Embed Size (px)
Citation preview

Reprinted from
International Journal of Flow ControlVolume 6 · Number 3 · September 2014
Multi-Science PublishingISSN 1756-8250
Design of Serrate-Semi-CircularRiblets with Application to SkinFriction Reduction on EngineeringSurfacesby
Samira Sayad Saravi, Kai Cheng, Tze Pei Chong and Alexandros Vathylakis
Volume 6 · Number 3 · 2014
83
Design of Serrate-Semi-Circular Ribletswith Application to Skin Friction
Reduction on Engineering SurfacesSamira Sayad Saravi, Kai Cheng, Tze Pei Chong and Alexandros Vathylakis
School of Engineering and Design, Brunel University Cleveland Road, Uxbridge, UB8 3PH, UK
Received date: 3/24/2014; Accepted date: 10/4/2014
ABSTRACTDrag reduction in wall-bounded flows can be achieved by the passive flow controltechnique through the application of bio-inspired riblet surfaces. This paper presents theinnovative design of Serrate-Semi-Circular riblet surfaces particularly focusing on theintrinsic relationship between the riblet features and the turbulent boundary layerstructure resulting from these surfaces in engineering applications. The availableexperimental facilities, instrumentation (i.e. hotwire) and measurement techniques (i.e.velocity spectra) have been employed to investigate the boundary layer velocity profilesand skin friction for flat plate and Serrate-Semi-Circular riblet surfaces. Both the simulationand experimental wind tunnel testing results show that the Serrate-Semi-Circular ribletsurface can provide 7% drag reduction, which is better than other riblet configurations,such as V and U shaped ones.
1. INTRODUCTIONIn recent years, turbulent boundary layer drag reduction on engineering surfaces has become animportant area of fluid dynamics research. Specifically, rising fuel costs have greatly highlighted theusefulness and necessity of developing efficient viscous drag reduction methods. Riblets as a passivemethod, installed over a smooth surface in the turbulent boundary layer, can reduce drag byapproximately 6–8% in turbulent flow. The advantages of using riblets, as a type of micro-structuredsurfaces in many engineering applications have been recognized as illustrated in Figure 1. Forinstance, the flight testing of aircrafts with ribleted structural surfaces by Boeing [1], Airbus [2] andNASA [3] demonstrated the important effects of riblets. Sareen [4] also employed different sizes ofsawtooth riblets applied to the DU 96-W-180 airfoil for a wind turbine. Apart from the aeronauticalapplications, other industrial uses for riblets have been identified and in particular, biologicalsurfaces with geometrically complex micro-featured surfaces [5]. In fact, there is now acomprehensive literature regarding effects of riblets with different geometries (Jimenez [6], Choi [7],Bushnell [8], Vukoslavcevic et al. [9], Park and Wallace [10], Lee and Jang [11], Lee and Lee [12],and Bechert et al [13]).
The initial drag reduction studies with riblets include those by Walsh and Weinstein [14] and Walsh[15], [16] at NASA Langley. They used a direct drag balance in a wind tunnel to examine the dragreduction behaviour of various riblet configurations and shapes with sizes of approximately s+, h+ = 10–15. They were able to reach a drag reduction of up to 4–5% for V, U and L groove riblets, whichappeared to be the most effective shapes due to the sharper peaks.
Moreover, the results demonstrated that the aspect ratio h/s of the riblets appears to have a majoreffect on the drag reduction. However, García-Mayoral and Jiménez [17] suggested that the existingexperiments for the location of the breakdown would collapse better with a new length scale, based onthe groove area (Ag) rather than with the riblet spacing or depth. They claimed that the degradation forlarge riblets of the linear regime of drag reduction is not connected with the breakdown of the Stokesbehaviour of the longitudinal velocity along the riblet grooves. However, almost all the above researchwas based on an individual case study basis and very much driven by numerical analysis. It isfundamentally essential to have a scientific understanding of the effects resulting from micro-structured

surfaces and the associated engineering design principles in order to be able to generate improved andpredictive capabilities, especially for drag reduction.
In this paper, the design of innovative Serrate-Semi-Circular riblet surfaces is presented along withthe outcomes of the research on transverse modifications of the associated fluid dynamic flowaccomplished by the geometrical features of the riblet surface. The Serrate-Semi-Circular Ribletsurfaces are designed to delay drag reduction breakdown and to improve the skin friction reduction.Experimental testing on the riblet surfaces was carried out in a wind tunnel aimed at further evaluatingand validating the riblet surface design, with the key focus being on examining the velocity profile andskin friction coefficient resulting from the surface design.
2. DESIGN OF SERRATE-SEMI-CIRCULAR RIBLET SURFACEWe have reviewed the regimes for drag reduction in ribleted surfaces, with particular emphasis on themost effective shapes, and the conditions under which that reduction increases [14, 15, 16]. The resultslead to the proposal of an alternative shape (Serrate-Semi-Circular riblets), which is analysed to assessits impact on the skin friction. The sizes have been carefully chosen based on the information from theliterature review and modelling. Special attention has been given to the effect of serration as wallroughness and the cross sectional area (Ag) [17]. In addition, the effect of having an extra tip inside theriblets on the vortices ejection has been incorporated the design and the size of serration is consideredto be in the range of the vortices ones.
The plates employed in the current investigation are made of the aluminium 6082 and the roughnesshas been measured using the TESA/ZYGO 3D surface profiler, as shown in Figure 4. The dimensionsof both plates (riblet and flat plate) are 295 mm × 150 mm × 5 mm and the new design of the riblets hasbeen milled on the flat plate using the fly cutting method.
In order to compare the selected geometry with the literature (Table 6), dimensionless sizes arerequired, which have been produced by skin friction velocity (ut) and kinematic viscosity (ν) fromexperimental data (Table 1). Finally, the base flow velocity was chosen as 30 m/s in this study.
84 Design of Serrate-Semi-Circular Riblets with Application to SkinFriction Reduction on Engineering Surfaces
International Journal of Flow Control
Figure 1. Typical micro-structured surfaces and their engineering applications.
Figure 2. (a) Apparent origin of a U-shape riblet surface (Bechert and Bartnwerfer [18]) (b) Schematic diagram of a V-shape riblet film (Lee and Jang [11]).

3. EXPERIMENTAL TESTINGThis study pertains to the measurement technique for deriving the skin friction and boundary layerstructures, inside a wind tunnel over smooth and ribleted surfaces. Recently derived measurements ofgood quality, using pitot tubes, 5 micron single hot-wire and automated traverse, were used to assesscritically, and then to improve the experimental accuracy of, the empirical coefficient as well as thedetermination of the surface shear and skin friction. Each sensor was calibrated in free-stream flowbefore and after each profile or each set of data points was measured. If these two calibrations were indisagreement by more than 2–3%, or if the error was more than 0.01, the entire process was repeated.
The experiment was conducted on the vertical blower wind tunnel at Brunel University, as shown inFigure 5 and the dimensions of the test section were 150 mm × 50 mm. This tunnel also had a filter atinlet to remove dust and dirt particles in order to minimize hot-wire contamination and breakage. Inaddition, sandpaper was used to trigger artificially the boundary layer into being turbulent, whichoccurred on the plates at zero angle of incidence. This is often referred to as a canonical zero-pressureturbulent gradient boundary layer.
Samira Sayad Saravi, Kai Cheng, Tze Pei Chong and Alexandros Vathylakis 85
Volume 6 · Number 3 · 2014
Figure 3. Riblets representing the transitional roughness and the consequent transitional sub-layer of turbulent flow.
Figure 4. Serrate-Semi-Circular riblets in trailing edge and the middle of test section.
Table 1. The dimensionless and actual (mm) sizes of the designed riblet
Sizes h1+(h1) h2
+(h2) s1+(s1) s2
+(s2) (Ag+)1/2
SSC Riblets 10.5 (0.108) 7.5 (0.075) 19.5 (0.210) 14 (0.150) 11

The measurements were taken using an automated traverse in the vertical (y), streamwise (x) andspanwise (z) directions, with a displacement accuracy of 0.01mm, 0.01mm and 0.1mm respectively.The traversing machine allows 3-D placement of measurement probes, which can position a thermalprobe or pitot tube at any (x, y, z) position and is controlled by the stepper motor, which uses theThermalpro software on the computer.
The signals from the single hot wire were acquired at 20 kHz, after passing through a 10 kHz anti-aliasing filter and the digitized voltage from the hot wire was then converted to velocity byinterpolating the 4th-order polynomial velocity-voltage calibration curve. Voltages were acquired usinga National Instruments Data Acquisition DaqBoard/3005 card, which consisted of a 1-MHz A/D with16-bit resolution, as highlighted in Figure 5.
The collected data from the acquisition card in the first step was reduced by Thermalpro. Next, themean and root mean square (rms) of the velocity data for the velocity profiles were calculated as:
(1)
(2)
where N is the total number of samples in the velocity time series and the rms is a measure of theamount of deviation of a signal piece of data from its mean value, which is computed as the square rootof the variance.
Precision uncertainty estimates for the velocity measurements were made through repeatability tests.This is, four replicate velocity profiles were taken for both the smooth and the ribleted surfaces. Thesystematic error, which represents the bias uncertainty, was obtained from the instrumentation used inthe measurements and this was combined with the precision uncertainty to calculate the overalluncertainties for the measured quantities. The method used in this context was that presented by Klineand McClintock [19], which involves examining the derivative of the equation that relates an unknown
uN
U U1
rms iN
i mean1
2( )= Σ −=
UN
U1
mean iN
i1= Σ =
86 Design of Serrate-Semi-Circular Riblets with Application to SkinFriction Reduction on Engineering Surfaces
International Journal of Flow Control
Figure 5. Experimental testing setup by using wind tunnel and hot-wires data logging system.
quantity (Z) to measured variables (X,Y). The maximum uncertainty can then be calculated by addingthe appropriate uncertainty terms, e.g.:
Z = f(X, Y) (3)
(4)
where ∂X, ∂Y and ∂Z are the uncertainties associated with X, Y and Z, respectively. In order tocalculate this equation, ∂X, ∂Y and ∂Z must be known a priori from previous evaluations, instrumentspecifications or experience. In Tables 2 and 3, uncertainties related to various instruments employedduring this investigation are summarised (Sagrado [20]).
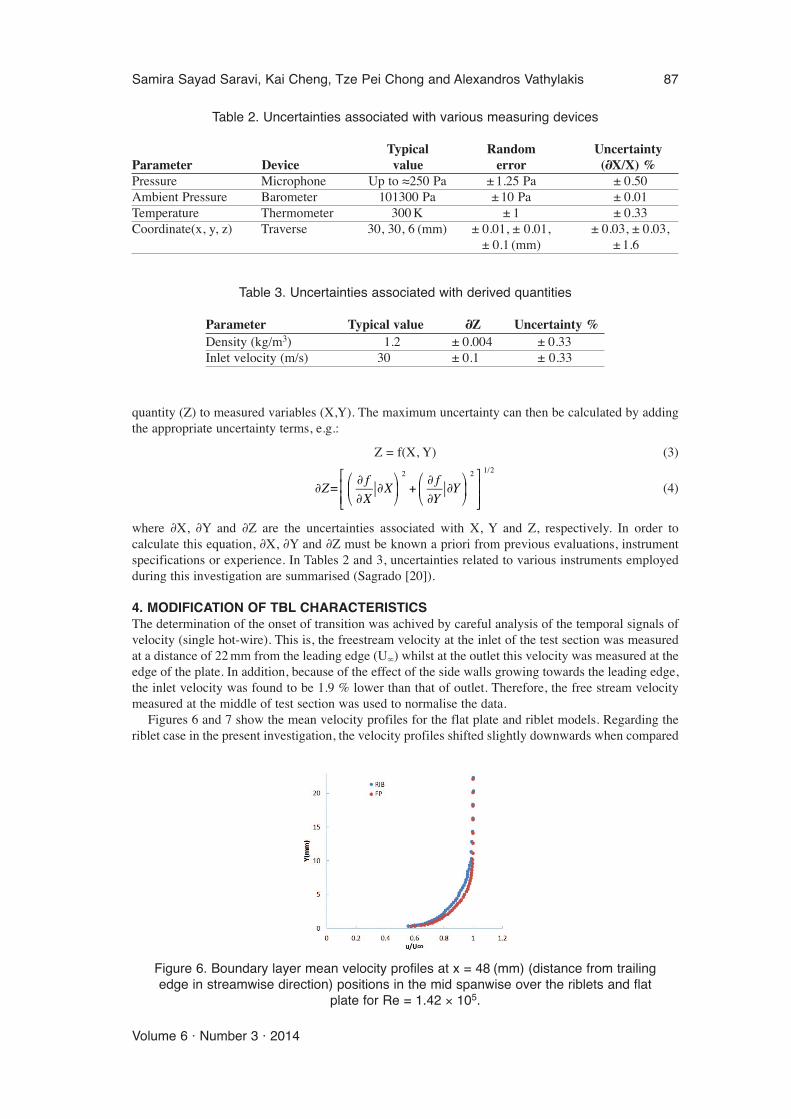
4. MODIFICATION OF TBL CHARACTERISTICSThe determination of the onset of transition was achived by careful analysis of the temporal signals ofvelocity (single hot-wire). This is, the freestream velocity at the inlet of the test section was measuredat a distance of 22 mm from the leading edge (U∞) whilst at the outlet this velocity was measured at theedge of the plate. In addition, because of the effect of the side walls growing towards the leading edge,the inlet velocity was found to be 1.9 % lower than that of outlet. Therefore, the free stream velocitymeasured at the middle of test section was used to normalise the data.
Figures 6 and 7 show the mean velocity profiles for the flat plate and riblet models. Regarding theriblet case in the present investigation, the velocity profiles shifted slightly downwards when compared
Zf
XX
f
YY=
2 2 1/2
∂∂
∂∂
⎛
⎝⎜
⎞
⎠⎟ +
∂
∂∂
⎛
⎝⎜
⎞
⎠⎟
⎡
⎣⎢⎢
⎤
⎦⎥⎥
Samira Sayad Saravi, Kai Cheng, Tze Pei Chong and Alexandros Vathylakis 87
Volume 6 · Number 3 · 2014
Table 2. Uncertainties associated with various measuring devices
Typical Random Uncertainty Parameter Device value error (∂X/X) %Pressure Microphone Up to ≈250 Pa ± 1.25 Pa ± 0.50Ambient Pressure Barometer 101300 Pa ± 10 Pa ± 0.01Temperature Thermometer 300 K ± 1 ± 0.33Coordinate(x, y, z) Traverse 30, 30, 6 (mm) ± 0.01, ± 0.01, ± 0.03, ± 0.03, ± 0.1 (mm) ± 1.6
Table 3. Uncertainties associated with derived quantities
Parameter Typical value ∂Z Uncertainty %Density (kg/m3) 1.2 ± 0.004 ± 0.33Inlet velocity (m/s) 30 ± 0.1 ± 0.33
Figure 6. Boundary layer mean velocity profiles at x = 48 (mm) (distance from trailing edge in streamwise direction) positions in the mid spanwise over the riblets and flat
plate for Re = 1.42 × 10⁵.

with the smooth surface. The fact that friction velocity decreases when using riblets, affects the wallnormal mean velocity gradient which is lower for cases of drag reduction.
In Table 4, the skin friction coefficient (Cf) and freestream velocities of the test section are given fora smooth surface. The method used to calculate Cf described in the next section. The skin frictioncoefficient Cf = 2τw /ρUe
2 increases with APG, which can be seen in Figure 9, where Cf is presentedfor the five different positions of streamwise direction, and this increase is due to the decrease in thewall shear stress (τw).
The obtained results in Table 5 show the effect of riblets on decreasing skin friction andconsequently drag. It can be seen that the skin friction on the ribleted plate has been reduced by 7% inaverage when compared to the flat one.
The drag reduction sizes for different studies are presented in Table 6 and the results for researchcan be as being favorable when compared to the extant literature. In terms of comparison with V andU shape riblet geometries, the experiments by Walsh [16] reported a drag reduction of 4% for s+ ≈ 20,and for the DNS by Choi [21] this was around 6% for s+ ≈ 20.
88 Design of Serrate-Semi-Circular Riblets with Application to SkinFriction Reduction on Engineering Surfaces
International Journal of Flow Control
Figure 7. Boundary layer mean velocity profiles at x = 60 (mm) (distance from trailing edge in streamwise direction) positions in the mid spanwise over the riblets and flat
plate for Re = 1.42 × 10⁵.
Table 4. Free stream velocity and skin friction in the model withthe smooth surface, considered in middle of the test section
Position (z) (mm to mid span) U∞ Cf–3.00 26.1347 0.0045–0.0046–2.00 26.6467 0.0044–0.0045–1.00 27.3029 0.00440 27.0170 0.00441.00 27.0662 0.0044–0.00452.00 27.0854 0.0045–0.00463.00 27.0799 0.0045–0.0046
Table 5. Free stream velocity and skin friction in the model withthe ribleted surface, considered in middle of the test section
Position (z) (mm to mid span) U∞ Cf–3.00 26.2971 0.0042–2.00 26.6081 0.0041–0.0042–1.00 27.4629 0.0041–0.00420 26.9972 0.0041–0.00421.00 27.7011 0.0042–0.00432.00 28.0609 0.00423.00 27.7043 0.0042
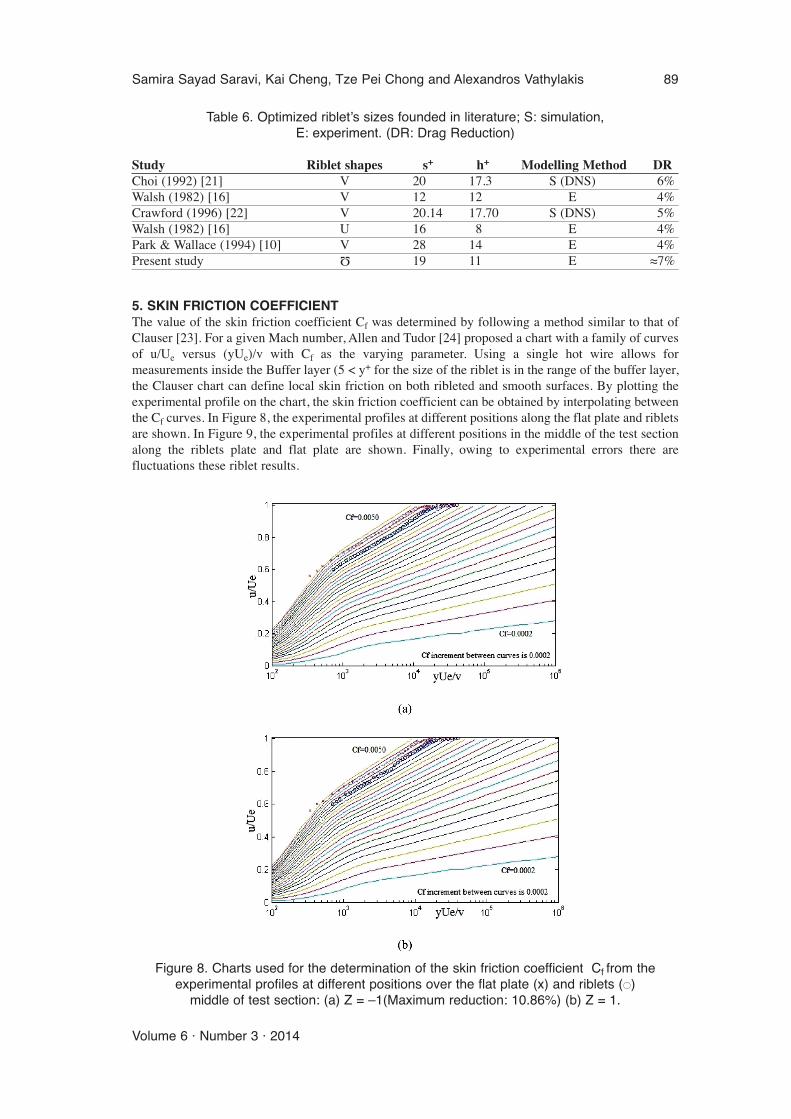
5. SKIN FRICTION COEFFICIENTThe value of the skin friction coefficient Cf was determined by following a method similar to that ofClauser [23]. For a given Mach number, Allen and Tudor [24] proposed a chart with a family of curvesof u/Ue versus (yUe)/v with Cf as the varying parameter. Using a single hot wire allows formeasurements inside the Buffer layer (5 < y+ for the size of the riblet is in the range of the buffer layer,the Clauser chart can define local skin friction on both ribleted and smooth surfaces. By plotting theexperimental profile on the chart, the skin friction coefficient can be obtained by interpolating betweenthe Cf curves. In Figure 8, the experimental profiles at different positions along the flat plate and ribletsare shown. In Figure 9, the experimental profiles at different positions in the middle of the test sectionalong the riblets plate and flat plate are shown. Finally, owing to experimental errors there arefluctuations these riblet results.
Samira Sayad Saravi, Kai Cheng, Tze Pei Chong and Alexandros Vathylakis 89
Volume 6 · Number 3 · 2014
Table 6. Optimized riblet’s sizes founded in literature; S: simulation, E: experiment. (DR: Drag Reduction)
Study Riblet shapes s+ h+ Modelling Method DRChoi (1992) [21] V 20 17.3 S (DNS) 6%Walsh (1982) [16] V 12 12 E 4%Crawford (1996) [22] V 20.14 17.70 S (DNS) 5%Walsh (1982) [16] U 16 8 E 4%Park & Wallace (1994) [10] V 28 14 E 4%Present study 19 11 E ≈7%
Ω
Figure 8. Charts used for the determination of the skin friction coefficient Cf from theexperimental profiles at different positions over the flat plate (x) and riblets (○)
middle of test section: (a) Z = –1(Maximum reduction: 10.86%) (b) Z = 1.

6. CONCLUSIONSA large portion of the total drag on long objects with relatively flat sides comes from turbulence atthe wall, so riblets will have an appreciable effect. Close to the wall itself, the effects of structuredsurface on the velocity field depend on the specific geometry of the riblets. The selected designdimensions of the Serrate-Semi-Circular riblets are: s1
+ = 19.5, s2+ = 14, h1
+ = 10.5, h2+ = 7.5 and
(Ag+)1/2 = 11. The experimental trials using a vertical wind tunnel were performed on the riblet
surface in order to obtain a detailed characterization of the flow parameters and boundary layerprofiles under turbulent boundary layers. The skin friction on the riblet plate was reduced by 7%compared to a flat one. In addition, after considering similar riblet spacing (≈20) from otherresearchers, it has emerged that the drag using the riblet structure in the present study decreased bymore. Therefore, it can be concluded that this innovative design demonstrates that the groove crosssection Ag
+ is a better characterization of drag reduction breakdown than the riblet spacing S+.However, further investigation is needed to understand the mechanism of the Serrate-Semi-Circularriblets on drag reduction.
ACKNOWLEDGEMENTSThe authors would like to thank the Korean Institute of Machinery and Materials (KIMM) for thepartial finance support of this research.
NOTATIONAPG Adverse Pressure GradientAg Riblets cross section [mm2]Ag
+ Dimensionless riblets spacing: Ag+ = Aguτ/ν, uτ is friction velocity
Cf Coefficient of friction: Cf= τw/(0.5ρU2ref)
DR Drag Reductionh+ Dimensionless riblets height: h+= huτ/ν, uτ is friction velocityh, h1, h2 Riblets height [mm]P Pressure [Pa]s+ Dimensionless riblets spacing: s+= suτ /ν, uτ is friction velocitys, s1, s2 Riblets spacing [mm]TBL Turbulent Boundary Layer
90 Design of Serrate-Semi-Circular Riblets with Application to SkinFriction Reduction on Engineering Surfaces
International Journal of Flow Control
Figure 9. Charts used for the determination of the skin friction coefficient Cffrom the experimental profiles at different streamwise positions
over the flat plate (♦) and riblets (●).
TE Trailing Edgeu Velocity in the streamwise direction [m/s]U∞ Free stream velocity [m/s]Ue Velocity at the edge of boundary layer [m/s]τw Wall shear stress [pa]uτ Skin friction velocity: uτ = (τw/ρ)^(1/2)[m/s]V Velocity in the wall-normal direction [m/s]ν Kinematic viscosity [m2/s]
REFERENCES[1] McLean JD, Georg-Falvy DN and Sullivan P. Flight test of turbulent skin friction reduction by
riblets. In: Conference on Turbulent Drag Reduction by Passive Means, The Royal AeronauticalSociety, London, 15–17 September 1987, pp. 408–48.
[2] Coustols E and Savill AM. Turbulent skin-friction drag reduction by active and passive means.AGARD, Report 786 part 1, Seine, France, 1992, pp. 8.1–8.53.
[3] Walsh MJ, Sellers WL and McGinley CB. Riblets drag at flight conditions. J Aircraft 1989; 26(6):570–575.
[4] Sareen A. Drag reduction using riblet film applied to airfoil for wind turbines. PhD Thesis,University of Illinois at Urbana-Champaign, USA, 2012.
[5] Itoh M, Tamano S, Iguchi R, Yokota K, Akino N, Hino R and Kubo S. Turbulent drag reductionby the seal fur surface. Phys. Fluids 2006; 18 (6): 065102.
[6] Jimenez J, Uhlman M, Pinelli A and Kawahara G. Turbulent shear flow over active and passiveporous surfaces. J. Fluid Mech. 2001; 442: 89–117.
[7] Choi KS. European drag-reduction research – Recent developments and current status. FluidDynamics Research 1999; 26: 325–335.
[8] Bushnell DM. Aircraft drag reduction – A review. Proc Instn Mech Engrs 2003; 217 (G1): 1–18.
[9] Vukoslavcevic P, Wallace JM and Balint JL. Viscous drag reduction using streamwise alignedriblets. AIAA J 1992; 30: 1119–1122.
[10] Park SR and Wallace JM. Flow alteration and drag reduction by riblets in a turbulent boundarylayer. AIAA J 1994; 32 (1): 31–38.
[11] Lee SJ and Jang YG. Control of flow around a NACA 0012 airfoil with a micro-riblet film. J.Fluids Struct. 2005; 20: 659–672.
[12] Lee SJ and Lee SH. Flow field analysis of a turbulent boundary layer over a riblet surface. ExpFluids 2001; 30: 153–166.
[13] Bechert DW, Bruse M and Hage W. Experiments on drag-reducing surfaces and their optimisationwith an adjustable geometry. J. Fluid Mech. 1997; 338: 59–87;
[14] Walsh MJ and Weinstein LM. Drag and heat transfer on surfaces with small longitudinal fins.AIAA J 1978; paper no. 78–1161, New York.
[15] Walsh MJ. Drag characteristics of V-groove and transverse curvature riblets. In: viscous flow dragreduction, progress in Astronautics and Aeronautics, Hough, G.R. (ed.) 1980; 72: 168–184.
[16] Walsh MJ. Turbulent boundary layer drag reduction using riblets, AIAA J 1982; paper no82–0169, New York.
[17] García-Mayoral R, and Jiménez J. Drag reduction by riblets. Philos. Trans. R. Soc. London, Ser. A 2011; 369: 1412–1427.
[18] Bechert DW and Bartenwerfer M. The viscous flow on surfaces with longitudinal ribs. Journal ofFluid Mechanics. 1989; 206: 105–129.
[19] Kline SJ and McClintock FA. Describing the uncertainties in single sample experiments.Mechanical Engineering. 1953; 3–8.
[20] Sagrado AG. Boundary layer and trailing edge noise sources. PhD Thesis, University ofCambridge, UK, 2007.
[21] Choi H. Turbulent drag reduction: Studies of feedback control and flow over riblets. PhD thesis.Stanford Univ., USA, 1992.
Samira Sayad Saravi, Kai Cheng, Tze Pei Chong and Alexandros Vathylakis 91
Volume 6 · Number 3 · 2014

[22] Crawford CH. Direct numerical simulation of near-wall turbulence: passive and active control.PhD thesis. Princeton Univ., New Jersey, USA, 1996.
[23] Clauser FH. Turbulent Boundary Layers in Adverse Pressure Gradient. J. Aeronaut. Sci. 1954; 21: 91–108.
[24] Allen JM, and Tudor DH. Charts for Interpolation of Local Skin Friction from ExperimentalTurbulent Velocity Profiles. Technical report, Tech. Rep. NASA SP-3048, 1969.
92 Design of Serrate-Semi-Circular Riblets with Application to SkinFriction Reduction on Engineering Surfaces
International Journal of Flow Control