Embed Size (px)
Citation preview
JOURNAL OF THE BALKAN GEOPHYSICAL SOCIETY, Vol. 15, No. 2, December 2012, p. 31-40, 11 figs, 2 tables
Reprocessing and interpretation of seismic reflection data at Messara Basin, Crete, Greece
Antonis Vafidis1*, Nikolaos Andronikidis1, Nikolaos Economou1, George Panagopoulos2, Avraam Zelilidis3 and Emanouil Manoutsoglou2
1 Laboratory of Applied Geophysics, Department of Mineral Resources Engineering, Technical University of Crete, Polytechnioupolis, 73100 Chania, Greece
2 Research Unit of Geology (Tectonics, Stratigraphy, Environmental Geology), Department of Mineral Resources Engineering, Technical University of Crete, Polytechnioupolis, 73100 Chania, Greece
3 Laboratory of Sedimentology, Department of Geology, University of Patras, 26504 Patras, Greece
(Received 05 September 2012; accepted 13 December 2012)
Abstract: Messara sedimentary basin located at Central Crete, Greece is covered by Quaternary and Neogene formations. Seismic reflection data along a 30 km W-E seismic line acquired by the Hellenic Petroleum Company (HPC) at Messara basin is reprocessed. The Kirchoff migrated data were subsequently spectrally balanced using a Ricker wavelet. The reprocessed seismic section provides an improved image of the shallow structures delineating a number of continuous reflectors in the upper Neogene formations. The maximum depth to the top of the preNeogene basement reaches 1000 m along seismic line Z1. Two structures are also imaged, the former consists of several thrust sheets and the latter is regarded as a positive flower structure. These reprocessed seismic data depict for the first time the subsurface structure of an extended area.
Key words: Messara basin, Seismic reflection, Migration, Zero-phase deconvolution.
INTRODUCTION
The seismic reflection technique has been used at several scales from some meters (Bachrach and Reshef, 2010) up to several hundreds of meters or kilometers (Barley and Summers, 2007; Howard, 2007) for the delineation of the subsurface. Intermediate or large depths seismic reflection studies around the world are mostly related to the tectonic evolution, indirectly leading to the evaluation of the georesources potential (Drummond et al., 2000). Processing of seismic reflection data aims at the signal enhancement. Signal processing methods, such as deconvolution and migration, can improve the interpretability of the seismic sections.
Increasing the resolution of seismic data has always been a quest for geophysicists. Deconvolution methods applied before or after stacking (Yu et al, 2006; Gray et al., 2001) increase the temporal resolution if the data are stationary. The seismic data are usually stationary in time gates. Time gates do not provide sufficient amount of data for the calculation of the inverse operator from statistical methods like spiking
deconvolution. Time-varying deconvolution (van der Baan, 2012), spectral balancing (Lazaratos and Finn, 2004) and spectral whitening techniques (Taner et al., 2003) improve seismic resolution. Deterministic deconvolution needs the phase information of the propagating wavelet. Lazaratos and Finn (2004) used a near the source trace for the calculation of a reference amplitude spectrum in order to apply spectral shaping, while Taner et al. (2003) enhanced the higher frequency amplitudes in the t-f domain. Recently, Economou and Vafidis (2010) and Economou et al., (2012) introduced a time varying deconvolution technique.
Most of the migration techniques apply the principle of downward continuation (Yilmaz, 1987). Downward continuation of the seismic wave field can be considered equivalent to lowering the receivers into the earth. By applying the imaging principle at each depth, the entire wave field is imaged. Finite difference (FD) migration techniques apply the principle of downward continuation and utilize the scalar wave equation. The phase shift or Gazdag migration is implemented in the frequency-wavenumber (f-k) domain. The downward continuation is equivalent
31
32 Vafidis et al.
to a phase shift in the f-k domain. Kirchhoff migration technique is an integral solution to the wave equation. In Kirchhoff migration data lying along each diffraction curve are summed to give the amplitude at each point on the migrated section (Sheriff and Geldart, 1995).
In this paper we present a reprocessed seismic section from Messara basin. Tests were performed utilizing three migration techniques, namely Kirchhoff, finite differences and Gazdag. Following migration, we applied zero-phase deconvolution which involves time varying spectral shaping. These reprocessed seismic data were subsequently interpreted.
GEOLOGICAL SETTING
The island of Crete represents a prominent horst structure formed in the recent forearc of the still ongoing Hellenic subduction. The structure of Crete consists of a pile of nappes that contain rock units from various geotectonic zones. Nappes of the External Hellenides and tectonic sections of Internal Hellenides were stacked into a pile until Oligocene. Although, initial studies draw a conclusion that Late Miocene and Plio-Quaternary tectonics of the Aegean are polyphase and complicated, including both extension and compression (Angelier, 1978), several authors use the division of Cretan basement into the Upper
Nappes (UN) and Lower Nappes (LN), according to their tectonostratigraphic position and their tectonometamorphic history. A general belief about these two Nappe groups is that they are separated by an E-W general trending low-angle detachment fault (Cretan Detachment Fault), which acted since 17-15 Ma when extension was the major tectonic regime in Crete (Kilias et al., 1994; Fassoulas et al., 1994; Fassoulas, 1999; van Hinsbergen and Meulenkamp, 2006; Papanikolaou and Vassilakis, 2010). The uplift and exhumation of the basement was accompanied by structural disintegration of the hanging wall, leading to formation of sedimentary basins on top of the nappe pile in the Lower to Middle Miocene.
One of such basins is Messara basin in which, according to ten Veen and Postma (1999), Neogene deposits has undergone mainly multidirectional extensional tectonic events. Since late Tortonian tectonic regime seems to change into transtensional. Stress pattern for the last 5 Ma do not support arc-normal pull alone, but an additional combination of both left-lateral and right-lateral faulting in Crete with E–W extension (ten Veen and Meijer, 1998). According to van Hinsbergen and Meulenkamp (2006) the Messara basin is developed over the hanging wall of Cretan detachment forming a supradetachement basin with deformed basement and several extensional klippen.
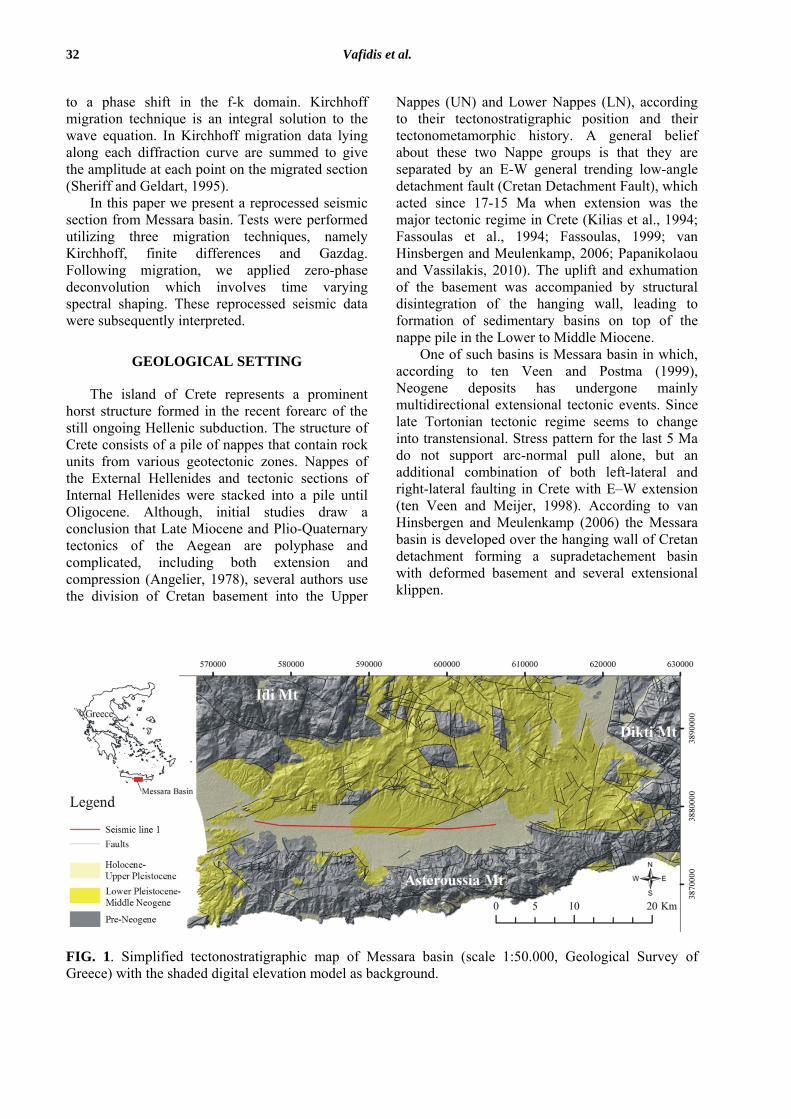
FIG. 1. Simplified tectonostratigraphic map of Messara basin (scale 1:50.000, Geological Survey of Greece) with the shaded digital elevation model as background.
Reprocessing and interpretation of seismic reflection data at Messara Basin, Crete, Greece 33
The basement of Messara sedimentary basin consists of a tectonic nappe pile of formations belonging both to External Hellenides, namely Pindos, Tripolis, Phyllite (P-Q) Nappes all stacked southward on the parautochthonous Permian-Tertiary Platten-kalk Group, and to Internal Hellenides, namely Arvi, Miamou, Vatos, Asterrousia Units and ophiolites, all stacked southward on the parautochthonous Permian-Tertiary Plattenkalk Group (Bonneau, 1984). Nevertheless, recent papers cast doubts on the duration of extension as a constantly major tectonic regime, suggesting that compression has played a crucial role beyond Middle Miocene (Chatzaras et al 2006; Tortorici et al., 2010; Kokinou et al., 2012; Klein et al., 2013). Given that models of the tectonic evolution of Messara basin, and in general of Crete, are so far based on the collection and processing of surface tectonic data, this paper deals with reprocessed geophysical data depicting for the first time the subsurface structure of an extended area.
DATA ACQUISITION
In 1982 a seismic reflection survey was conducted by Hellenic Petroleum Company (HPC) at Messara basin along four east-west and seven north-south lines in order to map the Alpine bedrock and further delineate the subsurface structure of the area.
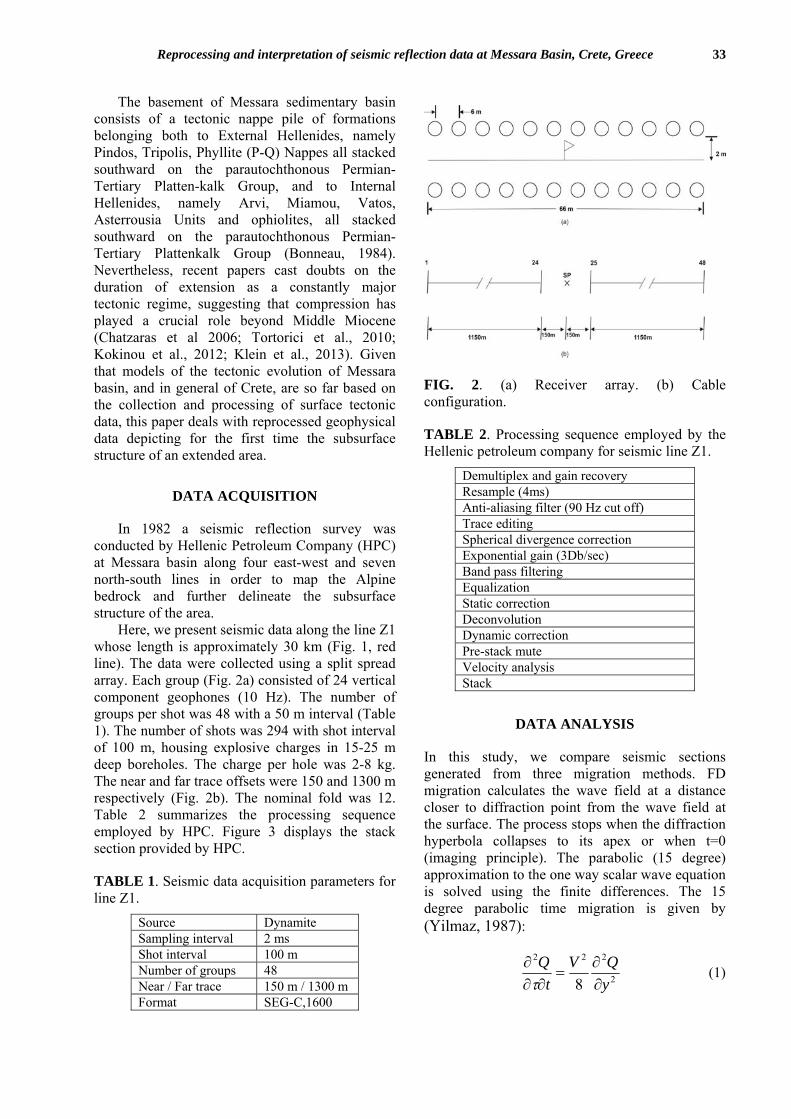
Here, we present seismic data along the line Z1 whose length is approximately 30 km (Fig. 1, red line). The data were collected using a split spread array. Each group (Fig. 2a) consisted of 24 vertical component geophones (10 Hz). The number of groups per shot was 48 with a 50 m interval (Table 1). The number of shots was 294 with shot interval of 100 m, housing explosive charges in 15-25 m deep boreholes. The charge per hole was 2-8 kg. The near and far trace offsets were 150 and 1300 m respectively (Fig. 2b). The nominal fold was 12. Table 2 summarizes the processing sequence employed by HPC. Figure 3 displays the stack section provided by HPC.
TABLE 1. Seismic data acquisition parameters for line Z1.
Source Dynamite Sampling interval 2 ms Shot interval 100 m Number of groups 48 Near / Far trace 150 m / 1300 m Format SEG-C,1600
FIG. 2. (a) Receiver array. (b) Cable configuration.
TABLE 2. Processing sequence employed by the Hellenic petroleum company for seismic line Z1.
Demultiplex and gain recovery Resample (4ms) Anti-aliasing filter (90 Hz cut off) Trace editing Spherical divergence correction Exponential gain (3Db/sec) Band pass filtering Equalization Static correction Deconvolution Dynamic correction Pre-stack mute Velocity analysis Stack
DATA ANALYSIS
In this study, we compare seismic sections generated from three migration methods. FD migration calculates the wave field at a distance closer to diffraction point from the wave field at the surface. The process stops when the diffraction hyperbola collapses to its apex or when t=0 (imaging principle). The parabolic (15 degree) approximation to the one way scalar wave equation is solved using the finite differences. The 15 degree parabolic time migration is given by (Yilmaz, 1987):
2
222
8 yQV
tQ
∂∂
=∂∂
∂τ
(1)
34 Vafidis et al.
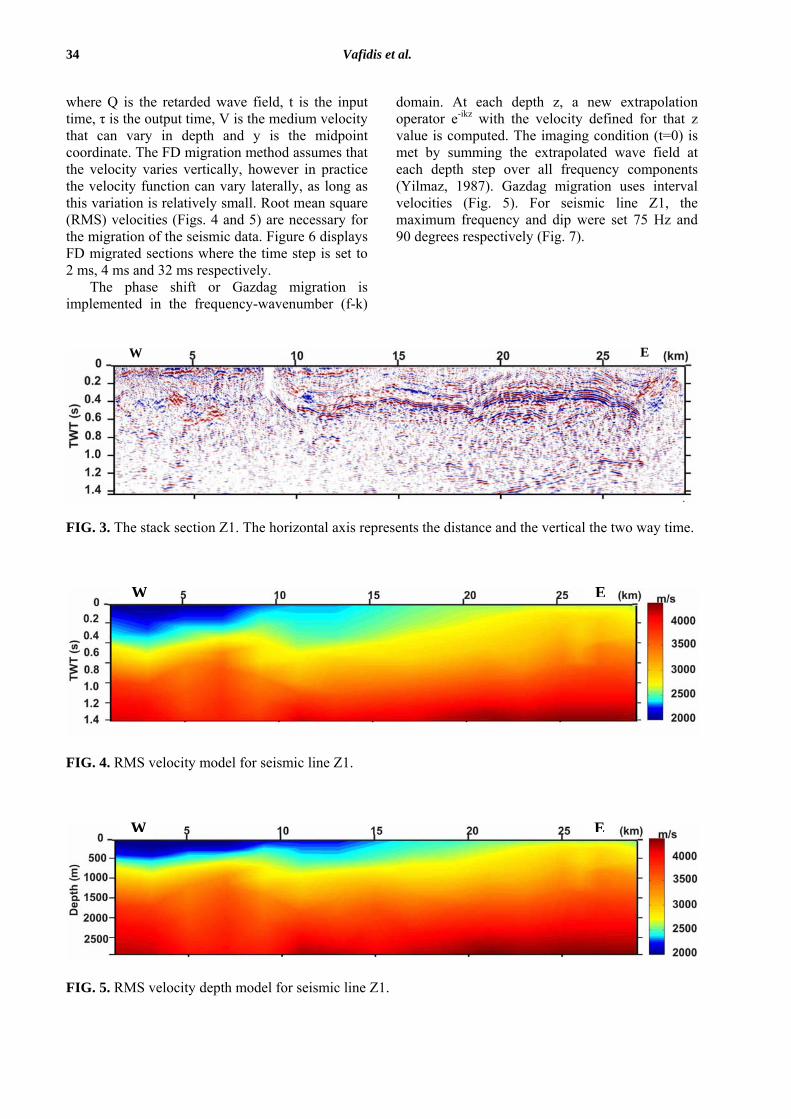
where Q is the retarded wave field, t is the input time, τ is the output time, V is the medium velocity that can vary in depth and y is the midpoint coordinate. The FD migration method assumes that the velocity varies vertically, however in practice the velocity function can vary laterally, as long as this variation is relatively small. Root mean square (RMS) velocities (Figs. 4 and 5) are necessary for the migration of the seismic data. Figure 6 displays FD migrated sections where the time step is set to 2 ms, 4 ms and 32 ms respectively.
The phase shift or Gazdag migration is implemented in the frequency-wavenumber (f-k)
domain. At each depth z, a new extrapolation operator e-ikz with the velocity defined for that z value is computed. The imaging condition (t=0) is met by summing the extrapolated wave field at each depth step over all frequency components (Yilmaz, 1987). Gazdag migration uses interval velocities (Fig. 5). For seismic line Z1, the maximum frequency and dip were set 75 Hz and 90 degrees respectively (Fig. 7).
E W
FIG. 3. The stack section Z1. The horizontal axis represents the distance and the vertical the two way time.
W E
FIG. 4. RMS velocity model for seismic line Z1.
W E
FIG. 5. RMS velocity depth model for seismic line Z1.

Reprocessing and interpretation of seismic reflection data at Messara Basin, Crete, Greece 35
FIG. 6. Migrated sections for seismic line Z1 generated by the 15 degree finite difference method. The time step is set to: (a) 2 ms, (b) 4 ms and (c) 32 ms.
W E
W E
W E
W E
FIG 7. Migrated section Z1 generated by the phase shift method.
36 Vafidis et al.
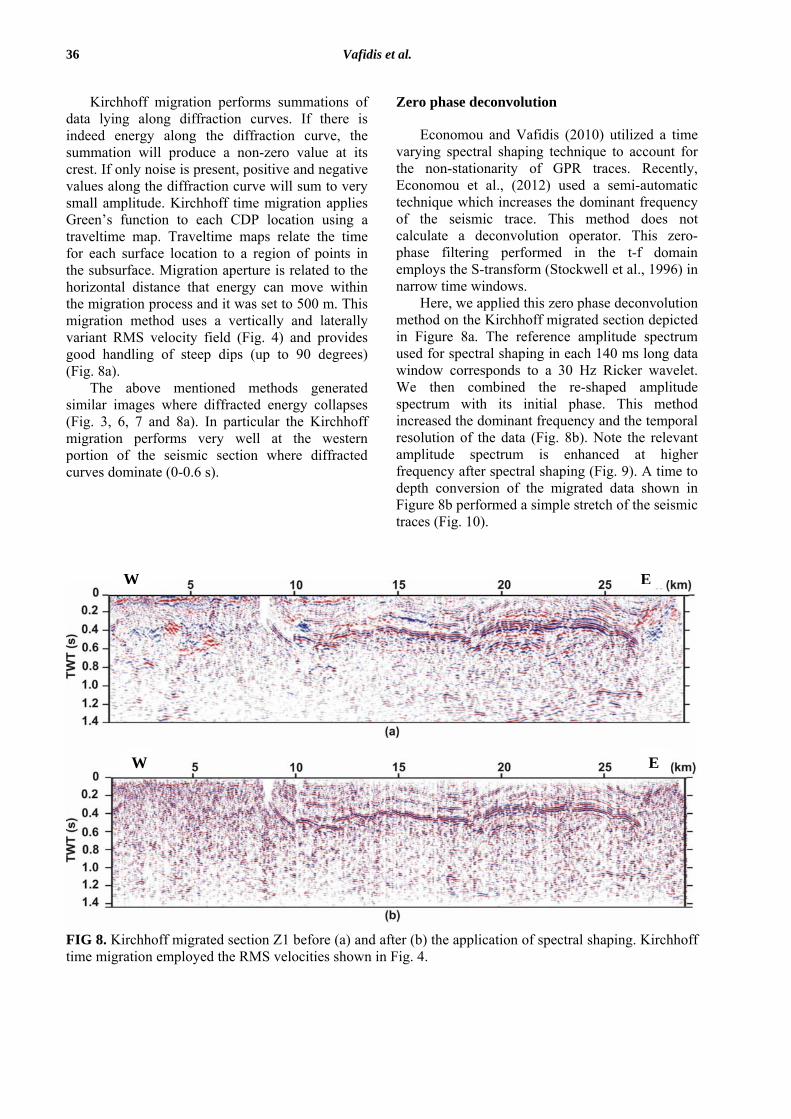
Kirchhoff migration performs summations of data lying along diffraction curves. If there is indeed energy along the diffraction curve, the summation will produce a non-zero value at its crest. If only noise is present, positive and negative values along the diffraction curve will sum to very small amplitude. Kirchhoff time migration applies Green’s function to each CDP location using a traveltime map. Traveltime maps relate the time for each surface location to a region of points in the subsurface. Migration aperture is related to the horizontal distance that energy can move within the migration process and it was set to 500 m. This migration method uses a vertically and laterally variant RMS velocity field (Fig. 4) and provides good handling of steep dips (up to 90 degrees) (Fig. 8a).
The above mentioned methods generated similar images where diffracted energy collapses (Fig. 3, 6, 7 and 8a). In particular the Kirchhoff migration performs very well at the western portion of the seismic section where diffracted curves dominate (0-0.6 s).
Zero phase deconvolution
Economou and Vafidis (2010) utilized a time varying spectral shaping technique to account for the non-stationarity of GPR traces. Recently, Economou et al., (2012) used a semi-automatic technique which increases the dominant frequency of the seismic trace. This method does not calculate a deconvolution operator. This zero-phase filtering performed in the t-f domain employs the S-transform (Stockwell et al., 1996) in narrow time windows.
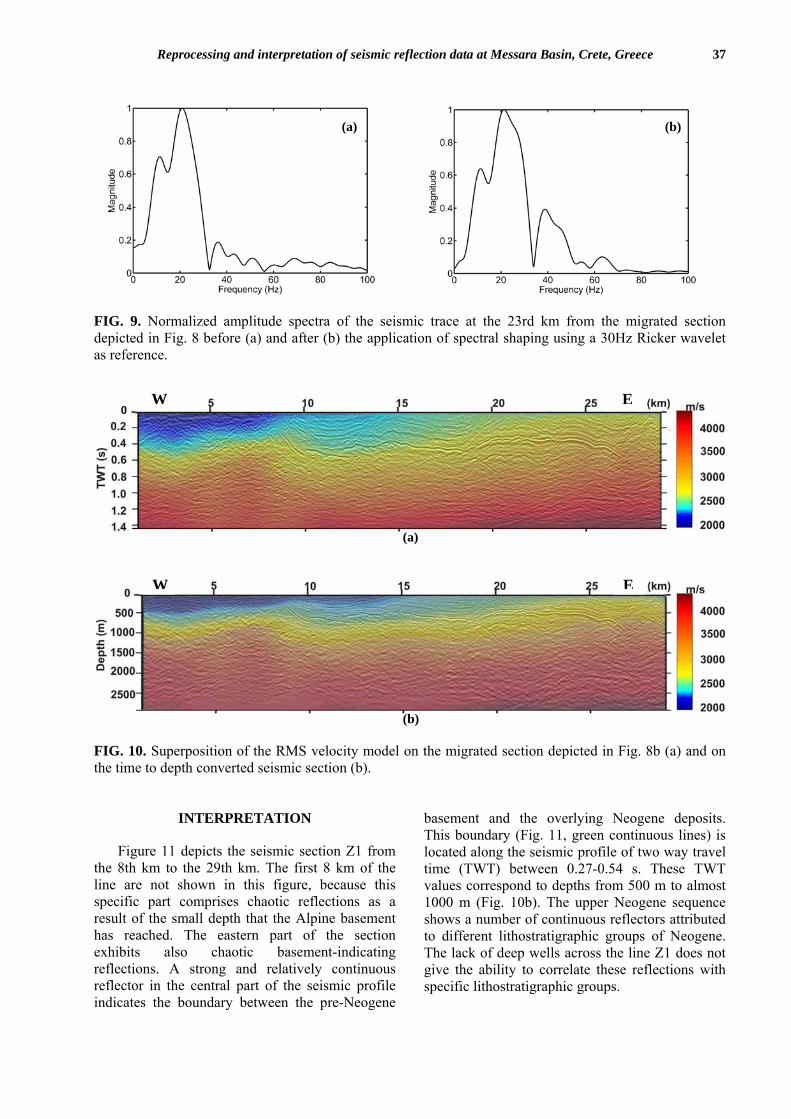
Here, we applied this zero phase deconvolution method on the Kirchhoff migrated section depicted in Figure 8a. The reference amplitude spectrum used for spectral shaping in each 140 ms long data window corresponds to a 30 Hz Ricker wavelet. We then combined the re-shaped amplitude spectrum with its initial phase. This method increased the dominant frequency and the temporal resolution of the data (Fig. 8b). Note the relevant amplitude spectrum is enhanced at higher frequency after spectral shaping (Fig. 9). A time to depth conversion of the migrated data shown in Figure 8b performed a simple stretch of the seismic traces (Fig. 10).
FIG 8. Kirchhoff migrated section Z1 before (a) and after (b) the application of spectral shaping. Kirchhoff time migration employed the RMS velocities shown in Fig. 4.
W E
W E
Reprocessing and interpretation of seismic reflection data at Messara Basin, Crete, Greece 37
(a) (b)
FIG. 9. Normalized amplitude spectra of the seismic trace at the 23rd km from the migrated section depicted in Fig. 8 before (a) and after (b) the application of spectral shaping using a 30Hz Ricker wavelet as reference.
W E
W E
(a)
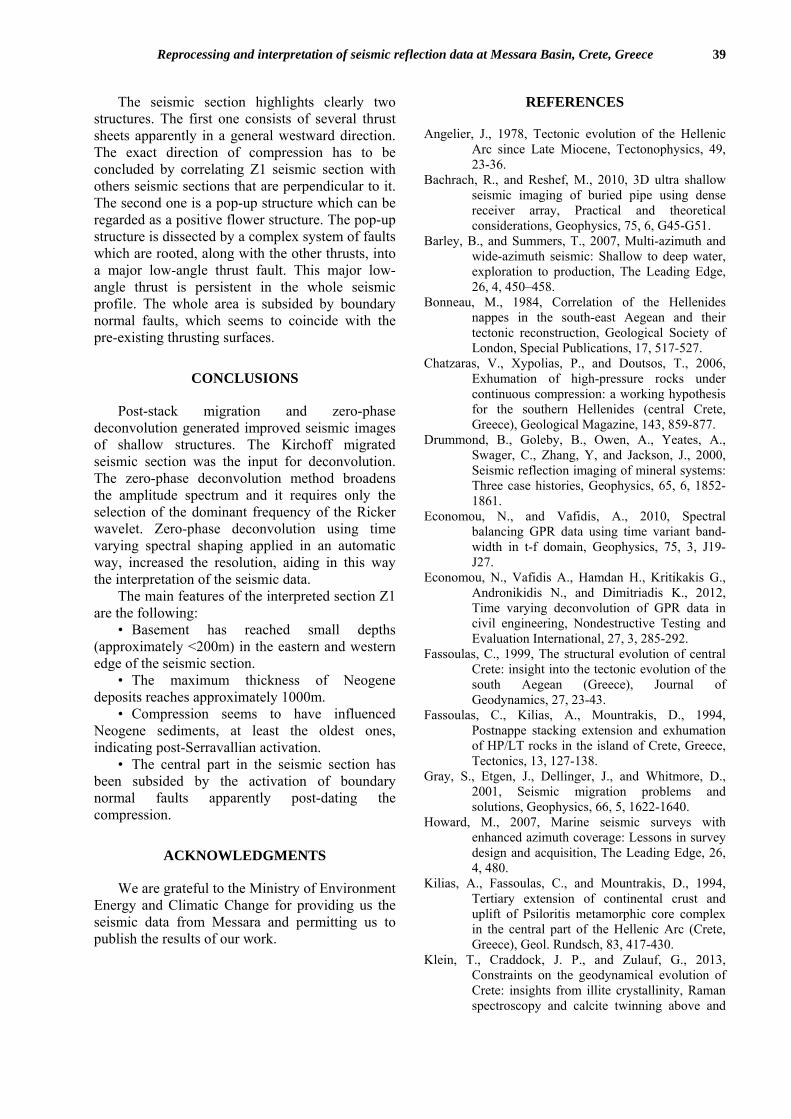
(b) FIG. 10. Superposition of the RMS velocity model on the migrated section depicted in Fig. 8b (a) and on the time to depth converted seismic section (b).
INTERPRETATION
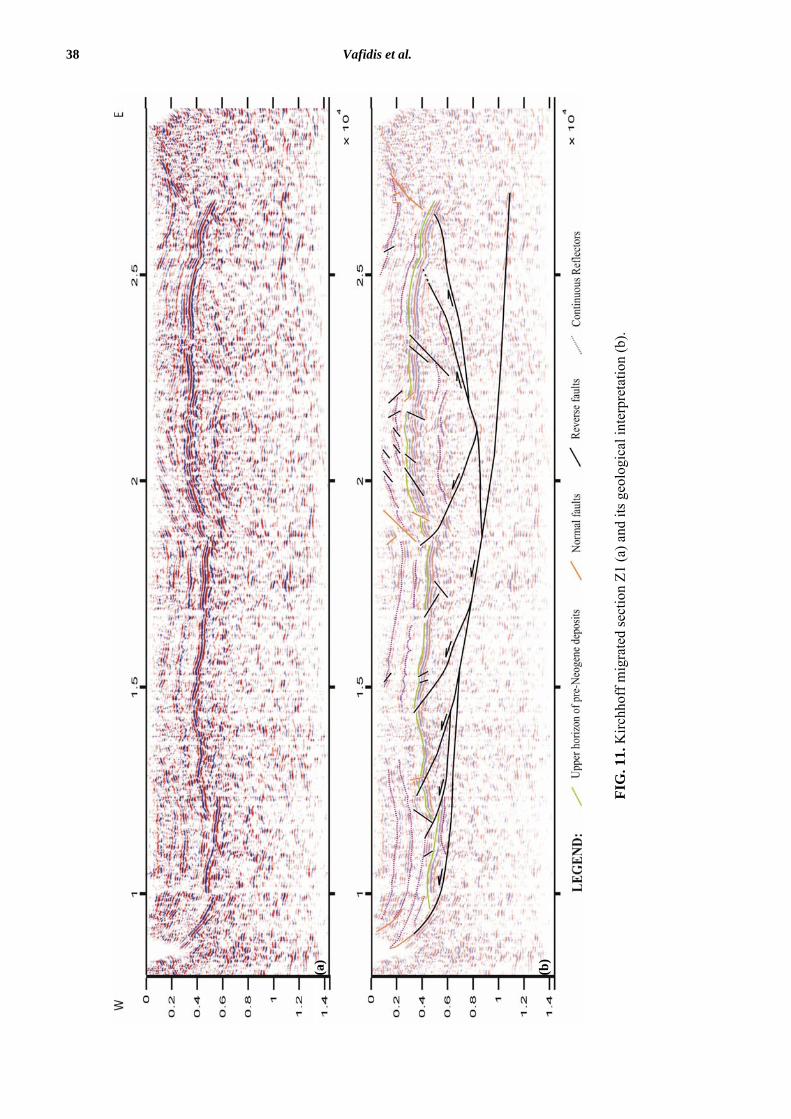
Figure 11 depicts the seismic section Z1 from the 8th km to the 29th km. The first 8 km of the line are not shown in this figure, because this specific part comprises chaotic reflections as a result of the small depth that the Alpine basement has reached. The eastern part of the section exhibits also chaotic basement-indicating reflections. A strong and relatively continuous reflector in the central part of the seismic profile indicates the boundary between the pre-Neogene
basement and the overlying Neogene deposits. This boundary (Fig. 11, green continuous lines) is located along the seismic profile of two way travel time (TWT) between 0.27-0.54 s. These TWT values correspond to depths from 500 m to almost 1000 m (Fig. 10b). The upper Neogene sequence shows a number of continuous reflectors attributed to different lithostratigraphic groups of Neogene. The lack of deep wells across the line Z1 does not give the ability to correlate these reflections with specific lithostratigraphic groups.
38 Vafidis et al.
FIG
. 11.
Kirc
hhof
f mig
rate
d se
ctio
n Z1
(a) a
nd it
s geo
logi
cal i
nter
pret
atio
n (b
).
(a)
(b)
Reprocessing and interpretation of seismic reflection data at Messara Basin, Crete, Greece 39
The seismic section highlights clearly two structures. The first one consists of several thrust sheets apparently in a general westward direction. The exact direction of compression has to be concluded by correlating Z1 seismic section with others seismic sections that are perpendicular to it. The second one is a pop-up structure which can be regarded as a positive flower structure. The pop-up structure is dissected by a complex system of faults which are rooted, along with the other thrusts, into a major low-angle thrust fault. This major low-angle thrust is persistent in the whole seismic profile. The whole area is subsided by boundary normal faults, which seems to coincide with the pre-existing thrusting surfaces.
CONCLUSIONS
Post-stack migration and zero-phase deconvolution generated improved seismic images of shallow structures. The Kirchoff migrated seismic section was the input for deconvolution. The zero-phase deconvolution method broadens the amplitude spectrum and it requires only the selection of the dominant frequency of the Ricker wavelet. Zero-phase deconvolution using time varying spectral shaping applied in an automatic way, increased the resolution, aiding in this way the interpretation of the seismic data.
The main features of the interpreted section Z1 are the following:
• Basement has reached small depths (approximately <200m) in the eastern and western edge of the seismic section.
• The maximum thickness of Neogene deposits reaches approximately 1000m.
• Compression seems to have influenced Neogene sediments, at least the oldest ones, indicating post-Serravallian activation.
• The central part in the seismic section has been subsided by the activation of boundary normal faults apparently post-dating the compression.
ACKNOWLEDGMENTS
We are grateful to the Ministry of Environment Energy and Climatic Change for providing us the seismic data from Messara and permitting us to publish the results of our work.
REFERENCES
Angelier, J., 1978, Tectonic evolution of the Hellenic Arc since Late Miocene, Tectonophysics, 49, 23-36.
Bachrach, R., and Reshef, M., 2010, 3D ultra shallow seismic imaging of buried pipe using dense receiver array, Practical and theoretical considerations, Geophysics, 75, 6, G45-G51.
Barley, B., and Summers, T., 2007, Multi-azimuth and wide-azimuth seismic: Shallow to deep water, exploration to production, The Leading Edge, 26, 4, 450–458.
Bonneau, M., 1984, Correlation of the Hellenides nappes in the south-east Aegean and their tectonic reconstruction, Geological Society of London, Special Publications, 17, 517-527.
Chatzaras, V., Xypolias, P., and Doutsos, T., 2006, Exhumation of high-pressure rocks under continuous compression: a working hypothesis for the southern Hellenides (central Crete, Greece), Geological Magazine, 143, 859-877.
Drummond, B., Goleby, B., Owen, A., Yeates, A., Swager, C., Zhang, Y, and Jackson, J., 2000, Seismic reflection imaging of mineral systems: Three case histories, Geophysics, 65, 6, 1852-1861.
Economou, N., and Vafidis, A., 2010, Spectral balancing GPR data using time variant band-width in t-f domain, Geophysics, 75, 3, J19-J27.
Economou, N., Vafidis A., Hamdan H., Kritikakis G., Andronikidis N., and Dimitriadis K., 2012, Time varying deconvolution of GPR data in civil engineering, Nondestructive Testing and Evaluation International, 27, 3, 285-292.
Fassoulas, C., 1999, The structural evolution of central Crete: insight into the tectonic evolution of the south Aegean (Greece), Journal of Geodynamics, 27, 23-43.
Fassoulas, C., Kilias, A., Mountrakis, D., 1994, Postnappe stacking extension and exhumation of HP/LT rocks in the island of Crete, Greece, Tectonics, 13, 127-138.
Gray, S., Etgen, J., Dellinger, J., and Whitmore, D., 2001, Seismic migration problems and solutions, Geophysics, 66, 5, 1622-1640.
Howard, M., 2007, Marine seismic surveys with enhanced azimuth coverage: Lessons in survey design and acquisition, The Leading Edge, 26, 4, 480.
Kilias, A., Fassoulas, C., and Mountrakis, D., 1994, Tertiary extension of continental crust and uplift of Psiloritis metamorphic core complex in the central part of the Hellenic Arc (Crete, Greece), Geol. Rundsch, 83, 417-430.
Klein, T., Craddock, J. P., and Zulauf, G., 2013, Constraints on the geodynamical evolution of Crete: insights from illite crystallinity, Raman spectroscopy and calcite twinning above and
40 Vafidis et al.
below the ‘Cretan detachment’, International Journal of Earth Sciences, 102, 135-182.
Kokinou, E., Alves, T., and Kamberis, E., 2012, Structural decoupling in a convergent forearc setting (southern Crete, Eastern Mediterranean), Geological Society of America Bulletin, 124, 1352-1364.
Lazaratos, S., and C., Finn, 2004, Deterministic spectral balancing for high-fidelity AVO, Presented at SEG Int. Exposition and 74th Annual Meeting, Denver, Colorado, 10-15 October, 2004.
Papanikolaou, D., and Vassilakis, E., 2010, Thrust faults and extensional detachment faults in Cretan tectono-stratigraphy: Implications for Middle Miocene extension, Tectonophysics, 233-247.
Sheriff, R., E., and Geldart, L., P., 1982, Exploration Seismology, Volumes 1 & 2, Cambridge University Press.
Stockwell, R., G., Mansinha, L., and Lowe, R., P., 1996, Localization of the complex spectrum: The S-transfor, IEEE Trans. Signal Processing, 44, 998–1001.
Taner, T., Luo, Y., Kelamis, G., and Kellogg, S., 2003, Frequency domain smoothing for enhanced seismic resolution, SEG Annual Meeting, October, 26-31, Dallas, Texas.
ten Veen, J., H., and Meijer, P. Th., 1998, Late Miocene to Recent tectonic evolution of Crete (Greece): geological observations and model analysis, Tectonophysics, 298, 191–208.
ten Veen, J., H., and Postma, G., 1999, Roll-back controlled vertical movements of outer-arc basins of the Hellenic subduction zone (Crete, Greece), Basin Research, 11, 243–266.
Tortorici, L., Caputo, R., and Monaco, C., 2010, Late Neogene to Quaternary contractional structures in Crete (Greece), Tectonophysics, 483, 203-213.
Yilmaz, O., 1987, Seismic data processing-Investigations in geophysics, Vol 2, SEG.
Yu, J., Hu, J., Schuster, G., and Estill, R., 2006, Prestack migration deconvolution, Geophysics, 71, 2, S53-S62.
van der Baan, M., 2012, Bandwidth enhancement by inverse-Q filtering or time-varying Wiener deconvolution, SEG Technical Program Expanded Abstracts, pp. 1-5.
van Hinsbergen, D., and Meulenkamp, J., 2006, Neogene supradetachment basin development on Crete (Greece) during exhumation of the South Aegean core complex, Basin Research, 18, 103-124.