Embed Size (px)
Citation preview
Schwarz et al. Translational Psychiatry (2019) 9:12
DOI 10.1038/s41398-018-0225-4 Translational Psychiatry
ART ICLE Open Ac ce s s
Reproducible grey matter patterns index amultivariate, global alteration of brainstructure in schizophrenia and bipolardisorderEmanuel Schwarz1, Nhat Trung Doan2, Giulio Pergola3, Lars T Westlye 2,4, Tobias Kaufmann2, Thomas Wolfers5,6,Ralph Brecheisen7, Tiziana Quarto3,8, Alex J Ing9, Pasquale Di Carlo 3, Tiril P Gurholt 2, Robbert L Harms10,Quentin Noirhomme10, Torgeir Moberget2, Ingrid Agartz2,11,12, Ole A Andreassen2, Marcella Bellani13,14,Alessandro Bertolino3,15, Giuseppe Blasi3,16, Paolo Brambilla 17, Jan K Buitelaar18,19, Simon Cervenka11, Lena Flyckt11,Sophia Frangou20, Barbara Franke 18,21, Jeremy Hall22, Dirk J Heslenfeld23, Peter Kirsch 24,25,Andrew M McIntosh 26,27, Markus M Nöthen28,29, Andreas Papassotiropoulos30,31,32,33,Dominique J-F de Quervain31,32,34, Marcella Rietschel 35, Gunter Schumann9, Heike Tost1, Stephanie H Witt 35,Mathias Zink1,36 and Andreas Meyer-Lindenberg1, The IMAGEMEND Consortium, Karolinska Schizophrenia Project(KaSP) Consortium
AbstractSchizophrenia is a severe mental disorder characterized by numerous subtle changes in brain structure and function.Machine learning allows exploring the utility of combining structural and functional brain magnetic resonanceimaging (MRI) measures for diagnostic application, but this approach has been hampered by sample size limitationsand lack of differential diagnostic data. Here, we performed a multi-site machine learning analysis to explore brainstructural patterns of T1 MRI data in 2668 individuals with schizophrenia, bipolar disorder or attention-deficit/hyperactivity disorder, and healthy controls. We found reproducible changes of structural parameters in schizophreniathat yielded a classification accuracy of up to 76% and provided discrimination from ADHD, through it lackedspecificity against bipolar disorder. The observed changes largely indexed distributed grey matter alterations thatcould be represented through a combination of several global brain-structural parameters. This multi-site machinelearning study identified a brain-structural signature that could reproducibly differentiate schizophrenia patients fromcontrols, but lacked specificity against bipolar disorder. While this currently limits the clinical utility of the identifiedsignature, the present study highlights that the underlying alterations index substantial global grey matter changes inpsychotic disorders, reflecting the biological similarity of these conditions, and provide a roadmap for futureexploration of brain structural alterations in psychiatric patients.
IntroductionSchizophrenia is a severe neuropsychiatric disorder
affecting approximately 0.7% of the population1. A largespectrum of experimental approaches has been used toidentify neural alterations in schizophrenia2,3. Amongthese, magnetic resonance imaging (MRI) has received
© The Author(s) 2019OpenAccessThis article is licensedunder aCreativeCommonsAttribution 4.0 International License,whichpermits use, sharing, adaptation, distribution and reproductionin any medium or format, as long as you give appropriate credit to the original author(s) and the source, provide a link to the Creative Commons license, and indicate if
changesweremade. The images or other third partymaterial in this article are included in the article’s Creative Commons license, unless indicated otherwise in a credit line to thematerial. Ifmaterial is not included in the article’s Creative Commons license and your intended use is not permitted by statutory regulation or exceeds the permitted use, you will need to obtainpermission directly from the copyright holder. To view a copy of this license, visit http://creativecommons.org/licenses/by/4.0/.
Correspondence: Emanuel Schwarz ([email protected]) orAndreas Meyer-Lindenberg ([email protected])1Department of Psychiatry and Psychotherapy, Central Institute of MentalHealth, Medical Faculty Mannheim, University of Heidelberg, Mannheim,Germany2Norwegian Centre for Mental Disorders Research (NORMENT), KG JebsenCentre for Psychosis Research, Division of Mental Health and Addiction,Institute of Clinical Medicine, University of Oslo, Oslo, NorwayFull list of author information is available at the end of the article.
1234
5678
90():,;
1234
5678
90():,;
1234567890():,;
1234
5678
90():,;
particularly strong interest4 due to its non-invasiveness,high efficiency in acquiring brain-wide information onstructure and function, and the ubiquitous availability ofscanners, enabling the accumulation of large sample sizes.Meta-analyses of MRI data have demonstrated thepresence of widespread brain-structural changes inpatients5–14, and machine learning, whereby combinedeffects of numerous predictors can be exploited, has beenused to identify predictive patterns that explain a sub-stantial amount of schizophrenia-associated variation15,16.With a few notable exceptions17–19, pattern recognition
studies on brain MRI data have only been performed insingle-site studies that demonstrate substantial variabilityin accuracy of case-control classification between studies.A recent meta-analysis suggests that this variability maybe attributable to small sample sizes, with larger studiesconverging at 70- 80% accuracy15. The latter accuracy isconsistent with a recent, large-scale multi-site investiga-tion showing reproducible brain-structural differencesbetween individuals with schizophrenia and healthy con-trols20. These limitations in accuracy pose a significantchallenge to translate psychiatric MRI tools for diagnosticand predictive applications into clinical practice. Theclinical utility of such tools strongly depends on theirvalue for everyday clinical decision making, which usuallyrequires differential diagnosis among different disordersrather than control/case discriminations. Therefore test-ing diagnostic specificity is of paramount importance21.Bipolar disorder has particularly high differential diag-nostic relevance for schizophrenia and previous studieshave provided promising evidence that structural differ-ences in schizophrenia show specificity against this dis-order22–24. Furthermore, symptoms of attention-deficit/hyperactivity disorder (ADHD) are among the frequentprecursors of schizophrenia25–31 during adolescence, buthave less differential diagnostic relevance in adult indivi-duals. The three conditions show substantially sharedgenetic risk, and conjointly map to a spectrum of neu-ropsychiatric disorders with brain structure alterationsassociated with genetic and environmental risk factors32.Based on these considerations, the collaborative FP7
project IMAging GEnetics for MENtal Disoders (IMA-GEMEND) has assembled a large, multimodal databasethat comprises neuroimaging data on cohorts of indivi-duals with schizophrenia and bipolar disorder, adolescentas well as adult individuals with ADHD, and healthycontrols33. The primary focus of the project is the iden-tification of multivariate biological signatures that can aiddiagnosis of these disorders. Using this resource, weanalyzed structural MRI data from 2668 individuals in thepresent study.Our primary aims were 1) to identify brain structural
patterns that can reproducibly differentiate individualswith schizophrenia from controls, 2) explore their
diagnostic specificity with regard to other disorders and 3)to identify the underlying brain structures driving suc-cessful classification. The availability of matched case-control data from several sites allowed application of aleave-site-out procedure, meaning that data from all butone site were iteratively used for algorithm training andthe remaining data used for testing. This was aimed at theidentification of differences robust against between-sitevariability. In order to make use of the complementaryinformation provided by the different measures, weincluded both 1) FreeSurfer-based measures of corticalmorphometry (cortical thickness, surface area andvolume) and global and subcortical volumetry as providedby Freesurfer34, and 2) voxel-based morphometry (VBM)as provided by Statistical Parametric Mapping (SPM)35.We also compared two machine learning strategies: (I)random forest machine learning, which captures non-linear and multiplicative effects of predictors and yields anefficient ranking of important predictors, and (II) supportvector machines (SVM), the most commonly and suc-cessfully applied linear tool in machine learning studieson brain structure36.
Materials and methodsCohortsThis study comprised eight cohorts with a total of 2668
participants (consisting of patients with schizophrenia(n= 375, cases in cohorts I-IV), bipolar disorder (n= 222,part of cohort VIII), ADHD (n= 342, cases in cohorts Vand VI), as well as healthy control subjects (n= 1729,cohorts I to VIII; n= 368 of these in cohorts I-IV)demographic details are shown in Supplementary Table 1;recruitment details are shown in Supplementary Table 2).All participants gave written, informed consent and thestudy received approval from the local ethics committeesof the participating institutions.
Data pre-processingPre-processing of all T1-weighted images was per-
formed centrally at the same site (University of Oslo,Norway) using FreeSurfer 5.3 (http://surfer.nmr.mgh.harvard.edu)34. All datasets underwent visual assessmentand minor manual intervention to correct for segmenta-tion errors wherever necessary. Data with significant lowquality due to, e.g., motion artifacts and image distortionswere excluded. Cortical parcellation was performed usingthe Desikan–Killiany atlas37,38, and subcortical segmen-tation was performed based on a probabilistic atlas39. Themean thickness, sum surface area, and volume for eachcortical region-of-interest (ROI), as well as the volume ofsubcortical structures were computed, resulting in a set of152 FreeSurfer features (Supplementary Table 4).An important question of the present study was whe-
ther signatures that combined the effects of multiple brain
Schwarz et al. Translational Psychiatry (2019) 9:12 Page 2 of 13
structures could be represented through regionally non-specific, ‘global grey-matter features’. For this, we manu-ally selected 20 of such ‘global features’ and these aredetailed in Supplementary Table 11. Additionally, the per-subject median of all ventricle features was used asreadout for global ventricle size. Furthermore, for VBM-and FreeSurfer-based analyses we determined separatelythe per-subject median across all features, resulting in a‘median feature’, resulting in a set of 22 ‘global features’ intotal. To avoid feature redundancy, bilateral features wereremoved if both uni-lateral features were available.The dataset was also processed each using VBM35 as
implemented in the CAT12 toolbox (http://dbm.neuro.uni-jena.de/cat/), SPM12 (http://www.fil.ion.ucl.ac.uk/spm/software/spm12/) and MATLAB 2014a (Math-works, Sherborn, MA, USA) to derive the grey matter(GM) maps. As input, we used the nu.mgz volume, anintensity-normalized volume adjusted for the non-uniformity in the original T1-images, obtained from theFreeSurfer pre-processing pipeline (https://surfer.nmr.mgh.harvard.edu/fswiki/ReconAllOutputFiles). Briefly,this volume was tissue-segmented into GM, white matter(WM) and cerebrospinal fluid maps. The modulated GMmaps were subsequently registered to the Dartel template,which is based on 550 healthy subjects from the IXIdatabase (http://brain-development.org/ixi-dataset/),using affine registration followed by the Dartel non-rigidregistration algorithm40. The mean GM density was thencomputed for each region-of-interest as defined in theAutomated Anatomical Labeling (AAL) atlas41, resultingin a set of 122 VBM features (Supplementary Table 3).
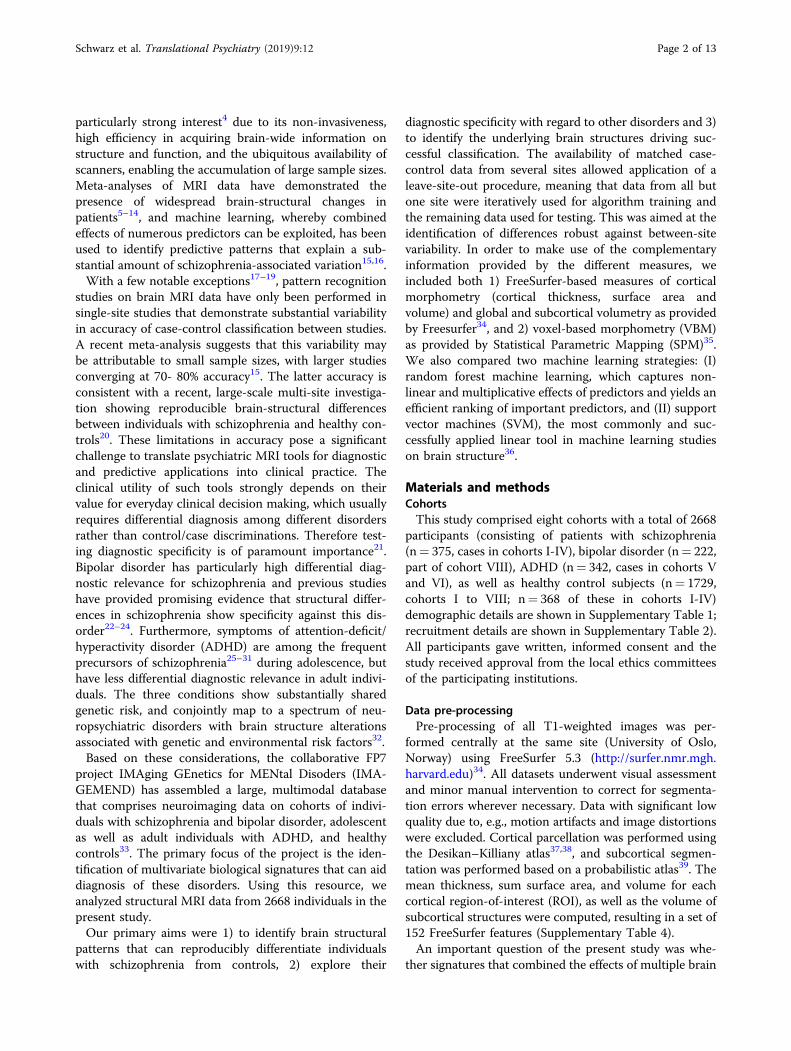
Matching, covariate adjustment and normalizationAn overview of the pre-processing and machine learn-
ing pipeline is shown in Fig. 1. Cohorts I to IV were usedfor subsequent training of machine learning algorithms.In cohorts II to IV, propensity score matching (using theR library MatchIt42) was used to create schizophrenia-control datasets, 1:1 matched on age and sex. Matchingwas performed separately for each cohort. No matchingwas performed in cohort I, since it comprised fewercontrols than patients and showed no significant case-control differences regarding age and sex. Controls notselected during the matching process were retained forvalidation of algorithms (cohort VIII).Covariate adjustment was performed in two steps. The
first step was aimed at removing the effects of covariatesrelevant within a given dataset. For this, linear regressionwas used to construct normalization models in the mat-ched case-control data (Supplementary Figure 1). Eachfeature was regressed against age, age2, sex, and totalintracranial volume (ICV, derived from FreeSurfer; thiscovariate was not included for thickness features derivedfrom FreeSurfer processing). Normalization models were
built separately for the cohorts used for training (i.e.during the leave-site-out procedure described below aswell as for prediction of the schizophrenia classifier intothe validation cohorts), and the resulting coefficients wereaveraged to obtain a final model per brain feature. Thesemodels were then applied to residualize the features in thetraining as well as the test data. Subsequently, ICV wasadded as a feature to the residualized training and testdata. In the second covariate adjustment step, the effectsof between-dataset variables (field strength and scannervendor) were removed. Using data from the previous stepas input, linear models were built to residualize alltraining data and adjust the test data accordingly. Duringthe leave-site-out testing procedures, as well as for testingclassifiers in validation data, the test data were not used togenerate normalization models and remained indepen-dent. The objective of this two-step procedure was toappropriately account for the effect of potential con-founders, without using site-information as additionalcovariate. This is essential for potential clinical applica-tion of a diagnostic tool, when subjects from sites aretested that are not part of the training data. In this case,adjustment against a site-covariate cannot be performed.In a secondary analysis, we set the means of each featurein a given test dataset artificially to 0 (for training data thisis already fulfilled due to the residualization procedure).With this we tested whether not using test data for
Fig. 1 Overview of analysis procedure. Subjects were firstpropensity score matched and VBM- / FreeSurfer-based featureswere then normalized against potential confounders.Normalization models were built in training data only and thesemodels were subsequently applied to adjust the test data. The samenormalization strategy was applied for global structural parameters,which were subsequently used to remove the global structural signalfrom VBM- / FreeSurfer-based features. The resulting data was used forleave-site-out cross-validation analyses. For univariate analyses, as wellas for machine learning analyses performed on the entire dataset, datawere additionally corrected for a site factor, to account for the impactof site differences (see methods)
Schwarz et al. Translational Psychiatry (2019) 9:12 Page 3 of 13
building of normalization models impacted on classifica-tion performance.For the machine learning analyses performed on the
entire, matched dataset (i.e. for out-of-bag performanceevaluation, where accuracy estimates were obtained fromobservations not selected during the repeated boot-strapping part of the random forest classification proce-dure, see below), we excluded the impact of a site factorthrough residualization using linear models, in addition tothe covariate adjustment described above. For this resi-dualization, site and scanner vendor were both includedas covariates. Such corrected data was also used for theunivariate analyses (see below). For principal componentsanalysis, which was applied to explore the global similaritybetween VBM- and FreeSurfer-based features, data wereadditionally normalized against diagnosis and subse-quently standardized.
Univariate analysisUnivariate analyses were performed to assess the extent
of change in individual brain-structural measures prior toand following adjustment for global structural parameters.Univariate analysis was performed on data residualized asdescribed above, to increase comparability against thefeatures’ importance determined by machine learning.Case-control differences were evaluated using Student’s t-tests and P-values were adjusted for the False DiscoveryRate (FDR) according to the method of Benjamini andHochberg43. The adjustment was performed separately forVBM- and FreeSurfer-based features.For the univariate analysis of the features following
removal of the global structural signal, we first correctedthe global structural features using the same stepsdescribed above. These corrected global structural fea-tures were then used to adjust the VBM- and FreeSurfer-based features, and the resulting residuals were used forthe univariate analysis.
Machine learning – cross-validation and accuracyestimationSeveral different procedures were employed to train and
test machine learning algorithms: a) ‘within-site’ classifi-cation, where algorithms were trained and tested sepa-rately in each given cohort (using cohorts I-IV forschizophrenia-control classification, cohort VIII (select-ing University of Oslo data only) for bipolar disorder-control classification, and cohorts V and VI for ADHD-control classification). b) ‘Leave-site-out’ classification incohorts I-IV. c) Prediction of a schizophrenia-controlclassifier in independent test data (the classifier wastrained in cohorts I-IV and tested in cohorts V-VIII).For procedures a) and b), performance of machine
learning algorithms was assessed by comparing the pre-dicted class membership against the real class-
membership. For ‘within-site’ classification, this was per-formed using bootstrapping.The Receiver Operating Characteristic Area Under
Curve (AUC) was determined to quantify accuracy (usingthe R library pROC44). For leave-site-out classification, weadditionally determined the mean of sensitivity and spe-cificity to explore whether predicted class probabilitieswere shifted across cohorts.For procedure c), accuracy was determined as the spe-
cificity, i.e. the percentage of subjects correctly classifiedas being not affected by schizophrenia.
Machine learning – random forestsRandom forest is a machine learning tool suitable for
classification and regression45. It combines the output of alarge number of individual classification/regression trees,each of which are built on randomly selected subsets ofobservations and predictors. The random forest cannaturally incorporate interactions between predictors,allows efficient ranking of predictor importance and hasbeen shown to be one of the most accurate classificationtools on a large variety of data sets36.Random forest machine learning (using the R package
randomForest46) was performed in a site-stratified man-ner using 5000 trees and the default value for the mtryparameter (no tuning of random forest parameters wasperformed). The number of trees was chosen based on theobservation that larger tree numbers do not significantlyimprove performance47. Site-stratification was performedsuch that for building each tree, an equal number ofsubjects (equal to the sample size of the smallest trainingcohort) were randomly drawn without replacement fromthe data of each site. We determined the importance ofthe features for prediction during this procedure using theGini index, a measure of how much a given featureimpacts the correct class separation, when used for a splitduring the tree-building process48. Selection of the mostimportant predictors was performed using the R packagevarSelRF49, also using 5000 trees, and default settingsotherwise. During this procedure, the least importantvariables are successively removed from the model. Theoptimal number of variables is chosen for the solutionwhere the out-of-bag error is equal to the lowest observederror rate, plus one standard deviation. This leads to asolution with close to optimal error rate but with a lowernumber of predictors, a scenario generally thought to bebeneficial for the generalizability of the classifier. TheGini-index-derived variable importance measure was alsoused to assess the similarity of features selected by within-site classification. For this, we determined the medianPearson correlation of the variable importance measuresacross cohorts.To explore the diagnostic specificity of important vari-
ables, we first selected the top m (with m being
Schwarz et al. Translational Psychiatry (2019) 9:12 Page 4 of 13
determined via random forest variable selection; m= 14for VBM-based and m= 11 for FreeSurfer-based features,respectively) variables from the schizophrenia-controlcomparison. We then determined the Wilcoxon ranksum statistic comparing the importance of these variablesagainst the remaining variables in bipolar disorder, ado-lescent as well as adult ADHD. To test significance, a5,000-fold permutation of diagnostic labels was per-formed. During each repetition, variable importance wasre-calculated for the three non-schizophrenia case-con-trol comparisons and the determination of rank sumstatistics was repeated. Empirical P-values were thencalculated as the frequency of permutation rank sumstatistic at least as high as those determined from non-permuted data.Random forest regression was used to determine the
amount of variance that could be predicted in individualVBM- and FreeSurfer-based features using the globalstructural parameters. The explained variance was deter-mined from out-of-bag predictions. For this analysis, thesame covariate-adjusted data were used as for the uni-variate analysis (see above). Accordingly, the globalstructural parameters were also additionally residualizedagainst a site factor.
Machine learning – Support Vector MachinesA support vector machine is a classification tool that
aims to identify a decision boundary with maximal marginbetween the boundary and observations from a givenclass50. The boundary is defined based on the mostproximal observations, making classification insensitive todata variations or outliers, resulting in frequently superiorgeneralization performance36. Linear SVM is relativelyrobust to overfitting and was, in the present study (usingthe R package e107151), tuned using 10-fold cross-vali-dation to optimize the cost parameter (choosing amongvalues from the log sequence between 10−5 and 105).Parameter optimization was performed in training dataonly.
Exploring the impact of global structural parameters onclassificationTo explore the effect of the 22 global structural features
on classification, these features were adjusted for con-founding variables using the same procedure applied forVBM- and FreeSurfer-based features (i.e. residualizationagainst age, age2, sex, gender, ICV, field strength, andscanner vendor). VBM- and FreeSurfer-based featureswere subsequently residualized against the covariate-adjusted global features using additive linear models. Toexplore the impact of this residualization procedureper se, it was repeated 1000 times with row order-permuted global features. Similarly, to explore the sig-nificance of the accuracy obtained after residualization,
the procedure was repeated 1000 times with permuteddiagnostic labels. Finally, to explore the classificationaccuracy obtained from global-features only, we appliedrandom forest machine learning (as described above)using the covariate-adjusted global features.
ResultsBrain structural neuroimaging data from a total of
2668 subjects were analyzed. Sample details are presentedin Supplementary Tables 1 and 2. The data were pro-cessed to extract either 122 VBM-based or 152FreeSurfer-based morphometry features (Fig. 1, Supple-mentary Tables 3 and 4, ICV was added as a predictor toeach feature set). Machine learning was used to identifystructural patterns that could be used to differentiateindividuals with schizophrenia from controls and toestablish the diagnostic specificity against bipolar disorderand ADHD.
Case-control differences, schizophrenia classification anddiagnostic specificity Univariate case-control differencesthe univariate analysis of matched cases and controls
from cohorts I to IV demonstrated significant alterationsin VBM-based features of individuals with schizophrenia(Supplementary Tables 3 and 4). A total of 110 of the 123features showed significant alteration at FDR < 0.05.Similarly, for FreeSurfer-based features, 105 of the 153features were significant at this threshold.
Machine-learning classificationUsing random forest machine learning, we first per-
formed a within-site classification of participants withschizophrenia and controls and found AUC valuesobtained from out-of-bag predictions ranging from 0.58to 0.82 for VBM-based and from 0.58 to 0.80 forFreeSurfer-based features, respectively (SupplementaryTable 5). Permutation analysis showed that accuracyestimates were significant for three of the four cohorts(Supplementary Table 5). When all case-control cohortswere combined into a single dataset, the AUC obtainedfrom out-of-bag predictions was 0.73 (P < 0.001) forVBM-based and 0.72 (P < 0.001) for FreeSurfer-basedmorphometry, respectively. When VBM- and FreeSurfer-based features were combined into a single dataset, theresulting AUC was 0.74 (P < 0.001). We further found thatfeatures were more consistently selected as importantpredictors for VBM data (median correlation of variableimportance measures across the four cohorts of 0.11)compared to FreeSurfer data (mean correlation -0.02).
Leave-site-out classificationWe tested the classification accuracy when all but one of
the case-control datasets were used for training. Thisleave-site-out cross-validation yielded median AUC
Schwarz et al. Translational Psychiatry (2019) 9:12 Page 5 of 13
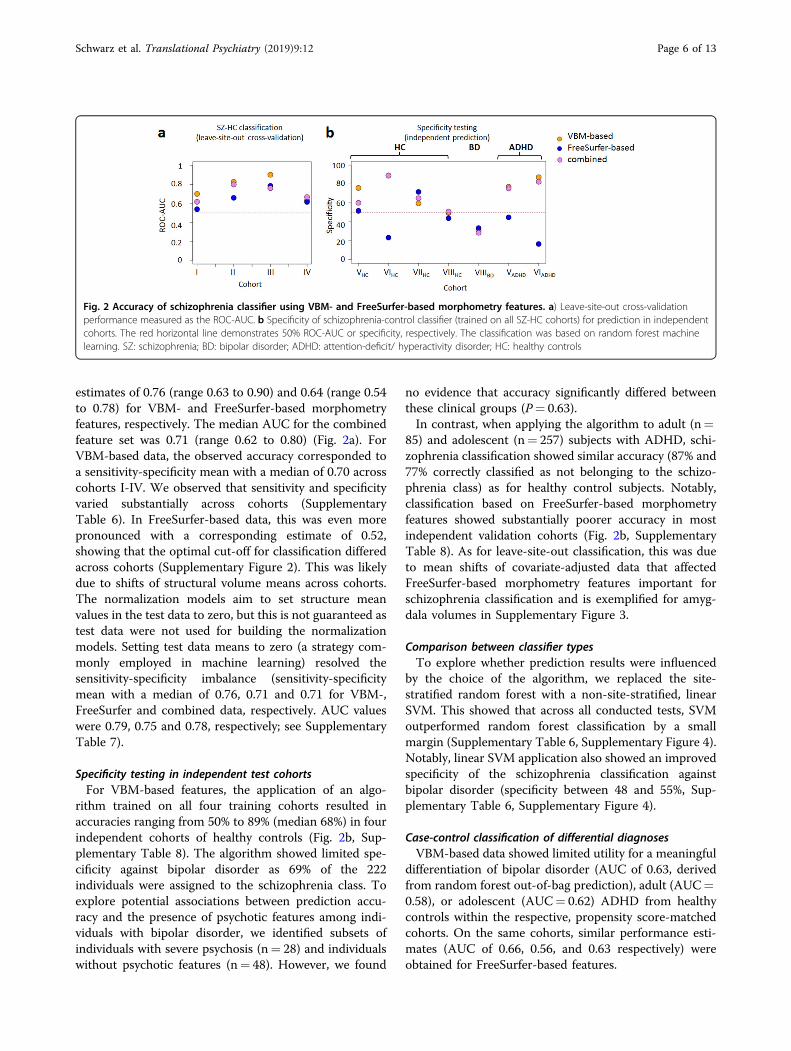
estimates of 0.76 (range 0.63 to 0.90) and 0.64 (range 0.54to 0.78) for VBM- and FreeSurfer-based morphometryfeatures, respectively. The median AUC for the combinedfeature set was 0.71 (range 0.62 to 0.80) (Fig. 2a). ForVBM-based data, the observed accuracy corresponded toa sensitivity-specificity mean with a median of 0.70 acrosscohorts I-IV. We observed that sensitivity and specificityvaried substantially across cohorts (SupplementaryTable 6). In FreeSurfer-based data, this was even morepronounced with a corresponding estimate of 0.52,showing that the optimal cut-off for classification differedacross cohorts (Supplementary Figure 2). This was likelydue to shifts of structural volume means across cohorts.The normalization models aim to set structure meanvalues in the test data to zero, but this is not guaranteed astest data were not used for building the normalizationmodels. Setting test data means to zero (a strategy com-monly employed in machine learning) resolved thesensitivity-specificity imbalance (sensitivity-specificitymean with a median of 0.76, 0.71 and 0.71 for VBM-,FreeSurfer and combined data, respectively. AUC valueswere 0.79, 0.75 and 0.78, respectively; see SupplementaryTable 7).
Specificity testing in independent test cohortsFor VBM-based features, the application of an algo-
rithm trained on all four training cohorts resulted inaccuracies ranging from 50% to 89% (median 68%) in fourindependent cohorts of healthy controls (Fig. 2b, Sup-plementary Table 8). The algorithm showed limited spe-cificity against bipolar disorder as 69% of the 222individuals were assigned to the schizophrenia class. Toexplore potential associations between prediction accu-racy and the presence of psychotic features among indi-viduals with bipolar disorder, we identified subsets ofindividuals with severe psychosis (n= 28) and individualswithout psychotic features (n= 48). However, we found
no evidence that accuracy significantly differed betweenthese clinical groups (P= 0.63).In contrast, when applying the algorithm to adult (n=
85) and adolescent (n= 257) subjects with ADHD, schi-zophrenia classification showed similar accuracy (87% and77% correctly classified as not belonging to the schizo-phrenia class) as for healthy control subjects. Notably,classification based on FreeSurfer-based morphometryfeatures showed substantially poorer accuracy in mostindependent validation cohorts (Fig. 2b, SupplementaryTable 8). As for leave-site-out classification, this was dueto mean shifts of covariate-adjusted data that affectedFreeSurfer-based morphometry features important forschizophrenia classification and is exemplified for amyg-dala volumes in Supplementary Figure 3.
Comparison between classifier typesTo explore whether prediction results were influenced
by the choice of the algorithm, we replaced the site-stratified random forest with a non-site-stratified, linearSVM. This showed that across all conducted tests, SVMoutperformed random forest classification by a smallmargin (Supplementary Table 6, Supplementary Figure 4).Notably, linear SVM application also showed an improvedspecificity of the schizophrenia classification againstbipolar disorder (specificity between 48 and 55%, Sup-plementary Table 6, Supplementary Figure 4).
Case-control classification of differential diagnosesVBM-based data showed limited utility for a meaningful
differentiation of bipolar disorder (AUC of 0.63, derivedfrom random forest out-of-bag prediction), adult (AUC=0.58), or adolescent (AUC= 0.62) ADHD from healthycontrols within the respective, propensity score-matchedcohorts. On the same cohorts, similar performance esti-mates (AUC of 0.66, 0.56, and 0.63 respectively) wereobtained for FreeSurfer-based features.
Fig. 2 Accuracy of schizophrenia classifier using VBM- and FreeSurfer-based morphometry features. a) Leave-site-out cross-validationperformance measured as the ROC-AUC. b Specificity of schizophrenia-control classifier (trained on all SZ-HC cohorts) for prediction in independentcohorts. The red horizontal line demonstrates 50% ROC-AUC or specificity, respectively. The classification was based on random forest machinelearning. SZ: schizophrenia; BD: bipolar disorder; ADHD: attention-deficit/ hyperactivity disorder; HC: healthy controls
Schwarz et al. Translational Psychiatry (2019) 9:12 Page 6 of 13
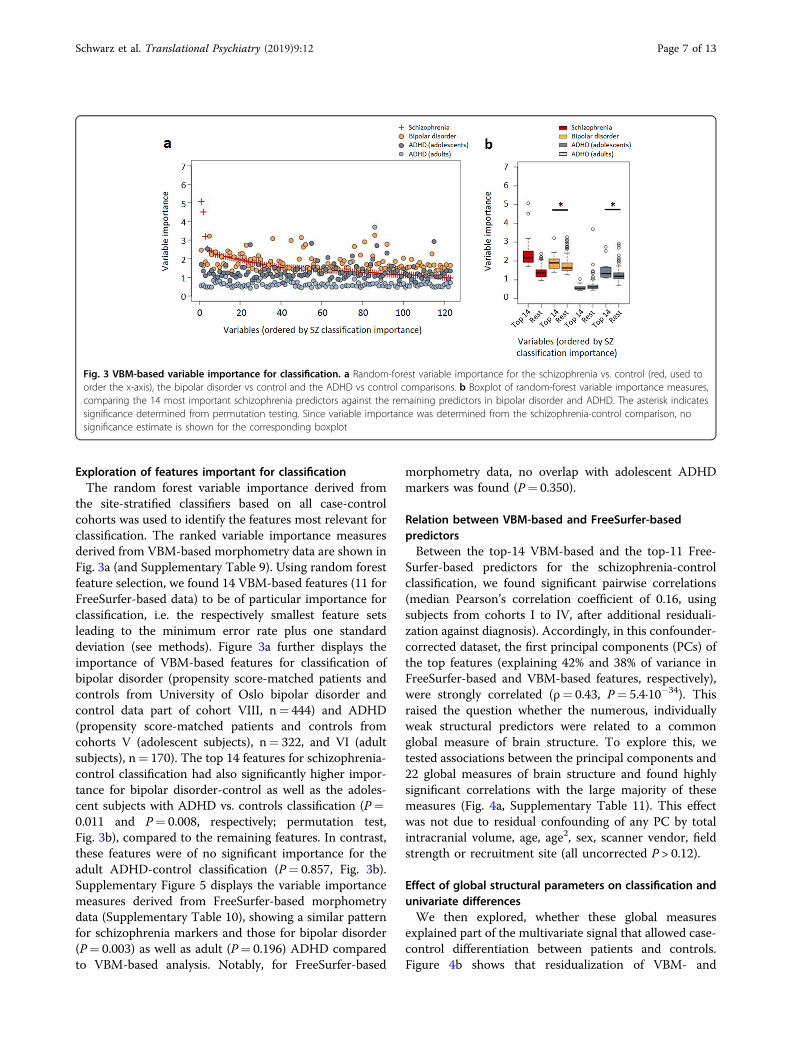
Exploration of features important for classificationThe random forest variable importance derived from
the site-stratified classifiers based on all case-controlcohorts was used to identify the features most relevant forclassification. The ranked variable importance measuresderived from VBM-based morphometry data are shown inFig. 3a (and Supplementary Table 9). Using random forestfeature selection, we found 14 VBM-based features (11 forFreeSurfer-based data) to be of particular importance forclassification, i.e. the respectively smallest feature setsleading to the minimum error rate plus one standarddeviation (see methods). Figure 3a further displays theimportance of VBM-based features for classification ofbipolar disorder (propensity score-matched patients andcontrols from University of Oslo bipolar disorder andcontrol data part of cohort VIII, n= 444) and ADHD(propensity score-matched patients and controls fromcohorts V (adolescent subjects), n= 322, and VI (adultsubjects), n= 170). The top 14 features for schizophrenia-control classification had also significantly higher impor-tance for bipolar disorder-control as well as the adoles-cent subjects with ADHD vs. controls classification (P=0.011 and P= 0.008, respectively; permutation test,Fig. 3b), compared to the remaining features. In contrast,these features were of no significant importance for theadult ADHD-control classification (P= 0.857, Fig. 3b).Supplementary Figure 5 displays the variable importancemeasures derived from FreeSurfer-based morphometrydata (Supplementary Table 10), showing a similar patternfor schizophrenia markers and those for bipolar disorder(P= 0.003) as well as adult (P= 0.196) ADHD comparedto VBM-based analysis. Notably, for FreeSurfer-based
morphometry data, no overlap with adolescent ADHDmarkers was found (P= 0.350).
Relation between VBM-based and FreeSurfer-basedpredictorsBetween the top-14 VBM-based and the top-11 Free-
Surfer-based predictors for the schizophrenia-controlclassification, we found significant pairwise correlations(median Pearson’s correlation coefficient of 0.16, usingsubjects from cohorts I to IV, after additional residuali-zation against diagnosis). Accordingly, in this confounder-corrected dataset, the first principal components (PCs) ofthe top features (explaining 42% and 38% of variance inFreeSurfer-based and VBM-based features, respectively),were strongly correlated (ρ= 0.43, P= 5.4·10−34). Thisraised the question whether the numerous, individuallyweak structural predictors were related to a commonglobal measure of brain structure. To explore this, wetested associations between the principal components and22 global measures of brain structure and found highlysignificant correlations with the large majority of thesemeasures (Fig. 4a, Supplementary Table 11). This effectwas not due to residual confounding of any PC by totalintracranial volume, age, age2, sex, scanner vendor, fieldstrength or recruitment site (all uncorrected P > 0.12).
Effect of global structural parameters on classification andunivariate differencesWe then explored, whether these global measures
explained part of the multivariate signal that allowed case-control differentiation between patients and controls.Figure 4b shows that residualization of VBM- and
Fig. 3 VBM-based variable importance for classification. a Random-forest variable importance for the schizophrenia vs. control (red, used toorder the x-axis), the bipolar disorder vs control and the ADHD vs control comparisons. b Boxplot of random-forest variable importance measures,comparing the 14 most important schizophrenia predictors against the remaining predictors in bipolar disorder and ADHD. The asterisk indicatessignificance determined from permutation testing. Since variable importance was determined from the schizophrenia-control comparison, nosignificance estimate is shown for the corresponding boxplot
Schwarz et al. Translational Psychiatry (2019) 9:12 Page 7 of 13
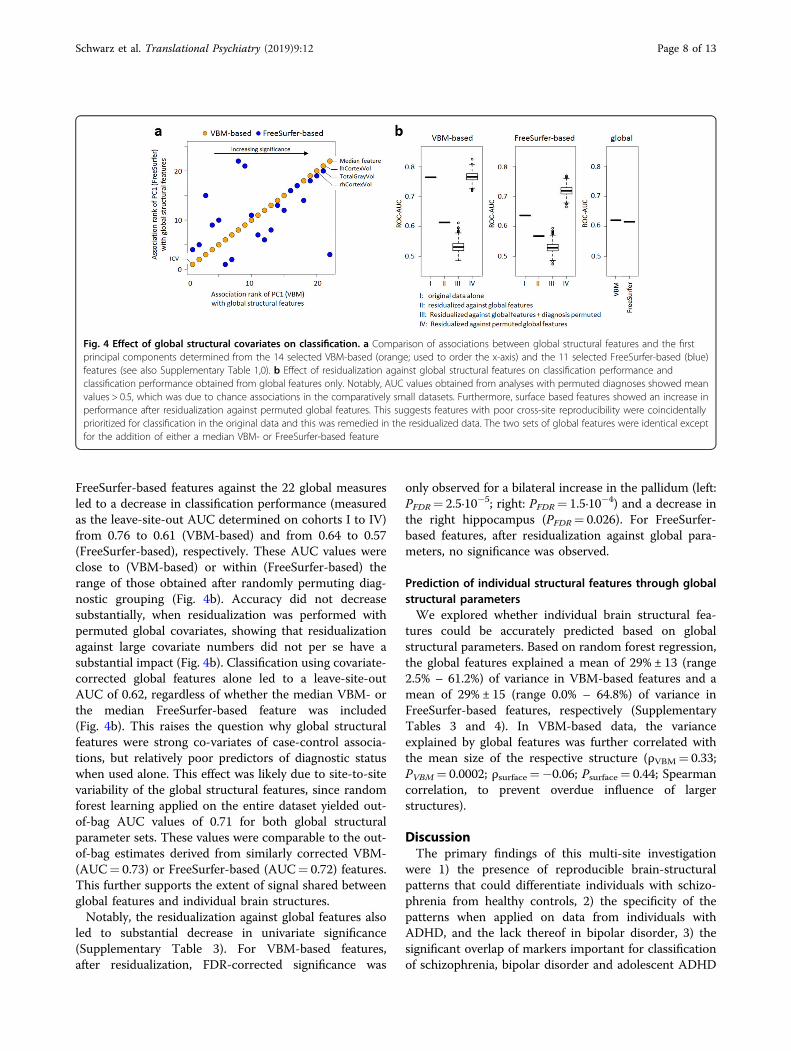
FreeSurfer-based features against the 22 global measuresled to a decrease in classification performance (measuredas the leave-site-out AUC determined on cohorts I to IV)from 0.76 to 0.61 (VBM-based) and from 0.64 to 0.57(FreeSurfer-based), respectively. These AUC values wereclose to (VBM-based) or within (FreeSurfer-based) therange of those obtained after randomly permuting diag-nostic grouping (Fig. 4b). Accuracy did not decreasesubstantially, when residualization was performed withpermuted global covariates, showing that residualizationagainst large covariate numbers did not per se have asubstantial impact (Fig. 4b). Classification using covariate-corrected global features alone led to a leave-site-outAUC of 0.62, regardless of whether the median VBM- orthe median FreeSurfer-based feature was included(Fig. 4b). This raises the question why global structuralfeatures were strong co-variates of case-control associa-tions, but relatively poor predictors of diagnostic statuswhen used alone. This effect was likely due to site-to-sitevariability of the global structural features, since randomforest learning applied on the entire dataset yielded out-of-bag AUC values of 0.71 for both global structuralparameter sets. These values were comparable to the out-of-bag estimates derived from similarly corrected VBM-(AUC= 0.73) or FreeSurfer-based (AUC= 0.72) features.This further supports the extent of signal shared betweenglobal features and individual brain structures.Notably, the residualization against global features also
led to substantial decrease in univariate significance(Supplementary Table 3). For VBM-based features,after residualization, FDR-corrected significance was
only observed for a bilateral increase in the pallidum (left:PFDR= 2.5·10−5; right: PFDR= 1.5·10−4) and a decrease inthe right hippocampus (PFDR= 0.026). For FreeSurfer-based features, after residualization against global para-meters, no significance was observed.
Prediction of individual structural features through globalstructural parametersWe explored whether individual brain structural fea-
tures could be accurately predicted based on globalstructural parameters. Based on random forest regression,the global features explained a mean of 29% ± 13 (range2.5% – 61.2%) of variance in VBM-based features and amean of 29% ± 15 (range 0.0% – 64.8%) of variance inFreeSurfer-based features, respectively (SupplementaryTables 3 and 4). In VBM-based data, the varianceexplained by global features was further correlated withthe mean size of the respective structure (ρVBM= 0.33;PVBM= 0.0002; ρsurface=−0.06; Psurface= 0.44; Spearmancorrelation, to prevent overdue influence of largerstructures).
DiscussionThe primary findings of this multi-site investigation
were 1) the presence of reproducible brain-structuralpatterns that could differentiate individuals with schizo-phrenia from healthy controls, 2) the specificity of thepatterns when applied on data from individuals withADHD, and the lack thereof in bipolar disorder, 3) thesignificant overlap of markers important for classificationof schizophrenia, bipolar disorder and adolescent ADHD
Fig. 4 Effect of global structural covariates on classification. a Comparison of associations between global structural features and the firstprincipal components determined from the 14 selected VBM-based (orange; used to order the x-axis) and the 11 selected FreeSurfer-based (blue)features (see also Supplementary Table 1,0). b Effect of residualization against global structural features on classification performance andclassification performance obtained from global features only. Notably, AUC values obtained from analyses with permuted diagnoses showed meanvalues > 0.5, which was due to chance associations in the comparatively small datasets. Furthermore, surface based features showed an increase inperformance after residualization against permuted global features. This suggests features with poor cross-site reproducibility were coincidentallyprioritized for classification in the original data and this was remedied in the residualized data. The two sets of global features were identical exceptfor the addition of either a median VBM- or FreeSurfer-based feature
Schwarz et al. Translational Psychiatry (2019) 9:12 Page 8 of 13
and 4) the finding that brain-structural changes werestrongly associated with global structural parameters.Based on brain-structural patterns, individuals with
schizophrenia could be reproducibly differentiated fromhealthy controls, with a median AUC of up to 0.76. Per-formance estimates were derived from unbiased leave-site-out cross-validation and no test set data were used todetermine parameters of covariate adjustment or machinelearning models. Therefore, the obtained estimates arelikely to reflect the performance of the algorithms, whentested in independent data. We observed that when testdata were not used during generation of normalizationmodels, sensitivity and specificity fluctuated substantially,which could be resolved by scaling of the test data. This,however, would require at least some data from a giventest site to be available prior to testing algorithms in datafrom that site20. It should also be noted that biologicalheterogeneity resulting from the current diagnostic sys-tem limits the accuracy biological predictions can achieve,when aiming to reproduce clinical classifications, con-stituting a general caveat for the field.The brain-structural patterns associated with schizo-
phrenia showed significant lack of specificity againstbipolar disorder, consistent with the substantial geneticand clinical overlap of the two disorders30,31,52. Notably,the signatures were specific against adolescent and adultADHD. Subjects with ADHD, did not, however, showbrain-structural alterations that could be used for accu-rate classification, nor did those with bipolar disorder.Despite this, the VBM-based feature sets most useful forclassification of adolescent ADHD and schizophreniashowed significant overlap. Given the high specificity ofthe schizophrenia classifier against adolescent ADHD, thissupports divergent profiles in the same feature set. Aparticular strength of the present study was that conclu-sions regarding differential diagnostic specificity againstbipolar disorder were not confounded by site variability.Considering the observed specificity fluctuations duringleave-site-out testing, it should, however, be noted thatthe preferential classification of subjects with ADHD ascontrols could have been influenced by between-siteeffects. Similarly, non-specificity of the schizophreniaclassifier against bipolar disorder was determined in onecohort and requires further replication. Also, the lack ofadolescent subjects in the training data may have con-founded the accuracy observed in adolescent ADHDsubjects.We aimed to identify brain-structural features driving
reproducible schizophrenia-control classification and tocompare these between two different pre-processingstrategies. We observed that these strategies led to iden-tification of differential structural patterns but found thatthese alterations were, to a large extent, capturing over-lapping global brain-structural alterations. Removing
variation explained by measures of global structuralproperties also removed most of the identified multi-variate signals. Notably, global structural parameters werestrong confounders of VBM- and FreeSurfer-based fea-ture associations, but were on their own relatively poorpredictors of diagnosis. Our results indicate that this was,to a significant extent, due to between-site variabilityaffecting the global signal. This effect may be due to thefact that the global signal combines multiple signals thatare individually affected by site-specific effects (such asthe shifts in mean measurement observed in the presentstudy), creating an aggregate signal reflecting site idio-syncrasies. This, in turn, raises the important question towhat extent global variables reflect the underlying biologyvs. measurement factors (i.e. the signal to noise ratio) instructural imaging data. The observed case-control clas-sification performance is consistent with previous large-scale analyses15,20, thus it is unlikely that measurementuncertainty specific to the present study accounts for theglobal effects detected. Furthermore, GM differences havebeen observed in numerous studies investigating first-episode schizophrenia patients, suggesting that theseeffects are not primarily related to the specific clinicalcharacteristics of the samples we examined [e.g53–55]. Onepossible interpretation of these results is that schizo-phrenia entails a combination of isometric and allometricstructural changes which may vary between individualsand within patients across different stages of the illness.This explanation may account for the low effect sizes andeffect heterogeneities of structural differences previouslyobserved in schizophrenia. Another interpretation is thata shared biological component affecting global variablesacross multiple disorders discriminates controls fromcases, but does not differentiate patients with differentdiagnoses. Accordingly, previous reports highlightedshared genetic components across multiple psychiatricdisorders and personality traits56,57. In contrast, the pre-sent results may also be interpreted from the perspectiveof cross-cohort reproducibility. That is, the reduction inclassifier accuracy through consideration of global struc-tural features primarily relates to effects on reproduciblealterations in GM features. Changes in individual sites, incontrast, may have persisted despite the normalizationagainst the global signals. This interpretation raises thequestion whether this and previous studies had sufficientresolution, in view of the large site to site differences, toinvestigate reproducible regional effects. An improvedimaging resolution could also allow identifying patterns ofstructural differences that show higher specificity betweenschizophrenia and bipolar disorder. A corollary of thisview is the question whether, even assuming that struc-tural imaging resolution yields sufficient signal to noiseratio to study regional effects, the correlations betweenregional and global variables caused by common
Schwarz et al. Translational Psychiatry (2019) 9:12 Page 9 of 13
underlying biology and by shared measurement uncer-tainties can be meaningfully disentangled. For example,we found that identification of univariate changes wasstrongly dependent on global structural alterations.Importantly, if the global signal was indeed more affectedby site specific experimental effects than individual brainstructures, it would be challenging for single-site investi-gations or univariate statistics to appropriately accountfor this effect, limiting the possibility to reproduce find-ings across studies.In this context, a limitation of the present study is the
lacking incorporation of other data modalities, such asdemographic, clinical or psycho-behavioral features,which could potentially have informed on the presence ofpatient subgroups or illness-dimensions in relation tobrain-structural alterations. Similarly, future studiesshould explore the effects of antipsychotic treatment onGM, which have been observed in schizophrenia (i.e.ref. 9) and are supported by data from animal models58,59,but which have also been found in antipsychotic-nativesubjects9. An acerbation of disorder-intrinsic structuralchanges by medication may be a possible explanation whyremoval of the global signal almost completely removedstructural differences. While this study explores theimpact of different pre-processing strategies on machinelearning analysis of brain-structural differences, it doesnot offer a comprehensive analysis of the broad spectrumof preprocessing methods currently available. The sensi-tivity of machine learning to the choice of preprocessingmay contribute to the variability of such analyses asreported in previous studies. Another limitation of thepresent study is the fact that it involved already diagnosedpatients. One of the most significant aspects of clinicalutility will be the ability to accurately predict the transi-tion from early signs to full-blown illness, such thatappropriate treatment can be started earlier.Finally, an interesting finding was that linear SVM
application showed marginally better classification per-formance compared to RF machine learning. This sug-gests that classification did not profit from RF’s ability tomodel complex interactions. Interestingly, schizophreniaclassification using linear SVM also showed an improvedspecificity against bipolar disorder, which requires furthervalidation in independent cohorts.In conclusion, this study identified reproducible GM
patterns that index a multivariate, global alteration ofbrain structure in schizophrenia and bipolar disorder, butare different from those seen in ADHD. These results mayreflect the biological heterogeneity of schizophrenia andare consistent with previous observations of sharedgenetic determinants between these disorders. The resultsfurther demonstrate the need for appropriately account-ing for the global signal during analysis of individual brainstructures. They underline the importance of biologically
dissecting these illnesses as a basis to redefine diagnosticboundaries using biological parameters. These efforts maybenefit from integrative analyses of other relevant datamodalities, including genetic risk measures or functionalneuroimaging, which may yield more accurate and spe-cific classifiers that have clinical utility. Also, substantialdifferences in the ability to derive reproducible brain-structural signatures were found when using VBM orFreeSurfer features derived from the same individuals,highlighting the importance of preprocessing strategiesfor machine learning analysis of brain-structural data.Finally, the present results highlight the need for a morein-depth analysis of how individual brain structures con-tribute to the pathophysiology of these psychiatricdisorders.
Code availabilityCode used for the analyses described in this manu-
scriptis available from the corresponding author uponrequest.
AcknowledgementsWe thank all the patients and healthy volunteers for their willingness toparticipate in the study. We also wish to express our appreciation to the KaSPresearch nurses. We would further like to thank Dr. Axel Schaefer and MarinaCariello for their assistance with this study. This study was supported by theEuropean Union’s Seventh Framework Programme for research, technologicaldevelopment and demonstration under grant agreement no 602450(IMAGEMEND, IMAging GENetics for MENtal Disorders) and the DeutscheForschungsgemeinschaft (DFG), SCHW 1768/1-1. A.M.-L. was supported by theDeutsche Forschungsgemeinschaft (DFG) (Collaborative Research Center SFB636, subproject B7); the German Federal Ministry of Education and Research(BMBF) through the Integrated Network IntegraMent (IntegratedUnderstanding of Causes and Mechanisms in Mental Disorders) under theauspices of the e:Med Programme (BMBF Grant 01ZX1314A and 01ZX1314G);and the Innovative Medicines Initiative Joint Undertaking (IMI) under GrantAgreements no 115300 (European Autism Interventions—A Multicentre Studyfor Developing New Medications) and no 602805 (European Union-Aggressotype). This study made use of the Dutch sample of the InternationalMulticentre persistent ADHD CollaboraTion (IMpACT). IMpACT unites majorresearch centres working on the genetics of ADHD persistence across thelifespan and has participants in the Netherlands, Germany, Spain, Norway, theUnited Kingdom, the United States, Brazil, and Sweden. The Dutch IMpACTnode is supported by grants from the Netherlands Organisation for ScientificResearch (NWO; grants 433-09-229 and 016-130-669 to BF), from the EuropeanCommunity’s Seventh Framework Programme (FP7/2007-2013) (grantagreements no 278948 (TACTICS), no 602450 (IMAGEMEND), and no 602805(Aggressotype)) and Horizon 2020 Programme (grant agreements no 643051(MiND) and no 667302 (CoCA)). This research also receives funding from theEuropean College of Neuropsychopharmacology (ECNP) Network ‘ADHDacross the Lifespan’ and the National Institutes of Health (NIH) Consortiumgrant U54 EB020403, supported by a cross-NIH alliance that funds Big Data toKnowledge Centers of Excellence. The NeuroIMAGE study, also contributingdata to this study, represents the longitudinal follow-up of the Dutchsubsample of the International Multicentre ADHD Genetics (IMAGE) project. PIsof NeuroIMAGE are Jan Buitelaar and Barbara Franke (Radboud UniversityMedical Center, Nijmegen), Jaap Oosterlaan and Dirk Heslenfeld (VrijeUniversiteit Medical Centre, Amsterdam), and Pieter Hoekstra and CatharinaHartman (University Medical Centre Groningen). NeuroIMAGE is supported bygrants from The Netherlands Organization for Health Research andDevelopment (ZonMw 60-60600-97-193), the Netherlands Organization forScientific Research (NWO, grants 1750102007010, 433-09-242 and 056-13-015),and by the European Community’s Seventh Framework Programme (FP7/2007-2013) under grant agreement number 278948 (TACTICS), 602450(IMAGEMEND), 602805 (AGGRESSOTYPE), 603016 (MATRICS), and Horizon 2020
Schwarz et al. Translational Psychiatry (2019) 9:12 Page 10 of 13
(grant agreement 643051 (MiND) and 642996 (BRAINVIEW) researchprogrammes. T.P.G. acknowledges funding from The Research Council ofNorway (grant #223273) and the KG Jebsen Foundation. J.O. acknowledgesfunding by NIH Grant R01MH62873, NWO Large Investment Grant1750102007010 and an NWO Brain & Cognition grant (056-24-011), theEuropean Union 7th Framework programs AGGRESSOTYPE (602805) andMATRICS (603016), and by grants from Radboud University Medical Center,University Medical Center Groningen and Accare, and Vrije UniversiteitAmsterdam. L.F. acknowledges funding by Söderbergs Königska Stiftelse,Stockholm County Council (ALF, PPG). H.F.B. acknowledges funding bySöderbergs Königska Stiftelse, Centre for Psychiatry Research (post docstipendium). S.C. acknowledges funding by The Swedish Research Council(523-2014-3467) and the Stockholm County Council (20160328). P.K.acknowledges funding by the DFG (KI 576/14-2). T.K. acknowledges funding bythe Research Council of Norway (grants #213837 and #223273 to PI OleAndreassen). J.H. acknowledges funding by the Wellcome Trust as well as theMRC. D.J.F.d.Q acknowledges funding by the Swiss National ScienceFoundation. G.P. acknowledges funding by Fondazione CON IL SUD, andHoffmann-La Roche. PB was partially supported by grants from the ItalianMinistry of Health (RF-2011-02352308). P.M.T. acknowledges funding by NIHgrant U54 EB020403. F.D. acknowledges funding by the German FederalMinistry of Education and Research (BMBF) grant 01ZX1314A/01ZX1614A. A.R.acknowledges funding by the “Capitale Umano ad Alta Qualificazione” grantawarded by Fondazione Con Il Sud. E.G.J. acknowledges funding by theSwedish Research Council, a regional agreement on medical training andclinical research between Stockholm County Council and Karolinska Institutet,and the HUBIN project. The HUBIN and KaSP studies were supported by theSwedish Research Council.
Author details1Department of Psychiatry and Psychotherapy, Central Institute of MentalHealth, Medical Faculty Mannheim, University of Heidelberg, Mannheim,Germany. 2Norwegian Centre for Mental Disorders Research (NORMENT), KGJebsen Centre for Psychosis Research, Division of Mental Health and Addiction,Institute of Clinical Medicine, University of Oslo, Oslo, Norway. 3Department ofBasic Medical Sciences, Neuroscience and Sense Organs, University of Bari AldoMoro, Bari, Italy. 4Department of Psychology, University of Oslo, Oslo, Norway.5Department of Human Genetics, Radboud University Medical Center,Nijmegen, The Netherlands. 6Donders Center for Cognitive Neuroimaging,Radboud University, Nijmegen, The Netherlands. 7Maastricht UniversityMedical Center, Maastricht, The Netherlands. 8Cognitive Brain Research Unit,Department of Psychology and Logopedics, Faculty of Medicine, University ofHelsinki, Helsinki, Finland. 9Centre for Population Neuroscience and StratifiedMedicine (PONS) and MRC-SGDP Centre, Institute of Psychiatry, Psychology &Neuroscience, King’s College London, London, UK. 10Brain Innovation B.V.,Maastricht, The Netherlands. 11Centre for Psychiatry Research, Department ofClinical Neuroscience, Karolinska Institutet, & Stockholm County Council,Stockholm, Sweden. 12Department of Psychiatry Research, DiakonhjemmetHospital, Oslo, Norway. 13Section of Psychiatry, Azienda OspedalieraUniversitaria Integrata Verona, Verona, VR, Italy. 14Department ofNeurosciences, Biomedicine and Movements Sciences, University of Verona,Verona, VR, Italy. 15Institute of Psichiatry, Policlinico Bari, Azienda OspedalieroUniversitaria Consorziale Policlinico Bari, Bari, BA, Italy. 16Azienda Ospedaliero-Universitaria Consorziale Policlinico, Bari, Italy. 17Department of Neurosciencesand Mental Health, Fondazione IRCCS Ca’ Granda Ospedale MaggiorePoliclinico, University of Milan, Milan, Italy. 18Donders Institute for Brain,Cognition and Behaviour, Radboudumc, Nijmegen, The Netherlands. 19KarakterChild and Adolescent Psychiatry University Center, Nijmegen, The Netherlands.20Department of Psychiatry, Icahn School of Medicine at Mount Sinai, NewYork, NY, USA. 21Departments of Human Genetics and Psychiatry, RadboudUniversity Medical Center, Nijmegen, The Netherlands. 22Neuroscience andMental Health Research Institute, Cardiff University, Maindy Road, Cardiff CF244HQ, UK. 23Department of Cognitive Psychology, Vrije Universiteit Amsterdam,Amsterdam, The Netherlands. 24Department of Clinical Psychology, CentralInstitute of Mental Health, Medical Faculty Mannheim, University of Heidelberg,Heidelberg, Germany. 25Bernstein Center for Computational NeuroscienceHeidelberg-Mannheim, Mannheim, Germany. 26Division of Psychiatry,University of Edinburgh, Royal Edinburgh Hospital, Edinburgh EH10 5HF, UK.27Centre for Cognitive Ageing and Cognitive Epidemiology, University ofEdinburgh, George Square, Edinburgh EH8 9JZ, UK. 28Institute of HumanGenetics, University of Bonn, School of Medicine & University Hospital Bonn,
Bonn, Germany. 29Department of Genomics, Life & Brain Center, University ofBonn, Bonn, Germany. 30Division of Molecular Neuroscience, Department ofPsychology, University of Basel, CH-4055 Basel, Switzerland. 31TransfacultyResearch Platform Molecular and Cognitive Neuroscience, University of Basel,Basel, Switzerland. 32Psychiatric University Clinics, University of Basel, CH-4055Basel, Switzerland. 33Department Biozentrum, Life Sciences Training Facility,University of Basel, CH-4056 Basel, Switzerland. 34Division of CognitiveNeuroscience, Department of Psychology, University of Basel, CH-4055 Basel,Switzerland. 35Department of Genetic Epidemiology in Psychiatry, CentralInstitute of Mental Health, Medical Faculty Mannheim, Heidelberg University,Heidelberg, Germany. 36District Hospital Mittelfranken, Department ofPsychiatry, Psychotherapy and Psychosomatics, Ansbach, Germany
The IMAGEMEND ConsortiumFrancesco Bettella2, Christine L Brandt2, Toni-Kim Clarke26, David Coynel31,34,Franziska Degenhardt28,29, Srdjan Djurovic2,37, Sarah Eisenacher1, MatthiasFastenrath31,34, Helena Fatouros-Bergman11, Andreas J Forstner28,29,38,39,40,Josef Frank35, Francesco Gambi41, Barbara Gelao3, Leo Geschwind30,31, Massimodi Giannantonio41,42, Annabella Di Giorgio3,43, Catharina A Hartman44, StefanieHeilmann-Heimbach28,29, Stefan Herms28,29,45, Pieter J Hoekstra46, PerHoffmann28,29,45, Martine Hoogman5,18, Erik G Jönsson4,11, Eva Loos31,34,Eleonora Maggioni3,17, Jaap Oosterlaan47, Marco Papalino3, Antonio Rampino3,Liana Romaniuk26, Pierluigi Selvaggi3,48, Gianna Sepede3,41, Ida E Sønderby2,Klara Spalek31,34, Jessika E Sussmann26, Paul M Thompson49, Alejandro AriasVasquez21, Christian Vogler30,31, Heather Whalley26 37Department of MedicalGenetics, Oslo University Hospital, Oslo, Norway. 38Human Genomics ResearchGroup, Department of Biomedicine, University of Basel, Basel, Switzerland.39Department of Psychiatry (UPK), University of Basel, Basel, Switzerland.40Institute of Medical Genetics and Pathology, University Hospital Basel, Basel,Switzerland. 41Department of Neuroscience, Imaging and Clinical Sciences “G.D’Annunzio” University Chieti-Pescara, Pescara, Italy. 42Department of MentalHealth, National Health Trust, Chieti, Italy. 43Fondazione Casa Sollievo dellaSofferenza IRCCS San Giovanni Rotondo (FG), San Giovanni Rotondo, Italy.44Department of Psychiatry, Interdisciplinary Center Psychopathology andEmotion regulation, University of Groningen, University Medical CenterGroningen, Groningen, The Netherlands. 45Department of Biomedicine &Institute of Medical Genetics and Pathology, Human Genomics ResearchGroup and Division of Medical Genetics, Department of Biomedicine,University and University Hospital Basel, Basel, Switzerland. 46Department ofChild and Adolescent Psychiatry, University of Groningen, University MedicalCenter Groningen, Groningen, The Netherlands. 47Emma Children’s Hospital,Academic Medical Center, Amsterdam, The Netherlands. 48Department ofNeuroimaging, Institute of Psychiatry, Psychology and Neuroscience, King’sCollege London, London, UK. 49Imaging Genetics Center, Stevens Institute forNeuroimaging & Informatics, University of Southern California, Los Angeles, CA,USA.
Karolinska Schizophrenia Project (KaSP) ConsortiumFarde L11, Flyckt L11, Engberg G50, Erhardt S50, Fatouros-Bergman H11, CervenkaS11, Schwieler L50, Agartz I2,11,12, Collste K11, Victorsson P11, Malmqvist A50,Hedberg M50, Orhan F50 50Department of Physiology and Pharmacology,Karolinska Institutet, Stockholm, Sweden
Conflicts of interestA.M.-L. has received consultant fees from Blueprint Partnership, BoehringerIngelheim, Daimler und Benz Stiftung, Elsevier, F. Hoffmann-La Roche, ICARESchizophrenia, K. G. Jebsen Foundation, L.E.K Consulting, LundbeckInternational Foundation (LINF), R. Adamczak, Roche Pharma, ScienceFoundation, Synapsis Foundation – Alzheimer Research Switzerland, SystemAnalytics, and has received lectures including travel fees from BoehringerIngelheim, Fama Public Relations, Institut d’investigacions Biomèdiques AugustPi i Sunyer (IDIBAPS), Janssen-Cilag, Klinikum Christophsbad, Göppingen, LillyDeutschland, Luzerner Psychiatrie, LVR Klinikum Düsseldorf, LWLPsychiatrieVerbund Westfalen-Lippe, Otsuka Pharmaceuticals, Reunions iCiencia S. L., Spanish Society of Psychiatry, Südwestrundfunk Fernsehen, SternTV, and Vitos Klinikum Kurhessen. J.K.B. has been in the past 3 years aconsultant to / member of advisory board of / and/or speaker for Roche,Medice and Servier. He is not an employee of any of these companies, and nota stock shareholder of any of these companies. He has no other financial ormaterial support, including expert testimony, patents, royalties. A.B. is astockholder of Roche and has received lecture fees from Otsuka. M.Z. has
Schwarz et al. Translational Psychiatry (2019) 9:12 Page 11 of 13
received unrestricted scientific grants from German Research Foundation(DFG), and Servier; further speaker and travel grants were provided by Otsuka,Servier, Lundbeck, Roche, Ferrer and Trommsdorff. S.C. has received grantsupport from AstraZeneca as a co-investigator, and has served as a one-offspeaker for Otsuka-Lundbeck and Roche Pharmaceuticals. SCs spouse is anemployee of SOBI pharmaceuticals. G.P. was an academic supervisor of aHoffmann-La Roche collaboration grant (years 2015-16). B.F. has receivededucational speaking fees from Shire and Medice. All other authors declare nopotential conflicts of interest.
Publisher's noteSpringer Nature remains neutral with regard to jurisdictional claims inpublished maps and institutional affiliations.
Supplementary Information accompanies this paper at (https://doi.org/10.1038/s41398-018-0225-4).
Received: 4 July 2018 Accepted: 16 July 2018
References1. McGrath, J., Saha, S., Chant, D. & Welham, J. Schizophrenia: a concise overview
of incidence, prevalence, and mortality. Epidemiol. Rev. 30, 67–76 (2008).2. Ross, C. A., Margolis, R. L., Reading, S. A., Pletnikov, M. & Coyle, J. T. Neuro-
biology of schizophrenia. Neuron 52, 139–153 (2006).3. Lewis, D. A. & Lieberman, J. A. Catching up on schizophrenia: natural history
and neurobiology. Neuron 28, 325–334 (2000).4. Shepherd, A. M., Laurens, K. R., Matheson, S. L., Carr, V. J. & Green, M. J.
Systematic meta-review and quality assessment of the structural brainalterations in schizophrenia. Neurosci. Biobehav. Rev. 36, 1342–1356 (2012).
5. Okada, N. et al. Abnormal asymmetries in subcortical brain volume in schi-zophrenia. Mol. Psychiatry 21, 1460–1466 (2016).
6. Gupta, C. N. et al. Patterns of Gray Matter Abnormalities in SchizophreniaBased on an International Mega-analysis. Schizophr. Bull. 41, 1133–1142(2015).
7. van Erp, T. G. et al. Subcortical brain volume abnormalities in 2028 individualswith schizophrenia and 2540 healthy controls via the ENIGMA consortium.Mol. Psychiatry 21, 585 (2016).
8. Honea, R., Crow, T. J., Passingham, D. & Mackay, C. E. Regional deficits in brainvolume in schizophrenia: a meta-analysis of voxel-based morphometry stu-dies. Am. J. Psychiatry 162, 2233–2245 (2005).
9. Haijma, S. V. et al. Brain volumes in schizophrenia: a meta-analysis in over 18000 subjects. Schizophr. Bull. 39, 1129–1138 (2013).
10. Glahn, D. C. et al. Meta-analysis of gray matter anomalies in schizophrenia:application of anatomic likelihood estimation and network analysis. Biol. Psy-chiatry 64, 774–781 (2008).
11. Ellison-Wright, I., Glahn, D. C., Laird, A. R., Thelen, S. M. & Bullmore, E. Theanatomy of first-episode and chronic schizophrenia: an anatomical likelihoodestimation meta-analysis. Am. J. Psychiatry 165, 1015–1023 (2008).
12. Cooper, D., Barker, V., Radua, J., Fusar-Poli, P. & Lawrie, S. M. Multimodal voxel-based meta-analysis of structural and functional magnetic resonance imagingstudies in those at elevated genetic risk of developing schizophrenia. Psy-chiatry Res. 221, 69–77 (2014).
13. Bora, E. et al. Neuroanatomical abnormalities in schizophrenia: a multimodalvoxelwise meta-analysis and meta-regression analysis. Schizophr. Res. 127,46–57 (2011).
14. Moberget, T, et al. Cerebellar volume and cerebellocerebral structural covar-iance in schizophrenia: a multisitemega-analysis of 983 patients and 1349healthy controls. Mol Psychiatry. 23, 1512–1520 (2018).
15. Wolfers, T., Buitelaar, J. K., Beckmann, C. F., Franke, B. & Marquand, A. F. Fromestimating activation locality to predicting disorder: A review of patternrecognition for neuroimaging-based psychiatric diagnostics. Neurosci. Biobe-hav. Rev. 57, 328–349 (2015).
16. Doan, N. T. et al. Distinct multivariate brain morphological patterns and theiradded predictive value with cognitive and polygenic risk scores in mentaldisorders. Neuroimage Clin. 15, 719–731 (2017).
17. Skatun, K. C. et al. Consistent Functional Connectivity Alterations in Schizo-phrenia Spectrum Disorder: A Multisite Study. Schizophr. Bull. 43, 914–924(2017).
18. Plis, S. M. et al. Deep learning for neuroimaging: a validation study. Front.Neurosci. 8, 229 (2014).
19. Sabuncu, M. R., Konukoglu, E. & Alzheimer’s Disease Neuroimaging, I. Clinicalprediction from structural brain MRI scans: a large-scale empirical study.Neuroinformatics 13, 31–46 (2015).
20. Rozycki, M. et al. Multisite machine learning analysis provides a robust struc-tural imaging signature of schizophrenia detectable across diverse patientpopulations and within individuals. Schizophr. Bull. 44, 1035–1044 (2018).
21. Chekroud, A. M. Bigger Data, Harder Questions-Opportunities ThroughoutMental Health Care. JAMA Psychiatry 74, 1183–1184 (2017).
22. Koutsouleris, N. et al. Individualized differential diagnosis of schizophrenia andmood disorders using neuroanatomical biomarkers. Brain 138, 2059–2073(2015).
23. Schnack, H. G. et al. Can structural MRI aid in clinical classification? A machinelearning study in two independent samples of patients with schizophrenia,bipolar disorder and healthy subjects. Neuroimage 84, 299–306 (2014).
24. Salvador, R. et al. Evaluation of machine learning algorithms and structuralfeatures for optimal MRI-based diagnostic prediction in psychosis. PLoS One12, e0175683 (2017).
25. Owens, D. G. & Johnstone, E. C. Precursors and prodromata of schizophrenia:findings from the Edinburgh High Risk Study and their literature context.Psychol. Med. 36, 1501–1514 (2006).
26. West, S. A. et al. The comorbidity of attention-deficit hyperactivity disorder inadolescent mania: potential diagnostic and treatment implications. Psycho-pharmacol. Bull. 31, 347–351 (1995).
27. Wingo, A. P. & Ghaemi, S. N. A systematic review of rates and diagnosticvalidity of comorbid adult attention-deficit/hyperactivity disorder and bipolardisorder. J. Clin. Psychiatry 68, 1776–1784 (2007).
28. Klassen, L. J., Katzman, M. A. & Chokka, P. Adult ADHD and its comorbidities,with a focus on bipolar disorder. J. Affect Disord. 124, 1–8 (2010).
29. Chang, K. D. Course and impact of bipolar disorder in young patients. J. Clin.Psychiatry 71, e05 (2010).
30. Consortium C-DGotPG.. Genetic relationship between five psychiatric dis-orders estimated from genome-wide SNPs. Nat. Genet. 45, 984–994 (2013).
31. Forstner, A. J. et al. Identification of shared risk loci and pathways for bipolardisorder and schizophrenia. PLoS ONE 12, e0171595 (2017).
32. Owen, M. J. Intellectual disability and major psychiatric disorders: a continuumof neurodevelopmental causality. Br. J. Psychiatry 200, 268–269 (2012).
33. Frangou, S., Schwarz, E. & Meyer-Lindenberg, A. Imagemend. Identifyingmultimodal signatures associated with symptom clusters: the example of theIMAGEMEND project. World Psychiatry 15, 179–180 (2016).
34. Dale, A. M., Fischl, B. & Sereno, M. I. Cortical surface-based analysis. I. Seg-mentation and surface reconstruction. Neuroimage 9, 179–194 (1999).
35. Ashburner, J. & Friston, K. J. Voxel-based morphometry--the methods. Neuro-image 11, 805–821 (2000).
36. Fernandez-Delgado, M., Cernadas, E., Barro, S. & Amorim,D. Do we needhundreds of classifiers to solve real world classification problems? J. Mach.Learn. Res. 15, 3133–3181 (2014).
37. Fischl, B. Automatically Parcellating the Human Cerebral Cortex. Cereb. Cortex14, 11–22 (2004).
38. Desikan, R. S. et al. An automated labeling system for subdividing the humancerebral cortex on MRI scans into gyral based regions of interest. Neuroimage31, 968–980 (2006).
39. Fischl, B. et al. Whole Brain Segmentation. Neuron 33, 341–355 (2002).40. Ashburner, J. A fast diffeomorphic image registration algorithm. Neuroimage
38, 95–113 (2007).41. Tzourio-Mazoyer, N. et al. Automated anatomical labeling of activations in
SPM using a macroscopic anatomical parcellation of the MNI MRI single-subject brain. Neuroimage 15, 273–289 (2002).
42. Ho, D. E., Imai, K., King, G. Stuart, E. A.. MatchIt: nonparametric preprocessing forparametric causal inference. J. Statist. Softw. 42, 1–28 (2011).
43. Yoav Benjamini, Y. H. Controlling the False Discovery Rate: a Practical andPowerful. Approach to Multiple Testing. J. R. Stat. Soc. Ser. B (Methodol.) 57,289–300 (1995).s
44. Robin, X. et al. pROC: an open-source package for R and S+to analyze andcompare ROC curves. BMC Bioinforma. 12, 77 (2011).
45. Breiman, L. Random Forests. Mach. Learn. 45, 5–32 (2001).
Schwarz et al. Translational Psychiatry (2019) 9:12 Page 12 of 13
46. Wiener, A. La. M. Classification and Regression by randomForest. R. News 2,18–22 (2002).
47. Diaz-Uriarte R dAS. Variable selection from random forests: application to geneexpression data. Arxiv preprint q-bio/0503025 2005.
48. Menze, B. H. et al. A comparison of random forest and its Gini importance withstandard chemometric methods for the feature selection and classification ofspectral data. BMC Bioinforma. 10, 213 (2009).
49. Diaz-Uriarte, R. GeneSrF and varSelRF: a web-based tool and R package forgene selection and classification using random forest. BMC Bioinforma. 8, 328(2007).
50. Corinna Cortes, V. V. Support-vector networks. Mach. Learn. 20, 273–297(1995).
51. David Meyer E. D., KurtHornik, Andreas Weingessel and Friedrich Leisch. e1071:Misc Functions of the Department of Statistics, Probability Theory Group(Formerly: E1071), TU Wien. R package version 1.6-8. https://CRAN.R-project.org/package=e1071. 2017.
52. International Schizophrenia, C. et al. Common polygenic variation contributesto risk of schizophrenia and bipolar disorder. Nature 460, 748–752 (2009).
53. Whitford, T. J. et al. Grey matter deficits and symptom profile in first episodeschizophrenia. Psychiatry Res. 139, 229–238 (2005).
54. Whitford, T. J. et al. Progressive grey matter atrophy over the first 2-3 years ofillness in first-episode schizophrenia: a tensor-based morphometry study.Neuroimage 32, 511–519 (2006).
55. Lieberman, J. A. et al. Antipsychotic drug effects on brain morphology in first-episode psychosis. Arch. Gen. Psychiatry 62, 361–370 (2005).
56. Lo, M. T. et al. Genome-wide analyses for personality traits identify six genomicloci and show correlations with psychiatric disorders. Nat. Genet. 49, 152–156(2017).
57. V Anttila B. B.-S., et al. Analysis of shared heritability in common disorders ofthe brain. bioRxivorg 101101/048991 2016.
58. Vernon, A. C. et al. Contrasting effects of haloperidol and lithium on rodentbrain structure: a magnetic resonance imaging study with postmortemconfirmation. Biol. Psychiatry 71, 855–863 (2012).
59. Vernon, A. C., Natesan, S., Modo, M. & Kapur, S. Effect of chronic antipsychotictreatment on brain structure: a serial magnetic resonance imaging study withex vivo and postmortem confirmation. Biol. Psychiatry 69, 936–944 (2011).
Schwarz et al. Translational Psychiatry (2019) 9:12 Page 13 of 13


![Autoreferat - IPI PAN · 3810–3817, 2012 [P4] W. Froelich, J.L. Salmeron, Evolutionary Learning of Fuzzy Grey Cognitive Maps for the Forecasting of Multivariate, Interval-Valued](https://img.pdfslide.net/doc/110x75/5f05de957e708231d4151f5a/autoreferat-ipi-pan-3810a3817-2012-p4-w-froelich-jl-salmeron-evolutionary.jpg)