Embed Size (px)
Citation preview

Reproducing kernel potential energy surfaces in biomolecular simulations: Nitricoxide binding to myoglobinMaksym Soloviov and Markus Meuwly Citation: The Journal of Chemical Physics 143, 105103 (2015); doi: 10.1063/1.4929527 View online: http://dx.doi.org/10.1063/1.4929527 View Table of Contents: http://scitation.aip.org/content/aip/journal/jcp/143/10?ver=pdfcov Published by the AIP Publishing Articles you may be interested in Revisiting the finite temperature string method for the calculation of reaction tubes and free energies J. Chem. Phys. 130, 194103 (2009); 10.1063/1.3130083 Harmonic Fourier beads method for studying rare events on rugged energy surfaces J. Chem. Phys. 125, 174108 (2006); 10.1063/1.2363379 A line integral reaction path approximation for large systems via nonlinear constrained optimization:Application to alanine dipeptide and the β hairpin of protein G J. Chem. Phys. 124, 194903 (2006); 10.1063/1.2194544 Dynamic coupling between coordinates in a model for biomolecular isomerization J. Chem. Phys. 124, 144911 (2006); 10.1063/1.2183768 Inclusion of quantum-mechanical vibrational energy in reactive potentials of mean force J. Chem. Phys. 114, 9953 (2001); 10.1063/1.1371497
Reuse of AIP Publishing content is subject to the terms: https://publishing.aip.org/authors/rights-and-permissions. Downloaded to IP: 192.33.100.145 On: Wed, 30
Mar 2016 14:54:52
THE JOURNAL OF CHEMICAL PHYSICS 143, 105103 (2015)
Reproducing kernel potential energy surfaces in biomolecular simulations:Nitric oxide binding to myoglobin
Maksym Soloviov and Markus Meuwlya)
Department of Chemistry, University of Basel, Klingelbergstrasse 80, 4056 Basel, Switzerland
(Received 7 April 2015; accepted 9 July 2015; published online 10 September 2015)
Multidimensional potential energy surfaces based on reproducing kernel-interpolation are employedto explore the energetics and dynamics of free and bound nitric oxide in myoglobin (Mb). Combininga force field description for the majority of degrees of freedom and the higher-accuracy representationfor the NO ligand and the Fe out-of-plane motion allows for a simulation approach akin to amixed quantum mechanics/molecular mechanics treatment. However, the kernel-representation canbe evaluated at conventional force-field speed. With the explicit inclusion of the Fe-out-of-plane(Fe-oop) coordinate, the dynamics and structural equilibrium after photodissociation of the ligandare correctly described compared to experiment. Experimentally, the Fe-oop coordinate plays animportant role for the ligand dynamics. This is also found here where the isomerization dynamicsbetween the Fe–ON and Fe–NO state is significantly affected whether or not this co-ordinateis explicitly included. Although the Fe–ON conformation is metastable when considering onlythe bound 2A state, it may disappear once the 4A state is included. This explains the absenceof the Fe–ON state in previous experimental investigations of MbNO. C 2015 AIP PublishingLLC. [http://dx.doi.org/10.1063/1.4929527]
I. INTRODUCTION
Following the dynamics of small ligands in (globular)proteins provides information about the internal structure ofthe macromolecule and about the way how ligand and pro-tein motions are coupled. By combining experimentation andsimulation, a detailed picture about these processes can beobtained. One of the paradigmatic systems in this context ismyoglobin (Mb) and its ligands O2, CO, or nitric oxide (NO),see Figure 1. NO is a key messenger for many biological pro-cesses in vertebrates. It can bind to Mb, and together with O2can be catalyzed by Mb to form nitrate.1 The rebinding kineticsof NO to Mb has been studied intensively over the past threedecades using experimental and computational methods.2–14
Compared to rebinding of CO, no substantial rebinding barrierhas been found for geminate recombination of NO to the hemeFe3 and ab initio calculations have even suggested that therecombination reaction may be barrierless for NO in specificconformations.15 Because of the short time scale involved(picoseconds), this process is ideally suited to be investigatedcomputationally at an atomistic level.10–14
Over the past few years, computational investigations ofligand migration in globular proteins have provided consider-able insights into their structure, energetics, and dynamics.16–19
All these efforts require adequate representations of the inter-molecular interactions. Methods for this range from purelyempirical force fields to mixed quantum mechanical/molecularmechanics (QM/MM) treatments. They all have their meritsand disadvantages in terms of computational efficiency andrealism in capturing the essentials of the interactions. While
a)Author to whom correspondence should be addressed. Electronic mail:[email protected]
empirical force fields are fast in terms of evaluating the ener-gies and forces of a given configuration, they need to be fittedto a parametrized form, their accuracy is limited and theydo not allow to describe bond-breaking and bond-formingprocesses. On the other hand, mixed QM/MM simulationscan be more accurate depending on the level of theory usedin the quantum part, but their application is usually limitedto single (or few) trajectory of short duration.20,21 In partic-ular for systems containing metal atoms—as is the case inMb where the active site is the Fe-heme unit—even densityfunctional theory (DFT)-based approaches become compu-tationally challenging. Furthermore, technical difficulties canarise, e.g., converging the Hartree Fock wavefunction or main-taining the correct electronic state, if sufficiently distortedconformations are sampled in the molecular dynamics (MD)simulations.
An alternative to QM/MM is to explicitly parametrizethe total energy (instead of representing the total energy assum over individual force field terms) for a subsystem basedon rigorous quantum chemistry and combine this with anempirical force field. Again, the parametrization step is crit-ical and often time-consuming. Such an approach has, forexample, been used in combining accurate representations forthe proton transfer energetics between a donor atom and anacceptor atom together with empirical force field parametersfor the environment.22 The approach—molecular mechanicswith proton transfer (MMPT)—has been successful to real-istically follow the proton transfer dynamics in protonatedwater dimer, diglyme, malonaldehyde, or even in a metal-catalyst used for hydroformylation.23–25 However, because thequantum-based energies cannot always be represented by stan-dard harmonic terms in order to take full advantage of theirhigher accuracy, tedious non-linear fits are often involved in
0021-9606/2015/143(10)/105103/9/$30.00 143, 105103-1 © 2015 AIP Publishing LLC
Reuse of AIP Publishing content is subject to the terms: https://publishing.aip.org/authors/rights-and-permissions. Downloaded to IP: 192.33.100.145 On: Wed, 30
Mar 2016 14:54:52
105103-2 M. Soloviov and M. Meuwly J. Chem. Phys. 143, 105103 (2015)
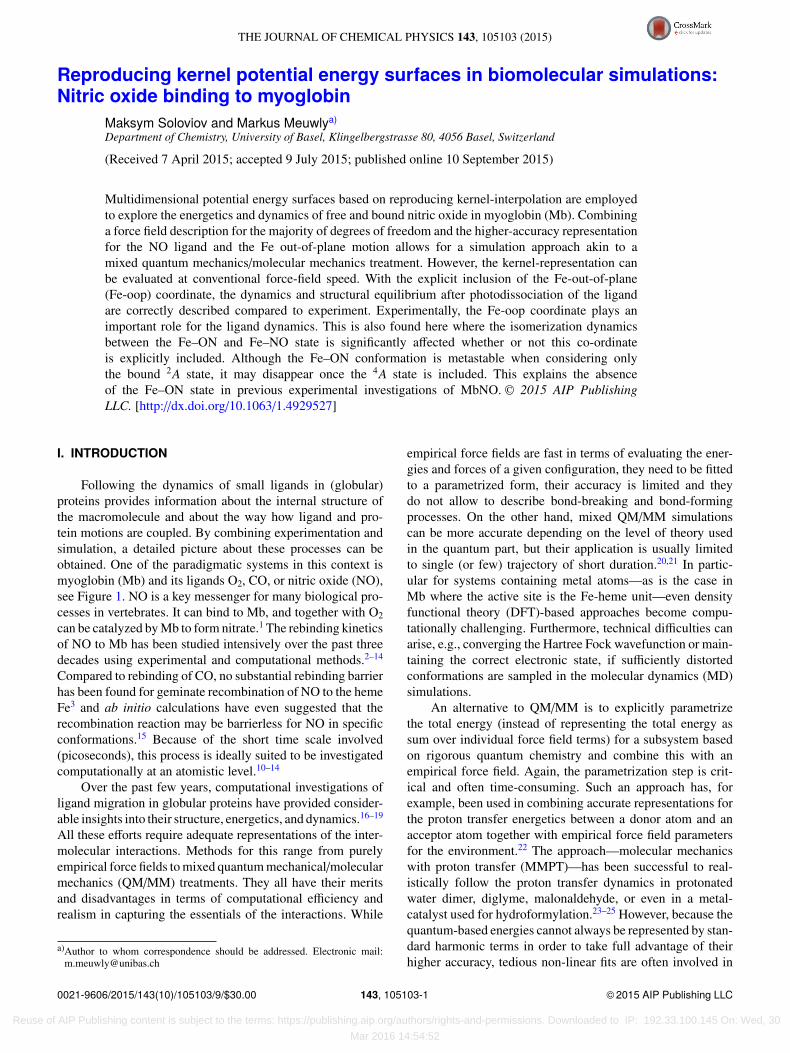
FIG. 1. NO-bound myoglobin with the heme, His93, and NO ligand inlicorice and the protein in secondary structure representation.
the parametrization. In the present work, reproducing kernelinterpolation will be used instead of carrying out a (non-)linearleast squares fit.
Recent experiments have followed the interplay betweenthe Fe-out-of-plane (Fe-oop) and the NO-ligand motion ina time resolved fashion.7 This work points towards a directcoupling between these degrees of freedom on the 10 to100 ps time scale. Running a statistically significant number ofQM/MM trajectories from which to analyze and atomisticallyresolve the interplay of the motions involved is beyond cur-rent computational methods. In order to retain the accuracyneeded, the total interaction in the protein-ligand system isdecomposed in a similar fashion and the subsystem—ligandand Fe-oop coordinate—is treated at the DFT level. Subse-quently, a suitable representation that preserves the accuracyof the interpolated potential energy surface (PES) is chosenand used in the simulations. An alternative to parametrizedrepresentations of PESs is parameter-free, reproducing kernelHilbert space (RKHS)-based representations of reference datafrom quantum chemical calculations.26,27 They are based onsmoothness criteria of the interpolant and have been success-fully applied to study van der Waals complexes28,29 and reac-tions.30,31 One of the hallmarks of an RKHS-interpolated PESis that it reproduces the reference energies exactly (i.e., byconstruction) which is not the case for parametrized forcefields.
In the present work, RKHS-based representations for asubsystem for which accurate energetics is required are com-bined with a force field description of the protein environment.The subsystem contains the ligand (nitric oxide) degrees offreedom and the heme Fe-oop motion which has been shownto be decisive for the two limiting states (bound and unbound)and the dynamics between them. The interpolated PESs arethen used to explore the ligand dynamics in the 2A and 4Astates. The approach used in the present work also allowsto following the isomerization dynamics of the ligand whichinvolves bond-breaking and bond-formation between the heme
Fe and the ligand. First, the computational models are pre-sented. Next, the RKHS-PES is discussed and its performancein atomistic simulations is assessed. Finally, the dynamicson the two electronic states of interest is characterized andcompared with experiment and previous work.
II. METHODS
A. Intermolecular interactions
The total potential energy of the system Vtot(X⃗), where X⃗is the position vector for all N atoms, is written as
Vtot(X⃗) = VFF(Q⃗) + V (R, θ, φ). (1)
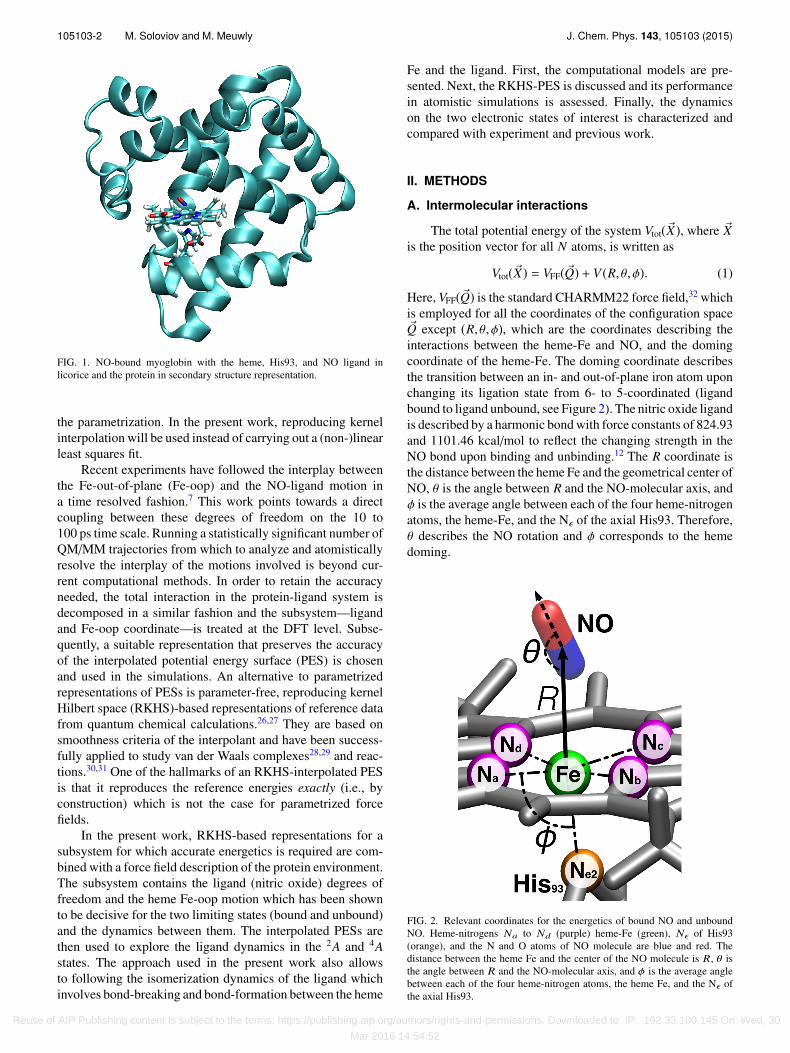
Here, VFF(Q⃗) is the standard CHARMM22 force field,32 whichis employed for all the coordinates of the configuration spaceQ⃗ except (R, θ, φ), which are the coordinates describing theinteractions between the heme-Fe and NO, and the domingcoordinate of the heme-Fe. The doming coordinate describesthe transition between an in- and out-of-plane iron atom uponchanging its ligation state from 6- to 5-coordinated (ligandbound to ligand unbound, see Figure 2). The nitric oxide ligandis described by a harmonic bond with force constants of 824.93and 1101.46 kcal/mol to reflect the changing strength in theNO bond upon binding and unbinding.12 The R coordinate isthe distance between the heme Fe and the geometrical center ofNO, θ is the angle between R and the NO-molecular axis, andφ is the average angle between each of the four heme-nitrogenatoms, the heme-Fe, and the Nϵ of the axial His93. Therefore,θ describes the NO rotation and φ corresponds to the hemedoming.
FIG. 2. Relevant coordinates for the energetics of bound NO and unboundNO. Heme-nitrogens Na to Nd (purple) heme-Fe (green), Nϵ of His93(orange), and the N and O atoms of NO molecule are blue and red. Thedistance between the heme Fe and the center of the NO molecule is R, θ isthe angle between R and the NO-molecular axis, and φ is the average anglebetween each of the four heme-nitrogen atoms, the heme Fe, and the Nϵ ofthe axial His93.
Reuse of AIP Publishing content is subject to the terms: https://publishing.aip.org/authors/rights-and-permissions. Downloaded to IP: 192.33.100.145 On: Wed, 30
Mar 2016 14:54:52
105103-3 M. Soloviov and M. Meuwly J. Chem. Phys. 143, 105103 (2015)
The reference energies for the 3-dimensional PESV (R, θ, φ) were obtained from DFT calculations based on theB3LYP33–36 functional together with the 6-31G(d,p) basisset.37,38 Gaussian0939 was used to perform all DFT calcula-tions. The model system contains a truncated heme group, theNO ligand and a methyl-imidazole as a core of the axial histi-dine (His93), see Figure 2. The reference points were calcu-lated on a 3-dimensional grid: The R-co-ordinate was scannedbetween 1.7 and 3.9 Å with step size∆R = 0.1 Å. The distanced between the heme-Fe and the heme-plane included positionsd = 0.2 and 0.1 Å (for the 4A state only) above the plane, thein-plane d = 0.0 Å position, and d = −0.1, −0.3, and −0.5 Åbelow the plane. For θ, an 11-point Gauss-Legendre grid inclu-ding angles of θ[◦] = 11.815,27.452,43.089,58.726,74.363,90.000,105.637,121.274,136.911,152.548, and 168.185 wasemployed. The out-of-plane distance used in the DFT grid wastranslated into an average angle φ between the heme-nitrogen,heme-Fe, and the Nϵ of the axial histidine ligand via standardtrigonometry.
The calculations were carried out for the 2A and 4Astates using a 3-dimensional grid resulting in 1210 and 1452reference points for the two states, respectively. In addition,100 validation points for both 2A and 4A states were computedat off-grid points for different values of r and θ = 30◦,60◦,120◦
and φ = 87◦,90◦,92◦,95◦. The root mean square error forthe validation set as determined from the fitted PES was1.0 kcal/mol and 1.1 kcal/mol for the 2A and 4A PESs, respec-tively. This is close to chemical accuracy except for errors inthe quantum chemical methods used.
Initially, a parametrized fit of the PES was attempted.However, it was found that in particular representing theFe-oop coordinate in parametrized form was difficult. Hence,a different approach was considered. Kernel-based represen-tations are a powerful means to exactly reproduce the targetdata while maintaining desirable smoothness and asymptoticbehavior of the inter- and extrapolant. The explicit form of theRKHS PES is as follows:
V (R, θ, φ) =10λ=0
Vλ(R, φ)Pλ(cos(θ)) + Vc(φ), (2)
where Pλ are Legendre polynomials and Vc is a harmonicpotential. By construction, the kernel-based part of the poten-tial
10λ=0 Vλ(R, φ)Pλ(cos(θ)) decays asymptotically (R → ∞) to
zero. The harmonic potential Vc,
Vc(φ) = 12
k(φ − φe)2, (3)
captures the asymptotic energies of the different V (R, θ) poten-tial energy surfaces depending on the Fe-oop position wherek is the force constant, and φe is the equilibrium position.Both k and φe are parametrized during the optimization ofthe potential V (R, θ, φ). The final parameters in the 2A stateare k = 0.165 kcal/mol and φe = 95.6◦ and in the 4A state,k = 0.116 kcal/mol and φe = 93.8◦.
The radial strength functions Vλ(R, φ) are represented as areproducing kernel,26
Vλ(R, φ) =i, j
βλ, i, j · K (R,Ri) · G(φ,φ j), (4)
whereK (R,Ri) is a radial reproducing kernel27,28 and G(φ,φ j)is a Gaussian reproducing kernel.40 The explicit form of theradial reproducing kernels used here is
K (Ri,Rj) = 114
R−7>
(1 − 7
9R<
R>
), (5)
where R> and R< are the greater distance and smaller distance,respectively, for any pair of R− values. The Gaussian kernelsare parametrized as follows:
G(φi, φ j) = exp(− (φi − φ j)22σ2 ), (6)
where σ is the width of the kernel and its value of σ = 5◦
was chosen such that the kernels overlap and the optimizationresult in smallest error on the reference data set. Therefore, ker-nels are symmetric positive definitive and describe the correctasymptotic behavior at large R as K decays to zero.
The βλ, i, j are determined from a singular value decom-position41–43 for each value of λ and hence are not adjustablefitting parameters as would be the case in a typical non-linearleast squares fit.29 In order to prevent overfitting, Tikhonovregularization (parameter α = 10−7) is used44,45 to penalizesolutions of large norm and to stabilize the procedure. Thecoefficients βλ are found from solving the least-square mini-mization problem,
β̂λ = arg minβλ
{∥K βλ − Eλ∥2 + α∥ βλ∥2}= (KTK + αI)−1KTEλ. (7)
Here, K is the kernel matrix and Eλ are the DFT energies. Thekernel matrix K is constructed based on the product kernel ki, j,
ki, j = K (Ri,Rj)G(φi, φ j), (8)
where K (Ri,Rj) and G(φi, φ j) are the radial and Gaussiankernels, respectively, which are calculated for every single pairof values (Ri, φi) and (Rj, φ j) of the grid.
In addition, for molecular dynamics simulations, forcesare required. The necessary derivatives of the RKHS PES canbe obtained analytically which yields good energy conserva-tion in NVE simulations.
B. Molecular dynamics simulations
The kernel-based interpolation was implemented into theCHARMM program46 which was used for all MD simulationstogether with the CHARMM22 force field.47 The protein wasset up as described previously.12,48 Mb contains 153 amino acidresidues, a heme group, and a nitrogen oxide molecule. Simu-lations were carried out for both, Hisδ64 and Hisϵ64 proton-ation, with the latter being the more likely state.49–53 Contraryto the previous work which employed stochastic boundaries,in the present work, the protein was solvated in a periodic,pre equilibrated waterbox 62.0864 × 62.0864 × 62.0864 Å3.The final system contains 23 711 atoms. All bonds involvinghydrogens were treated using SHAKE54,55 with a tolerance of10−6. For the non-bonded interactions a cutoff of 14 Å wasused. First, the system was minimized using steepest-descentand adopted basis Newton-Raphson algorithms. Then, it washeated from 100 to 300 K during 60 ps and equilibrated for
Reuse of AIP Publishing content is subject to the terms: https://publishing.aip.org/authors/rights-and-permissions. Downloaded to IP: 192.33.100.145 On: Wed, 30
Mar 2016 14:54:52

105103-4 M. Soloviov and M. Meuwly J. Chem. Phys. 143, 105103 (2015)
500 ps. This was followed by production runs in the NVTensemble as described further below. The time step in allsimulations was ∆t = 1 fs and the velocity Verlet integratorwas used to propagate the equations of motion.
III. RESULTS AND DISCUSSION
A. The fitted PES
The results show that the fitted 2A PES has two well-defined minima, which correspond to the Fe–NO and Fe–ONstates. These two states have already been found in earlierwork48,56 but are absent in other investigations.57 Previouswork found an energy difference of 15.3 kcal/mol betweenthe two states whereas the present B3LYP/6-31G** calcu-lations yield 18.1 kcal/mol. In order to confirm their exis-tence, additional electronic structure calculations were carriedout. For this, the Fe–NO and Fe–ON structures were sepa-rately optimized at the UB3PW91/6-31G** level of theory.The converged energies differ by 18.5 kcal/mol and establishthat both conformational isomers also exist with this func-tional. Experimentally, the existence of an Fe–ON state hasbeen found for model systems,56,58,59 but not for NO in Mb.60
The NO-binding energy on the 2A PES is 23.7 kcal/mol,see Figures 3 and 4. Figure 3 illustrates that the RKHS-PESexactly matches the reference DFT-points. Also, it can beseen that the binding energy of the ligand depends on theFe-oop position and that upon NO-dissociation from an in-plane position, the asymptotic energy is higher than for disso-ciation from an out-of-plane position. At infinite separation ofthe NO from the heme-Fe (see Figure 2), the Fe atom moves0.2 Å below the porphyrin plane (d = −0.2 Å) and correctlypredicts the doming effect. The experimentally observed out-of-plane distance in the high-resolution X-ray structure ofMb61 is −0.25 Å and the one found in the previous workis −0.35 Å.12 The out-of-plane positioning of the heme-Fein the model system and in the protein differs because theprotein environment exerts forces which affect the equilibrium
FIG. 3. Radial cuts through the PES for θ = 152.06◦ and different out-of-plane displacements (shown in the legend). Symbols represent the refer-ence DFT points; solid and dashed lines are the RKHS PES. When theNO molecule dissociates from an in-plane position (crosses) the asymptoticenergy is higher than for dissociation from an out-of-plane position (circles).The binding energies of the ligand also depend on the Fe-oop position.
FIG. 4. PESs for the two states considered here. Black isocontours arethe RKHS-PES and red circles are the DFT reference points for the Fe-in-plane conformation (φ = 90◦). (a) The Fe–NO bound state, 2A, with theglobal minimum in a bent Fe–NO conformation, the secondary minimum(Fe–ON) 20.2 kcal/mol, and the transition state separating the two states at23.7 kcal/mol above the global minimum. (b) The unbound, 4A, state. Theenergies of this state are close to those of the 2A state around the Fe–ONconformation which may wash out this secondary minimum.
structure. This can be taken into account by the harmonicangular potential (Nheme–Fe–NHis) of the force field. The 4Astate does not have a clear minimum energy structure, seeFigure 4, and mostly represents a van der Waals complex withan equilibrium Fe–CoMNO distance of 3.5 Å.
B. Validation simulations
In order to validate the implementation of the total poten-tial energy function—and the RKHS-interpolation in partic-ular—and the corresponding derivatives, several NVE simula-tions 500 ps in length were carried out. The average fluctuationof p(E − ⟨E⟩) is 1 kcal/mol for simulations with the kernel-based PESs for the 2A and 4A states. As a comparison, simula-tions for the 2A state were run using the force field parametersfrom previous work12 and showed identical results. Also, nodrift in the total energy is found. This validates the presentimplementation of the kernel-based PES.
It is also of interest to compare the results from simu-lations with and without the RKHS potential. A meaning-ful target is the dynamics of the Fe-oop motion which isfunctionally relevant and has also been investigated spectro-scopically.72 After breaking the Fe–NO bond, the Fe immedi-ately starts to move below the heme-plane on a ∼100 fs time
Reuse of AIP Publishing content is subject to the terms: https://publishing.aip.org/authors/rights-and-permissions. Downloaded to IP: 192.33.100.145 On: Wed, 30
Mar 2016 14:54:52
105103-5 M. Soloviov and M. Meuwly J. Chem. Phys. 143, 105103 (2015)
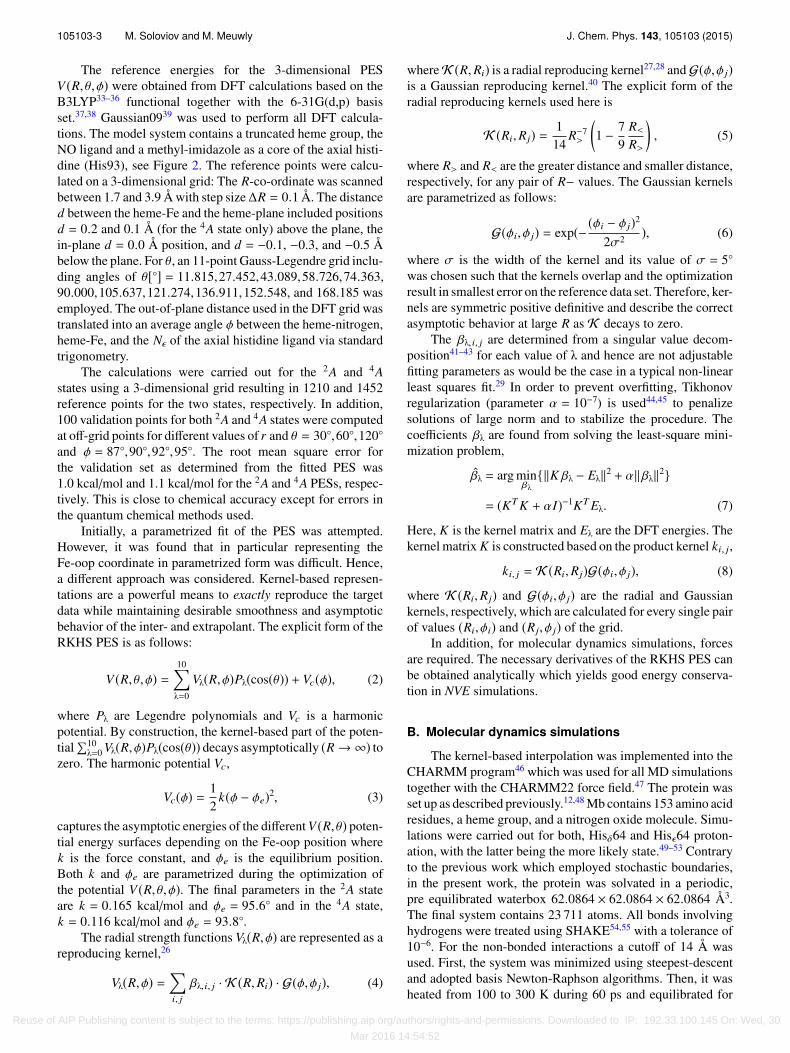
FIG. 5. Averaged time dependence over a 2 ps sliding window of the Fe-oopmotion after photodissociation of the ligand and subsequent dynamics onthe “FF plus RKHS” 4A PES. The ultrafast, sub-picosecond component isaveraged out and not visible and the raw data (black trace) are shown to-gether with the overall fit (red trace). The experimentally determined spectralshifts (orange) and the relaxation dynamics from the “FF only” simulations(blue) were scaled to superimpose on the results from the “FF plus RKHS”relaxation dynamics.
scale. This is consistent with optical experiments and previousMD simulations.72,73 Simulations were run with the “FF plusRKHS” potential as in Eq. (1) and with the conventional “FFonly.” The same number of runs, carried out under identicalconditions, was analyzed in both cases. Using the FF plusRKHS-PES, the simulations yield an overall relaxation dy-namics of the Fe-oop position onto which a characteristic beat-ing pattern (see black trace in Figure 5) is superimposed whichsuggests complex structural changes in the protein. The decaycan be fit to a double exponential ae−t/τ1 + be−t/τ2 + c andyields τ1 = 3.5 ps and τ2 = 64.4 ps, as shown in Figure 5. Withthe conventional FF only, the dynamics is single exponential(blue trace in Figure 5, with suitably scaled amplitude fordirect comparison) with a time constant of τ1 = 13.7 ps. Opti-cal experiments also find two time constants: 3.5 ps and 83.0 psfor the two processes on the picosecond time scale, respec-tively (orange trace).72 The numerical values are summarizedin Table I and suggest that the FF plus RKHS potential energysurface faithfully captures the existence and magnitude of twotime constants whereas the conventional FF does not. On theother hand, the relative amplitudes a1 : a2 of the fast and slow
TABLE I. Parameters of the double exponential fits to the data. The unitsfor the amplitudes a1 and a2 are Å for the simulations and cm−1 for theexperiments.72 Parameter b reports on the equilibrium Fe-oop position andthe experimental value is from Ref. 61.
τ1 (ps) τ2 (ps) a1 (Å or cm−1) a2 (Å or cm−1) b (Å)
FF only 13.7 0.025 −0.43FF + RKHS 3.5 64.4 0.012 0.010 −0.28Experiment61,72 3.5 83.0 85.0 19.0 −0.25
process differ between experiment (≈4 : 1 for fast vs. slow)and the FF plus RKHS simulations (≈1 : 1), as can also be seenin Figure 5. This is, however, not surprising, as the physicalprocess probed is not exactly the same. The experiment reportson the temporal decay of a change in the electronic structurearound the heme group which leads to ligand dissociation andstructural dynamics whereas the atomistic simulations onlyfollow the structural relaxation following bond breaking.
This structural dynamics has also been investigated fromearlier simulations with a somewhat different computationalsetup but the same force field for the heme-group. Most impor-tantly, a constant dielectric was used3,73 in the earlier simula-tions whereas in the present case, the water solvent was treatedexplicitly. These earlier simulations found two time scales withamplitudes of the fast and slow processes close to each other(1 : 1), as was also found for the FF plus RKHS simulationsdescribed above. Unfortunately, a typo in the sign of one ofthe decay times must have occurred which prevents explicitcomparison. The current work leads to an Fe-oop distanceof ≈−0.28 Å which compares well with the experimentallymeasured result (−0.25 Å)61 contrary to earlier simulations(−0.60 Å).73 Hence, the FF plus RKHS simulations find twotime scales for the structural relaxation of the Fe-oop mo-tion with about equal amplitude of the two processes andan equilibrium value (−0.28 Å) for the Fe-oop position inagreement with experiments (−0.25 Å). This is not the casefor the FF-only simulations (which find −0.43 Å) carried outunder identical conditions, see Figure 5 and comparison inTable I.
To further compare results from simulations using thecurrent RKHS-PES with existing data,48 the Fe–ON→ Fe–NOisomerization dynamics was studied on the 2-dimensional sur-face, i.e., for φ = 90◦. For this, 250 trajectories were initiatedfrom the Fe–ON local minimum energy structure. The kineticcurves (see Figure 6(a)) were determined from trajectorieswhich lead to isomerization within 250 ps. The ensuing isom-erization kinetics are the blue and magenta traces in Figure 6(a)for Hisδ64 and Hisϵ64 protonation, respectively. For the ki-netic curves, isomerization was considered to occur if the NOcoordinates fulfill the criterion (R = 2.55 Å and θ = 130◦). Thetypical isomerization time is on the 100 ps time scale. This isin qualitative agreement with previous crossing times whichranged from 50 ps to 600 ps48 using about 10 trajectories,from which, however, no rigorous distribution of the crossingtimes could be determined. The 100 ps found here qualitativelyagree with the earlier work and the shorter isomerization timesfound here are explained by the lower barrier in the presentPES. It is concluded that the two different PES parametriza-tions (Morse plus Legendre versus RKHS-plus-Legendre here)yield qualitatively similar isomerization times with the presentsimulations exhibiting more rapid dynamics due to the lowerisomerization barrier. Also, the difference between the twoprotonation states of His64 are small; the yield within 250 psdiffers by about 10%.
C. Equilibrium dynamics of the 2A and 4A states
The well depth of the bound Fe–NO minimum is23.7 kcal/mol. In the 2A state, the conformationally averaged
Reuse of AIP Publishing content is subject to the terms: https://publishing.aip.org/authors/rights-and-permissions. Downloaded to IP: 192.33.100.145 On: Wed, 30
Mar 2016 14:54:52

105103-6 M. Soloviov and M. Meuwly J. Chem. Phys. 143, 105103 (2015)
FIG. 6. (a) NO isomerization kinetics (fraction of product formed as afunction of time) on the 2A PES with (3D—red and green for Hisδ64 andHisϵ64 protonation, respectively) and without (2D—blue and magenta forHisδ64 and Hisϵ64 protonation, respectively) explicitly taking into accountthe Fe-oop coordinate. Fits to single and double exponentials (see text) arein solid lines. The short (dashed green) and long (dotted green) componentsdescribe the two processes found for Hisϵ64 protonation. (b) Projections ofseveral representative trajectories for the Fe–ON→ Fe–NO isomerization dy-namics on the 3-dimensional PES including the Fe-oop motion, superimposedon the 2A PES. The Fe–ON state has θ = 30◦ whereas the Fe–NO state ischaracterized by θ = 150◦.
Fe–N distance is 1.79 ± 0.04 Å and the average Fe–N–O angleis 147.5 ± 4.6◦. These values are in good agreement withthe experimentally determined structures with nitric oxidebound to the heme-Fe, including myoglobin,62–64 indoleamine
2,3-dioxygenase,65 cytochrome c oxidase,66 and others (seeTable II). The differences might be explained by the effectsof the crystal field and the specific structure and electrostaticenvironment of the distal pocket.
The motion of the NO molecule is significantly affected bythe structure of the active site, especially by the His64 residue.One important determinant in the photodissociation process isthe local structure surrounding the bound ligand at the momentof excitation. This is largely determined by the positioning ofthe His64 side chain. The significant lowering in the proba-bility of the dihedral angle φ1 = (Na–Fe–N–O) in Figure 7(a) iscaused by excluded volume not easily accessible to the boundligand due to the proximity of His64 and differs for the twoprotonation states Hisδ64 and Hisϵ64. For Hisδ64, one low-probability state exists (at ≈60◦) whereas for Hisϵ64, there aretwo, see Figure 7(a). The minima at φ1 ≈ 60◦ coincide whereasthat at φ1 ≈ −90◦ only occur for Hisϵ64. Further analysis of thetrajectories suggests that for Hisϵ64, the side chain can occupytwo distinct states (see Figure 7(b)) whereas there is only oneconformation for Hisδ64.
Although the Fe–ON state has not been characterizedexperimentally so far in MbNO, considering the ground state2A dynamics is still valuable for several reasons. First, it allowsto assess the coupling between the ligand motion and theFe-oop dynamics and second, direct comparison with previoussimulations at a considerably lower level of theory is possible(see Sec. III B). Finally, when rebinding from the 4A state, theNO-ligand crosses to the 2A state in a large range of geometriesand hence, exploration and characterization of the full 2A PESare meaningful and relevant.
Previously, the motion of bound NO has been investi-gated on a fitted, parametrized two-dimensional PES basedon B3LYP//VDZ/3-21G calculations.48 This PES was param-etrized for the in-plane position of Fe; therefore, φ = 90◦
throughout. As a first step, the performance of the present PES,which relies on a RKHS representation, is compared to simula-tions on the earlier Legendre expansions with Morse functionsfor the radial coordinate. As it was already mentioned, the2A state has two well defined minima (Fe–NO and Fe–ON).The isomerisation barrier for Fe–NO → Fe–ON is 23.7 (21.4previous work) kcal/mol, whereas the barrier for the reversereaction is around 3.5 kcal/mol (8.4 kcal/mol in previouswork).48 Part of these differences are due to the considerablylarger basis set used in the present work.
Compared to simulations on the 2D-PES, following thedynamics on the 3D-PES explicitly including the Fe-oop mo-tion shows that within the maximum simulation time of 250 ps,a considerably smaller number of trajectories completes theconformational transition between Fe–ON and Fe–NO, see
TABLE II. Characteristic bond lengths and angles for the active site of MbNO obtained from X-ray structures ofNO-bound myoglobins and related heme-containing proteins and the present simulations.
Reference Fe–N (Å) Fe–N–O (deg) Structure resolution (Å)
Mb (MD, current work) 1.79±0.04 147.46±4.60 . . .Horse heart Mb67 1.87 144 1.3Sperm whale myoglobin (1HJT)62 1.89 112 1.7Horse heart (MS XAFS)68 1.75 150 . . .
Reuse of AIP Publishing content is subject to the terms: https://publishing.aip.org/authors/rights-and-permissions. Downloaded to IP: 192.33.100.145 On: Wed, 30
Mar 2016 14:54:52
105103-7 M. Soloviov and M. Meuwly J. Chem. Phys. 143, 105103 (2015)
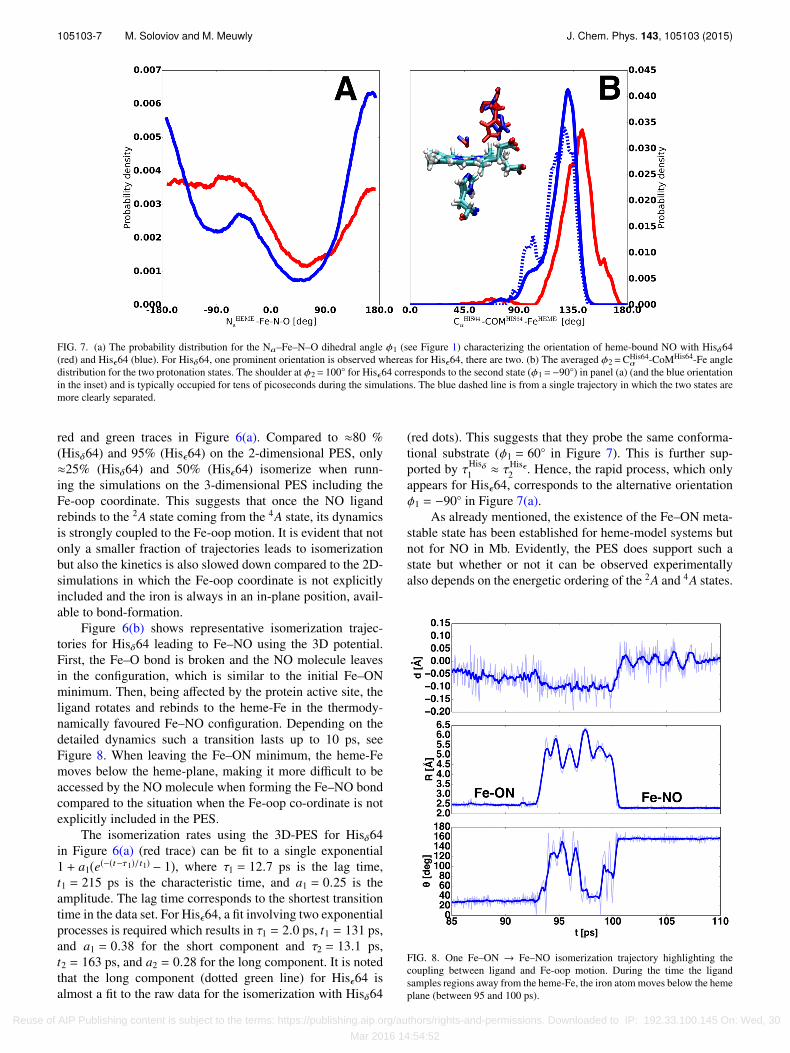
FIG. 7. (a) The probability distribution for the Na–Fe–N–O dihedral angle φ1 (see Figure 1) characterizing the orientation of heme-bound NO with Hisδ64(red) and Hisϵ64 (blue). For Hisδ64, one prominent orientation is observed whereas for Hisϵ64, there are two. (b) The averaged φ2=CHis64
α -CoMHis64-Fe angledistribution for the two protonation states. The shoulder at φ2= 100◦ for Hisϵ64 corresponds to the second state (φ1=−90◦) in panel (a) (and the blue orientationin the inset) and is typically occupied for tens of picoseconds during the simulations. The blue dashed line is from a single trajectory in which the two states aremore clearly separated.
red and green traces in Figure 6(a). Compared to ≈80 %(Hisδ64) and 95% (Hisϵ64) on the 2-dimensional PES, only≈25% (Hisδ64) and 50% (Hisϵ64) isomerize when runn-ing the simulations on the 3-dimensional PES including theFe-oop coordinate. This suggests that once the NO ligandrebinds to the 2A state coming from the 4A state, its dynamicsis strongly coupled to the Fe-oop motion. It is evident that notonly a smaller fraction of trajectories leads to isomerizationbut also the kinetics is also slowed down compared to the 2D-simulations in which the Fe-oop coordinate is not explicitlyincluded and the iron is always in an in-plane position, avail-able to bond-formation.
Figure 6(b) shows representative isomerization trajec-tories for Hisδ64 leading to Fe–NO using the 3D potential.First, the Fe–O bond is broken and the NO molecule leavesin the configuration, which is similar to the initial Fe–ONminimum. Then, being affected by the protein active site, theligand rotates and rebinds to the heme-Fe in the thermody-namically favoured Fe–NO configuration. Depending on thedetailed dynamics such a transition lasts up to 10 ps, seeFigure 8. When leaving the Fe–ON minimum, the heme-Femoves below the heme-plane, making it more difficult to beaccessed by the NO molecule when forming the Fe–NO bondcompared to the situation when the Fe-oop co-ordinate is notexplicitly included in the PES.
The isomerization rates using the 3D-PES for Hisδ64in Figure 6(a) (red trace) can be fit to a single exponential1 + a1(e(−(t−τ1)/t1) − 1), where τ1 = 12.7 ps is the lag time,t1 = 215 ps is the characteristic time, and a1 = 0.25 is theamplitude. The lag time corresponds to the shortest transitiontime in the data set. For Hisϵ64, a fit involving two exponentialprocesses is required which results in τ1 = 2.0 ps, t1 = 131 ps,and a1 = 0.38 for the short component and τ2 = 13.1 ps,t2 = 163 ps, and a2 = 0.28 for the long component. It is notedthat the long component (dotted green line) for Hisϵ64 isalmost a fit to the raw data for the isomerization with Hisδ64
(red dots). This suggests that they probe the same conforma-tional substrate (φ1 = 60◦ in Figure 7). This is further sup-ported by τ
Hisδ1 ≈ τHisϵ
2 . Hence, the rapid process, which onlyappears for Hisϵ64, corresponds to the alternative orientationφ1 = −90◦ in Figure 7(a).
As already mentioned, the existence of the Fe–ON meta-stable state has been established for heme-model systems butnot for NO in Mb. Evidently, the PES does support such astate but whether or not it can be observed experimentallyalso depends on the energetic ordering of the 2A and 4A states.
FIG. 8. One Fe–ON → Fe–NO isomerization trajectory highlighting thecoupling between ligand and Fe-oop motion. During the time the ligandsamples regions away from the heme-Fe, the iron atom moves below the hemeplane (between 95 and 100 ps).
Reuse of AIP Publishing content is subject to the terms: https://publishing.aip.org/authors/rights-and-permissions. Downloaded to IP: 192.33.100.145 On: Wed, 30
Mar 2016 14:54:52
105103-8 M. Soloviov and M. Meuwly J. Chem. Phys. 143, 105103 (2015)
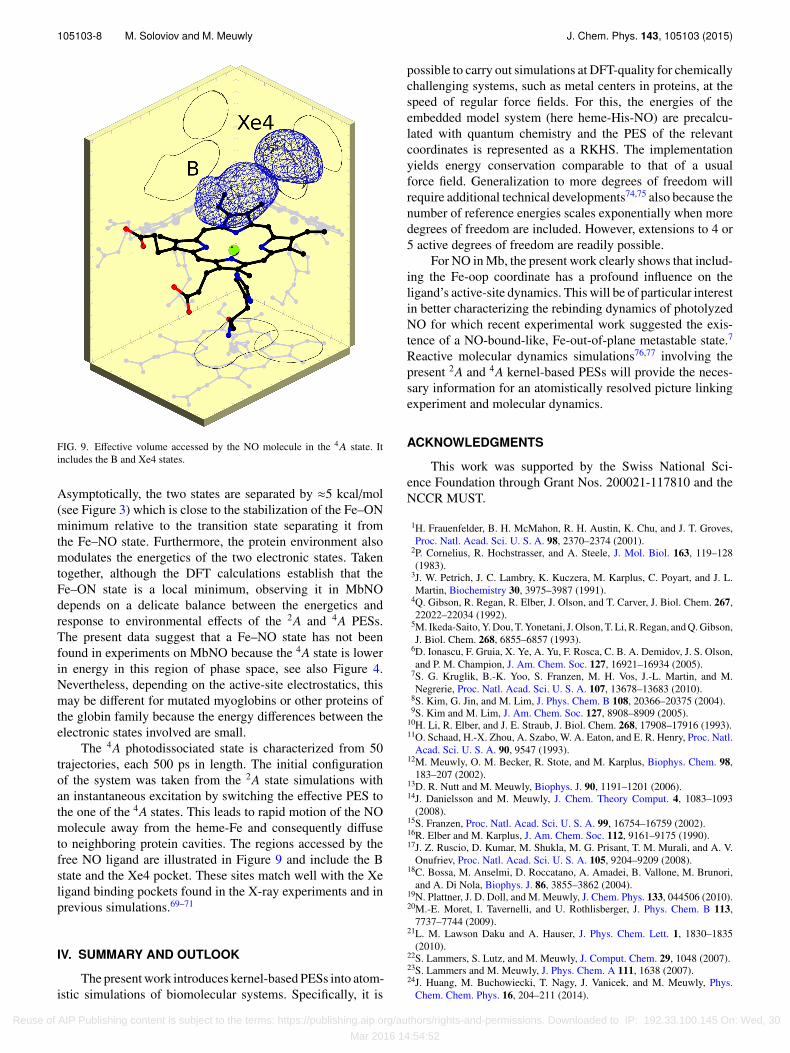
FIG. 9. Effective volume accessed by the NO molecule in the 4A state. Itincludes the B and Xe4 states.
Asymptotically, the two states are separated by ≈5 kcal/mol(see Figure 3) which is close to the stabilization of the Fe–ONminimum relative to the transition state separating it fromthe Fe–NO state. Furthermore, the protein environment alsomodulates the energetics of the two electronic states. Takentogether, although the DFT calculations establish that theFe–ON state is a local minimum, observing it in MbNOdepends on a delicate balance between the energetics andresponse to environmental effects of the 2A and 4A PESs.The present data suggest that a Fe–NO state has not beenfound in experiments on MbNO because the 4A state is lowerin energy in this region of phase space, see also Figure 4.Nevertheless, depending on the active-site electrostatics, thismay be different for mutated myoglobins or other proteins ofthe globin family because the energy differences between theelectronic states involved are small.
The 4A photodissociated state is characterized from 50trajectories, each 500 ps in length. The initial configurationof the system was taken from the 2A state simulations withan instantaneous excitation by switching the effective PES tothe one of the 4A states. This leads to rapid motion of the NOmolecule away from the heme-Fe and consequently diffuseto neighboring protein cavities. The regions accessed by thefree NO ligand are illustrated in Figure 9 and include the Bstate and the Xe4 pocket. These sites match well with the Xeligand binding pockets found in the X-ray experiments and inprevious simulations.69–71
IV. SUMMARY AND OUTLOOK
The present work introduces kernel-based PESs into atom-istic simulations of biomolecular systems. Specifically, it is
possible to carry out simulations at DFT-quality for chemicallychallenging systems, such as metal centers in proteins, at thespeed of regular force fields. For this, the energies of theembedded model system (here heme-His-NO) are precalcu-lated with quantum chemistry and the PES of the relevantcoordinates is represented as a RKHS. The implementationyields energy conservation comparable to that of a usualforce field. Generalization to more degrees of freedom willrequire additional technical developments74,75 also because thenumber of reference energies scales exponentially when moredegrees of freedom are included. However, extensions to 4 or5 active degrees of freedom are readily possible.
For NO in Mb, the present work clearly shows that includ-ing the Fe-oop coordinate has a profound influence on theligand’s active-site dynamics. This will be of particular interestin better characterizing the rebinding dynamics of photolyzedNO for which recent experimental work suggested the exis-tence of a NO-bound-like, Fe-out-of-plane metastable state.7
Reactive molecular dynamics simulations76,77 involving thepresent 2A and 4A kernel-based PESs will provide the neces-sary information for an atomistically resolved picture linkingexperiment and molecular dynamics.
ACKNOWLEDGMENTS
This work was supported by the Swiss National Sci-ence Foundation through Grant Nos. 200021-117810 and theNCCR MUST.
1H. Frauenfelder, B. H. McMahon, R. H. Austin, K. Chu, and J. T. Groves,Proc. Natl. Acad. Sci. U. S. A. 98, 2370–2374 (2001).
2P. Cornelius, R. Hochstrasser, and A. Steele, J. Mol. Biol. 163, 119–128(1983).
3J. W. Petrich, J. C. Lambry, K. Kuczera, M. Karplus, C. Poyart, and J. L.Martin, Biochemistry 30, 3975–3987 (1991).
4Q. Gibson, R. Regan, R. Elber, J. Olson, and T. Carver, J. Biol. Chem. 267,22022–22034 (1992).
5M. Ikeda-Saito, Y. Dou, T. Yonetani, J. Olson, T. Li, R. Regan, and Q. Gibson,J. Biol. Chem. 268, 6855–6857 (1993).
6D. Ionascu, F. Gruia, X. Ye, A. Yu, F. Rosca, C. B. A. Demidov, J. S. Olson,and P. M. Champion, J. Am. Chem. Soc. 127, 16921–16934 (2005).
7S. G. Kruglik, B.-K. Yoo, S. Franzen, M. H. Vos, J.-L. Martin, and M.Negrerie, Proc. Natl. Acad. Sci. U. S. A. 107, 13678–13683 (2010).
8S. Kim, G. Jin, and M. Lim, J. Phys. Chem. B 108, 20366–20375 (2004).9S. Kim and M. Lim, J. Am. Chem. Soc. 127, 8908–8909 (2005).
10H. Li, R. Elber, and J. E. Straub, J. Biol. Chem. 268, 17908–17916 (1993).11O. Schaad, H.-X. Zhou, A. Szabo, W. A. Eaton, and E. R. Henry, Proc. Natl.
Acad. Sci. U. S. A. 90, 9547 (1993).12M. Meuwly, O. M. Becker, R. Stote, and M. Karplus, Biophys. Chem. 98,
183–207 (2002).13D. R. Nutt and M. Meuwly, Biophys. J. 90, 1191–1201 (2006).14J. Danielsson and M. Meuwly, J. Chem. Theory Comput. 4, 1083–1093
(2008).15S. Franzen, Proc. Natl. Acad. Sci. U. S. A. 99, 16754–16759 (2002).16R. Elber and M. Karplus, J. Am. Chem. Soc. 112, 9161–9175 (1990).17J. Z. Ruscio, D. Kumar, M. Shukla, M. G. Prisant, T. M. Murali, and A. V.
Onufriev, Proc. Natl. Acad. Sci. U. S. A. 105, 9204–9209 (2008).18C. Bossa, M. Anselmi, D. Roccatano, A. Amadei, B. Vallone, M. Brunori,
and A. Di Nola, Biophys. J. 86, 3855–3862 (2004).19N. Plattner, J. D. Doll, and M. Meuwly, J. Chem. Phys. 133, 044506 (2010).20M.-E. Moret, I. Tavernelli, and U. Rothlisberger, J. Phys. Chem. B 113,
7737–7744 (2009).21L. M. Lawson Daku and A. Hauser, J. Phys. Chem. Lett. 1, 1830–1835
(2010).22S. Lammers, S. Lutz, and M. Meuwly, J. Comput. Chem. 29, 1048 (2007).23S. Lammers and M. Meuwly, J. Phys. Chem. A 111, 1638 (2007).24J. Huang, M. Buchowiecki, T. Nagy, J. Vanicek, and M. Meuwly, Phys.
Chem. Chem. Phys. 16, 204–211 (2014).
Reuse of AIP Publishing content is subject to the terms: https://publishing.aip.org/authors/rights-and-permissions. Downloaded to IP: 192.33.100.145 On: Wed, 30
Mar 2016 14:54:52

105103-9 M. Soloviov and M. Meuwly J. Chem. Phys. 143, 105103 (2015)
25J. Huang, D. Haeussinger, U. Gellrich, W. Seiche, B. Breit, and M. Meuwly,J. Phys. Chem. B 116, 14406–14415 (2012).
26N. Aronszajn, Trans. Am. Math. Soc. 68, 337 (1950).27T. Hollebeek, T. S. Ho, and H. Rabitz, Annu. Rev. Phys. Chem. 50, 537
(1999).28T. S. Ho and H. Rabitz, J. Chem. Phys. 104, 2584 (1996).29M. Meuwly and J. M. Hutson, J. Chem. Phys. 110, 8338 (1999).30J. Castro-Palacio, T. Nagy, R. Bemish, and M. Meuwly, J. Chem. Phys. 141,
164319 (2014).31J. Castro-Palacio, R. Bemish, and M. Meuwly, J. Chem. Phys. 142, 091104
(2015).32A. D. MacKerell, Jr. et al., J. Phys. Chem. B 102, 3586 (1998).33A. D. Becke, J. Chem. Phys. 98, 5648 (1993).34C. Lee, W. Yang, and R. Parr, Phys. Rev. B 37, 785 (1988).35S. Vosko, L. Wilk, and M. Nusair, Can. J. Phys. 58, 1200 (1980).36P. Stephens, F. Devlin, C. Chabalowski, and M. Frisch, J. Chem. Phys. 98,
11623 (1994).37G. Petersson and M. A. Al-Laham, J. Chem. Phys. 94, 6081 (1991).38G. Petersson, A. Bennett, T. Tensfeldt, M. A. Al-Laham, W. A. Shirley, and
J. Mantzaris, J. Chem. Phys. 89, 2193 (1988).39M. J. Frisch et al., 09, Revision A.1, Gaussian, Inc., Wallingford,
CT, 2009.40T. Hangelbroek and A. Ron, J. Funct. Anal. 259, 203 (2010).41C. Eckart and G. Young, Psychometrika 1, 211 (1936).42M. R. Hestenes, J. Soc. Ind. Appl. Math. 6, 52 (1958).43G. H. Golub and W. Kahan, J. Soc. Ind. Appl. Math. Ser. B Numer. Anal. 2,
205 (1965).44A. N. Tikhonov, Dokl. Akad. Nauk SSSR 39, 195 (1943).45A. N. Tikhonov, Dokl. Akad. Nauk SSSR 151, 501 (1963).46B. R. Brooks, C. L. Brooks III, A. D. J. Mackerell, L. Nilsson et al., J.
Comput. Chem. 30, 1545 (2009).47A. J. MacKerell, M. Feig, and C. I. Brooks, J. Comput. Chem. 25, 1400
(2004).48D. R. Nutt, M. Karplus, and M. Meuwly, J. Phys. Chem. B 109, 21118
(2005).49J. Johnson, D. Lamb, H. Frauenfelder, J. Muller, B. McMahon, G. Nienhaus,
and R. D. Young, Biophys. J. 71, 1563–1573 (1996).50C. Rovira, B. Schulze, M. Eichinger, J. D. Evanseck, and M. Parrinello,
Biophys. J. 81, 435–445 (2001).51K. A. Merchant, W. G. Noid, D. E. Thompson, R. Akiyama, R. F. Loring,
and M. D. Fayer, J. Phys. Chem. B 107, 4–7 (2003).52M. Meuwly, ChemPhysChem 7, 2061–2063 (2006).
53K. Nienhaus, J. S. Olson, S. Franzen, and G. U. Nienhaus, J. Am. Chem.Soc. 127, 40–41 (2005).
54J. P. Ryckaert, G. Ciccotti, and H. J. C. Berendsen, J. Comput. Phys. 23, 327(1977).
55M. Yoneya, H. J. C. Berendsen, and K. Hirasawa, Mol. Simul. 13, 395 (1994).56M. Carducci, M. Pressprich, and P. Coppens, J. Am. Chem. Soc. 119,
2669–2678 (1997).57N. Strickland and J. N. Harvey, J. Phys. Chem. B 111, 841 (2007).58L. Cheng, I. Novozhilova, C. Kim, A. Kovalevsky, K. A. Bagley, P. Coppens,
and G. B. Richter-Addo, J. Am. Chem. Soc. 122, 7142 (2000).59N. Xu, J. Yi, and G. B. Richter-Addo, Inorg. Chem. 49, 6253–6266 (2010).60K. Nienhaus, P. Palladino, and G. U. Nienhaus, Biochemistry 47, 935 (2008).61I. Schlichting, J. Berendzen, G. Phillips, and R. Sweet, Nature 371, 808–812
(1994).62E. A. Brucker, J. S. Olson, M. Ikeda-Saito, and G. N. Phillips, Proteins:
Struct., Funct., Bioinf. 30, 352 (1998).63C. E. Immoos, F. Sulc, P. J. Farmer, K. Czarnecki, D. F. Bocian, A. Levina,
J. B. Aitken, R. S. Armstrong, and P. A. Lay, J. Am. Chem. Soc. 127, 814(2005).
64Z. N. Zahran, L. Chooback, D. M. Copeland, A. H. West, and G. B. Richter-Addo, J. Inorg. Biochem. 102, 216 (2008).
65J. B. Aitken, S. E. Thomas, R. Stocker, S. R. Thomas, O. Takikawa, R. S.Armstrong, and P. A. Lay, Biochemistry 43, 4892 (2004).
66A. Giuffre, E. Forte, M. Brunori, and P. Sarti, FEBS Lett. 579, 2528 (2005).67D. M. Copeland, A. S. Soares, A. H. West, and G. B. Richter-Addo, J. Inorg.
Biochem. 100, 1413 (2006).68A. M. Rich, R. S. Armstrong, P. J. Ellis, and P. A. Lay, J. Am. Chem. Soc.
120, 10827 (1998).69R. F. Tilton, I. D. Kuntz, and G. A. Petsko, Biochemistry 23, 2849 (1984).70E. C. Liong, “Structural and functional analysis of proximal pocket mutants
of sperm whale myoglobin,” Ph.D. thesis, Rice University, 1999.71P. Banushkina and M. Meuwly, J. Phys. Chem. B 109, 16911 (2005).72M. Lim, T. Jackson, and P. Anfinrud, Proc. Natl. Acad. Sci. U. S. A. 90,
5801–5804 (1993).73K. Kuczera, J. Lambry, J. Martin, and M. Karplus, Proc. Natl. Acad. Sci. U.
S. A. 90, 5805–5807 (1993).74T. Ho and H. Rabitz, J. Chem. Phys. 119, 6433–6442 (2003).75S. Manzhos, X. Wang, R. Dawes, and T. Carrington, J. Phys. Chem. A 110,
5295–5304 (2006).76J. Danielsson and M. Meuwly, J. Phys. Chem. B 111, 218 (2007).77T. Nagy, J. Y. Reyes, and M. Meuwly, J. Chem. Theory Comput. 10,
1366–1375 (2014).
Reuse of AIP Publishing content is subject to the terms: https://publishing.aip.org/authors/rights-and-permissions. Downloaded to IP: 192.33.100.145 On: Wed, 30
Mar 2016 14:54:52


![Natation Artistique - Performance Synchro...Nadeau, Ève Plourde et Evelyne Richer. [Alexia Breault] 17. Pénélope Martin, Charlotte Boucher, Anastasia Koulikis, Selena Soloviov et](https://img.pdfslide.net/doc/110x75/5ff66279004abe412b1392d6/natation-artistique-performance-nadeau-ve-plourde-et-evelyne-richer-alexia.jpg)