Embed Size (px)
Citation preview

Reproduction Quality Notice
This document is part of the Air Technical Index [ATI] collection. The ATI collection is over 50 years old and was imaged from roll film. The collection has deteriorated over time and is in poor condition. DTIC has reproduced the best available copy utilizing the most current imaging technology. ATI documents that are partially legible have been included in the DTIC collection due to their historical value.
If you are dissatisfied with this document, please feel free to contact our Directorate of User Services at [703] 767-9066/9068 or DSN 427-9066/9068.
Do Not Return This Document To DTIC
Reproduced by
AIR DOCUMENTS DIVISION
/
HEADQUARTERS AIR MATERIEL COMMAND
WRIGHT FIELD, DAYTON, OHIO
,Äy..,*
Ji« ••K-..;i.:
t , J«, W, f»T ^ •• '•<>.. —•-
US GOVERNMENT IS ABSOLVED
FROM ANY LITIGATION WHICH MAY
ENSUE FROM THE CONTRACTORS IN -
FRINGING ON THE FOREIGN PATENT
RIGHTS WHICH MAY BE INVOLVED.
*» k ••

^V^V ;
f» *,- V:,-* ,1. " ;V*". i,'"-!.- .-.IS»' *"»•.. »-- •"•-. . •>,-'i. '• • • •• •••':•••• ••• i* •••"\,-V' •
"?«*»•-.•. /..•
fed?» if^F- •;••:•
'''^w*. -'' '••**$>• '>-'".'^.'V
^ftft^fk :-v£* V-'1 "-V
•5<t
.•;*'
<.j,i" :'.* -• *
ÜM CLASSIFIED
m$&&&.&'.3 •v.-/*^;^
.-.•••••;**;•."^•SiAi--1;' •-^••.'^ •.•••: ^a;-••#
. * *:
-'#••";•••,
:'•%•
fa
NATIONAL ADVISORY COMMITTEE FOR AERONAUTICS
TECHNICAL NOTK
No. 1299 ATI No. -?/£?
EFFECTS OF MACH NUMBER AND REYNOLDS NUMBER
ON THE MAXIMUM LIFT COEFFICIENT OF A WING
OF NACA 230-SERIES AIRFOIL SECTIONS
By G. Chester Furlong and James E. Fitzpatrick
Langley Memorial Aeronautical Laboratory __JLangleyField, Va.
i\
r: '*» ü-.w» G0?Y RETURN ;0
Spi-ciat Documtn s L^ra.ich - TS3WF--6 Wnghi Fislo B,ere:.i;« Lb iry Section
i Aij uoc iii.nis l-A-j ,h.,i - „iiei'iiifliiLtf f [••?)
Washington
May 1947
WBH fulJ, Ujlon, Oiiio.
RATIONAL ADVISORY COMMITTEE FOR AERONAUTICS
TECHNICAL MOTE NO. U99
EFFECTS OF MACH NOMHER AND REYNOLDS NUMBER
ON THE MAXIMUM LIFT COEFFICIENT OF A WING
OF RACA 230-SERIES AIRFOIL SECTIONS
By a- Cheater Fur3oxv and Janes E. Fitapetrick
SIMJARY
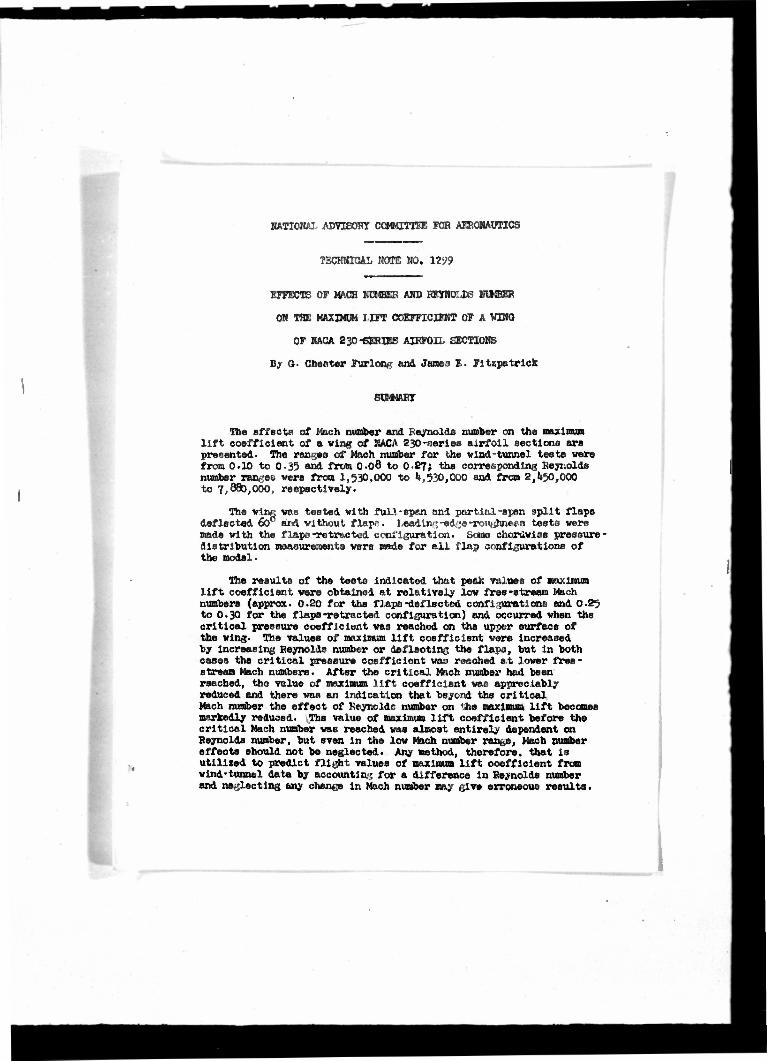
The effects of Mach number and Reynolds number on the maximum lift coefficient of a wing of MCfi 230-nerIes airfoil sections are presented- The ranges of Maoh number for the wind-tunnel teats were frost 0-10 to 0-33 and from O.08 to 0-&7; the corresponding Reynolds number ranges were from 1,530,000 to 4,530,000 and from 2,450,000 to 7,880,000, respectively.
The wine was tested with fuU -span ar.d partial-span split flaps deflected 60 and without flapn. Leading-ed^e-roiifjhneea tests were made with the flaps -re tracted ccniMguration- Sou» chordwiae pressure - distribution measurements were made for all flap configurations of the model-
The results of the tests indicated that peek values of maximum lift coefficient were obtalnod at relatively low free~etream Mach numbers (approx. 0.20 for the flapts-deflected configurations and 0-25 to 0.30 for the flaps'retracted configuration) and occurred when the critical pressure coefficient was reached on the upper surface of the wing. The values of maximum lift coefficient wore increased by increasing Reynolds number or deflecting the flaps, but in both cases the critical pressure coefficient wan readied at lower free- stream Mach numbers. After the critical Mach number had been reached, tho value of maximum lift coefficient was appreciably reduced and there wan an indication that beyond the critical Mach number the effect of Reynolds number on 'he maximum lift becomes markedly reduced. The value of maximum lift coefficient before the critical Mach number was reached was almost entirely dependent on Reynolds number, but even in the low Mach number range, Mach number effects should not bo neglected. Any method, therefore, that 1B utilized to predict Hi,.'hi values of maximum lift coefficient from wind-tunnel data by accounting for a difference in Reynolds number and neglecting any change in Mach number may civ« erroneous results.
HACA TH No. 12P9
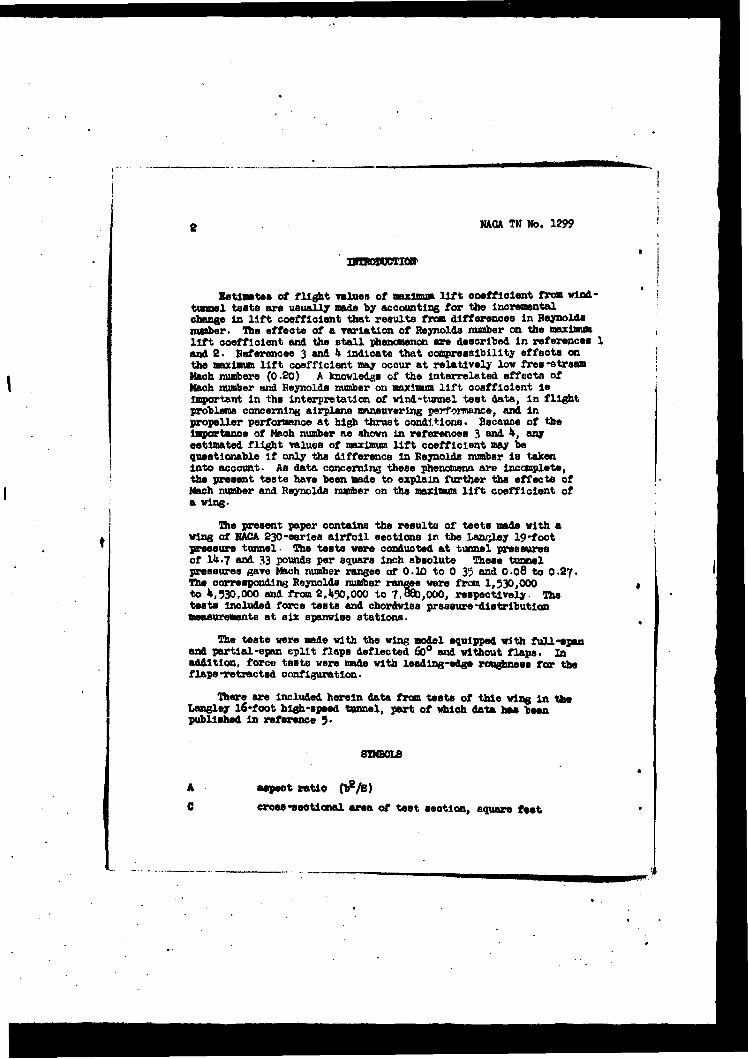
TJRROXOCTXOV
Estimates of flight values of maximum lift coefficient from wind- tunnel teets are usually made by accounting for the incremental change In lift coefficient that results from differences in Reynolds number. The effects of a variation of Reynolds number on the maximum lift coefficient and the stall phenomenon are described In references and 2• References 3 and h indicate that compressibility effects on the maximum lift coefficient may occur at relatively low free-stream Mach numbers (0.20) A knowledge of the Interrelated effects of Mach number and Reynolds number on maximum lift coefficient is Important in the interpretation of wind-tunnel test data, in flight problems concerning airplane maneuvering psrforwmce, and in propeller performance at high thrust conditions. Becaune of the importance of Maoh number aa shown in references 3 and k, any estimated flight values of maximum lift coefficient may be questionable if only the difference In Reynolds number la taken Into account. As data concerning these phenomena are incomplete, the present testB have been made to explain further the effects of Mach number and Reynolds number on the maximum lift coefficient of a wing.
The present paper contains the results of teats made with a wing of NACA 230-series airfoil sections in the Lanjjley 19-foot pressure tunnel- The tests were conducted at tunnel pressures of 14.7 and 33 pounds per square Inch absolute These tunnel pressures gave Mach number ranges of 0.10 to 0 35 and O.08 to O.27. The corresponding Reynolds number ranges were from 1,530,000 to k,530,000 and from 2,U50,O0O to 7,800,000, respectively. The tests included force tests and chordwise pressure-distribution measurements at six apanwlse stations-
The tests were made with the wing model equipped with full-span and partial-span eplit flaps deflected 6o° end without flaps. Da addition, force tests were made with leading-edge roughness for the flaps-retracted configuration.
There are included herein data from tests of this wing In the Langley 16-foot high-speed tunnel, port of which data has been published la reference 5-
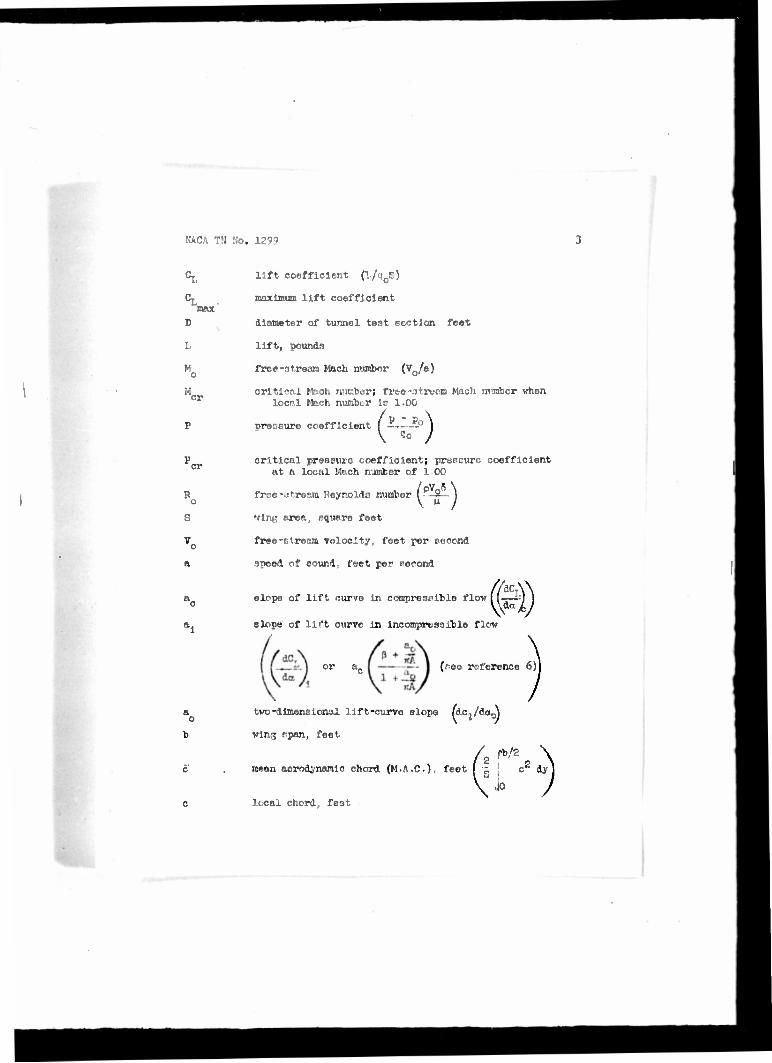
SYMBOLS
A
C
aepeot ratio Q?/8)
cross-sectional area of test section, square feet
HACA TN No. 1299
max D
I.
er
lift coefficient (I./q E)
Kaximum lift coefficient
diameter of tunnel test section feet
lift, pounds
free-stream Mach number (V0/a)
critical Mach number; free-utruam Mach number when local Mach number lc 1.00
•ore-iBure coefficient (H*) critical pressure coefficient; pressure coefficient
at a local Mach number of 1 00
(¥) free-utream Reynolds number
•vlng area, square feet
free-stream velocity, feet per second
speed of sound, feet per second
elope of lift curve in compressible flow (m slope of lift curve in incompressible flow
(nee reference 6)| a- --
two-dimensional lift-curve slope /dc,/da0\
wing span, feet
mean aerodynamic chord (M.A.C). feet IT I cS dy 1
.10
local chord, fe3t
ittCA Tfl No. 12?9
I
V
P0
"r,
y
y
ft
%
Vx
0
p
M
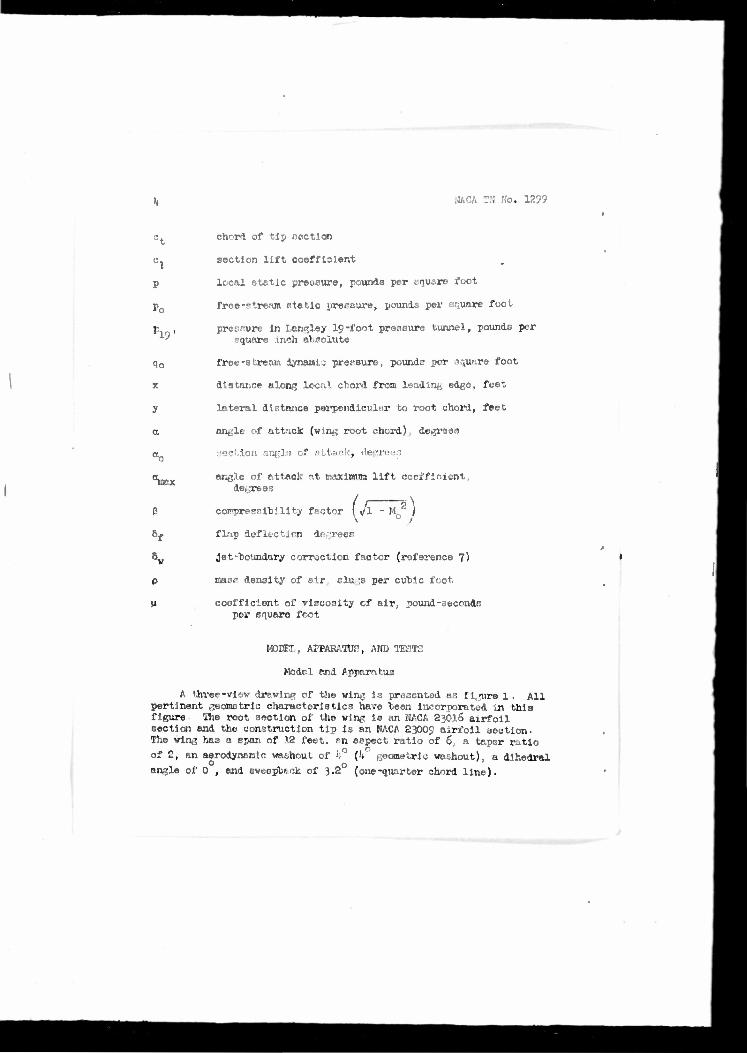
chord of tip section
section lift coefficient
local static preaoure, pounds per square foot
free-stream static «recsure, pounds per square foot
pressure in Langley 19-foot pressure tunnel, pounds per square inch absolute
free-stream dynamic; pressure, pound" per aquure foot
distance along local chord from leading edge, feet
lateral distance perpendlculur to root chord, feet
angle of att-ick (wing root chord), degrees
section angle or attack, degrees
angle of attack at maximum lift coefficient, decrees
(/ A coirpresslbility factor I i/l - M0 /
flfip deflection degrees
Jet-fcoundary correction factor (reference 7)
mas« density of air clu :s per cubic foot
coefficient of viscosity of air, pound-seconds per square foot
M3UET., APPARATUS, AND TESTS
Model and Apparatus
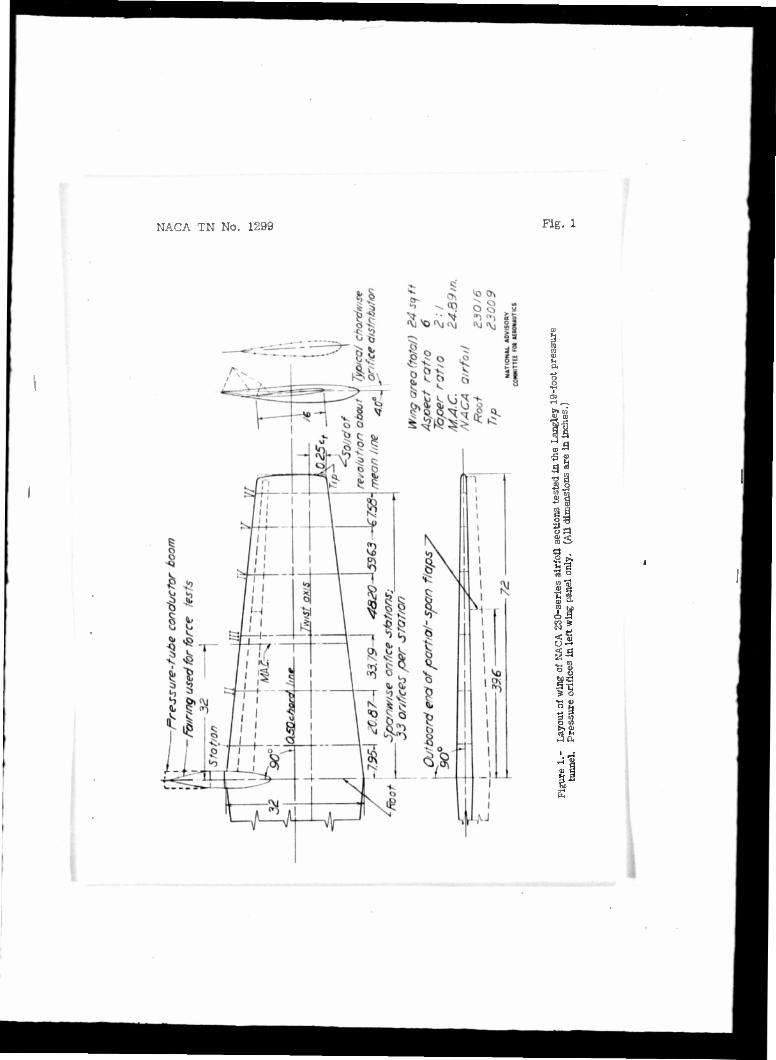
A three-view drewt nt; of the win»; Is presented as f i.^ire 1 . All pertinent geometric characteristics have teen incorporated in this figure The root section of the wing Is an IIACA 23OI6 airfoil section and the construction tip is an NACA 23009 airfoil section - The wing has a span of 12 feet, rn aspect ratio of 6. a taper ratio of 2, an aerodynamic waehout of I» (4" jjeometrii; washout), a dihedral
arwle of 0 , and sweeps*ck of 3.2 (one-quarter chord line).
NACA TN Mo, 1299
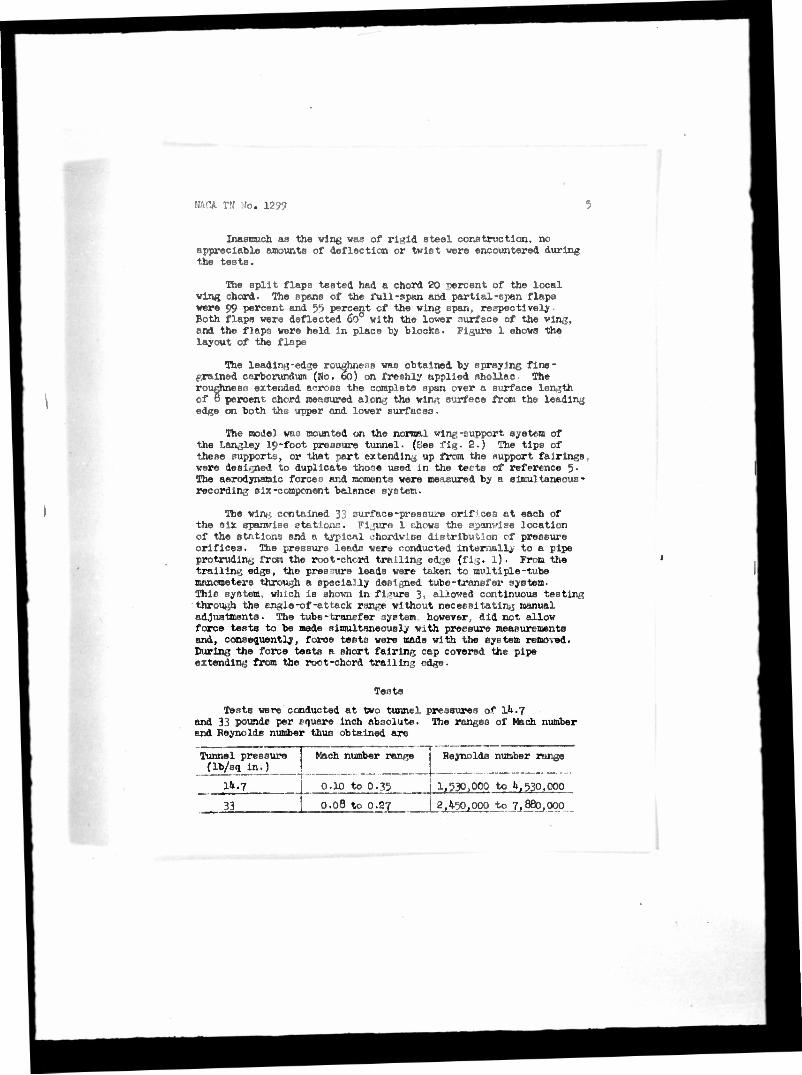
Inasmuch aa the wing was of rigid steal construction, no appreciable amounts of deflection or twist were encountered during the tests.
The split flaps tested had a chord 20 percent of the local wing chord- The spans ot the full-span and partial-span flaps were 99 percent and yf> percent of the wing span, respectively. Both flaps were deflected 60° with the lower surface of the wing, and the flaps were held in place by blocks. Figure 1 shows the layout of the flaps
The leading-edge roughness was obtained by spraying fine- grained carborundum (Mo. 60) on freshly applied shellac The roughness extended across the complete span over a surface length of 8 percent chord measured along the win« surface from the leading edge on both the upper and lower surfaces•
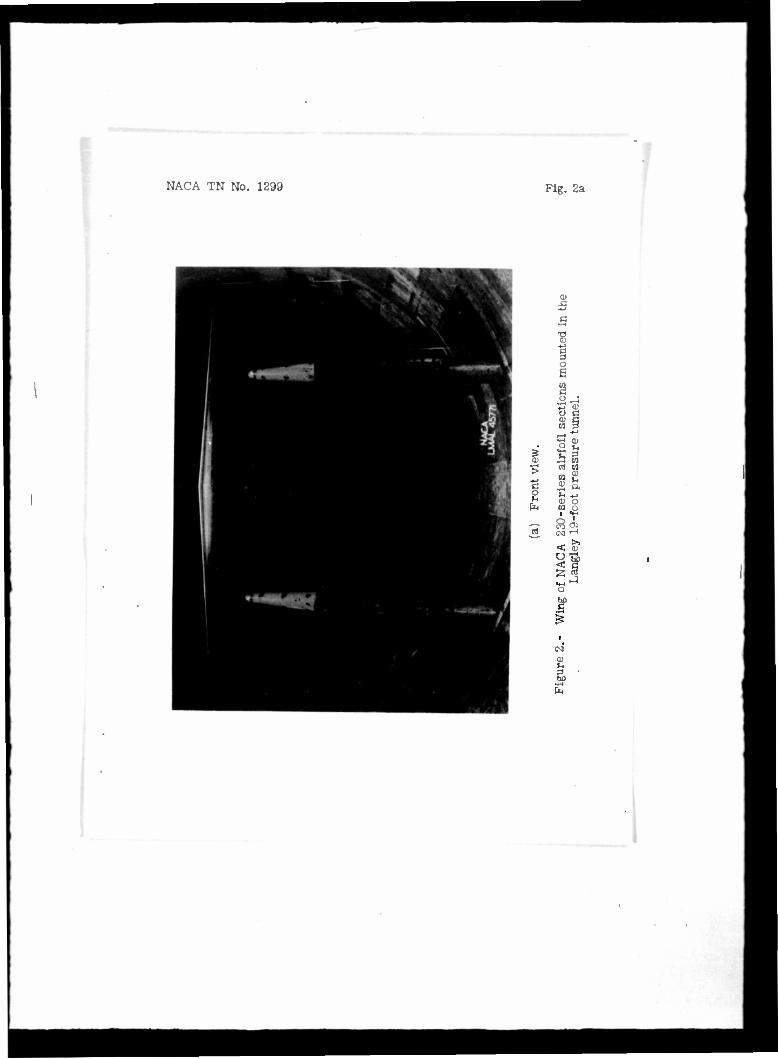
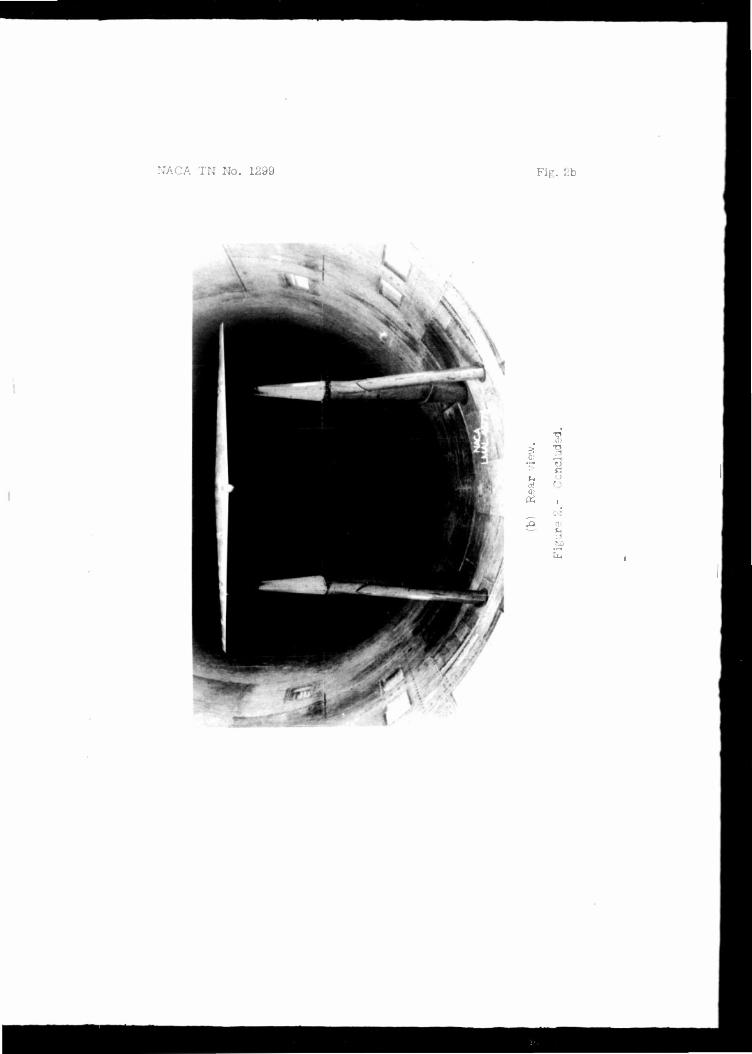
The model was mounted on the normal wing-support system of the Langley 19-foot pressure tunnel. (See fig. 2.) The tips of these supports, or that part extending up from the support fairings, were designed to duplicate those used in the tecte of reference 5- The aerodynamic forced and moments were measured by a simultaneous - recording six-component balance system.
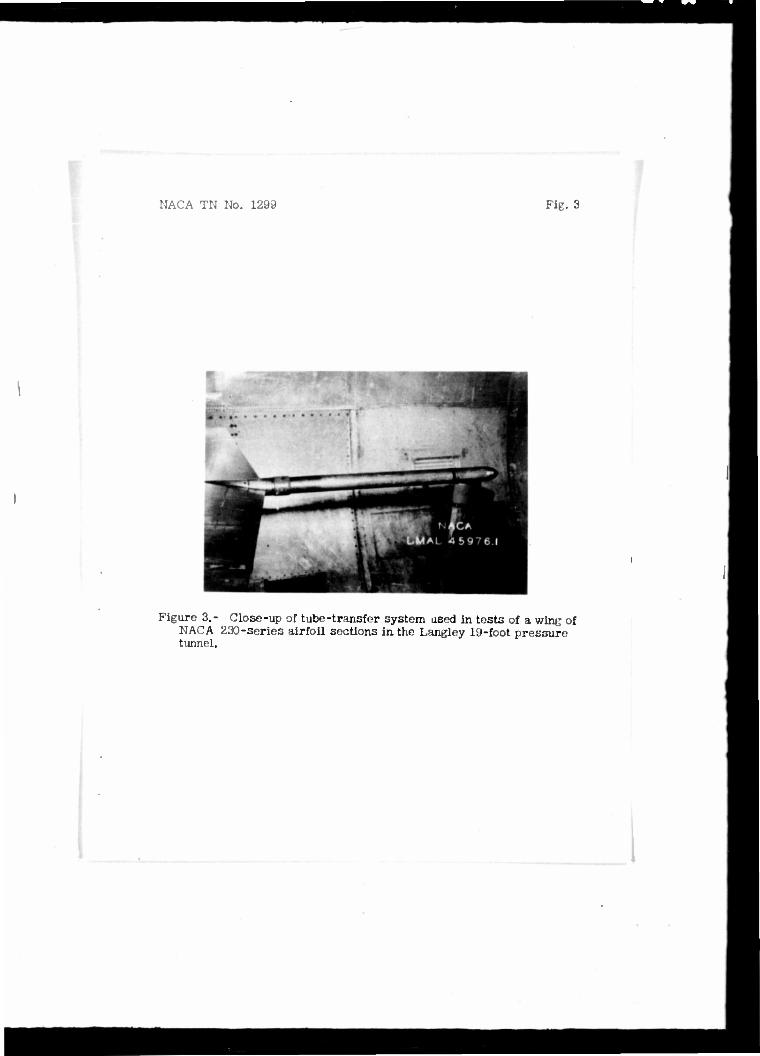
The win« contained 33 surface-pressure orif'ces at each of the six epanwlse stations. Figure 1 shows the spanvise location of the stations and a typical chordwise distribution of pressure orifices. The pressure leads were nonducted internally to a pipe protruding from the root-chord trailing ed,\se (fig. 1). Firm the trailing edge, the pressure leads were taken to multiple-tube manometers through a specially designed tube-transfer system. This system, which is shown in figure 3, allowed continuous testing through the angle-of-attack range without necessitating manual adjustments. The tube - transfer system, however, did not allow force tests to be made simultaneously with pressure measurements and, consequently, force tests were made with the system removed. During the force tests a short fairing cap covered the pipe extending from the root-chord trailing edge.
Teats
Tests were conducted at two tunnel pressures of lb.7 and 33 pounds per square inch absolute. The ranges of Mach number and Reynolds number thus obtained are
Tunnel pressure (lb/sq in.) _j
14.7
Mach number range
0.10 to 0.35
Reynolds number range
1,530,000 to It,530.000
33 O.08 to 0.27 2,450,000 to .7,880,000
NACA TN No. 1299
For convenience, tents made at tunnel pressures of ik.f *»d 33 pounds per square Inch absolute are desigu&ted
respectively- ^19
= 14.7 and p 19'
33,
Tare tests were made for all model flap configurations at both tunnel pressures. In addition, scale effect on tares was Investigated for the flaps-retracted configuration. The result» indicated no change in tore through the Mach number and Reynolds number ranges obtainable in the Langley 19-foot pressure tunnel.
Force tests were made through the tunnel-speed range at both tunnel pressures for all flap configurations. Leading-edge-roughness teste wore also madß at both tunnel preaauroo for the flaps- retracted configuration. The forte tests at a tunnel preBaure of 33 pounds per square inch absolute were made at speeds which would produce either the same Mach numbers or Reynolds numbers ao those of similar tests reported in reference 5.
A comparison of the maximum-lift-coefficient data obtained in the two wind tunnels for the same test conditions was made. A Langley 16-foot high-speed tunnel condition (Mach number of 0.15 and Reynolds number of 2,450,000) was reproduced In the I/angley 19-foct pressure tunnel at a tunnel pressure of I0.5 pounds per square inch absolute•
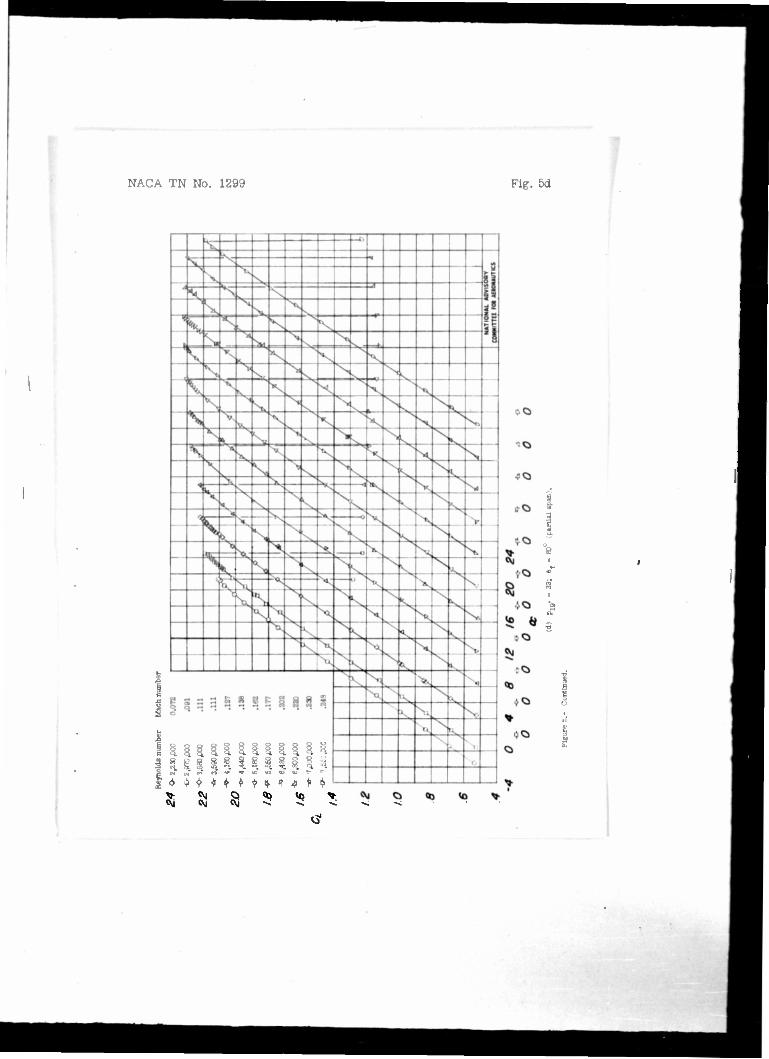
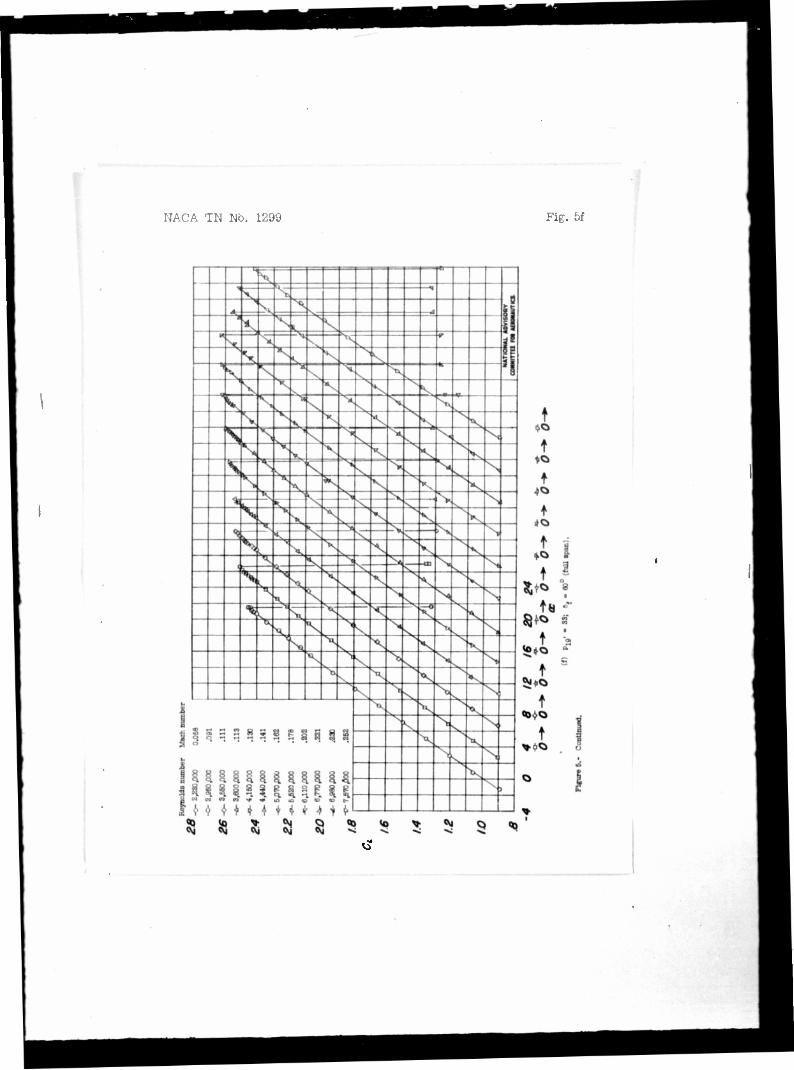
Chordvise-pressure-distribution measurements were made at Plg 1 • 33 for v*lues of Mach number and Reynolds number obtained
in force tests.
Vleual observations of the stw.ll pattern were made by tuft surveys at several tunnel airspeeds.
The wing was tested through an angle-of-attack range from-3.7° through the stall. A constant value of Mach number or Reynolds number was maintained during a mn by proper adjustment of the dynamic pressure to account for changes in temperature and pressure.
CORRECTIONS TO DATA
Force Teats
The lift coefficients have been corrected for support-strut interference ts determined by tare tests.
iKGA m No. 1299
Tho angle» of attack have teen corrected for air-stream mloallnement and Jet-bound>ry effects. The air-stream mieallnement was determined during tbe tare teste, and the jot-boundery correction was determined \iy the following equation derived from reference 8:
,JJO. (--1f1) \e"-*: This equation contains the angle-of-attack correction at the lifting line for the case of a win.' with an elliptical spanwlse load distribution and also an additional correction for the induced streamline curvature. The torm ß has been introduced to account for compressibility effects (reference 6). For the teets in the Langley 12-foot pressure tunnel, a mean value of ß was found to suffice and the correction to an^le of attack becomes 0-Ö7Ö0C •
Pressure Distribution
So corrections have been applied to the local values of stetlc prespure. The local effects of the struts and wolle on these pr9srures are assumed to be negligible. In tho computation of the pressure coefficients, however, average dynamic preesura and free- stream static pressure across the span have been u'ed.
RESULTS
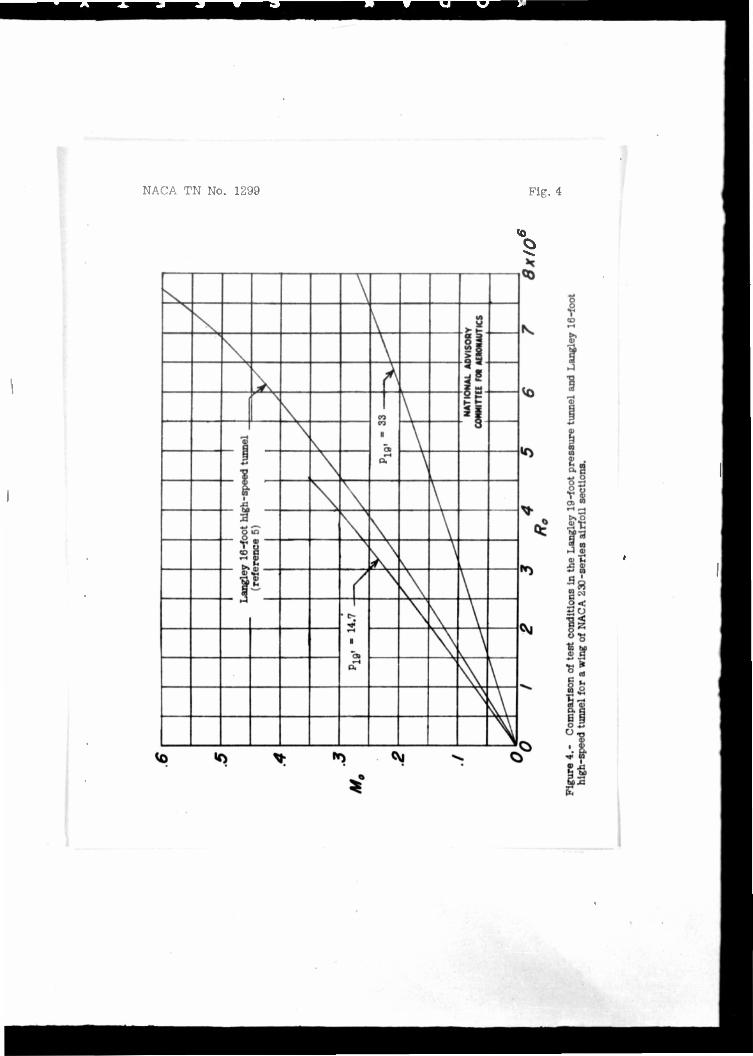
The variation of Mach number w.'th Reynolds number obtained from tests reported in reference 3 Of the seme wing an tested herein Mid obtained at both tunuel pressures in the langley 19"foot pressure tunnel is shown in figure b. All values of Reynolds number have been bared on the mean aerodynamic chord of tiio wing. The maximum deviations of Mach number an.l Reynolds number from the curves for these testa in the Langley 19-foot pressure tunnel are within values of M^j = tO-01 and *•„ t20,000.
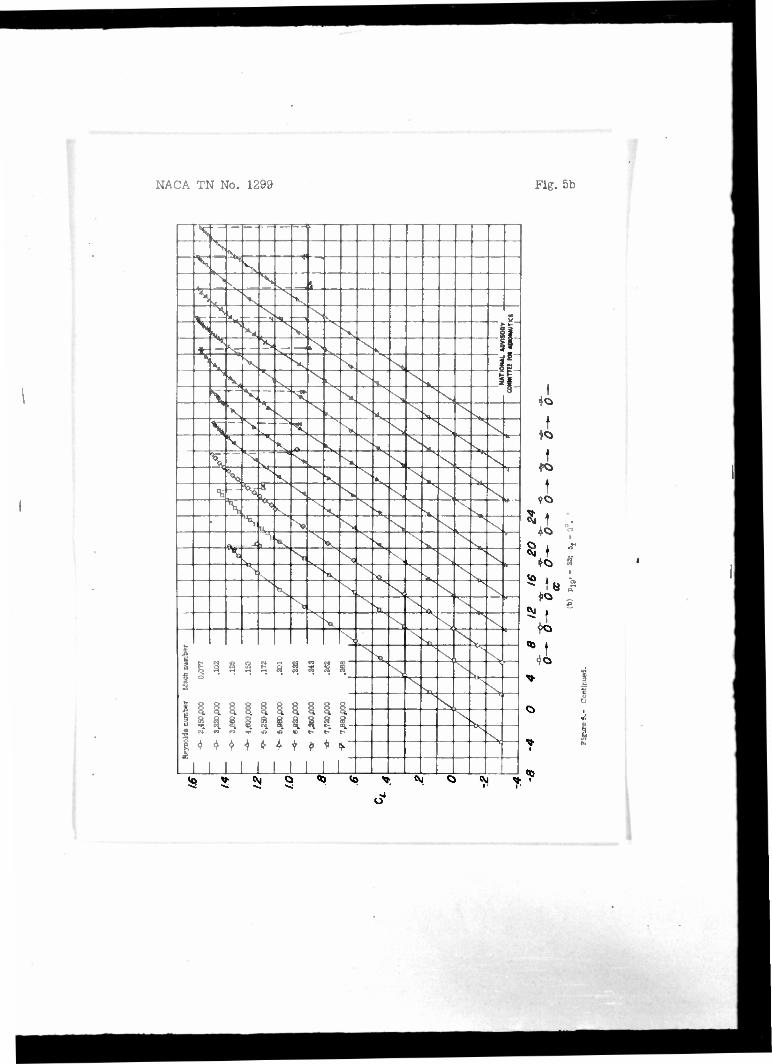
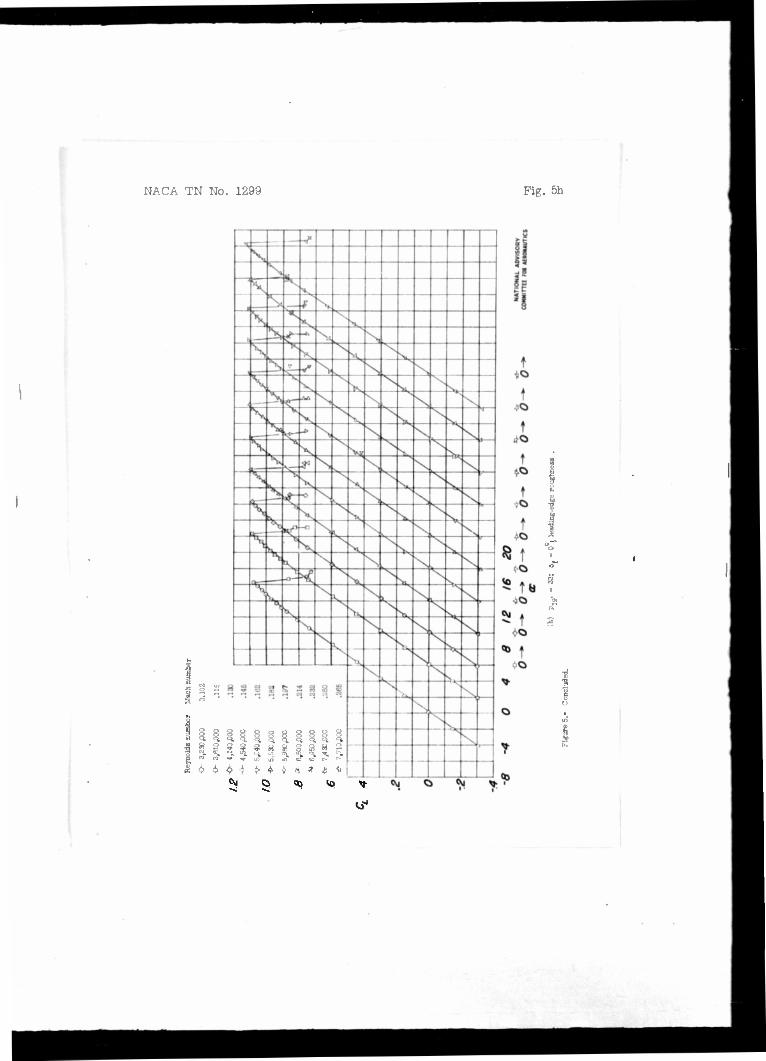
The 11ft-coefficient data obtained from force tetts in the Langley 19-foct pressure tunnel are presented in fijure •?. This fi«jure includes data for four confitjurationo, that ic, for flaps retracted, for partial-span flap?, for full-span flapr, and for flaps retracted with leading-edge roughness at both the Langley 19-foot pressure tunnel conditions.
A check run to determine the values of maximum lift coefficient
MAC/. T! Wo. 12?'.'
that would be obtained in the two tunnels under the same teat conditions gave a value of maximum lift coefficient of 1-35, ae compared with a velue of I.36 (reference 5) obtained in the Langley 16-foot high-speed tunnel. This agreement was considered satisfactory and Juctlfied any conclusions interpreted fx-oa the results of both tunnels•
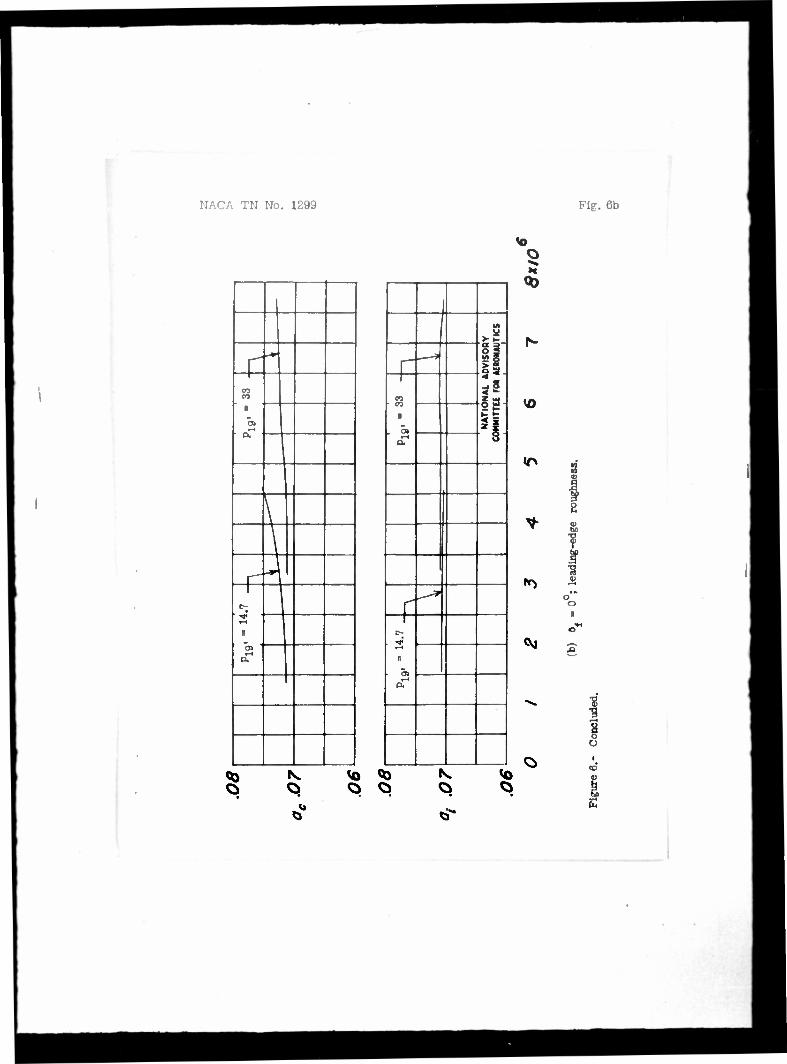
The slopes of the lift curves for the flaps-retracted configuration with and without leading-edge roughness and tho Elopes corrected to incompressible-flow conditions by the method of reference 6 are plotted against Reynolds number in figure 6. The figure shows the applicability of the correction factor of reference 6 in converting slopes of these lift curves from compressible-flow conditions to incompressible-flow conditions. After the correction factor had been applied **o the slopes, the results from the T^an^ley 16-foot high-speed tunnel (reference 5) and the Langley 19-foot pressure tunnel vere in excellent agreement.
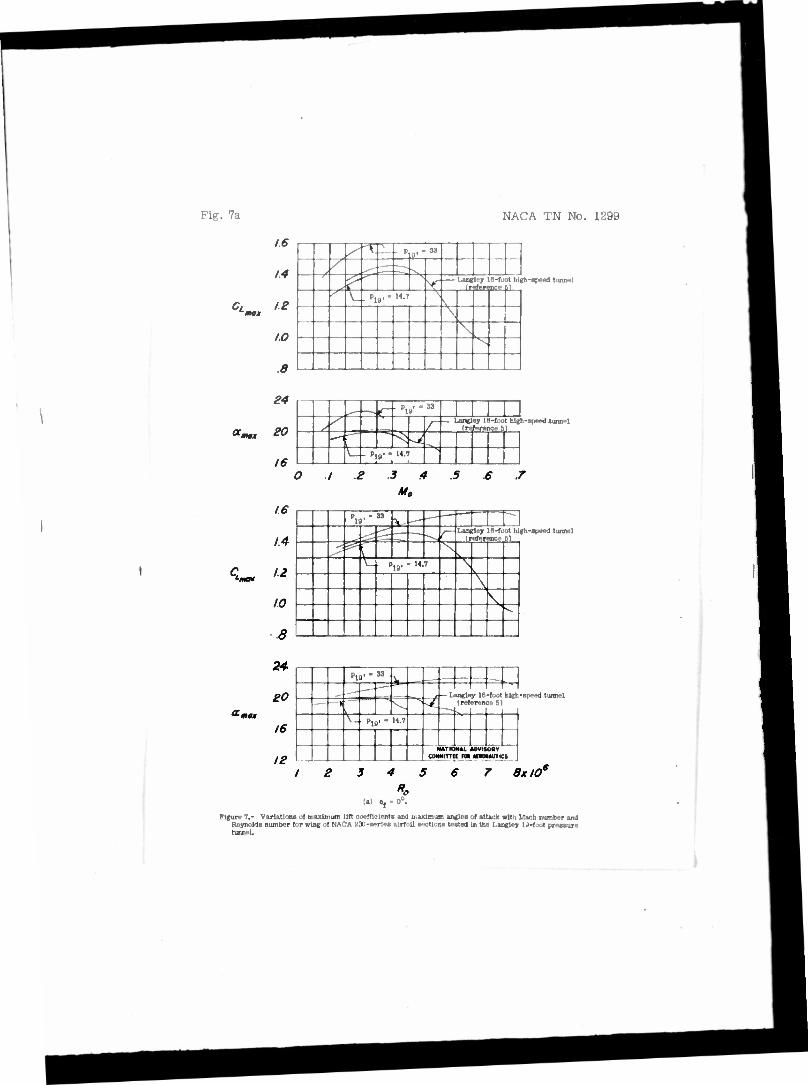
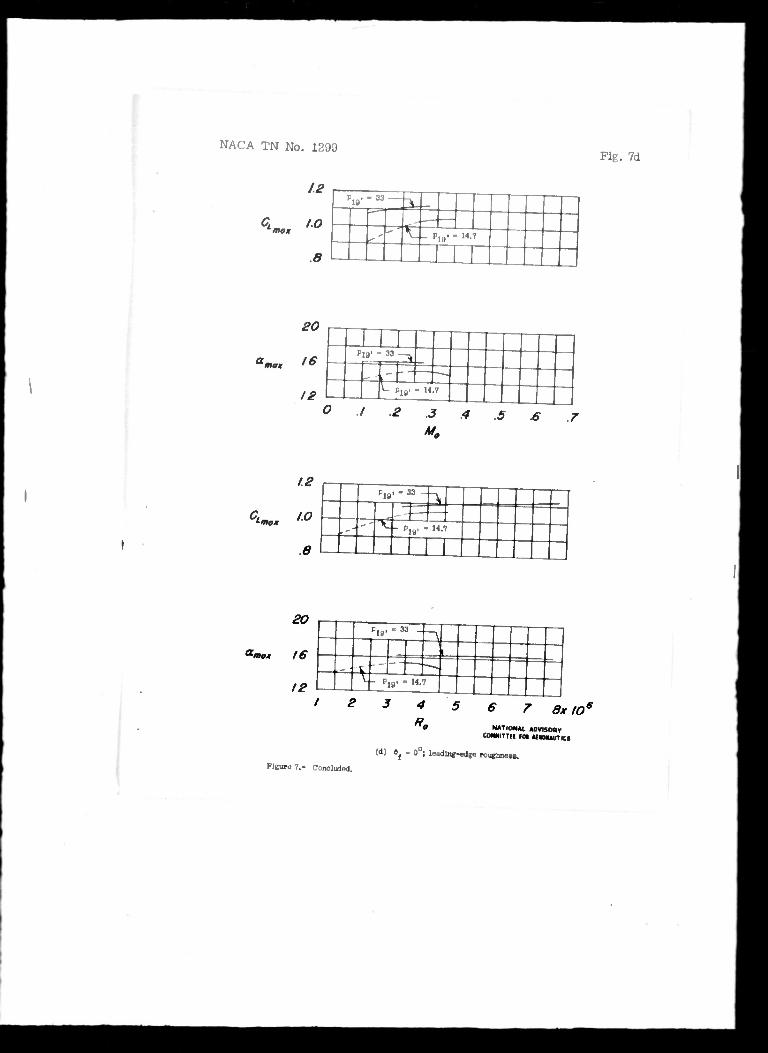
The maximum lift coefficients and correapoiidüvj angles of attack have been plotted against Mach number &nd Reynolds number in figure 7, which also includes data obtained frcm reference 5- The variations of maximum lift coefficient with Mach number and Reynolds number for all model configurations and tunnel conditions resemble those shown in reference £ for a wing of NftCA 0012 airfoil section. Figure 7 shows that for each tunnel condition the maximum lift coefficient increases with an increase in airspeed •• K and M increasing (see fit;, k) - to a maximum or peak value, after which the maximum lift coefficient decrease? with a further increase in airspeed. The peck values of maximum lift coefficient occur at Mach number- of approximately 0.20 for the fImps-deflected confijj-urations and between O.25 ard 0-30 for the flaps-retracted configuration. There vere no peak maximum lift coefficients for the flaps-retracted leading -edge -roughness configuration iii the Mach number ranges obtainable in the Lang.ley 19-foot pressure tunnel. A comparison of the flaps-deflected configurations (figs- 7(b) and ?(c)) with the flapti-retracted confi.-iurat-'oii (fig- 7(a)) at similar tunnel conditions shows that flap deflection usuries the peak maximum lift coefficients to occur at lover M».ch numbers. For each model configuration a similar ccmpari&on between the two tunnel conditions pj-i = 33 and plt,, • Ik.f shows.' that tho peak
maximum lift coefficients occur at lower Mach numbers for p . = 33
than for p , = lU.7.
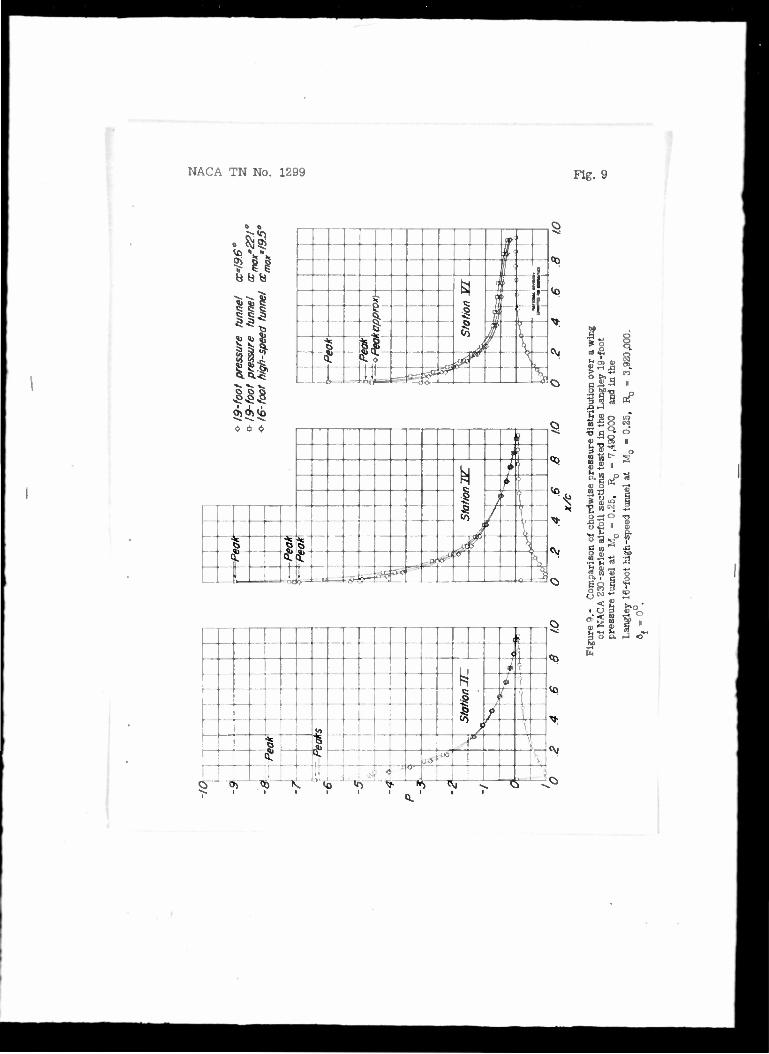
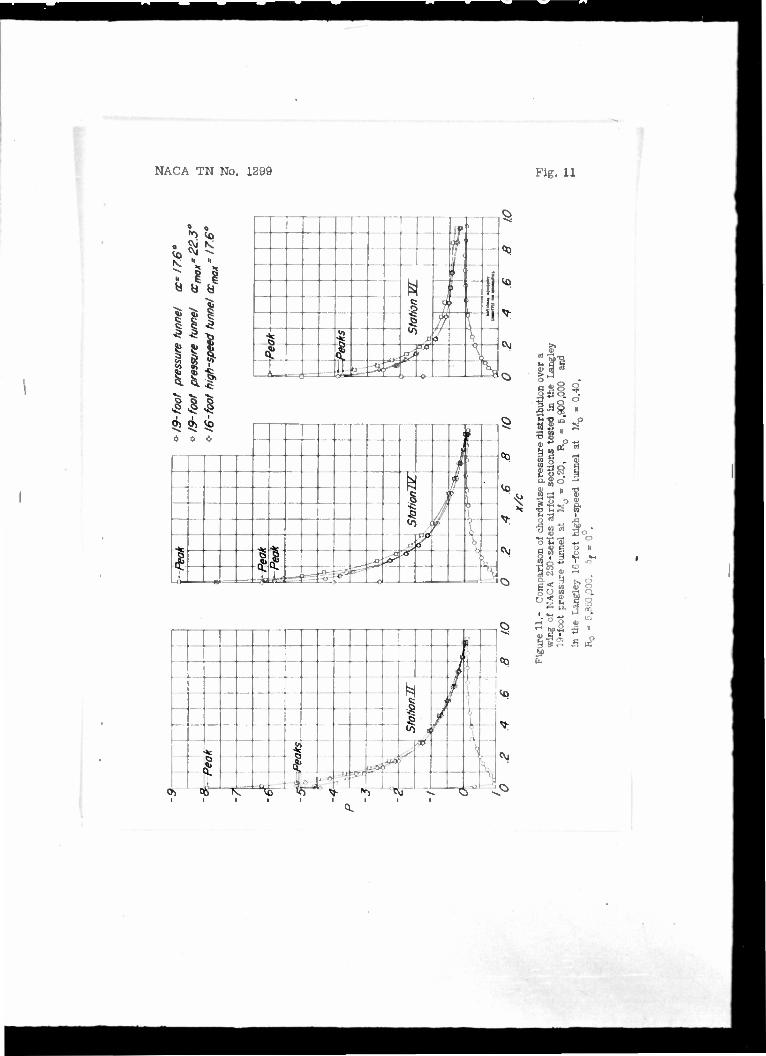
Sor» of the chcrdwlse pressure-distribution data obtained during the tests are presented for three cf the six spanwlse stations in figures 8 to 12. Pressure-diatrlbut^in data were
NAGA TM 'Jo. 129?
obtained In the Langley .19-foot pressure tunnel for only the tunnel condition p.
19' 33 as sons atmospheric-pressure data were
available from tests in the Langley 16-foot high-speed tunnel. The data are presented at the maximum angles of attack for several values of Mach number and Reynolds number with flaps retracted and deflected. A comparison was made of data from the Langley l6-foot high-speed tunnel with data from the Langley 19-foot pressure tunnel (p15< • 33) at comparable values of either Mach number or
Keynolds number- As a result of the large pressure peaKs encountered with flaps deflected, the pressure-coefficient scale has been reduced from that used for the flaps-retracted configuration.
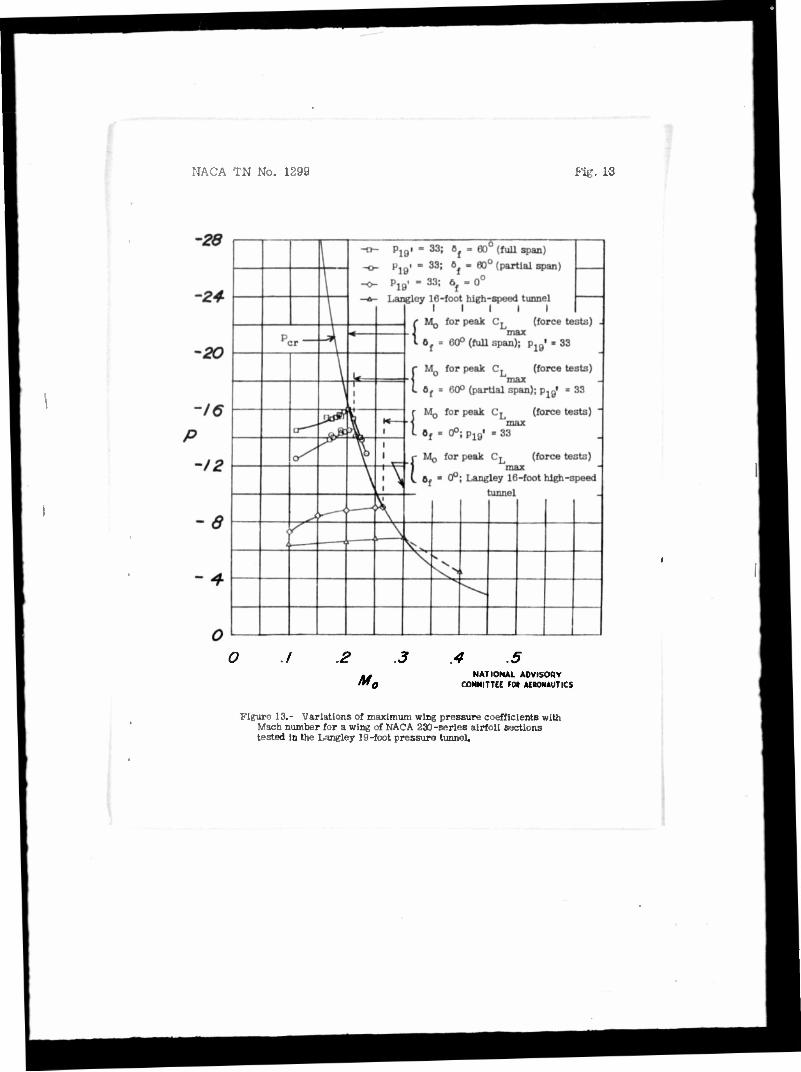
From the pressure-distribution data that were available from tests of the wing in both tunnels, figure 13 has been prepared. The peak pressure coefficients obtained for each section at the maximum lift coefficient of the wing were first plotted against the semlspsn to obtain the faired maximum value of peak pressure coefficient on the wing; the maximum peak pressure coefficients of the wing were then plotted against Mach number to obtain figure 13- The figure is not so complete as would be desirable because of the limited Mach nuniber range of the Langley 19-foot pressure tunnel.
Tho res-Its of the visual stall studies are summarized in figure 14 in which the stall progressions for the flaps-retracted and flaps-deflected configurations are presented.
DISCUSSION
The significance of a variation of Reynolds number alone on the maximum lift coefficient of an airfoil has been fully described In reference 1 In which data are presented of testa conducted at low free-stream Mach numbers (M 3O-08). T0 reiterate, the
effect of increasing Reynolds number is to cause an earlier transition from laminar to turbulent boundary layer. The increased turbulent boundary layer Is then capable of resisting separation, and a higher angle of attack is reached before stalling occurs; thus, an Increase in maximum lift coefficient Is obtained. Aa pointed out in reference 2, the Reynolds number first affects the lift of an airfoil at moderately high angles of attack. When the Reynolds number has reached a value at which the entire boundary layer has become turbulent, there is evidence that a further increase In Reynolds number will not produce any increase in the maximum lift coefficient.
10 NACA TN No. 1299
In the region of the critical Mach number Mcr a pronounced
change exists in the flow, hut whether an actual separation of flow occurs seems to depend on both the type of airfoil involved and the angle of attack at which the critical Mach number is reached.
When, as in the teste of the wing, a variation in Mach number is accompanied by a variation in Beynolds number, the explanation for the variation of CT is not readily apparent. The most
max significant point of the variation of C, with Mach number and
'max Beynolds number is the peak value attained; hence, the determining factor or factors of this point will be discussed first. The peak values of C, may be determined by the critical Mach number,
Tnax by the Beynolds number at which the entire boundary layer Is turbulent, or by both.
The maximum pressure peaks encountered in tests cf the wing have been plotted against Mach number in figure 13. The curve of P„_ cr against Mach number Is also shown- The intersections of the curves of maximum pressure coefficient with the curve of P occur at
free-stream Mach numbers at which the peak values of C.
obtained in force tests the peak values of C.
. wer« Tnax
(fig. 7)- The probability Is Indicated that for each tunnel condition occurred when the
critical Mach number had been reached. The possibility that the Beynolds number at which the entire boundary layer is turbulent would be reached in these tests is excluded. The effect of increasing the magnitude of Beynolds number for a given Mach number, however, by changing from the Langle.v lö-foot high-speed tunnel condition (reference 5) to the Langley 19-foot pressure tunnel condition of p
19' 33 (oee fig. h)
and, consequently, CL
increased the peak pressure coefficients
but reduced slightly the free-stream max
Mach number (fig. 13) at which the peak value of C Tnax
occurred.
When the flaps are deflected, an increase in pressure coefficient along the chord result? and this increase causes an increased maximum lift coefficient; but because of the increased pressure peaks, the critical pressure coefficient Is reached at lower free- stream Mach numbers with flaps deflected than with flaps retracted-
The foregoing discussion of figure 13 is based on consideration of the maximum pressure coefficient that occurred on the wing.
WvZk TM ?Jn. 1D99 11
Visual observations of the 3tall pattern (fig. 14) Justified the discussion of the stall witii rei'erenco to only one point on the wing. The stall studies were made at several Mech nurbers end revealed an abrupt simultaneous stall over the entire surface of the wln^.
The decrease In C. Tnax
after the peak value has teen reached
Is due to the fact l-hat the critical pressure coefficient diminishes (fig. 13) aa the airspeed is increased beyond this point. A.? the airspeed is increased, therefore, the critical pressure coefficient is reached on the wing at progressively lower angles of attack; early stall is thus precipitated and, consequently, lower values of maximum lift coefficient ere obtained. The principal contribution of Reynolds number toward increasing C as previously pointed
out, lr. its effect in lncreaslnf the engle of attack at which the wing stalls; hence, when the critical Mach number limits the peak value of Cr the effect of a further increase In Reynolds
max number is markedly reduepd. The data from tho present tests (figs. 7(a) to 7(c)) are too Limited to de'^erolno whether at very hifjh airspeeds CL is affected at all by Bc^ncldp nanber. Flight
"max tests of an airplane equipped with a ving of NACA S6-eeriet; airfoil sections (reference 9I have shown that fit values of Mach nunber in exuesi; of 0.!?0 the ei'fecte of Reynolds number arc ne^li^ible. The value of Mach number at which the Reynolds nuaber wJJl become negligible will probP-lly depend on the particular airfoil involved.
The increase in C. hnax
before the critical Mach nunbor Js
reached is due almost entirely to the chanpe in Reynolds number; that is, the natural transition from laminur to turbulent boundary layer with increasing Reynolds number allows higher angles of attack to be reached before the wing stalls. Wien the values of C, I,
cempured it equal Reynolds numbers (figs. 7(a) to 7(c)), .it is neen that, in the ran/;e belov the peak value of CT lower values of
max C- ere obtained at a tunnel pressure of 14.7 poundE per square max
inch absolute than are obtained at a tunnel pressure of 33 pounds per square inch absolute. The values at p , • 1J*.7 are actually at
19 higher Mach numbers than are the values at p10, => 33 (fig. k).
A plausible explanation of this loss in lift due to the increase
32 HAC, n No. 1299
In Mach number may be that a7 though the leading-edße prusrures at lift coefficients below tho ttall are almost the Barne, tho transition from laminar to turbulent boundary layer ir delayed by the increased Mech number aud, since the win^ tested exhibited laminar separation, the win« will stall at slightly lower angles of attack. This rearward movement of transition, because ct tn increase in Mach number, has been determined for the low-drau ron£S at the Ames laboratory, end a continuation of tho discuenior. to Cr appears rearonr.ble from tho results obtained in the present "max
tents.
Reference 1 presents a method for pradicting incremental changes in the maximum lift coefficient that occur as a result of the difference between wind-tunnel and flight Reynolds number. 2ecanee the flight value of Mr.ch number will usually be somewhat hi.jher than that used as a baeie for the method of reference 1 (MQ a C'.oS),
the application of tlict method for the prediction of flight value*, of CL
max •-. hlf:h,!' v tine : '
from tests at low Eeyncldc number will probably yield
C. - oven 11' tlie critical Mach number has not ijnax
been reached.
The preceding discussion has dealt with tho effects of Much number and Reynolde number on tho maximum lift coefficient of a wing which ha3 a» abrupt dtall precipitated by hich peak values of leading -edge preai?ure. The characteristics of a wir.3 with lower peak values of lead Li; 3-edge pressure and u more cou^lei: stall may be materially different. If a wing exhibits a stall produced by trailin3-ed(je separation, the leading-ed/jo pressures Hay be low enough to allow a rathor hi^h free-ntream Mach number tc be reached before the critical pressure coefficient is encountered- In Buch a case, the Reynolds m-jriber at which a completely turbulent boundary layer oiirtr ma;'be reached before the critical M?ch number it- attained. Tho flapn-retracted leadüng-edKO-rou/^hnafe confi;^iration (fig. 7(d)) IK an example in which the coinpletj boundary layer is turbulent. Thero is very little change in Cr through the
Reynolds number ran.-i.e. The peek leading-ed-je preesrrer furthoi'inore have probably been reduced so that no critical Mach number it indicated in the range of the present tents• The value of CT
'max at the lowest Mach number and Reynolds number for p. , = 1^.7
causes the curve in figure 7(d) to have a sharp drop in the low Reynolds number range. The shape of the lift oi'rve for thin test condition (fl«. lj(s)) at C, is such as to suggest the
,Lmax
HACA T!I No. 1299 13
possibility of premature stall although no cause Is evident. Because the drop In the curve of C. against Reynolds number occurs
max through a large part of the complete Reynolds number range and is a result of this one test point, the curves have been shown dashed between this test condition and the next highest test condition.
CONCLUDING REMARKS
On the basis of the wind-tunnel investigation made to determine the effects of Mr.ch number and Reynolds number on the maximum lift coefficient of a wing of NACA 230-series airfoil sections, the following conclusions may be drawn. These conclusions appear applicable to other wings which exhibit an abrupt stall precipitated by high leading-edge pressures.
1. The peak values cf maximum lift coefficient are determined by a critical Mach number which Is attained at relatively low free- stream Mach numbers (approx. 0.20 for the flaps-deflected configu- rations and O.25 to 0.30 for the flaps-retracted configuration).
2. The values of maximum lift coefficient are increased when the Reynolds number Is increased but the critical pressure coefficient (critical Mach number) is reached at lower free-stream Mach numbers.
3- The increased pressure peaks that result when the flaps are deflected cause the critical pressure coefficient (critical Mach number) to be reached at lower free-stream Mach numbers than when the flaps are retracted.
k. After the critical pressure coefficient (critical Mach number) has been reached, the value of maximum lift coefficient is appreciably reduced by further increase in Mach number and there is an indication that the effect of Reynolds number on the maximum lift becomes markedly reduced.
5. The value of maximum lift coefficient before the critical pressure coefficient (critical Mach number) is reached is almost entirely dependent on Reynolds nualber. but even in the low Mach number range, Mach number effects should not be neglected. Any method, therefore, that is utilized to predict flight values of maximum lift coefficient from wind-tunnel data by accounting for a Oifference in Reynolds nuuber and neglecting a difference in Ifech number nay give erroneous results.
Lan^ley lianorial Aeronautical Laboratory national Advisory Committee for Aeronautics
Lancley Field, Va., :iovomber 1?, 19h6
Ill NACA TN No. 1299
KEFEREHCEE
1. Jacobs, Eastman N., and Sherman, Altert: Airfoil Section Characteristics as Affected by Variations of the Eeynolda Number. NACA Bep. Mo. 586, I937.
2. PinXerton. Bobert M.: The Variation with Reynolds Number of Pressure Distribution over an Airfoil Section - NACA Bep- No. 6l3, 1938.
3. Stack, John. Fddzluk, Henry A., and Cleary, Harold E.: Preliminary Investigation of the Effect of Compressibility on the Maximum Lift Coefficient. NACA ACS Feb. I9U3.
k. Muse, Thomas C: Some Effecta of Reynolds tad. Mr>.eh Numbers on the Lift of en NACA 0012 Iiectaiujular Wing in the NACA 19"Foot Pressure Tunnel. NACA CD Ho. 3E2&. 191*3.
5. Pearson, E.O. Jr., Evens. A. J., end West, F. E... Jr.: Effects of CoSpresalDillty on the Maximum 1 ift Characteristic.-, and Spenwiee Load Distribution of a 12-Foot-Span Fighter-Type Win.; of NACA 230-Series Airfoil Sections. NACA ACB No. 7.5G10, ISjk^.
6. Goldstein, E., and Young, A.D-: The Linear Perturbation Theory of Compressible Flow with Applications to Wind- Tunnel Interference. B-«: M. No. I909, British A.B.C., I943.
7. Sllverstein, Abe. and White James A.: Wind-Tunnel Interference with Particular Reference to Off-Center Positions of the Wing end to the Dovnwasft at the Tall. NACA Bep. No. 5^7, 19:5.
8. Lotz, Irmgard : Correction of Downwcsh in Wind Tunnels of Circular and Elliptic Sections. NACA TM No. 3Q1, 1936.
9. Spreiter, JohnR.. and Steffen Paul J.s Fffect of Mach and Reynolds Numbers on Maximum Lift Coefficient. NACA TN Ho. lOMt, I9W. •
NACA TN No. 1299 Fig. 1
£• ri
•.^
i
NACA TN No. 1299 Fig. 2a
tu
•-> u En
d
0 ..; •-» .5 7 «-J c :i o fcs a) kJ o
—i (—3 a
'i c. 1' CO H *->
.—H ..-< 0)
* B .~* :o cd W to
:• ••H
a
U -+-» •:•' (> to i v
:, 1
•.M «H
< !? n
S3 1 O '..» .S r-
i
.; •. !• P,
• r-t
[i.
NACA TU No. 1299 Fig. 2b
r a) r:- % c "•!
ö ••• • >
:' " >;• .:. i
-.'. s :
u i M
Pn
NACA TN No. 1299 Fig. 3
Figure 3.- Close-up of tube-transfer system used in tests of a wing of NACA 230-series airfoil sections in the Langley 19-foot pressure tunnel.
NACA TN No. 1299 Fig. 4
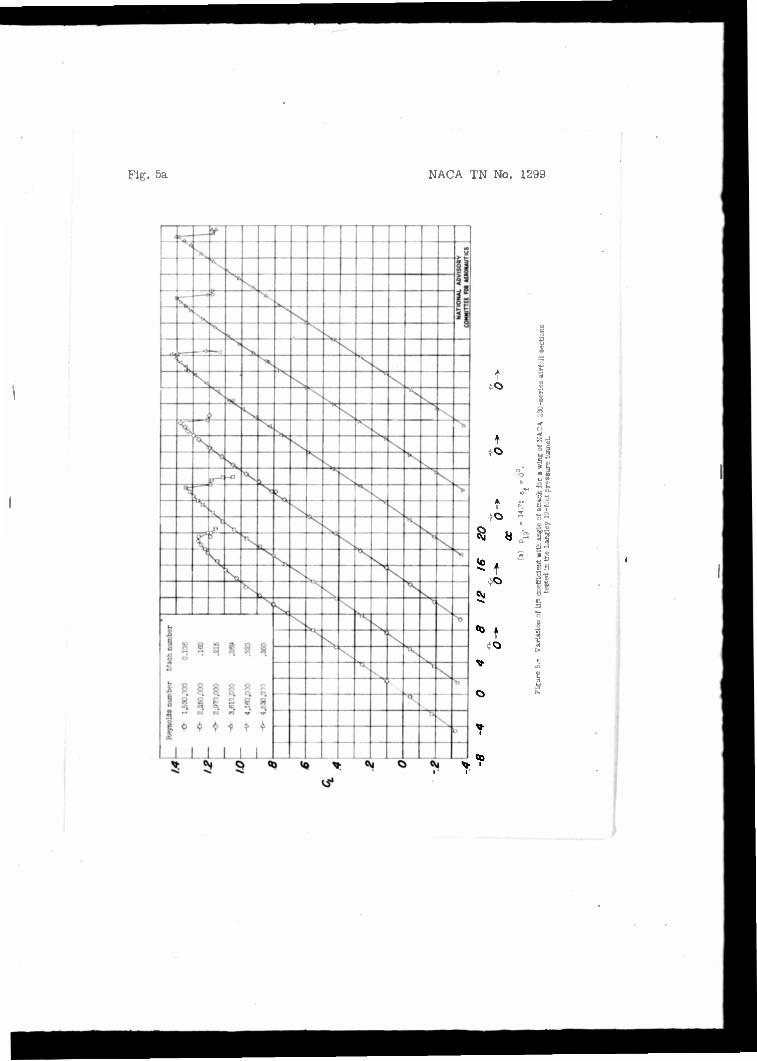
Fig. 5a NACA TN No. 1299
o
* f.
o if*' V< o ;"s flK
t *•: 8* fO = ... •-
• • •
8 »;= K <s * ;
•s. f ts >o
«VJ $
:•:
* f 1
o :- V in
I
NACA TN No. 1299 Fig. 5b
S . „
v ~
v • 1
. J - 'J. v • 9
M -*„ _ s . - §l s v
,k-. k i it a
v, ' ' - '. ii v.
V "" k- N
^ V s
N ' X ". ^ X
<« > N "
- Ai s 1 V sv
, . V N -•
N » V. X % "
';: 1
- s ., N ^x. Sj •>
• •»
V
•X- *. •. V • V
1 1 •
v- >. N X
\ N: - , N N » a
V s^. *\ " ••
, X \ \ , '« 'N
i : N^
. s e • ssaassassa ;, ki I °
•
• CM* « co V m ua «T t^ t^ •
>
!
I
•
t
f •to
*1 ••• T H
*M T
to
V
*» -«2 «M <\l
d1
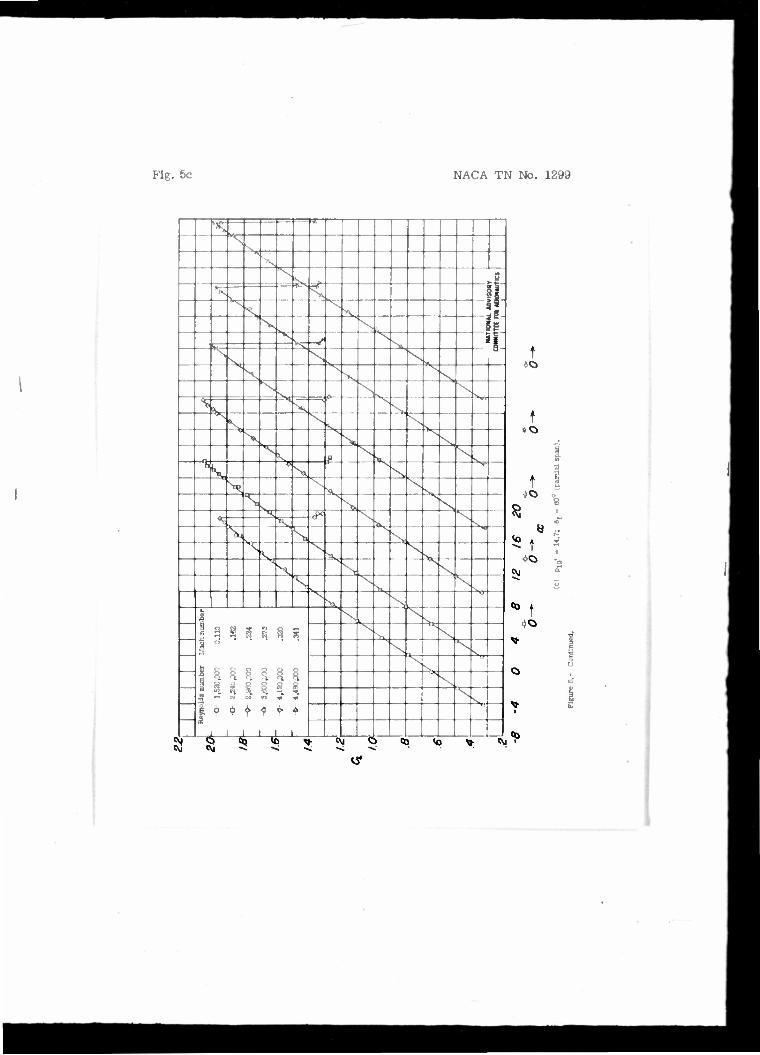
Fig. 5c NACA TN No. 1299
T. r— •
'• >
-, i| '••• . K
- V M
—•• s 'I
h t
••
•
% ». —.
" t V
' r1 1 s lv s
•
's N * e
,, »« t i \ su
'•
- s . 's
••
•>-
\ k >. •4 5 's s v ̂ ACS '* vs
s • CM
v. •1
•. Co A 1 1 § § a E § s 1 °
4 U U ä 5 I § s § § § S ^ H M N n * *"
j i i i i i
s. >.
CO
0 i j
0 s > s •^
h 0 J C > * > « > * cv T
NACA TN No. 1299 Fig. 5d
I I I ft
CM
_ttt!gtttMi g S 8 8 |_ 8 ^ 8 § 8 sj
to tO C-
) % <q > £ OJ

Fig. 5e NACA TN No. 1299
t
**• •
•_
Ai - \
'N "s v
S -.
•*•'
N •••
V
k*
f --..
p - *"
S i. s ̂ ' \ \
s s. v N. s \ k.
N .. Mj)
;
s. • sT,, '
•-
N s
, h"-
•-.
^ '„ N V v* N s
N CD M C3 US O CD s s S3 a s g
USIU 1 * 1 §. § * *-» N « CO if ^>
* * * t fr 4
s , '••,
s, s '-4
•••
• IV
1 2* ft * s
1
> <t ) « > X> ft ' c > <* 1 <Q
n
äs
ig t :
* t
cvi y
w
NACA TN No. 1299 Fig. bf
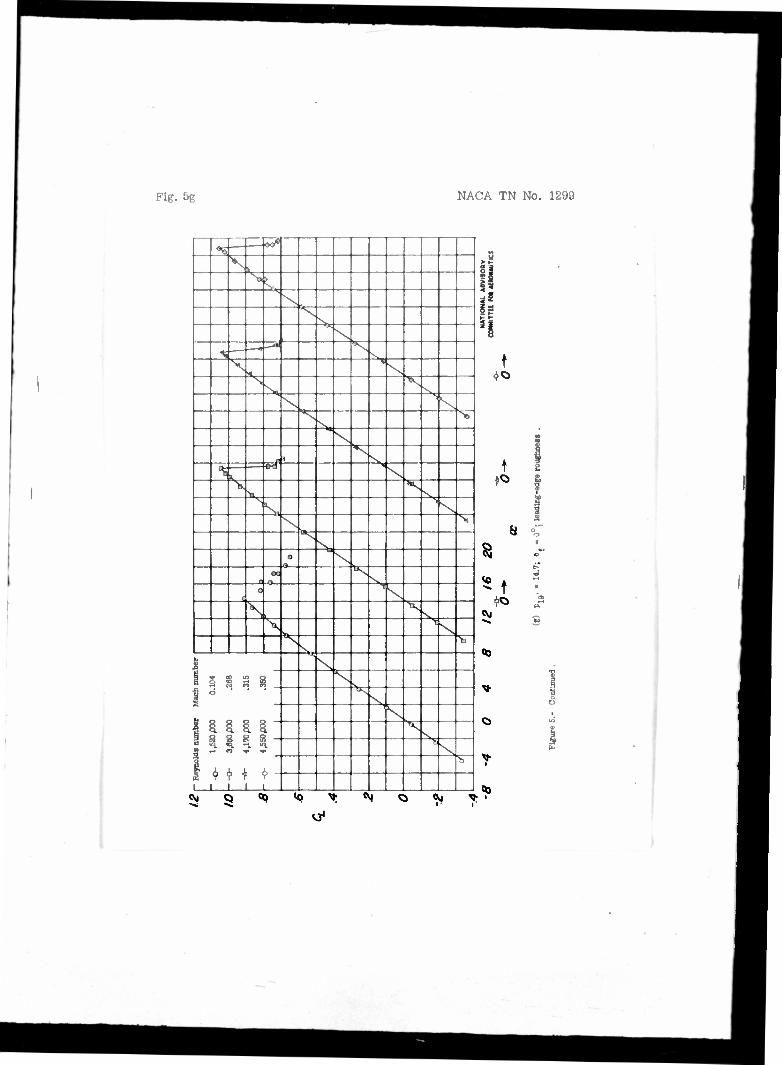
Fig. 5g NACA TN No. 1299
•? • ./
v J.
"XI N
V s. •> k s
i
fj . <HT1
V N
0
OB
^ u
0 \ s X
SL "t \ V
I I § 1 3 i i d ' ' a
1 1 1 1 \ I S S 8 S B „V fU <••* li | - „" , ,
;
1 V s * N
\>
1 . r t 1
s
t
t
<M 5 ey <N M:
$
t
% V
I
NACA TN No. 1299 Fig. 5h
a 3 pa pj
gsssssaas H. ifj, q ic T» "i "i, *« '"• » *• us in in «> «T r- t*
<J> } ^ * ^ rj * « 11 <\j o 00 *o
;1
i. 1 a
*
tf
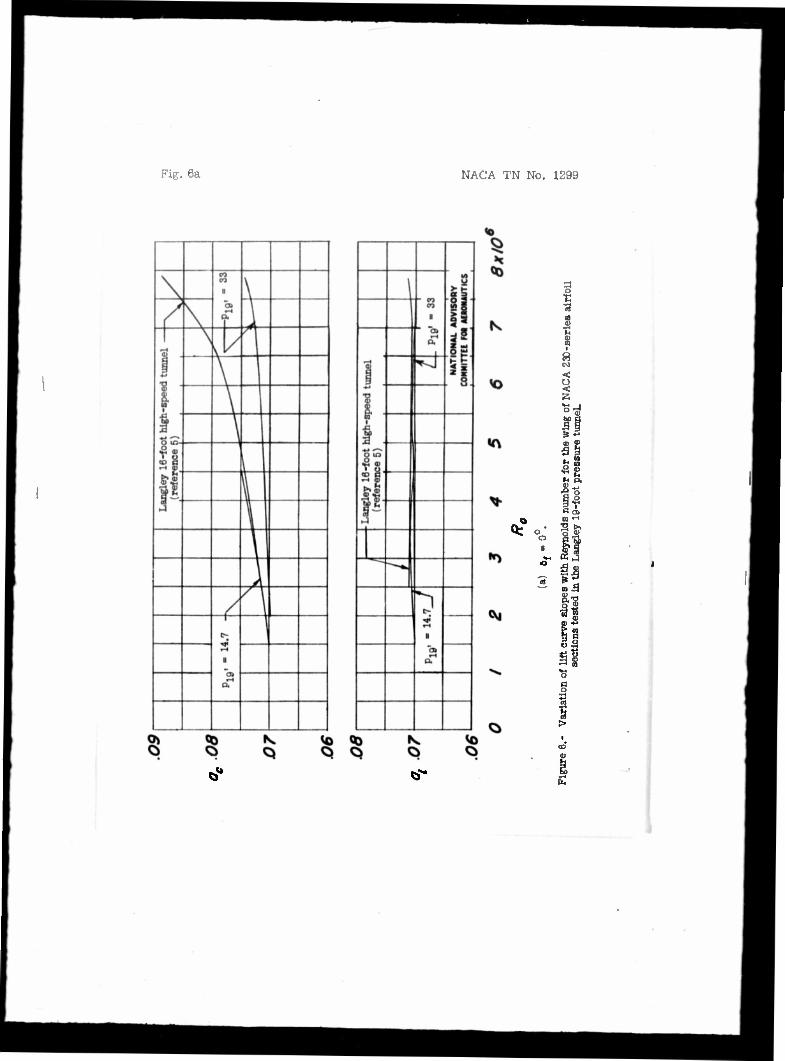
Fig. 6a NACA TN No. 1299
o o
a~
ö- ^
NACA TN No. 1299 Fig. 6b
J
NA
TIO
NA
L
AD
VIS
OR
Y
CO
MM
ITTE
E
FM
AER
ON
AU
TIC
S
r* r ,—•»
n to
i • c5
a
rH Pi
li
o. • -
\
H 1 r --*
i
rH
II
CD i-f
a.
0»
a.
1
vo
«r>
I £ 8.
1 I o"* o
i
*>
§ K Q tf
N Q
Pig. 7a NACA TN No. 1299
1.6 ' : - 33 r 1.4
,, V y' >
— Laagley 18-foot hit
cL 1.2 ' \ • V L_
10
.8
24 IV - 33 J_
"mu 20 A ' / — l.angley 16-foot hlg
(reference 5) ^ , ,
ie \
i i 1 1
O I .2 3 4 .5 .6 7
t.6
1.4
10
8
24
20
16
12
V-33 "•
4 Laagley 10-foot hj (reference 5)
gh-ftpeed tunnel
-' "" V 1 x-
*/•»
\ <V ^ \ \
V V
-speed tunnel
PI9, - 33 -H~H /
III T" — Laagley 16-foot high
l —
"• ff •v-v. •• :-
t: p:„. - M.7
• cm
«tlOMl «OV'S «um rat m>
Mr JUT«
l <. ?
•
J 1 f
*
r 6 7 8x10*
(a) of-0w.
Figure 7.- Variations of maximum lift coefficients and maximum angles of attack with Mach number and Reynolds number for wing of NACA 230-series airfoil sections tested In the Langley Id-foot pressure tunnel.
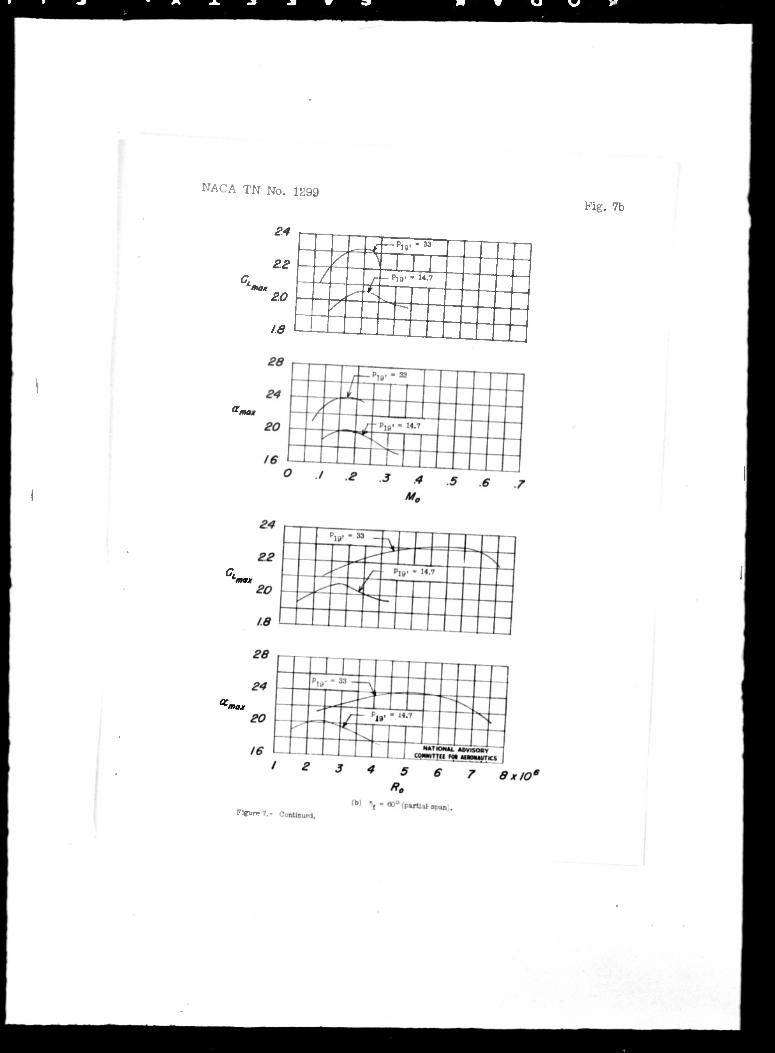
NACA TN No. 1299 Fig. 7b
S4
ZS
ao
18
.'
/ r _ P19. - 14.7
/
Figure
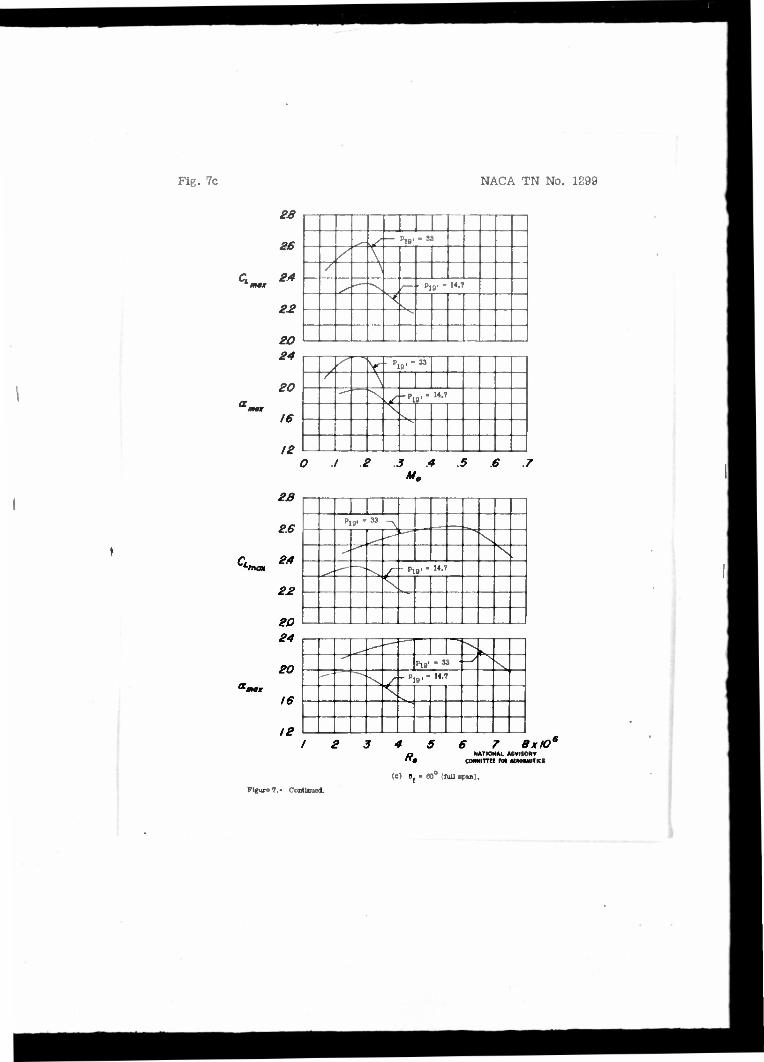
Fig. 7c NACA TN No. 1299
28
26
22
20 24
20
um 16
12
28
2.6
'/na«
22
2.0 24
,.-' — Pig. • 33
/ \ / \
' • »»• • »•7
/ , r "• \ • v - M
/
\ ^ -pi .. -1«
^J
./ * J .4 .5 .ff
PjB, - 33 ^
/ - p19, - 14.7
'
am»t
20
16
12
]—*-. \ •
• •
p19. - 33 ' r • •
-'»•
12 3 4 5 6 7 8xl06
NATIONAL ADVISORY COMMITTEE FM AlHHUUTK S
(C) Q( - 60° (fullapu).
Figure ?.- Continued.
NACA TN No. 1299
12
CL 1.0 lman "
8
Fig. 7d
P]a, - 33 - -n . - **" "IF"
v - pi»- • • 14.7
'ma*
20
16
12
\ 1 ; IB' " 33 P - :C
V- p19, - 14.7
0 ' * * 4 .5 .6 .7
1.2
8
P18. - 33 - ~\\ A
.-- - P,„. - 14.7
1
20 P,8, -33 _
~\ amox 16 i
\
12 \ - Pi9. - 14.7
1
Figure 7.- Concl
i
i LI.
) J
id)
r
8f
4
/P
r
; 1».
i
lint; •"!)'•
CO
roil
NATi MlTt
0UM
MM n fo
n.
P
»DVI
UM soov «jut
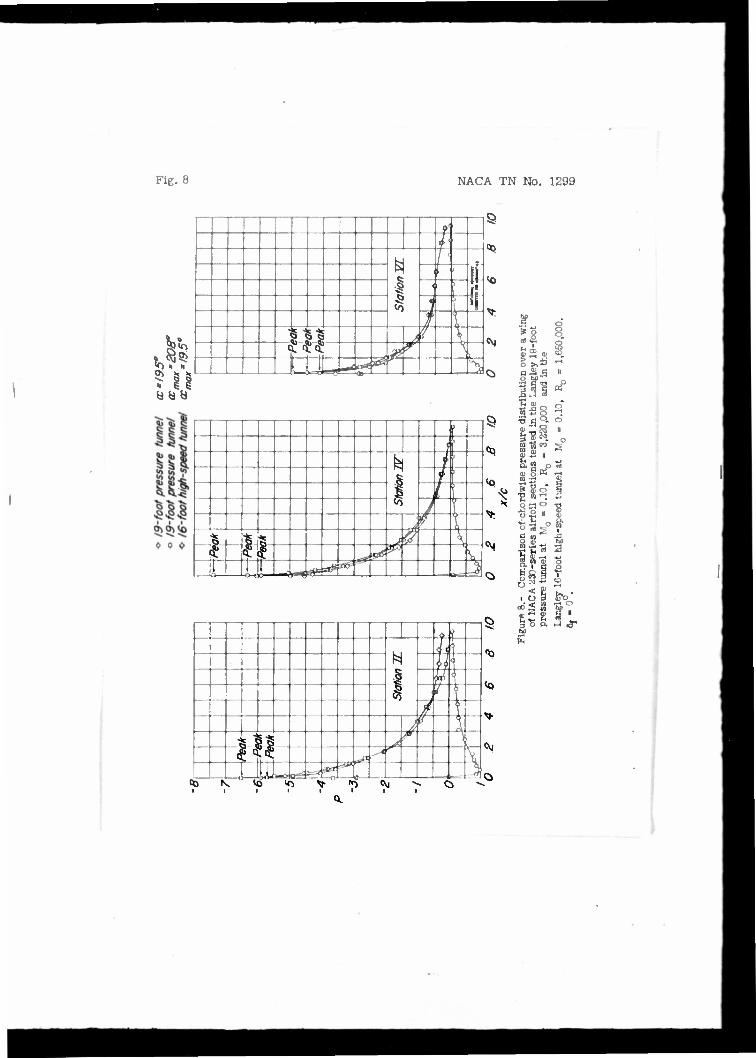
Fig. 8 NACA TN No. 1299
SD" "
?' /
N
1 3-
1 f < • 1
] f - V L C lt s
c L<£ *••
'*•
•— JL — hi£i- ?
tö
<o
«M
N 5/ •
j 1 1
y
-$• Cl, s •
? \ 1 . ! —s »* fis u . 3
1 N
¥'•'••' <H* _~ ta •' H - '
* N t ^ a u 1 \ h M •> 0 J «. c i >»
a
w to w in S
,'•
S3
C • • O ra O f
•SI I
£ i s
' Ei
gas 1 ü 3
g o a M
NACA TN No. 1299
<0 hi,
? ii
it!
Ill III1
Fig. 9
U
HI (
*" JU >
i » \ . ( 1. i M
& -1
' li 2 > <
• i 1 1
• •-• - \
5
0 0« 9
*
1 Vt)
^> . £ 1 |
Op
if i-rjj-ij U r^- <- .,",- a<J
Q * Ö
9
N
i '
to
^ j; 1 <Nj Q. J*1 ••
, ' .- «t « , •' C> c c » TT 5 i* u 3 u •i s h h ̂ 0 i •s I. i %
I- I*
ra i ' •
8S «
<U O w • w ^ V- V -'
"S" " w " §- IS Hi W 01
gal ; <g i o 3
g5g BOA
B
t°o
J «r 11.
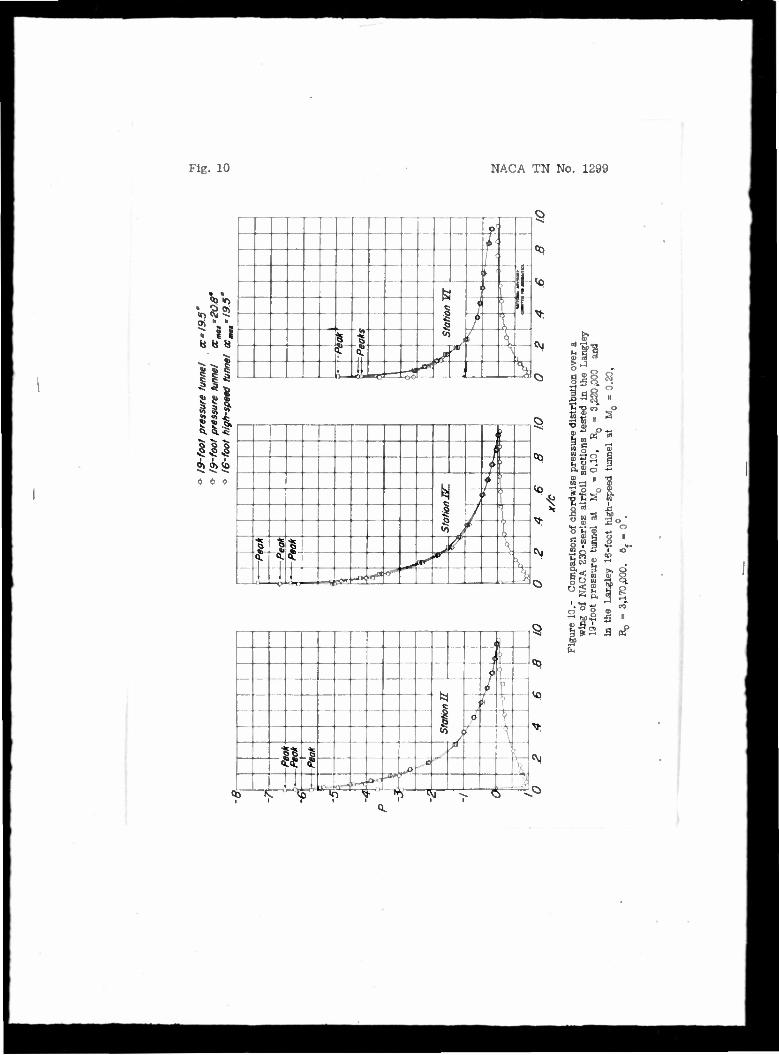
Fig. 10 NACA TN No. 1299
$ <i
ill 0 0 0
o
i
NACA TN No. 1299 Fig. 11
o to
0 o T> to
•i n
JJ 1 1 1
^ *? s g 1 | 9» n ^ * I.
f i i - i i
I •
$ 1 1 •t
f 1 -•*> r
/! >: > •> \
to
to
£11 1 1 .' ^
^J si! •5: <> * «
^.
- h
i I
-V b 1 - —
1 jgS
n< '•'•• > ^
• - i Q
a Sä
•
<Y>
I ; to ....
<J ,
•* | ^
O
<\l 1 ai'"1. i g
Q> 0) tf r> ̂ <j 3 IR * *• f. > '? •4 »• i. i
lag
a* • " a? sa .
£ r;. •S M 'S
." "", 'u '•? ~ tt) ß
,2Q*J
t. ^ - •' ;•.
gun
I* p.
~'°8 ,. .r: ! S S3
,•.:
bo ,
a s
5 ' Bo?
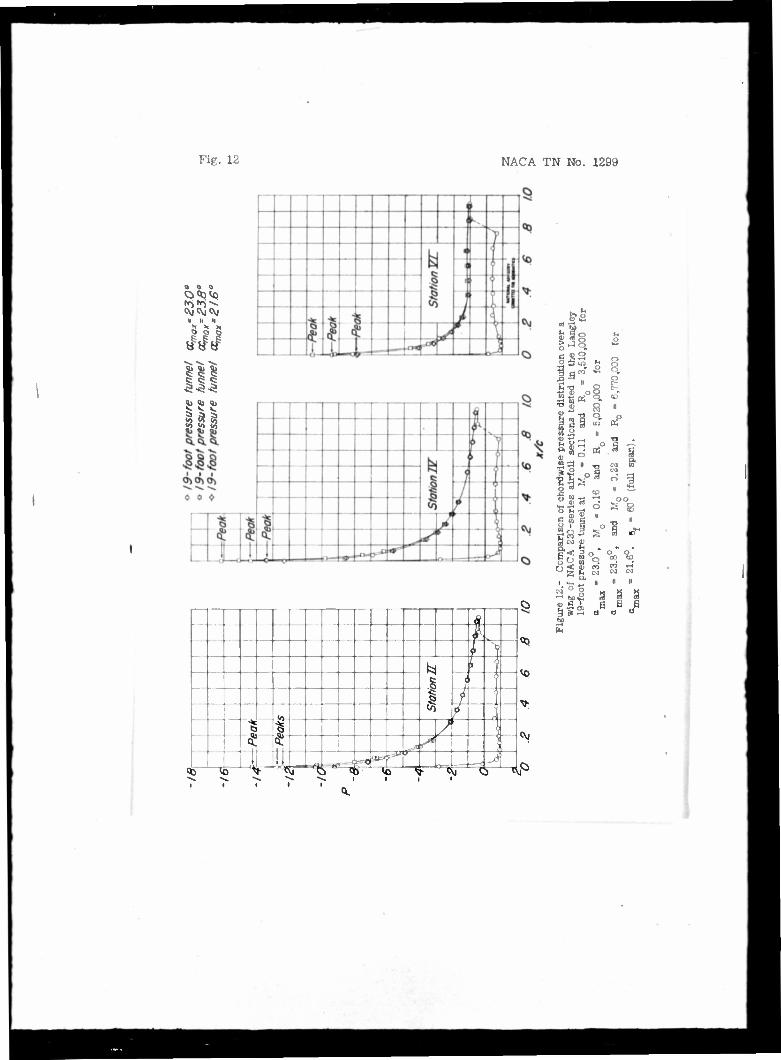
Fig. 12 NACA TN No. 1299
«CO
i
y HI t c ^
s» *> <R
* 5?
f , I »q
1 o
J Uj
9 •
— •§ ' : •^ •5! « •-'
I '•' , i o ... ^ <*> ll 3 ^ h c VI 's i * 0 S <l 3 S h 0 VI <s i 0
. M
±3 to af ' o o<
8 "-a w .^ flJ -^ -j
» a ii ,
!fjs°
.OS"
a 5> 2
"a r _ ° o M ^i oo
2 g
r * I'- t
s a a s
a a
NACA TN No. 1299 Fig. 13
/x. NATIONAL ADVISORY COMMITTEE FM AERONAUTICS
Figure 13.- Variations of maximum wing pressure coefficients with Mach number for a wing of NACA 230 -series airfoil sections tested in the Langley 19-foot pressure tunnel.
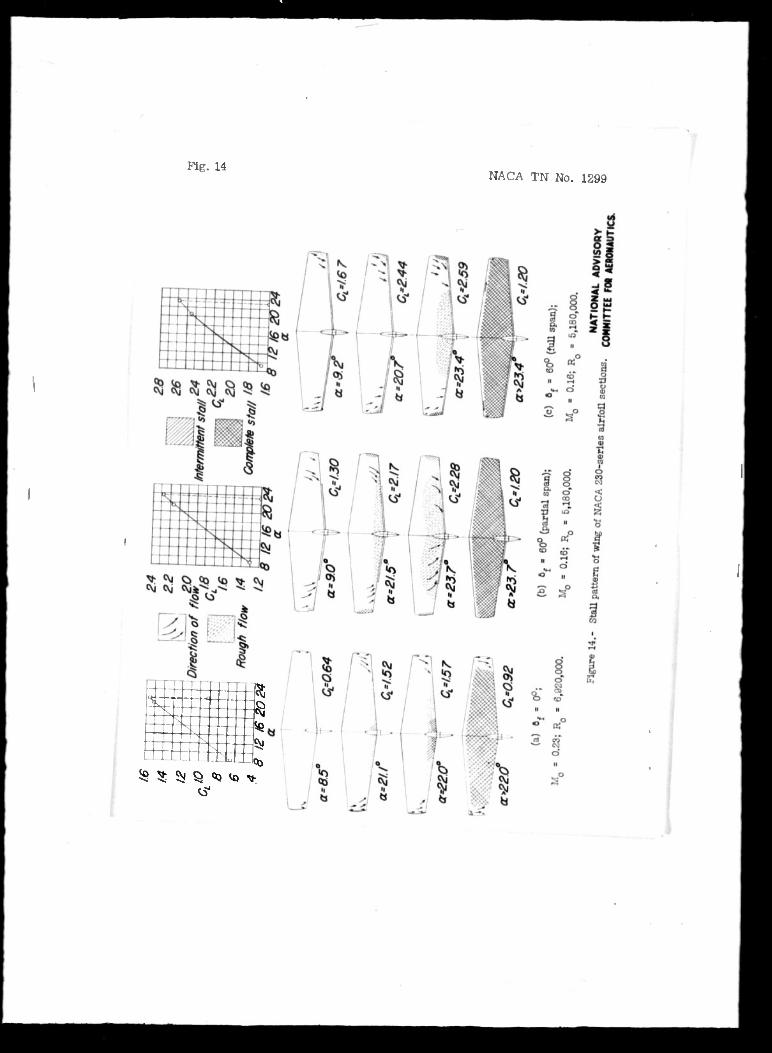
Fig. 14 NACA TN No. 1299
' T" I5j — sä
-r-^ ' m ^ -. iß ^ _
ZLZ: ^ TrmtitlJdflo $ S: ^ § <t) <o >
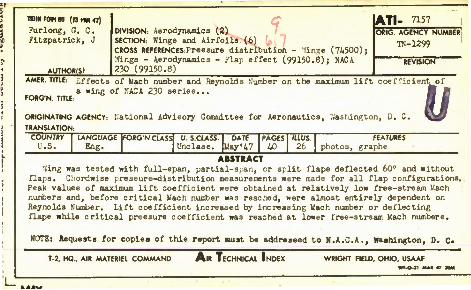
isowwies {am Furlong, G. C. Fitzpatrick, J
AUTHOR(S)
•1 DIVISION: aerodynamics (2) SECTION: Wings and Airfoils (6) CROSS REFERENCES: Pressure distribution - Vinas (7i500); '.Yings - aerodynamics - Flap effect (99150.8); NACA 230 (99150.8)
ATI- 7157 ORIG. AGENCY NUM8ER
TN-1299
AMER. TITLE: Effects of Mach number and Reynolds N'umber on the maximum lift coef ficient^of a wing of MACA 230 series...
FORG'N. TITLE:
ORIGINATING AGENCY: National Advisory Committee for Aeronautics, Washington, D. C. TRANSLATION:
u COUNTRY
U.S. LANGUAGE FORGN.CLASS U. S.CLASS
Eng. Unclass. DATE
VUy'i7 PAGES ILLUS.
26 FEATURES
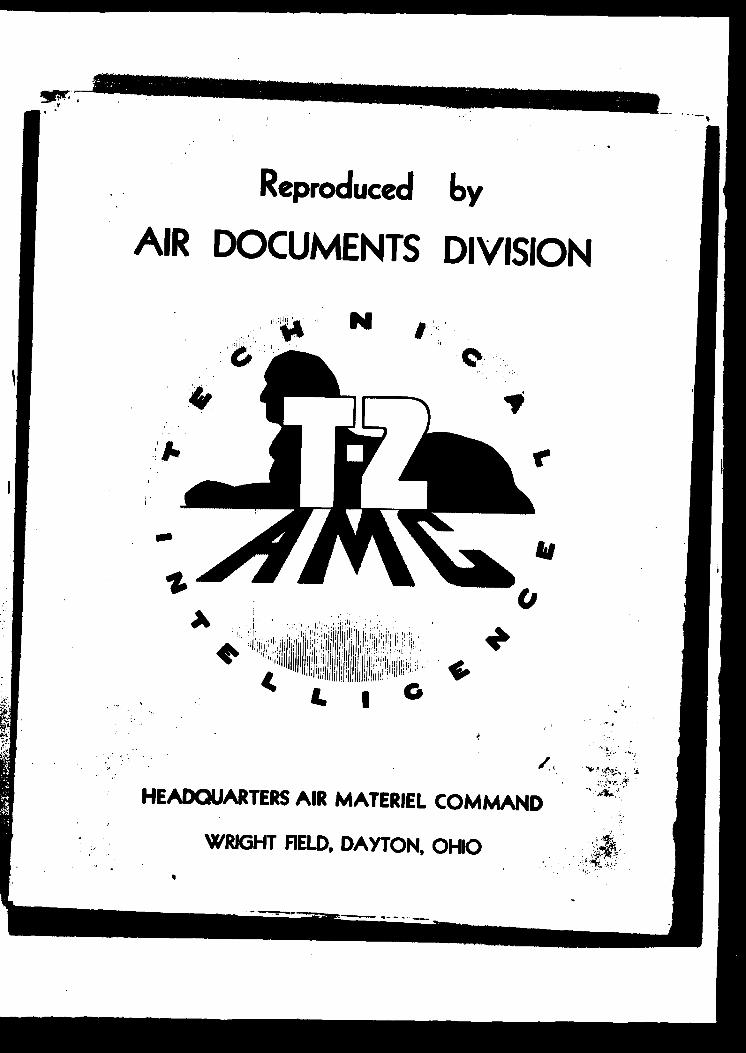
photos, graphs ABSTRACT
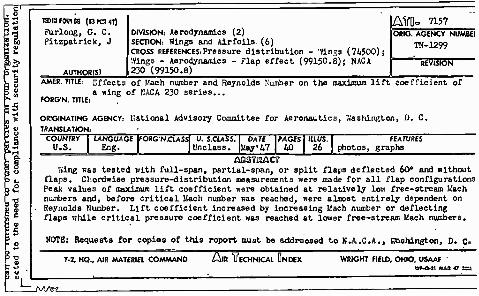
'.Ying was tested with full-span, partial-span, or split flaps deflected 60° and without flaps. Ghordwiae pressure-distribution measurements were made for all flap configurations. Peak values of max.1 mum lift coefficient were obtained at relatively low free-stream l£ach numbers and, before critical Mach number was reached, were almost entirely dependent on Reynolds Number. Lift coefficient increased by increasing Mach number or deflecting flaps while critical pressure coefficient was reached at lower free-stream Mach numbers.
NOTE: Requests for copies of this report must be addressed to N.A.C.A., waehington, D. C.
WRIGHT FIELD. OHIO, USAAF WF-O-il MAI 47 MM
, HO., AIR MATERIEL COMMAND AlR TECHNICAL INDEX
I raraFoaes (ntet«) Furlong, G. C. Fitzpatrick, J
AUTHOR(S)
DIVISION: Aerodynamics (2) SECTION: Wings and Airfoils. (6) CROSS REFERENCES. Pressure distribution - 'Yings (74500); '.Kings - Aerodynamics - Flap effect (99150.8); NACA 230 (99150.8)
A170- 7157 ORIG. AGENCY NUMBEI
TN-1299
FORG'N. TITLE
Effects of Mach number and Reynolds Number on the maximum lift coefficient of wing of MACA 230 series...
ORIGINATING AGENCY: national Advisory Committee for Aeronautics, '..'ashington, D. C. TRANSLATION:
LANGUAGE |fO«G'N.CU5S| U. S.CLASS Unclass.
DATE liay'47
PACK 1U.US 26
FEATURES photot, graphs
ßasraaar Wing was tested with full-span, partial-span, or split flaps deflected 60° and without
flap3. Chordwise pressure-distribution measurements were made for all flap configurations Peak values of maximum lift coefficient were obtained at relatively low free-stream Kach numbers and, before critical Mach number was reached, were almost entirely dependent on Reynolds Number. Lift coefficient increased by increasing liach number or deflecting flaps while critical pressure coefficient was reached at lower free-stream Mach numbers.
NOTE: Requests for copies of this roport must be addroosed to N.A.C.A., Bashington, D. C.
T-2. HO.. AIR MATERIEL COMMANO Ala VECHNICAL DNDEX WRIGHT FIELD, OHIO. USAAF ' »P^t-ll MAO 47 tta
_JW»2_