Embed Size (px)
Citation preview

DOCUMENT RESUME
ED 464 955 TM 033 886
AUTHOR Lee, Jaekyung; Coladarci, TheodoreTITLE How Adequate Are Adequate Yearly Progress (AYP) Measures?
Regression Artifacts and School AYP.SPONS AGENCY National Science Foundation, Arlington, VA.PUB DATE 2002-04-00NOTE 30p.; Paper presented at the Annual Meeting of the American
Educational Research Association (New Orleans, LA, April1-5, 2002).
PUB TYPE Numerical/Quantitative Data (110) Reports Research(143) Speeches/Meeting Papers (150)
EDRS PRICE MF01/PCO2 Plus Postage.DESCRIPTORS Academic Achievement; *Achievement Gains; Junior High School
Students; Junior High Schools; *Regression (Statistics);Scores
IDENTIFIERS *Artifacts; Kentucky; Maine
ABSTRACTThis study explored the extent to which current adequate
yearly progress (AYP) indices reflect real change or a statistical artifact.The objective, in more specific terms, was to investigate regressionartifacts in evaluating schools' academic progress and explore methods toovercome their effects in developing AYP measures. Schools in Kentucky andMaine were studied, using eighth-grade achievement data from the two states'student assessments, the Kentucky Instructional Results Information Systemand the Maine Educational Assessment. Three different types of schoolachievement gain estimates were computed: (1) the 1-year gain measure; (2) a
2-year gain measure; and (3) a 3-year gain measure. Time-reversed analyseswere conducted to determine whether gain score really was a regressionartifact. Findings for both states show that higher performing schools tendto gain less while lower performing schools gain more. This illustrates thewell-known regression to the mean status phenomenon. Results also revealregression to the mean growth phenomenon. Schools that gained more in thepast tend to gain relatively less. The first force tends to make higher andlower performing schools appear convergent in their status, and the latterforce may make more and less improving schools appear convergent in theirgrowth. These two forces as statistical artifacts may confound AYP measuresand need to be addressed. (Contains 4 figures, 11 tables, and 9 references.)(SLD)
Reproductions supplied by EDRS are the best that can be madefrom the original document.
CDGOGo
Cy) Foundation. The views expressed herein are solely those of the authors.c=i
How adequate are Adequate Yearly Progress (AYP) Measures?
Regression artifacts and school AYP
Jaekyung Lee Theodore Coladarci
College of Education and Human Development
University of Maine
Paper presented at the 2002 meeting
of the American Educational Research Association, New Orleans
BEST COPY AVM 1BLE
We acknowledge that this research has been supported by a grant from the National Science
U.S. DEPARTMENT OF EDUCATIONOffice ot Educational Research and Improvement
EDUCATIONAL RESOURCES INFORMATION
CENTER (ERIC)6/This document has been reproduced as
received from the person or organization
originating it.
1:1 Minor changes have been made to
improve reproduction quality.
° Points of view or opinions stated in thisdocument do not necessarily representofficial OERI position or policy.
2
PERMISSION TO REPRODUCE ANDDISSEMINATE THIS MATERIAL HAS
BEEN GRANTED BY
TO THE EDUCATIONAL RESOURCESINFORMATION CENTER (ERIC)
1

2
1. Research Questions and Objectives
The reauthorized Elementary and Secondary School Act (ESEA), No Child Left Behind
Act, requires standards-based accountability for school systems receiving federal funds. One
major component of this accountability policy is to require states and school districts to gradually
demonstrate progress toward ensuring that all students are academically proficientas defined
by each statewithin 12 years. This policy requires developing measures to evaluate individual
schools' adequate yearly progress (AYP). Currently, there are substantial variations among the
50 states in terms of their operational definitions of AYP and, further, the data and methods
employed to develop AYP measures (CPRE, 2000).
The dominant design for studying progress of schools across the nation is by means of
successive-group comparisons (Carlson, 2001). This approach looks at the average achievement
gain/loss from one year to the next for successive groups at the same grade level (e.g., comparing
the average reading score of 4th graders in 2002 with the average reading score of 4th graders in
2001). Using this approach, one infers a change in the quality of a school or its programs by
looking at the performance difference between two groups of students. Inherent weaknesses of
this approach are initial group differences and mobility.
Hill (1997) has demonstrated that sampling error makes it difficult to determine which
schools are making AYP and which are not. Pooling data from multiple grades and/or years may
reduce these sampling errors, although more than three or four years of data may be required to
draw a valid comparison. Researchers also have found that successive-group comparisons can
produce results different from those based on longitudinal comparisons, where performance is
followed over time for the same cohort of students (e.g., Carlson, 2001; Dyer et al., 1969). And

3
as Linn and Baker (1999) point out, within-school changes in student body can covary with
changes in instruction, complicating the interpretation of AYP data.
Regression artifacts further complicate the evaluation of school AYP. Regression to the
mean occurs when we examine the difference between two imperfectly correlated measures.
Lower performing schools tend to improve their performance status more than higher performing
schools. In other words, a school's baseline score (i.e., where the school started) is negatively
correlated with the school's gain score (i.e., how much the school improved). We call this
phenomenon regression to the mean status. Further, when we attempt to look at growth at more
than two time points and examine growth in two adjacent periods, we may face another type of
regression artifact: regression to the mean growth. For instance, if we choose to examine change
from year 1 to year 2 and from year 2 to year 3, then the change from year 1 to year 2 will be
negatively correlated with the change from year 2 to year 3. It is particularly problematic when
one attempts to examine change in the growth between two periods: the "winners" in one period
may appear to be "losers" in the other (and vice versa).
The central research question that we explore below is the extent to which current AYP
indices reflect real change or a statistical artifact. Specifically, the objective of our study is to (a)
investigate regression artifacts in evaluating schools' academic progress and (b) explore methods
to overcome their effects in developing AYP measures. To date, little attention has been paid to
regression artifacts and their possible implications for AYP evaluation.
2. Research Methods and Data
Data
4

4
We examined schools in Kentucky and Maine. Early on, both states (a) established
student assessment systems to monitor their schools' academic progress and (b) made a greater
effort to align their assessments with the announced content and performance standards (Lee,
2000). We used 8t1 mathematics achievement data collected from the two states' student
assessments: the Kentucky Instructional Results Information System (KIRIS) for 1993-1998 and
the Maine Educational Assessment (MEA) for 1990-1998.
Figure 1 shows the distributions of MEA 8th grade math school scale scores from 1990
through 1998. MEA scores range from 100 to 400, with a mean of 250 and standard deviation of
50 in the 1985-1986 base year. Figure 2 shows the distributions of KIRIS 8th grade math school
accountability index scores from 1993 through 1998. The KRIS accountability index score is a
weighted composite reflecting the percentage of students at four different achievement levels (0
for Novice, .4 for Apprentice, 1.0 for Proficient, and 1.4 for Distinguished). Thus, KIRIS
accountability index scores can range from 0 to 140. Although the MEA and KIRIS use different
types of school scores for reporting purposes, their underlying test scores are both equated across
years so that we can see whether individual schools in each state have made academic progress
over time) While schools in both states appear to have made significant achievement gains over
the period, there is substantial between-school variation in the amount of progress made.
Methods
We computed three different types of school achievement gain estimates: (a) the one-year
gain measure computes the difference between two adjacent-year means (e.g., 1991-1992 gain =
a school's 1992 mean minus its 1991 mean); (b) the two-year gain measure computes the
I Like Kentucky, Maine also employed criterion-referenced school performance reporting since 1995 and, since1997, has calculated school AYP based on the weighted composite of the percentage of students at four differentachievement levels. However, we do not use these data in this paper because they are available for only an
5

5
difference between adjacent two-year moving average scores (e.g., 9091-9293 gain = difference
between the average of 1992 and 1993 means and the average of 1990 and 1991 means); and (c)
the three-year gain measure computes the difference between adjacent three-year moving
average scores (e.g., 9092-9395 gain = difference between the average of 1993, 1994, and 1995
means and the average of 1990, 1991, and 1992 means). We also conducted ordinary least-
squares (OLS) time-series regression analyses of the school performance data over the entire
periods, determining how the long-term trends compare with short-term gains.
Further, we conducted time-reversed analyses to determine whether gain score really is a
regression artifact (see Campbell & Stanley, 1963; Campbell & Kenny, 1999). In order to
remove regression artifacts from gain score, we conducted regressions of 1-year, 2-year, and 3-
year gain scores on their corresponding baseline scores and preceding gain scores, and obtained
residualized gains. As Cronbach and Furby (1970) pointed out earlier, the residualized gain score
is a way of removing the effect of pretest status from posttest score but it is not a corrected
measure of true change because the portion discarded may include some genuine and important
changes in the subjects (in this case, schools). Despite the limitations of residualized gain scores
(Cronbach & Furby, 1970), we incorporated them in our analyses to explore how they might
address regression artifacts and how this adjustment might improve the relationships among raw
gain scores.
3. Research Findings and Implications
Analysis of school means and their relationship
insufficient number of years. Also we do not examine any post-1998 data here because both states have used a newstudent assessment since 1999, rendering the earlier data incomparable.
6

6
Correlations among one-year school means of 8th grade math achievement are modestly
positive (see Table 1). The correlation coefficients are in the .40s and .50s for adjacent years, and
they become weaker for remote years. For example, the correlation between 1990 and 1991
means is .55, while the correlation between 1990 and 1998 means is .34. This indicates proximal
autocorrelation in the time-series data (Campbell & Kenny, 1999). These generally modest
correlations indicate that one-year school mean scores are not stable, and even diminishing
correlations indicate that the estimate of school performance based on one-year means may lose
its stability further over time.
Correlations among two-year school means of 8th grade math achievement are in the .60s
and .70s (see Table 2). The correlations among 2-year means are generally higher than the
correlations among one-year means, indicating that the former increases stability by combining
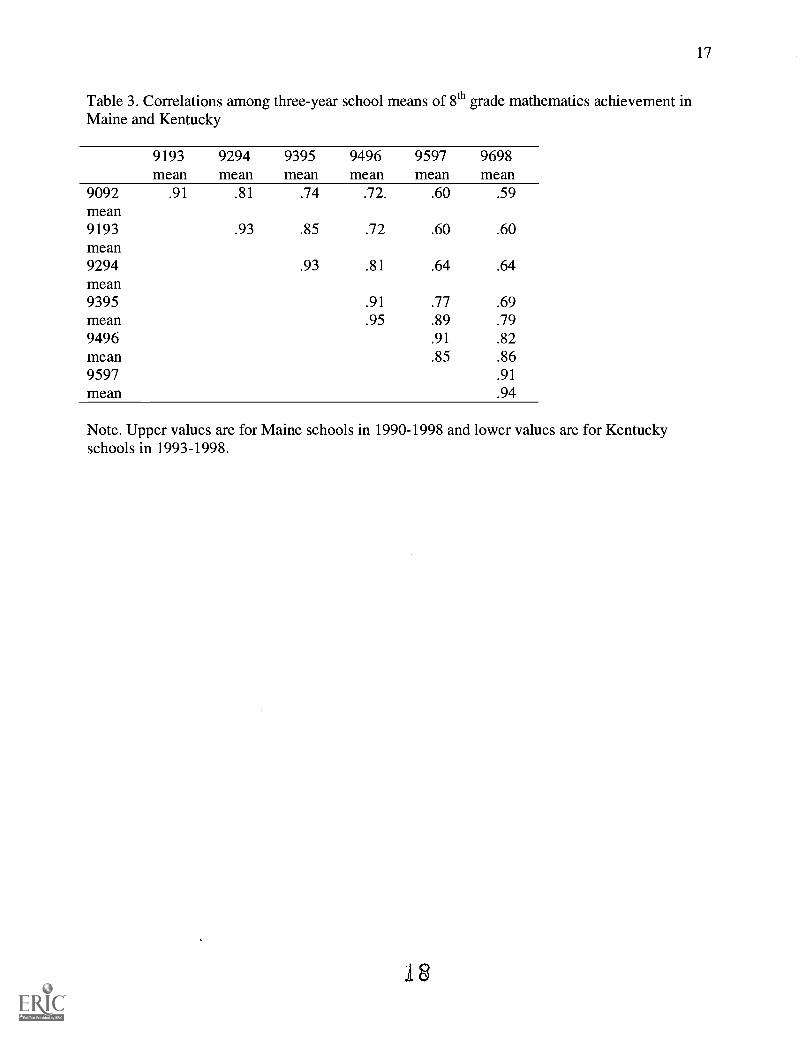
two years' data. Likewise, correlations among three-year school means of 8th grade math
achievement are also slightly higher than correlations among two-year school means (see Table
3). As one would expect, the correlations among two-year or three-year means are particularly
high when the two adjacent periods have common years. However, proximal autocorrelation still
prevails: the size of correlation coefficients drop substantially as the time periods grow further
apart.
Analysis of school gains and their relationship
Now we obtain three different types of gain scores for each school by computing
differences among one-year means, among two-year means, and among three-year means. In this
section, we examine the relationship among successive gain scores to find out whether the
schools' gain scores are stable over time. If current AYP measures are to serve as a reliable
indicator of school effectiveness, then school gains should demonstrate stability as evidenced by
7
7
positive correlations among successive gains. We understand that being reliable doesn't
guarantee the validity of the AYP measures used, but it should be one of necessary conditions for
demonstrating their validity.
Table 4 shows correlations among one-year gains. Correlations among yearly gain scores
are very low for close pairs remote pairs alike. In other words, schools that appear to gain more
this year do not maintain their gains the following years. The only exception is the moderately
negative correlation between adjacent periods with an overlapping year (see the correlations in
central diagonal line in Table 4). For example, the correlation between 9091 gain and 9192 gain
is -.45. This is likely to result from the fact that both gains share the 1991 score with different
signs, that is, plus 91 score in 9091 gain versus minus 91 score in 9192 gain. Aside from the
artifactual, inverse relationship between adjacent pair of gains, the overall patterns of
correlations indicate that there is no stability in the amount of yearly gain scores made by
schools.
The correlations among two-year gains are somewhat higher than the correlations among
one-year gains (see Table 5). However, the higher correlations are observed only when the two
periods involve common years. Moreover, the correlations are often negative for the same reason
as one-year gain correlations above. When we look at two periods with no common years (e.g.,
9091-9293 gain vs. 9596-9798 gain), the correlations are barely significant. The correlations
among three-year gains may be more stable (see Table 6), but they tend to have the same
problems as the correlations among two-year gains.
To examine a longer-term trend in schools' academic progress, we ran OLS time-series
linear regression to obtain the estimate of annual school gain over the entire period in each state:
9 years in Maine and 6 years in Kentucky. Among the 224 Maine schools with enough data for
8

8
this regression, 85 schools (38%) had statistically significant gain estimates. The average of all
224 schools' annual gain estimates is 7.72, or .12 standard deviations (based on the 1990
standard deviation). Among the 315 Kentucky schools with enough data for this regression, 140
schools (44%) had statistically significant gain estimates. The average of all 315 schools' annual
gain estimates is 5.34, or .47 standard deviations (based on the 1993 standard deviation).
In order to find out how well these different types of gains reflect the long-term trend, we
examined the correlations between the former and the latter. Table 7 shows that three-year gain
provides a closer estimate of the long-term academic growth trend than does two-year gain,
which in turn is better than one-year gain. The correlations between three-year gains and whole-
period trends are in the .50s and .60s. This indicates that AYP measures require longer intervals
of data to provide a better approximation of the long-term trend. Nevertheless, it is uncertain
whether an estimate of even a longer-term trend can provide a satisfactorily reliable and valid
assessment of schools' academic progress.
Regression artifacts and residualized gains
Correlations between initial status and gain scores are modestly negative (ranging mostly
from -.40s to -.50s), which suggests that lower performing schools tend to gain more than higher
performing schools. This might suggest the well-known regression to the mean artifact. We call
this type of regression artifact regression to the mean status, which we distinguish from another
type of regression artifact explained below. We conducted time-reversed analyses of gain score
to determine whether it really is a regression artifact. Schools were classified into three groups
(top quartile, middle half, bottom quartile) based on their 8th grade math mean scores in each of
two adjacent years, and their performance trajectories were compared.
9

9
Figure 3 illustrates regression to the mean status with 1996 and 1997 data from Maine.
Forward performance trajectories (solid lines) trace changes in average scores from 1996 to 1997
for three groups of schools that were classified based on their 1996 performance status: high (96
H), middle (96 M), and low (96 L). In contrast, backward performance trajectories (broken lines)
trace changes from 1997 to 1996 for three groups of schools that were classified based on their
1997 performance status: high (97 H), middle (97 M), and low (97 L). For both high and low
performing schools, backward trajectories turn out to move in the same direction as their forward
counterparts.2 For instance, high performing schools in 1996 perform less well (going
downward) in 1997, but at the same time high performing schools in 1997 also turn out to
perform less well in 1996. This time-reversed analysis strongly indicates a regression artifact.
Correlations among yearly gain scores for adjacent years are also negative (ranging from
-.30s to -.50s). Schools that gained more in the current year tend to gain less in the next year.
This suggests another type of regression artifact. The same is true of two-year and three-year
gains, which also show a negative relationship with adjacent year gains (i.e., either two-year or
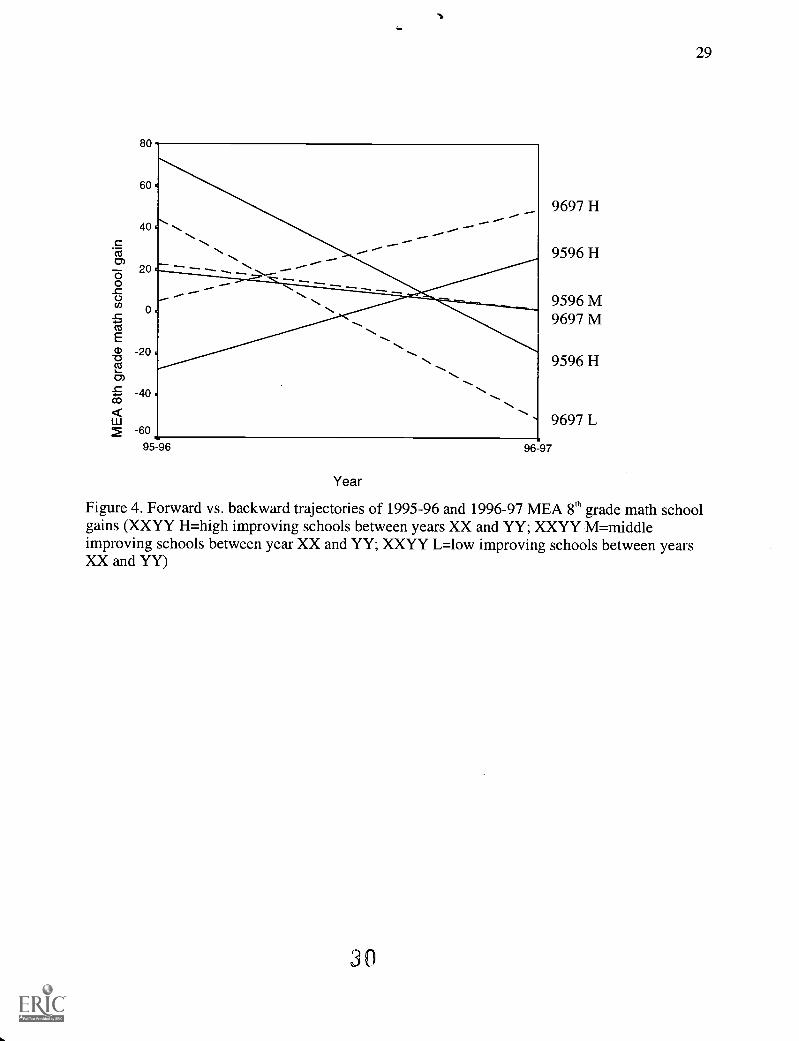
three-year). This type of regression artifact, which we call regression to the mean growth, is
illustrated in Figure 4. Here, schools were classified into three groups based on their achievement
gains in 1995-96 and in 1996-97. Once again, forward vs. backward trajectories for high (H) and
low (L) improving schools also turn out to move in the same directions. If there had been no
regression artifact, forward and backward trajectories would have followed the opposite
directions.
We found that the regression-to-the-mean-growth effect operates independent of
2 If backward trajectories are traced from 1996 to 1997, then they appear to move in the opposite directions toforward trajectories. But backward trajectories by definition should be viewed as moving from 1997 to 1996.
1 0

10
regression-to-the-mean-status effect. Further, the former is often as strong as the latter. For
example, Table 8 shows the results from two separate, multiple regression analyses of the 1995-
1997 data from Maine schools, one using regular (forward) regression and another using time-
reversed (backward) regression. For time-reversed regression, we used both current period's gain
and baseline score to predict previous period's gain. In this case, both forward and backward
regression analyses produce very similar results: The effects of both predictors are significantly
negative. If there had been no regression artifacts, the effects should have weakened substantially
or disappeared altogether. We conducted the same analysis for 2-year and 3-year gains, obtaining
similar results.
Given these prevailing regression artifacts, we attempted to obtain estimates of school
gains that are not influenced by these misleading effects. We ran a series of forward regressions
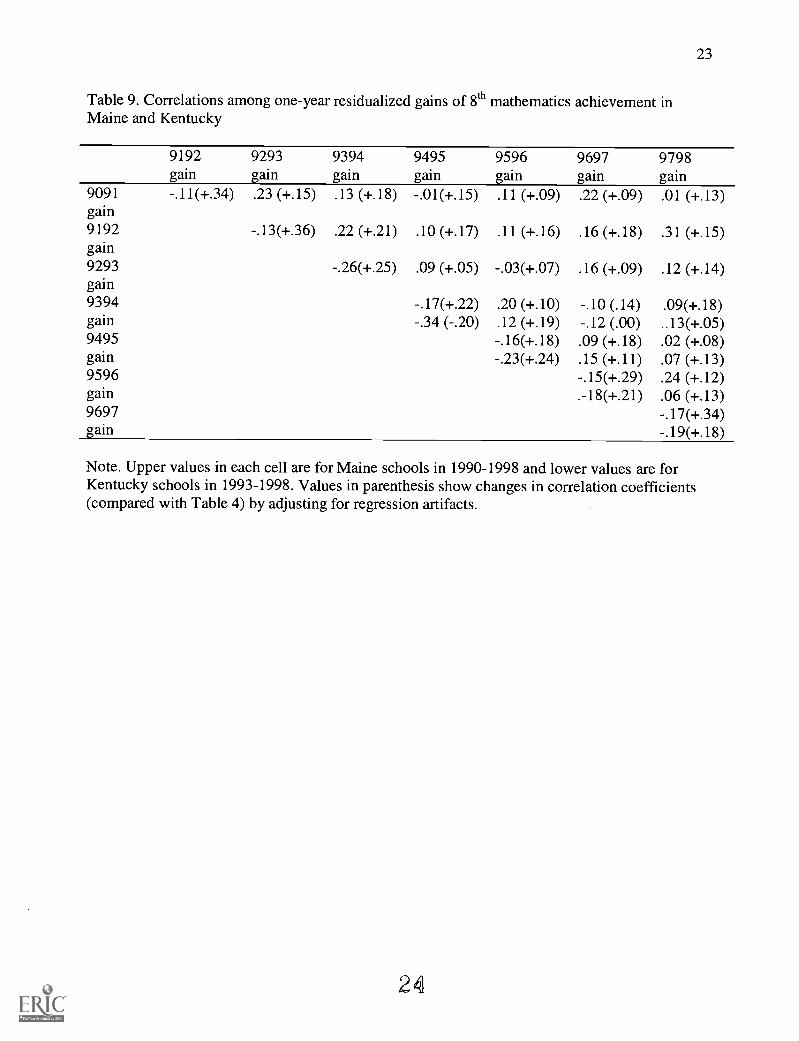
as shown in the top part of Table 8 to obtain residuals. Table 9 shows correlations among
residualized one-year gains. Values in parentheses show changes in correlation coefficients
compared with those in Table 4. Although all of the correlations change in a more positive
direction, the changes are quite marginal; negative correlations become less negative, but hardly
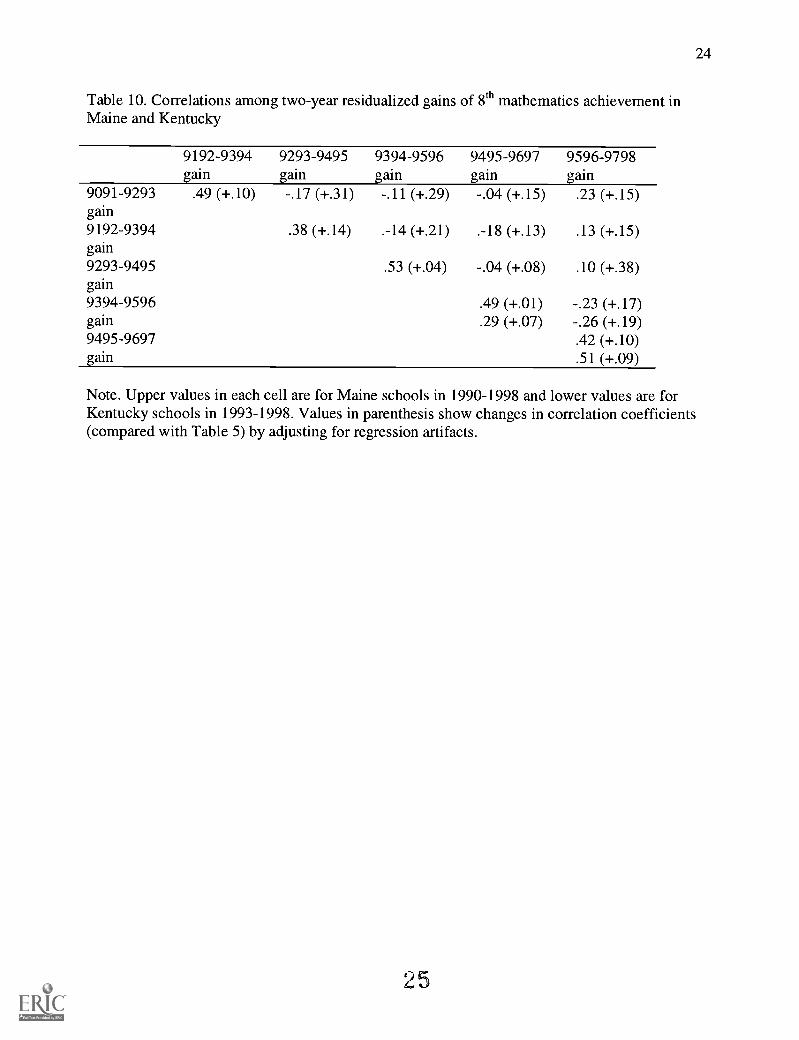
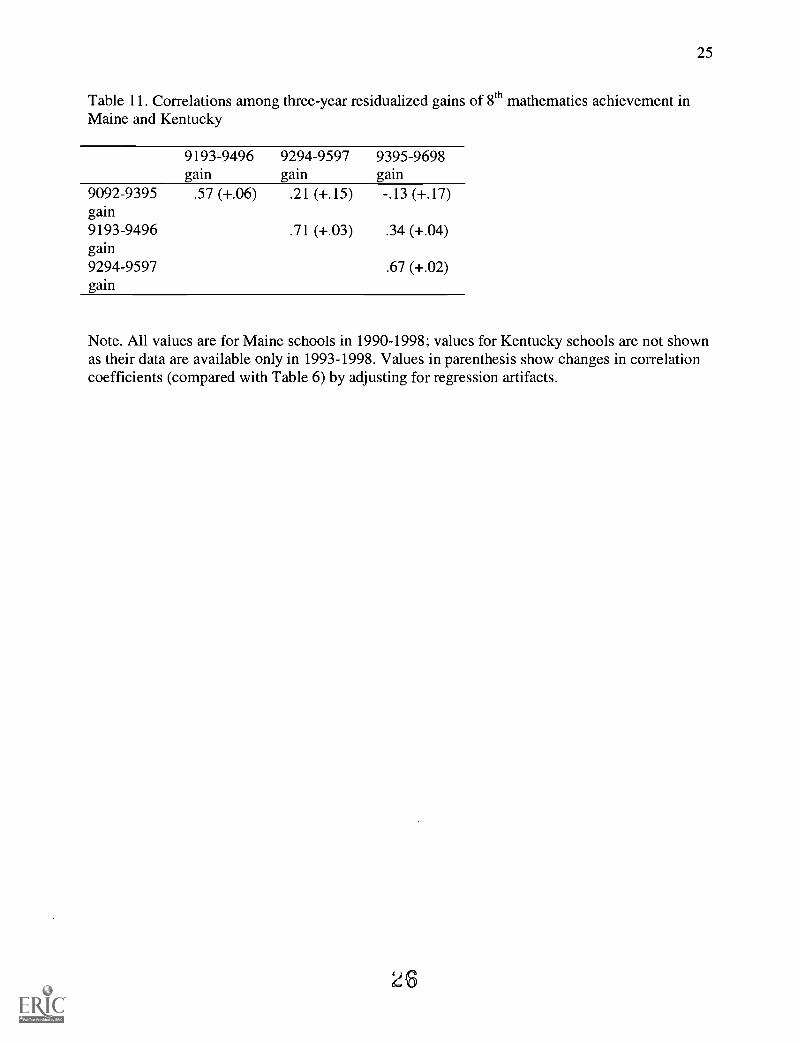
change into positive. Likewise, Table 10 and Table 11 respectively show correlations among 2-
year and 3-year residualized gains. The same tendency of changes in correlation coefficients are
found.
Many researchers claimed that regression to the mean is more of a problem for two-wave
studies than multiwave studies. But Campbell and Kenny (1999) point out that the empirical fact
of proximal autocorrelation implies that regression to the mean continues after the second wave
of measurement. It is true that the largest amount of regression toward the mean usually takes
place at lag 1 because that is where the correlation changes most. However, regression to the
.1 i

11
mean continues because the correlation keeps dropping further after lag 1. Thus, however many
time points we look at for an estimation of change or trend, it is necessary to take cautionary
steps against regression artifacts.
Policy and Research Implications
Both Kentucky and Maine adopted the method of successive-group comparisons (i.e.,
comparing the performance of different cohorts) to evaluate school AYP. Previous studies and
the present findings strongly challenge the validity of current AYP measures based on this
method. Although the most important source of instability in school performance gain may come
from changes in student body and mobility, neither factor is considered in developing and
evaluating school AYP measures. Indeed, the lower reliability of gain scores due to large
sampling error and resulting lower correlations among the gain scores should worsen regression
artifacts. But we suspect that these regression artifacts may remain legitimate concerns due to
measurement error even if states could switch to a longitudinal-comparison design (i.e.,
following the performance of the same students).
In summary, our findings show that higher performing schools tend to gain less while
lower performing schools gain more. This illustrates the well-known regression to the mean
"status" phenomenon. At the same time, our results also reveal regression to the mean "growth"
phenomenon. Schools that gained more than others in the past tend to gain relatively less. The
former force tends to make higher and lower performing schools appear convergent in their
status, whereas the latter force may make more and less improving schools appear convergent in
their growth. These two forces as statistical artifacts may confound school AYP measures and
need to be addressed. At the same time, it is important to realize that any adjustment for
12

12
regression artifacts cannot cure the underlying problems with current AYP measures that arise
from the use of successive comparison method.
Kentucky was among the first states to establish a clear definition of adequate yearly
progress as part of a state accountability system (Linn & Baker, 1999). Their timeline for AYP
has changed along with a new assessment system. According to the state's new AYP rule, every
school has to meet the goal of 100 by 2014; this goal can be accomplished when schools have
100% of their students perform at proficient level. Schools get a composite accountability index
score based on percent students at each of the four achievement levels (novice, apprentice,
proficient, and distinguished) and they are expected to fill the gap between their current score
and the goal of 100 (one seventh of the gap each biennium). Schools may receive rewards or
assistance depending on whether they met the AYP quota.
In contrast, Maine developed AYP measures to evaluate only Title I schools and adopted
a transitional formula to evaluate a school's AYP status. According to the current rule, schools
that have over 70% of students who do not meet the state standards and an average scale score of
535 or lower for two consecutive years are designated as "priority" or "needs improvement"
schools. Those schools are eligible to receive technical assistance from the state and need to
demonstrate progress by making a 3-5 point gain on the MEA scale for two consecutive years.
Do these two AYP approaches make sense, given the regression artifacts that we have
considered in this paper? In the case of Maine, they set the same quota for all Title I schools,
despite the fact that there are substantial variation among even those relatively low-performing
schools. In case of Kentucky, they set different quota for schools according to the schools'
baseline status. Schools that initially performed at a lower level would be assigned a task of
making relatively large gainsthat is, meeting a higher AYP thresholdwhile initially higher
13

13
performing schools would have to meet a relatively lower AYP threshold. The Kentucky
approach has the potential to take into account the regression-to-the-mean-status artifact, but it is
not clear whether this adjustment is reasonable and how it differs from the residualized gain
approach. To test this, subsequent research may compare individual schools' adjusted gain scores
(residuals obtained after controlling for the effect of initial score) with their AYP difference
score (difference between school-specific AYP threshold and actual gain made) and with their
raw gain.
On the other hand, the effect of regression to the mean growth is not considered by the
current AYP formula for either Kentucky or Maine. Once the AYP threshold or quota for each
school is set based on the gap between baseline performance and expected performance, it does
not change. So schools have to meet the same quota every period regardless of how much
progress they made previously. In both states, the AYP quota for schools does not change as
their scores change. An arguably more sensible approach is to reset the AYP quota every time,
adjusting for the amount of progress toward the goal. This way, schools that improved more than
the quota and thus narrowed the gap more would be assigned a smaller quota next time. This has
the potential to address the regression-to-the-mean-growth artifact. To test how this works,
subsequent research may compare individual schools' adjusted gain scores (residuals obtained
after controlling for the effect of previous gain) with their adjusted AYP difference score (gap
between moving AYP threshold and actual gain) and with their unadjusted AYP difference score
(gap between fixed AYP threshold and actual gain).
14
14
References
Campbell, D. T. & Kenny, D. A. (1999). A primer on regression artifacts. New York: Guilford
Press.
Campbell, D. T. & Stanley, J. C. (1963). Experimental and quasi-experimental designs for
research. Chicago: Rand McNally.
Carlson, D. (2001). The focusing of state educational accountability systems: Which schools do
we want to reward or punishand for doing what? Unpublished draft paper.
Consortium for Policy Research in Education (CPRE). (2000). State assessment and
accountability systems: 50 state profiles. Retrieved May 20, 2001, from
http://www.gse.upenn.edu/cpre/docs/pubs/profiles.html
Cronbach, L. J., & Furby, L. (1970). How should we measure "change"or should we?
Psychological Bulletin, 74, 68-80.
Dyer, H. S., Linn, R. L., & Patton, M. J. (1969). A comparison of four methods of obtaining
discrepancy measures based on observed and predicted school system means on
achievement tests. American Educational Research Journal, 6, 591-605.
Hill, R. (1997). Calculating and reducing errors associated with the evaluation of adequate yearly
progress. Paper presented at the annual assessment conference of the CCSSO (ERIC
Publication No. ED 414307).
Lee, J. (2000). Using National and State Assessments to Inform the Performance of Education
Systems. Paper presented at the annual meeting of AERA, New Orleans (ERIC
Publication No. ED 442871).
Linn, R. L. & Baker, E. L. (1999). Standards-based accountability systems' adequate yearly
progress: Absolutes, wishful thinking, and norms. The CRESST Line, Spring 99.
15

15
Table 1. Correlations among one-year school means of 8th grade mathematics achievement inMaine and Kentucky
1991mean
1992mean
1993mean
1994mean
1995mean
1996mean
1997mean
1998mean
1990mean1991mean1992mean1993mean1994mean1995mean1996mean1997mean
.55 .47
.50
.41
.52
.59
.44
.54
.65
.65
.62
.51
.45
.51
.53
.56
.60
.59
.46
.43
.48
.41
.64
.54
.60
.65
.62
.28
.41
.39
.42
.67
.50
.56
.52
.61
.48
.72
.34
.30
.49
.47
.62
.50
.57
.45
.58
.49
.65
.56
.76
Note. Upper values are for Maine schools in 1990-1998 and lower values are for Kentuckyschools in 1993-1998.
16

16
Table 2. Conelations among two-year school means of 8th grade mathematics achievement inMaine and Kentucky
9192mean
9293mean
9394mean
9495mean
9596mean
9697mean
9798mean
9091mean9192mean9293mean9394mean9495mean9596mean9697mean
.83 .60
.85
.61
.74
.89
.63
.69
.73
.87
.84
.59
.59
.58
.62
.74
.85
.90
.51
.54
.51
.58
.74
.58
.72
.85
.88
.46
.54
.57
.61
.71
.61
.69
.64
.76
.84
.90
Note. Upper values are for Maine schools in 1990-1998 and lower values are for Kentuckyschools in 1993-1998.
17
17
Table 3. Correlations among three-year school means of 8th grade mathematics achievement inMaine and Kentucky
9193mean
9294mean
9395mean
9496mean
9597mean
9698mean
9092mean9193mean9294mean9395mean9496mean9597mean
.91 .81
.93
.74
.85
.93
.72.
.72
.81
.91
.95
.60
.60
.64
.77
.89
.91
.85
.59
.60
.64
.69
.79
.82
.86
.91
.94
Note. Upper values are for Maine schools in 1990-1998 and lower values are for Kentuckyschools in 1993-1998.
18

18
Table 4. Correlations among one-year gains of 8th mathematics achievement in Maine andKentucky
9192gain
9293gain
9394gain
9495gain
9596gain
9697gain
9798gain
9091gain9192gain9293gain9394gain9495gain9596gain9697gain
-.45 .08
-.49
-.05
.01
-.51
-.16
-.07
.04
-.39-.34
.02
-.05
-.10
.10-.07-.34-.57
.13
-.02
.07
-.10-.12-.09.04-.44-.39
-.12
.16
-.02
-.09.08-.06-.06.12
-.07-.51-.37
Note. Upper values in each cell are for Maine schools in 1990-1998 and lower values are forKentucky schools in 1993-1998.
i 9

19
Table 5. Correlations among two-year gains of 8th mathematics achievement in Maine andKentucky
9192-9394gain
9293-9495gain
9394-9596gain
9495-9697gain
9596-9798gain
9091-9293gain9192-9394gain9293-9495gain9394-9596gain9495-9697gain
.39 -.48
.26
-.40
-.35
.49
-.19
-.31
-.12
.48
.22
.08
-.02
-.28
-.40-.45.32.42
Note. Upper values in each cell are for Maine schools in 1990-1998 and lower values are forKentucky schools in 1993-1998.
20

20
Table 6. Correlations among three-year gains of 8th mathematics achievement in Maine andKentucky
9193-9496gain
9294-9597gain
9395-9698gain
9092-9395gain9193-9496gain9294-9597gain
.51 .06
.68
-.30
.30
.69
Note. All values are for Maine schools in 1990-1998; values for Kentucky schools are not shownas their data are available only in 1993-1998.
21

21
Table 7. Correlations of long-term trend regression coefficient with 1-year, 2-year, and 3-yeargain scores
1-year gain 2-year gain 3-year gain9091gain
12 9091-9293gain
.44 9092-9395gain
.62
9192gain
.29 9192-9394gain
.45 9193-9496gain
.66
9293gain
.10 9293-9495gain
.42 9294-9597gain
.51
9394 .17 9394-9596 .34 9395-9698 .47gain .34 gain .44 gain .589495 .22 9495-9697 .30gain .19 gain .629596 .17 9596-9798 .32gain .22 gain .569697 .16gain .309798 -.03gain .18
Note. Upper values in each cell are for Maine schools in 1990-1998 and lower values are forKentucky schools in 1993-1998.
22

Table 8. Forward vs. backward regression of 1-year school gain score in Maine
Regression of 9697 gain on 9596 gain and 96 meanCoefficient Standard Beta t
Errorp-value
Intercept 150.84 19.200 7.856 .00096 mean -.416 .057 -.437 -7.317 .0009596 gain -.281 .061 -.273 -4.580 .000Adjusted R2= .348
Regression of 9695 gain on 9796 gain and 96 meanCoefficient Standard Beta t p-value
ErrorIntercept 37.76896 mean -.1779796 gain -.323Adjusted R2= .208
22
23.258 1.624 .106.067 -.192 -2.641 .009.071 -.332 -4.580 .000
Note. 9697 gain = 97 mean 96 mean; 9796 gain = 96 mean 97 mean; 9596 gain = 96 mean95 mean; 9695 gain = 95 mean 96 mean.
23
23
Table 9. Correlations among one-year residualized gains of 8th mathematics achievement inMaine and Kentucky
9192gain
9293gain
9394gain
9495gain
9596gain
9697gain
9798gain
9091 -.11(+.34) .23 (+.15) .13 (+.18) -.01(+.15) .11 (+.09) .22 (+.09) .01 (+.13)gain9192 -.13(+.36) .22 (+.21) .10 (+.17) .11 (+.16) .16 (+.18) .31 (+.15)gain9293 -.26(+.25) .09 (+.05) -.03(+.07) .16 (+.09) .12 (+.14)gain9394 -.17(+.22) .20 (+.10) -.10 (.14) .09(+.18)gain -.34 (-.20) .12 (+.19) -.12 (.00) ..13(+.05)9495 -.16(+.18) .09 (+.18) .02 (+.08)gain -.23(+.24) .15 (+.11) .07 (+.13)9596 -.15(+.29) .24 (+.12)gain .-18(+.21) .06 (+.13)9697 -.17(+.34)gain -.19(+.18)
Note. Upper values in each cell are for Maine schools in 1990-1998 and lower values are forKentucky schools in 1993-1998. Values in parenthesis show changes in correlation coefficients(compared with Table 4) by adjusting for regression artifacts.
24
24
Table 10. Correlations among two-year residualized gains of 8th mathematics achievement inMaine and Kentucky
9192-9394gain
9293-9495gain
9394-9596gain
9495-9697gain
9596-9798gain
9091-9293 .49 (+.10) -.17 (+.31) -.11 (+.29) -.04 (+.15) .23 (+.15)gain9192-9394 .38 (+.14) .-14 (+.21) .-18 (+.13) .13 (+.15)gain9293-9495 .53 (+.04) -.04 (+.08) .10 (+.38)gain9394-9596 .49 (+.01) -.23 (+.17)gain .29 (+.07) -.26 (+.19)9495-9697 .42 (+.10)gain .51 (+.09)
Note. Upper values in each cell are for Maine schools in 1990-1998 and lower values are forKentucky schools in 1993-1998. Values in parenthesis show changes in correlation coefficients(compared with Table 5) by adjusting for regression artifacts.
25
25
Table 11. Correlations among three-year residualized gains of 8th mathematics achievement inMaine and Kentucky
9193-9496gain
9294-9597gain
9395-9698gain
9092-9395 .57 (+.06) .21 (+.15) -.13 (+.17)gain9193-9496 .71 (+.03) .34 (+.04)gain9294-9597 .67 (+.02)gain
Note. All values are for Maine schools in 1990-1998; values for Kentucky schools are not shownas their data are available only in 1993-1998. Values in parenthesis show changes in correlationcoefficients (compared with Table 6) by adjusting for regression artifacts.
26

26
oN =
. . . . .212 213 214 217 213 221 227
90 91 92 93 94 95 96
Year
220
97
Figure 1. Box Plot of 1990-98 MEA 8th grade math school scores
27

27
N = 321
93
330
94
312
95
Year
312
96
325
97
351
98
Figure 2. Box Plot of 1993-98 1URIS 8th grade math school scores

400
380 - -360
340 =-
320
300
280
260
1996
YEAR
1997
97 H
96 H
97 M96 M
96 L
97 L
28
Figure 3. Forward vs. backward trajectories of 1996 and 1997 MEA 8th grade math school scores(YY H=high performing schools in year YY; YY M=middle performing schools in year YY; YYL=low performing schools in year YY)
2 9
80
60
40
20
-20
-40
-60
95 96
Year
9697 H
9596 H
9596 M9697 M
9596 H
9697 L
96 97
29
Figure 4. Forward vs. backward trajectories of 1995-96 and 1996-97 MEA 8th grade math schoolgains (XXYY H=high improving schools between years XX and YY; XXYY M=middleimproving schools between year XX and YY; XXYY L=low improving schools between yearsXX and YY)
3 0

U.S. Department of EducationOffice of Educational Research and Improvement (OERI)
National Library of Education (NLE)Educational Resources Information Center (ERIC)
REPRODUCTION RELEASE(Specific Document)
I. DOCUMENT IDENTIFICATION:
TM033886
Title: /6 Iv /4 41 elf-t,c 6^,e_ Ye,,, id, rep r,e_s_s 6' A re)4e4'-5,,e ? c,,. e ; Ac..713- d &bf ArP
Author(s): "j"-G. e ie e_ API-4Corporate Source:
7-4e cio 4^4e- C 0 /CA-Cle1/44,-C
Publication Date:
II. REPRODUCTION RELEASE:
In order to disseminate as widely as possible timely and significant materials of interest to the educational community, documents announced in themonthly abstract journal of the ERIC system, Resources in Education (RIE), are usually made availableto users in microfiche, reproduced paper copy,and electronic media, and sold through the ERIC Document Reproduction Service (EDRS). Credit is given to the source of each document, and, Ifreproduction release is granted, one of the following notices is affixed to the document.
If permission is granted to reproduce and disseminate the identified document, please CHECK ONE of the following three options and sign at the bottomof the page.
The sample sticker shown below will beaffixed to all Level 1 documents
1
PERMISSION TO REPRODUCE ANDDISSEMINATE THIS MATERIAL HAS
BEEN GRANTED BY
TO THE EDUCATIONAL RESOURCESINFORMATION CENTER (ERIC)
Level
Check here for Level 1 release, permitting reproductionand dissemination in microfiche or other ERIC archival
media (e.g., electronic) and paper copy.
Signhere,--)please
The sample sticker shown below will beaffixed to all Level 2A documents
PERMISSION TO REPRODUCE ANDDISSEMINATE THIS MATERIAL IN
MICROFICHE, AND IN ELECTRONIC MEDIAFOR ERIC COLLECTION SUBSCRIBERS ONLY,
HAS BEEN GRANTED BY
2A
TO THE EDUCATIONAL RESOURCESINFORMATION CENTER (ERIC)
Level 2A
Check here for Level 2A release, permitting reproductionand dissemination In microfiche and in electronic media
for ERIC archival collection subscribers only
The sample sticker shown below will beaffixed to all Level 2B documents
PERMISSION TO REPRODUCE ANDDISSEMINATE THIS MATERIAL IN
MICROFICHE ONLY HAS BEEN GRANTED BY
2B
TO THE EDUCATIONAL RESOURCESINFORMATION CENTER (ERIC)
Level 2B
Check here for Level 28 release, permittingreproduction end dissemination in mkrofiche onty
Documents will be processed as indicated provided reproduction quality permits.If permission to reproduce is granted, but no box is checked, documents will be processed at Level 1.
I hereby grant to the Educational Resources Infonnation Center (ERIC) nonexclusive permission to reproduce and disseminate this documentas indicated above. Reproducten from the ERIC microfiche or electmnic media bypersons other than ERIC employees and its systemcontractors requires permission from the copyright holder. Exception is made for non-profit reproduction by libraties and other service agenciesto satisfy information needs of educators in response to discrete inquiries.
Organizat
51 (.10; Vert. .rbA Grrbrom, 6 C4r47
Printed Name/Position/Title:
LeeTelephone:
xic1SEVail0 Iv /e tacm vock;if (3.
eiL4
/ 4,5 is-L-4-19453,or
Fn--e 5'Pf-a-v.2.3pato _ 3 e
(over)

HI. DOCUMENT AVAILABILITY INFORMATION (FROM NON-ERIC SOURCE):
If permission to reproduce is not granted to ERIC, or, if you wish ERIC to cite the availability of the document from another source, pleaseprovide the following information regarding the availability of the document. (ERIC will not announce a document unless it is publiclyavailable, and a dependable source can be specified. Contributors should also be aware that ERIC selection criteria are significantly morestringent for documents that cannot be made available through EDRS.)
Publisher/Distributor
Address:
Price:
IV. REFERRAL OF ERIC TO COPYRIGHT/REPRODUCTION RIGHTS HOLDER:
If the right to grant this reproduction release is held by someone other than the addressee, please provide the appropriate name andaddress:
Name:
Address:
V. WHERE TO SEND THIS FORM:
Send this form to the following ERIC Clearinghouse:University of Maryland
ERIC Clearinghouse on Assessment and Evaluation1129 Shriver LaboratoryCollege Park, MD 20742
Attn: Acquisitions
However, if solicited by the ERIC Facility, or if making an unsolicited contribution to ERIC, return this form (and the document beingcontributed) to:
ERIC Processing and Reference Facilitytwo West Street, 2" Floor
Laurel, Maryland 20707-3598
Telephone: 301-497-4080Toll Free: 800-799-3742
FAX: 301-953-0263e-mall: [email protected]
WWW: http://encfac.piccard.cec.corn
EFF-088 (Rev. 9/97)PREVIOUS VERSIONS OF THIS FORM ARE OBSOLETE.


![IS 9293 (1991): Textiles - Canvas, Flax · IS 9293 (1991): Textiles - Canvas, Flax [TXD 33: Industrial Fabrics]. . IS 9293 :1991 * Pwvmw Indian Standard -TEXTILES - CANVAS, FLAX -](https://img.pdfslide.net/doc/110x75/6049a091d9c85e3b7c6d7cec/is-9293-1991-textiles-canvas-flax-is-9293-1991-textiles-canvas-flax.jpg)