Embed Size (px)
Citation preview
CBPS Discussion Paper
1
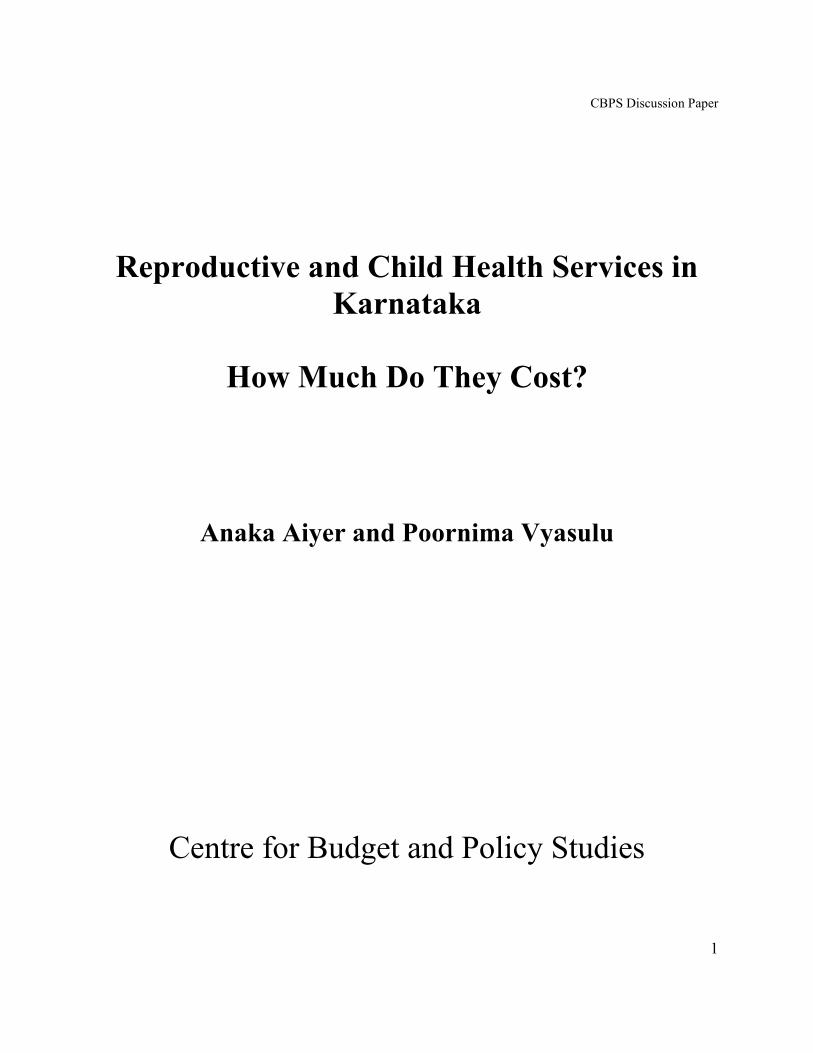
Reproductive and Child Health Services in
Karnataka
How Much Do They Cost?
Anaka Aiyer and Poornima Vyasulu
Centre for Budget and Policy Studies
CBPS Discussion Paper
2
This note is part of a research project funded by the John D and
Catherine T MacArthur Foundation in the Centre for Budget and Policy
Studies, Bangalore. It was prepared by Anaka Aiyer under the guidance
of Poornima Vyasulu. Colleagues in CBPS offered comments on an
earlier draft. We benefited from the discussions at a presentation made
to our academic council, which helped us improve the presentation.
Though firm conclusions have not been possible, it is hoped wider
debate among NGOs and academics, and health department officials will
help improve the system, help fill in the gaps and lead to better
estimates. It is being presented to a larger audience to encourage debate.
We are grateful to the officials of the Health Department of Karnataka
for their co-operation in providing and explaining the data, and for
discussions at various times.
Responsibility for errors and opinions is that of the authors alone.
RCH Services in Karnataka—How Much Do They Cost?
CBPS Discussion Paper
3
Introduction
In 1999, the Karnataka World Bank report made the following observations:
The Maternal Mortality Rate was high at 450/100000 live births
84% of the cases received ANC—antenatal care—preceding the survey.
38% of the women delivered in health institutions, nearly half of the deliveries were
attended to by doctors, nurses or midwives, 22% delivered with the help of TBAs
Nearly 1/4 of all mothers did not receive TT, 3/4 of which received OFA tablets
Present GOI rules state that each PHC has to cater to a population of 30000 and each sub
centre should cater to a population of 5000. Number pf PHC/lakh had grown to 4.64 and
number of sub centres per lakh had grown to 24. Each PHU was to cater to a population
of 15000.
At the village level there was to be at least one Dai for a population of 1000.
Per capita expenditure on health (in 1995-96) was projected to be Rs121.34
Recent statistics (2001) have concluded that health care services are provided at 210 Rs.
Per capita at the state level.
Recently, in the sphere of development debates, budget analysis as a tool is gaining popularity. It
is felt that this tool enables us to understand how the defined goals of development and policy
pronouncements are provided for in terms of financial resources. This note is a part of such a
budget analysis process of the RCH programme as it examines the allocation of funds to the
RCH programme.
The note is based on the work of a project in Karnataka, undertaken by CBPS, looking into the
role of the PRIs in providing effective RCH services. The project focuses on three issues -
accountability, accessibility and affordability of the RCH service in Karnataka and Budget
analysis is the tool used to understand the efficacy of RCH services.
Provision for RCH in the State Budget
In continuation of its earlier Maternal and Child Heath services schemes, the government
launched the Reproductive and Child Health [RCH] programme in 1997 with some
modifications in the scope and approach. The new RCH service would cover the following
additional aspects –
1. Improved Ante Natal Care (ANC)
2. Education on AIDS and Reproductive Tract Infections(RTI)
3. Education for the youth on the same
4. Contraceptive use
CBPS Discussion Paper
4
It is interesting to note that the state budget has no separate head for the RCH service, either
under the medical and public health head of account or the family welfare account. Perhaps the
term MCH is used interchangeably with RCH and the line department continues to use the MCH
term to include RCH. Since RCH as a budget head is difficult to identify in the budget
documents and MCH was more easily identifiable most of this study will be based on MCH
budgets.1
In the nineties, the Karnataka government put aside Rs 1,10,000 lakh for total medical and public
health expenditure. The State proposed to spend 3.6% of this on family welfare programs out of
which 1 5.43% (i.e. Rs. 463 lakhs) was allotted for maternal and child health services2. At the
end of the ninth plan we found that 97% of the total medical and health expenditures was
actually spent3. Only 83% of the family welfare budget was realized in actual expenditures, out
of which only 3Rs%(97.30 lakh) was spent on the MCH Services. At the Zilla Panchayat level
Rs.756.62 lakh was spent out of the available Rs.1000 lakh on MCH Services. The question that
comes to mind is – why is there such a huge difference between what was allocated and what is
actually spent on MCH services?
If this trend continues in the tenth plan, while the projected expenditure on Family Welfare is
Rs.5565.35, the actual expenditure will be Rs.4631.513 lakh. Similarly we can expect that
Rs.1172 lakh will be spent on MCH Services. Though this is definitely an improvement in
actuals (from the previous year’s Rs.842 lakh) we cannot be sure that this amount will be
actually spent on MCH Services or what proportion of it will actually reach `maternal health`
related services.4
Information on the 2002-03 budgets outlays and expenditure was also obtained from the
Karnataka government. Under various MCH related heads, it has been found that 78% (approx.
Rs 14000 lakh) of the allocations was actually spent. Out of this, 22% was spent on maternal and
child health services. More than 100% was spent of Non-plan allocations under the heads of
‘allocation to Zilla Panchayats and allocations for special programmes’. It is not clear exactly
what is covered in these items—there is need for more work on this at the district level wherte
the work is done.
1 In fact the key component under RCH seems to be sterilization!
2 The MCH services come up under various heads in the general and family welfare allocations.
In the general health services it shows up as expenditure on the upkeep of the service providers
such as buildings, training etc. in the Family welfare allocations. there are heads we have
identified as direct MCH services. A list has been provided at the end of the report. 3 This was also seen in an earlier study of CBPS - Maternal health as Seen in Budget Data….
4 A common problem of the MCH service expenditure is that a very large proportion of it goes
into child health. We cannot determine how much as there are no actual numbers, but we can
assume that a large proportion of the allotments go into programmes such as immunization,
nutrition, etc, again we cannot make any comment about beneficiary population.
CBPS Discussion Paper
5
From the allocations at the state level, we move on to the allocations from the state to the
various districts for the year 2004-05, looking at the two project districts - Chamarajanagar and
Chitradurga districts. This is a relevant time frame as the primary data we have collected is for
the same time period. In order to examine the effectiveness of the budget, actual expenditures
need to be studied. However, this information is not yet available.
Allocations under Medical and Public Health Heads
Under the heads of Medical and Public Health, Chamarajnagar is allotted 3% of the state budgets
while Chitradurga has been allotted 6% for general health services. The basis for this allocation
is not clear – is it on population figures or status of health or some other criteria like estimated
need for health services through Community assesement ?
Plan Allocations
In theory, plan allocations refer to additional investments of a long tern nature on programmes
introduced in that plan period. In this sense, this should indicate new initiatives taken.
Unfortunately, programmes introduced in past plans have not been transferred to non-plan
funding because of fiscal constraints. Often, in a fiscally tight situation, non-plan expenditures,
which are supposed to be less important, are cut. In the field of health, which depends on the
availability of people, and is people intensive, this often means that new recruitments needed,
say on retirement of people, does not take place. The common view in government that non-plan
expenditure is not a priority is as wrong as the view that plan allocations are important. This
distinction has thus lost all meaning, but is provided any way. The main point is that plan
allocations should not be understood as a new initiative unless independent evidence to that
effect is available.
Under the plan allocations, the exact heads for MCH could not be identified. Account heads such
as allocations to PHCs, upgradation of PHCs, dispensaries, rural health services and so on5 were
used. It was assumed that, budgets allocated under these subheadings might eventually reach the
woman in some form of service provided. Here too, 4% of the total state share is allocated to
Chamarajnagar while 6% was allocated to Chitradurga.
For Chamarajnagar, we find that close to 19% of the budget for general health was allotted to the
Taluk Panchayats and the rest was retained at the Zilla Panchayats. There is no allocation to the
gram panchayats from this head.
Non-Plan Allocations
5 Please see the list at the end of the report.
CBPS Discussion Paper
6
If we look at non-plan allocations of the state to the Chitradurga and Chamarajnagar Zilla
Panchayat6, we find that the state had allotted close to 97% of its non-plan expenditures on
salaries for general health. To the Taluk Panchayat schemes, the state has allocated 53% to
salaries.
Most of the heads under which we have identified MCH services are largely expenditures heads
like the upkeep of the PHCs, provisions for operating/ running costs such as water and
electricity. These are also included in the calculation of budgetary allocations to MCH as they
are essential to provide good MCH services. This makes unbundling the allocations into direct
and indirect costs difficult.
Between the 2 districts, Chamarajnagar somehow got a lower allocations under all the heads.
FAMILY WELFARE SCHEMES
In the allocations to the districts we find that, 8% of the total allotments for family welfare are
allocated to MCH services for Chitradurga. In Chamarajnagar the allocation amounts to 4% of
the budget. Here we have taken into account plan, non-plan, and state and centrally sponsored
schemes.
Plan Allocations
In the plan allocations also, Chitradurga got a higher allocations from the state as well as the
centre7. Overall, 1% of the allocations for family welfare came from the state and 99% of the
allocation from the centre. This is obviously not a surprising thing as the family welfare
programmes is a centrally sponsored programme. In this head, we find various components for
potential MCH services. In the ninth plan, it seemed that the center took over providing services
such as education, sterilization, training, and some other MCH related programmes. The state
was involved in supplying drugs for family welfare, compensations, transport etc. Health is
however, a state subject under the constitution.
Non-Plan allocations
34% of the state budget was allocated to Chitradurga for family welfare non-plan. There was
absolutely no allocation by the state for FW programmes to Chamarajnagar.
-------------------------------------------------------------------------------------------------------------------
PHC LEVEL DATA
6 We have looked at the budget for 2004-05 allotments.
7 Chitradurga – 9% from state schemes, 5.6% from the central schemes
Chamarajnagar – 7% from state schemes, 4.7% from the central schemes
CBPS Discussion Paper
7
The data that has been collected from the PHC is primary data from Chamarajnagar. The
surveyors have gone to each PHC to collect data on salaries, running costs and the list of the
ANMs. The sample has been cleaned and the number of PHC that are complete with information
on costs as well as demographics has been analyzed. Information on number of people who visit
the PHC and the exact coverage of the ANM cannot be determined from the sample. The trends
that have been analyzed are general trends for Chamarajnagar.
After the upgradation of PHUs to PHCs, we find each PHC has under its jurisdiction 4
sub centres. Each PHC caters to an average of 15 villages and a population of close to
15400 (on average)8. Each sub centre caters to a population of close to 3600 people
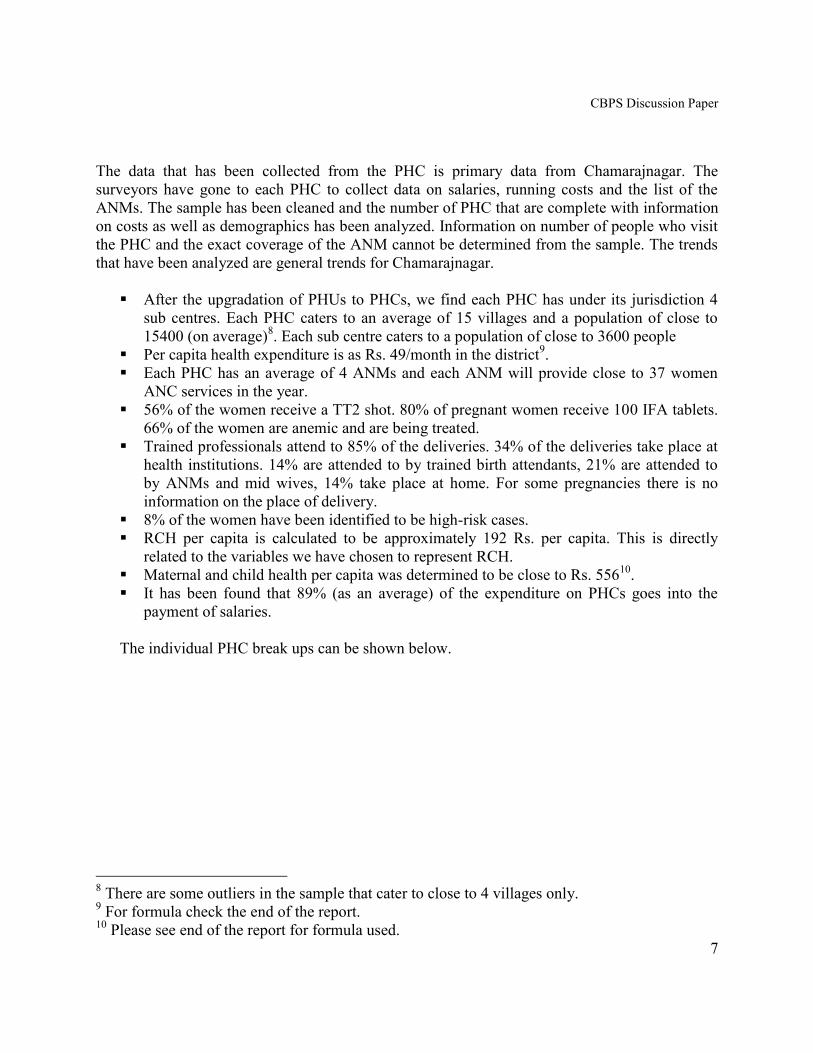
Per capita health expenditure is as Rs. 49/month in the district9.
Each PHC has an average of 4 ANMs and each ANM will provide close to 37 women
ANC services in the year.
56% of the women receive a TT2 shot. 80% of pregnant women receive 100 IFA tablets.
66% of the women are anemic and are being treated.
Trained professionals attend to 85% of the deliveries. 34% of the deliveries take place at
health institutions. 14% are attended to by trained birth attendants, 21% are attended to
by ANMs and mid wives, 14% take place at home. For some pregnancies there is no
information on the place of delivery.
8% of the women have been identified to be high-risk cases.
RCH per capita is calculated to be approximately 192 Rs. per capita. This is directly
related to the variables we have chosen to represent RCH.
Maternal and child health per capita was determined to be close to Rs. 55610
.
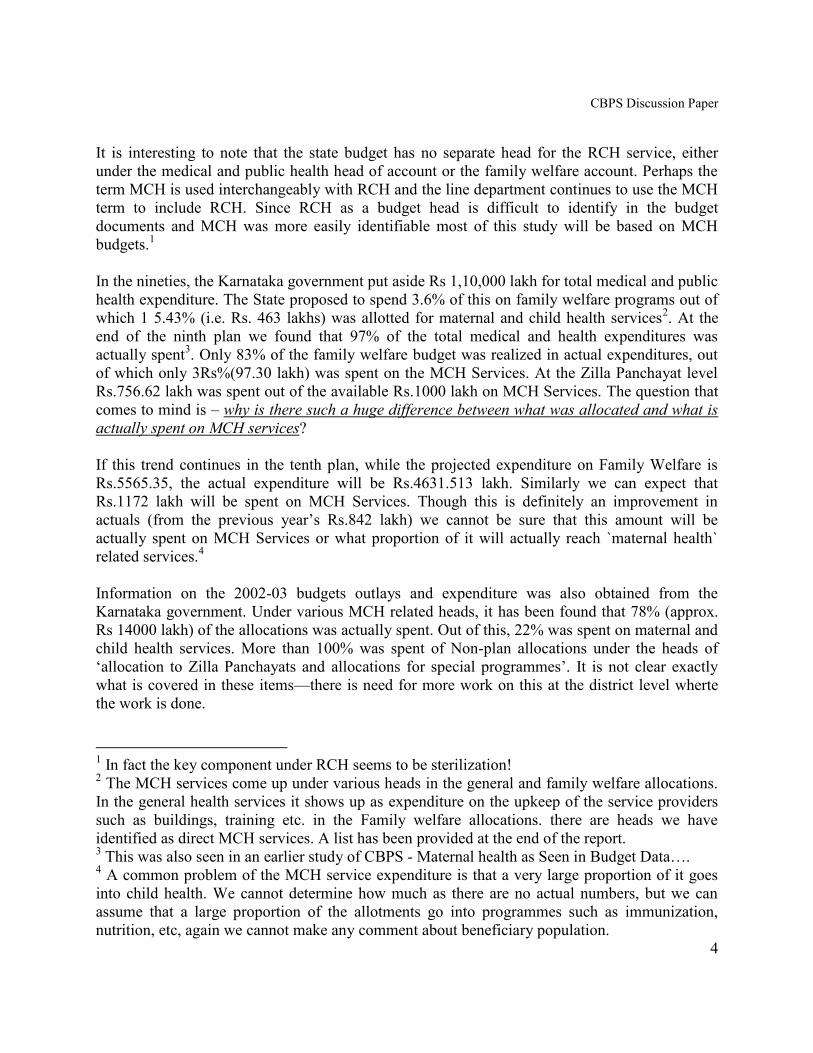
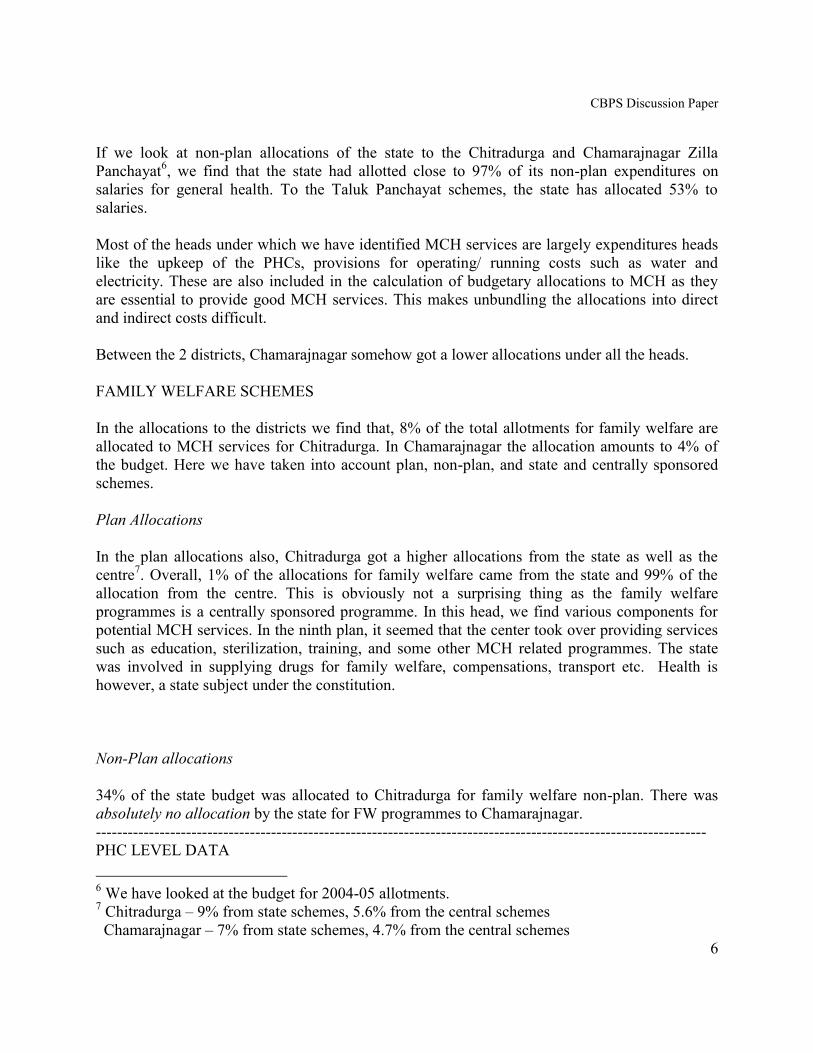
It has been found that 89% (as an average) of the expenditure on PHCs goes into the
payment of salaries.
The individual PHC break ups can be shown below.
8 There are some outliers in the sample that cater to close to 4 villages only.
9 For formula check the end of the report.
10 Please see end of the report for formula used.
CBPS Discussion Paper
8
SALARY TO TOTAL EXP
0
200000
400000
600000
800000
1000000
1200000
1400000
1600000
1800000
Agra Mumbali Panathahundi P.G. Palaya Hhlikarihundi
PHC
TOTAL SALARY EXP TOTAL EXP
\
Name of the health centre PER CAPITA
General health RCH MCH
Agra Mumbai 60.82275498 616.47847 5418.345946
Yodhatra Palaya 56.08103214 64.38677812 228.3908356
Bachahalli 61.52858661 198.9300777 329.4779412
Ramapura 53.35871579 215.1073115 484.1458932
Dhadaduvadi 33.02501354 89.23795181 138.9851446
Hunure 63.00458163 190.7746086 300.0212092
Panathahundi 37.72389146 237.0372208 661.0795848
Santhamanahalli 52.70962343 168.0296925 250.5390021
Baraga 58.31635815 345.08177 1289.492063
Punachi 113.7678649 315.5655853 511.9816934
Matalli 32.12849479 158.5160377 249.8542751
Kuduru 39.71719975 195.0712622 278.6546906
P.G. Palaya 36.66940399 134.2952117 188.1175166
Lokenahalli 46.8213811 76.92200557 129.8510972
Maduvanahalli 143.7274649 268.8372093
Palya 44.56162836 126.9376093 169.2830482
Umakuru 60.3821032 349.5321252 396.5719626
Kotalavadi 14.35707899 65.23600283 116.7134404
Hhlikarihundi 59.02722696 255.6909871 401.6359551
Chulakivadi 16.26864093 63.01881533 100.3313609
Coudahalli 19.75779817 21.76206967 28.13537003
Goudahalli 74.5939678 193.0106505 305.4834025
CBPS Discussion Paper
9
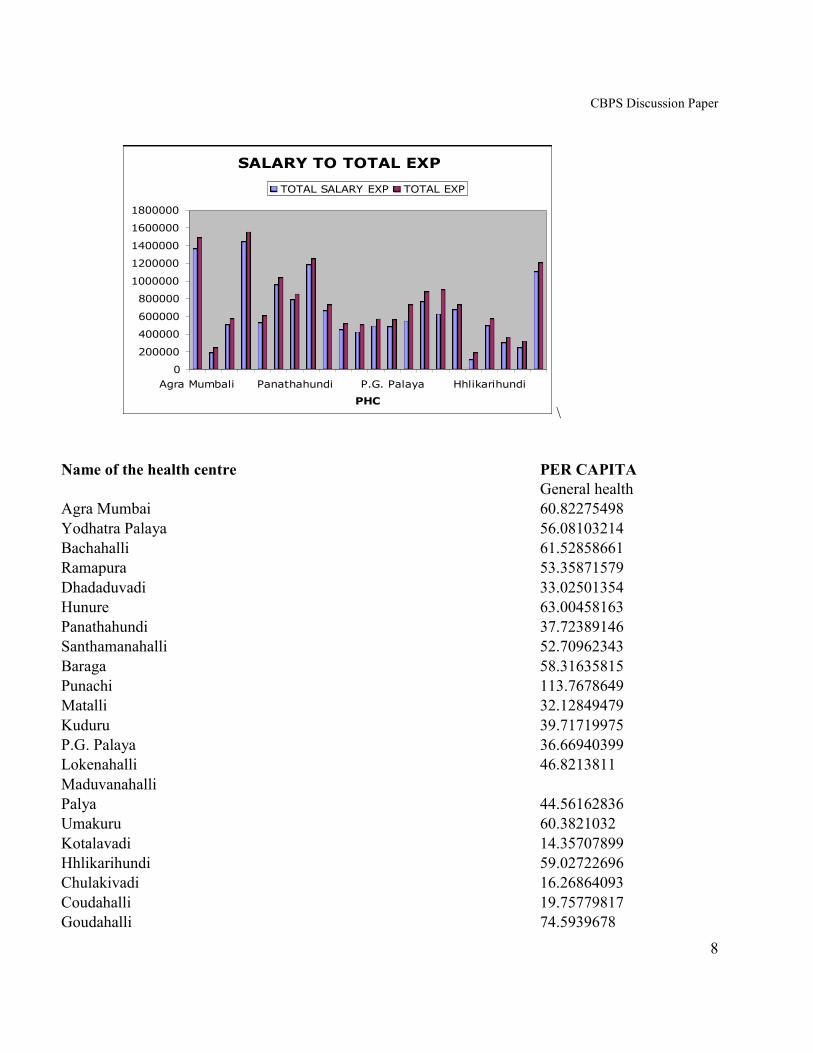
Total 1034.623347 4224.34971 12245.9286
Average 49.26777841 192.0159 556.63312
per capita without outliers total 3262.7895 6827.5827
average 112.50998 310.34467
the outlier has been identified to be at agra mumbali as no
Information on the census of children is present.
During the ninth plan the government upgraded the Public Health Units to Primary Health
Centers. This effect can be directly seen in the PHC sample data. What can be found is that, the
PHC now caters to a population of 15000, which was the population coverage of the PHUs in the
World Bank report. Also, in our data we see that there are some PHCs, which cover 4-8 villages
only. An educated guess is that, when the PHUs were upgraded to PHCs, their coverage was
untouched. There was hardly any improvement in the quality of services at the upgraded PHC.
What has been observed is that, though every PHC seems to be stacked adequately with
contraceptives, maternal health care is inadequate. Some of the reasons are –
There are only male doctors at the PHC, thus, reducing accessibility.
The PHC are inadequately equipped
The distance of the PHC to the individual also matters; often the PHC is
completely inaccessible and unreliable.
There are many social stigmas attached to maternal health care, ante natal care
and post natal care that often reduce the accessibility of these services.
Most of the problem arises due to inadequate staffing and inadequate provision of
infrastructural services.
Though there is a record that says close to 80% of the women receive 100 IFA
tablets during their pregnancies, it is very hard the evaluate the effectiveness of
this result. Due to a myth that mothers who take iron tablets will have dark
skinned babies. Most often the tablets are distributed, but will remain in the
houses stocked away in a corner.
The DHO of Chamarajnagar confirmed the lack of adequate staff and funds for the district.
ANALYSIS OF HOUSEHOLD LEVEL DATA
Household level data comprises of a survey conducted on women to evaluate their awareness on
Reproductive and Child Health services within the community. The current sample consists of
139 observartions of which 110 have been collected from Chamarajnagar. Since the database of
CBPS Discussion Paper
10
Chitradurga is rather small, no general analysis has been done on the same. The data from
Chamarajnagar, in addition to having a larger size, is also more informative.
The results presented below, show general trends. The findings are preliminary and there are
outliers in the sample under various heads. The present data can be used to determine future
direction of data collection and analysis.
CHAMARAJNAGAR – general trends of the sample
The average age of sample interviewed in Chamarajnagar was close to 23. In the district, the
average annual income was app 9800 Rs and (ranging from 1000 to 80000). On average, there
were 6 members living together in the household.
In the sample, which was conducted in a 6-month period, 30% of the women interviewed were
pregnant. However, this value cannot be assumed to be a general trend as the surveyors might
have identified pregnant women for the survey. A larger database needs to be analyzed before
any conclusions are made.
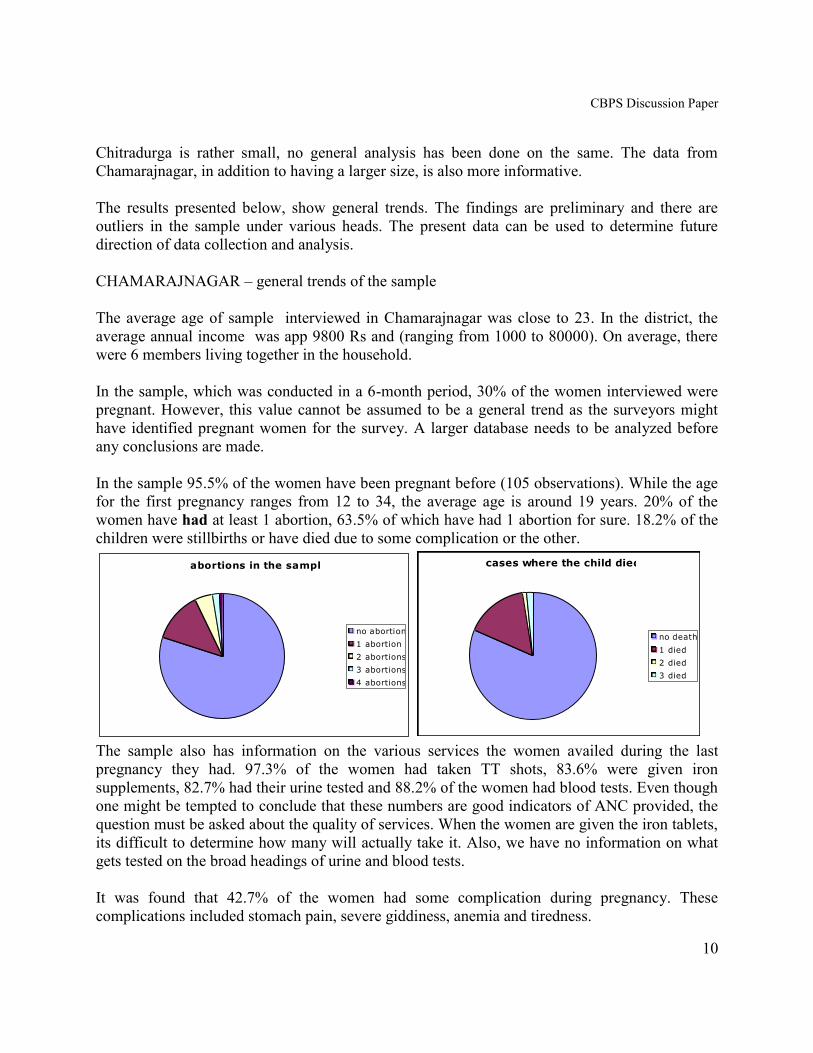
In the sample 95.5% of the women have been pregnant before (105 observations). While the age
for the first pregnancy ranges from 12 to 34, the average age is around 19 years. 20% of the
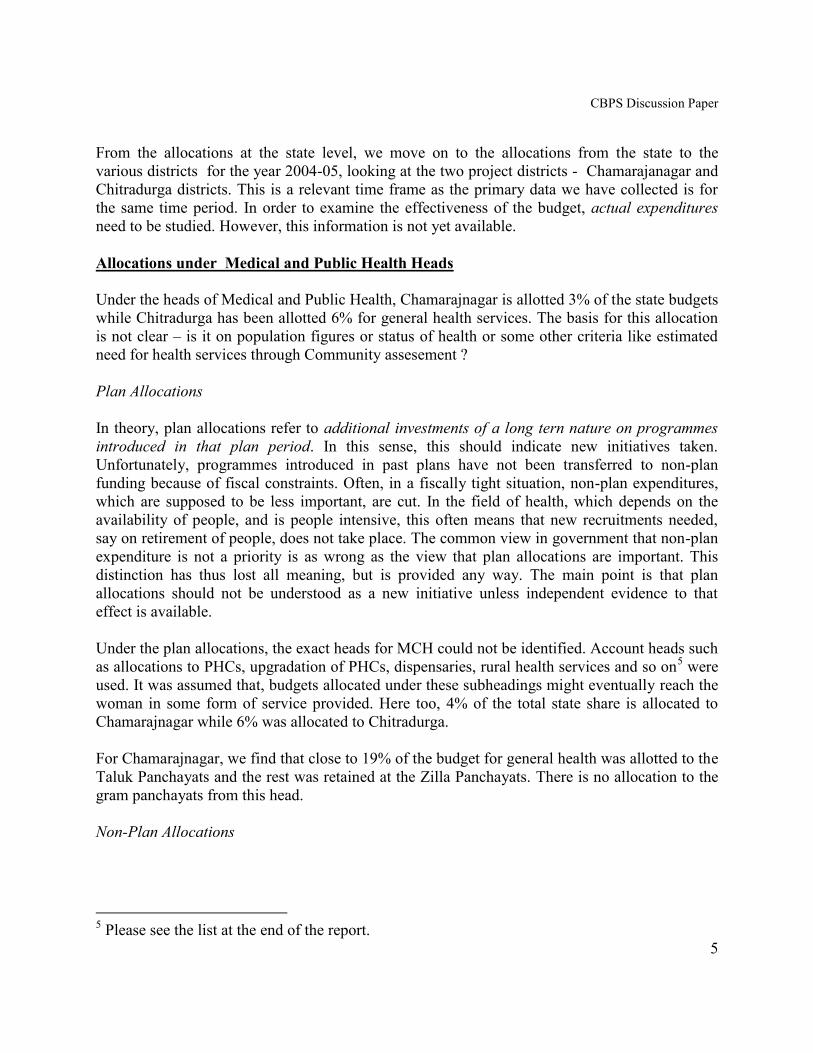
women have had at least 1 abortion, 63.5% of which have had 1 abortion for sure. 18.2% of the
children were stillbirths or have died due to some complication or the other.
abortions in the sample
no abortion
1 abortion
2 abortions
3 abortions
4 abortions
cases where the child died
no death
1 died
2 died
3 died
The sample also has information on the various services the women availed during the last
pregnancy they had. 97.3% of the women had taken TT shots, 83.6% were given iron
supplements, 82.7% had their urine tested and 88.2% of the women had blood tests. Even though
one might be tempted to conclude that these numbers are good indicators of ANC provided, the
question must be asked about the quality of services. When the women are given the iron tablets,
its difficult to determine how many will actually take it. Also, we have no information on what
gets tested on the broad headings of urine and blood tests.
It was found that 42.7% of the women had some complication during pregnancy. These
complications included stomach pain, severe giddiness, anemia and tiredness.
CBPS Discussion Paper
11
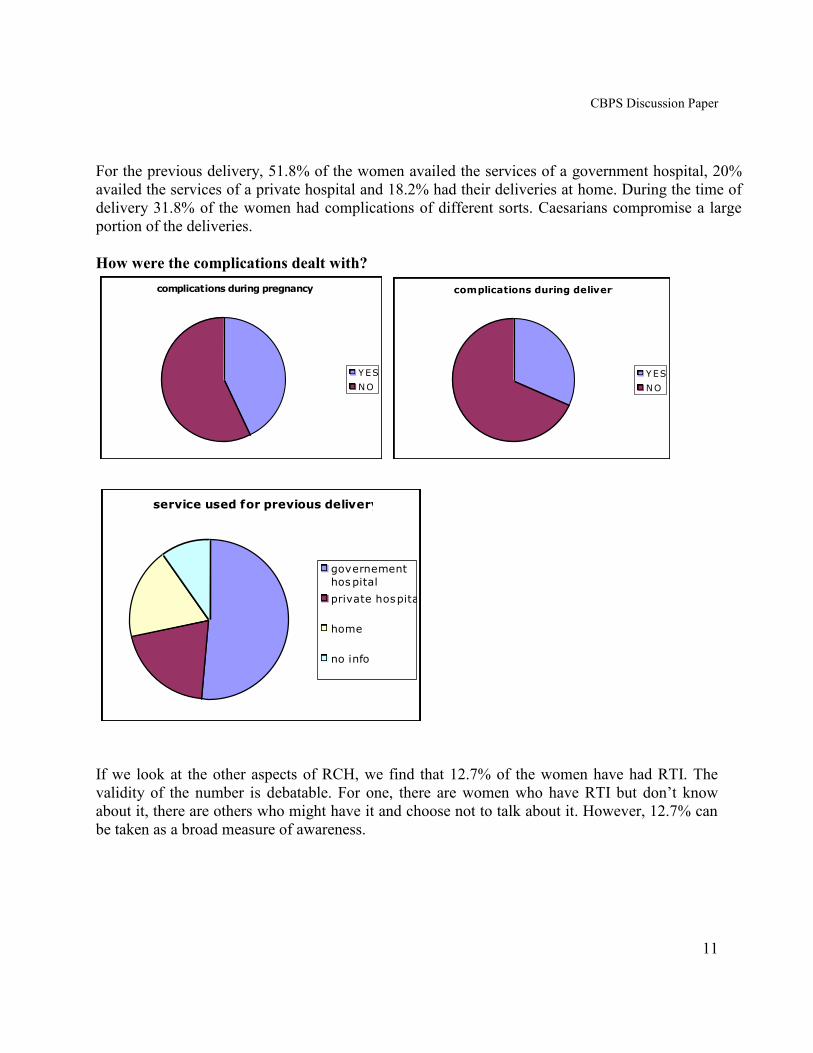
For the previous delivery, 51.8% of the women availed the services of a government hospital, 20%
availed the services of a private hospital and 18.2% had their deliveries at home. During the time of
delivery 31.8% of the women had complications of different sorts. Caesarians compromise a large
portion of the deliveries.
How were the complications dealt with?
complications during pregnancy
YES
NO
complications during delivery
YES
NO
service used for previous delivery
governement
hospital
private hospital
home
no info
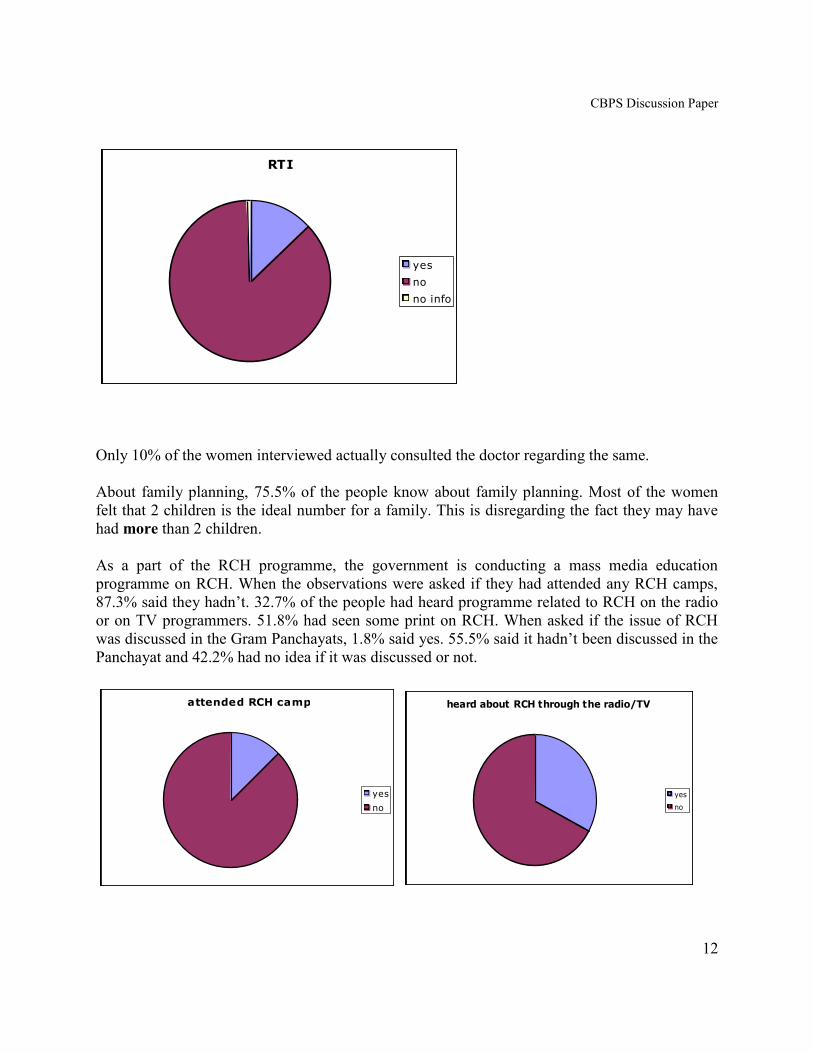
If we look at the other aspects of RCH, we find that 12.7% of the women have had RTI. The
validity of the number is debatable. For one, there are women who have RTI but don’t know
about it, there are others who might have it and choose not to talk about it. However, 12.7% can
be taken as a broad measure of awareness.
CBPS Discussion Paper
12
RTI
yes
no
no info
Only 10% of the women interviewed actually consulted the doctor regarding the same.
About family planning, 75.5% of the people know about family planning. Most of the women
felt that 2 children is the ideal number for a family. This is disregarding the fact they may have
had more than 2 children.
As a part of the RCH programme, the government is conducting a mass media education
programme on RCH. When the observations were asked if they had attended any RCH camps,
87.3% said they hadn’t. 32.7% of the people had heard programme related to RCH on the radio
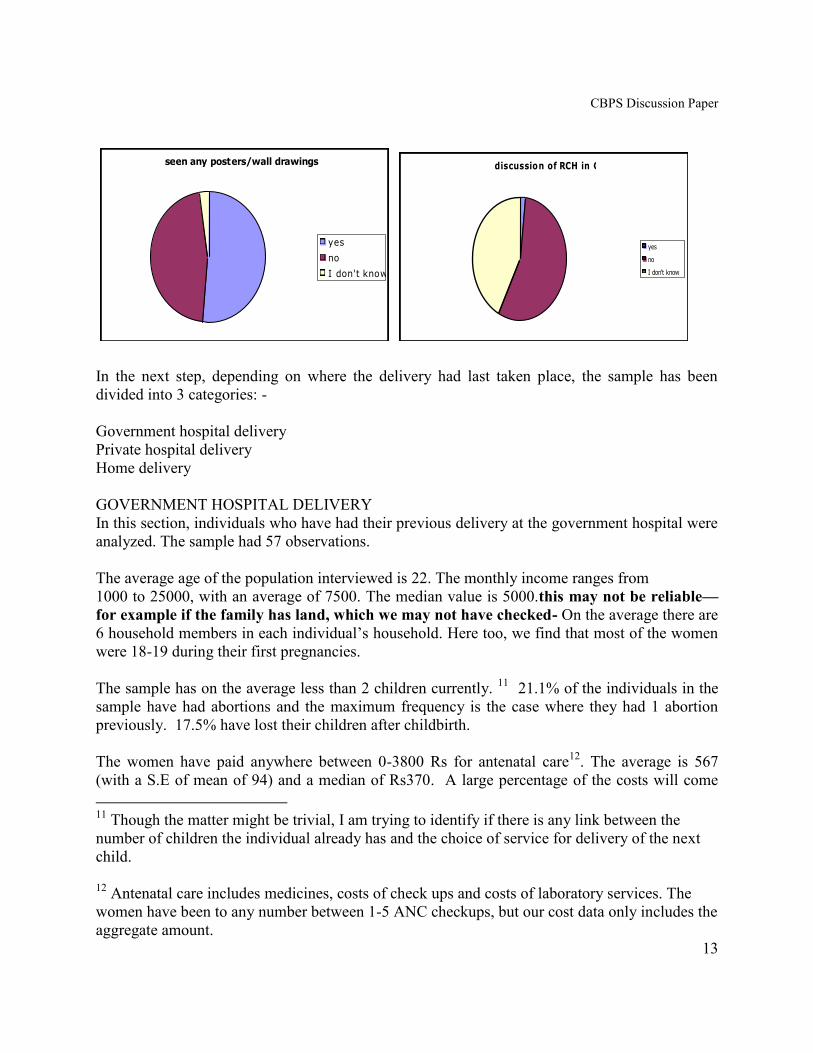
or on TV programmers. 51.8% had seen some print on RCH. When asked if the issue of RCH
was discussed in the Gram Panchayats, 1.8% said yes. 55.5% said it hadn’t been discussed in the
Panchayat and 42.2% had no idea if it was discussed or not.
attended RCH camps
yes
no
heard about RCH through the radio/TV
yes
no
CBPS Discussion Paper
13
seen any posters/wall drawings
yes
no
I don't know
discussion of RCH in GP
yes
no
I don't know
In the next step, depending on where the delivery had last taken place, the sample has been
divided into 3 categories: -
Government hospital delivery
Private hospital delivery
Home delivery
GOVERNMENT HOSPITAL DELIVERY
In this section, individuals who have had their previous delivery at the government hospital were
analyzed. The sample had 57 observations.
The average age of the population interviewed is 22. The monthly income ranges from
1000 to 25000, with an average of 7500. The median value is 5000.this may not be reliable—
for example if the family has land, which we may not have checked- On the average there are
6 household members in each individual’s household. Here too, we find that most of the women
were 18-19 during their first pregnancies.
The sample has on the average less than 2 children currently. 11
21.1% of the individuals in the
sample have had abortions and the maximum frequency is the case where they had 1 abortion
previously. 17.5% have lost their children after childbirth.
The women have paid anywhere between 0-3800 Rs for antenatal care12
. The average is 567
(with a S.E of mean of 94) and a median of Rs370. A large percentage of the costs will come
11
Though the matter might be trivial, I am trying to identify if there is any link between the
number of children the individual already has and the choice of service for delivery of the next
child.
12
Antenatal care includes medicines, costs of check ups and costs of laboratory services. The
women have been to any number between 1-5 ANC checkups, but our cost data only includes the
aggregate amount.
CBPS Discussion Paper
14
from medicines prescribed for the individual. When looking within the trends we find that, 8.2%
of the women have had TT injections, 78.9% were given IFA tablets, 82.5% of the women have
had their urine tested and 89.5% of the women had their blood tested.
At the time of delivery13
, the individual would spend on average 1500 Rs (S.E of 242) and a
median value of Rs1000. Depending on the level of complication they might have spent upto Rs
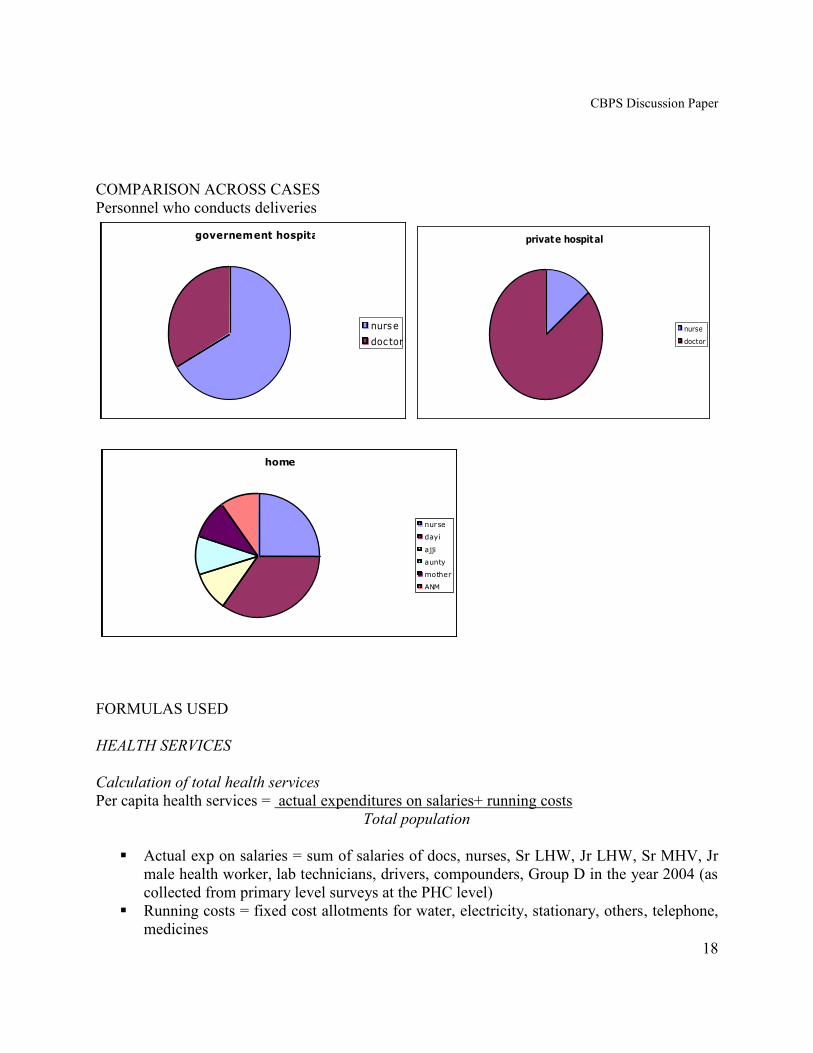
11000 for delivery. In 66.7% of the cases, the nurse conducted the deliveries and in the rest of
the cases, a doctor conducted the delivery. 33% of the women faced some complication during
delivery.
For the total costs, an individual would spend anywhere between 1800-2200 Rs during their
pregnancy. The median value of expenditure was Rs. 1380.
NOTE: - In the next two analyses, the sample set for each is very small and hence the trends
determined in analysis may not represent the sample population.
PRIVATE HOSPITAL DELIVERY
The database of the private hospital delivery category consists of 22 observations.
The average age of the sample interviewed was between 24-25 years and the annual income s
ranged from 2000 to 60000. The mean annual income was 15880, which was relatively close to
the median value. There were on average 6 members in the household. At 20 years (average)
most of the women had had their first child. 63.6% of the women said they faced some
complication during their pregnancies.
In previous pregnancies, 31.8% of the women have had abortions and the same percentage of
women lost of their children after childbirth.
For Antenatal care, the individual would spend on an average 1300 – 1700 Rs. In this sample set,
we find that all the women have had TT injections, 95.5% have been given IFA tablets, 86.4% of
the women have had a urine test and 90.9% of the women have had a blood test. 14
13
The costs of deliveries include only the cost incurred to the individual in payments to doctors,
nurses, dayis, ANM, etc for conducting the delivery. 14
Since there is no information on what is the exact point of ANC service delivery, one cannot
make any conclusions regarding the quality of ANC given by each individual service
(government or private).
CBPS Discussion Paper
15
50% of the women have had some complication during delivery. An individual has paid anything
between Rs 55 and Rs 45000 for delivery services. On average, for a delivery in a private
hospital, an individual spent between 10300-14300 (the median value is 6300).
The per capita expenditure on private health services works out to be close to 13900 Rs. The
median value is Rs 7500 and the per capita expenditure ranges from 1200 – 49500 Rs.
HOME DELIVERY
In the home delivery category, it was determined that there were 20 observations that were
relevant to the analysis.
The average age of the population interviewed was 23 and their annual income on average was
11775. The median value was 6500. Here too, there were on average 6 members in the
household. Most of the women interviewed were 18 at the time of their first pregnancy. 45% of
the women said they faced some complication during their pregnancies.
Individuals in the sample have on average 2 children. 5% have had abortions previously and10%
of the women have lost their children soon after child birth (in previous pregnancies).
Though the average value of the payments for any Antenatal care was close to 500 with a
standard error of the mean of 142, the median value was 280 Rs. All the women in the sample
have had TT injections for their last delivery. 85% were given IFA tablets and the same
percentage has had their urine tested. 90% of the women have had a blood test done during their
pregnancies.
For the delivery alone, the individual paid up to 4395 Rs. The average ranged from 500-900 Rs.
The median value is Rs 50. In the sample 35% of the deliveries are conducted by the dayi, who
will charge on the average Rs50 per delivery. A nurse conducts close to 25% of the delivery and
will probably charge anywhere between 500-1000 for the delivery. This is probably the reason
one sees such large range in the sample. 20% of the sample has had some complication during
delivery.
Consequently, a delivery at home will cost anywhere between Rs 50 – Rs 4500. The average
value is Rs 1265 (with a standard error of 339). The median value for cost of delivery is Rs510.
Summary-
In addition to there being a gap between allocations and expenditures, one finds that between the
ninth and the tenth plan budget, allocations to family welfare and MCH in medical and public
health as a percent of the total state health budget have decreased. One reason might be that,
with the introduction of the national rural health mission, the state government has begun to
CBPS Discussion Paper
16
divert its resources away from the same. Another reason could be that the state is abdicating it
responsibility towards family welfare and RCH. In the era of reforms. This needs deeper study.
A cross section comparison of total allotments for the health budget reveals that Chamarajnagar
gets a lower allotment than Chitradurga. This trend is consistent within the heads also. Only in
the allocations of the state to the TPs to these districts, does Chamarajnagar get a higher
allocation. The reasons that could probably explain this are 2 fold-
Chitradurga is an older district and hence its allotments have been constantly revised to
reach this figure.
Chitradurga, has a larger population.
Another trend that can be noticed with the government welfare budgets is that, the government
has reduced RCH to programmes such as TT, ANC coverage. What constitutes the broad
heading of ANC is not known. Also, their targets include coverage of immunization (mostly for
children) and sterilization. The state government is into mass media education for MCH. So
while the state is claiming to have more than 100% coverage on their various programmes, the
people of Chamarajnagar are not of the same opinion. In the household data, it can be found that
except for the print media, there is a majority of the sample that has not heard of RCH through
any media. A plausible reason could be that the state has not carried out these programmes as
effectively in Chamarajnagar.
While we look at the budgets, we find that the post box system of service delivery15
seems to
have been circumvented in the plan expenditure allocations. We find that the state has separate
provisions for the Zilla and the Taluk Panchayats but this is the level at whoich services are
delivered.
The problem of this budget analysis is that the heads identified as allied services of MCH are
under various collective heads. It almost impossible to determine what proportion of allocations
to water, electricity and even PHCs would go into maternal health.
When we compare the results from the PHC level data and the household level data, it can be
seen that, while the ANM claims that only 34% of the deliveries were institutional deliveries,
71.8% of the household observations used hospitals. the ANM’s list says that 21% of the
deliveries were conducted by the ANM, but the household data says that 10% of the deliveries at
home were conducted by the ANM. There is no mention of ANM delivering in the hospitals. The
problem with making such a comparison is the time period of the sample. The PHC data has
been collected in 2003-04, but the delivery data has a more random time period.
In the household data, 33 observations were pregnant at the time of the survey. Out of these,
93.9% of the women had taken a TT injection and 81.8% had been given IFA tablets. From the
15
The post box system refers to the transfer of funds from the state to the ZP. The funds are then
transferred to the TPs through the ZPs.
CBPS Discussion Paper
17
PHC level data, we find that 80% of the women had received IFA, but only 56% had been given
TT1. Does the discrepancy of TT given mean that TT is not being delivered properly at the PHC
level? Does it mean that the women are using some other service for TT injections delivery?
There can be verified when the database is complete.
There is no mention of any individual who has used the PHC for delivery in the household data.
This could also be due to the fact that service delivery of the PHC comes under the broad head of
government hospital. This needs to be verified.
In the household data, we find that 12% of the women said they had RTIs and 10% said they had
consulted a doctor regarding the same. This could indicate that there are women who are aware
about the disease but are not talking to doctors about the same. This shows the possibility of a
communication gap between the individual and their accessibility to services.
Of those who had their deliveries in a government hospital, 98.2% only had their TT injections.
A 98.2% of TT injections might imply any if the 2 things, 1. The women were not given any TT
due to laxness on part of government services, 2. The women were not given TT due to some
medical reason (such as quick succession of conception or so on). This trend is only observed in
the government hospital. All the individuals who had their deliveries either in private hospitals or
at home had TT injections. However, since it is difficult to determine the point of service of
delivery for TT and so on, this observation might be baseless.
It has been found that between the government hospital and the private hospital, there is a greater
percent of women who have had their blood and urine tested if they have gone to the private
hospital for their delivery.
Of those who had abortions, 86.4% went to hospitals for their deliveries and 4.5% used their
homes for deliveries. Also, all those who had more than one abortion have used the services of
the hospital for their last delivery. Of those women whose children were born still, 85% accessed
the hospitals for their deliveries. A more rigorous exercise needs to be done before any
conclusive statement is made.
It was determined that, at the maximum the government spends Rs 556 on average per for MCH
and Rs 192 for RCH at the PHC level. On the individual front, for using services of the
government, the women pay close to Rs 1000 for a delivery. The woman seems to be paying for
free services.
CBPS Discussion Paper
18
COMPARISON ACROSS CASES
Personnel who conducts deliveries
governement hospital
nurse
doctor
private hospital
nurse
doctor
home
nurse
dayi
ajji
aunty
mother
ANM
FORMULAS USED
HEALTH SERVICES
Calculation of total health services
Per capita health services = actual expenditures on salaries+ running costs
Total population
Actual exp on salaries = sum of salaries of docs, nurses, Sr LHW, Jr LHW, Sr MHV, Jr
male health worker, lab technicians, drivers, compounders, Group D in the year 2004 (as
collected from primary level surveys at the PHC level)
Running costs = fixed cost allotments for water, electricity, stationary, others, telephone,
medicines
CBPS Discussion Paper
19
Total population = covered by each PHC (lists maintained at the ANM level.
Possible problems in the population collected- cant tell how many of the population
actually access the PHC services. We assume that since then ANM has collected the info,
she covers the population and thus, indirectly they are connected to the PHC services.
RCH SERVICES
Calculation of RCH using a different population figure
Per capita health services = actual expenditures on salaries+ running costs
Total sample population
Actual exp on salaries = sum of salaries of docs, Jr LHW, Group D in the year 2004 (as
collected from primary level surveys at the PHC level)
Running costs = fixed cost allotments for water, electricity, medicines
We assume that 25% of he drugs going into FW goes into MCH in particular
Total sample population = sum of number of women in the eligible couple list and list of
children between the ages of 0-5. We assume they constitute half the eligible couple list
and include all women who are in their productive age groups
Calculation of MCH per capita
Per capita health services = actual expenditures on salaries+ running costs
Total sample population
Actual exp on salaries = sum of salaries of docs, Jr LHW, Group D in the year 2004 (as
collected from primary level surveys at the PHC level)
Running costs = fixed cost allotments for water, electricity, medicines
We assume that 25% of he drugs going into FW goes into MCH in particular
Total sample population = sum of number of pregnant women and list of children
between the ages of 0-5.
However, one needs to determine what part of the ANM or doctor’s time will go into RCH
programmes and consequently their salaries need to be reduced. Also, by assuming that the entire
infrastructure cost allocations goes into RCH is a limiting value to the validity of per capita
MCH. For example, if we assume that on the whole, 10% of the expenditure of the PHC goes
into RCH, our numbers are reduced to Rs 55 for MCH and Rs 19 for RCH. Hence knowing these
values will make a tremendous difference to the costs estimated.
AREAS FOR FURTHER ANALYSIS
1. Developing new methods to unbundled costs of RCH within the PHC.
CBPS Discussion Paper
20
2. Determining a time discounting factors for medical and paramedical staff to calculate
the exact costs of providing RCH services.
3. Obtaining morbidity patterns for RCH through the PHC.
4. Looking at Central Allotments for RCH head wise and hence determining the
direction of flow of funds.
5. Increasing the size of the database of the household analysis to make conclusions
more definitive.
6. Enlarge the size of the Chitradurga database for both PHC level data and household
data.
7. Improve the income database of the household data.
8. checking if there are any income effects that determine choice of services once the
data on income ahs been reentered.
9. Obtaining data on where ANC was delivered.
APPENDIX
Budget Heads we have looked at
STATE BUDGETS
State level
Rural health services Family Welfare
Health sub centres (+capital building) Providing infrastructure under FW
Subsidiary health centre Maintenance of equipment
Establishment of new sun centres MCH at PHC level
PHC (+capital buildings) Disposable Delivery kits
CHC (+capital buildings) Child survival and safe motherhood
Other expenditures Maintenance of cold chain equipments
Water supply to rural health institutions Training in FW & MCH
ICDS project Post Partum Programmes
School health services Akshara Arogya
IPP (III) Purchase of vehicles
Health and FW training centres Women’s health care
Training of senior lab technicians Loans to paramedical staff for 2 wheeler
Programme for women Provisions hygiene kits for rural women
Health programmes for SC/ST women
Training of junior lab technicians
Refurbishing existing PHCs
ZP level
Rural health services Family Welfare
Health Sub centres Disposable Delivery kits
Subsidiary Health Centres Child Survival and Safe Motherhood
PHC (+capital buildings)
CBPS Discussion Paper
21
CHC (+capital buildings)
Hospital Dispensaries
Provision of Ambulance vans
Establishment of blood banks
Mobile health units
Strengthening of PHU (+maternity annexure)
Establishment of PHU (+capital buildings)
Construction of Post Partum rooms
Establishment of Sub Centres (MNP)
Water supple to rural health institution.
These figures include budget as well as actual expenditure for the 9th
plan. The 10th
plan figures
include the projected expenditures.
ALLOCATIONS TO THE ZILLA PANCHAYAT BUDGETS
Plan Expenditures
Medical and Public Health Family Welfare
Zilla Panchayat schemes Zilla Panchayat Allotments
PHC State Schemes
PHC (MNP) Compensations
Upgradation of PHC to CHC Supply of drugs under Family welfare
Provisions for Ambulances Transport
Establishment of blood banks
Repairs to hospital equipment Centrally Sponsored Schemes
Direction and Administration
Taluk Panchayat schemes District Family Welfare Schemes
Rural health services Training of Dais
Health Sub Centres Compensation
Strengthening of PHUs (maternity homes) IUD Vasectomy and Tubectomy
Establishment of Sub Centre Mass Education
Other Expenditure other services and supplies
School Health Services District Post Partum Programmes
Supplies and materials
Non – Plan Expenditures
Medical and Public Health Family Welfare
PHC Population Centres
PHC (GOI Patterns) Zilla Panchayat Schemes
Upgradation of PHC TO CHC
Drugs and Chemical to Allopathy and Medicines
Strengthening of PHUs (+maternity homes)
Establishment of Sub centres
CBPS Discussion Paper
22
Buildings
Water and Electricၩty
Telephone
Taluk Panchayat Scheme
Health and family welfare performance budget (2004-05)
Direction & administration
Training
Urban FW service
Maternity and Child health
Transportation
Compensation
Mass education
Selected area programme (include IPP)
Assistance to local bodies, corporations etc
Assistance to Zilla Panchayats
Other service and suppliers
Expenditure
In our discussions we often found that it was acknowledged that firm data were not available. In
its absence, decisions have been based on ad hoc and arbitrary hunches etc. Our effort to use
available data shows that the answers we seeks cannot be extracted from this data.
This leads to a dilemma. Do we continue to make ad hoc and arbitary decisions, bemoaning the
lack of data? or do we, on the basis of exercises like this one, try and improve the database?
We hope this discussion, which has pointed out specific gaps in availability of data, will
contribute to finding a solution to this question. Maternal health is too important a matter to
ignore for ever.