Embed Size (px)
Citation preview

1
Reproductive success in a tropical tree species, Virola surinamensis
Undergraduate Research Thesis
Presented in Partial Fulfillment of the Requirements for graduation “with Research
Distinction in Evolution, Ecology and Organismal Biology” in the undergraduate colleges
of The Ohio State University
by
Megan Sullivan
The Ohio State University
March 2014
Project Advisor: Dr. Liza Comita, Department of Evolution, Ecology, and Organismal
Biology
2
Introduction
Tropical forests are a haven for biodiversity. Determining the driving forces behind this pattern
of high diversity in tropical forests has been a question that researchers have been investigating
for quite some time. It is thought that violations of the competitive exclusion principle allow for
greater diversity (Wright 2002, Connell 1971, Janzen 1970). Tropical tree species violate this
principle in different ways and persist in competition against one another through a variety of
mechanisms, ultimately, to obtain reproductive success. Reproductive success is when an
individual is more successful at surviving and reproducing respective to other individuals of the
species (Bergstrom and Dugatkin, 2012). Many different mechanisms can affect reproductive
success and many different characteristics can drive these mechanisms.
Reproductive success in plants results from a number of processes. Fruit production (the number
of seeds that the tree produces initially) is the starting point for measuring reproductive potential.
Fruit production in individuals can be affected by factors such as the amount of available
resources (e.g., light, water, and nutrients) and competition by the surrounding neighborhood of
plants for those resources (Lee and Bazzaz, 1982, Graham and Wright et. al. 2003). Another
specific limiting resource to consider is the availability of pollen. In dioecious, self-incompatible
tree species, pollen limitation occurs when the frequency of male individuals in the surrounding
neighborhood is too low to allow for the fertilization of ovules in a female individual (Burd
1994). While past studies have argued for either resource limitation or pollen limitation driving
fruit production in plants (Campbell and Halama 1993), these processes are not necessarily
mutually exclusive and can both simultaneously play a role in determining fruit production.
3
Once fertilization has occurred, fruit and seeds start to mature. However, not all will mature.
Ovules and fruit may be absorbed or aborted by the plant. Further, the potential for loss of these
seeds must be considered. Insect predation is a process that causes a loss of many viable seeds
from the total seed crop produced (Mezquida and Olano 2013). Moreover, there is strong
evidence that predators play a role in reducing seed crops and determining the diversity of
tropical forests (Carson and Schnitzer 2008, Janzen 1970, Connell 1971). When more fruit is
produced in one area (either due to an individual crop or a conspecific neighborhood), it is more
likely that more insects will be attracted to that area to predate upon the seeds. The mechanism of
predation lowers the reproductive success of the individual crop/the conspecific neighborhood as
a whole by removing a large portion of seeds and decreasing the probability that a conspecific
individual will replace the adult individual. This allows for other species to enter the area and
thus increases local and community diversity (Carson and Schnitzer 2008). Pre-dispersal insect
predation is a method of predation that affects seeds when they are still on the tree. The evidence
of this type of predation is easy to measure, by the observation of an exit hole from the insect
larvae when looking at seeds underneath the canopy of a tree. It has been shown that 58% of
insects are host-specific at the family level of plants, and 99% of granivores are family-specific
predators, with larval host plants being more specific to predators than adult host plants
(Novotny and Basset 2005). Therefore when considering the effect of density dependence on the
rate of pre-dispersal insect predation, both the seed crop of the individual and of the conspecific
neighborhood of trees should be considered (Jones and Comita 2010, Mezquida and Olano
2013). An increase in the number of seeds produced per individual and per neighborhood may
attract more insect predators to the area, which would likely lead to a higher percentage of seeds
being predated upon. However, it is possible that predator satiation occurs at the highest levels of

4
seed production (Augspurger 1981, Jones and Comita 2010), when a tree produces more seeds
than the insect population can consume, allowing some seeds to escape and survive to seedlings.
Finally, after considering the number of seeds produced and accounting for the loss of some of
the seed crop from predation, reproductive success is also influenced by germination rate. The
variation in germination of seeds can be affected by several factors and trade-offs. For example,
Leishmans (2001) shows a trade-off between seed number and seed size. All else being equal,
the size of a seed can then affect the burgeoning plant’s ability to survive and establish, as larger
seeds contain more resources that are necessary to the growth and development of the new plant.
However, each parent individual only has a certain amount of energy to invest in reproduction
and cannot produce both numerous and the largest seeds. Another principle that could affect
germination rates is inbreeding depression. Inbreeding depression is the result of having two
parent individuals that are closely genetically related. The offspring of these two closely-related
individuals have lower vigor and less chance of surviving than the offspring of two unrelated and
genetically different individuals. Pollen limitation may increase the chance of inbreeding
depression in the offspring if there are few male trees in the area and these male trees are all
highly genetically related to the female tree (Gonzalez-Varo & Traveset, 2010).
Fruit production, insect seed predation, and germination are therefore important factors that
affect the fitness of individual plants. To explore how factors may affect fitness of tropical trees,
I took measurements of fruit production, pre-dispersal insect predation, and germination rates for
10 individuals of Virola surinamensis, a common dioecious tree in the semi-deciduous tropical
forest of Panama. To determine what drives variation in these different processes, I measured the
size of each focal tree (quantified as canopy area) and estimated the amount of competition for

5
abiotic resources that each tree experienced (quantified as level of liana infestation and basal area
of neighboring trees) to determine how tree size and resource competition affected fruit
production. I estimated the amount of competition for pollen (quantified as basal area of
neighboring non-fruiting conspecific neighboring trees) to determine whether there was a pattern
of pollen limitation that affected fruit production or a pattern of inbreeding depression that
affected the germination rates of seeds. I also estimated the fruit crop at the individual scale
(quantified as total number of seeds produced and mean seed weight) and the fruit availability at
the neighborhood scale (quantified as fruiting conspecific basal area of neighboring trees) to see
if these characteristics affected variation in post-seed-production reproductive success
mechanisms (insect predation and germination).
Hypotheses:
1. Fruit production will primarily be affected by the parent tree’s access to resources and
pollen, with larger female trees that are closer to male trees producing more fruit. The
level of competition in the surrounding neighborhood for these resources will also affect
fruit production, with trees in high areas of competition producing fewer fruit.
2. Insect predation will increase with seed availability at both the individual and
neighborhood scale.
3. Germination rate will be affected by seed weight/seed number trade-offs and by pollen
availability and inbreeding depression.

6
Methods
Study Site
I conducted my research in a tropical lowland forest on Barro Colorado Island (BCI) in the
Panama Canal Zone (9º09’N, 79 º 51’W). Annual rainfall ranges from 193 to 363 cm, with the
wet season starting in May and lasting through mid-December (Croat 1979). The average annual
temperature is 27º C (Leigh, E.G. 1999). Tree diversity varies widely on the island (Hubbell, et.
al. 1999). Large to medium trees are at peak flowering activity in March and April, while fruiting
activity has its largest peak in April and then a second, smaller peak in August (Croat 1979).
Species Description
Figure 1: Virola surinamensis seed
Virola surinamensis (Rol.) Warb. (Myristicaceae) is a canopy
tree that occurs from Costa Rica and Panama to Brazil. It is
listed as one of the more common trees on Barro Colorado
Island, mainly being found in the old forest areas (Croat
1979). The fruiting period of Virola trees is between April and
September, with a peak in July or August (Howe 1983). The
seeds of V. surinamensis are covered by a red aril and each
seed is held inside a yellow, bivalved capsule [Fig.1]. There is
one seed per fruit. When the fruits ripen they dehisce, the seeds are eaten by bird or monkeys or
drop to the ground, and afterward the woody capsule then also drops to the ground, where it can
persist for up to a year (Croat 1979, Howe and Vande Kerckhove 1981).
Fruit Counts, Canopy Area, and Insect Predation

7
To estimate fruit production, 10% of the projected canopy area of the tree was randomly
sampled. Canopy area of each tree was measured by staking transects in 8 directions (N, NE, E,
SE, S, SW, W, NW) to form wedges out from the trunk of the tree to the edge of the canopy. The
area of each wedge was calculated, and the eight wedge areas were added together to get the total
canopy area. Canopy area was divided by ten to determine how many sample quadrats were
needed. Quadrats were 1 m2 and were randomly placed along the transects beneath the measured
canopy area of the tree. Fruit counts recorded number of mature fruit (i.e. capsule with mature
seed still attached), immature fruit, whole capsules without seeds, half capsules without seeds,
intact seeds, seeds with fungal damage, and seeds with insect predation damage (as indicated by
the presence of an exit hole in the seed). Total estimated fruit production was calculated with the
formula (Howe 1981):
Total = (fruit + seed + whole capsules + (half capsules/2)) ∙ 10. (1)
Fruit counts were completed twice, once during the fruiting season in August and once after the
fruiting season was over in November for the ten focal trees. Total fruit counts at time one and
time two were highly correlated (r = 0.973, P < 0.001), so data from the August counts were
used in all statistical analyses. Percent insect predation was not correlated at time one and time
two (r = 0.41, P = 0.24), so insect seed predation for each time period was analyzed separately.
Average insect predation was calculated within categories of low, medium, and high fruit
production to determine whether there was a significant difference in the level of insect predation
between categories.
Neighborhood measurements
8
Competition was quantified in terms of liana infestation and size and basal area of neighboring
trees in order to determine if competition with the neighboring plants had an effect on fruit
production. To quantify liana infestation, each tree was scored on a four-point scale (by
categories of 025%, 25–50%, 50–75%, and 75–100%) that measured how much of the canopy of
the tree, on sight, showed signs of liana infestation (van de Heijden et. al., 2010). To quantify the
neighborhood of surrounding trees, transects were measured in 8 directions (N, NE, E, SE, S,
SW, W, NW) to form wedges from the trunk out to 30 meters. Within each wedge, the diameter
at breast height (DBH) of trees were measured 1.3 meters from the ground. Conspecific (same
species) trees with a DBH of 10cm or greater were thought to be of large enough size to be
flowering and fruiting adults and thus were measured and recorded. Heterospecific (different
species) trees with a DBH of 30cm or greater were thought to be of large enough size to make an
impact on resource competition and thus were recorded and measured. In order to estimate
neighborhood fruit and pollen availability, we recorded whether the neighboring conspecific
trees were fruiting or non-fruiting, with the assumption that non-fruiting trees were male. From
the DBH of each tree, the conspecific and heterospecific basal area was calculated with the
formula BA=(DBH/2)2xpi.
Seed Mass
Seed mass was measured in eight out of ten focal tree species. To measure fresh mean seed mass,
50 seeds were collected and weighed together for each tree. The weight was divided by the
number of seeds to obtain the mean seed mass for the tree
Germination Rates
9
Germination rates were measured in eight out of ten focal tree species. To determine germination
rates of seeds, at least 50 (and up to 350) seeds were collected from underneath the canopy of
each focal tree. These seeds were then surface sterilized by first removing the arils and then
being soaked in a 70% ethanol solution for two minutes, being rinsed with water, being soaked in
a 10% bleach solution for two minutes, and being rinsed with water again. The seeds were then
germinated in trays of soil sterilized by autoclaving. Seed were monitored for eleven weeks to
determine germination rates of each focal tree.
Statistical Analysis
A linear regression model was used to determine the effects of different variables on fruit
production. Generalized linear models with binomial errors were used to determine the effects of
different variables on the proportion of seeds that were predated by insects and the proportion of
seeds that germinated. All statistical analyses were done in the R statistics package version 3.0.2
(R Core Team 2013).
Results
Fruit Production
Estimated fruit production was variable between trees, (mean = 5,957.5 ± 4,632.3 (SD), range =
735–17,265). A linear multiple regression model was used to determine if plant competition for
abiotic resources (defined as liana infestation and basal area of heterospecific neighboring trees),
plant competition for pollen (defined as basal area of fruiting conspecific neighboring trees),
seed weight, pollen limitation (defined as non-fruiting conspecific basal area) or tree size
(defined as canopy area) had any effect on seed production. There was no significant effect of
plant competition or seed weight on fruit production, but tree size was found to be significantly

10
positively correlated with fruit production (r2 = 0.79, P = 0.014) [Table 1, Fig. 2a]. No
significant correlation was found, indicating that there is no seed weight/seed number trade-off
taking place in the focal trees studied [Table 2, Fig 2f].
Variable Estimate Standard
Error
T value Pr (>|t|)
Intercept 1868.8 2491.25 0.750 0.4949
Canopy area 30.04 7.22 4.160 0.0141*
Liana 655.09 1095.86 0.598 0.5822
Heterospecific Basal
Area
-0.017 0.014 -1.185 0.3015
Non-fruiting
Conspecific Basal
Area
-0.14 0.16 -0.918 0.4107
Fruiting Conspecific
Basal Area
0.49 0.48 1.027 0.3626
Table 1: Results of fruit production linear model - Canopy area is the only
independent variable that had a significant effect on the number of fruit produced by an
individual
11
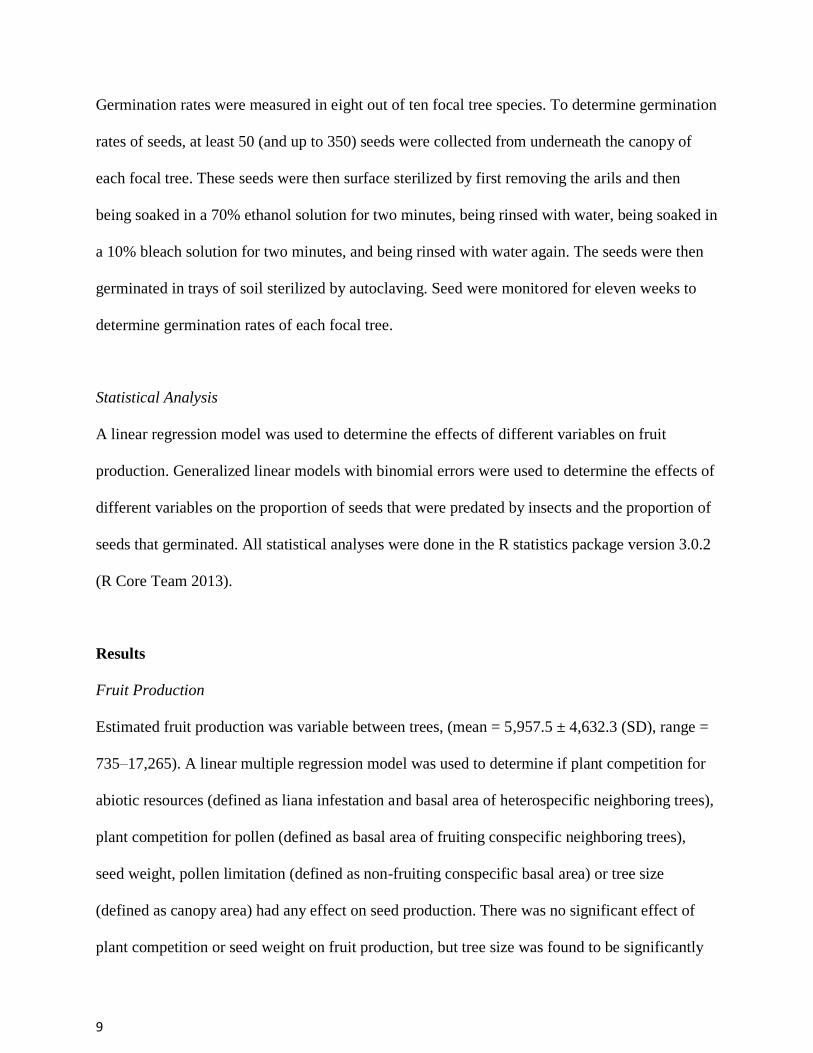
Figure 2. Fruit production in Virola surinamensis. A) Fruit production as a function of tree size –
There is a positive correlation between tree size (measured as canopy area) and fruit production.
2B) Fruit production as a function of liana infestation; C) Fruit production as a function of
heterospecific basal area; D) Fruit production as a function of non-fruiting conspecific
basal area; E) Fruit production as a function of fruiting conspecific basal area; F) Fruit
production as a function of mean seed weight – There is no correlation between liana
infestation, heterospecific basal area, non-fruiting conspecific basal area, fruiting conspecific
basal area, or mean seed weight and fruit production
2A) 2B) 2C)
2D) 2E) 2F)

12
Variable Estimate Standard Error T value Pr (>|t|)
Intercept 16520.00 17753.71 0.931 0.388
Mean Seed
Weight
-80.14 136.31 -0.588 0.578
Table 2: Results of fruit production vs. mean seed weight model – The model indicates that
there is no seed number/seed weight tradeoff happening in fruit production.
Insect Predation
Insect predation rates were highly variable among focal trees (mean= 24.4% ± 23.0% (SD),
range = 6.9–76.3%) in the August counts. A generalized linear model with binomial error was
used to determine whether the surrounding conspecific neighborhood (defined as basal area of
neighboring trees) or total fruit produced affect insect predation rates. Insect predation rates were
found to be significantly negatively correlated with fruiting conspecific basal area (P = 0.0242)
and total fruit (P < 0.001) [Table 3a]. However, when using the model with binomial errors the
data was found to be overdispersed. When using a generalized linear model with quasibinomial
errors to account for the overdispersion, predation rates were not found to be significantly
correlated with any of the independent variables [Table 3b]. Results for percent insect predation
at time two (November) showed a significantly positive correlation between insect predation and
both total fruit (P < 0.001) and fruiting conspecific basal area (P < 0.001) when tested with a
generalized linear model with binomial error [Table 3c]. However, data was overdispersed in this
model and a generalized linear model with quasibinomial errors was used to account for this..
Neither total fruit nor conspecific basal area were significantly correlated with insect predation in

13
the generalized linear model with quasibinomial errors [Table 3d]. The highest predation rates
were present at intermediate levels of fruit production, while trees with low and high seed
production both showed lower levels of insect predation rates. The high variability in the
intermediate category of fruit production meant that insect predation rate differences between the
low, medium, and high categories of insect predation were not significant [Fig. 3a, 3b].
Variable Estimate Standard Error T value Pr (>|t|)
Intercept -6.69e-01 1.29e-01 -5.18 2.2e-07***
Total Fruit -1.08e-04 1.18e-05 -9.13 <2e-16***
Fruiting Conspecific
Basal Area
-1.02e-04 4.52e-05 -2.25 0.0242*
Table 3a: Results of predation rate generalized linear model with binomial errors (August)
– Total fruit and fruiting conspecific basal area were found to be significantly negatively
correlated with predation rate.
Variable Estimate Standard Error T value Pr (>|t|)
Intercept -6.69e-01 7.72e-01 -0.867 0.414
Total Fruit -1.08e-04 7.058e-05 -1.53 0.170
Fruiting Conspecific
Basal Area
-1.02e-04 2.70e-4 -0.377 0.717
14
Table 3b: Results of predation rate generalized linear model with quasibinomial errors
(August) – None of the independent variables were found to be significantly correlated with
predation rate.
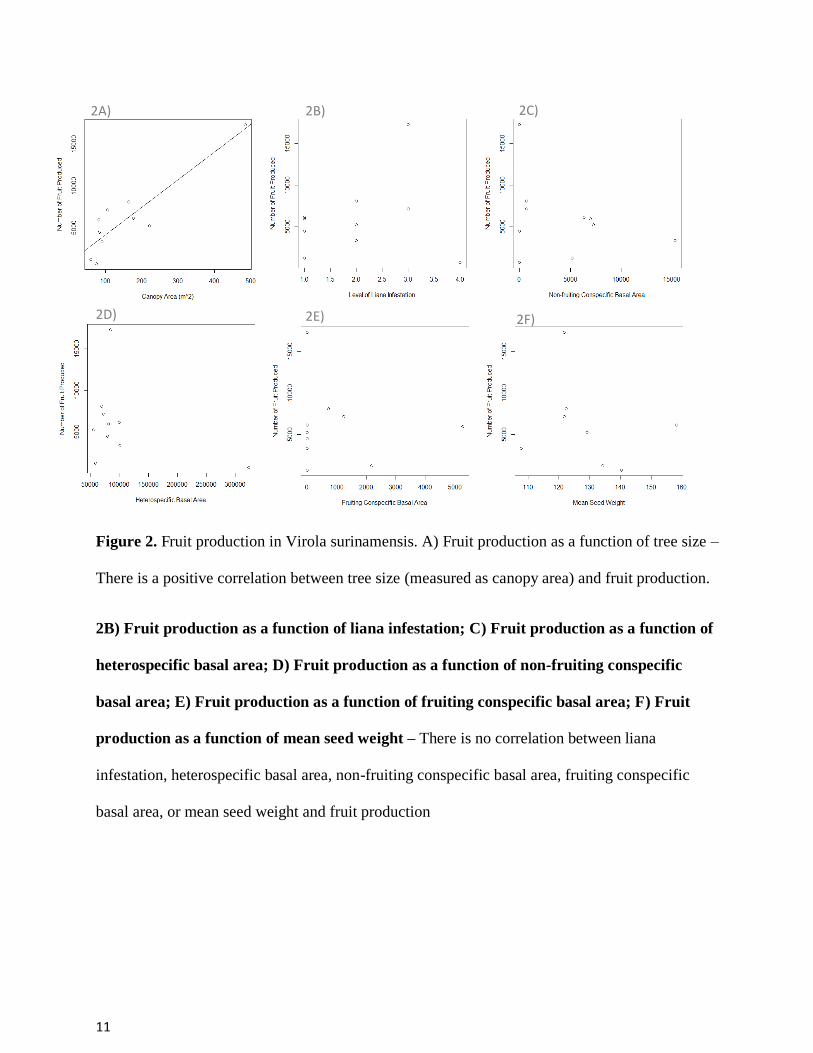
Variable Estimate Standard Error T value Pr (>|t|)
Intercept -4.17e-01 1.88e-01 -2.213 0.0269*
Total Fruit 1.92e-04 4.65e-05 4.134 3.57e-05***
Fruiting Conspecific
Basal Area
3.383e-04 6.816e-05 4.964 6.92e-07***
Table 3c: Results of predation rate generalized linear model with binomial errors
(November ) – Total fruit and fruiting conspecific basal area were found to be significantly
positively correlated with predation rate.
Variable Estimate Standard Error T value Pr (>|t|)
Intercept 4.17e-01 5.02e-01 -0.830 0.434
Total Fruit 1.92e-04 1.24e-04 1.550 0.165
Fruiting Conspecific
Basal Area
3.38e-04 1.82e-04 1.861 0.105
Table 3d: Results of predation rate generalized linear model with quasibinomial errors
(November) – None of the independent variables were found to be significantly correlated with
predation rate.

15
Figure 3A) Insect predation rates – The data shows insect predation rates increasing towards
medium levels of seed production and then decreasing at the highest levels of seed production.
This pattern could indicate density dependence at low to medium levels of seed production and
insect predator satiation at high levels of seed production.
Figure 3B) Level of insect predation – Insect predation rates were highest in medium levels of
seed production and lowest at the lowest and highest levels of seed production. Insect predation
rates were also most variable in the intermediate level of seed production.
Germination
Germination rates were highly variable (mean = 25.9% ±18.2% (SD), range = 7.6–57.0%)
amongst eight focal trees. Generalized linear models with binomial error were used to determine
whether the pollen availability (quantified as non-fruiting conspecific basal area), seed weight, or
total seeds produced affected germination. Total fruit production was found to be significantly
negatively correlated with germination rates (P < 0.01) and non-fruiting conspecific basal area (P
= 0.0984), while mean seed weight did not show a correlation with germination rate [Table 4a].
3B) 3A)
16
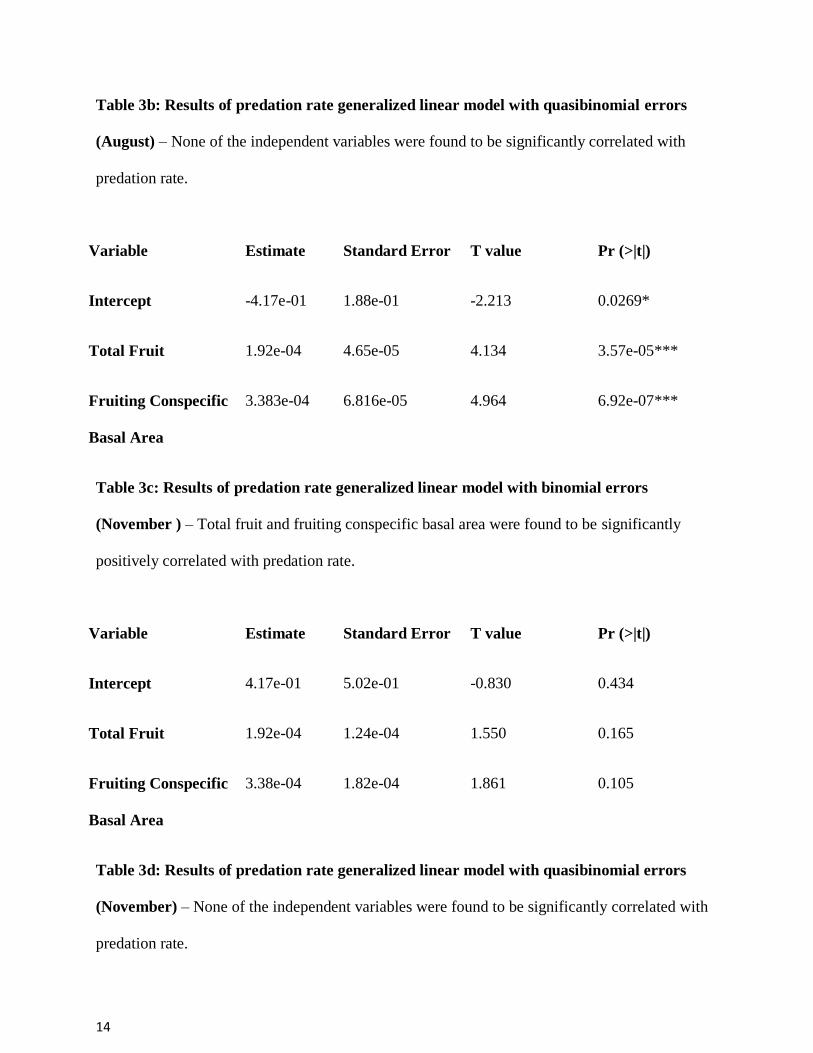
However, the data was found to be over-dispersed in the model with binomial errors. When
using a generalized linear model with quasibinomial errors to account for the overdispersion, the
model showed that none of the independent variables tested were significantly correlated with
germination rates [Table 4b].
Variable Estimate Standard Error T value Pr (>|t|)
Intercept -9.49e-01 5.86e-01 -1.619 0.1054
Total fruit -1.31e-04 1.83e-05 -7.169 7.55e-13***
Non-fruiting
Conspecific
Basal Area
-2.20e-05 1.33e-05 -1.652 0.0984 .
Mean Seed
Weight
6.21e-03 3.92e-03 1.585 0.1130
Table 4a: Results of germination rate generalized linear model with binomial errors– Total
fruit and non-fruiting conspecific basal area were both significantly correlated with germination
rates, while mean seed weight did not have a correlation with germination rates.

17
Variable Estimate Standard Error T value Pr (>|t|)
Intercept -9.49e-01 5.088 -0.187 0.861
Total Fruit -1.308e-04 1.58e-04 -0.826 0.455
Non-fruiting
Conspecific
Basal Area
-2.20e-05 1.16e-04 -0.190 0.858
Mean Seed
Weight
6.21e-03 3.40e-02 0.183 0.864
Table 4b: Results of germination rate generalized linear model with quasibinomial errors–
None of the independent variables were significantly correlated with germination rate.
Figure 4A) Germination rate as a function of mean weight
Figure 4B) Germination rate as a function of total number of seeds
4A) 4B)

18
Discussion
Out of the three factors studied, fruit production was the only one that showed a significant
relationship (with tree size). Insect predation did not have a significant relationship with seed
availability, but a pattern of density dependence and insect predator satiation may be indicated in
the data. Germination did not show a relationship with a seed weight/seed number trade-off or
show any relationship that was indicative of inbreeding depression.
Fruit Production
Given that the only variable found to be a significant driver of fruit production was tree size
[Table 1, Fig. 2a], it is clear that being a larger individual is beneficial to the reproductive
success of the plant. A larger parent tree is better able to compete for and obtain resources such
as sunlight, water, and soil nutrients. This pattern matches ones that have been found in previous
studies (MacFarlane and Kobe 2006, Thomas 1996, Eriksson and Jakobsson 2000; Weiner and
Thomas 2001). Obtaining more physical resources allows for more energy to be allocated to
reproduction and more seeds to be produced. A larger canopy area would be able to take up more
sunlight for photosynthesis. Also, a larger canopy area could be indicative of a larger root
system, because larger trees would need more support, and that could better allow the tree to take
up more soil nutrients and water from the soil.
Because there was no significant correlation between mean seed weight and total number of fruit
counted [Table 2, Fig. 2f], there doesn’t seem to be a trade-off between seed weight and seed
number, despite a trend in this direction. This trade-off principle was not a strong enough driver
to be seen in the population studied. This could be because that tree size has such a strong
relationship with seed number, and the effects of that relationship need to be removed for

19
evidence of a trade-off pattern to be seen (Michaels et. al. 1988). Other studies have found that
while a seed weight/seed number trade-off can be seen among different tree species, within
species variation in seed weight and seed number is more highly correlated with environmental
conditions and that, in general, a species tends towards one strategy (either fewer, larger seeds or
many, smaller seeds) when investing energy in reproduction (Primack 1978, Hardin 1984).
Competition for abiotic resources or pollen did not seem to be a factor in affecting fruit
production [Table 1, Fig. 2b, d, e]. In terms of pollen limitation, a higher number of neighboring
fruiting conspecifics was hypothesized to have a negative effect on fruit production because
there would be increased competition for pollen. However, a higher number of neighboring
fruiting conspecifics could also attract more pollinators to the area, which would positively affect
fruit production. Additionally, a higher number of e neighboring fruiting conspecifics could
indicate that the area that the neighborhood is in is a particularly suitable habitat for Virola trees
and therefore the trees have higher fruit production due to the positive effects of living in that
habitat. Previous studies have shown that limiting sunlight can cause negative effects on tree
species (Virolle et al. 2009). However, because the focal trees were canopy-emergent it is
unlikely that heterospecific neighboring trees would have any effect on the tree’s ability to take
up sunlight. Other factors, such as cloud cover could limit the amount of sunlight that the trees
receive (Wright and Barret 2005), but determining this was outside of the limitations of this
study. Liana infestation did not seem to limit the trees’ fruit production either. This could be due
the different mechanisms by which lianas inhabit host trees. There is evidence that lianas inhibit
fruit production by constricting the growing twigs in the canopy and by reducing leaf area in
certain parts of the tree. Both of these can cause the breakage of twigs and branches in the
canopy and decrease the fecundity of the host tree (Kainer et. al. 2006). Different species of

20
lianas have variable strategies on how to most efficiently obtain resources without damaging the
host tree. Some lianas focus on taking advantage of unused light gaps below the canopy. This
allows these species of lianas to avoid using the thinner, newer branches in the canopy for
support and doesn’t block much of the host tree’s canopy from obtaining sunlight, which would
be detrimental to the host tree and could cause it to die. Other lianas are more aggressive in their
competition for light and support from the host trees, but lianas still obtain only 40–80% of the
light that the host tree canopy does (Ichihashi and Tateno, 2001). The mechanisms and drivers of
liana success are still not fully understood, but research is ongoing to more fully understand how
lianas interact with the environment.
Because non-fruiting conspecific neighbor basal area was not correlated with total fruit
production [Table 1], the female focal trees don’t seem to be pollen-limited. If this were the case,
there would be a significant positive correlation with non-fruiting conspecific basal area and the
fruit production of the focal trees. Therefore I would assume that this is not a significant driver of
fruit production in this Virola surinamensis. However, I would suggest that further studies be
done to come up with more conclusive results Studies using different methods of quantifying
pollination (e.g. distance of male trees from female tree) (House, 1992) and looking how
pollinators can affect fruit set (e.g. long distance vs. short distance pollinators) (Koptor, 1984)
have found that fruit set is affected by pollination when looking at these factors. This
experiment made assumptions about non-fruiting conspecific neighboring trees: first, that these
trees were male individuals and second, that these trees flowered and produced male pollen. It
would be more accurate to check to ensure that both of these are actually true. Another factor to
consider is that more non-fruiting conspecific trees in the neighborhood could offer more pollen,
but at the same time increase the competition for resources in the area. In this case, the positive

21
effects of increased pollen availability could be cancelled out by the negative effects of increased
resource competition. Additionally, this data was limited to 10 trees from one fruiting season. It
is a known phenomenon that trees vary in fruit production from year to year (Mezquida and
Olano 2013, Herrera et al. 1998, Kelly and Sork 2002), and it would be more accurate to have a
dataset that analyzes fruit production over the course of multiple fruiting seasons in order to
ascertain if the variables analyzed have a significant effect on fruit production.
Insect Predation
Though none of the variables tested were found to significantly affect the proportion of seeds
predated upon [Table 3b], qualitatively the data indicates a pattern of density dependence and
insect predator satiation. Negative density dependence is indicated as the proportion of seeds
predated upon increases with increasing fruit production, and then insect predator satiation is
indicated when that proportion peaks near the intermediate level of fruit production and then
drops as fruit production continues to increase (Janzen 1970, Connell 1971, Mezquida and Olano
2013, Jones and Comita 2010).
Given that the data collected is so variable, this specific part of the study would be worth
repeating with a larger sample size and over a longer period of time to account for the spatial and
temporal differences that are related to the variation in fruit production. Varying fruit production
may be a strategy that allows trees to have higher reproductive success (Mezquida and Olano,
2013). By producing fewer fruit, the trees would attract fewer insect predators and would likely
have fewer seeds predated upon. Conversely, by producing more fruit, the trees would attract
more insects. But when producing the most fruit, trees overwhelm the insect population and
insect predator satiation occurs. When this happens, the insects cannot eat as large of a
proportion of the seeds produced and this can compensate for the viable seeds that were lost; it

22
allows the tree to still be reproductively successful. Varying these strategies in different years
means that the ecosystem interactions are constantly changing. This sort of behavior encourages
negative density dependence interactions in the ecosystem and violates the competitive exclusion
principle.
Germination
Mean seed weight was not correlated with germination rate [Table 4b], indicating that seed size
is not indicative of seed quality in terms of germination. Seed weight has been found to be
influenced largely by the pressure to attract dispersers and the pressure to have adequate
resources to germinate and establish as a seedling. Dispersers generally prefer smaller seeds,
while larger seeds have more resources to provide to the emergent seedling. (Howe and Richeter
1982). Additionally, larger seeds may produce larger seedlings, giving them a competitive
advantage against other seedlings. A study by Moles and Westoby (2004) also did not find a
correlation between germination rate and seed weight, but did find a relationship between both
seedling establishment and seed weight and sapling establishment and seed weight. The time
limitations of my study did not allow me to monitor the seedlings past the emergent seedling
stage, but it would be interesting for future studies to look into the relationship of mean seed
weight and seedling/sapling establishment.
Germination rate was not related to non-fruiting conspecific basal area (Table 4b). In past
studies, germination rate has been found to be higher in seeds that have been cross pollinated
(having a lower degree of genetic relatedness between parents) than those that are self-pollinated
(having the highest degree of parental relatedness) (Gonzalez-Varo and Travaset 2010). If non-
fruiting conspecific neighbors were of different degrees of genetic relatedness, a trend in
23
germination rates may exist. However, the results from my experiment don’t show inbreeding
depression and this could be because all pollen donors (the non-fruiting conspecific trees present
in the neighborhood) are equally closely related. If this is the case, then a varying number of
pollen donors would not affect the quality of the seeds and therefore would not affect
germination rate. Another factor to consider again is the assumptions about non-fruiting
conspecific neighboring tree. In future studies it would be more accurate to ensure that these
individuals are actually male and did flower during the pollination season.
Overall
My sample size was limited to eight to ten trees (depending on the data analyzed) and the time
period that I had to collect the data was limited to ten weeks (during one fruiting season). Only
having ten data points from one fruiting season could allow for sampling error to skew the data
in ways that a larger sample size over multiple years would be more immune to. Additionally,
species interactions are complex and vary over time and space. It is possible that the variables
investigated here do impact reproductive success to some degree, however not any one variable
was found to be a major driver in any of the three processes studied.
I suggest that further studies with a larger sample size and over multiple years to include more
fruiting seasons would be worthwhile, especially in the case of insect predation. A trend of
density dependence and predator satiation is suggested by the data collected, but a significant
relationship could not be found given the variation in insect predation rates of the ten trees that I
studied.
24
Acknowledgements
I would like to acknowledge Liza Comita, Simon Queenborough, Jenalle Eck, and Lisa Miller
for their helpfulness and support with this project. The Smithsonian Tropical Research Institute
office in Panama and the facility on Barro Colorado Island provided logistical support. This
project was funded by a Research Experience for Undergraduates (REU) supplement to National
Science Foundation grant number DEB-1242622.
Literature Cited
Augspurger, C. K. 1981. Reproductive synchrony of a tropical shrub - experimental studies on
eff ects of pollinators and seed predators on Hybanthus prunifolius (Violaceae). Ecology 62.
775-788.
Bergstrom, C.T. and Dugatkin, L.A. 2012. Evolution. W.W. Norton & Company, Inc. New
York.
Burd, M. 1994. Bateman’s principle and plant reproduction: the role of pollen limitation in fruit
and seed set. Botanical Review 60. 83-139.
Campbell, D.R. and Halama K.J. 1993. Resource and pollen limitation to lifetime seed
production in a natural plant population. Ecology 74. 1043-1051.
Carson, W.P., Anderson J.T., Leigh, E.G., and Schnitzer, S.A. 2008 Challenges associated with
testing and falsifying the Janzen-Connell hypothesis: a review and critique. 210-241 In: Carson,
W.P., and Schnitzer, S.A. (eds), Tropical forest ecology. Wiley-Blackwell.
Chen, Z.H., Peng, J.F., Zhang, D.M. & Zhao, J.G. 2002. Seed germination and storage of woody
species in the lower subtropical forest. Acta Botanica Sinica, 44. 1469-1476.

25
Connell, J. H. 1971. On the role of natural enemies in preventing competitive exclusion in some
marine animals and in rain forest trees. 298-312. In: den Boer, P. J. and Gradwell, G. R. (eds),
Dynamics of populations. Centre for Agricultural Publication and Documentation.
Croat, T.B. 1979. Flora of Barro Colorado Island. Standford University Press. Standford,
California.
Eriksson, O. 1997. Clonal life histories and the evolution of seed recruitment. The Ecology and
Evolution of Clonal Plants. 211-226. In: de Kroon, H. and van Groenendael, J. (eds,). Backhuys,
Leiden.
Eriksson, O., and Jakobsson, A. 2000. Recruitment trade-offs and the evolution of dispersal
mechanisms in plants. Evol. Ecol. 13. 411-423.
Graham, E.A., Mulkey, S.S., Kitajima, K., Phillips, N.G., and Wright, S.J. 2003. Cloud cover
limits net CO2 uptake and growth of a rainforest tree during tropical rainy seasons. PNAS.
100(2) 572-576.
Gonzalez-Varo, J.P. and Traveset, A. 2010. Among-individual variation in pollen limitation and
inbreeding depression in a mixed-mating shrub. Annals of Botany 106. 999-1008.
Hardin, E.D. 1984. Variation in seed weight, number per capsule and germination in Populus
deltoids Batr. Trees in southeastern Ohio. Am Mid Nat. 112(1). 29-34.
Herrera, C.M., Jordano, P., Guitain, J., Travaset, A. 1998. Annual variability in seed production
by woody plants and the masting concept: reassessment of principles and relationship to
pollination and seed dispersal. Am. Nat. 152. 576-594.
House, S.M. 1992. Population density and fruit set in three dioecious tree species in Australian
tropical rain forest. J Ecol. 80(1). 57-69.

26
Howe, H.F. 1983. Annual variation in a Neotropical seed-dispersal system. 211-227. In: Sutton,
S.L., Whitmore, T.C., and Chadwick, A.C. (eds). Tropical Rain Forest: Ecology and
Management. Blackwell Scientific Publications, Oxford.
Howe, H.F and Vande Kerckhove, G.A.1981. Removal of wild nutmeg (Virola surinamensis)
crops by birds. Ecology. 62(4). 1093-1106.
Howe, H.F. and Richter, W.M. 1982. Effects of seed size on seedling size in Virola
surinamensis; a within and between tree analysis. Oecologia 53. 347-351.
Hubbell, S.P., Foster, R.B., O’Brien, S.T., Harms, K.E., Condit, R., Wechsler, B., Wright, S.J,
Loo de Lao, S. 1999. Light-gap disturbances, recruitment limitation, and tree diversity in a
Neotropical forest. Science. 283. 554-557.
Ichihashi, R. and Tateno, M. 2011. Strategies to balance between light acquisition and the risk of
falls of four temperate liana species: to overtop host canopies or not? J. Ecol. 99. 1071-1080.
Janzen, D. H. 1970. Herbivores and the number of tree species in tropical forests. Am. Nat. 104.
501-529.
Jones, F. A. and Comita, L. S. 2008. Neighbourhood density and genetic relatedness interact to
determine fruit set and abortion rates in a continuous tropical tree population. Proc. R. Soc.
Lond. B 275. 2759-2767.
Jones, F.A. and Comita, L.S. 2010. Density-dependent pre-dispersal seed predation and fruit set
in a tropical tree. Oikos 119. 1841-1847.
Jones, R.H., Sharitz, R.R., Dixon, P.M., Segal, D.S. and Schneider, R.L. (1994) Woody plant
regeneration in four floodplain forests. Ecological Monographs, 64, 345-367.

27
Kainer K.A., Wadt, L.H.O., Gomes-Silva D.A.P., and Capanu M.2006. Liana loads and their
association with Bertholletia excelsa fruit and nut production, diameter growth and crown
attributes. Journal of Tropical Ecology. 22.147-154.
Kelly, D., Sork, V.L., 2002. Mast seeding in perennial plants: why, how, where? Annu Rev Ecol
Syst 33. 427-447.
Koptur, S. 1984. Outcrossing and pollinator limitation of fruit set: breeding systems of
Neotropical Inga trees (Fabaceae: Mimosoideae). Evolution. 38(5). 1130-1143.
Lee T.D. and Bazzaz F.A. 1982. Regulation of fruit and seed production in an annual legume,
Cassia fasciculate. Ecology 63. 1363-1373.
Leigh, E.G. 1999. Tropical forest ecology: a view from Barro Colorado Island. Oxford
University Press. New York.
Leishman, M.R. 2001. Does the seed size/number trade-off model determine plant community
structure? An assessment of the model mechanisms and their generality. Oikos 93. 294-302.
MacFarlane, D.W. and Kobe, R.K. 2006. Selecting models for capturing tree-size effects on
growth-resource relationships. Can. J. For. Res. 36. 1695-1704.
Mezquida E.T. and Olano J.M. 2013. What makes a good neighborhood? Interaction of spatial
scale and fruit density in the predator satiation dynamics of a masting juniper tree. Oecologia
173. 483-492.
Michaels, H.J., Benner, B., Hartgerink, A.P. Lee, T.D., Rice, S., Willson, M.F., and Bertin, R.I.
Seed size variation: magnitude, distribution, and ecological correlates. Evol Ecol. 2. 157-166.
Moles, A.T. and Westoby, M. 2004. Seedling survival and seed size: a synthesis of the literature.
J. Ecol. 92. 372-383.

28
Novotny, V. and Basset, Y. 2005. Host specificity of insect herbivores in tropical forests. Proc.
R. Soc. B. 272. 1083-1090.
Primack, R.B. 1978. Regulation of Seed Yield in Plantago. J Ecol. 66(3). 835-847.
R Core Team (2013). R: A language and environment for statistical computing. R Foundation for
Statistical Computing, Vienna, Austria.URL: http://www.R-project.org/
Van de Heijden, G.M.F., Feldpausch, T.R., de la Fuente Herrero, A., van der Velden, N.K., and
Phillips, O.L. 2010. Calibrating the liana crown occupancy index in Amazonian forests. Forest
Ecology and Management. 260. 549-555.
Violle, C., Gamier, E., Lecoeur, J., Roumet, C., Podeur, C., Blanchard, A., and Navas M. 2009.
Traits and resource depletion in plant communities. Oecologia 160. 747-755.
Weiner, J., and Thomas, S.C. 2001. The nature of tree growth and the “age-related decline in
forest productivity”. Oikos, 94. 374-375.
Wright, S. J. 2002. Plant diversity in tropical forests: a review of mechanisms of species
coexistence. Oecologia 130. 1-14.