1
REPUBLIC BANCORP, INC. (MI) Exchange NMS Symbol RBNC Price $14.68 (8/31/2005) 52Wk Range 15.90-12.68 Yield 3.00 P/E 15.78 *7 Year Price Score 123.70 *12 Month Price Score 97.79 *NYSE Composite Index=100 Interim Earnings (Per Share) Qtr. Mar Jun Sep Dec 2002 0.20 0.20 0.22 0.13 2003 0.21 0.21 0.25 0.15 2004 0.23 0.23 0.27 0.17 2005 0.24 0.25 ... ... Interim Dividends (Per Share) Amt Decl Ex Rec Pay 0.11Q 11/18/2004 12/8/2004 12/10/2004 1/4/2005 0.11Q 2/18/2005 3/9/2005 3/11/2005 4/4/2005 0.11Q 4/27/2005 6/8/2005 6/10/2005 7/5/2005 0.11Q 7/22/2005 9/7/2005 9/9/2005 10/3/2005 Indicated Div: $0.44 (Div. Reinv. Plan) Valuation Analysis Forecast P/E 19.38 (4/15/2004) Market Cap $1.0 Billion Book Value 409.1 Million Price/Book 2.48 Price/Sales N/A Dividend Achiever Status Rank 98 10 Year Growth Rate 14.52% Total Years of Dividend Growth 12 TRADING VOLUME (thousand shares) 3 4 5 6 7 8 9 10 11 12 13 14 15 16 10% 10% 5-for-4 10% 10% 10% 10% 10% 10% 1996 1997 1998 1999 2000 2001 2002 2003 2004 2005 0 5 10 15 Business Summary: Commercial Banking (MIC: 8.1 SIC: 6021 NAIC: 522110) Republic Bancorp, with total assets of $5.72 billion and total deposits of $3.05 billion as of Dec 31 2004, is a bank holding company. Through its wholly-owned subsidiary, Republic Bank, a Michigan banking corporation, Co. has three primary lines of business: commercial banking, retail banking and mortgage banking. Republic Bank offers financial products to consumers and businesses through its 95 retail, commercial and mortgage banking branches located in Michigan, Ohio and Indiana and a loan production office in Massachusetts. Co. also operated a network of 97 ATMs as of Dec 31 2004. Recent Developments: For the quarter ended June 30 2005, net income increased 6.8% to $17,475 thousand from net income of $16,368 thousand in the year-earlier quarter. Net interest income was $38,751 thousand, up 7.1% from $36,197 thousand the year before. Provision for loan losses was $1,400 thousand versus $2,000 thousand in the prior-year quarter, a decrease of 30.0%. Non-interest income fell 29.0% to $8,886 thousand, while non-interest expense declined 9.1% to $21,259 thousand. Prospects: Co. is seeing strong growth across its business lines, supported by continued improvement in asset quality and operating efficiency. Co. should continue to benefit from its growing installment loan portfolio due to increases in home equity loans. Meanwhile, Co. may see slower growth in non-interest revenue due to decreases in mortgage income as mortgage originations decline from the prior year. However, these effects should be mitigated by lower non-interest expense as a result of the lower mortgage activity. Separately, Co. is seeing momentum in both its commercial and real estate mortgage loan portfolios, as evidenced by continuing growth in Co.'s pipelines of loans and applications. Financial Data Address: 1070 East Main Street, P.O. Box 70, Owosso, MI 48867 Telephone: 989-725-7337 Web Site: www.republicbancorp.com Officers: Jerry D. Campbell - Chmn. George J. Butvilas - Vice-Chmn. Transfer Agents: EquiServe Trust Company, N.A., Providence, RI Investor Contact: 989-725-7337 No of Institutions: 119 Shares: 29,407,784 % Held: 42.58 (US$ in Thousands) 6 Mos 3 Mos 12/31/2004 12/31/2003 12/31/2002 12/31/2001 12/31/2000 12/31/1999 Earnings Per Share 0.93 0.91 0.94 0.86 0.79 0.65 0.63 0.20 Cash Flow Per Share (0.52) 2.32 1.15 8.13 1.89 (6.95) 1.64 3.90 Tang Book Value Per Share 5.91 5.76 5.82 5.29 4.79 4.27 3.36 2.73 Dividends Per Share 0.430 0.406 0.383 0.305 0.262 0.238 0.216 0.205 Dividend Payout % 46.24 44.79 40.72 35.36 33.00 36.42 34.44 100.15 Income Statement Interest Income 156,578 75,841 282,379 265,680 284,704 333,376 348,328 299,662 Interest Expense 79,499 37,513 132,529 123,183 137,024 189,767 213,680 171,396 Net Interest Income 77,079 38,328 149,850 142,497 147,680 143,609 134,648 128,266 Provision for Losses 2,900 1,500 8,500 12,000 16,000 8,700 6,500 11,650 Non-Interest Income 19,924 11,038 47,319 60,779 56,027 71,384 70,838 137,731 Non-Interest Expense 44,131 22,872 94,075 104,654 100,515 132,213 127,641 225,968 Income Before Taxes 49,972 24,994 94,594 86,622 87,192 74,080 71,345 28,379 Income Taxes 15,190 7,687 27,910 25,896 24,687 22,515 22,945 10,745 Net Income 34,782 17,307 66,684 60,726 62,505 51,565 48,400 17,634 Average Shares 70,526 71,201 71,273 70,588 71,420 73,231 73,058 73,696 Balance Sheet Net Loans & Leases 4,491,258 4,446,301 4,422,157 4,117,243 3,620,466 3,429,224 3,743,226 3,346,297 Total Assets 6,075,228 5,923,692 5,713,977 5,353,688 4,778,195 4,740,605 4,610,641 4,301,615 Total Deposits 3,035,086 2,992,746 3,046,211 2,815,269 2,788,272 2,753,468 2,728,526 2,613,050 Total Liabilities 5,666,121 5,518,744 5,304,339 4,984,268 4,395,467 4,356,969 4,287,058 4,005,360 Stockholders' Equity 409,107 404,948 409,638 369,420 332,728 304,917 294,864 266,441 Shares Outstanding 69,205 70,274 70,425 69,879 69,503 70,763 72,361 72,933 Statistical Record Return on Assets % 1.17 1.18 1.20 1.20 1.31 1.10 1.08 0.54 Return on Equity % 17.39 17.10 17.07 17.30 19.60 17.19 17.20 8.46 Net Interest Margin % 48.00 50.54 53.07 53.63 51.87 43.08 38.66 42.80 Efficiency Ratio % 23.72 26.33 28.53 32.06 29.50 32.66 30.45 51.66 Loans to Deposits 1.48 1.49 1.45 1.46 1.30 1.25 1.37 1.28 Price Range 15.90-12.27 15.90-11.64 15.90-11.64 12.71-9.59 11.53-8.44 10.91-7.34 7.85-4.70 8.57-6.42 P/E Ratio 17.10-13.20 17.47-12.79 16.91-12.38 14.78-11.15 14.60-10.69 16.78-11.30 12.47-7.45 42.86-32.10 Average Yield % 3.05 2.96 2.88 2.77 2.60 2.56 3.72 2.77 232

Republic Bancorp, Inc. (MI)

  • View
    216

  • Download
    2

Embed Size (px)

Citation preview

REPUBLIC BANCORP, INC. (MI)Exchange

NMSSymbolRBNC

Price$14.68 (8/31/2005)

52Wk Range15.90-12.68

Yield3.00

P/E15.78

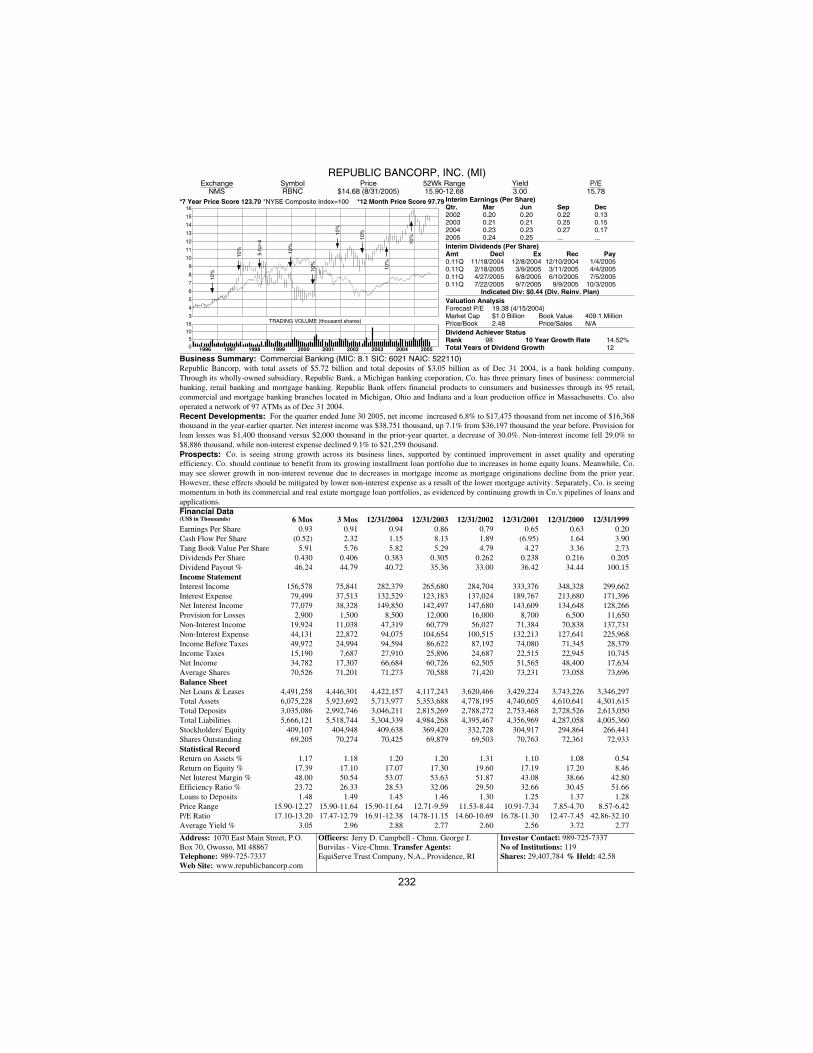
*7 Year Price Score 123.70 *12 Month Price Score 97.79*NYSE Composite Index=100 Interim Earnings (Per Share)Qtr. Mar Jun Sep Dec2002 0.20 0.20 0.22 0.132003 0.21 0.21 0.25 0.152004 0.23 0.23 0.27 0.172005 0.24 0.25 ... ...Interim Dividends (Per Share)Amt Decl Ex Rec Pay0.11Q 11/18/2004 12/8/2004 12/10/2004 1/4/20050.11Q 2/18/2005 3/9/2005 3/11/2005 4/4/20050.11Q 4/27/2005 6/8/2005 6/10/2005 7/5/20050.11Q 7/22/2005 9/7/2005 9/9/2005 10/3/2005

Indicated Div: $0.44 (Div. Reinv. Plan)Valuation AnalysisForecast P/E 19.38 (4/15/2004)Market Cap $1.0 Billion Book Value 409.1 MillionPrice/Book 2.48 Price/Sales N/ADividend Achiever StatusRank 98 10 Year Growth Rate 14.52%Total Years of Dividend Growth 12

TRADING VOLUME (thousand shares)3

4

5

6

7

8

9

10

11

12

13

14

15

1610

%

10%

5-fo

r-4

10%

10%

10%

10%

10%

10%

1996 1997 1998 1999 2000 2001 2002 2003 2004 200505

1015

Business Summary: Commercial Banking (MIC: 8.1 SIC: 6021 NAIC: 522110)Republic Bancorp, with total assets of $5.72 billion and total deposits of $3.05 billion as of Dec 31 2004, is a bank holding company.Through its wholly-owned subsidiary, Republic Bank, a Michigan banking corporation, Co. has three primary lines of business: commercialbanking, retail banking and mortgage banking. Republic Bank offers financial products to consumers and businesses through its 95 retail,commercial and mortgage banking branches located in Michigan, Ohio and Indiana and a loan production office in Massachusetts. Co. alsooperated a network of 97 ATMs as of Dec 31 2004. Recent Developments: For the quarter ended June 30 2005, net income increased 6.8% to $17,475 thousand from net income of $16,368thousand in the year-earlier quarter. Net interest income was $38,751 thousand, up 7.1% from $36,197 thousand the year before. Provision forloan losses was $1,400 thousand versus $2,000 thousand in the prior-year quarter, a decrease of 30.0%. Non-interest income fell 29.0% to$8,886 thousand, while non-interest expense declined 9.1% to $21,259 thousand. Prospects: Co. is seeing strong growth across its business lines, supported by continued improvement in asset quality and operatingefficiency. Co. should continue to benefit from its growing installment loan portfolio due to increases in home equity loans. Meanwhile, Co.may see slower growth in non-interest revenue due to decreases in mortgage income as mortgage originations decline from the prior year.However, these effects should be mitigated by lower non-interest expense as a result of the lower mortgage activity. Separately, Co. is seeingmomentum in both its commercial and real estate mortgage loan portfolios, as evidenced by continuing growth in Co.'s pipelines of loans andapplications.Financial Data

Address: 1070 East Main Street, P.O.Box 70, Owosso, MI 48867 Telephone: 989-725-7337Web Site: www.republicbancorp.com

Officers: Jerry D. Campbell - Chmn. George J.Butvilas - Vice-Chmn. Transfer Agents: EquiServe Trust Company, N.A., Providence, RI

Investor Contact: 989-725-7337No of Institutions: 119Shares: 29,407,784 % Held: 42.58

(US$ in Thousands) 6 Mos 3 Mos 12/31/2004 12/31/2003 12/31/2002 12/31/2001 12/31/2000 12/31/1999Earnings Per Share 0.93 0.91 0.94 0.86 0.79 0.65 0.63 0.20Cash Flow Per Share (0.52) 2.32 1.15 8.13 1.89 (6.95) 1.64 3.90Tang Book Value Per Share 5.91 5.76 5.82 5.29 4.79 4.27 3.36 2.73Dividends Per Share 0.430 0.406 0.383 0.305 0.262 0.238 0.216 0.205Dividend Payout % 46.24 44.79 40.72 35.36 33.00 36.42 34.44 100.15Income StatementInterest Income 156,578 75,841 282,379 265,680 284,704 333,376 348,328 299,662Interest Expense 79,499 37,513 132,529 123,183 137,024 189,767 213,680 171,396Net Interest Income 77,079 38,328 149,850 142,497 147,680 143,609 134,648 128,266Provision for Losses 2,900 1,500 8,500 12,000 16,000 8,700 6,500 11,650Non-Interest Income 19,924 11,038 47,319 60,779 56,027 71,384 70,838 137,731Non-Interest Expense 44,131 22,872 94,075 104,654 100,515 132,213 127,641 225,968Income Before Taxes 49,972 24,994 94,594 86,622 87,192 74,080 71,345 28,379Income Taxes 15,190 7,687 27,910 25,896 24,687 22,515 22,945 10,745Net Income 34,782 17,307 66,684 60,726 62,505 51,565 48,400 17,634Average Shares 70,526 71,201 71,273 70,588 71,420 73,231 73,058 73,696Balance SheetNet Loans & Leases 4,491,258 4,446,301 4,422,157 4,117,243 3,620,466 3,429,224 3,743,226 3,346,297Total Assets 6,075,228 5,923,692 5,713,977 5,353,688 4,778,195 4,740,605 4,610,641 4,301,615Total Deposits 3,035,086 2,992,746 3,046,211 2,815,269 2,788,272 2,753,468 2,728,526 2,613,050Total Liabilities 5,666,121 5,518,744 5,304,339 4,984,268 4,395,467 4,356,969 4,287,058 4,005,360Stockholders' Equity 409,107 404,948 409,638 369,420 332,728 304,917 294,864 266,441Shares Outstanding 69,205 70,274 70,425 69,879 69,503 70,763 72,361 72,933Statistical RecordReturn on Assets % 1.17 1.18 1.20 1.20 1.31 1.10 1.08 0.54Return on Equity % 17.39 17.10 17.07 17.30 19.60 17.19 17.20 8.46Net Interest Margin % 48.00 50.54 53.07 53.63 51.87 43.08 38.66 42.80Efficiency Ratio % 23.72 26.33 28.53 32.06 29.50 32.66 30.45 51.66Loans to Deposits 1.48 1.49 1.45 1.46 1.30 1.25 1.37 1.28Price Range 15.90-12.27 15.90-11.64 15.90-11.64 12.71-9.59 11.53-8.44 10.91-7.34 7.85-4.70 8.57-6.42P/E Ratio 17.10-13.20 17.47-12.79 16.91-12.38 14.78-11.15 14.60-10.69 16.78-11.30 12.47-7.45 42.86-32.10Average Yield % 3.05 2.96 2.88 2.77 2.60 2.56 3.72 2.77

232