Embed Size (px)
Citation preview
1
Republic of Korea LEAP Modeling Effort
David F. von HippelNautilus Institute
Spent Fuel and Reduction of Radiological Risk after Fukushima and Deep Borehole and Spent Fuel in East
Asia WORKING GROUP MEETINGMay 28-30, 2013, Beijing, China
OUTLINE OF PRESENTATION Introduction: Model Background Key Data Sources Model Structure Key Assumptions Used in Modeling to
Date Draft Results Next Steps in ROK LEAP Modeling
Effort
RRRF/DBSF Working Group Meeting 2D. von Hippel 5/2013
ROK LEAP Model—Background Model development over the period since
approximately 2001 by Dr. Kim Hoseok Updated to 2010 base year by Dr. Kim Dr. Kim sends his greetings to Working Group
Colleagues, but could not attend due to his GGGI commitments
Model used by Dr. Kim for a variety of studies in his positions for Korea Environment Institute and for other organizations in Korea Published study on use of Landfill Gas is an
example D. von Hippel is running ROK-LEAP for the project
with input from Dr. Chung Woo-jin, Dr. Kang JungminRRRF/DBSF Working Group Meeting 3D. von Hippel 5/2013
The ROK LEAP Model: Key Data Sources Overall: KEEI detailed energy balance tables used as
“control total” source for major totals for base year (2010) supply and demand
Residential—Driven by number of households Energy: 2008 AND 2012 Energy Consumption Survey (MOCIE
2008, 2012), Survey on Electricity Consumption Characteristics of Home Appliances (2006,2012, Electric Power Information System)
Heating: # of household by heating type from Statistics Korea Activities: National Demographic Survey (NSO)
Industrial—Driven by industrial GDP, share of GDP by subsector Energy: 2008,2012 Energy Consumption Survey (MOCIE 2008.
2012), Yearbook of Energy Statistics (MOCIE & KEEI, 2011 and earlier); intensities calculated based on above, below
Activities and Fuel Shares: Economic Statistics System, KEEI Energy Statistics Yearbook (2011)
4RRRF/DBSF Working Group MeetingD. von Hippel 5/2013
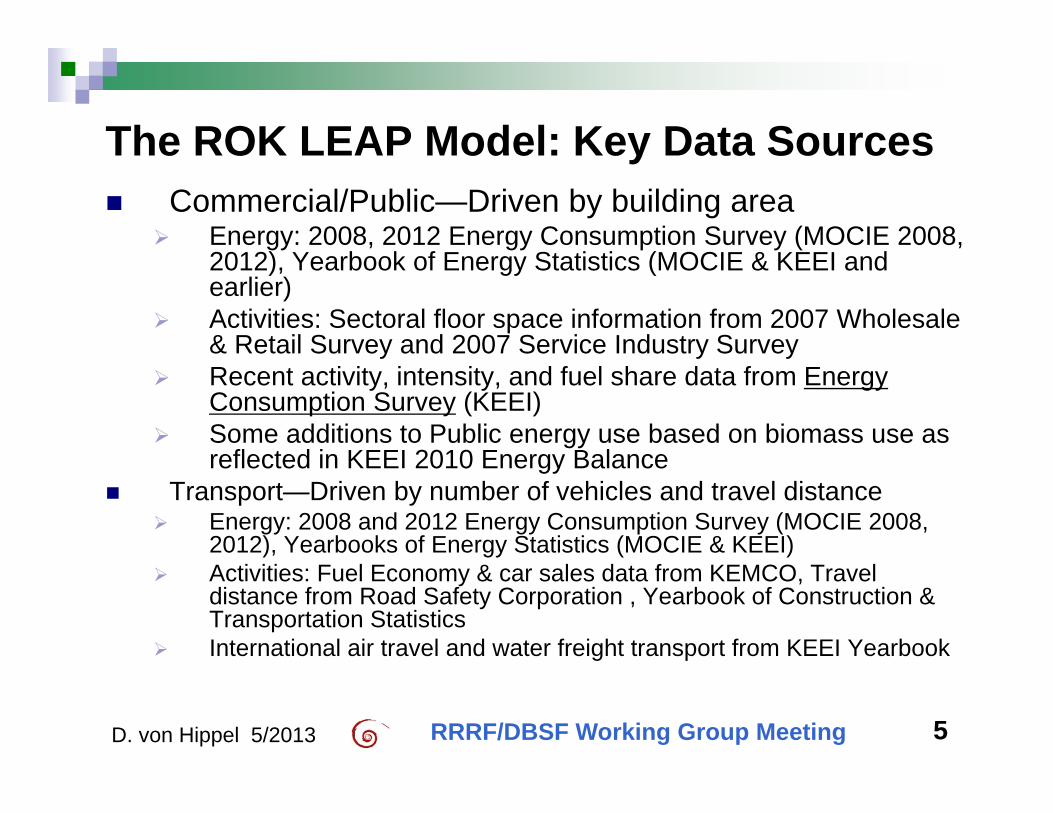
The ROK LEAP Model: Key Data Sources Commercial/Public—Driven by building area
Energy: 2008, 2012 Energy Consumption Survey (MOCIE 2008, 2012), Yearbook of Energy Statistics (MOCIE & KEEI and earlier)
Activities: Sectoral floor space information from 2007 Wholesale & Retail Survey and 2007 Service Industry Survey
Recent activity, intensity, and fuel share data from Energy Consumption Survey (KEEI)
Some additions to Public energy use based on biomass use as reflected in KEEI 2010 Energy Balance
Transport—Driven by number of vehicles and travel distance Energy: 2008 and 2012 Energy Consumption Survey (MOCIE 2008,
2012), Yearbooks of Energy Statistics (MOCIE & KEEI) Activities: Fuel Economy & car sales data from KEMCO, Travel
distance from Road Safety Corporation , Yearbook of Construction & Transportation Statistics
International air travel and water freight transport from KEEI Yearbook
5RRRF/DBSF Working Group MeetingD. von Hippel 5/2013
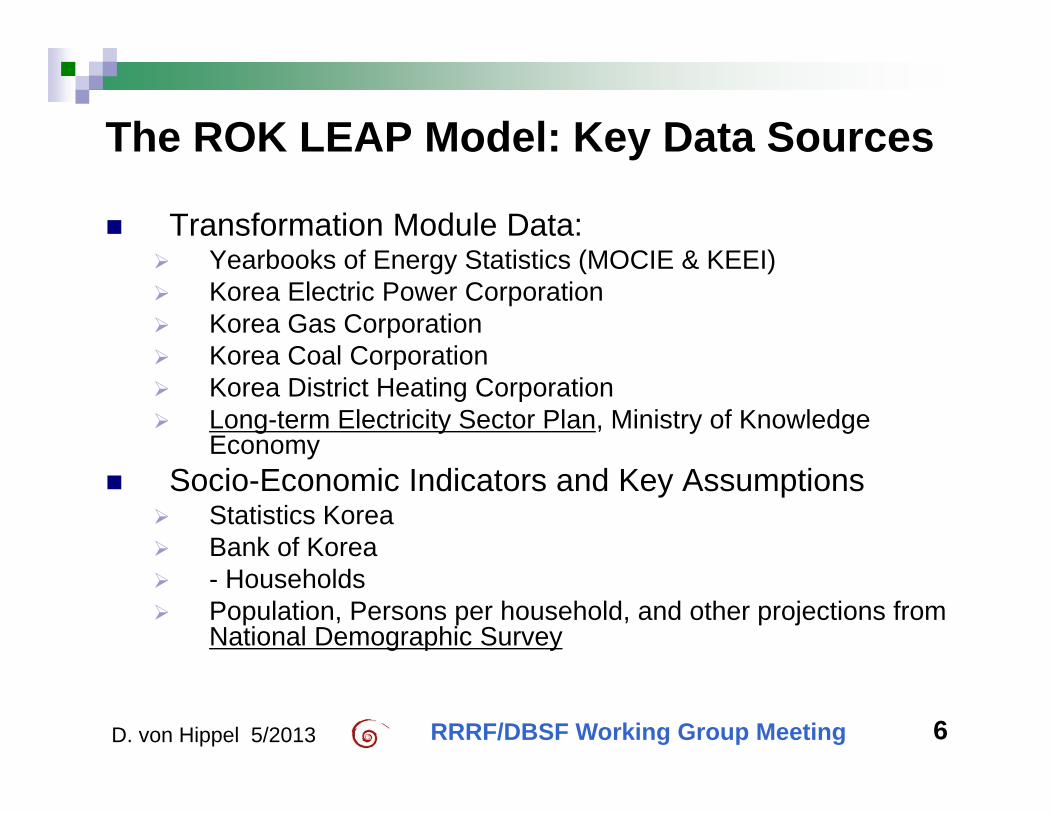
The ROK LEAP Model: Key Data Sources
Transformation Module Data: Yearbooks of Energy Statistics (MOCIE & KEEI) Korea Electric Power Corporation Korea Gas Corporation Korea Coal Corporation Korea District Heating Corporation Long-term Electricity Sector Plan, Ministry of Knowledge
Economy Socio-Economic Indicators and Key Assumptions
Statistics Korea Bank of Korea - Households Population, Persons per household, and other projections from
National Demographic Survey
6RRRF/DBSF Working Group MeetingD. von Hippel 5/2013
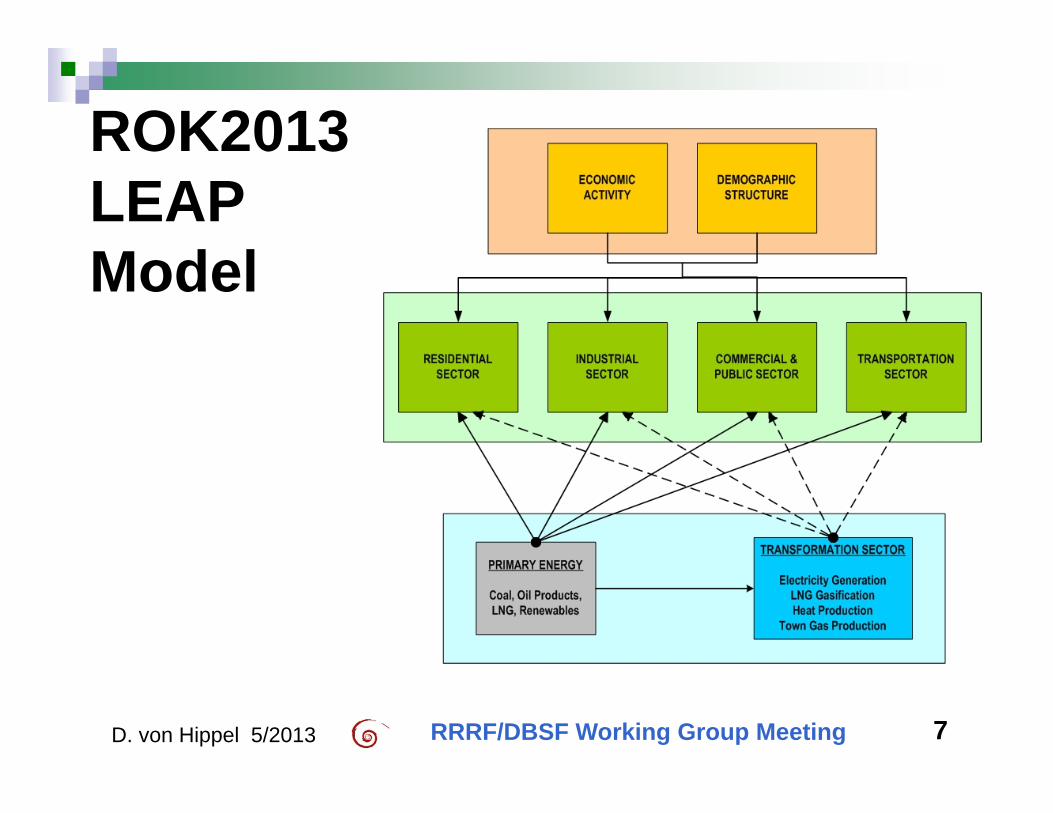
ROK2013 LEAP Model
7RRRF/DBSF Working Group MeetingD. von Hippel 5/2013
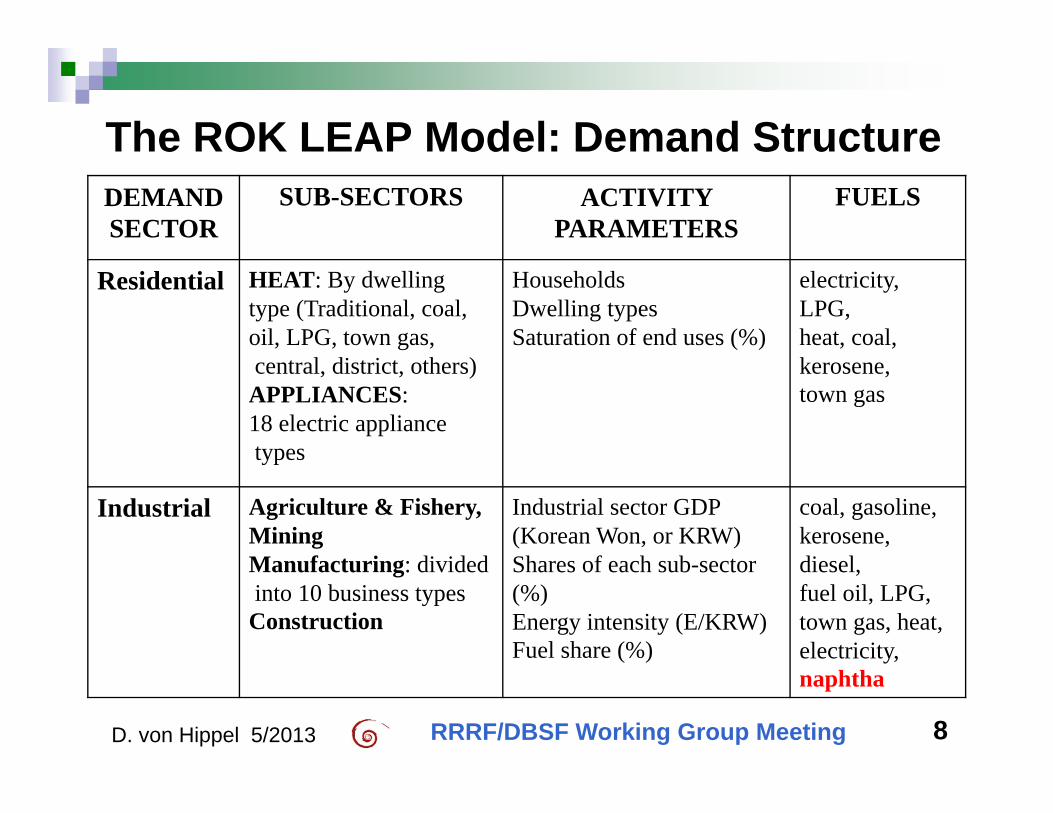
The ROK LEAP Model: Demand StructureDEMAND SECTOR
SUB-SECTORS ACTIVITY PARAMETERS
FUELS
Residential HEAT: By dwelling type (Traditional, coal,oil, LPG, town gas,central, district, others)APPLIANCES: 18 electric appliancetypes
HouseholdsDwelling types Saturation of end uses (%)
electricity, LPG, heat, coal, kerosene, town gas
Industrial Agriculture & Fishery,MiningManufacturing: dividedinto 10 business types Construction
Industrial sector GDP (Korean Won, or KRW)Shares of each sub-sector(%)Energy intensity (E/KRW)Fuel share (%)
coal, gasoline, kerosene, diesel, fuel oil, LPG, town gas, heat,electricity, naphtha
8RRRF/DBSF Working Group MeetingD. von Hippel 5/2013
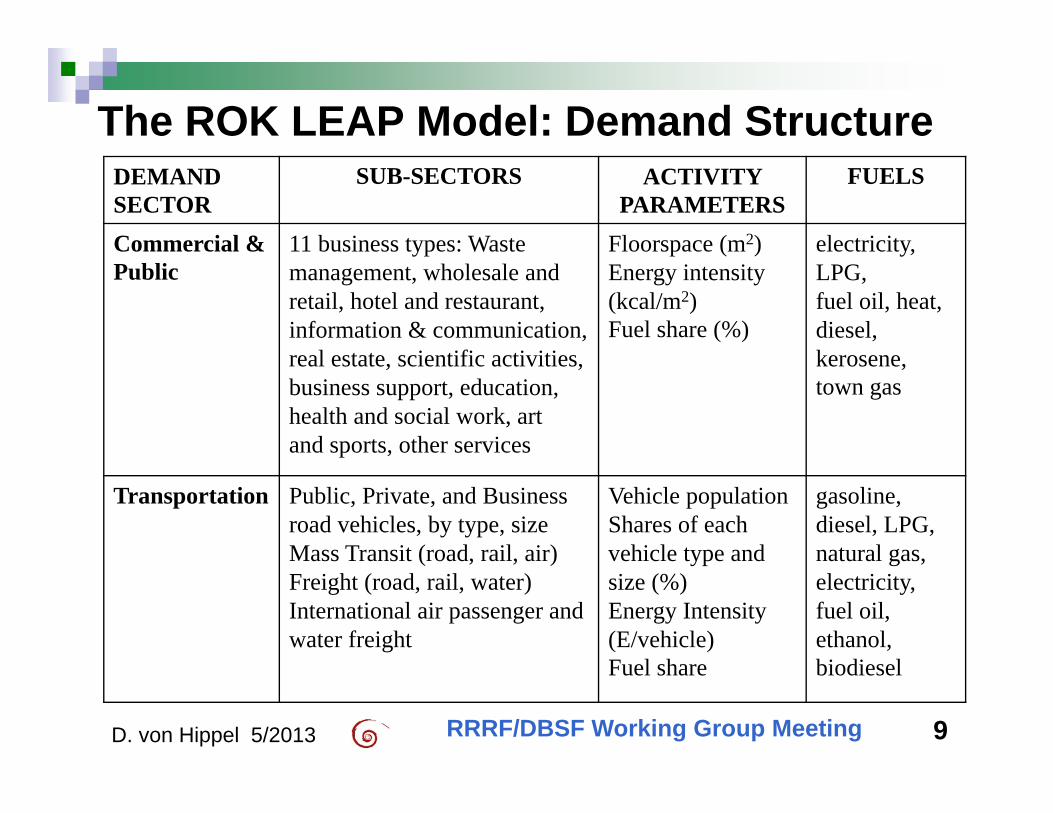
The ROK LEAP Model: Demand StructureDEMANDSECTOR
SUB-SECTORS ACTIVITY PARAMETERS
FUELS
Commercial & Public
11 business types: Waste management, wholesale and retail, hotel and restaurant, information & communication, real estate, scientific activities, business support, education, health and social work, art and sports, other services
Floorspace (m2)Energy intensity (kcal/m2)Fuel share (%)
electricity, LPG, fuel oil, heat, diesel, kerosene,town gas
Transportation Public, Private, and Business road vehicles, by type, sizeMass Transit (road, rail, air)Freight (road, rail, water)International air passenger and water freight
Vehicle population Shares of each vehicle type and size (%)Energy Intensity (E/vehicle)Fuel share
gasoline, diesel, LPG, natural gas, electricity, fuel oil, ethanol, biodiesel
9D. von Hippel 5/2013 RRRF/DBSF Working Group Meeting
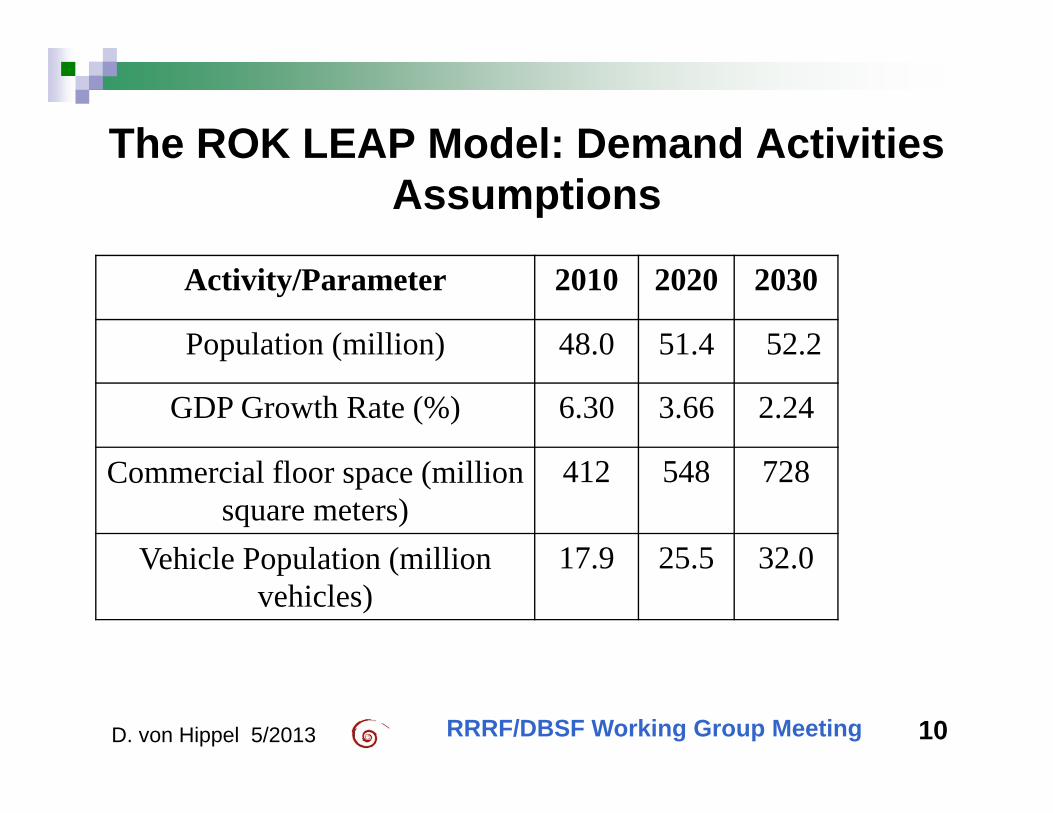
The ROK LEAP Model: Demand Activities Assumptions
Activity/Parameter 2010 2020 2030
Population (million) 48.0 51.4 52.2
GDP Growth Rate (%) 6.30 3.66 2.24
Commercial floor space (million square meters)
412 548 728
Vehicle Population (millionvehicles)
17.9 25.5 32.0
10D. von Hippel 5/2013 RRRF/DBSF Working Group Meeting

11
THE ROK LEAP MODELTRANSFORMATION STRUCTURE Electricity T&D Electricity Generation — 11 Types of power plants,
including Industrial Combined Heat and Power (CHP) District Heat production Town Gas production LNG Gasification Oil Refining Blast Furnace Gas Production Coke Production
RRRF/DBSF Working Group MeetingD. von Hippel 5/2013
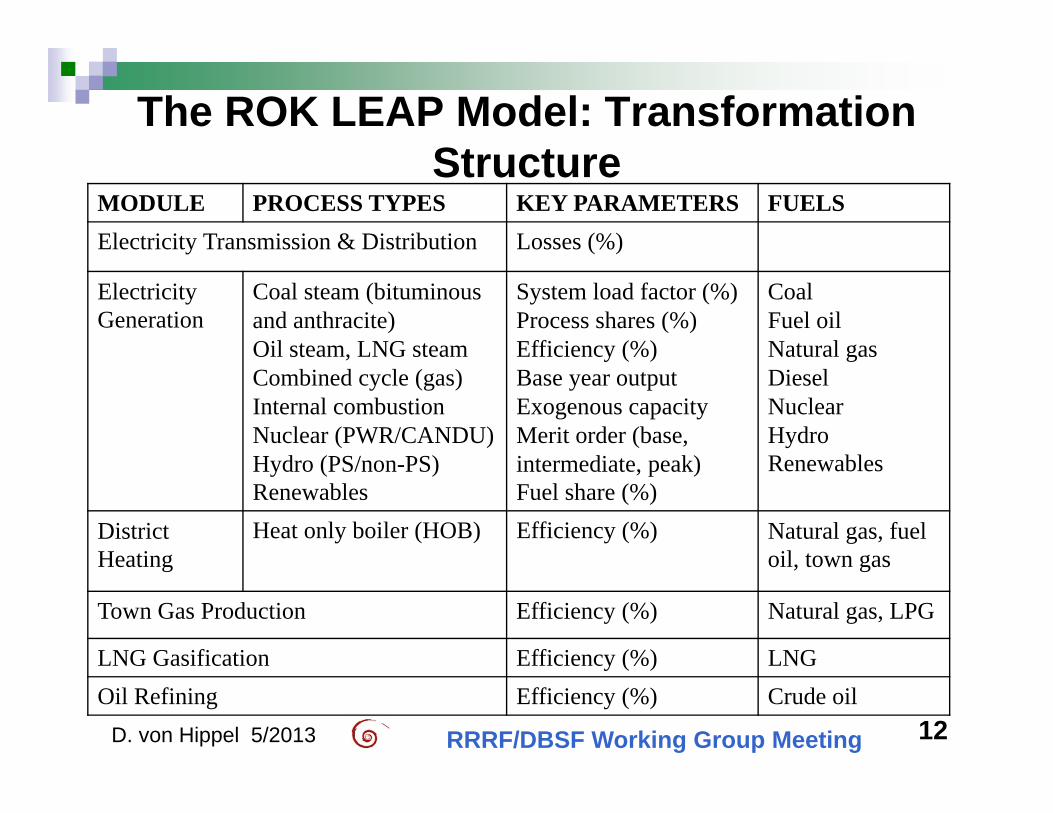
The ROK LEAP Model: Transformation Structure
MODULE PROCESS TYPES KEY PARAMETERS FUELSElectricity Transmission & Distribution Losses (%)
Electricity Generation
Coal steam (bituminous and anthracite)Oil steam, LNG steamCombined cycle (gas)Internal combustionNuclear (PWR/CANDU)Hydro (PS/non-PS)Renewables
System load factor (%)Process shares (%)Efficiency (%)Base year outputExogenous capacity Merit order (base, intermediate, peak)Fuel share (%)
CoalFuel oilNatural gasDieselNuclearHydroRenewables
District Heating
Heat only boiler (HOB) Efficiency (%) Natural gas, fuel oil, town gas
Town Gas Production Efficiency (%) Natural gas, LPG
LNG Gasification Efficiency (%) LNGOil Refining Efficiency (%) Crude oil
12RRRF/DBSF Working Group MeetingD. von Hippel 5/2013
13
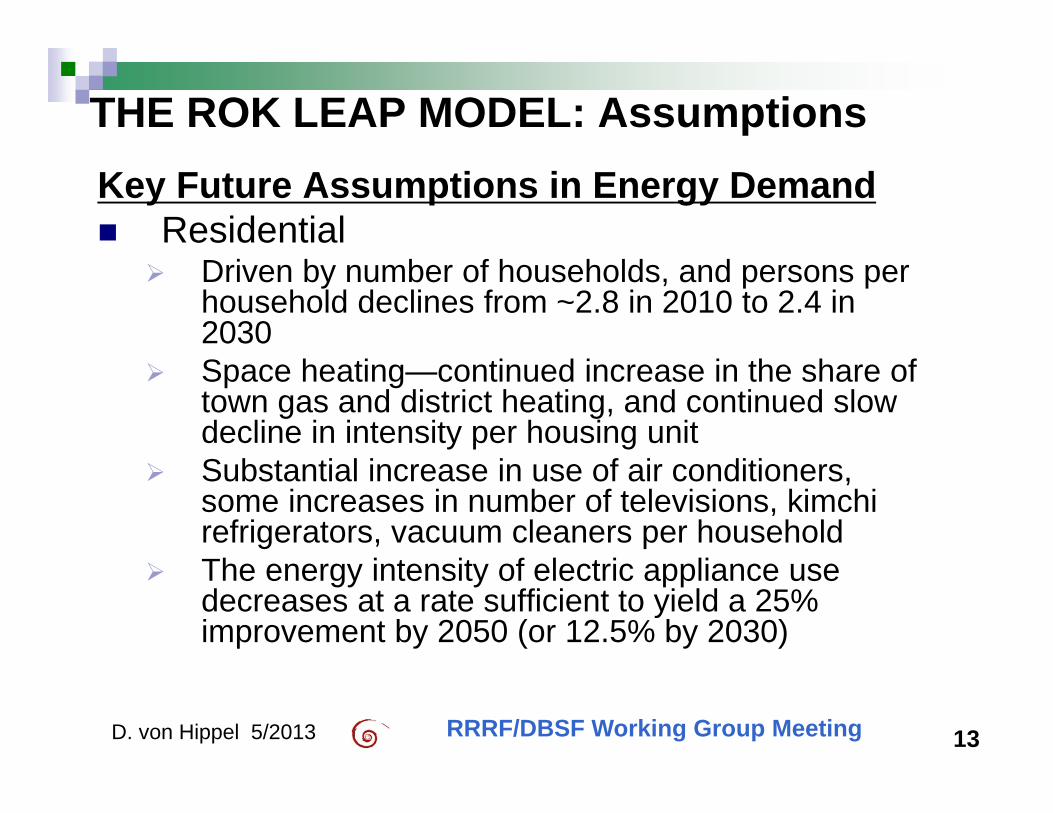
THE ROK LEAP MODEL: AssumptionsKey Future Assumptions in Energy Demand Residential
Driven by number of households, and persons per household declines from ~2.8 in 2010 to 2.4 in 2030
Space heating—continued increase in the share of town gas and district heating, and continued slow decline in intensity per housing unit
Substantial increase in use of air conditioners, some increases in number of televisions, kimchi refrigerators, vacuum cleaners per household
The energy intensity of electric appliance use decreases at a rate sufficient to yield a 25% improvement by 2050 (or 12.5% by 2030)
D. von Hippel 5/2013 RRRF/DBSF Working Group Meeting

14
THE ROK LEAP MODEL: AssumptionsKey Future Assumptions in Energy Demand Industrial—Driven by industrial GDP, share
Share of value added by Manufacturing falls slowly Within Manufacturing, share of Chemicals
decreases markedly over time, (which reduces Naptha use), “Misc Manufacturing” increases to compensate, others remain the same over time
All intensities slowly decline over time Commercial—Driven by building area, which
rises rapidly (by 75% by 2030) Fuel shares and energy intensities remain relatively
constant Public—Driven by government expenditures,
which rise by 75% by 2030 Energy intensities, fuel shares don’t change
D. von Hippel 5/2013 RRRF/DBSF Working Group Meeting
15
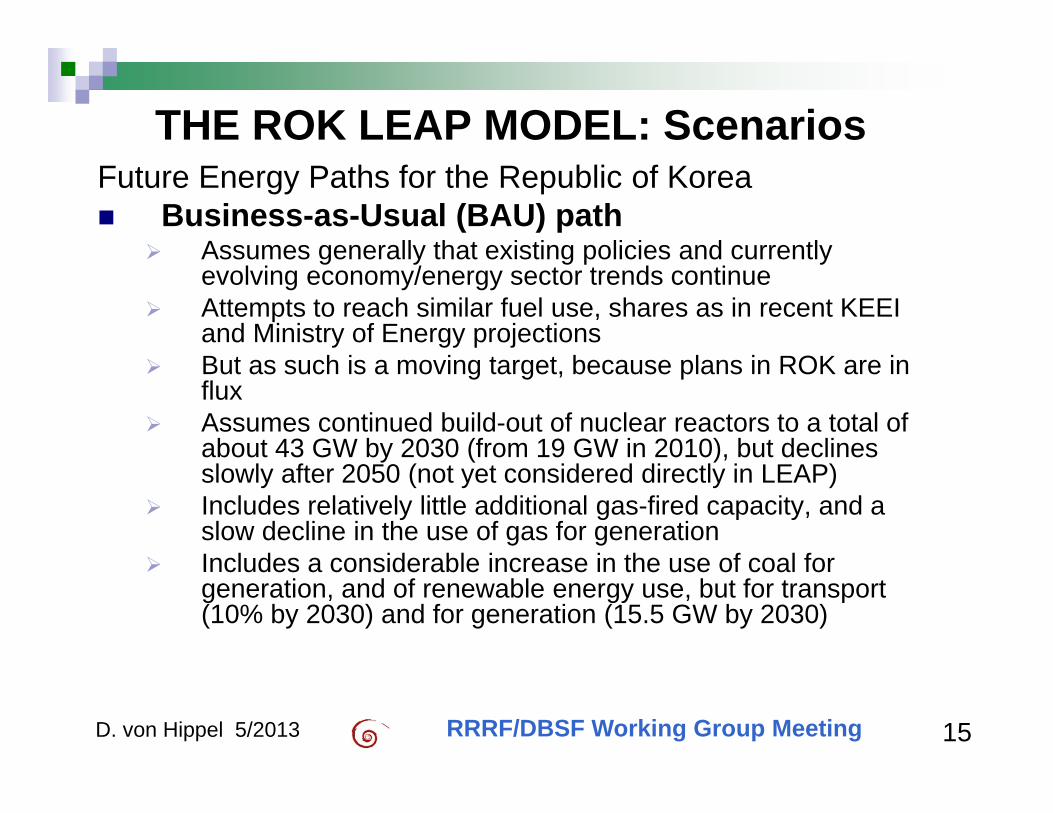
THE ROK LEAP MODEL: ScenariosFuture Energy Paths for the Republic of Korea Business-as-Usual (BAU) path
Assumes generally that existing policies and currently evolving economy/energy sector trends continue
Attempts to reach similar fuel use, shares as in recent KEEI and Ministry of Energy projections
But as such is a moving target, because plans in ROK are in flux
Assumes continued build-out of nuclear reactors to a total of about 43 GW by 2030 (from 19 GW in 2010), but declines slowly after 2050 (not yet considered directly in LEAP)
Includes relatively little additional gas-fired capacity, and a slow decline in the use of gas for generation
Includes a considerable increase in the use of coal for generation, and of renewable energy use, but for transport (10% by 2030) and for generation (15.5 GW by 2030)
D. von Hippel 5/2013 RRRF/DBSF Working Group Meeting

16
THE ROK LEAP MODEL: Scenarios
D. von Hippel 5/2013 RRRF/DBSF Working Group Meeting
KEEI Projections from Late 2012; Units, Tonnes of Oil Equivalent
2010 2015 2020 2025 2030 2035AAGR(%)('10~'35)
Coal75.9 91.5 104.5 106.6 118.1 123.2 2.0
(28.9) (30.8) (30.9) (29.3) (30.4) (30.5)
Oil104.3 105.5 113.6 115.1 115.9 114.9 0.4
(39.7) (35.6) (33.6) (31.7) (29.8) (28.5)
Natural Gas43.0 45.2 47.5 55.4 54.6 59.3 1.3
(16.4) (15.2) (14.0) (15.3) (14.0) (14.7)
Hydro1.4 1.6 1.6 1.6 1.7 1.8 0.9
(0.5) (0.5) (0.5) (0.5) (0.4) (0.4)
Nuclear31.9 43.9 56.7 66.9 79.5 84.5 4.0
(12.2) (14.8) (16.8) (18.4) (20.5) (20.9)
Renewable6.1 8.9 14.1 17.5 18.9 20.1 4.9
(2.3) (3.0) (4.2) (4.8) (4.9) (5.0)
Total262.6 296.5 337.9 363.1 388.6 403.8 1.7
(100.0) (100.0) (100.0) (100.0) (100.0) (100.0)
17
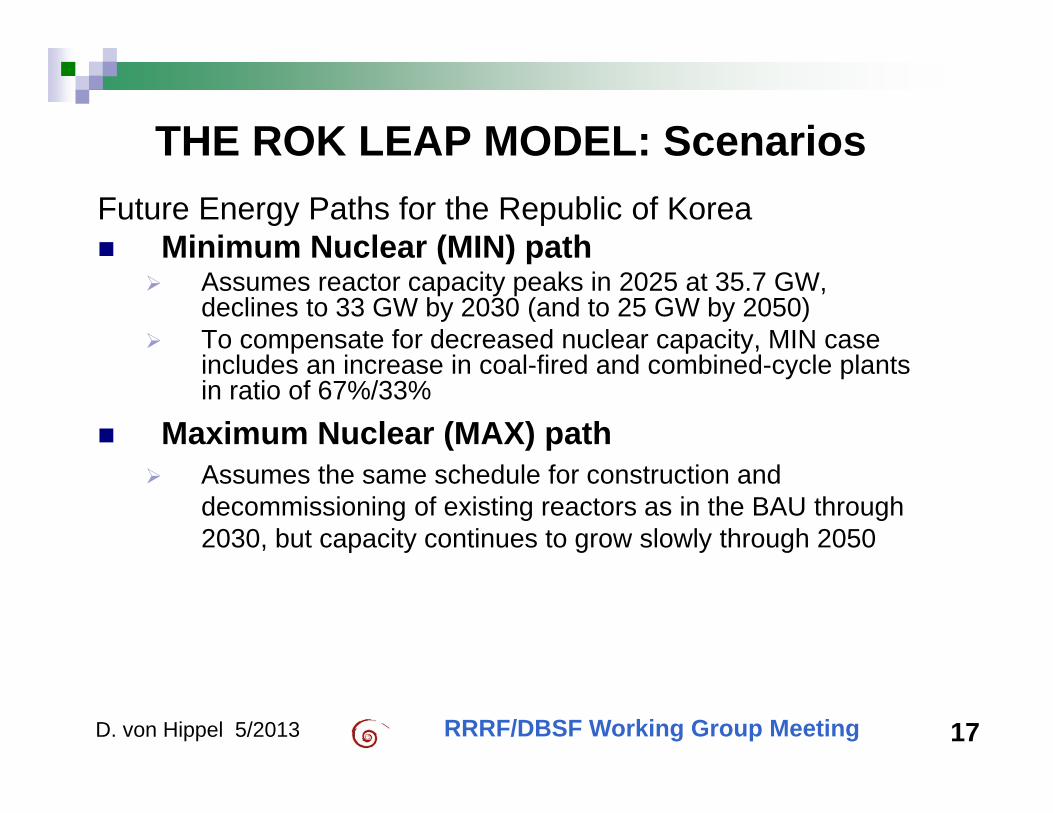
THE ROK LEAP MODEL: ScenariosFuture Energy Paths for the Republic of Korea Minimum Nuclear (MIN) path
Assumes reactor capacity peaks in 2025 at 35.7 GW, declines to 33 GW by 2030 (and to 25 GW by 2050)
To compensate for decreased nuclear capacity, MIN case includes an increase in coal-fired and combined-cycle plants in ratio of 67%/33%
Maximum Nuclear (MAX) path Assumes the same schedule for construction and
decommissioning of existing reactors as in the BAU through 2030, but capacity continues to grow slowly through 2050
D. von Hippel 5/2013 RRRF/DBSF Working Group Meeting
18
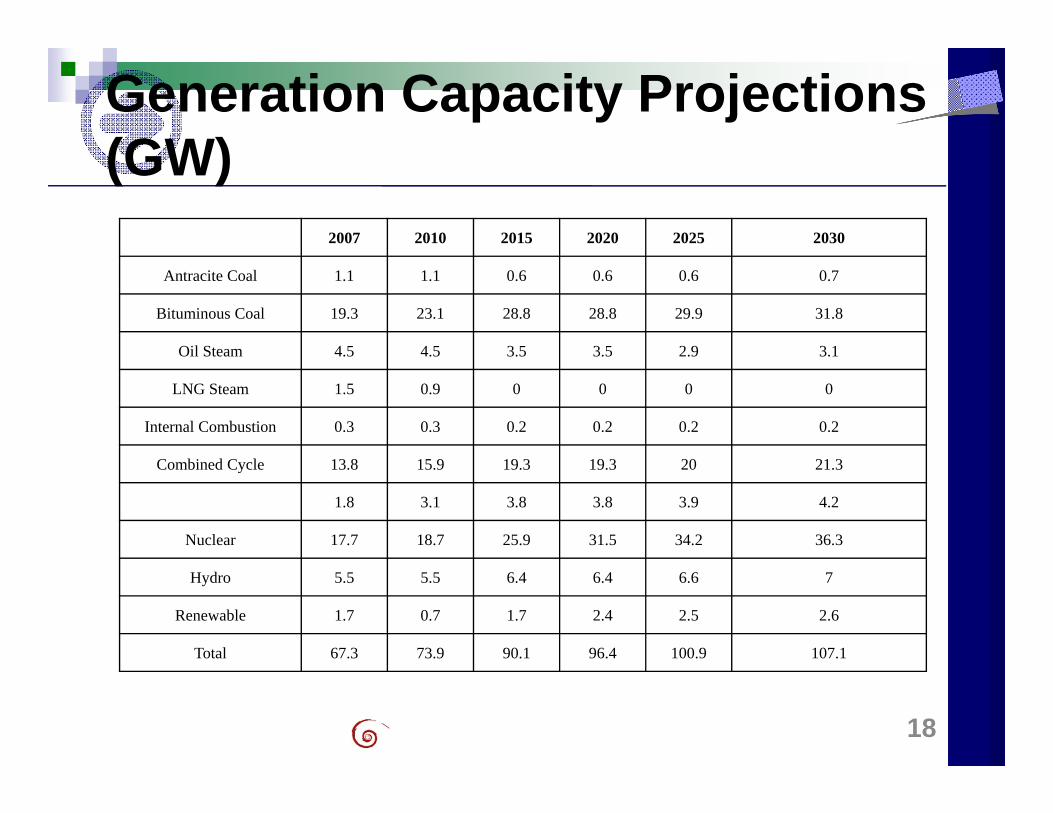
2007 2010 2015 2020 2025 2030
Antracite Coal 1.1 1.1 0.6 0.6 0.6 0.7
Bituminous Coal 19.3 23.1 28.8 28.8 29.9 31.8
Oil Steam 4.5 4.5 3.5 3.5 2.9 3.1
LNG Steam 1.5 0.9 0 0 0 0
Internal Combustion 0.3 0.3 0.2 0.2 0.2 0.2
Combined Cycle 13.8 15.9 19.3 19.3 20 21.3
1.8 3.1 3.8 3.8 3.9 4.2
Nuclear 17.7 18.7 25.9 31.5 34.2 36.3
Hydro 5.5 5.5 6.4 6.4 6.6 7
Renewable 1.7 0.7 1.7 2.4 2.5 2.6
Total 67.3 73.9 90.1 96.4 100.9 107.1
Generation Capacity Projections (GW)
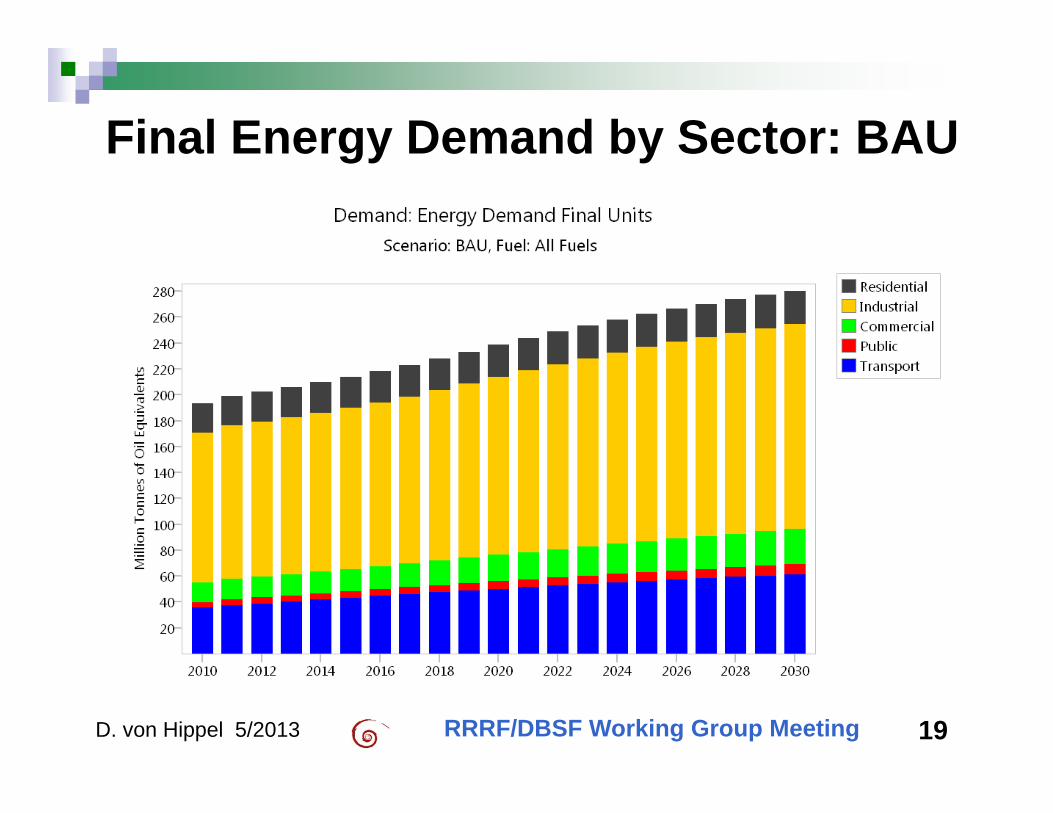
Final Energy Demand by Sector: BAU
19D. von Hippel 5/2013 RRRF/DBSF Working Group Meeting

Final Energy Demand by Fuel: BAU
20D. von Hippel 5/2013 RRRF/DBSF Working Group Meeting
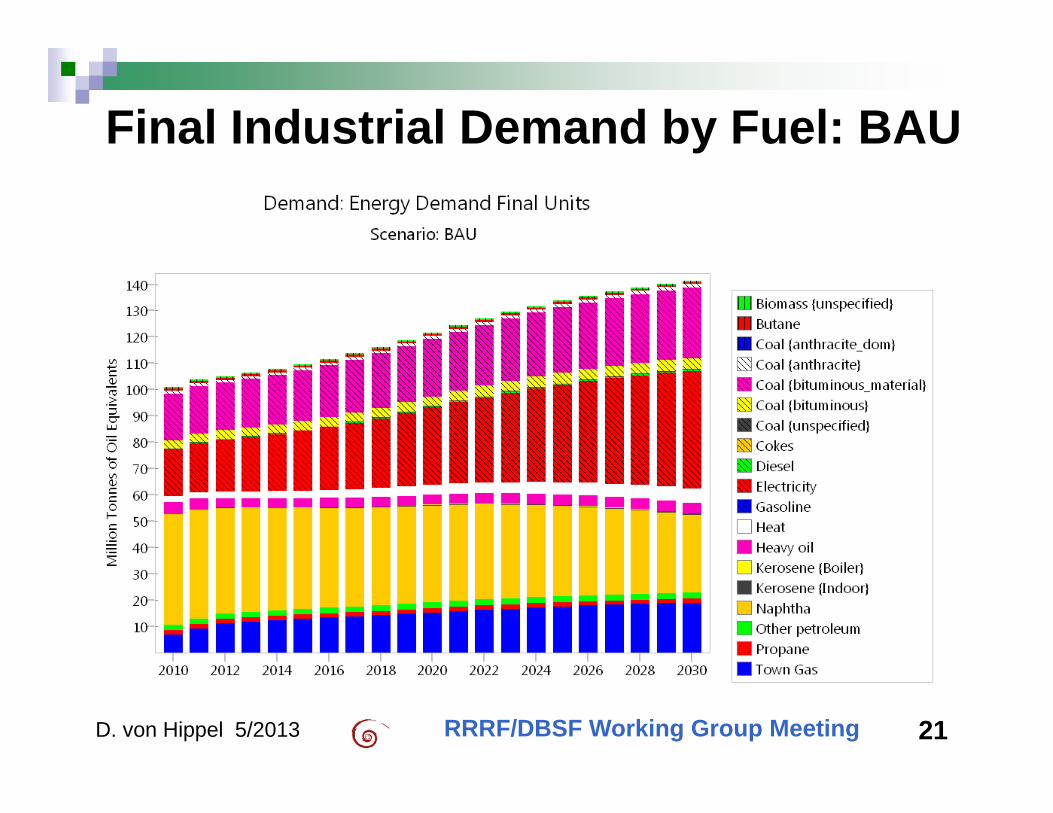
Final Industrial Demand by Fuel: BAU
21D. von Hippel 5/2013 RRRF/DBSF Working Group Meeting
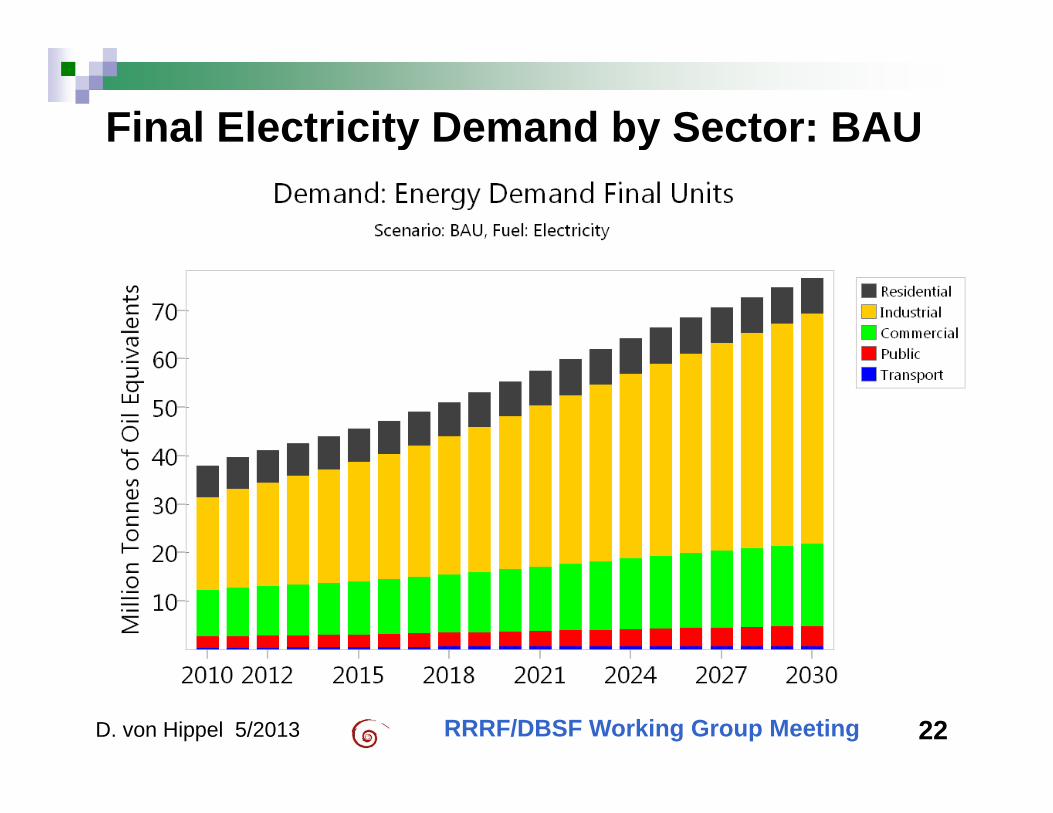
Final Electricity Demand by Sector: BAU
22D. von Hippel 5/2013 RRRF/DBSF Working Group Meeting
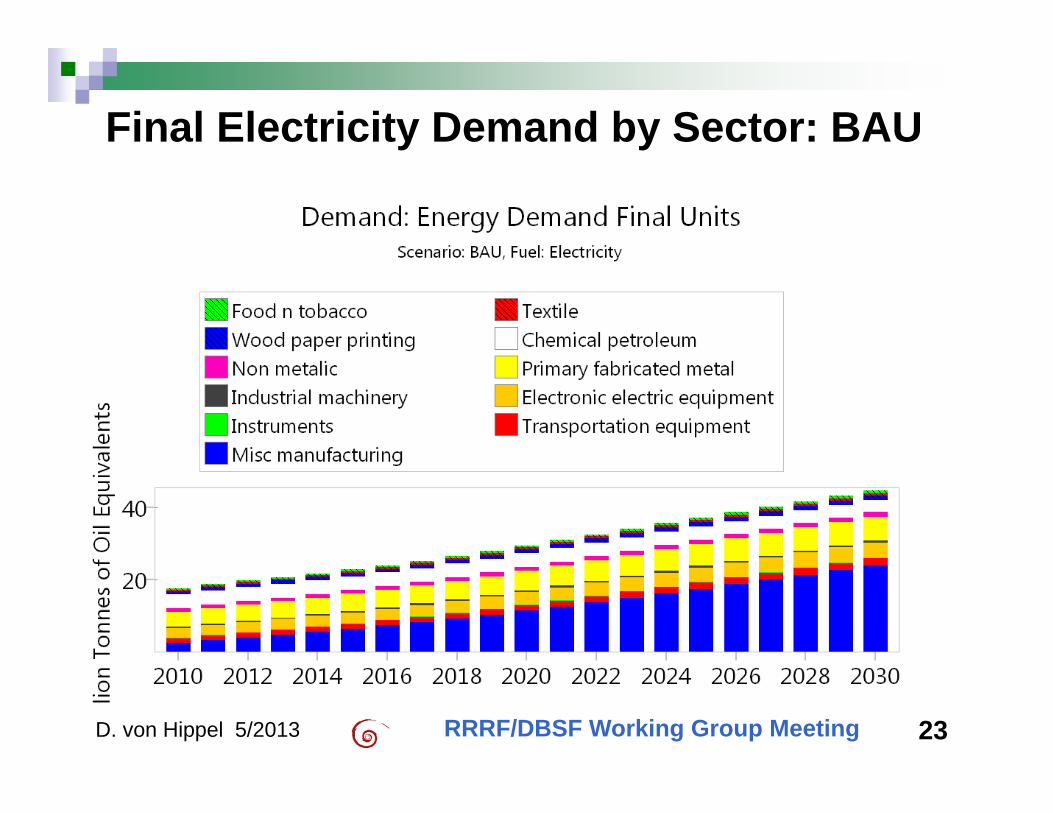
Final Electricity Demand by Sector: BAU
23D. von Hippel 5/2013 RRRF/DBSF Working Group Meeting
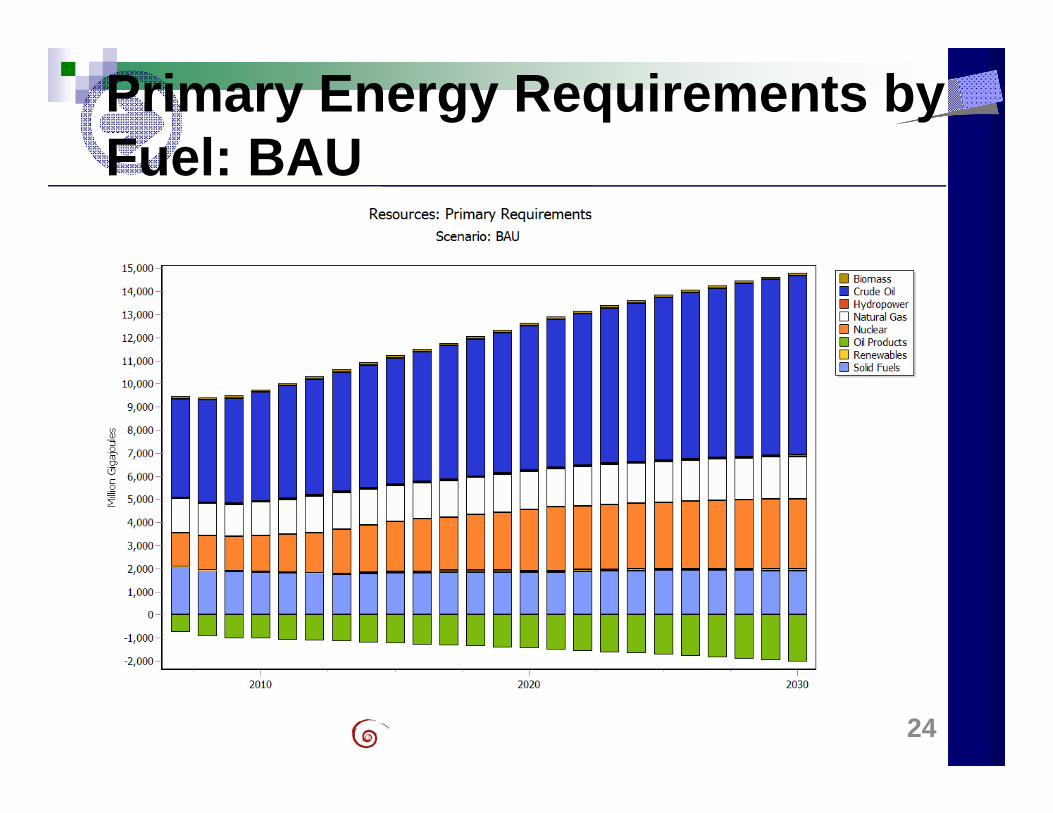
24
Primary Energy Requirements by Fuel: BAU
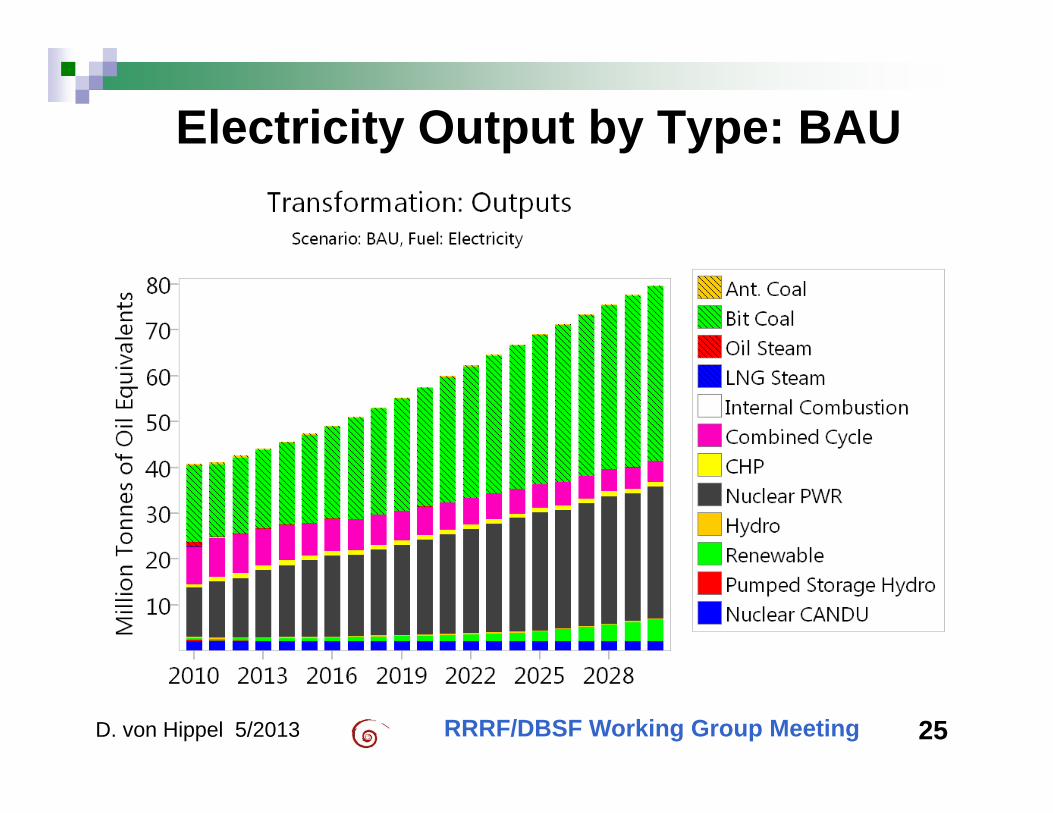
Electricity Output by Type: BAU
25D. von Hippel 5/2013 RRRF/DBSF Working Group Meeting
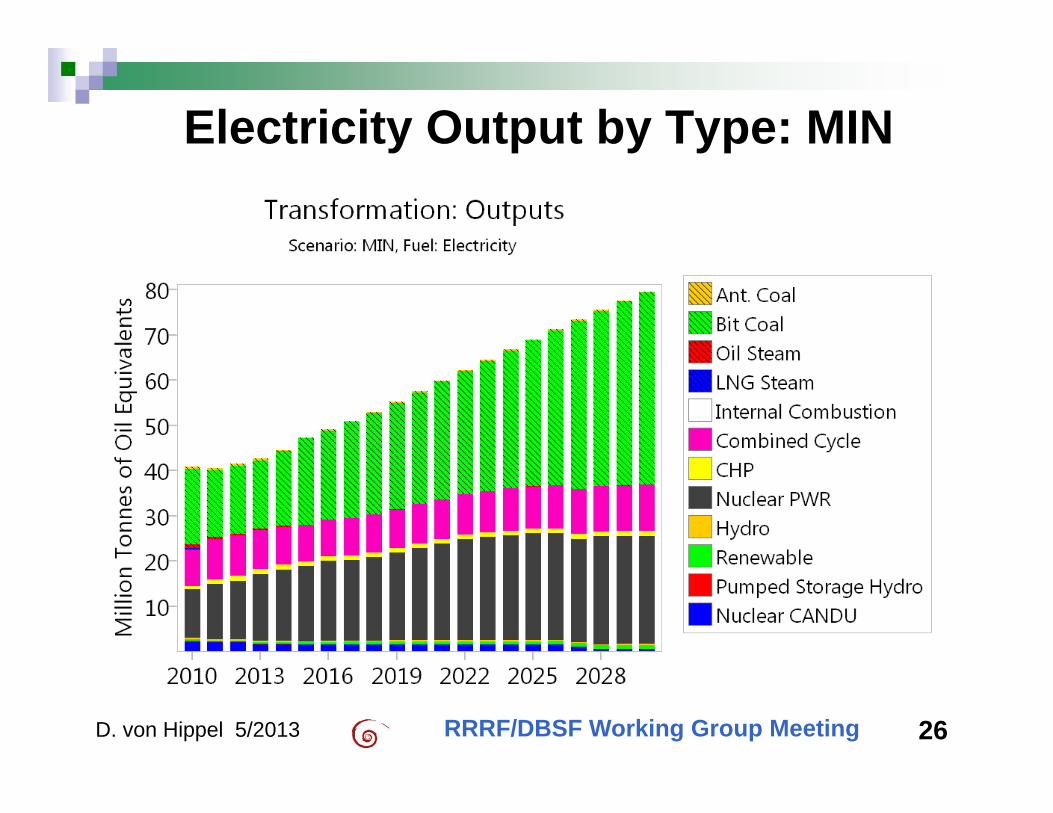
Electricity Output by Type: MIN
26D. von Hippel 5/2013 RRRF/DBSF Working Group Meeting
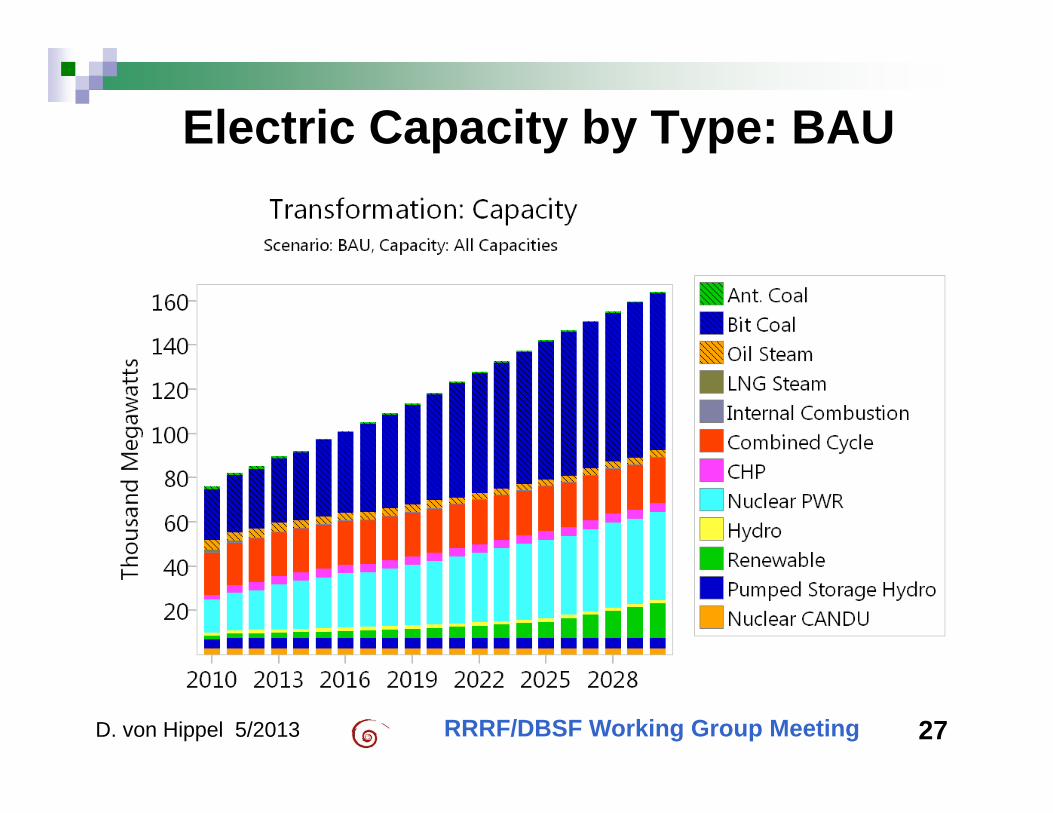
Electric Capacity by Type: BAU
27D. von Hippel 5/2013 RRRF/DBSF Working Group Meeting
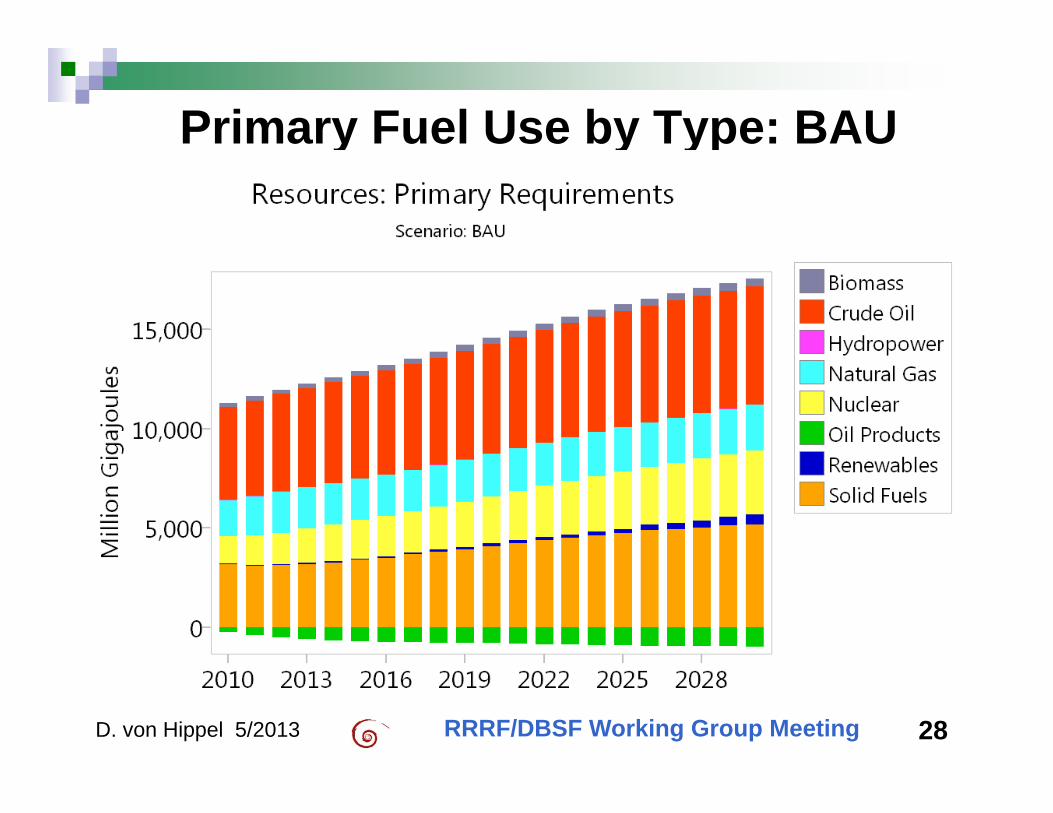
Primary Fuel Use by Type: BAU
28D. von Hippel 5/2013 RRRF/DBSF Working Group Meeting
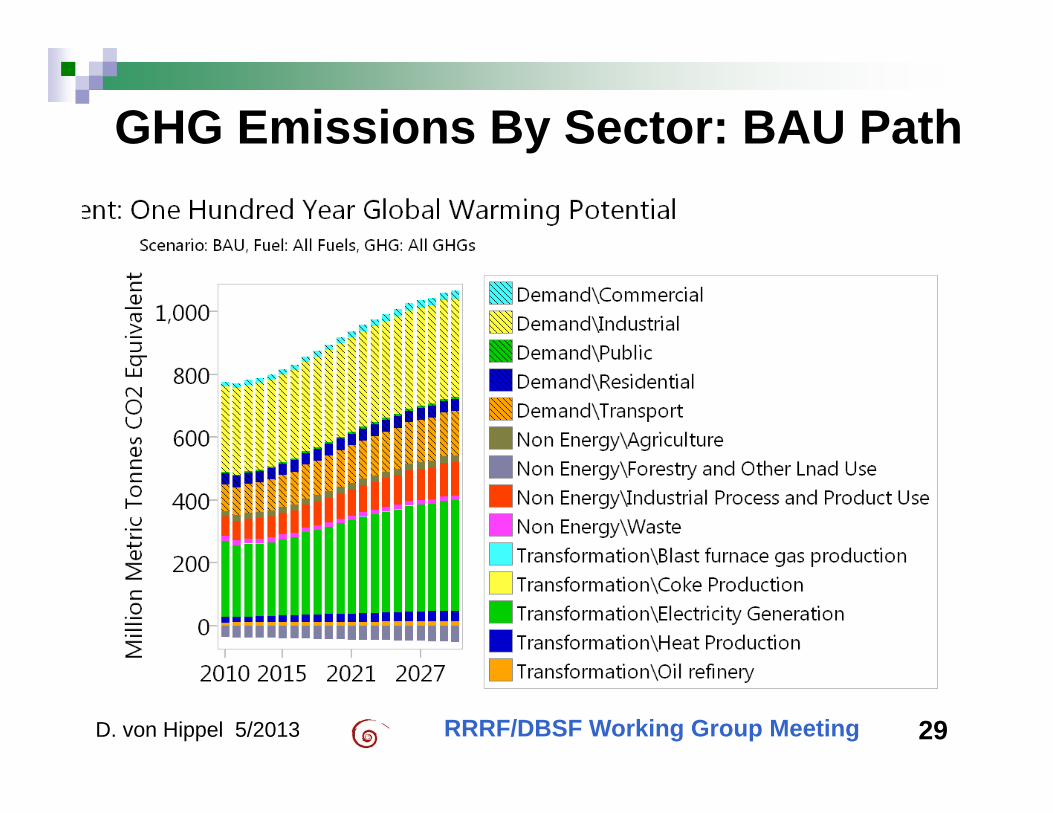
GHG Emissions By Sector: BAU Path
29D. von Hippel 5/2013 RRRF/DBSF Working Group Meeting
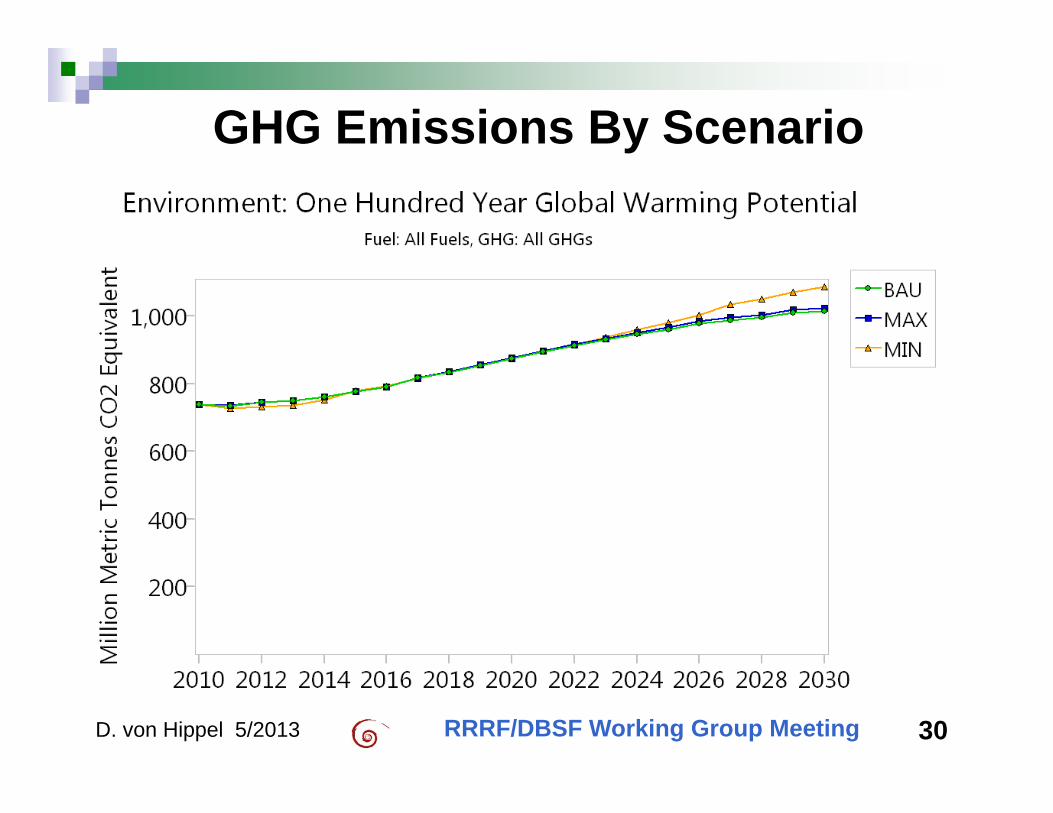
GHG Emissions By Scenario
30D. von Hippel 5/2013 RRRF/DBSF Working Group Meeting
THE ROK LEAP MODEL: Next Steps Work with Dr. Chung and Dr. Kang to revise
BAU, MIN, MAX Cases for consistency with sources (including any new plans)
Prepare case approximating newer (2/2013) Ministry of Energy “Target” case
Review assumptions for all Demand, Transformation branches for reasonableness
Detail attributes of MIN, MAX, BAU paths as needed for modeling of regional nuclear fuel cycle cooperation
31D. von Hippel 5/2013 RRRF/DBSF Working Group Meeting
THE ROK LEAP MODEL: Next Steps Prepare one or more “National Alternative”
cases that focus more on energy efficiency, renewable energy, “green growth”
Revise older “Regional Alternative” path that includes National Alternative attributes, and also models the inclusion of the ROK in regional energy cooperation initiatives (including with DPRK)
32D. von Hippel 5/2013 RRRF/DBSF Working Group Meeting
RRRF/DBSF Working Group Meeting 33D. von Hippel 5/2013
THANK YOU!
![별표3] The Republic of Korea Tariff Reduction Schedule for Korea … · 2015-12-22 · [별표3] The Republic of Korea Tariff Reduction Schedule for Korea-ASEAN FTA (HS2012) 2012](https://img.pdfslide.net/doc/110x75/5e8e2fd8378fff744940f072/eoe3-the-republic-of-korea-tariff-reduction-schedule-for-korea-2015-12-22.jpg)