Embed Size (px)
Citation preview

Entering A New Phase of Reforms
Republic of Latvia
December 2018
Disclaimer
This presentation and its contents are confidential and may not be reproduced, redistributed, published or passed on to any other person, directly or indirectly, in whole or in part, for any
purpose and should not be treated as offering material of any sort. If this presentation has been received in error it must be returned immediately to the Ministry of Finance of the Republic of
Latvia (“Latvia”). This presentation is not directed at, or intended for distribution to or use by, any person or entity that is a citizen or resident of, or located in, any locality, state, country or
other jurisdiction where such distribution or use would be contrary to law or regulation or which would require any registration, licensing or other action to be taken within such jurisdiction.
THIS PRESENTATION IS NOT FOR PUBLICATION, RELEASE OR DISTRIBUTION, DIRECTLY OR INDIRECTLY, INTO THE UNITED STATES, AUSTRALIA, CANADA OR JAPAN OR
ANY OTHER JURISDICTION IN WHICH SUCH PUBLICATION, RELEASE OR DISTRIBUTION WOULD BE UNLAWFUL. This presentation and the information contained herein are not an
offer of securities for sale in the United States or any other jurisdiction. No action has been or will be taken by Latvia in any country or jurisdiction that would, or is intended to, permit a public
offering of securities in any country or jurisdiction where action for that purpose is required. In particular, no securities have been or will be registered under the U.S. Securities Act of 1933, as
amended (the “Securities Act”) or with any securities regulatory authority of any state or other jurisdiction of the United States and securities may not be offered, sold or delivered within the
United States except pursuant to an exemption from, or in a transaction not subject to, the registration requirements of the Securities Act and applicable state securities laws and may only be
sold outside of the United States in reliance on Regulation S under the Securities Act and otherwise in compliance with all applicable laws and regulations in each country or jurisdiction in
which any such offer, sale or delivery of securities is made. Latvia does not intend to register or to conduct a public offering of any securities in the United States or any other jurisdiction. This
presentation and its contents may not be viewed by persons within the United States (within the meaning of Regulation S under the Securities Act).
This presentation is directed solely at (i) persons who are outside the United Kingdom, (ii) persons in the United Kingdom who have professional experience in matters relating to investments
falling within Article 19(5) of the Financial Services and Markets Act 2000 (Financial Promotion) Order 2005 as amended (the “Order”), (iii) high net worth entities, and other persons in the
United Kingdom to whom it may lawfully be communicated, falling within Article 49(2)(a) to (d) of the Order and (iv) persons in the United Kingdom to whom an invitation or inducement to
engage in investment activity within the meaning of section 21 of the Financial Services and Markets Act 2000) in connection with the issue or sale of any securities of Latvia may otherwise
lawfully be communicated or caused to be communicated (all such persons in (i)-(iv) above being referred to as “relevant persons”). In the United Kingdom, this presentation is directed only
at relevant persons and persons who are not relevant persons should not in any way act or rely on this presentation. Any investment activity to which this presentation relates will only be
available to and will only be engaged with relevant persons.
This presentation does not constitute or form part of, and should not be construed as, an offer or invitation to sell securities of Latvia, or the solicitation of an offer to subscribe for or purchase
securities of Latvia, and nothing contained herein shall form the basis of or be relied on in connection with any contract or commitment whatsoever. Any decision to purchase any securities of
Latvia should be made solely on the basis of the conditions of the securities and the information contained in the offering circular, information statement or equivalent disclosure document
prepared in connection with the offering of such securities. Prospective investors are required to make their own independent investigations and appraisals of the business and financial
condition of Latvia and the nature of any securities before taking any investment decision with respect to securities of Latvia.
By accessing this presentation the recipient will be deemed to represent that they possess, either individually or through their advisers, sufficient investment expertise to understand the risks
involved in any purchase or sale of any financial instrument or any other information contained herein. The information in this presentation has not been independently verified. No
representation or warranty, express or implied, is made as to the accuracy, completeness or fairness of the presentation and the information contained herein and no reliance should be
placed on such information. None of Latvia, their advisers, connected persons or any other person accepts any liability for any loss howsoever arising, directly or indirectly, from this
presentation or its contents. This presentation should not be construed as legal, tax, investment or other advice and any recipient is strongly advised to seek their own independent advice in
respect of any related investment, financial, legal, tax, accounting or regulatory considerations. There is no obligation to update, modify or amend this presentation or to otherwise notify any
recipient if any information, opinion, projection, forecast or estimate set forth herein changes or subsequently becomes inaccurate or in light of any new information or future events.
This presentation contains forward-looking statements, which include all statements other than statements of historical facts, including, without limitation, any statements preceded by,
followed by or including the words “anticipates,” “estimates,” “expects,” “believes,” “intends,” “plans,” “aims,” “seeks,” “may,” “will,” “should” or similar expressions or the negative thereof. Such
forward-looking statements involve known and unknown risks, uncertainties and other important factors beyond Latvia's control that could cause Latvia’s actual results, performance or
achievements to be materially different from future results, performance or achievements expressed or implied by such forward-looking statements. These forward-looking statements speak
only as at the date of this presentation. Latvia expressly disclaims any obligation or undertaking to disseminate any updates or revisions to any forward-looking statements contained herein to
reflect any change in its expectations with regard thereto or any new information or change in events, conditions or circumstances on which any of such statements are based.
2
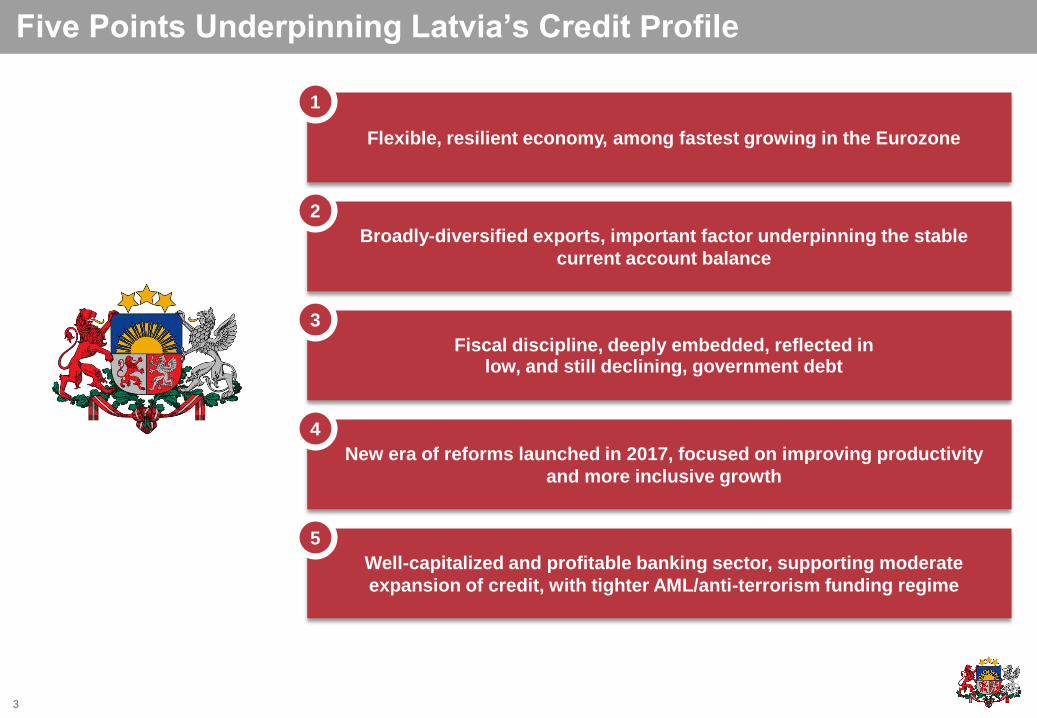
Five Points Underpinning Latvia’s Credit Profile
Flexible, resilient economy, among fastest growing in the Eurozone
1
Broadly-diversified exports, important factor underpinning the stable
current account balance
2
Fiscal discipline, deeply embedded, reflected in low, and still declining, government debt
3
New era of reforms launched in 2017, focused on improving productivity
and more inclusive growth
4
Well-capitalized and profitable banking sector, supporting moderate
expansion of credit, with tighter AML/anti-terrorism funding regime
5
3

1. Overview
Portrait of an Improving Sovereign Credit4
Presentation Outline
1) Overview: Portrait of an Improving Sovereign Credit 4
2) The Economy: Strong, Sustainable Growth 8
3) Banking Sector: Well-Capitalized, Profitable, and Beginning to Lend Again 13
4) Banking Sector Reforms: Strengthening AML/Anti-Terrorism Funding Controls 18
5) Fiscal Policy: Disciplined Approach Supports Improved Credit Profile 21
6) New Reform Push: Targets Productivity and More Inclusive Growth 24
7) Government Debt and Funding Strategy 29
8) Conclusion 35
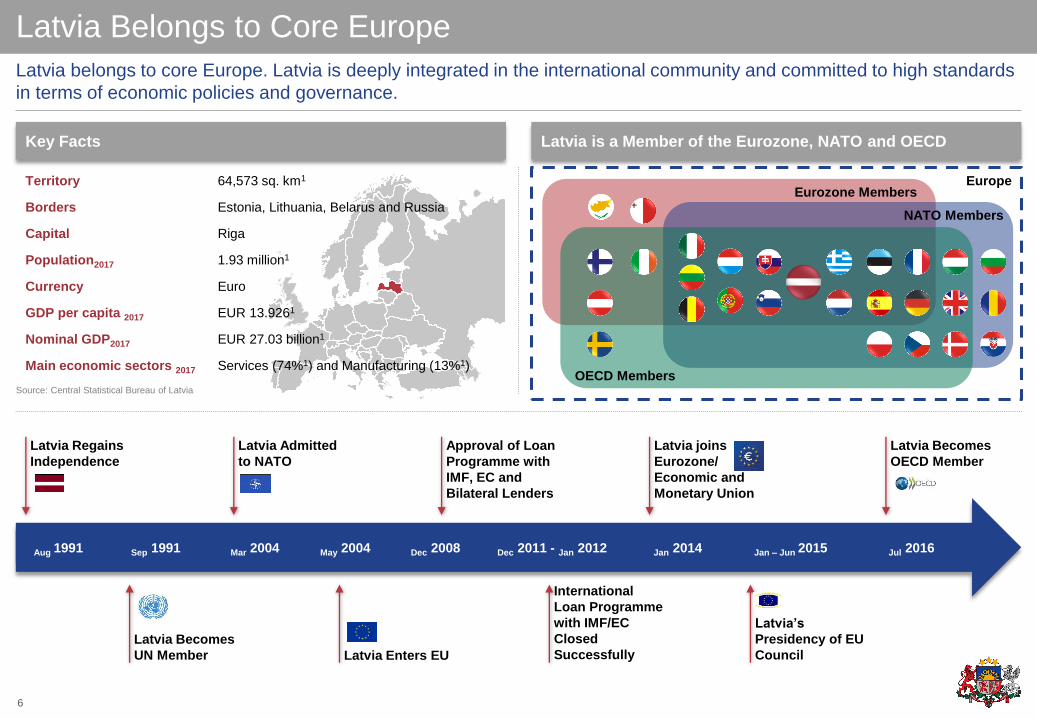
Territory 64,573 sq. km1
Borders Estonia, Lithuania, Belarus and Russia
Capital Riga
Population2017 1.93 million1
Currency Euro
GDP per capita 2017 EUR 13.9261
Nominal GDP2017 EUR 27.03 billion1
Main economic sectors 2017 Services (74%1) and Manufacturing (13%1)
Latvia Belongs to Core Europe
Latvia belongs to core Europe. Latvia is deeply integrated in the international community and committed to high standards
in terms of economic policies and governance.
Key Facts Latvia is a Member of the Eurozone, NATO and OECD
Aug 1991 Sep 1991 Mar 2004 May 2004 Dec 2008 Dec 2011 - Jan 2012 Jan 2014 Jan – Jun 2015 Jul 2016
Latvia Regains
Independence
Latvia Becomes
UN Member
Latvia Admitted
to NATO
Approval of Loan
Programme with
IMF, EC and
Bilateral Lenders
Latvia joins
Eurozone/
Economic and
Monetary Union
Latvia Becomes
OECD Member
Latvia Enters EU
International
Loan Programme
with IMF/EC
Closed
Successfully
Latvia’s
Presidency of EU
Council
Europe
NATO Members
Eurozone Members
OECD MembersSource: Central Statistical Bureau of Latvia
6
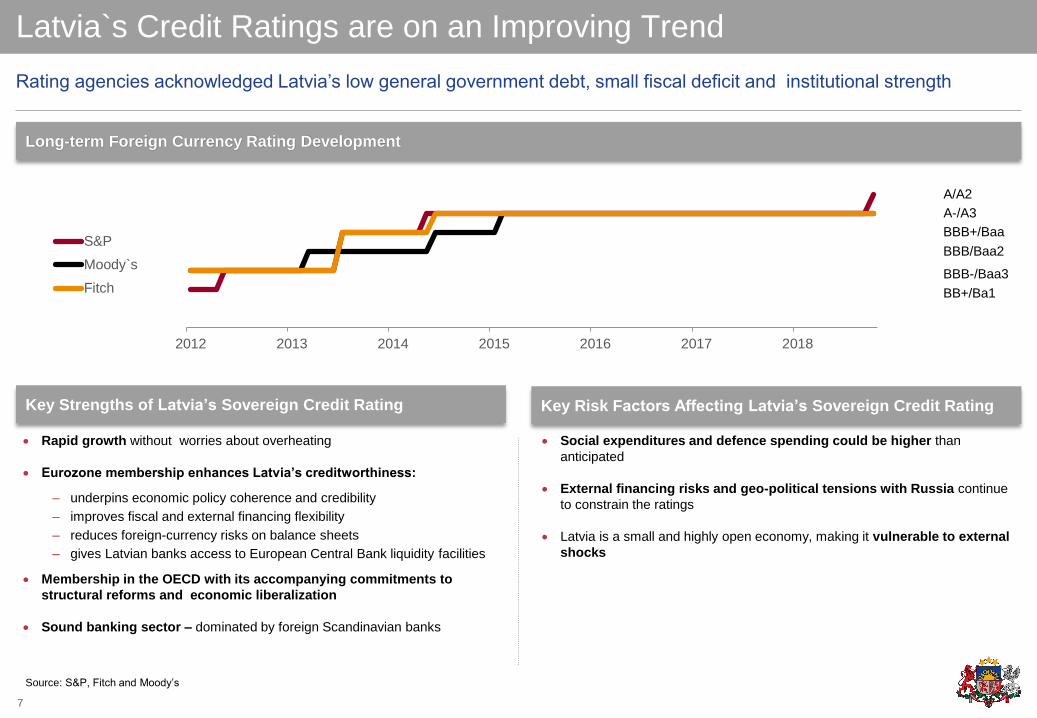
Latvia`s Credit Ratings are on an Improving Trend
Rating agencies acknowledged Latvia’s low general government debt, small fiscal deficit and institutional strength
Long-term Foreign Currency Rating Development
Key Strengths of Latvia’s Sovereign Credit Rating
Source: S&P, Fitch and Moody’s
Key Risk Factors Affecting Latvia’s Sovereign Credit Rating
Rapid growth without worries about overheating
Eurozone membership enhances Latvia’s creditworthiness:
– underpins economic policy coherence and credibility
– improves fiscal and external financing flexibility
– reduces foreign-currency risks on balance sheets
– gives Latvian banks access to European Central Bank liquidity facilities
Membership in the OECD with its accompanying commitments to
structural reforms and economic liberalization
Sound banking sector – dominated by foreign Scandinavian banks
Social expenditures and defence spending could be higher than
anticipated
External financing risks and geo-political tensions with Russia continue
to constrain the ratings
Latvia is a small and highly open economy, making it vulnerable to external
shocks
A/A2
BBB-/Baa3
A-/A3
BBB+/Baa
BBB/Baa2
BB+/Ba1
7
2012 2013 2014 2015 2016 2017 2018
S&P
Moody`s
Fitch

2. The Economy
Strong, Sustainable Growth 8
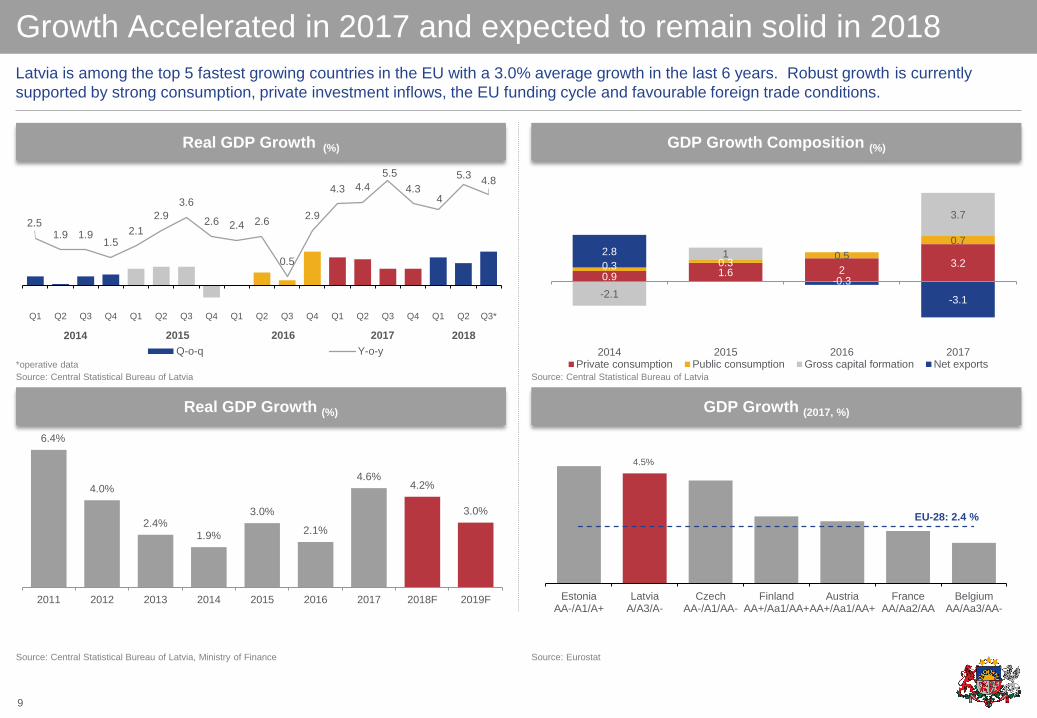
Growth Accelerated in 2017 and expected to remain solid in 2018
Real GDP Growth (%) GDP Growth (2017, %)
Real GDP Growth (%) GDP Growth Composition (%)
4.5%
EstoniaAA-/A1/A+
LatviaA/A3/A-
CzechAA-/A1/AA-
FinlandAA+/Aa1/AA+
AustriaAA+/Aa1/AA+
FranceAA/Aa2/AA
BelgiumAA/Aa3/AA-
EU-28: 2.4 %
6.4%
4.0%
2.4%1.9%
3.0%
2.1%
4.6%4.2%
3.0%
0.0%
1.0%
2.0%
3.0%
4.0%
5.0%
6.0%
7.0%
2011 2012 2013 2014 2015 2016 2017 2018F 2019F
2.51.9 1.9
1.52.1
2.9
3.6
2.6 2.4 2.6
0.5
2.9
4.3 4.4
5.5
4.34
5.34.8
-1
0
1
2
3
4
5
6
Q1 Q2 Q3 Q4 Q1 Q2 Q3 Q4 Q1 Q2 Q3 Q4 Q1 Q2 Q3 Q4 Q1 Q2 Q3*
Q-o-q Y-o-y
2014 2015 2016 2017 2018
Source: Central Statistical Bureau of Latvia
Source: Central Statistical Bureau of Latvia, Ministry of Finance Source: Eurostat
Source: Central Statistical Bureau of Latvia
9
Latvia is among the top 5 fastest growing countries in the EU with a 3.0% average growth in the last 6 years. Robust growth is currently
supported by strong consumption, private investment inflows, the EU funding cycle and favourable foreign trade conditions.
0.9 1.6 23.20.3 0.3
0.5
0.7
-2.1
1
3.7
2.8
-0.3
-3.1
2014 2015 2016 2017Private consumption Public consumption Gross capital formation Net exports*operative data
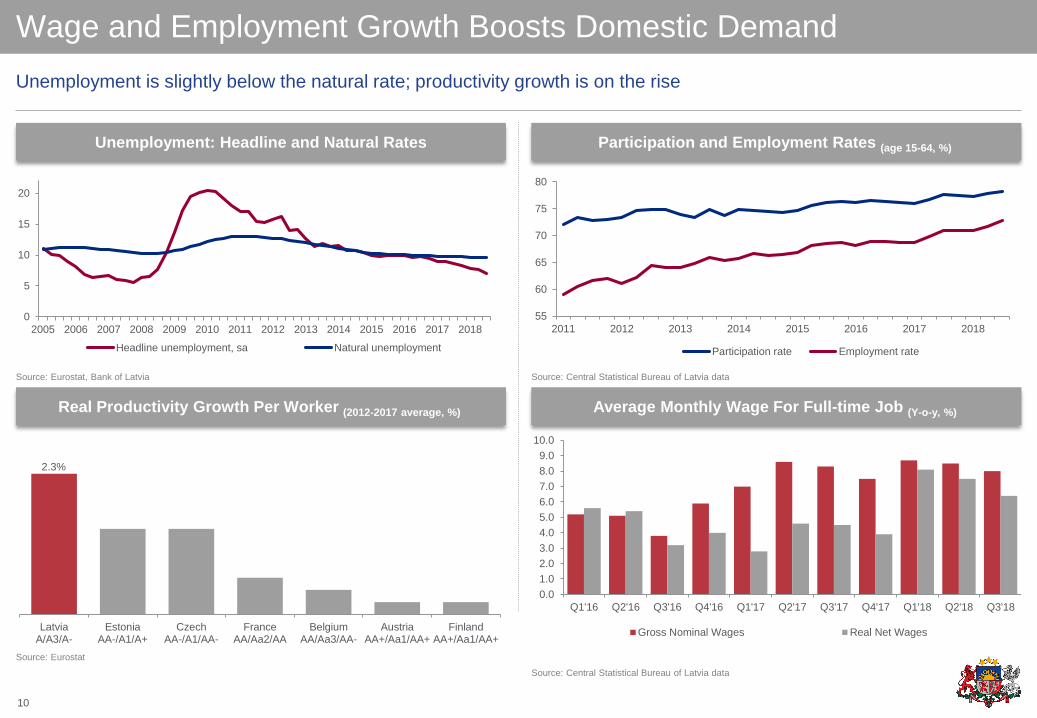
Wage and Employment Growth Boosts Domestic Demand
Real Productivity Growth Per Worker (2012-2017 average, %) Average Monthly Wage For Full-time Job (Y-o-y, %)
Unemployment: Headline and Natural Rates Participation and Employment Rates (age 15-64, %)
Unemployment is slightly below the natural rate; productivity growth is on the rise
2.3%
0
1
2
3
LatviaA/A3/A-
EstoniaAA-/A1/A+
CzechAA-/A1/AA-
FranceAA/Aa2/AA
BelgiumAA/Aa3/AA-
AustriaAA+/Aa1/AA+
FinlandAA+/Aa1/AA+
Source: Eurostat, Bank of Latvia
Source: Eurostat
Source: Central Statistical Bureau of Latvia data
Source: Central Statistical Bureau of Latvia data
0.0
1.0
2.0
3.0
4.0
5.0
6.0
7.0
8.0
9.0
10.0
Q1'16 Q2'16 Q3'16 Q4'16 Q1'17 Q2'17 Q3'17 Q4'17 Q1'18 Q2'18 Q3'18
Gross Nominal Wages Real Net Wages
10
55
60
65
70
75
80
2011 2012 2013 2014 2015 2016 2017 2018
Participation rate Employment rate
0
5
10
15
20
2005 2006 2007 2008 2009 2010 2011 2012 2013 2014 2015 2016 2017 2018
Headline unemployment, sa Natural unemployment
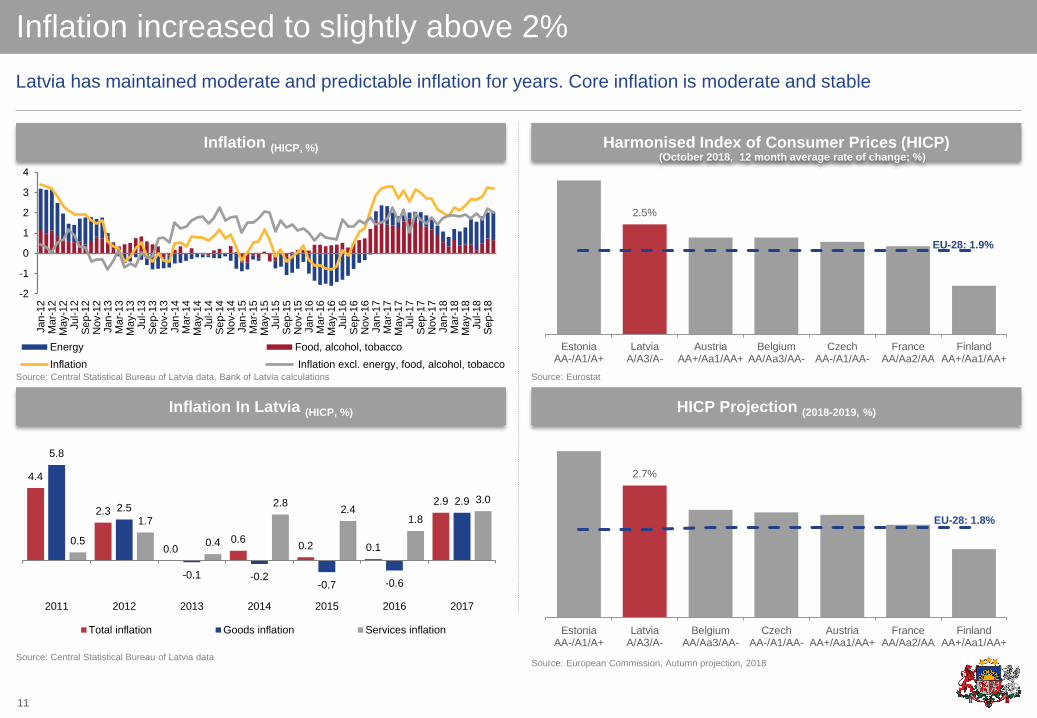
Inflation increased to slightly above 2%
Inflation In Latvia (HICP, %) HICP Projection (2018-2019, %)
Inflation (HICP, %) Harmonised Index of Consumer Prices (HICP)
Latvia has maintained moderate and predictable inflation for years. Core inflation is moderate and stable
4.4
2.3
0.00.6
0.2 0.1
2.9
5.8
2.5
-0.1 -0.2-0.7 -0.6
2.9
0.5
1.7
0.4
2.82.4
1.8
3.0
2011 2012 2013 2014 2015 2016 2017
Total inflation Goods inflation Services inflation
Source: Central Statistical Bureau of Latvia data, Bank of Latvia calculations
Source: Central Statistical Bureau of Latvia dataSource: European Commission, Autumn projection, 2018
Source: Eurostat
2.7%
0.00%
0.50%
1.00%
1.50%
2.00%
2.50%
3.00%
3.50%
0.00%
0.50%
1.00%
1.50%
2.00%
2.50%
3.00%
3.50%
EstoniaAA-/A1/A+
LatviaA/A3/A-
BelgiumAA/Aa3/AA-
CzechAA-/A1/AA-
AustriaAA+/Aa1/AA+
FranceAA/Aa2/AA
FinlandAA+/Aa1/AA+
EU-28: 1.8%
2.5%
0.0%
0.5%
1.0%
1.5%
2.0%
2.5%
3.0%
3.5%
0.0%
0.5%
1.0%
1.5%
2.0%
2.5%
3.0%
3.5%
EstoniaAA-/A1/A+
LatviaA/A3/A-
AustriaAA+/Aa1/AA+
BelgiumAA/Aa3/AA-
CzechAA-/A1/AA-
FranceAA/Aa2/AA
FinlandAA+/Aa1/AA+
EU-28: 1.9%
11
-2
-1
0
1
2
3
4
Jan
-12
Ma
r-12
Ma
y-1
2Jul-1
2S
ep-1
2N
ov-1
2Jan
-13
Ma
r-13
Ma
y-1
3Jul-1
3S
ep-1
3N
ov-1
3Jan
-14
Ma
r-14
Ma
y-1
4Jul-1
4S
ep-1
4N
ov-1
4Jan
-15
Ma
r-15
Ma
y-1
5Jul-1
5S
ep-1
5N
ov-1
5Jan
-16
Ma
r-16
Ma
y-1
6Jul-1
6S
ep-1
6N
ov-1
6Jan
-17
Ma
r-17
Ma
y-1
7Jul-1
7S
ep-1
7N
ov-1
7Jan
-18
Ma
r-18
Ma
y-1
8Jul-1
8S
ep-1
8
Energy Food, alcohol, tobacco
Inflation Inflation excl. energy, food, alcohol, tobacco
(October 2018, 12 month average rate of change; %)
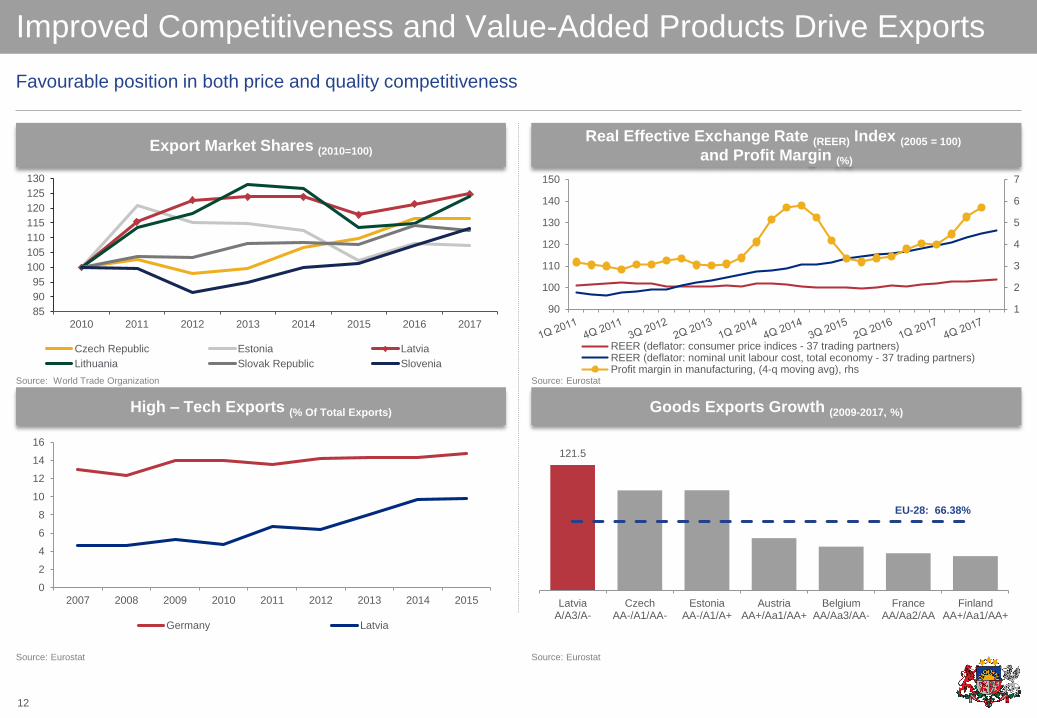
Improved Competitiveness and Value-Added Products Drive Exports
High – Tech Exports (% Of Total Exports) Goods Exports Growth (2009-2017, %)
Export Market Shares (2010=100)
Real Effective Exchange Rate (REER) Index (2005 = 100)
and Profit Margin (%)
Favourable position in both price and quality competitiveness
0
2
4
6
8
10
12
14
16
2007 2008 2009 2010 2011 2012 2013 2014 2015
Germany Latvia
121.5
LatviaA/A3/A-
CzechAA-/A1/AA-
EstoniaAA-/A1/A+
AustriaAA+/Aa1/AA+
BelgiumAA/Aa3/AA-
FranceAA/Aa2/AA
FinlandAA+/Aa1/AA+
EU-28: 66.38%
Source: World Trade Organization
Source: Eurostat Source: Eurostat
Source: Eurostat
12
85
90
95
100
105
110
115
120
125
130
2010 2011 2012 2013 2014 2015 2016 2017
Czech Republic Estonia Latvia
Lithuania Slovak Republic Slovenia
1
2
3
4
5
6
7
90
100
110
120
130
140
150
REER (deflator: consumer price indices - 37 trading partners)REER (deflator: nominal unit labour cost, total economy - 37 trading partners)Profit margin in manufacturing, (4-q moving avg), rhs

3. Banking Sector
Well-Capitalized, Profitable, and Beginning to Lend Again 13
Sound, Well Capitalised and Liquid Banking Sector
Capital Adequacy (%) Liquidity Coverage Ratio
Key Highlights Capital Ownership of the Banking System (3Q 2018)
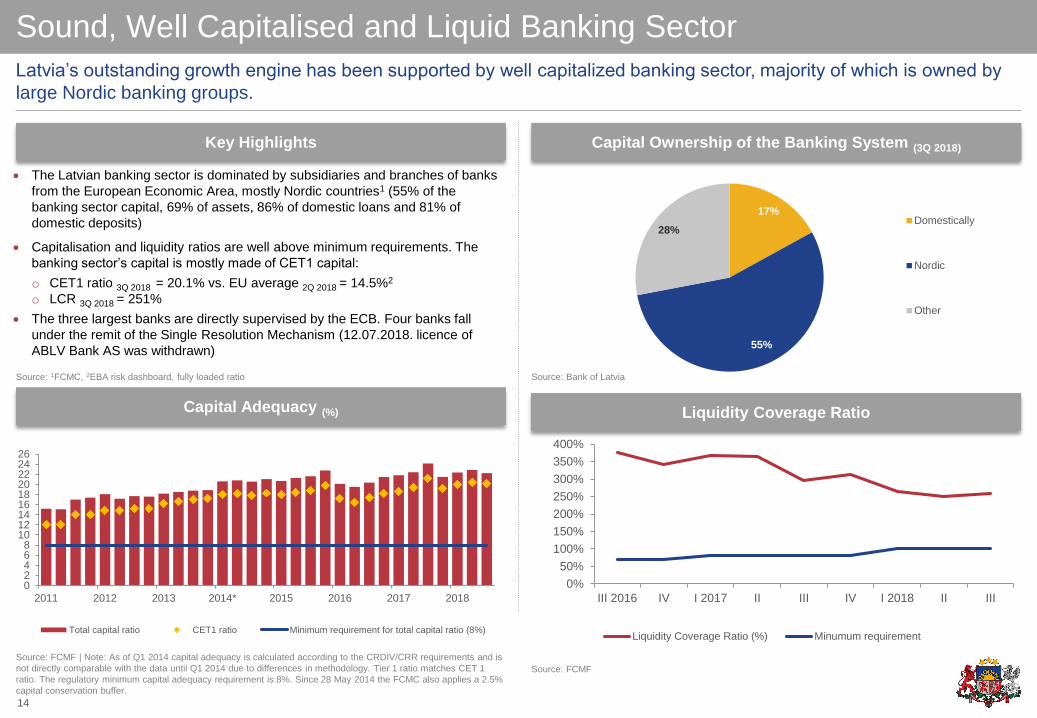
Latvia’s outstanding growth engine has been supported by well capitalized banking sector, majority of which is owned by
large Nordic banking groups.
The Latvian banking sector is dominated by subsidiaries and branches of banks
from the European Economic Area, mostly Nordic countries1 (55% of the
banking sector capital, 69% of assets, 86% of domestic loans and 81% of
domestic deposits)
Capitalisation and liquidity ratios are well above minimum requirements. The
banking sector’s capital is mostly made of CET1 capital:
o CET1 ratio 3Q 2018 = 20.1% vs. EU average 2Q 2018 = 14.5%2
o LCR 3Q 2018 = 251%
The three largest banks are directly supervised by the ECB. Four banks fall
under the remit of the Single Resolution Mechanism (12.07.2018. licence of
ABLV Bank AS was withdrawn)
02468
101214161820222426
2011 2012 2013 2014* 2015 2016 2017 2018
Total capital ratio CET1 ratio Minimum requirement for total capital ratio (8%)
17%
55%
28%Domestically
Nordic
Other
Source: 1FCMC, 2EBA risk dashboard, fully loaded ratio
Source: FCMF | Note: As of Q1 2014 capital adequacy is calculated according to the CRDIV/CRR requirements and is
not directly comparable with the data until Q1 2014 due to differences in methodology. Tier 1 ratio matches CET 1
ratio. The regulatory minimum capital adequacy requirement is 8%. Since 28 May 2014 the FCMC also applies a 2.5%
capital conservation buffer.
Source: FCMF
Source: Bank of Latvia
14
0%
50%
100%
150%
200%
250%
300%
350%
400%
III 2016 IV I 2017 II III IV I 2018 II III
Liquidity Coverage Ratio (%) Minumum requirement
Bank Lending Recovers and Supports Growth
Total Loan Portfolio Quality Domestic Loan-to-Deposit Ratio (%)
Key Highlights Loans to Domestic Clients excluding Government (yoy)
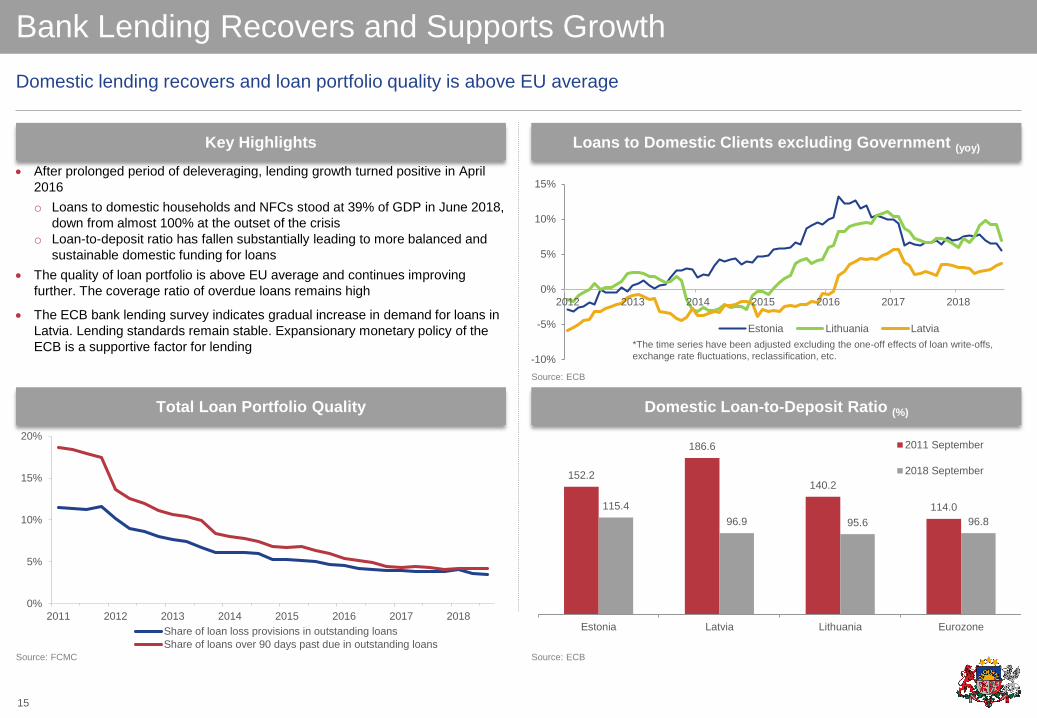
Domestic lending recovers and loan portfolio quality is above EU average
After prolonged period of deleveraging, lending growth turned positive in April
2016
o Loans to domestic households and NFCs stood at 39% of GDP in June 2018,
down from almost 100% at the outset of the crisis
o Loan-to-deposit ratio has fallen substantially leading to more balanced and
sustainable domestic funding for loans
The quality of loan portfolio is above EU average and continues improving
further. The coverage ratio of overdue loans remains high
The ECB bank lending survey indicates gradual increase in demand for loans in
Latvia. Lending standards remain stable. Expansionary monetary policy of the
ECB is a supportive factor for lending
152.2
186.6
140.2
114.0115.4
96.9 95.6 96.8
Estonia Latvia Lithuania Eurozone
2011 September
2018 September
Source: ECB
Source: FCMC Source: ECB
15
0%
5%
10%
15%
20%
2011 2012 2013 2014 2015 2016 2017 2018
Share of loan loss provisions in outstanding loans
Share of loans over 90 days past due in outstanding loans
-10%
-5%
0%
5%
10%
15%
2012 2013 2014 2015 2016 2017 2018
Estonia Lithuania Latvia
*The time series have been adjusted excluding the one-off effects of loan write-offs,
exchange rate fluctuations, reclassification, etc.
Banking Sector Profitability Remains Healthy
Key Highlights ROE Dispersion
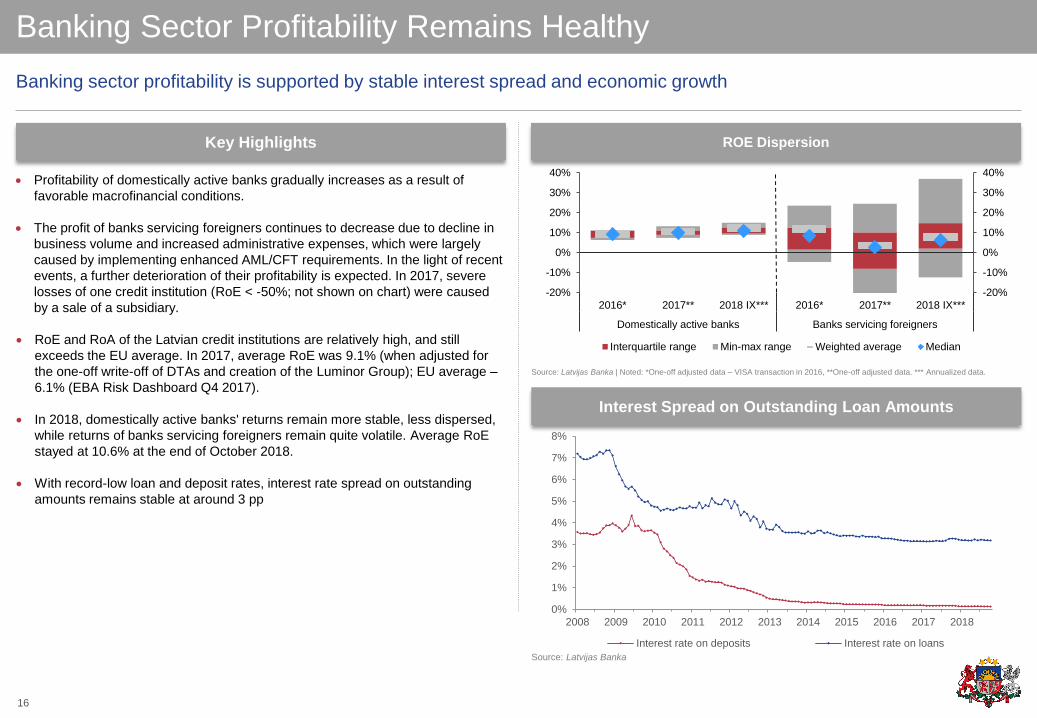
Profitability of domestically active banks gradually increases as a result of
favorable macrofinancial conditions.
The profit of banks servicing foreigners continues to decrease due to decline in
business volume and increased administrative expenses, which were largely
caused by implementing enhanced AML/CFT requirements. In the light of recent
events, a further deterioration of their profitability is expected. In 2017, severe
losses of one credit institution (RoE < -50%; not shown on chart) were caused
by a sale of a subsidiary.
RoE and RoA of the Latvian credit institutions are relatively high, and still
exceeds the EU average. In 2017, average RoE was 9.1% (when adjusted for
the one-off write-off of DTAs and creation of the Luminor Group); EU average –
6.1% (EBA Risk Dashboard Q4 2017).
In 2018, domestically active banks' returns remain more stable, less dispersed,
while returns of banks servicing foreigners remain quite volatile. Average RoE
stayed at 10.6% at the end of October 2018.
With record-low loan and deposit rates, interest rate spread on outstanding
amounts remains stable at around 3 pp
Banking sector profitability is supported by stable interest spread and economic growth
Interest Spread on Outstanding Loan Amounts
0%
1%
2%
3%
4%
5%
6%
7%
8%
2008 2009 2010 2011 2012 2013 2014 2015 2016 2017 2018
Interest rate on deposits Interest rate on loans
Source: Latvijas Banka | Noted: *One-off adjusted data – VISA transaction in 2016, **One-off adjusted data. *** Annualized data.
Source: Latvijas Banka
16
-20%
-10%
0%
10%
20%
30%
40%
-20%
-10%
0%
10%
20%
30%
40%
2016* 2017** 2018 IX*** 2016* 2017** 2018 IX***
Domestically active banks Banks servicing foreigners
Interquartile range Min-max range Weighted average Median
Parent Banks are Stable, Financially Sound and Profitable
Key Highlights Banks Financial Information
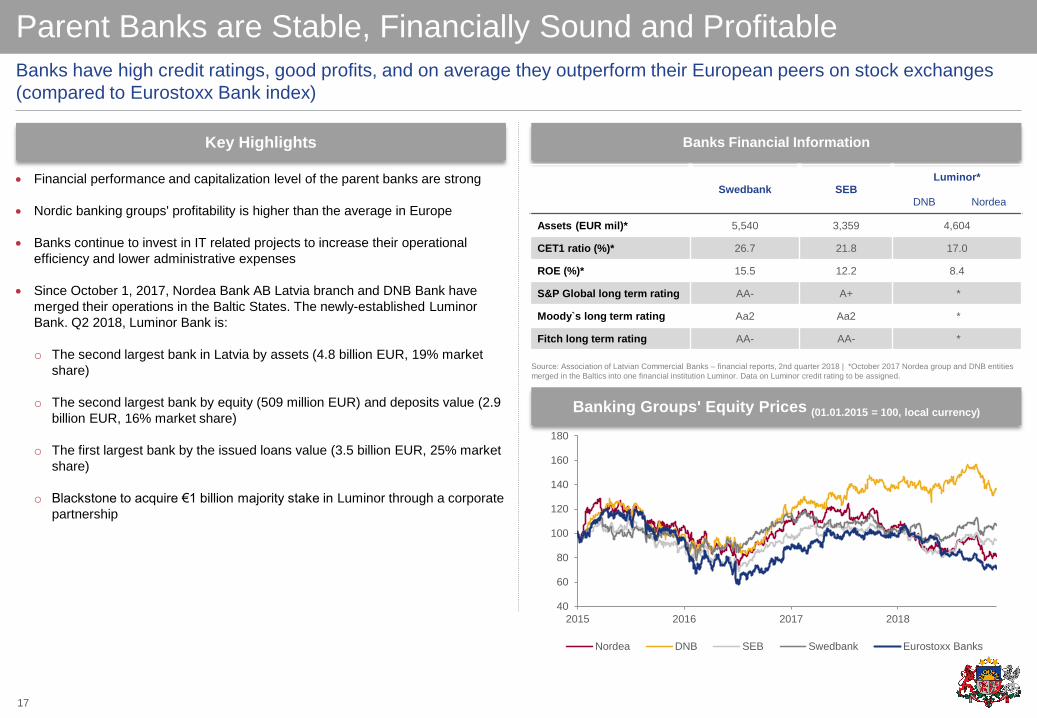
Financial performance and capitalization level of the parent banks are strong
Nordic banking groups' profitability is higher than the average in Europe
Banks continue to invest in IT related projects to increase their operational
efficiency and lower administrative expenses
Since October 1, 2017, Nordea Bank AB Latvia branch and DNB Bank have
merged their operations in the Baltic States. The newly-established Luminor
Bank. Q2 2018, Luminor Bank is:
o The second largest bank in Latvia by assets (4.8 billion EUR, 19% market
share)
o The second largest bank by equity (509 million EUR) and deposits value (2.9
billion EUR, 16% market share)
o The first largest bank by the issued loans value (3.5 billion EUR, 25% market
share)
o Blackstone to acquire €1 billion majority stake in Luminor through a corporate
partnership
Banks have high credit ratings, good profits, and on average they outperform their European peers on stock exchanges
(compared to Eurostoxx Bank index)
Banking Groups' Equity Prices (01.01.2015 = 100, local currency)
Swedbank SEBLuminor*
DNB Nordea
Assets (EUR mil)* 5,540 3,359 4,604
CET1 ratio (%)* 26.7 21.8 17.0
ROE (%)* 15.5 12.2 8.4
S&P Global long term rating AA- A+ *
Moody`s long term rating Aa2 Aa2 *
Fitch long term rating AA- AA- *
40
60
80
100
120
140
160
180
2015 2016 2017 2018
Nordea DNB SEB Swedbank Eurostoxx Banks
Source: Association of Latvian Commercial Banks – financial reports, 2nd quarter 2018 | *October 2017 Nordea group and DNB entities
merged in the Baltics into one financial institution Luminor. Data on Luminor credit rating to be assigned.
17

4. Banking Sector Reforms
Strengthening AML/Anti-Terrorism Funding Controls18
Tougher AML and CFT requirements are on the way
Key HighlightsTimeline for the enforcement of the amendments to the Law on the
Prevention of Money Laundering and Terrorism Financing
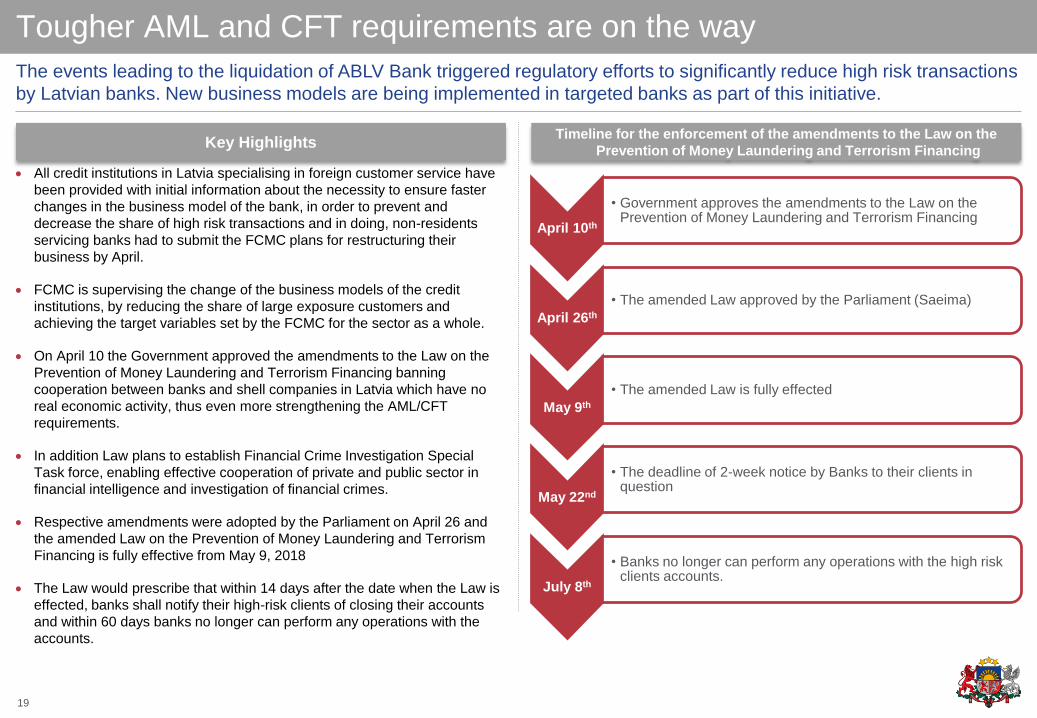
All credit institutions in Latvia specialising in foreign customer service have
been provided with initial information about the necessity to ensure faster
changes in the business model of the bank, in order to prevent and
decrease the share of high risk transactions and in doing, non-residents
servicing banks had to submit the FCMC plans for restructuring their
business by April.
FCMC is supervising the change of the business models of the credit
institutions, by reducing the share of large exposure customers and
achieving the target variables set by the FCMC for the sector as a whole.
On April 10 the Government approved the amendments to the Law on the
Prevention of Money Laundering and Terrorism Financing banning
cooperation between banks and shell companies in Latvia which have no
real economic activity, thus even more strengthening the AML/CFT
requirements.
In addition Law plans to establish Financial Crime Investigation Special
Task force, enabling effective cooperation of private and public sector in
financial intelligence and investigation of financial crimes.
Respective amendments were adopted by the Parliament on April 26 and
the amended Law on the Prevention of Money Laundering and Terrorism
Financing is fully effective from May 9, 2018
The Law would prescribe that within 14 days after the date when the Law is
effected, banks shall notify their high-risk clients of closing their accounts
and within 60 days banks no longer can perform any operations with the
accounts.
The events leading to the liquidation of ABLV Bank triggered regulatory efforts to significantly reduce high risk transactions
by Latvian banks. New business models are being implemented in targeted banks as part of this initiative.
April 10th
• Government approves the amendments to the Law on the Prevention of Money Laundering and Terrorism Financing
April 26th
• The amended Law approved by the Parliament (Saeima)
May 9th
• The amended Law is fully effected
May 22nd
• The deadline of 2-week notice by Banks to their clients in question
July 8th
• Banks no longer can perform any operations with the high risk clients accounts.
19
The Economic Impact of Tighter AML CFT is Minimal
Source: Bank of Latvia,
*Fitch (Latvia sovereign risk from ABLV Bank failure appears limited, 27.02.2018.)
Bank Liquidity Ratios Well Above CRD IV Requirement
The Role of Foreign Clients Banks in Latvia Growth Rates of Domestic and Foreign Client Deposits
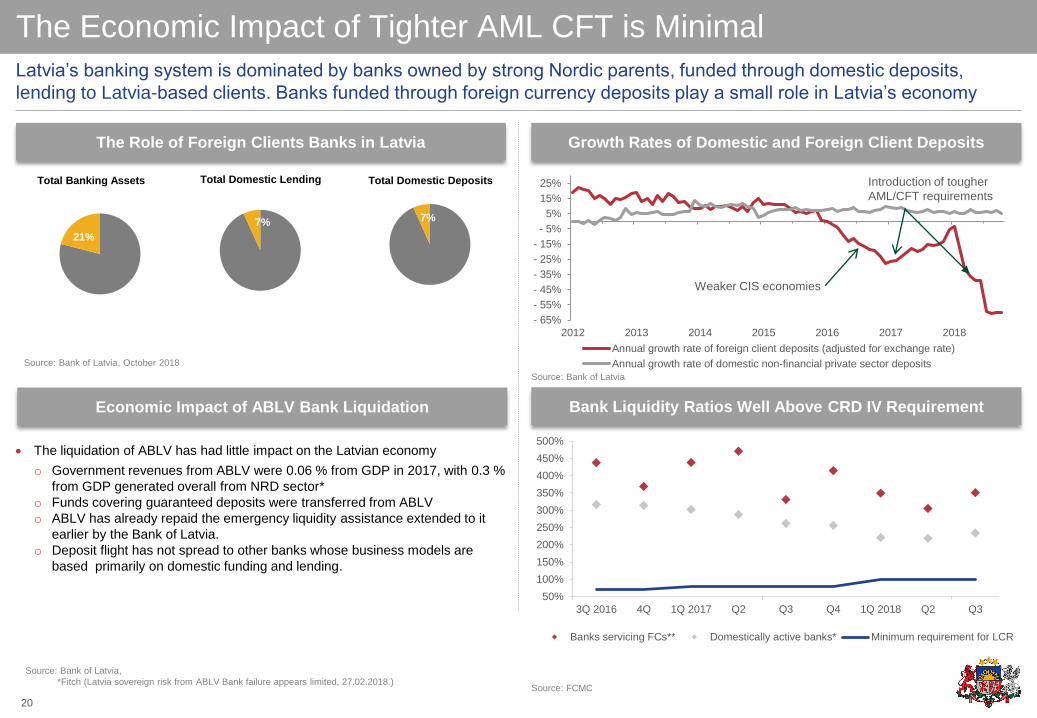
Latvia’s banking system is dominated by banks owned by strong Nordic parents, funded through domestic deposits,
lending to Latvia-based clients. Banks funded through foreign currency deposits play a small role in Latvia’s economy
The liquidation of ABLV has had little impact on the Latvian economy
o Government revenues from ABLV were 0.06 % from GDP in 2017, with 0.3 %
from GDP generated overall from NRD sector*
o Funds covering guaranteed deposits were transferred from ABLV
o ABLV has already repaid the emergency liquidity assistance extended to it
earlier by the Bank of Latvia.
o Deposit flight has not spread to other banks whose business models are
based primarily on domestic funding and lending.
Total Banking Assets
21%
- 65%
- 55%
- 45%
- 35%
- 25%
- 15%
- 5%
5%
15%
25%
2012 2013 2014 2015 2016 2017 2018
Annual growth rate of foreign client deposits (adjusted for exchange rate)
Annual growth rate of domestic non-financial private sector deposits
Source: Bank of Latvia
Total Domestic Lending Total Domestic Deposits
Source: FCMC
7% 7%
20
Introduction of tougher
AML/CFT requirements
Weaker CIS economies
Economic Impact of ABLV Bank Liquidation
50%
100%
150%
200%
250%
300%
350%
400%
450%
500%
3Q 2016 4Q 1Q 2017 Q2 Q3 Q4 1Q 2018 Q2 Q3
Banks servicing FCs** Domestically active banks* Minimum requirement for LCR
Source: Bank of Latvia, October 2018

5. Fiscal Policy
Disciplined Approach Supports Improved Credit Profile 21
Fiscal Sustainability Remains Top Priority
Expenditure Review Results (EUR, Million) 2018 Budget: Expenditure Measures (EUR million)
General Government nominal balance (% of GDP) Budget Balance (2017, % GDP)
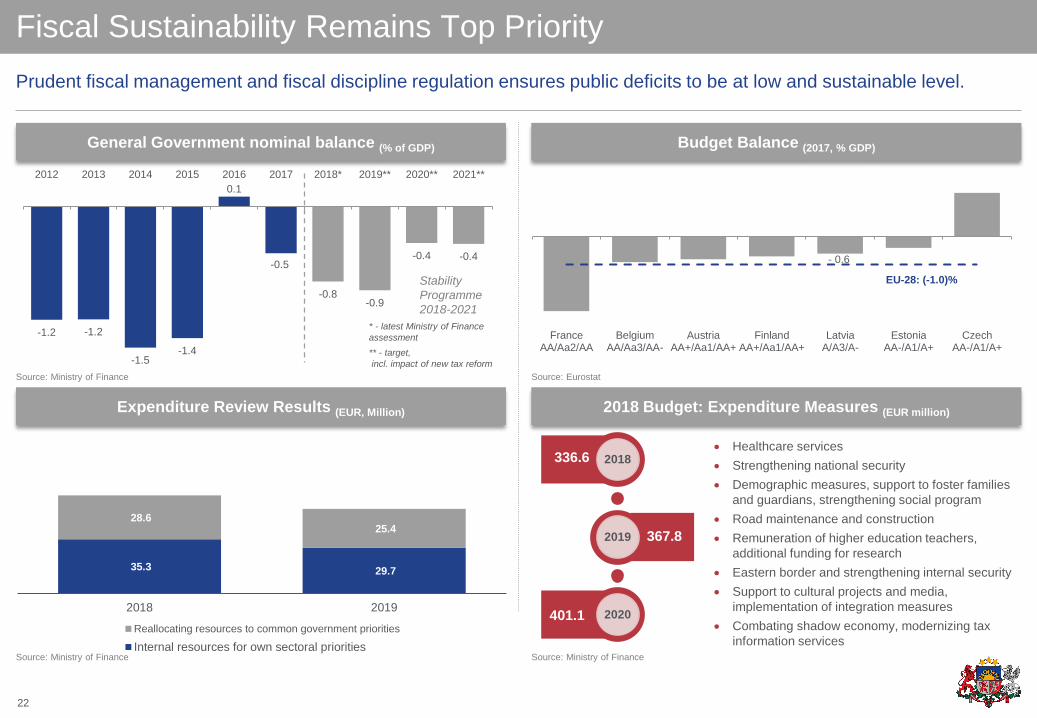
Prudent fiscal management and fiscal discipline regulation ensures public deficits to be at low and sustainable level.
-1.2 -1.2
-1.5-1.4
0.1
-0.5
-0.8-0.9
-0.4 -0.4
-1.6
-1.4
-1.2
-1.0
-0.8
-0.6
-0.4
-0.2
0.0
0.2
2012 2013 2014 2015 2016 2017 2018* 2019** 2020** 2021**
* - latest Ministry of Finance
assessment
** - target,
incl. impact of new tax reform
Stability
Programme
2018-2021
2018
2019
2020
336.6
367.8
401.1
Healthcare services
Strengthening national security
Demographic measures, support to foster families
and guardians, strengthening social program
Road maintenance and construction
Remuneration of higher education teachers,
additional funding for research
Eastern border and strengthening internal security
Support to cultural projects and media,
implementation of integration measures
Combating shadow economy, modernizing tax
information services
- 0.6
FranceAA/Aa2/AA
BelgiumAA/Aa3/AA-
AustriaAA+/Aa1/AA+
FinlandAA+/Aa1/AA+
LatviaA/A3/A-
EstoniaAA-/A1/A+
CzechAA-/A1/A+
EU-28: (-1.0)%
Source: Ministry of Finance
Source: Ministry of Finance Source: Ministry of Finance
Source: Eurostat
22
35.3 29.7
28.625.4
2018 2019
Reallocating resources to common government priorities
Internal resources for own sectoral priorities
Pension Reform Underpins Stability of Public Finances
The 2nd Tier Pension Net AUM (EUR billion, % GDP) Latvia’s age-related spending is one the lowest in EU (2016, % GDP)
Latvia’s Pension System And Recent Reforms Age-related Spending, Projected Change (2016-2070 , % GDP)
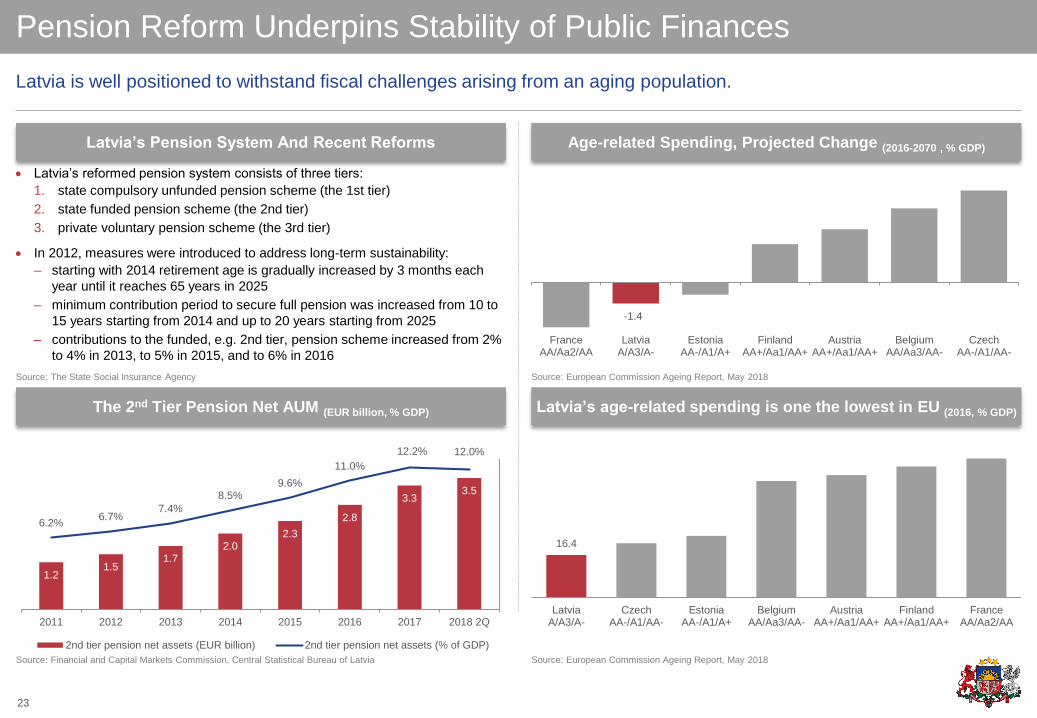
Latvia is well positioned to withstand fiscal challenges arising from an aging population.
Latvia’s reformed pension system consists of three tiers:
1. state compulsory unfunded pension scheme (the 1st tier)
2. state funded pension scheme (the 2nd tier)
3. private voluntary pension scheme (the 3rd tier)
In 2012, measures were introduced to address long-term sustainability:
– starting with 2014 retirement age is gradually increased by 3 months each
year until it reaches 65 years in 2025
– minimum contribution period to secure full pension was increased from 10 to
15 years starting from 2014 and up to 20 years starting from 2025
– contributions to the funded, e.g. 2nd tier, pension scheme increased from 2%
to 4% in 2013, to 5% in 2015, and to 6% in 2016
-1.4
FranceAA/Aa2/AA
LatviaA/A3/A-
EstoniaAA-/A1/A+
FinlandAA+/Aa1/AA+
AustriaAA+/Aa1/AA+
BelgiumAA/Aa3/AA-
CzechAA-/A1/AA-
16.4
LatviaA/A3/A-
CzechAA-/A1/AA-
EstoniaAA-/A1/A+
BelgiumAA/Aa3/AA-
AustriaAA+/Aa1/AA+
FinlandAA+/Aa1/AA+
FranceAA/Aa2/AA
Source: The State Social Insurance Agency
Source: Financial and Capital Markets Commission, Central Statistical Bureau of Latvia Source: European Commission Ageing Report, May 2018
Source: European Commission Ageing Report, May 2018
23
1.21.5
1.72.0
2.3
2.8
3.33.5
6.2%6.7%
7.4%
8.5%9.6%
11.0%
12.2% 12.0%
0.0
0.5
1.0
1.5
2.0
2.5
3.0
3.5
4.0
2011 2012 2013 2014 2015 2016 2017 2018 2Q
2nd tier pension net assets (EUR billion) 2nd tier pension net assets (% of GDP)

6. New Reform Push
Targets Productivity and More Inclusive Growth24
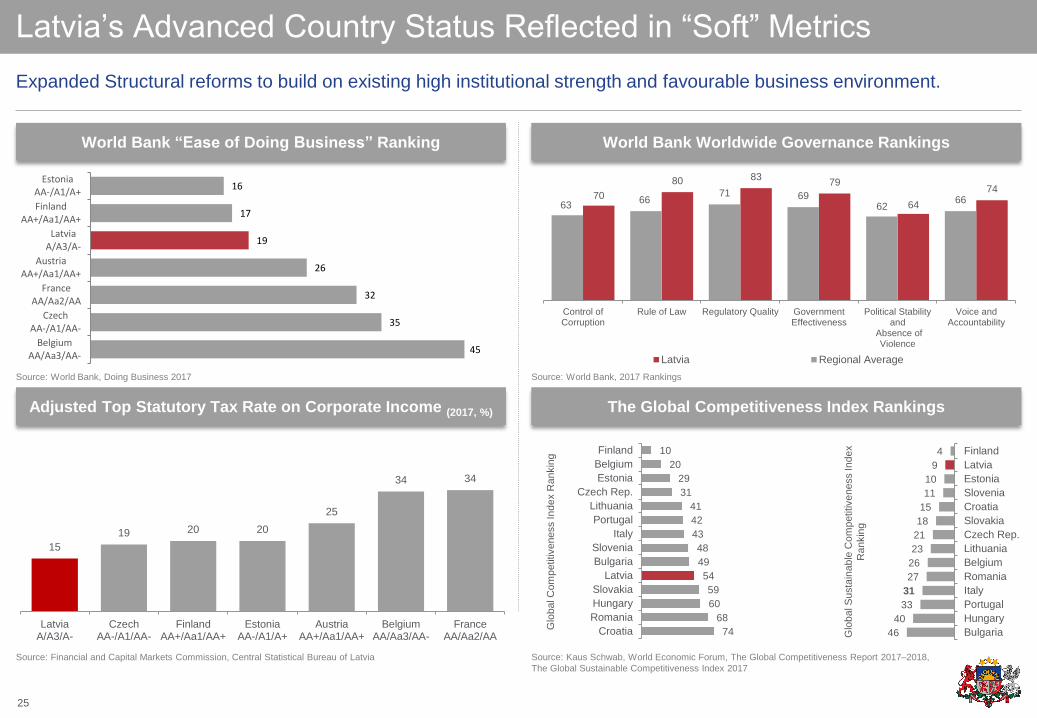
Latvia’s Advanced Country Status Reflected in “Soft” Metrics
Adjusted Top Statutory Tax Rate on Corporate Income (2017, %) The Global Competitiveness Index Rankings
World Bank “Ease of Doing Business” Ranking World Bank Worldwide Governance Rankings
Expanded Structural reforms to build on existing high institutional strength and favourable business environment.
74
64
798380
70 6662
697166
63
Voice andAccountability
Political Stabilityand
Absence ofViolence
GovernmentEffectiveness
Regulatory QualityRule of LawControl ofCorruption
Latvia Regional Average
15
19 20 20
25
34 34
LatviaA/A3/A-
CzechAA-/A1/AA-
FinlandAA+/Aa1/AA+
EstoniaAA-/A1/A+
AustriaAA+/Aa1/AA+
BelgiumAA/Aa3/AA-
FranceAA/Aa2/AA
16
17
19
26
32
35
45
EstoniaAA-/A1/A+
FinlandAA+/Aa1/AA+
LatviaA/A3/A-
AustriaAA+/Aa1/AA+
FranceAA/Aa2/AA
CzechAA-/A1/AA-
BelgiumAA/Aa3/AA-
10
20
29
31
41
42
43
48
49
54
59
60
68
74
Finland
Belgium
Estonia
Czech Rep.
Lithuania
Portugal
Italy
Slovenia
Bulgaria
Latvia
Slovakia
Hungary
Romania
Croatia
4
9
10
11
15
18
21
23
26
27
31
33
40
46
Finland
Latvia
Estonia
Slovenia
Croatia
Slovakia
Czech Rep.
Lithuania
Belgium
Romania
Italy
Portugal
Hungary
Bulgaria
Glo
ba
l C
om
petitive
ness In
de
x R
an
kin
g
Source: World Bank, Doing Business 2017
Source: Financial and Capital Markets Commission, Central Statistical Bureau of Latvia Source: Kaus Schwab, World Economic Forum, The Global Competitiveness Report 2017–2018,
The Global Sustainable Competitiveness Index 2017
Source: World Bank, 2017 Rankings
Glo
ba
l S
usta
ina
ble
Co
mp
etitive
ne
ss In
de
x
Ra
nkin
g
25
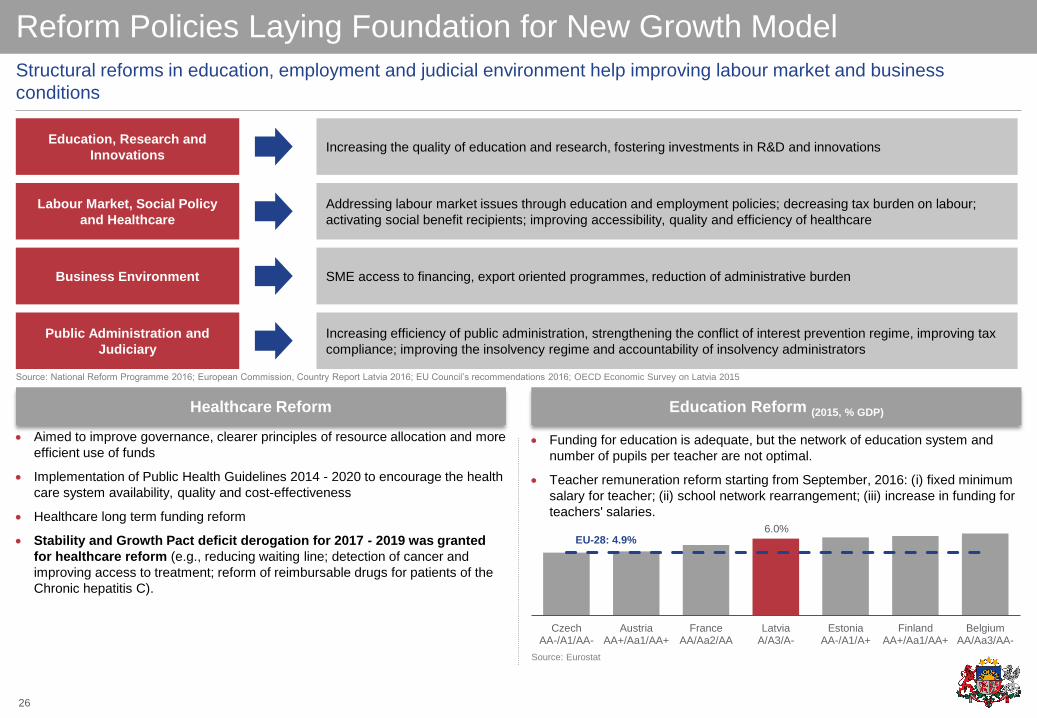
Reform Policies Laying Foundation for New Growth Model
Healthcare Reform Education Reform (2015, % GDP)
Structural reforms in education, employment and judicial environment help improving labour market and business
conditions
Education, Research and
Innovations Increasing the quality of education and research, fostering investments in R&D and innovations
Addressing labour market issues through education and employment policies; decreasing tax burden on labour;
activating social benefit recipients; improving accessibility, quality and efficiency of healthcare
Public Administration and
Judiciary
Increasing efficiency of public administration, strengthening the conflict of interest prevention regime, improving tax
compliance; improving the insolvency regime and accountability of insolvency administrators
Labour Market, Social Policy
and Healthcare
Business Environment SME access to financing, export oriented programmes, reduction of administrative burden
Aimed to improve governance, clearer principles of resource allocation and more
efficient use of funds
Implementation of Public Health Guidelines 2014 - 2020 to encourage the health
care system availability, quality and cost-effectiveness
Healthcare long term funding reform
Stability and Growth Pact deficit derogation for 2017 - 2019 was granted
for healthcare reform (e.g., reducing waiting line; detection of cancer and
improving access to treatment; reform of reimbursable drugs for patients of the
Chronic hepatitis C).
CzechAA-/A1/AA-
AustriaAA+/Aa1/AA+
FranceAA/Aa2/AA
LatviaA/A3/A-
EstoniaAA-/A1/A+
FinlandAA+/Aa1/AA+
BelgiumAA/Aa3/AA-
Funding for education is adequate, but the network of education system and
number of pupils per teacher are not optimal.
Teacher remuneration reform starting from September, 2016: (i) fixed minimum
salary for teacher; (ii) school network rearrangement; (iii) increase in funding for
teachers' salaries.
6.0%
Source: National Reform Programme 2016; European Commission, Country Report Latvia 2016; EU Council’s recommendations 2016; OECD Economic Survey on Latvia 2015
Source: Eurostat
EU-28: 4.9%
26
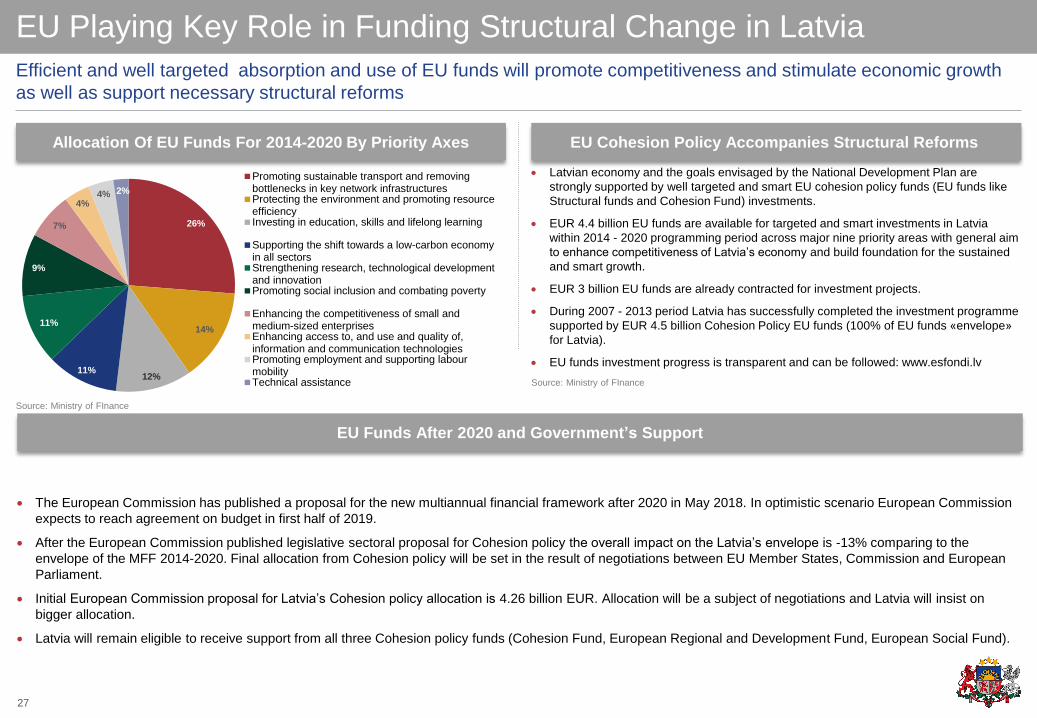
EU Playing Key Role in Funding Structural Change in Latvia
EU Funds After 2020 and Government’s Support
Allocation Of EU Funds For 2014-2020 By Priority Axes EU Cohesion Policy Accompanies Structural Reforms
Efficient and well targeted absorption and use of EU funds will promote competitiveness and stimulate economic growth
as well as support necessary structural reforms
26%
14%
12%11%
11%
9%
7%
4%4% 2%
Promoting sustainable transport and removingbottlenecks in key network infrastructuresProtecting the environment and promoting resourceefficiencyInvesting in education, skills and lifelong learning
Supporting the shift towards a low-carbon economyin all sectorsStrengthening research, technological developmentand innovationPromoting social inclusion and combating poverty
Enhancing the competitiveness of small andmedium-sized enterprisesEnhancing access to, and use and quality of,information and communication technologiesPromoting employment and supporting labourmobilityTechnical assistance
Latvian economy and the goals envisaged by the National Development Plan are
strongly supported by well targeted and smart EU cohesion policy funds (EU funds like
Structural funds and Cohesion Fund) investments.
EUR 4.4 billion EU funds are available for targeted and smart investments in Latvia
within 2014 - 2020 programming period across major nine priority areas with general aim
to enhance competitiveness of Latvia’s economy and build foundation for the sustained
and smart growth.
EUR 3 billion EU funds are already contracted for investment projects.
During 2007 - 2013 period Latvia has successfully completed the investment programme
supported by EUR 4.5 billion Cohesion Policy EU funds (100% of EU funds «envelope»
for Latvia).
EU funds investment progress is transparent and can be followed: www.esfondi.lv
The European Commission has published a proposal for the new multiannual financial framework after 2020 in May 2018. In optimistic scenario European Commission
expects to reach agreement on budget in first half of 2019.
After the European Commission published legislative sectoral proposal for Cohesion policy the overall impact on the Latvia’s envelope is -13% comparing to the
envelope of the MFF 2014-2020. Final allocation from Cohesion policy will be set in the result of negotiations between EU Member States, Commission and European
Parliament.
Initial European Commission proposal for Latvia’s Cohesion policy allocation is 4.26 billion EUR. Allocation will be a subject of negotiations and Latvia will insist on
bigger allocation.
Latvia will remain eligible to receive support from all three Cohesion policy funds (Cohesion Fund, European Regional and Development Fund, European Social Fund).
Source: Ministry of FInance
Source: Ministry of FInance
27
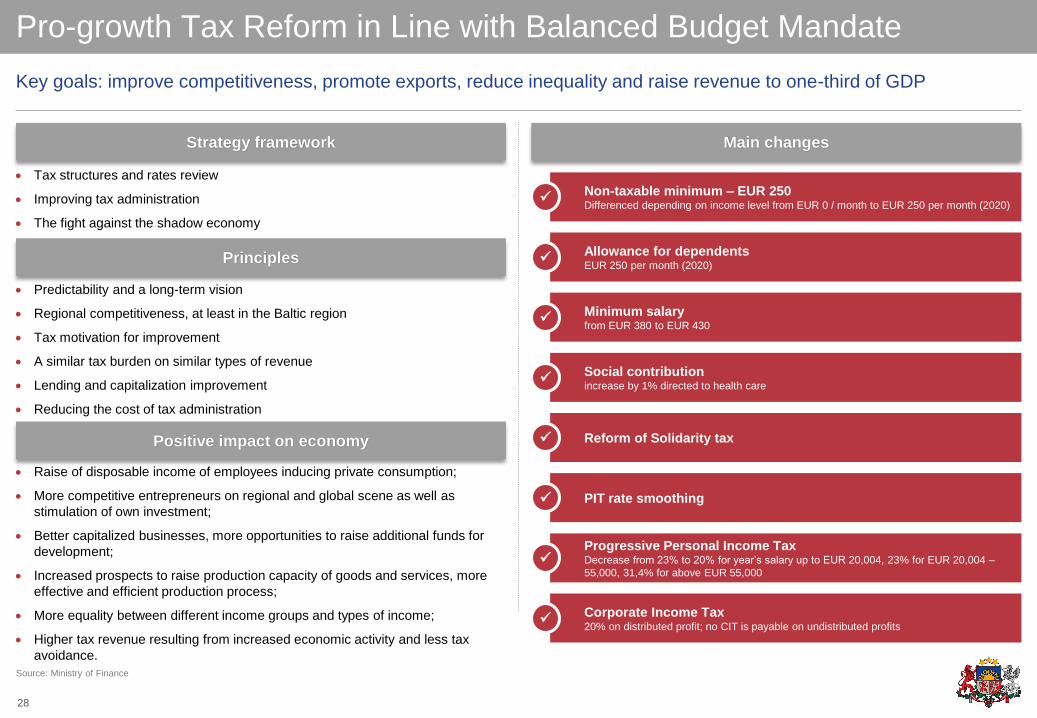
Pro-growth Tax Reform in Line with Balanced Budget Mandate
Positive impact on economy
Strategy framework Main changes
Key goals: improve competitiveness, promote exports, reduce inequality and raise revenue to one-third of GDP
Principles
Tax structures and rates review
Improving tax administration
The fight against the shadow economy
Raise of disposable income of employees inducing private consumption;
More competitive entrepreneurs on regional and global scene as well as
stimulation of own investment;
Better capitalized businesses, more opportunities to raise additional funds for
development;
Increased prospects to raise production capacity of goods and services, more
effective and efficient production process;
More equality between different income groups and types of income;
Higher tax revenue resulting from increased economic activity and less tax
avoidance.
Predictability and a long-term vision
Regional competitiveness, at least in the Baltic region
Tax motivation for improvement
A similar tax burden on similar types of revenue
Lending and capitalization improvement
Reducing the cost of tax administration
Non-taxable minimum – EUR 250Differenced depending on income level from EUR 0 / month to EUR 250 per month (2020)
Progressive Personal Income TaxDecrease from 23% to 20% for year’s salary up to EUR 20,004, 23% for EUR 20,004 –
55,000, 31,4% for above EUR 55,000
Allowance for dependentsEUR 250 per month (2020)
Minimum salaryfrom EUR 380 to EUR 430
Social contributionincrease by 1% directed to health care
Reform of Solidarity tax
PIT rate smoothing
Corporate Income Tax20% on distributed profit; no CIT is payable on undistributed profits
Source: Ministry of Finance
28

7. Government Debt and Funding Strategy
29
9 %
35 %
61 %
78 %
99 %
40 %
0
20
40
60
80
100
120
EstoniaAA-/A1/A+
CzechAA-/A1/AA-
LatviaA/A3/A-
FinlandAA+/Aa1/AA+
AustriaAA+/Aa1/AA+
FranceAA/Aa2/AA
BelgiumAA/Aa3/AA-
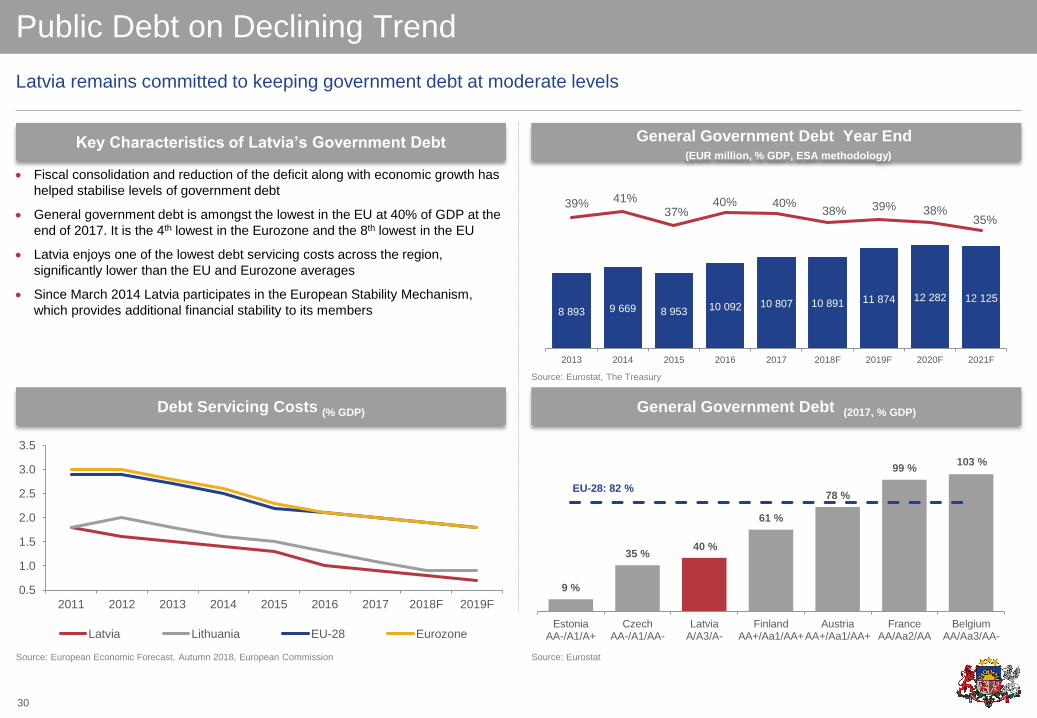
Public Debt on Declining Trend
Debt Servicing Costs (% GDP) General Government Debt (2017, % GDP)
Key Characteristics of Latvia’s Government Debt General Government Debt Year End (EUR million, % GDP, ESA methodology)
Latvia remains committed to keeping government debt at moderate levels
Fiscal consolidation and reduction of the deficit along with economic growth has
helped stabilise levels of government debt
General government debt is amongst the lowest in the EU at 40% of GDP at the
end of 2017. It is the 4th lowest in the Eurozone and the 8th lowest in the EU
Latvia enjoys one of the lowest debt servicing costs across the region,
significantly lower than the EU and Eurozone averages
Since March 2014 Latvia participates in the European Stability Mechanism,
which provides additional financial stability to its members
EU-28: 82 %
0.5
1.0
1.5
2.0
2.5
3.0
3.5
2011 2012 2013 2014 2015 2016 2017 2018F 2019F
Latvia Lithuania EU-28 Eurozone
Source: European Economic Forecast, Autumn 2018, European Commission Source: Eurostat
Source: Eurostat, The Treasury
8 893 9 669 8 953 10 092 10 807 10 891 11 874 12 282 12 125
39% 41%37%
40% 40%38% 39% 38%
35%
0
2000
4000
6000
8000
10000
12000
14000
16000
18000
20000
0%
5%
10%
15%
20%
25%
30%
35%
40%
45%
50%
2013 2014 2015 2016 2017 2018F 2019F 2020F 2021F
30
103 %
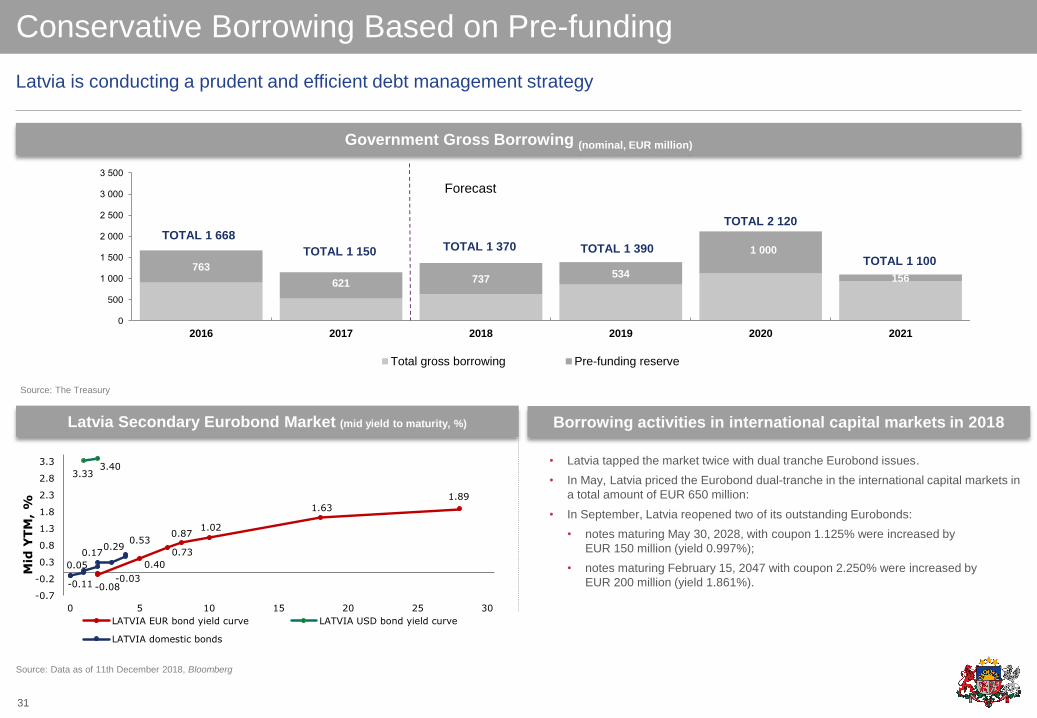
Conservative Borrowing Based on Pre-funding
Government Gross Borrowing (nominal, EUR million)
Latvia is conducting a prudent and efficient debt management strategy
Latvia Secondary Eurobond Market (mid yield to maturity, %)
31
Source: Data as of 11th December 2018, Bloomberg
• Latvia tapped the market twice with dual tranche Eurobond issues.
• In May, Latvia priced the Eurobond dual-tranche in the international capital markets in
a total amount of EUR 650 million:
• In September, Latvia reopened two of its outstanding Eurobonds:
• notes maturing May 30, 2028, with coupon 1.125% were increased by
EUR 150 million (yield 0.997%);
• notes maturing February 15, 2047 with coupon 2.250% were increased by
EUR 200 million (yield 1.861%).
Source: The Treasury
Borrowing activities in international capital markets in 2018
TOTAL 1 668
TOTAL 1 150 TOTAL 1 370 TOTAL 1 390
TOTAL 2 120
763
621 737534
1 000
156
0
500
1 000
1 500
2 000
2 500
3 000
3 500
2016 2017 2018 2019 2020 2021
Total gross borrowing Pre-funding reserve
Forecast
TOTAL 1 100
-0.03-0.08
0.40
0.73
0.871.02
1.63
1.89
3.333.40
-0.11
0.05
0.170.29
0.53
-0.7
-0.2
0.3
0.8
1.3
1.8
2.3
2.8
3.3
0 5 10 15 20 25 30
Mid
YTM
, %
LATVIA EUR bond yield curve LATVIA USD bond yield curve
LATVIA domestic bonds
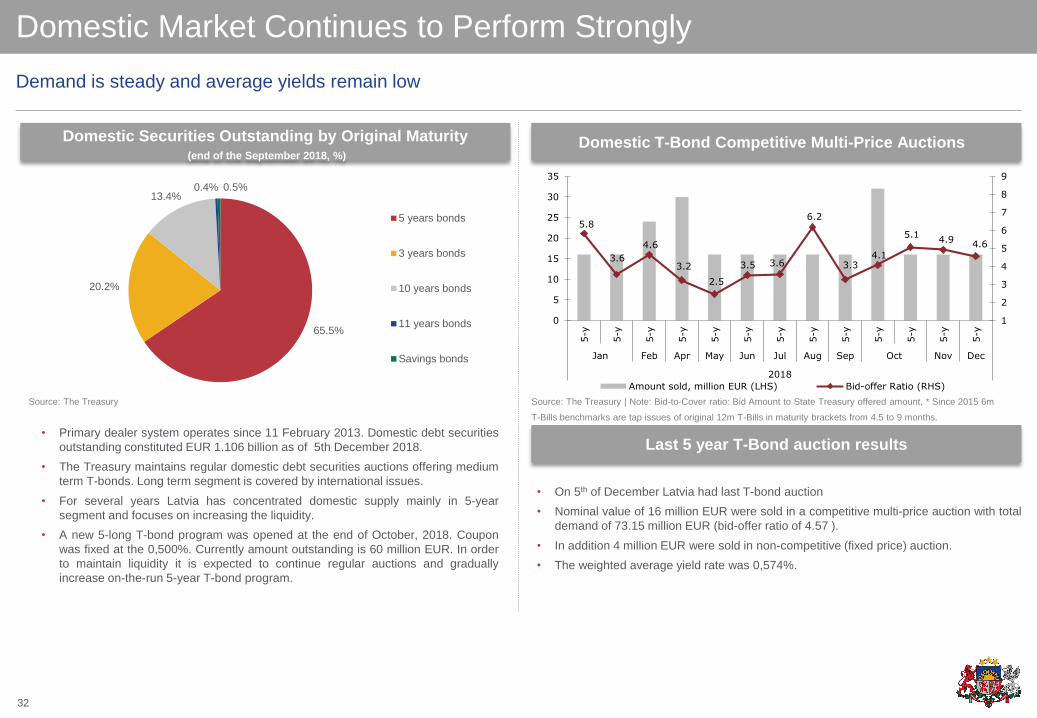
Domestic Market Continues to Perform Strongly
Domestic Securities Outstanding by Original Maturity(end of the September 2018, %)
Last 5 year T-Bond auction results
Domestic T-Bond Competitive Multi-Price Auctions
Demand is steady and average yields remain low
65.5%
20.2%
13.4%0.4% 0.5%
5 years bonds
3 years bonds
10 years bonds
11 years bonds
Savings bonds
Source: The Treasury Source: The Treasury | Note: Bid-to-Cover ratio: Bid Amount to State Treasury offered amount, * Since 2015 6m
T-Bills benchmarks are tap issues of original 12m T-Bills in maturity brackets from 4.5 to 9 months.
32
• Primary dealer system operates since 11 February 2013. Domestic debt securities
outstanding constituted EUR 1.106 billion as of 5th December 2018.
• The Treasury maintains regular domestic debt securities auctions offering medium
term T-bonds. Long term segment is covered by international issues.
• For several years Latvia has concentrated domestic supply mainly in 5-year
segment and focuses on increasing the liquidity.
• A new 5-long T-bond program was opened at the end of October, 2018. Coupon
was fixed at the 0,500%. Currently amount outstanding is 60 million EUR. In order
to maintain liquidity it is expected to continue regular auctions and gradually
increase on-the-run 5-year T-bond program.
• On 5th of December Latvia had last T-bond auction
• Nominal value of 16 million EUR were sold in a competitive multi-price auction with total
demand of 73.15 million EUR (bid-offer ratio of 4.57 ).
• In addition 4 million EUR were sold in non-competitive (fixed price) auction.
• The weighted average yield rate was 0,574%.
5.8
3.6
4.6
3.2
2.5
3.5 3.6
6.2
3.34.1
5.14.9
4.6
1
2
3
4
5
6
7
8
9
0
5
10
15
20
25
30
35
5-y
5-y
5-y
5-y
5-y
5-y
5-y
5-y
5-y
5-y
5-y
5-y
5-y
Jan Feb Apr May Jun Jul Aug Sep Oct Nov Dec
2018
Amount sold, million EUR (LHS) Bid-offer Ratio (RHS)
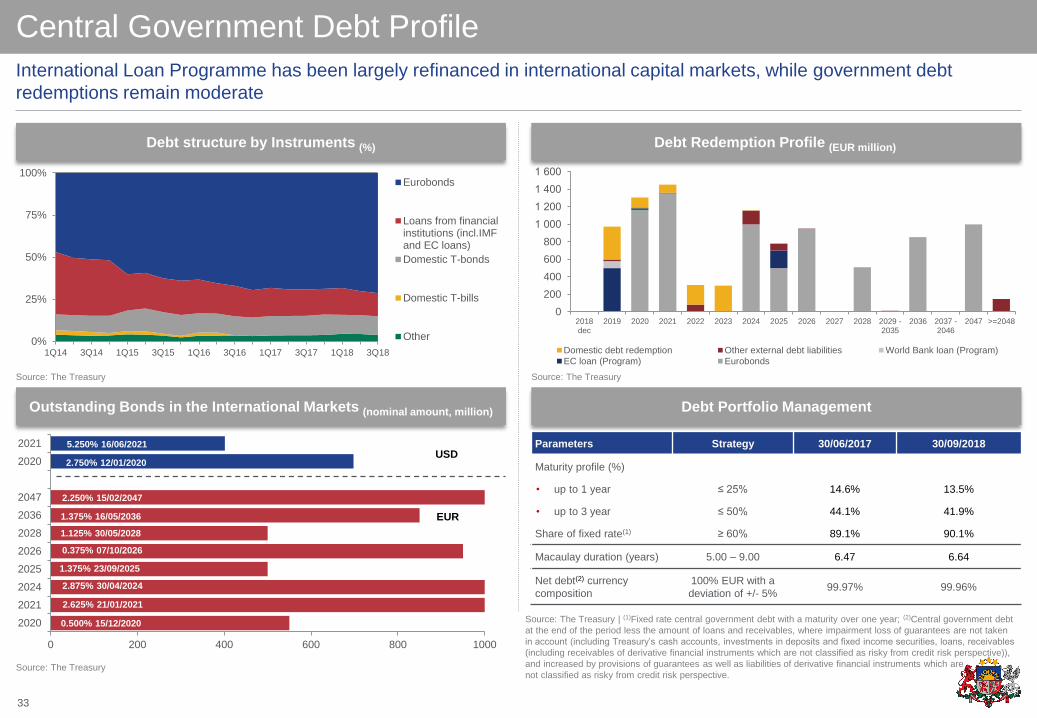
Central Government Debt Profile
Outstanding Bonds in the International Markets (nominal amount, million) Debt Portfolio Management
Debt structure by Instruments (%) Debt Redemption Profile (EUR million)
International Loan Programme has been largely refinanced in international capital markets, while government debt
redemptions remain moderate
0%
25%
50%
75%
100%
1Q14 3Q14 1Q15 3Q15 1Q16 3Q16 1Q17 3Q17 1Q18 3Q18
Eurobonds
Loans from financialinstitutions (incl.IMFand EC loans)
Domestic T-bonds
Domestic T-bills
Other
Source: The Treasury Source: The Treasury
Source: The Treasury
33
0 200 400 600 800 1000
2020
2021
2024
2025
2026
2028
2036
2047
2020
2021
1.375% 16/05/2036
0.375% 07/10/2026
1.375% 23/09/2025
2.875% 30/04/2024
2.625% 21/01/2021
0.500% 15/12/2020
2.250% 15/02/2047
2.750% 12/01/2020
5.250% 16/06/2021USD
EUR
1.125% 30/05/2028
Parameters Strategy 30/06/2017 30/09/2018
Maturity profile (%)
• up to 1 year ≤ 25% 14.6% 13.5%
• up to 3 year ≤ 50% 44.1% 41.9%
Share of fixed rate(1) ≥ 60% 89.1% 90.1%
Macaulay duration (years) 5.00 – 9.00 6.47 6.64
Net debt(2) currency
composition
100% EUR with a
deviation of +/- 5%99.97% 99.96%
Source: The Treasury | (1)Fixed rate central government debt with a maturity over one year; (2)Central government debt
at the end of the period less the amount of loans and receivables, where impairment loss of guarantees are not taken
in account (including Treasury’s cash accounts, investments in deposits and fixed income securities, loans, receivables
(including receivables of derivative financial instruments which are not classified as risky from credit risk perspective)),
and increased by provisions of guarantees as well as liabilities of derivative financial instruments which are
not classified as risky from credit risk perspective.
0
200
400
600
800
1 000
1 200
1 400
1 600
2018dec
2019 2020 2021 2022 2023 2024 2025 2026 2027 2028 2029 -2035
2036 2037 -2046
2047 >=2048
Domestic debt redemption Other external debt liabilities World Bank loan (Program)
EC loan (Program) Eurobonds
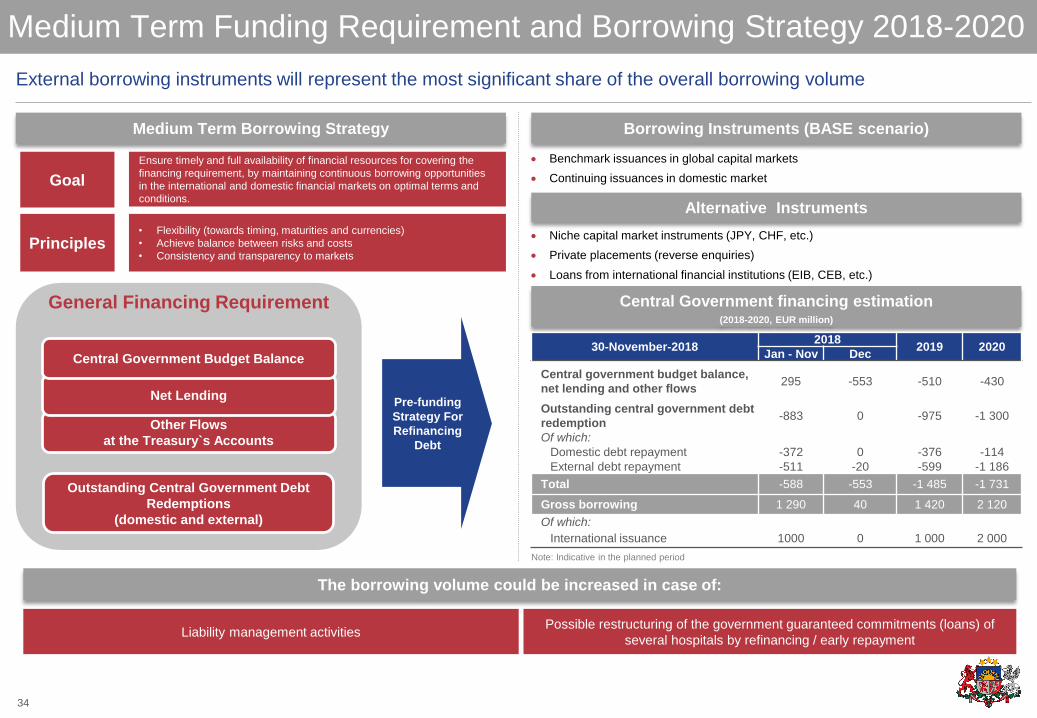
Medium Term Funding Requirement and Borrowing Strategy 2018-2020
Central Government financing estimation (2018-2020, EUR million)
Medium Term Borrowing Strategy Borrowing Instruments (BASE scenario)
External borrowing instruments will represent the most significant share of the overall borrowing volume
Benchmark issuances in global capital markets
Continuing issuances in domestic market
Pre-funding
Strategy For
Refinancing
Debt
Other Flows
at the Treasury`s Accounts
Net Lending
Outstanding Central Government Debt
Redemptions
(domestic and external)
Central Government Budget Balance
General Financing Requirement
Goal
Principles
Ensure timely and full availability of financial resources for covering the
financing requirement, by maintaining continuous borrowing opportunities
in the international and domestic financial markets on optimal terms and
conditions.
• Flexibility (towards timing, maturities and currencies)
• Achieve balance between risks and costs
• Consistency and transparency to markets
30-November-20182018
2019 2020Jan - Nov Dec
Central government budget balance,
net lending and other flows295 -553 -510 -430
Outstanding central government debt
redemption-883 0 -975 -1 300
Of which:
Domestic debt repayment -372 0 -376 -114
External debt repayment -511 -20 -599 -1 186
Total -588 -553 -1 485 -1 731
Gross borrowing 1 290 40 1 420 2 120
Of which:
International issuance 1000 0 1 000 2 000
Note: Indicative in the planned period
34
Niche capital market instruments (JPY, CHF, etc.)
Private placements (reverse enquiries)
Loans from international financial institutions (EIB, CEB, etc.)
Alternative Instruments
The borrowing volume could be increased in case of:
Liability management activitiesPossible restructuring of the government guaranteed commitments (loans) of
several hospitals by refinancing / early repayment

8. Conclusion
Building on Past Success, Facing Future Challenges 35
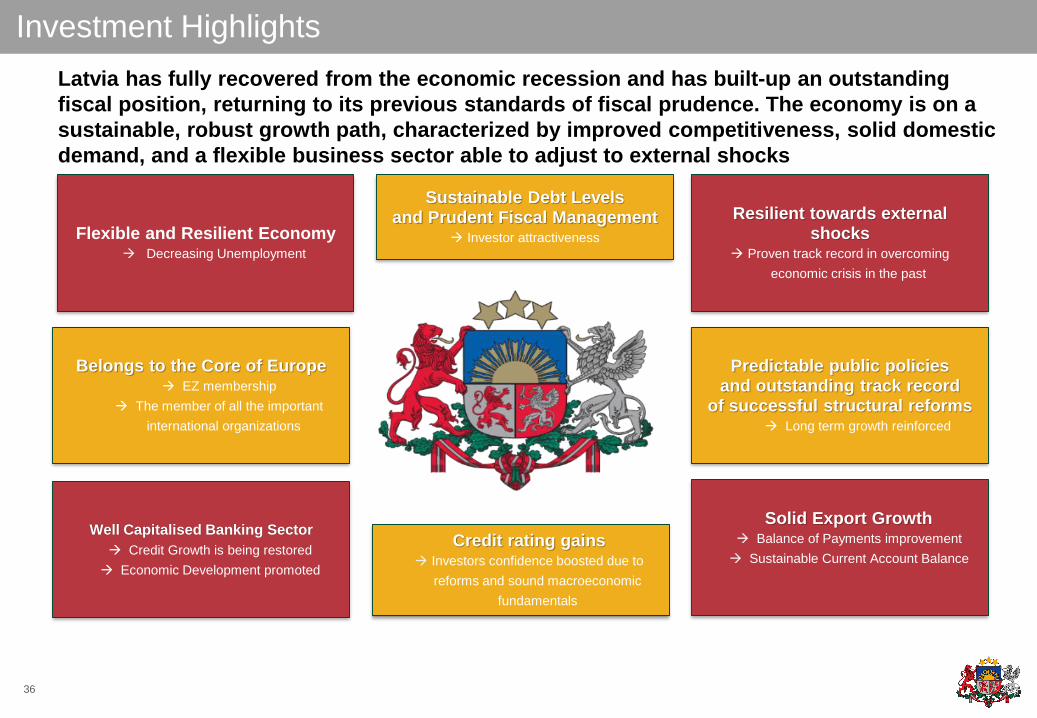
Investment Highlights
Flexible and Resilient Economy Decreasing Unemployment
Belongs to the Core of Europe EZ membership
The member of all the important
international organizations
Well Capitalised Banking Sector
Credit Growth is being restored
Economic Development promoted
Sustainable Debt Levelsand Prudent Fiscal Management
Investor attractiveness
Resilient towards external shocks
Proven track record in overcoming
economic crisis in the past
Predictable public policies and outstanding track record
of successful structural reforms Long term growth reinforced
Solid Export Growth Balance of Payments improvement
Sustainable Current Account Balance
Credit rating gains Investors confidence boosted due to
reforms and sound macroeconomic
fundamentals
Latvia has fully recovered from the economic recession and has built-up an outstanding
fiscal position, returning to its previous standards of fiscal prudence. The economy is on a
sustainable, robust growth path, characterized by improved competitiveness, solid domestic
demand, and a flexible business sector able to adjust to external shocks
36