Embed Size (px)
Citation preview
FOOD AND AGRICULTURE ORGANIZATION OF THE UNITED NATIONS
NUTRITION COUNTRY PROFILE REPUBLIC OF MALAWI

Malawi Nutrition Profile – Nutrition and Consumer Protection Division, FAO, 2008 2
Acknowledgements
This profile was prepared by Dr Beatrice Mtimuni, Associate Professor in Human Nutrition and Head of Home Economics and Human Nutrition Department at Bunda College, University of Malawi, in collaboration with Estelle Bader and Giulia Palma, Consultants, and Marie Claude Dop, Nutrition Officer, Nutrient requirements and assessment group, Nutrition and Consumer Protection Division, Food and Agriculture Organization of the United Nations. The assistance of Ms Tamara Lampe is gratefully acknowledged. As we are sending the profile for publication, the report of the 2006 Multiple Indicator Cluster Survey (NSO and UNICEF, 2008) has just been released. This new survey shows a nutrition situation that differs very little from that described in this profile using the results of the 2004-2005 Malawi Demographic and Health Survey (NSO and ORC Macro., 2005). Some progress has been registered with young children complementary feeding and vitamin A supplementation, but prevalence of underweight, wasting and stunting in underfives remains unchanged. For more information, please write to: [email protected]

Malawi Nutrition Profile – Nutrition and Consumer Protection Division, FAO, 2008 3
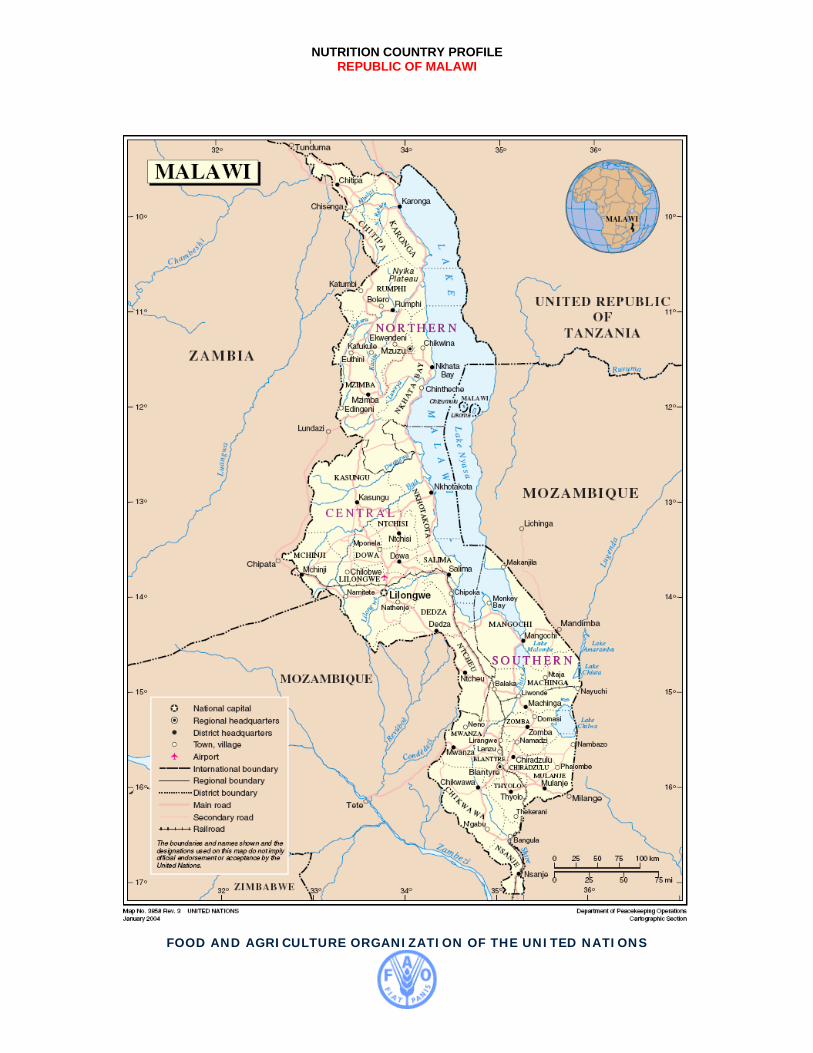
Summary The Republic of Malawi is a landlocked country situated in South-eastern Africa. The country has very large fresh-water resources and a high agricultural potential. The population, very young and predominantly rural, is growing rapidly. The Malawian economy is largely based on agriculture. Most of the population is engaged in the agricultural sector, which accounts for more than one third of GDP. Smallholder rain-fed maize production is largely predominant and the livestock sub-sector remains underdeveloped. Economic growth, highly dependent on the agricultural sector, is constrained by a high vulnerability to climatic shocks which affect the country frequently. Poverty is widespread in the rural population. Moreover, the incidence of poverty is not declining. Nevertheless, during the last two years the country has experienced bumper crops for maize due to favourable climatic conditions and an input subsidy scheme that has reached a very large number of small farmers. The HIV/AIDS epidemic, infectious diseases, malnutrition and limited access to basic health care are among the major factors contributing to high infant and underfive mortality rates. The maternal mortality ratio remains unacceptably high. In a context of high morbidity and the HIV/AIDS epidemic, access to health services is still limited and the lack of material and human resources further constrains the quality of services. The Malawian diet is mainly composed of cereals, primarily maize, starchy roots (cassava and potatoes) and starchy fruit (plantain). Fruit and vegetables complement the diet. Many factors, including adverse climatic conditions, low agricultural productivity and poverty, contribute to widespread food insecurity among the population, leading to severe food crises when natural or man-made shocks occur. Twice in the 1990s and in 2001-2002, Malawi was affected by drought-induced famine. In 2005, the country faced another serious food crisis during which about a third of the population was in need of food assistance. Overall, dietary energy supply is barely sufficient to meet population energy requirements and more than a third of the population is undernourished (latest estimates 2001-2003). Moreover, the diet lacks diversity and is poor in micronutrient-rich foods. Although breastfeeding is universal and prolonged, some infant and young child feeding practices remain unsatisfactory. Exclusive breastfeeding up to six months of age is not widespread and complementary foods are insufficiently diversified. These inappropriate feeding practices, along with high morbidity, low access to health care, poverty and food insecurity explain the very high prevalence of chronic malnutrition that plagues Malawi, almost half of the children under-five years being stunted. Since the early 1990s, the nutritional status of young Malawian children has not improved. Undernutrition also affects women. Micronutrient deficiencies are widespread. During the 1990s iodine deficiency disorders were identified as a public health problem (Northern and Central regions). More recent data are urgently needed. Universal salt iodization is implemented in the country, but coverage is insufficient and needs to be re-evaluated. A national survey conducted in 2001 showed subclinical signs of vitamin A deficiency to be highly prevalent among young children. Routine supplementation with vitamin A is implemented but programmes for ensuring a more adequate intake of vitamin A rich foods for vulnerable groups, i.e. women and young children, are lacking. Anemia affects almost three-quarters of children under five years and more than two women out of five. A high proportion of pregnant women receive iron supplementation but few take supplements consistently during pregnancy. Food-based strategies are lacking to improve the micronutrient status of the population in a sustainable way. The current favourable agricultural context is a unique opportunity for introducing agricultural diversification for improving the nutritional quality of diets. The nutritional status of the Malawian population remains critical. Although short-term interventions such as supplementation and fortification still need to be reinforced, investment in long-term food based strategies is urgently needed.
Malawi Nutrition Profile – Nutrition and Consumer Protection Division, FAO, 2008 4
Summary Table Basic Indicators Year
Population Total population 12.884 million 2005 Rural population 83 % 2000/05 Population under 15 years of age 47 % 2000/05 Annual population growth rate 2.3 % 2000/05 Life expectancy at birth 45 years 2000/05 Agriculture Agricultural area 47 % 2003 Arable and permanent cropland per agricultural inhabitant 0.3 Ha 2000 Level of development Human development and poverty Human development index 0.400 [0-1] 2004 Proportion of population living with less than 1$ a day (PPP) MDG1 42 % 1990/2003 Proportion of population living below the national poverty line MDG1 52 % 2004/05 Education Net primary enrolment ratio MDG2 80 % 2004/05 Youth literacy rate (15-24 years) MDG2 76 % 2000/04 Ratio of girls to boys in primary education MDG3 0.96 girl per 1 boy 2002/03 Health Infant mortality rate MDG4 76 ‰ 2000/04 Under-five mortality rate MDG4 133 ‰ 2000/04 Maternal mortality ratio (adjusted) MDG5 1800 per 100 000 live births 2000 Malaria-related mortality rate in under-fives MDG6 1288 per 100 000 deaths in
under-fives 2000
Proportion of 1-year-old children immunized against measles MDG4 80 % 2004 Environment Sustainable access to an improved water source in rural area MDG7 68 % of population 2004
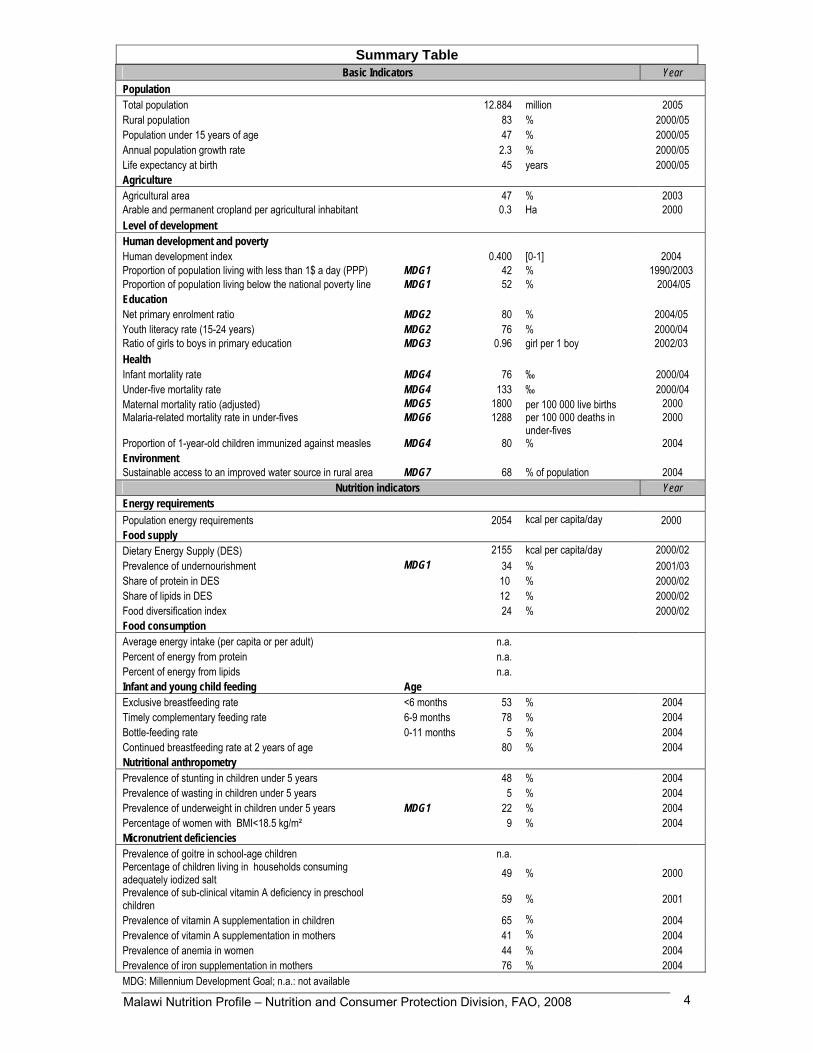
Nutrition indicators Year Energy requirements Population energy requirements 2054 kcal per capita/day 2000 Food supply Dietary Energy Supply (DES) 2155 kcal per capita/day 2000/02 Prevalence of undernourishment MDG1 34 % 2001/03 Share of protein in DES 10 % 2000/02 Share of lipids in DES 12 % 2000/02 Food diversification index 24 % 2000/02 Food consumption Average energy intake (per capita or per adult) n.a. Percent of energy from protein n.a. Percent of energy from lipids n.a. Infant and young child feeding Age Exclusive breastfeeding rate <6 months 53 % 2004 Timely complementary feeding rate 6-9 months 78 % 2004 Bottle-feeding rate 0-11 months 5 % 2004 Continued breastfeeding rate at 2 years of age 80 % 2004 Nutritional anthropometry Prevalence of stunting in children under 5 years 48 % 2004 Prevalence of wasting in children under 5 years 5 % 2004 Prevalence of underweight in children under 5 years MDG1 22 % 2004 Percentage of women with BMI<18.5 kg/m² 9 % 2004 Micronutrient deficiencies Prevalence of goitre in school-age children n.a. Percentage of children living in households consuming adequately iodized salt 49 % 2000 Prevalence of sub-clinical vitamin A deficiency in preschool children 59 % 2001
Prevalence of vitamin A supplementation in children 65 % 2004 Prevalence of vitamin A supplementation in mothers 41 % 2004 Prevalence of anemia in women 44 % 2004 Prevalence of iron supplementation in mothers 76 % 2004 MDG: Millennium Development Goal; n.a.: not available
Malawi Nutrition Profile – Nutrition and Consumer Protection Division, FAO, 2008 5
TABLE OF CONTENTS
Acknowledgements ............................................................................................................................. 2 Summary .............................................................................................................................................. 3 Summary Table .................................................................................................................................... 4 List of tables and figures .................................................................................................................... 6 Acronyms ............................................................................................................................................. 7 Part I: Overview and basic indicators ................................................................................................ 9
I.1 Context ........................................................................................................................................ 9 I.2 Population................................................................................................................................... 9
Population indicators ..................................................................................................................... 9 Population pyramid ..................................................................................................................... 10
I.3 Agriculture ................................................................................................................................ 11 Land use and irrigation statistics ................................................................................................. 12 Main crops, agricultural calendar, seasonal food shortage.......................................................... 12 Livestock production and fishery ................................................................................................. 12
I.4 Economy ................................................................................................................................... 13 I.5 Social indicators....................................................................................................................... 14
Health indicators ......................................................................................................................... 14 Water and sanitation ................................................................................................................... 15 Access to health services............................................................................................................ 16 Education .................................................................................................................................... 16 Level of development, poverty..................................................................................................... 17 Other social indicators................................................................................................................. 18
Part II: Food and nutrition situation ................................................................................................. 19 II.1 Qualitative aspects of the diet and food security ................................................................. 19
Food consumption patterns......................................................................................................... 19 Food security situation ................................................................................................................ 19 Surveys of dietary diversity and variety ....................................................................................... 21
II.2 National food supply data....................................................................................................... 21 Supply of major food groups ....................................................................................................... 21 Dietary energy supply, distribution by macronutrient and diversity of the food supply ................. 23 Vegetable/animal origin of macronutrients .................................................................................. 23 Dietary energy supply by food group........................................................................................... 24 Food imports and exports expressed as percentage of DES....................................................... 25 Food aid ...................................................................................................................................... 26
II.3 Food consumption .................................................................................................................. 26 II.4 Infant and young child feeding practices .............................................................................. 27 II.5 Nutritional anthropometry ...................................................................................................... 30
Low birth weight .......................................................................................................................... 30 Anthropometry of preschool children........................................................................................... 30 Anthropometry of school-age children......................................................................................... 36 Anthropometry of adolescents..................................................................................................... 36 Anthropometry of adult women.................................................................................................... 36 Anthropometry of adult men ........................................................................................................ 40
II.6 Micronutrient deficiencies ...................................................................................................... 40 Iodine deficiency disorders (IDD) ................................................................................................ 40
Prevalence of goitre and urinary iodine level........................................................................... 40 Iodization of salt at household level ........................................................................................ 41
Vitamin A deficiency (VAD) ......................................................................................................... 41 Prevalence of sub-clinical and clinical vitamin A deficiency..................................................... 41 Vitamin A supplementation ..................................................................................................... 43
Iron deficiency anemia (IDA) ....................................................................................................... 45 Prevalence of IDA ................................................................................................................... 45 Interventions to combat IDA.................................................................................................... 47
Other micronutrient deficiencies .................................................................................................. 48 II.7 Policies and programmes aiming to improve nutrition and food security.......................... 49
Reference list ..................................................................................................................................... 51

Malawi Nutrition Profile – Nutrition and Consumer Protection Division, FAO, 2008 6
List of tables and figures List of tables Table 1: Population indicators............................................................................................................. 10 Table 2: Land use and irrigation.......................................................................................................... 12 Table 3: Livestock and fishery statistics.............................................................................................. 13 Table 4: Basic economic indicators..................................................................................................... 13 Table 5: Health indicators ................................................................................................................... 15 Table 6: Access to safe water and sanitation...................................................................................... 16 Table 7: Access to health services...................................................................................................... 16 Table 8: Education.............................................................................................................................. 17 Table 9: Human development and poverty ......................................................................................... 18 Table 10: Other social indicators ........................................................................................................ 18 Table 11: Trends in per capita supply of major foods groups (in g/per day) ........................................ 21 Table 12: Share of the main food groups in the Dietary Energy Supply (DES), trends ....................... 24 Table 13: Initiation and duration of breastfeeding ............................................................................... 28 Table 14: Type of infant and young child feeding................................................................................ 29 Table 15: Consumption of complementary foods, and meal frequency by breastfeeding status and age
................................................................................................................................................... 30 Table 16: Anthropometry of preschool children................................................................................... 33 Table 16: Anthropometry of preschool children (cont.)........................................................................ 34 Table 16: Anthropometry of preschool children (cont.)........................................................................ 35 Table 17: Anthropometry of adult women ........................................................................................... 37 Table 17: Anthropometry of adult women (cont.) ................................................................................ 38 Table 17: Anthropometry of adult women (cont.) ................................................................................ 39 Table 18: Prevalence of goitre and level of urinary iodine in school-age children ............................... 41 Table 19: Prevalence of vitamin A deficiency in preschool children .................................................... 42 Table 20: Prevalence of vitamin A deficiency in mothers during their last pregnancy ......................... 43 Table 21: Vitamin A supplementation of children and mothers ........................................................... 44 Table 22: Prevalence of anemia in preschool children........................................................................ 45 Table 23: Prevalence of anemia in women of childbearing age .......................................................... 46 Table 24: Iron supplementation: percentage of mothers who took iron tablets/syrups during pregnancy
................................................................................................................................................... 48
List of figures � Figure 1: Dietary energy supply (DES), trends and distribution by macronutrient....................... 23 � Figure 2: Vegetable/animal origin of energy, protein and lipid supplies ...................................... 23 � Figure 3: Dietary energy supply by food group........................................................................... 24 � Figure 4: Major food exports as percentage of Dietary Energy Supply (DES), trends ................ 25 � Figure 5: Major food imports as percentage of Dietary Energy Supply (DES), trends ................ 26
Malawi Nutrition Profile – Nutrition and Consumer Protection Division, FAO, 2008 7
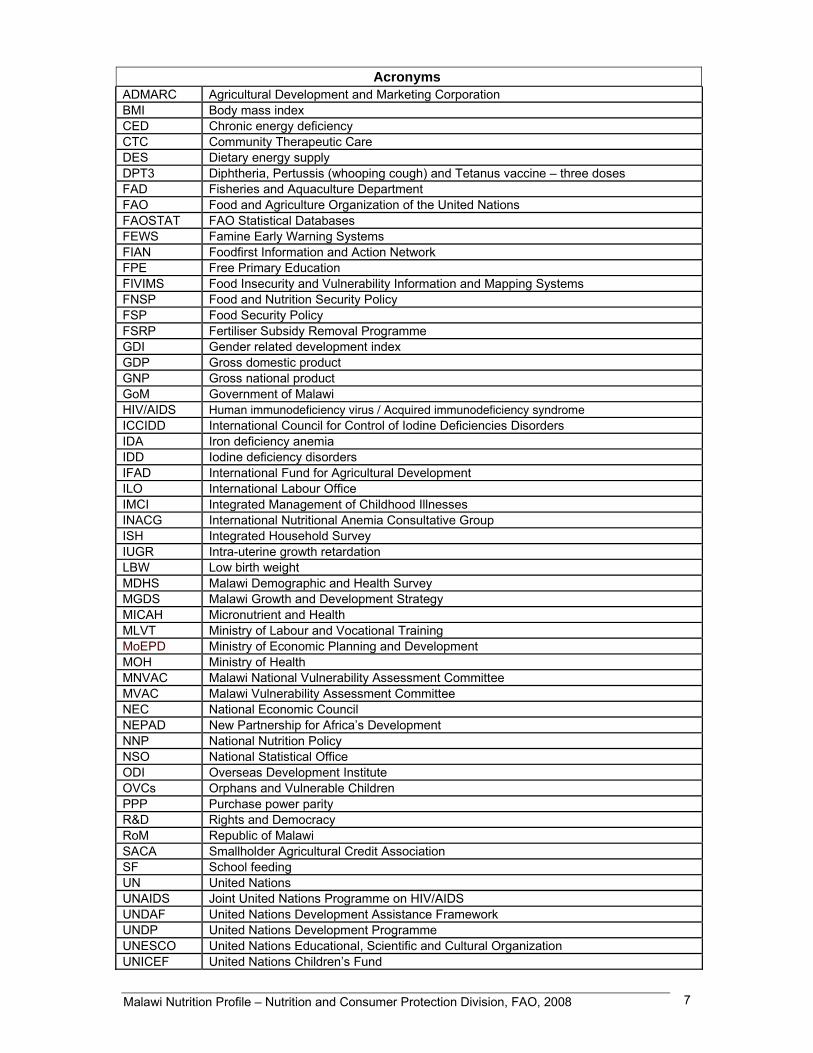
Acronyms ADMARC Agricultural Development and Marketing Corporation BMI Body mass index CED Chronic energy deficiency CTC Community Therapeutic Care DES Dietary energy supply DPT3 Diphtheria, Pertussis (whooping cough) and Tetanus vaccine – three doses FAD Fisheries and Aquaculture Department FAO Food and Agriculture Organization of the United Nations FAOSTAT FAO Statistical Databases FEWS Famine Early Warning Systems FIAN Foodfirst Information and Action Network FPE Free Primary Education FIVIMS Food Insecurity and Vulnerability Information and Mapping Systems FNSP Food and Nutrition Security Policy FSP Food Security Policy FSRP Fertiliser Subsidy Removal Programme GDI Gender related development index GDP Gross domestic product GNP Gross national product GoM Government of Malawi HIV/AIDS Human immunodeficiency virus / Acquired immunodeficiency syndrome ICCIDD International Council for Control of Iodine Deficiencies Disorders IDA Iron deficiency anemia IDD Iodine deficiency disorders IFAD International Fund for Agricultural Development ILO International Labour Office IMCI Integrated Management of Childhood Illnesses INACG International Nutritional Anemia Consultative Group ISH Integrated Household Survey IUGR Intra-uterine growth retardation LBW Low birth weight MDHS Malawi Demographic and Health Survey MGDS Malawi Growth and Development Strategy MICAH Micronutrient and Health MLVT Ministry of Labour and Vocational Training MoEPD Ministry of Economic Planning and Development MOH Ministry of Health MNVAC Malawi National Vulnerability Assessment Committee MVAC Malawi Vulnerability Assessment Committee NEC National Economic Council NEPAD New Partnership for Africa’s Development NNP National Nutrition Policy NSO National Statistical Office ODI Overseas Development Institute OVCs Orphans and Vulnerable Children PPP Purchase power parity R&D Rights and Democracy RoM Republic of Malawi SACA Smallholder Agricultural Credit Association SF School feeding UN United Nations UNAIDS Joint United Nations Programme on HIV/AIDS UNDAF United Nations Development Assistance Framework UNDP United Nations Development Programme UNESCO United Nations Educational, Scientific and Cultural Organization UNICEF United Nations Children’s Fund

Malawi Nutrition Profile – Nutrition and Consumer Protection Division, FAO, 2008 8
UNPD United Nations Population Division UNSTAT United Nations Statistics Division VAD Vitamin A deficiency WB World Bank WFP World Food Programme WHO World Health Organization

Malawi Nutrition Profile – Nutrition and Consumer Protection Division, FAO, 2008 9
Part I: Overview and basic indicators
I.1 Context The Republic of Malawi is a land-locked country situated in South-eastern Africa. It has borders with the United Republic of Tanzania to the North, Mozambique to the South-East, South and South-West and Zambia to the West. It is bounded by Lake Malawi in the East. Its total area amounts to 118 480 km2, of which Lake Malawi accounts for 24 280 km2 (FAO, Forestry Division). The dominant physical feature is the deep, trough-like depression forming part of the Great Rift Valley that traverses the country from North to South and is occupied by Lake Malawi, the lakeshore plains and the Shire River Valley. The latter drains the lake and joins the Zambezi River in its lower reaches. Elevations range from about 40 m to 3 000 m above sea level. The central part is mountainous with peaks up to 2 600 m. The Shire Valley in the extreme South is a low-lying flat 500 m above sea level, while Mount Mulanje in the South-East tops at 3 000 m (FAO, Forestry Division). The country has a continental climate with large seasonal temperature variations between the dry, cold season and the wet, warm season (FAO, Forestry Division). From May to August, the weather is cool and dry and it becomes hot from September to November. The rainy season begins in October or November and continues until April (NSO and ORC Macro, 2005). Although most of the dry season is relatively cold, its final stages are associated with strong, dry winds and high temperatures. On the other hand, the wet season provides ideal growing conditions. Mean annual precipitations vary between 500 mm and 1 125 mm (FAO, Forestry Division). Rainfall and temperature vary depending on altitude and proximity to the lake (NSO and ORC Macro, 2005). Temperatures on the Rift Valley can exceed 24°C and frosts are unknown. However, frosts are frequent in June and July on the high plateaus, where the mean annual temperature fluctuates below 18°C, but they are less severe and uncommon on the plains at lower altitudes where the average temperature lies between 18°C and 24°C (FAO, Forestry Division). The country is divided into three regions: the Northern region, which is comprised of six districts, the Central region of nine districts and the Southern region of 13 districts (NSO and ORC Macro, 2005). Administratively, the districts are subdivided into Traditional Authorities, presided by chiefs. The Traditional Authorities are composed of villages. These are the smallest administrative units, and they are presided by village headmen.
I.2 Population
Population indicators Malawi’s total population was estimated at 12.9 million in 2005, with about 83% of the population living in rural areas. Malawi has a very young and rapidly growing population. Nearly half of the population is under the age of 15 years and almost two-thirds under the age of 25 (UNPD). With a population density of 112 inhabitants per km2, Malawi is one of the most densely populated countries in Sub-Saharan Africa (UNPD; WHO, 2006a). The Northern region, the least developed part of the country, is sparsely populated; the Central region, which has some of the country’s most fertile and productive land, is home to more than 40% of the population. The Southern region is the most densely populated (IFAD, Rural Poverty Portal). Life expectancy at birth fell from 49 years in 1990-95 to 45 years in 2000-2005, a decline largely due to the HIV/AIDS epidemic (UNPD; WHO, 2006a). The total dependency rate is very high (101% in 2005), indicative of a heavy economic burden on the productive age groups (UNPD).

Malawi Nutrition Profile – Nutrition and Consumer Protection Division, FAO, 2008 10
According to the Second Integrated Household Survey (2004-2005), 17% of the household heads had at some point moved from one area to another (internal and international migration). Internal migration is largely predominant : among household heads who had ever moved, 2% had moved from urban to urban (within Malawi), 8% from rural to urban, 11% from urban to rural, and the majority (75%) had moved from a rural area to another rural area (NSO, 2005a).
Table 1: Population indicators
Indicator Estimate Unit Reference period Source
Total population 12.884 million 2005 UNPD Annual population growth rate 2.3 % 2000-2005 UNPD Crude birth rate 44.6 ‰ 2000-2005 UNPD Population distribution by age: 2005 UNPD
0-4 years 18 % 5-14 years 29 % 15-24 years 20 % 60 and over 5 %
Rural population 83 % 2000-2005 UNPD Agricultural population 78 % 2000 FAOSTAT Population density 112 inhabitants per km2 2005 UNPD Median age 16 years 2005 UNPD Life expectancy at birth 45 years 2000-2005 UNPD
Population sex ratio 98.6 males per 100 female 2005 UNPD
Net migration rate -0.3 ‰ 2000-2005 UNPD Total dependency rate 101 % 2005 UNPD
Population pyramid
Source: NSO and ORC Macro, 2005. The population pyramid of Malawi has a wide base, which reflects the high level of fertility and the high level of mortality in the country. In 2004, the total fertility rate was estimated at 6.0 children per woman (NSO and ORC Macro, 2005).
Malawi Nutrition Profile – Nutrition and Consumer Protection Division, FAO, 2008 11
I.3 Agriculture Agriculture plays an important role in Malawi’s economy, as it provides 35% of GDP and 78% of the population is engaged in this sector (WB; FAO, Faostat-Population). Households’ agricultural activities are a major source of livelihood in Malawi, especially in rural areas where 81% of the active population is classified as subsistence farmers (NSO, 2005a). However, the agriculture sector is very vulnerable to weather shocks. Malawi’s agricultural sector is characterized by a dual structure: a low input/low productivity smallholder sector and high input/high productivity estate sector. The smallholder sub-sector comprises a very large number of small-scale farmers (approximately 80% of the workforce) growing mainly food crops for their own consumption but also cash crops such as coffee, tobacco, macadamia, cotton and groundnuts. The estate sector comprises a much smaller number of large-scale farmers, producing almost entirely for the export market. The main estate-grown crops are tobacco, coffee, tea and sugar (FAO, AQUASTAT, 2006; FAO/WFP, 2002). In Malawi, the main food crop is maize, which accounts for nearly 90% of the cultivated land, supplemented by cassava, pulses, sweet potatoes, fruit and vegetables, and, to a lesser extent, by sorghum, millet and rice (FAO, AQUASTAT, 2006; FAO/WFP, 2002; FAO, Faostat). Smallholders, mostly engaged in rain-fed maize production, make up about three quarters of the agricultural production (WB, 2008). According to the 2004-2005 Integrated Household Survey, almost all households (97%) that had cultivated during the last cropping season grew maize. Less than half (44%) had diversified their agricultural production. Beside maize, other crops grown were pulses (50% of households) followed by groundnuts (37%), cassava (22%) and other non specified grains (20%) (NSO, 2005a). Use of modern irrigation methods is quite minimal, or nonexistent amongst most households. Although all of the country’s districts have access to a body of water - either a river or one of Malawi’s five lakes- in 2003 irrigated agricultural land represented less than 1% of the total land area (FAO, Faostat-Land use). Agricultural performance remains vulnerable to erratic rainfall patterns, and is limited by poor irrigation systems, inappropriate and outdated agricultural technologies. In addition, the population is reluctant to switch to other more drought resistant crops than maize.. Moreover, the rapid increase in population has resulted in great pressure on land. Cultivation is expanding to marginal and less fertile areas and, in the smallholder farming system, fallow periods for restoring soil fertility have been greatly reduced. This is leading to soil erosion and a general degradation of the natural resource base, compounded by recurrent drought. This problem is more serious in Southern Malawi, which is the most densely populated area, as compared to Central and Northern Malawi (FAO, AQUASTAT, 2006). The Government has introduced various initiatives to boost agricultural production. These include market liberalization (1994), and agricultural production support programmes such as the Universal Starter Pack (1998), and the Targeted Input Program (2002), which was replaced by targeted Input Subsidy Program (2005). An Agricultural Productivity Investment Program was also launched in 1996 to increase agricultural productivity among smallholder farmers through the provision of credit facilities. The program was closed in 2005 with limited results and a high default rate (WB, 2007). The government has recently introduced a Government Input Subsidy Scheme which provides small farmers with fertilizers at a subsidized price. The programme reached 1.7 million small farmers. Early estimates for 2008 indicate a bumper maize harvest, following high production for the previous two years (FAO, 2008). These good results are due to both favourable rainfall and the Input Subsidy Scheme.

Malawi Nutrition Profile – Nutrition and Consumer Protection Division, FAO, 2008 12
Land use and irrigation statistics
Table 2: Land use and irrigation
Type of area Estimate Unit Reference period Source
Total land area 9408 1000 Ha 2003 FAO Agricultural area 47 % 2003 FAO Arable lands & permanent crops 28 % 2003 FAO Permanent crops 1 % 2003 FAO Permanent pasture 20 % 2003 FAO Forested land areas 36 % 2005 UNSTAT Irrigated agricultural land 0.6 % 2003 FAO Arable & permanent cropland in Ha per agricultural inhabitant 0.3 Ha 2000 FAO
N.B. Percents are calculated on the total land area.
Main crops, agricultural calendar, seasonal food shortage According to FAO estimates, the 5 major food and agricultural commodities produced in Malawi in 2005 were cassava, sugar cane, potatoes, maize and bananas (FAO, Statistics Division). Maize and potatoes were mainly for local human consumption, while sugar cane was also exported. Cassava was mainly used as feed, along with human consumption.
Source: FAO/GIEWS. Most of the households run out of their own produced food in December. Therefore the season of food shortage, commonly know as the lean period, goes from December to March.
Livestock production and fishery The livestock sub-sector in Malawi is relatively small and underdeveloped, contributing only about 7% to agricultural GDP (NEPAD and FAO, 2005). The livestock population is small in Malawi and in particular the number of cattle has been decreasing since 1987. Poultry constitutes the largest and most popular livestock species in Malawi, especially chickens which are kept by 80–85% of the almost 2 million rural households. Chicken is the most common source of income and animal protein in both rural and urban areas (NEPAD and FAO, 2005). Fish production contributes 4% to Malawi’s GDP. Fish, which significantly contributes to the national food security, is mainly provided by capture fisheries. The government of Malawi is promoting sustainable wild fisheries and has launched a countrywide programme to promote the development of aquaculture at both the subsistence and commercial farming levels (NEPAD and FAO, 2005).

Malawi Nutrition Profile – Nutrition and Consumer Protection Division, FAO, 2008 13
Table 3: Livestock and fishery statistics Livestock production and fishery Estimate Unit Reference
period Source
Cattle 750 000 number of heads 2005 FAO Sheep and goats 2 015 000 number of heads 2005 FAO Poultry birds 15 200 thousands 2005 FAO Fish catch and aquaculture 57196 tons 2004 FAO
I.4 Economy The economy of Malawi remains agro-based, with the agriculture sector accounting for about 35% of GDP, employing more than 80% of the total rural population and accounting for more than 80% of total export earnings (WB; MoEPD, 2004). Agriculture also provides raw materials for the manufacturing sector, which is mainly based on agro-processing activities, including tobacco, tea and sugar. However, the manufacturing sector is small (about 10% of GDP) and declining (MoEPD, 2004). Economic growth is greatly conditioned by the outcome of agricultural production, as in recent years of recurring drought. The narrow economic base and small size of the domestic market limit economic growth, also hindered by an erratic power supply, poor infrastructure and high transport costs (IFAD, Rural Poverty Portal). During the past 10 years, economic growth in general and agricultural growth in particular have been elusive. Since 1998 the growth rate is far below the 6% per annum growth threshold to reduce poverty significantly, with real GDP growth falling to less than 2% between 2000 and 2002 (BAD, 2005 ; WB, 2007). In 2006, GDP annual growth reached 8% thanks to increased agriculture production (WB). In 2004, Malawi’s GDP per capita was only 646 PPP US$, which was far below the average for Sub-Saharan Africa (GDP per capita of 1946 PPP US$) (UNDP, 2006). Malawi’s land-locked status is an important disadvantage. The weakness of the transport infrastructure includes poor access to ports, limited air links and freight capacity, limited rail capacity and poor condition of roads serving manufacturing, mining and rural producing areas (MoEPD, 2004).
Table 4: Basic economic indicators Indicator Estimate Unit Reference period Source Gross Domestic Product per capita 646 PPP US $ 2004 UNDP GDP annual growth 8 % 2006 WB Gross National Income per capita 160 $ 2005 WB Industry as % of GDP 19 % 2005 WB Agriculture as % of GDP 35 % 2005 WB Services as % of GDP 46 % 2005 WB Paved roads as % of total roads n.a.
Internet users 0.4 per 10 000 people 2004 WB
Total debt service as % of GDP 2 % 2003 UNDP Military Public expenditure 1 % of GDP 2003 UNDP
n.a.: not available Main non-food exports are tobacco, textiles and cotton fabrics. Tobacco is the largest export earner in the country, accounting for about 60% of total exports. The tobacco sector grew rapidly in the early 1990s but has since levelled off (MoEPD, 2004). Petroleum was Malawi’s largest import in 2005 (NSO, 2005b).
Malawi Nutrition Profile – Nutrition and Consumer Protection Division, FAO, 2008 14
I.5 Social indicators
Health indicators Infant and under-five mortality rates have considerably declined since the 1990s. However the current rates remain high. According to Malawi Demographic and Health Survey (MDHS) 2004, for the period 2000-2004, infant mortality rate was 76‰ and under-five mortality rate was 133‰ (NSO and ORC Macro, 2005). During the 15-year period preceding the 2004 MDHS, the estimates indicate that under-five mortality has declined by 30% (from 190‰ in 1990-1994 to 133‰ in 2000-2004) and infant mortality declined by 27% (from 104‰ in 1990-1994 to 76‰ in 2000-2004) (NSO and ORC Macro, 2005). However, Malawi has registered a setback in the fight against vaccine-preventable diseases since the early 1990s. Vaccination coverage is declining as the percentage of children age 12-23 months considered fully immunized has dropped from 82% in 1992 to 70% in 2000 and 64% in 2004-2005 (NSO and ORC Macro, 2005). It is not possible to establish reliable trends for maternal mortality. However it is clear that the rate has remained unacceptably high throughout the years and is among the highest in the world. Adjusted maternal mortality ratio was estimated at 1 800 deaths per 100 000 live births in 2000 (UNICEF, 2007a). Using direct estimation procedures based on the 2004 MDHS survey, the maternal mortality ratio was estimated to be 984 maternal deaths per 100,000 live births for the period 1998-2004 (NSO and ORC Macro, 2005). Only 57% of Malawian women deliver with the assistance of skilled health personnel (NSO and ORC Macro, 2005). Maternal deaths are attributed to obstetric complications, delays in seeking care, poor referral systems, lack of appropriate drugs, equipment and staff capacity, incorrect interventions and inadequate treatments (WHO, 2006a). The major causes of morbidity and mortality in Malawi are HIV/AIDS, lower respiratory infections, malaria, diarrhoeal diseases and conditions arising during the perinatal period. Cholera is endemic in the country (WHO, 2006b). Malawi is among the Sub-Saharan African countries severely affected by the HIV/AIDS epidemic. Its impact remains devastating and the country’s efforts are inadequate given the pace of the spread of HIV/AIDS (GoM, 2006). HIV/AIDS prevalence in adults has stabilized at an average of 14% (UNSTAT). There are around 500 000 AIDS orphans in the country (WHO, 2006b). Malawi’s response to HIV/AIDS began in 1986, initially concentrating on preventing further transmission of the virus. Since then Malawi has demonstrated increased commitment to addressing HIV/AIDS and a National AIDS Commission was established in 2001 to manage a multi-sectoral response to the pandemic (GoM, 2006). Limited investment and lack of human resources hinder the development of the health sector. Public expenditure in the health sector has decreased due to budget cuts and currently 40% of the MoH (Ministry of Health) positions are vacant throughout the country (WHO, 2006b). There are only 1 physician and 26 nurses per 100 000 people, therefore there is lack of capacity to deliver health services, especially in rural areas, where primary health care is severely compromised (WHO, 2006b). In an effort to resolve the human resource crisis, in 2004, the Ministry of Health, with the support of its development partners, put together a plan called “The 6-Year Emergency Human Resources Relief Programme”, including the expansion of the capacity of health workers training institutions and the retention of health workers in the public sector (RoM, 2005).

Malawi Nutrition Profile – Nutrition and Consumer Protection Division, FAO, 2008 15
Table 5: Health indicators
Indicator Estimate Unit Reference period Source
Mortality Infant mortality rate 76 ‰ 2000-2004 MDHS Under-five mortality rate 133 ‰ 2000-2004 MDHS Maternal mortality ratio :
reported 984 per 100 000 live births 1998-2004 MDHS
adjusted 1800 per 100 000 live births 2000 UNICEF
Morbidity
Malaria-related mortality rate in under-fives 1288
per 100 000 deaths in
under-fives 2000 UNSTAT
Percentage of under-fives sleeping under a treated bed net 15 % 2004-2005 MDHS
Prevalence of diarrhoea in under-fives in the last 2 weeks 22 % 2004-2005 MDHS
Oral Rehydration rate among under-fives* 70 % 2004-2005 MDHS
Percentage of under-fives with acute respiratory infections in the last 2 weeks
19 % 2004-2005 MDHS
Tuberculosis prevalence 501 per 100 000 people 2004 UNSTAT
HIV/AIDS Prevalence in adults** 14 % 2005 UNSTAT Percentage of women (15-24) who know that a person can protect herself from HIV infection by consistent condom use
66 % 2000 UNSTAT
Immunization Percent of infants with immunization against tuberculosis at 1 year of age 97 % 2004 UNICEF/WHO
Percent of infants with DTP3 immunization at 1 year of age 89 % 2004 UNICEF/WHO
Percent of infants with immunization against measles at 1 year of age 80 % 2004 UNICEF/WHO
Percent of pregnant women immunized against tetanus 66 % 2004-2005 MDHS
*Proportion of children under 5 years of age ill with diarrhoea at any time during the two weeks preceding the survey who received Oral RehydrationTherapy (ORT). ORT includes solution prepared from oral rehydration salt (ORS) packets or increased fluids. ** 15-49 years
Water and sanitation Malawi has made significant progress in increasing access to safe water and improved sanitation. According to UNICEF, in 2004 more than 70% of the households in Malawi had access to safe water, and 61% access to proper sanitation (62% in urban areas and 61% in rural areas) (UNICEF, 2007a).
Malawi Nutrition Profile – Nutrition and Consumer Protection Division, FAO, 2008 16
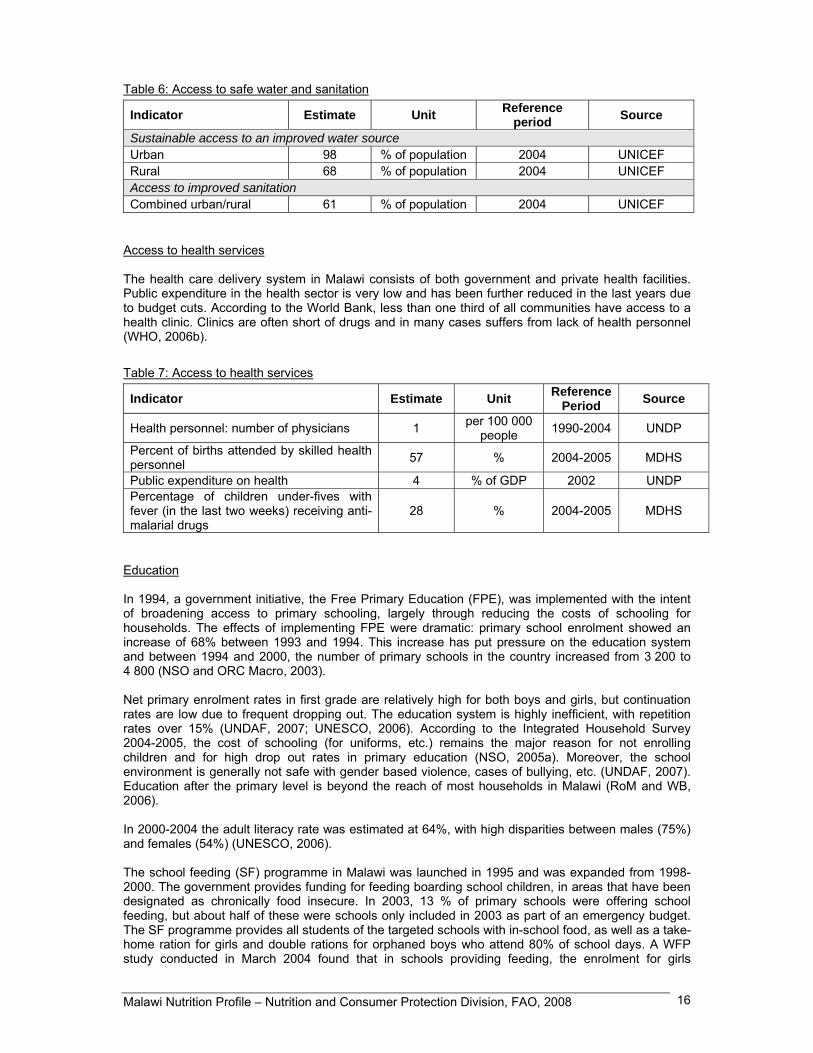
Table 6: Access to safe water and sanitation
Indicator Estimate Unit Reference period Source
Sustainable access to an improved water source Urban 98 % of population 2004 UNICEF Rural 68 % of population 2004 UNICEF Access to improved sanitation Combined urban/rural 61 % of population 2004 UNICEF
Access to health services The health care delivery system in Malawi consists of both government and private health facilities. Public expenditure in the health sector is very low and has been further reduced in the last years due to budget cuts. According to the World Bank, less than one third of all communities have access to a health clinic. Clinics are often short of drugs and in many cases suffers from lack of health personnel (WHO, 2006b).
Table 7: Access to health services
Indicator Estimate Unit Reference Period Source
Health personnel: number of physicians 1 per 100 000 people 1990-2004 UNDP
Percent of births attended by skilled health personnel 57 % 2004-2005 MDHS
Public expenditure on health 4 % of GDP 2002 UNDP Percentage of children under-fives with fever (in the last two weeks) receiving anti-malarial drugs
28 % 2004-2005 MDHS
Education In 1994, a government initiative, the Free Primary Education (FPE), was implemented with the intent of broadening access to primary schooling, largely through reducing the costs of schooling for households. The effects of implementing FPE were dramatic: primary school enrolment showed an increase of 68% between 1993 and 1994. This increase has put pressure on the education system and between 1994 and 2000, the number of primary schools in the country increased from 3 200 to 4 800 (NSO and ORC Macro, 2003). Net primary enrolment rates in first grade are relatively high for both boys and girls, but continuation rates are low due to frequent dropping out. The education system is highly inefficient, with repetition rates over 15% (UNDAF, 2007; UNESCO, 2006). According to the Integrated Household Survey 2004-2005, the cost of schooling (for uniforms, etc.) remains the major reason for not enrolling children and for high drop out rates in primary education (NSO, 2005a). Moreover, the school environment is generally not safe with gender based violence, cases of bullying, etc. (UNDAF, 2007). Education after the primary level is beyond the reach of most households in Malawi (RoM and WB, 2006). In 2000-2004 the adult literacy rate was estimated at 64%, with high disparities between males (75%) and females (54%) (UNESCO, 2006). The school feeding (SF) programme in Malawi was launched in 1995 and was expanded from 1998-2000. The government provides funding for feeding boarding school children, in areas that have been designated as chronically food insecure. In 2003, 13 % of primary schools were offering school feeding, but about half of these were schools only included in 2003 as part of an emergency budget. The SF programme provides all students of the targeted schools with in-school food, as well as a take-home ration for girls and double rations for orphaned boys who attend 80% of school days. A WFP study conducted in March 2004 found that in schools providing feeding, the enrolment for girls
Malawi Nutrition Profile – Nutrition and Consumer Protection Division, FAO, 2008 17
increased by 38% and pass rates increased by 10% from previous years compared to a decline by 10% in enrolment in non-feeding schools (RoM and WB, 2006).
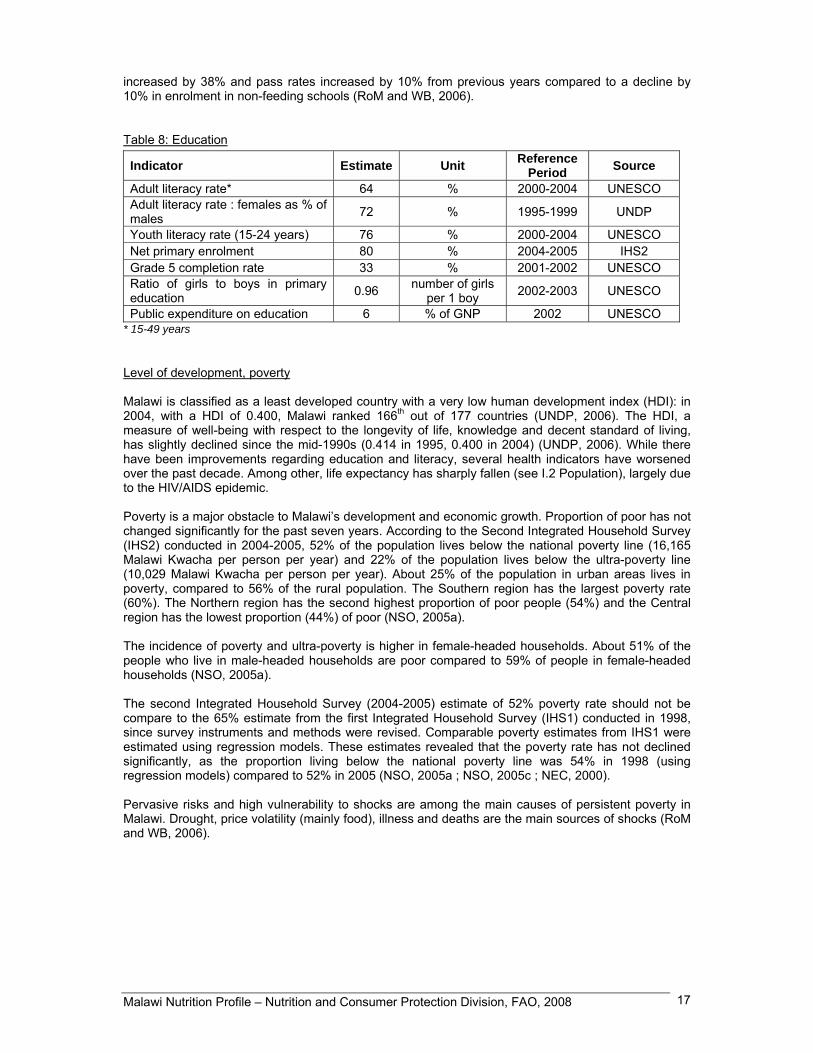
Table 8: Education
Indicator Estimate Unit Reference Period Source
Adult literacy rate* 64 % 2000-2004 UNESCO Adult literacy rate : females as % of males 72 % 1995-1999 UNDP
Youth literacy rate (15-24 years) 76 % 2000-2004 UNESCO Net primary enrolment 80 % 2004-2005 IHS2 Grade 5 completion rate 33 % 2001-2002 UNESCO Ratio of girls to boys in primary education 0.96 number of girls
per 1 boy 2002-2003 UNESCO
Public expenditure on education 6 % of GNP 2002 UNESCO * 15-49 years
Level of development, poverty Malawi is classified as a least developed country with a very low human development index (HDI): in 2004, with a HDI of 0.400, Malawi ranked 166th out of 177 countries (UNDP, 2006). The HDI, a measure of well-being with respect to the longevity of life, knowledge and decent standard of living, has slightly declined since the mid-1990s (0.414 in 1995, 0.400 in 2004) (UNDP, 2006). While there have been improvements regarding education and literacy, several health indicators have worsened over the past decade. Among other, life expectancy has sharply fallen (see I.2 Population), largely due to the HIV/AIDS epidemic. Poverty is a major obstacle to Malawi’s development and economic growth. Proportion of poor has not changed significantly for the past seven years. According to the Second Integrated Household Survey (IHS2) conducted in 2004-2005, 52% of the population lives below the national poverty line (16,165 Malawi Kwacha per person per year) and 22% of the population lives below the ultra-poverty line (10,029 Malawi Kwacha per person per year). About 25% of the population in urban areas lives in poverty, compared to 56% of the rural population. The Southern region has the largest poverty rate (60%). The Northern region has the second highest proportion of poor people (54%) and the Central region has the lowest proportion (44%) of poor (NSO, 2005a). The incidence of poverty and ultra-poverty is higher in female-headed households. About 51% of the people who live in male-headed households are poor compared to 59% of people in female-headed households (NSO, 2005a). The second Integrated Household Survey (2004-2005) estimate of 52% poverty rate should not be compare to the 65% estimate from the first Integrated Household Survey (IHS1) conducted in 1998, since survey instruments and methods were revised. Comparable poverty estimates from IHS1 were estimated using regression models. These estimates revealed that the poverty rate has not declined significantly, as the proportion living below the national poverty line was 54% in 1998 (using regression models) compared to 52% in 2005 (NSO, 2005a ; NSO, 2005c ; NEC, 2000). Pervasive risks and high vulnerability to shocks are among the main causes of persistent poverty in Malawi. Drought, price volatility (mainly food), illness and deaths are the main sources of shocks (RoM and WB, 2006).

Malawi Nutrition Profile – Nutrition and Consumer Protection Division, FAO, 2008 18
Table 9: Human development and poverty
Indicator Estimate Unit Reference period Source
Human development index (HDI) 0.400 value between 0-1 2004 UNDP Proportion of population living with less than 1$ a day (PPP) 42 % 1990-2003 UNDP
Population living below the national poverty line
52 % 2004-2005 IHS2
Human poverty index (HPI-1) 43 % 2005 UNDP
Other social indicators Malawian women do not enjoy the same opportunities as men in terms of access and participation to social, political and economic development. With regard to economic opportunities, there are limited formal employment opportunities, most of which are dominated by men. Women are predominantly employed in the subsistence agricultural sector, constrained by inadequate access to land, income and credit. Illiteracy rates are higher for women and early childbearing affects girls’ ability to take advantage of educational opportunities, increasing their vulnerability to poverty. Women have weak independent rights to own and inherit property. At the household level, women, especially those in rural areas, participate less in decision-making: for example, 71% of all women are not able to participate in making decisions about their own health and 38% of rural women who earn cash do not participate in decisions on how their money is to be used (Ngwira et al., 2003). In 2002, about 80% of children aged 5-17 year (3.2 million children) were working both at home and outside their house engaging in economic and non-economic activities (NSO and MLVT, 2004). In 2004, there were 1 040 000 Orphans and Vulnerable Children (OVCs) in Malawi, representing 14% of all children in the country (Devereux et al., 2006).
Table 10: Other social indicators
Indicator Estimate Unit Reference period Source
Gender related development index (GDI) 0.396 value between 0-1 2005 UNDP Women’s wage employment in non-agricultural sector as % of total non agricultural employees
12 % 2004 UNSTAT
Ratification of ILO Convention 182 on The Worst Forms of Child Labour Ratified 1999 ILO

Malawi Nutrition Profile – Nutrition and Consumer Protection Division, FAO, 2008 19
Part II: Food and nutrition situation
II.1 Qualitative aspects of the diet and food security
Food consumption patterns In Malawi, food consumption patterns are based on cereals, primarily maize, and starchy roots (mainly cassava and potatoes). The staple food is nsima, a stiff, unfermented maize-based porridge. The porridge is molded into patties and served either with beans, meat, or vegetables in a tomato-and-onion sauce, called ndiwo. Malawians also eat cassava, rice and potatoes, though rice is considered a luxury and potatoes are often used as ndiwo. Generally a Malawian meal is composed of starch in generous quantity, accompanied by some relish to add flavour. Meat is rather expensive and most people cannot afford it. Fish is often consumed in small amounts in main meals. Much of the fish is consumed in rural areas and therefore contributes to meet the nutritional requirements of some of the poorest people in the country. Utilization of fresh fish is more popular in villages and towns near the lakes and rivers, while more remote rural areas are supplied with processed fish. The demand for fish in Malawi is very high. However, overall, nowadays Malawians find it more difficult and more expensive to obtain fish than ever before (FAO/FAD, 2005). The main staple food crop for most of the country is maize, with bitter cassava being preferred in some parts of Central and Northern areas. Plantains are the main staple in a small area of the Northern region and rice is important in the lakeshore and wetland areas. Sorghum and millet are secondary staples, with sweet potatoes, Irish potatoes and (sweet) cassava being considered as snacks (FAO/WFP, 2005). While maize consumption remains relatively stable among households all year long, households change other aspects of consumption patterns. During the months of food shortage, other, less desirable foods are consumed, particularly green, or unripe maize. Cassava has frequently been promoted as an alternative food during the maize lean months. Cassava consumption is particularly important and stable over time in the North, the region with the greatest production of cassava, and where it is already a culturally accepted part of the diet. Cassava is much less commonly grown in the South and Centre, and it is likely that less is available for consumption, particularly as the lean season progresses (RoM and WB, 2006). According to the National Nutrition Survey performed in December 2005 which is representative of the rural Malawian population, the national average number of meals per day for an adult was 2.0 ; 45% of adults had two meals the day before the survey, roughly one-third of adults had three meals and 19% had only one meal the day before the survey. The percentage of households reporting at least one member regularly reducing the amount of food they consumed at mealtimes was 82% and 49% of households reported that at least one member did not eat during a whole day in the last month due to lack of food (GoM and UNICEF, 2005).
Food security situation Food security is defined as “A situation that exists when all people, at all times, have physical, social and economic access to sufficient, safe and nutritious food that meets their dietary needs and food preferences for an active and healthy life” (FIVIMS). Food insecurity may be caused by the unavailability of food, insufficient purchasing power, inappropriate distribution, or inadequate use of food at the household level. Food insecurity may be chronic, seasonal or transitory. Malawi is among the most food insecure countries in the world. While in the 20 years after its independence gained in 1964, Malawi was fully capable of producing all the food it needed, it is no longer able to either produce or commercially purchase all of the food it needs (Sahley et al., 2005).
Malawi Nutrition Profile – Nutrition and Consumer Protection Division, FAO, 2008 20
The country suffers from chronic food insecurity at both household and national levels with many of the problems being structural in nature. The main contributing factors include over-dependence on rainfed agriculture, low productivity, low incomes, poor road infrastructure, poor functioning of markets, poor early warning system and poor mechanization. In addition, past food security policies have been ineffective, resulting in stagnating food production and productivity (GoM, 2006). With few exceptions, agriculture continues to be rainfed. These conditions have rendered Malawi highly vulnerable to climatic shocks that have precipitated acute food insecurity with increasing frequency over the past 20 years (Sahley et al., 2005). Rural households are almost totally dependent on rainfall for their livelihoods, both directly (for crop production) and indirectly (for ganyu employment – casual labour) (Devereux et al., 2006). Twice in the 1990s and in 2001-2002, Malawi was threatened with drought-induced famine (ODI, not dated). Adverse climatic conditions in the two consecutive growing seasons of 2000-2001 and 2001-2002, exacerbated by gross mismanagement of grain reserves have plunged the country into one of its worst food security crises with around 30% of the population in need of emergency support (ODI, not dated ; Menon, 2007). In 2005, Malawi faced another serious food crisis, the result of a combination of various factors including drought, floods and consecutive poor harvests (FAO, 2005). At least 4.7 million people – a third of the population – were in need of food assistance during the 2005 crisis (Menon, 2007). Agricultural production levels are not keeping pace with rapid population growth. Although maize production has shown an upward trend, it has steadily fallen short of population growth and the variability of maize production has become greater since the early 1990s (Sahley et al., 2005 ; Devereux et al., 2006). Due to increasing land pressure, most rural households tend to cultivate less land, and declining farm sizes have not been accompanied by agricultural intensification, or by diversification either within or outside agriculture (Devereux et al., 2006). Since the completion of the Fertiliser Subsidy Removal Programme (FSRP) in 1995 and following the collapse of the Smallholder Agricultural Credit Association (SACA) in 1992, Malawian smallholders have faced higher prices for fertilizers, and severely restricted access to input credit (Devereux et al., 2006). For all major productive inputs required for sustainable agriculture – land, water, soil, fertilizer – farmers face severe constraints. As a consequence, per capita food availability declined throughout the 1980s and 1990s, mainly because of falling per capita maize production (Wobst et al., 2004 ; FAO, Faostat). The magnitude of the decline in food supply was disguised in the 1990s by exaggerated cassava production figures, which appeared to offset the decline in maize output until they were exposed as grossly inflated during the 2001-2002 food crisis (Devereux et al., 2006). Malawi’s agricultural marketing structure is characterised by high transaction costs and poor market infrastructure. The ADMARC (Agricultural Development and Marketing Corporation) remains a major actor in agricultural marketing, but its activities have been curtailed in recent years, leaving a confused an inefficient agricultural marketing system (Devereux et al., 2006). In addition, domestic prices exhibit much higher volatility compared to international prices, partially due to production variability and high transport costs (RoM and WB, 2006). A major cause of food insecurity in Malawi is deep and pervasive poverty. Most households live below the national poverty line, being unable to afford a minimum basket of food and non-food items. Ganyu1 is a crucial poverty issue in Malawi because after own-farm production, ganyu is the most important source of livelihood for most poor households and is the most important coping strategy during the crucial period of food shortage (Whiteside, 2000). In the past, ganyu provided the main supplementary income for poor households, but ganyu is becoming more difficult to find (Devereux et al., 2006). Income poverty has led to asset poverty and general livelihood erosion over time as households have struggled to cope with the droughts that regularly affect the country. As assets and livelihoods have eroded, the extreme poor have grown in number, food access shortfalls have grown, and the country’s vulnerability to food insecurity has increased (Frankenberger, 2003). HIV/AIDS worsens the food security situation in Malawi. It negatively affects household’s productive capacity, decreasing agricultural labour output and increasing dependency. It depletes the time and resources of caregivers, who might otherwise be able to produce food and earn income for food.
1 The word ganyu is widely used in Malawi to describe a range of short-term rural labour relationships, the most common of which is piecework weeding or ridging on the fields of other smallholders, or on agricultural estates. Ganyu can be defined as any off-own-farm work done by rural people on a casual basis. Usually covering a period of days or weeks, remuneration may be in cash or in kinf such as food (Whiteside, 2000).

Malawi Nutrition Profile – Nutrition and Consumer Protection Division, FAO, 2008 21
In 2007, the food security situation improved in all districts. The improvement is attributed to the good harvest that the districts obtained as a result of favourable weather conditions and increased fertilizer and improved seed uptake by farmers, mainly due to the government Input Subsidy Programme. Data from the Ministry of Agriculture and Food Security show that in 2007 Malawi had the largest cereal harvest on record. However, some isolated parts of the country were still unable to achieve sufficient production of food crops. Estimates from the Malawi Vulnerability Assessment Committee (MVAC) did not show substantial transient vulnerability in most parts of the country; however, around 519 200 people whose year-round food security status is not assured need to be monitored as adverse economic developments could affect their ability to access adequate food (MVAC, 2007 ; UNICEF, 2007b). Certain coping strategies such as reduction in expenditure and sales of livestock or household assets, cannot be undertaken by very poor households, as they neither have any assets to sell nor savings. Major coping strategies are reliance on less preferred foods, getting food from friends or relatives outside the house, regularly reducing the amount of food eaten, reducing the number of meals per day, and going without eating for whole days (MNVAC, 2002).
Surveys of dietary diversity and variety The Malawi National Nutrition Survey conducted in December 2005 documents dietary diversity and variety (GoM and UNICEF, 2005). This survey was designed to be representative of the rural population of Malawi. The four urban areas of Malawi (Lilongwe, Mzuzu, Zomba and Blantyre) were not surveyed. The survey was performed in 26 districts instead of the 28 existing districts in Malawi, the sampling frame of two districts (Neno and Likoma) were merged with two others (Mwanza and Nkhata Bay). The sample included 22 765 rural households (GoM and UNICEF, 2005). In this survey, households were asked if their breakfast, lunch and dinner included various categories of food. The questions were focusing on the day prior to the survey. Staples food, the most frequently consumed foods, were followed by legumes and fruit. The consumption of animal food, fats and sugar, and vegetables was less common (GoM and UNICEF, 2005). The diet varied by region. Adults in Northern districts were consuming a more diversified diet than adults in the Southern and Central districts. A higher food availability in the Northern region maybe responsible for a higher food diversity among adults in this region (GoM and UNICEF, 2005).
II.2 National food supply data
Supply of major food groups
Table 11: Trends in per capita supply of major foods groups (in g/per day)
Supply for human consumption in g/day Major food groups 1965-67 1972-74 1979-81 1986-88 1993-95 2000-2002
Cereals (excl. beer) 496 511 467 434 424 404 Fruit and vegetables 225 233 235 208 188 164 Starchy roots 56 139 200 135 141 530 Other 86 127 55 35 38 40 Pulses, nuts, oilcrops 79 89 76 55 38 43 Sweeteners 13 18 23 31 41 38 Fish 22 38 24 27 17 10 Milk and eggs 15 19 30 24 17 15 Meat and offals 12 15 16 15 13 15 Vegetable oils 4 4 5 3 6 6 Animal fats 3 3 4 0 0 1
Source: FAOSTAT

Malawi Nutrition Profile – Nutrition and Consumer Protection Division, FAO, 2008 22
In 2000-2002, the three major food groups in terms of supply for human consumption were starchy roots, cereals and fruit and vegetables. The per capita supply of starchy roots, which is comprised mainly of cassava and potatoes, has fluctuated over the years and has considerably increased during the last period (Table 11) (FAO, Faostat). The droughts experienced in the 1990s heavily affected maize production. The important increase in supply of starchy roots is due to large efforts by the government to promote crop diversification, especially cassava production to compensate for shortfalls in maize production (FEWS, 2001). Moreover, cassava planted areas have almost doubled between 1992-93 and 2000-2001 (FEWS, 2001). Cassava production has consequently increased rapidly in all regions of the country. High population density, coupled with dramatically increasing maize and bread prices following liberalization, led to the rapid emergence of an urban fast food market for prepared cassava in central Malawi, a traditionally maize consuming region (Haggblade and Zulu, 2003). However, national cassava production was probably grossly over-estimated during the 2001-2002 food crisis, wrongly appearing to offset the decline in maize output (Devereux et al., 2006). The supply of cereals consists mainly of maize and, to a much lesser extent, of wheat (imported), rice, millet and sorghum (locally produced). In 2000-2002, the per capita supply of maize represented about 90% of the total per capita supply in cereals (FAO, Faostat). The per capita supply of cereals has declined regularly since the early 1970s. Although maize production overall shows an upward trend, production levels are not keeping pace with rapid population growth. Moreover, maize is particularly affected by dry spells, and recurrent droughts experienced in the early 1990s and the disastrous droughts of 2000-2002 explain the decline of cereal supply during the last decade (FAO/WFP, 2004; FEWS, 2001). The supply of fruit and vegetables, which form another key food group in Malawi and constitute an important source of micronutrients, has decreased steadily since the early 1980s. Current per capita supply of fruit and vegetables is very low. This food group is mainly comprised of plaintain, tomatoes, cabbages and other brassicas, bananas, mangoes, papaya and oranges (FAO, Faostat). The supply of food of animal origin, which is a vital source of protein and micronutrients, has been irregular over the years. The per capita supply of fish has considerably fallen since the 1970s due to high population growth against declining fish production creating a real threat to food and nutrition security in Malawi (FAO, Faostat; FAO/FAD, 2005). The per capita supply of milk and eggs increased between 1965-67 and 1979-81 but has steadily fallen since this period and the current supply is very low. The per capita supply of meat and offals has remained very low and almost constant over the period (FAO, Faostat). The downward trend of meat supply could be explained by recurrent droughts which have decimated livestock. The supply of pulses, nuts and oilcrops, which comprises mainly beans, groundnuts, pigeon peas and cottonseed, has declined since the late 1970s. The per capita supply of vegetable oils (mainly locally produced groundnut oil and imported soyabean oil), has slightly increased over the years. This increase is related to a rise in imported soyabean oil (since 1993-95), due to declining production of groundnut oil. The supply of animal fats, already initially low, has been virtually non-existent since 1986-88 (FAO, Faostat).

Malawi Nutrition Profile – Nutrition and Consumer Protection Division, FAO, 2008 23
Dietary energy supply, distribution by macronutrient and diversity of the food supply • Figure 1: Dietary energy supply (DES), trends and distribution by macronutrient
12 13 12 12 11 10
16 15 15 13 12 12
72 72 7375 77 78
0
500
1000
1500
2000
2500
3000
3500
1965-67 1972-74 1979-81 1986-88 1993-95 2000-2002
kcal
/day
protein lipids carbohydrates
Daily EnergyRequirements: 2 054 kcal/capita
Source: FAOSTATMalawi
Figure 1: Trends in DES per capita and percentages from protein, lipids & carbohydrates
After a steady decline between 1972-74 and 1993-95, per capita Dietary Energy Supply (DES) has increased during the last period. In 2000-2002, the DES was 2155 kcal per capita/day in comparison with population energy requirements of 2054 kcal per capita/day in 2000 (FAO, Faostat; FAO, 2004). According to “The State of Food Insecurity in the World”, the prevalence of undernourishment was 34% in 2001-2003 (FAO, 2006a). Even if still very high, the prevalence has decreased since 1990-93 when half of the population was undernourished (FAO, 2006a). The contribution of carbohydrates to the DES has steadily increased since the late 1970s, reaching 78% in 2000-2002. On the contrary, the share of energy from lipids has decreased since 1979-81, and remained since then lower than the recommended level of 15-30% of energy from fat (FAO, Faostat; WHO/FAO, 2003). In 2000-2002, the share of energy from protein (10%) was at the lower limit of recommendations (10-15%) (FAO, Faostat; WHO/FAO, 2003).
Vegetable/animal origin of macronutrients • Figure 2: Vegetable/animal origin of energy, protein and lipid supplies
97 93 85
1573
0
20
40
60
80
100Vegetable/animal
origin(%)
Animal origin
Vegetable origin
MalawiSource: FAOSTAT
Figure 2: Origin of energy, protein and lipid supplies, 2000-2002
Energy Protein Lipid

Malawi Nutrition Profile – Nutrition and Consumer Protection Division, FAO, 2008 24
In Malawi, the diet is dominated by foods of vegetable origin, which provide a considerable part of dietary energy (97%), protein (93%) and lipid (85%) supplies (FAO, Faostat). The low supply of foods of animal origin may entail a low intake and/or bioavailability of micronutrients in the diet, especially vitamin A, iron and calcium.
Dietary energy supply by food group • Figure 3: Dietary energy supply by food group
Vegetable oils 3%
Fruit and vegetables 4%
Sweeteners 6%
Pulses, nuts, oilcrops 8%
Other1%
Milk and eggs 1%
Meat and offals2%
Starchy roots17%
MalawiSource: FAOSTAT
Figure 3: Percentage of energy provided by major food groups in 2000-2002
Cereals (excl. beer) 59%
Note: Percentages <1% are not presented in the graph.
Cereals and starchy roots together represent more than three-quarters of the DES. The DES provided by foods of animal origin is particularly low (3%) while that of fruit and vegetables was only 4% (FAO, Faostat). The low contribution of animal products and fruit and vegetables in the diet may entail various micronutrient deficiencies.
Table 12: Share of the main food groups in the Dietary Energy Supply (DES), trends
% of DES Food groups 1965-67 1972-74 1979-81 1986-88 1993-95 2000-2002
Cereals (excl. beer) 71 67 65 69 69 59 Pulses, nuts, oilcrops 15 15 13 11 7 8 Starchy roots 2 4 6 5 5 17 Sweeteners 2 3 4 5 8 6 Fruit and vegetables 5 4 5 5 5 4 Vegetable oils 2 2 2 1 3 3 Meat and offals 1 1 2 2 2 2 Other 1 2 1 1 1 1 Fish 1 1 1 1 1 0 Milk and eggs 1 1 1 1 1 1 Animal fats 1 1 1 0 0 0
Contribution of cereals and starchy roots to the DES has not changed significantly over the whole period. However, in 2000-2002 the contribution of starchy roots considerably increased, due to efforts to diversify crop production but also probably as a result of grossly over-estimated production figures. The contribution of cereals to the DES decreased substantially in 2000-2002, as a result of drought (FAO, Faostat).
Malawi Nutrition Profile – Nutrition and Consumer Protection Division, FAO, 2008 25
The share of pulses, nuts and oilcrops in the DES shows a downward trend over the period taken into consideration. Contribution of other protein-rich foods such as meat/offals, milk/eggs and fish to the DES has been very limited and stable over the whole period (FAO, Faostat). The food diversification index, i.e. the contribution of food groups other than cereals and starchy roots to the DES, is very low, estimated at 24% in 2000-2002 indicating a monotonous diet. The dietary diversity index has not increased significantly since the 1960s (FAO, Faostat).
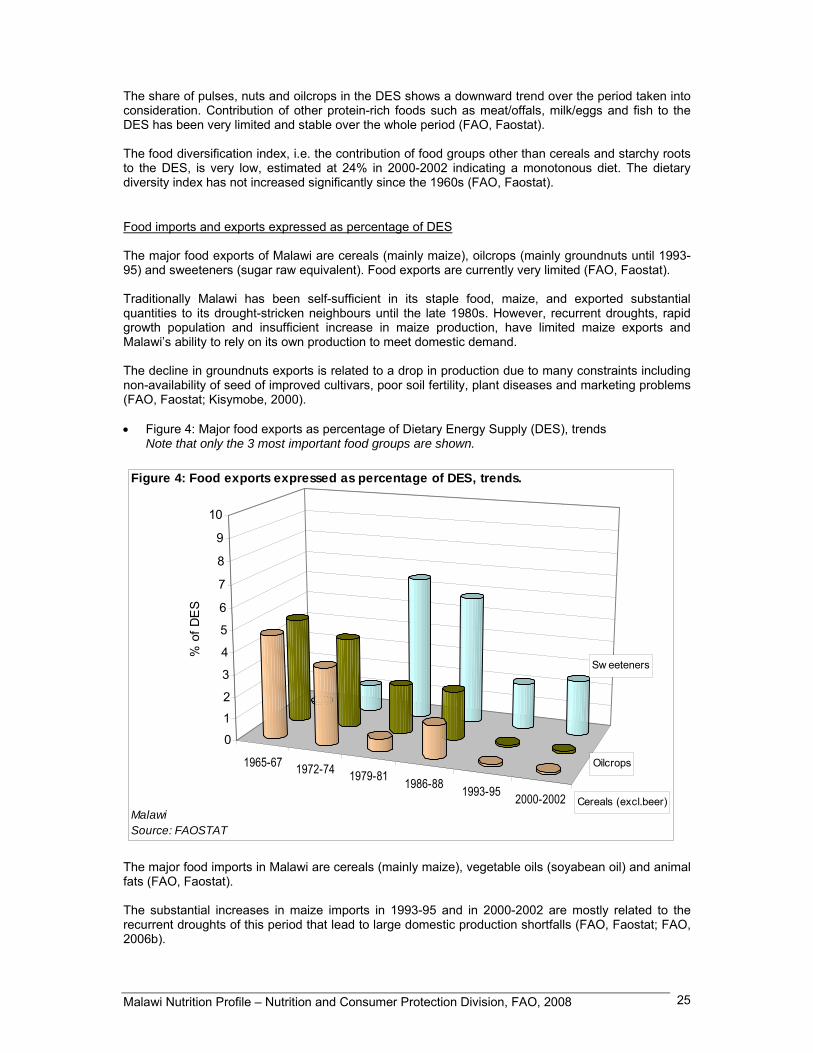
Food imports and exports expressed as percentage of DES The major food exports of Malawi are cereals (mainly maize), oilcrops (mainly groundnuts until 1993-95) and sweeteners (sugar raw equivalent). Food exports are currently very limited (FAO, Faostat). Traditionally Malawi has been self-sufficient in its staple food, maize, and exported substantial quantities to its drought-stricken neighbours until the late 1980s. However, recurrent droughts, rapid growth population and insufficient increase in maize production, have limited maize exports and Malawi’s ability to rely on its own production to meet domestic demand. The decline in groundnuts exports is related to a drop in production due to many constraints including non-availability of seed of improved cultivars, poor soil fertility, plant diseases and marketing problems (FAO, Faostat; Kisymobe, 2000). • Figure 4: Major food exports as percentage of Dietary Energy Supply (DES), trends
Note that only the 3 most important food groups are shown.
1965-67 1972-74 1979-81 1986-88 1993-95 2000-2002
Sw eeteners
Cereals (excl.beer)
Oilcrops
0
1
2
3
4
5
6
7
8
9
10
% o
f DE
S
MalawiSource: FAOSTAT
Figure 4: Food exports expressed as percentage of DES, trends.
The major food imports in Malawi are cereals (mainly maize), vegetable oils (soyabean oil) and animal fats (FAO, Faostat). The substantial increases in maize imports in 1993-95 and in 2000-2002 are mostly related to the recurrent droughts of this period that lead to large domestic production shortfalls (FAO, Faostat; FAO, 2006b).

Malawi Nutrition Profile – Nutrition and Consumer Protection Division, FAO, 2008 26
• Figure 5: Major food imports as percentage of Dietary Energy Supply (DES), trends
Note that only the 3 most important food groups are shown.
1965-67 1972-74 1979-81 1986-88 1993-95 2000-2002
0
5
10
15
20
25
% o
f DE
SFigure 5: Food imports expressed as percentage of DES, trends.
MalawiSource: FAOSTAT
Food aid In 2006, Malawi received a total food aid of 242 521 t, of which 183 512 t of cereals (mainly coarse grains) and 59 008 t of non-cereals (mainly oils and fats and pulses). This food aid was mainly delivered as emergency food aid2 (WFP, 2007). Between 2004 and 2006, total food aid tripled in Malawi (WFP, 2007). This may be attributed to the serious food crisis the country faced in 2005, as well as recent dry spells and floods experienced in many parts of the country, which adversely affected crop production (FEWS, 2005; FEWS, 2006; UN, 2006).
II.3 Food consumption National level surveys Presently, no detailed data are available on food consumption at national level. The Second Malawi Integrated Household Survey 2004-2005 (ISF2) only documented expenditures on food and did not present results in terms of food consumption (NSO, 2005a). The National Nutrition Survey conducted in 2005 only documented the diversity of food consumption in rural Malawi (see II.1 « Surveys of dietary diversity and variety ») (GoM and UNICEF, 2005).
2 Emergency food aid is destined to victims of natural or man-made disasters; Project food aid aims at supporting specific poverty-alleviation and disaster-prevention activities; Programme food aid is usually supplied as a resource transfer for balance of payments or budgetary support activities. Unlike most of the food aid provided for project or emergency purposes, it is not targeted to specific beneficiary groups. It is sold on the open market, and provided either as a grant, or as a loan.
Cereals (excl.beer)
Vegetable oils
Animal fats
Malawi Nutrition Profile – Nutrition and Consumer Protection Division, FAO, 2008 27
The ISH2, representative at national level, included 11 280 households. The results showed that 56% of Malawian households’ total expenditure was on food. In rural areas, food expenditure represented 59% of total expenditure while their urban counterparts spent only 45% on food. At regional level, household expenditure on food was highest in the Northern region (61%), followed by the Southern (56%) and the Central region (54%) (NSO, 2005a). Comparison with the 1998 Integrated Household Survey (ISH1) shows that there has been an overall decline in terms of food expenditure share to total expenditure. In rural areas, the food expenditure share was estimated at 77% in 1998 (59% in 2004-2005). In urban areas food expenditure slightly increased from 41% in 1998 to 45% in 2004-2005. In the Northern and Central regions, food expenditure declined 10 percentage points between 1998 and 2004-2005 while in the Southern region it remained stable over the same period (NSO, 2005a). In 2004-2005, the highest expenditure on food was that for cereals and cereal products. The expenditure on milk and milk products ranked second, followed by meat, fish and animal products. Average annual household food expenditure was higher in urban areas for all food items except pulses. In particular, urban households spent much more on meat, fish, animal products and milk/dairy products than their counterparts living in rural areas (NSO, 2005a).
II.4 Infant and young child feeding practices Three national surveys provide information on infant and young child feeding practices: the 2004 Malawi Demographic and Health Survey (MDHS) (conducted in 2004-2005), MDHS 2000 and MDHS 1992 (NSO and ORC Macro, 2005; NSO and ORC Macro, 2001; NSO and Macro International Inc., 1994). According to the 2004 MDHS, breastfeeding is nearly universal with 98% of children under five years of age having been breastfed for some period of time. Differences by background characteristics of sex, residence, region or mother’s education were small (NSO and ORC Macro, 2005) Among children ever breastfed, 70% and 97% were breastfed within one hour and one day of birth respectively. Early initiation of breastfeeding (i.e. within one hour of birth) varied slightly according to background characteristics. Urban children were more likely to be breastfed within the recommended one hour of birth (78%) than their counterparts living in rural areas (69%). There were minor differences according to regions. However, disparities across districts were marked, ranging from 56% of children breastfed within one hour of birth in Kasungu district to 80% in Salima district. Early initiation of breastfeeding was more common among children of mothers with at least some primary education (NSO and ORC Macro, 2005). Breastfeeding was already a nearly universal practice in the early 1990s (NSO and Macro International Inc., 1994). However, improvements have been made in the rate of early initiation of breastfeeding which increased from 57% in 1992 to 72% in 2000 and 70% in 2004-2005 (NSO and ORC Macro, 2005; NSO and ORC Macro, 2001; NSO and Macro International Inc., 1994). Prelacteal feeding is not a common practice in Malawi: only 5% of children were given prelacteal feeds in 2004-2005 (NSO and ORC Macro, 2005). However, it is worth noting that this was more than double the percentage reported in the 2000 MDHS (2%) (NSO and ORC Macro, 2001). According to the 2004 MDHS, the median duration of breastfeeding among children under three years was 23.2 months, one month shorter than in the 2000 MDHS (NSO and ORC Macro, 2005; NSO and ORC Macro, 2001).

Malawi Nutrition Profile – Nutrition and Consumer Protection Division, FAO, 2008 28
Table 13: Initiation and duration of breastfeeding
Survey name/date (Reference)
Background characteristics
Sample size (all children under five
years)
Percentage of children under
five years everbreastfed
Number of children under
five years everbreastfed
Among children everbreastfed,
percentage breastfed
within one hour of birth
Among children everbreastfed,
percentage breastfed
within 24 hours of birth¹
Number of
children under three years
Median duration of
breastfeeding in children under three
years (in months)
Total 10771 98.3 10593 69.8 96.6 6715 23.2 Sex M 5381 98.0 5275 69.3 96.7 3340 23.4 F 5390 98.7 5318 70.4 96.4 3375 23.0 Residence Urban 1425 98.6 1405 78.1 97.5 910 22.8 Rural 9347 98.3 9187 68.6 96.4 5805 23.2 Region Northern 1345 98.2 1320 69.5 97.4 824 23.1 Central 4494 98.5 4426 68.4 95.0 2816 23.0 Southern 4933 98.3 4847 71.2 97.8 3075 23.4 Region (districts) Blantyre 724 98.9 715 77.5 96.9 440 23.8 Kasungu 525 98.0 515 56.4 97.6 314 23.3 Machinga 441 98.5 434 79.4 98.8 272 24.6 Mangochi 636 97.9 622 78.4 96.9 407 23.4 Mzimba 676 98.4 665 70.6 98.0 413 23.7 Salima 312 98.9 308 79.9 97.6 201 22.8 Thyolo 575 98.4 565 62.0 98.4 351 23.3 Zomba 544 97.8 532 78.9 96.9 337 23.0 Lilongwe 1489 98.7 1470 76.6 94.6 944 22.9 Mulanje 437 97.6 427 68.4 98.9 273 22.8 Other districts 4414 98.3 4339 64.9 96.0 2763 22.9 Mother's education No education 2903 98.7 2865 68.0 95.8 1697 24.1 Primary 6739 98.2 6618 70.7 96.9 4246 23.0
Malawi
Demographic and Health
Survey 2004
2004-2005 (NSO and
ORC Macro, 2005)
Secondary or higher 1127 98.2 1107 72.8 96.7 771 22.6 ¹ Includes children who started breastfeeding within one hour of birth Although breastfeeding is widely practiced in Malawi, in 2004-2005 only 53% of children under 6 months of age were exclusively breastfed. The rate of exclusive breastfeeding declined sharply with age. Although as many as 75% of infants aged 0-1 month were exclusively breastfed, at 4-5 months only 28% were (NSO and ORC Macro, 2005; NSO and ORC Macro, 2001). About three-quarters (78%) of children aged 6-9 months were given complementary food (timely complementary feeding). Virtually all children (98%) were breastfed for at least one year and 80% were still breastfed at 2 years of age (NSO and ORC Macro, 2005). Bottle-feeding is not recommended in Malawi even when breastfeeding is contraindicated, as for HIV positive mothers who chose replacement feeding. Although bottle-feeding is not a common practice in Malawi, this practice has become slightly more frequent between 2000 and 2004-2005 (NSO and ORC Macro, 2005). Great improvements have been made in infant and young child feeding practices since the early 1990s, particularly concerning exclusive breastfeeding. In 1992, exclusive breastfeeding was almost non-existent, regarding less than 2% of children under 6 months of age (NSO and Macro International Inc., 1994). In 2000, 45% of children under 6 months of age were exclusively breastfed and this rate increased to 53% in 2004-2005 (NSO and ORC Macro, 2001; NSO and ORC Macro, 2005).
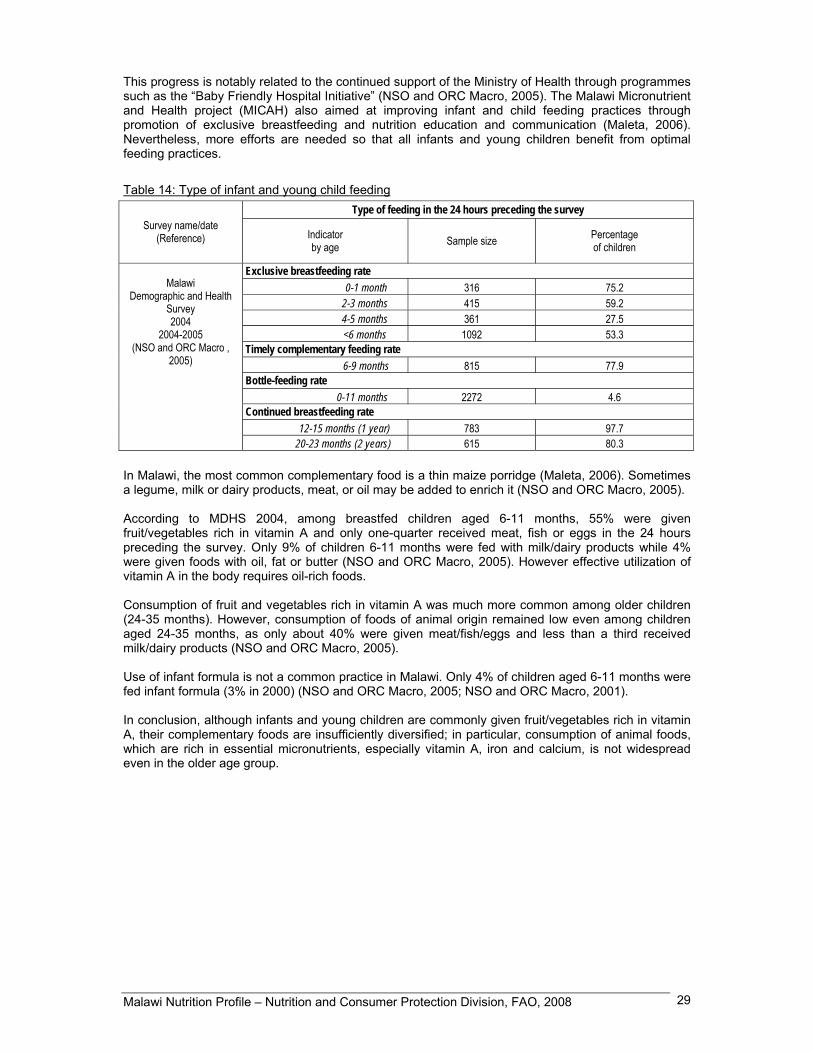
Malawi Nutrition Profile – Nutrition and Consumer Protection Division, FAO, 2008 29
This progress is notably related to the continued support of the Ministry of Health through programmes such as the “Baby Friendly Hospital Initiative” (NSO and ORC Macro, 2005). The Malawi Micronutrient and Health project (MICAH) also aimed at improving infant and child feeding practices through promotion of exclusive breastfeeding and nutrition education and communication (Maleta, 2006). Nevertheless, more efforts are needed so that all infants and young children benefit from optimal feeding practices.
Table 14: Type of infant and young child feeding Type of feeding in the 24 hours preceding the survey
Survey name/date (Reference) Indicator
by age Sample size Percentage of children
Exclusive breastfeeding rate 0-1 month 316 75.2 2-3 months 415 59.2 4-5 months 361 27.5 <6 months 1092 53.3
Timely complementary feeding rate 6-9 months 815 77.9
Bottle-feeding rate 0-11 months 2272 4.6
Continued breastfeeding rate 12-15 months (1 year) 783 97.7
Malawi
Demographic and Health Survey 2004
2004-2005 (NSO and ORC Macro ,
2005)
20-23 months (2 years) 615 80.3 In Malawi, the most common complementary food is a thin maize porridge (Maleta, 2006). Sometimes a legume, milk or dairy products, meat, or oil may be added to enrich it (NSO and ORC Macro, 2005). According to MDHS 2004, among breastfed children aged 6-11 months, 55% were given fruit/vegetables rich in vitamin A and only one-quarter received meat, fish or eggs in the 24 hours preceding the survey. Only 9% of children 6-11 months were fed with milk/dairy products while 4% were given foods with oil, fat or butter (NSO and ORC Macro, 2005). However effective utilization of vitamin A in the body requires oil-rich foods. Consumption of fruit and vegetables rich in vitamin A was much more common among older children (24-35 months). However, consumption of foods of animal origin remained low even among children aged 24-35 months, as only about 40% were given meat/fish/eggs and less than a third received milk/dairy products (NSO and ORC Macro, 2005). Use of infant formula is not a common practice in Malawi. Only 4% of children aged 6-11 months were fed infant formula (3% in 2000) (NSO and ORC Macro, 2005; NSO and ORC Macro, 2001). In conclusion, although infants and young children are commonly given fruit/vegetables rich in vitamin A, their complementary foods are insufficiently diversified; in particular, consumption of animal foods, which are rich in essential micronutrients, especially vitamin A, iron and calcium, is not widespread even in the older age group.

Malawi Nutrition Profile – Nutrition and Consumer Protection Division, FAO, 2008 30
Table 15: Consumption of complementary foods, and meal frequency by breastfeeding status and age Foods consumed by children in the 24 hours preceding the
survey Percent of children having consumed the following foods Survey
name/date (Reference)
Age (months)
Breastfeeding status*
Number of
children Infant formula
Other milk and dairy products
Pulses Meat/ fish/ eggs
Foods with oil/
fat/butter
Fruits and vegetables rich in vit. A
Mean number
of meals per day
6-11 BF 1165 4.4 9.0 19.4 25.7 3.8 54.5 n.a.
12-23 BF 1911 4.2 10.4 35.2 42.1 7.3 85.0 n.a.
Malawi
Demographic and Health
Survey 2004
2004-2005 (NSO and ORC Macro , 2005)
24-35 BF 277 2.2 29.6 33.7 39.3 6.0 90.2 n.a.
* Breastfed children (BF) or non breastfed children (NBF) or breastfed and non breastfed taken together n.a.: not available Inadequate infant and young child feeding practices (low exclusive breastfeeding rate, late introduction of complementary foods, low consumption of micronutrient-rich complementary foods) are immediate causes of the high prevalence of malnutrition among young Malawian children and determining factors of the very high infant mortality rate observed in the country. Hence, great efforts are necessary to improve these practices.
II.5 Nutritional anthropometry
Low birth weight (less than 2 500 g) According to the 2004 MDHS, the prevalence of low birth weight among all surveyed children born in the five years preceding the survey was 5%. However, birth weight was reported for less than one-half (49%) of the births (NSO and ORC Macro, 2005). In Malawi, many women do not deliver at a health facility, and hence neonates are not weighed at birth. In addition, the majority of the children weighed at birth were born in a favourable environment, in urban areas and/or of mothers having a higher educational level (NSO and ORC Macro, 2005). Consequently, the prevalence of low birth weight may be considerably underestimated. According to mother’s own assessment of their child’s size at birth, 12% of neonates were considered to be smaller than average and 4% were considered very small (NSO and ORC Macro, 2005). It is not possible to establish reliable trends for the prevalence of low birth weight as the percentage of weighed births increased between the consecutive MDHS. Low birth weight (LBW) results from preterm birth and/or intra-uterine growth retardation (IUGR), the major attributable causes of IUGR including the mother’s low weight gain, low body mass index (BMI), short stature and malaria. LBW is closely associated with neonatal mortality and morbidity, inhibited growth and cognitive development, and chronic diseases later in life (UNICEF and WHO, 2004 ; WHO, 2002).
Anthropometry of preschool children Four national surveys have been conducted in Malawi to assess the prevalence of malnutrition among preschool children: the Malawi National Nutrition Survey (MNNS) conducted in December 2005, the 2004 Malawi Demographic and Health Survey (MDHS), the 2000 MDHS and the 1992 MDHS (GoM

Malawi Nutrition Profile – Nutrition and Consumer Protection Division, FAO, 2008 31
and UNICEF, 2005; NSO and ORC Macro, 2005; NSO and ORC Macro, 2001; NSO and Macro International Inc., 1994). The MNNS assessed the nutritional status of children aged 6-59 month and showed a prevalence of stunting of 43% (18% of children were severely stunted). The prevalence of underweight was 22% and that of wasting was 5% (data not shown as sample size and disaggregated data were not available) (GoM and UNICEF, 2005). According to the 2004 MDHS conducted between October 2004 and January 2005, the prevalence of stunting among children under five years of age was 48%, the prevalence of wasting was 5% and that of underweight was estimated at 22% (NSO and ORC Macro, 2005). Thus the 2004 and 2005 surveys yielded very similar estimates. According to the threshold defined by WHO, the reported prevalence of stunting (≥ 40%) places the country at a very high level of chronic malnutrition (WHO, 1995). According to the MDHS 2004, almost half of children under five years of age were stunted and more than one-fifth (22%) were severely stunted. Boys were slightly more likely to be stunted than girls. As is typical, the prevalence of stunting increased during the first two years of life. The deterioration of nutritional status began shortly after birth and a rapid worsening in the linear growth of children took place during the first year, particularly late in the first year, and continued through the second year, when the prevalence of stunting peaked at 61%. After 2 years of age, the prevalence of stunting remained high (NSO and ORC Macro, 2005). Deterioration of nutritional status during the first year of life could be attributed to inappropriate complementary feeding practices, cumulative effects of illness and lack of access to health care. The prevalence of stunting was significantly higher among children living in rural areas (49%) when compared to those living in urban areas (38%). Regional variations in prevalence were substantial: stunting was extremely prevalent in the Central region, where 53% of under-fives were stunted and 25% were severely stunted (NSO and ORC Macro, 2005). Despite having higher per capita energy supply (according to the consumption module from ISH2 2004-2005) and a lower incidence of poverty (see I.5 Level of development, poverty), the Central region exhibits a higher prevalence of stunting (RoM and WB, 2006). This observation suggests a strong implication of other factors - including recurrent illness, inadequate infant and young child feeding practices, lack of mother’s knowledge of health and nutritional matters, lack of diet diversity - on nutritional status of young children living in this region. Differentials among districts in the prevalence of stunting were also substantial. Stunting was extremely prevalent in Kasungu where 56% of children were stunted and where severe stunting affected more than one-quarter (27%) of under-fives (NSO and ORC Macro, 2005). Kasungu is known as the grain basket of Malawi due to its relatively large share in national maize production. However, many villages of this district have experienced chronic food shortages since 2001 (R&D and FIAN, 2006). The prevalence of stunting was also particularly high in the capital district Lilongwe (52%) (NSO and ORC Macro, 2005). Kasungu and Lilongwe are located in the Central region of Malawi. Mother’s education appears to be linked to nutritional status of children: the prevalence of stunting was 52% among children of mothers with no education and 33% among children of mothers with secondary or higher education (NSO and ORC Macro, 2005). This relation should not be interpreted as a direct effect of mothers’ education on stunting, as the relationship is confounded by a higher socio-economic status of educated mothers. At national level, in 2004-2005 the prevalence of wasting was 5% and that of severe wasting 2% (NSO and ORC Macro, 2005). Acute malnutrition (wasting) reflects the nutritional situation at the time of the survey and hence can be strongly influenced by the period during which data collection took place. Data collection of MDHS 2004-2005 occured between October 2004 and January 2005, partly during the period of food shortage which generally extends from December to March. The prevalence of wasting was similar for boys and girls. Prevalence peaked at 8% among children aged 6-12 months, probably due to inadequate complementary feeding practices and high morbidity. In contrast with the prevalence of stunting which was much higher in rural areas than in urban areas, the prevalence of wasting was similar in urban and rural areas. The prevalence was highest in the Northern region. In Thyolo district, the prevalence reached 9% while in Mangochi district the prevalence (2.5%) was statistically insignificant (NSO and ORC Macro, 2005).
Malawi Nutrition Profile – Nutrition and Consumer Protection Division, FAO, 2008 32
Comparison of the three national surveys of 1992, 2000 and 2004-2005 shows that the prevalence of stunting and that of wasting have remained stable, indicating that there has been no improvement in the nutritional status of preschool children since the early 1990s (NSO and ORC Macro, 2005; NSO and ORC Macro, 2001; NSO and Macro International Inc., 1994). It should be noted that the 2004-2005 MDHS was conducted partially during the period of food shortage, differently form the 1992 and 2000 MDHS : this might explain the high prevalence of wasting observed in the more recent survey. Overall, between 2000 and 2004-2005 the prevalence of stunting remained stable at national level. However, in urban area the prevalence of stunting increased from 34% in 2000 to 39% in 2004-2005, whereas in rural areas this prevalence slightly decreased (51% in 2000 and 49% in 2004-2005) (NSO and ORC Macro, 2005; NSO and ORC Macro, 2001). In Malawi, many factors have a negative impact on the nutritional status of young children, among which inadequate infant feeding practices, a high disease burden exacerbated by the advent of the HIV/AIDS pandemic, and poor access to quality health care services. The country is also experiencing a situation of widespread food insecurity and poverty. These factors are among the main causes of malnutrition in Malawi. Trends in the nutritional status of preschool children are worrying and effort in addressing nutritional problems must be strengthened.

Malawi Nutrition Profile – Nutrition and Consumer Protection Division, FAO, 2008 33
Table 16: Anthropometry of preschool children Prevalence of malnutrition Percentage of children with
Stunting Wasting Underweight Overweight Height-for-age Weight-for-height Weight-for-age Weight-for-height
Name/date of survey
(month/year) (Reference)
Background characteristics
Age (years) Sex Sample
size
< -3 Z-scores < -2 Z-scores* < -3 Z-scores < -2 Z-scores* < -3 Z-scores < -2 Z-scores* > +2 Z-scores Total 0-4.99 M/F 8520 22.2 47.8 1.6 5.2 4.5 22.0 n.a. Sex 0-4.99 M 4221 23.8 50.0 1.9 5.5 4.5 22.4 n.a. 0-4.99 F 4299 20.7 45.6 1.4 4.8 4.5 21.6 n.a. Age 0-0.49 M/F 758 1.9 11.6 0.9 4.0 0.5 2.1 n.a. 0.5-0.99 M/F 956 9.8 32.3 2.8 8.1 4.4 22.6 n.a. 1-1.99 M/F 1886 30.3 60.7 1.8 6.8 7.4 28.8 n.a. 2-2.99 M/F 1588 24.2 47.7 1.9 5.3 5.4 25.1 n.a. 3-3.99 M/F 1645 24.8 52.9 1.1 3.1 3.9 20.3 n.a. 4-4.99 M/F 1689 25.0 53.5 1.3 4.1 3.1 21.8 n.a. Residence Urban 0-4.99 M/F 1071 15.8 37.8 1.6 5.9 3.2 16.8 n.a. Rural 0-4.99 M/F 7449 23.1 49.2 1.6 5.1 4.7 22.8 n.a. Region Northern 0-4.99 M/F 1210 19.0 42.4 1.2 5.9 4.3 17.7 n.a. Central 0-4.99 M/F 3330 24.8 52.7 0.9 3.6 4.2 22.5 n.a. Southern 0-4.99 M/F 3980 21.1 45.3 2.4 0.3 4.9 23.0 n.a. Region (districts) Blantyre 0-4.99 M/F 579 18.1 40.2 2.8 4.8 3.6 17.0 n.a. Kasungu 0-4.99 M/F 447 27.0 56.1 0.8 4.0 5.1 21.3 n.a. Machinga 0-4.99 M/F 376 19.6 44.8 1.4 6.0 3.8 21.4 n.a. Mangochi 0-4.99 M/F 512 24.2 48.3 0.1 2.5 5.7 23.6 n.a. Mzimba 0-4.99 M/F 614 23.0 46.8 1.1 4.1 4.2 17.9 n.a. Salima 0-4.99 M/F 264 23.8 49.3 1.0 5.2 4.9 20.6 n.a. Thyolo 0-4.99 M/F 414 24.3 48.1 3.1 8.7 5.0 22.2 n.a. Zomba 0-4.99 M/F 476 19.8 42.3 2.6 7.6 3.6 22.0 n.a. Lilongwe 0-4.99 M/F 952 24.3 52.3 1.1 4.7 3.0 24.5 n.a. Mulanje 0-4.99 M/F 329 23.3 50.5 1.9 6.0 6.4 26.5 n.a. Other districts 0-4.99 M/F 3557 21.5 47.5 1.7 5.1 4.9 22.5 n.a. Mother's education No education 0-4.99 M/F 2130 25.6 52.4 2.1 5.8 6.6 26.2 n.a. Primary 0-4.99 M/F 4994 21.6 47.6 1.6 5.0 4.1 21.6 n.a.
Malawi Demographic
and Health Survey 2004
(Oct. 2004 – Jan. 2005)
(NSO andORC Macro,2005)
Secondary or higher 0-4.99 M/F 841 13.0 33.1 1.2 4.8 2.1 12.9 n.a. * Category <-2 Z-scores includes <-3 Z-scores; n.a.: not available

Malawi Nutrition Profile – Nutrition and Consumer Protection Division, FAO, 2008 34
Table 16: Anthropometry of preschool children (cont.) Prevalence of malnutrition Percentage of children with
Stunting Wasting Underweight Overweight Height-for-age Weight-for-height Weight-for-age Weight-for-height
Name/date of survey (month/year) (Reference)
Background characteristics
Age (years) Sex Sample
size
< -3 Z-scores < -2 Z-scores* < -3 Z-scores < -2 Z-scores* < -3 Z-scores < -2 Z-scores* > +2 Z-scores Total 0-4.99 M/F 9318 24.4 49.0 1.2 5.5 5.9 25.4 n.a. Sex 0-4.99 M 4622 25.8 50.5 1.2 5.1 6.0 25.7 n.a. 0-4.99 F 4696 23.0 47.6 1.3 6.0 5.7 25.1 n.a. Age 0-0.49 M/F 1005 3.0 11.4 1.3 5.8 1.3 5.9 n.a. 0.5-0.99 M/F 1114 11.3 28.2 2.2 9.4 5.5 25.7 n.a. 1-1.99 M/F 2022 29.6 57.8 1.8 9.9 9.5 36.6 n.a. 2-2.99 M/F 1930 29.4 55.6 1.1 4.8 8.8 31.1 n.a. 3-3.99 M/F 1804 30.8 59.1 0.7 2.1 3.4 21.3 n.a. 4-4.99 M/F 1443 27.6 57.4 0.6 1.5 3.5 20.5 n.a. Residence Urban 0-4.99 M/F 1220 13.5 34.2 0.9 4.9 1.4 12.8 n.a. Rural 0-4.99 M/F 8098 26.1 51.2 1.3 5.6 6.5 27.3 n.a. Region Northern 0-4.99 M/F 1027 16.2 39.0 1.0 4.7 3.4 17.4 n.a. Central 0-4.99 M/F 4017 30.2 55.5 1.2 5.0 6.7 27.9 n.a. Southern 0-4.99 M/F 4273 20.9 45.3 1.3 6.2 5.7 25.0 n.a. Region (districts) Blantyre 0-4.99 M/F 666 13.5 38.1 1.2 6.7 3.8 18.0 n.a. Karonga 0-4.99 M/F 193 14.6 38.8 0.4 5.2 3.1 16.0 n.a. Kasungu 0-4.99 M/F 385 20.9 47.4 0.6 2.7 2.8 20.7 n.a. Lilongwe 0-4.99 M/F 1416 31.6 54.2 1.6 5.9 7.2 27.6 n.a. Machinga 0-4.99 M/F 367 22.0 44.5 0.3 3.3 3.4 24.5 n.a. Mangochi 0-4.99 M/F 488 24.2 47.5 1.1 5.7 8.5 28.8 n.a. Mulanje 0-4.99 M/F 418 26.1 49.5 1.1 4.0 5.2 27.7 n.a. Mzimba 0-4.99 M/F 424 17.8 43.9 1.1 4.0 3.3 18.7 n.a. Salima 0-4.99 M/F 202 25.6 54.6 1.8 5.7 8.8 29.0 n.a. Thyolo 0-4.99 M/F 418 23.3 46.3 1.0 4.5 5.5 25.9 n.a. Zomba 0-4.99 M/F 574 21.4 45.7 2.4 7.7 7.8 24.6 n.a. Other districts 0-4.99 M/F 3767 25.8 51.3 1.1 5.8 6.0 26.9 n.a. Mother's education No education 0-4.99 M/F 2998 28.5 54.2 1.2 6.6 6.9 29.0 n.a. Primary 0-4.99 M/F 5688 24.0 48.7 1.3 5.0 5.7 25.2 n.a.
Malawi
Demographic and Health Survey
2000 (July-Nov., 2000) (NSO and ORC Macro, 2001)
Secondary or higher 0-4.99 M/F 632 8.4 27.1 1.1 5.6 2.1 9.8 n.a. * Category <-2 Z-scores includes <-3 Z-scores; n.a.: not available

Malawi Nutrition Profile – Nutrition and Consumer Protection Division, FAO, 2008 35
Table 16: Anthropometry of preschool children (cont.) Prevalence of malnutrition Percentage of children with
Stunting Wasting Underweight Overweight Height-for-age Weight-for-height Weight-for-age Weight-for-height
Name/date of survey
(month/year) (Reference)
Background characteristics
Age (years) Sex Sample
size
< -3 Z-scores < -2 Z-scores* < -3 Z-scores < -2 Z-scores* < -3 Z-scores < -2 Z-scores* > +2 Z-scores Total 0-4.99 M/F 3235 22.9 48.7 1.4 5.4 7.6 27.2 n.a. Sex
0-4.99 M 1615 24.5 50.9 2.0 6.0 8.5 28.3 n.a. 0-4.99 F 1620 21.4 46.5 0.9 4.9 6.7 26.1 n.a. Age 0-0.49 M/F 418 2.1 10.4 0.8 2.4 0.5 2.2 n.a. 0.5-0.99 M/F 409 8.5 26.9 3.1 7.0 8.6 23.4 n.a. 1-1.99 M/F 692 24.1 52.0 2.2 11.2 11.4 37.5 n.a. 2-2.99 M/F 586 28.7 59.5 1.2 3.9 10.2 35.5 n.a. 3-3.99 M/F 553 35.0 66.3 0.4 2.6 7.0 30.3 n.a. 4-4.99 M/F 577 29.4 60.1 1.0 3.9 5.4 24.2 n.a. Residence Urban 0-4.99 M/F 345 11.1 35.0 1.0 2.6 3.6 15.4 n.a. Rural 0-4.99 M/F 2890 24.3 50.3 1.5 5.8 8.1 28.6 n.a. Region Northern 0-4.99 M/F 390 17.5 44.7 0.4 3.5 5.0 20.3 n.a. Central 0-4.99 M/F 1314 25.0 50.5 1.0 4.5 6.8 25.0 n.a. Southern 0-4.99 M/F 1531 22.5 48.1 2.1 6.7 8.9 30.8 n.a. Mother's education No education 0-4.99 M/F 1669 26.4 51.7 1.9 6.2 9.0 30.7 n.a. Primary 0-4.99 M/F 1471 20.0 47.2 1.0 4.7 6.5 24.3 n.a.
Malawi
Demographic and Health Survey
1992 (Sept.-Nov., 1992) (NSO and Macro International Inc.,
1994)
Secondary or higher 0-4.99 M/F (95) (6.1) (19.3) (0.7) (3.4) (1.2) (10.7) n.a. * Category <-2 Z-scores includes <-3 Z-scores; n.a.: not available Results in parenthesis are based on small samples and therefore must be interpreted with caution.

Malawi Nutrition Profile – Nutrition and Consumer Protection Division, FAO, 2008 36
Anthropometry of school-age children There is currently no data available on anthropometry of school-age children in Malawi.
Anthropometry of adolescents There is currently no data available on anthropometry of adolescents in Malawi.
Anthropometry of adult women Three national representative surveys provide information on women’s nutritional status: the 1992 MDHS, the 2000 MDHS and the 2004 MDHS (NSO and Macro International Inc., 1994; NSO and ORC Macro, 2001; NSO and ORC Macro, 2005). According to the 2004 MDHS, the mean height for women was 156 cm, with only 3% of women falling below the cutoff point (145 cm). The mean body mass index (BMI) for adult women was 22 kg/m2 (NSO and ORC Macro, 2005). Among adult women, in 2004-2005, 9% had a BMI below 18.5 kg/m2, reflecting chronic energy deficiency (CED). Differences in prevalence of CED by background characteristics were large. Young women aged 15-19 years were more likely to be affected than older women. Women living in rural areas were almost twice as likely to have CED than women living in urban areas. Variations in CED across regions and districts were substantial. The prevalence of CED was higher in the Southern region. In Mulanje and Mangochi districts the prevalence of CED (13%) was more than double the prevalence reported in Lilongwe (6%). CED was more prevalent among less educated women (NSO and ORC Macro, 2005). The prevalence of CED among women and the prevalence of stunting during the first 6 months of life (10%) could be related, the latter being a consequence of intra-uterine growth retardation in pregnant women suffering from undernutrition. At national level, the prevalence of overweight (BMI 25.0-29.9 kg/m2) and obesity (BMI ≥ 30.0 kg/m2) was 14%. The prevalence of overweight increased with age and was higher among women living in urban areas (17%) than among those living in rural areas (10%). The prevalence of overweight was high in Blantyre (15%), Zomba (14%) and Lilongwe (14%). The likelihood of a woman of being overweight was positively related to her educational level (NSO and ORC Macro, 2005). Overall, among adult women at national level, the prevalence of overweight and obesity (14%) was higher than the prevalence of CED (9%), indicating that Malawi is undergoing a nutrition transition, primarily in urban areas, but also emerging in rural areas. Comparison of the two national surveys conducted in 2000 and 2004-2005 shows that the prevalence of CED among women aged 15-49 remained stable between 2000 and 2004-2005 (9%). This prevalence remained stable in urban and in rural areas. The 1992 MDHS can not be compared to the other surveys as the sample represents mothers with a birth in the five years preceding the survey as opposed to all women in the other surveys. Regarding prevalence of overweight and obesity, it appears that there were also no substantial changes, apart from a slight increase in the rural sector (NSO and ORC Macro, 2005; NSO and ORC Macro, 2001).
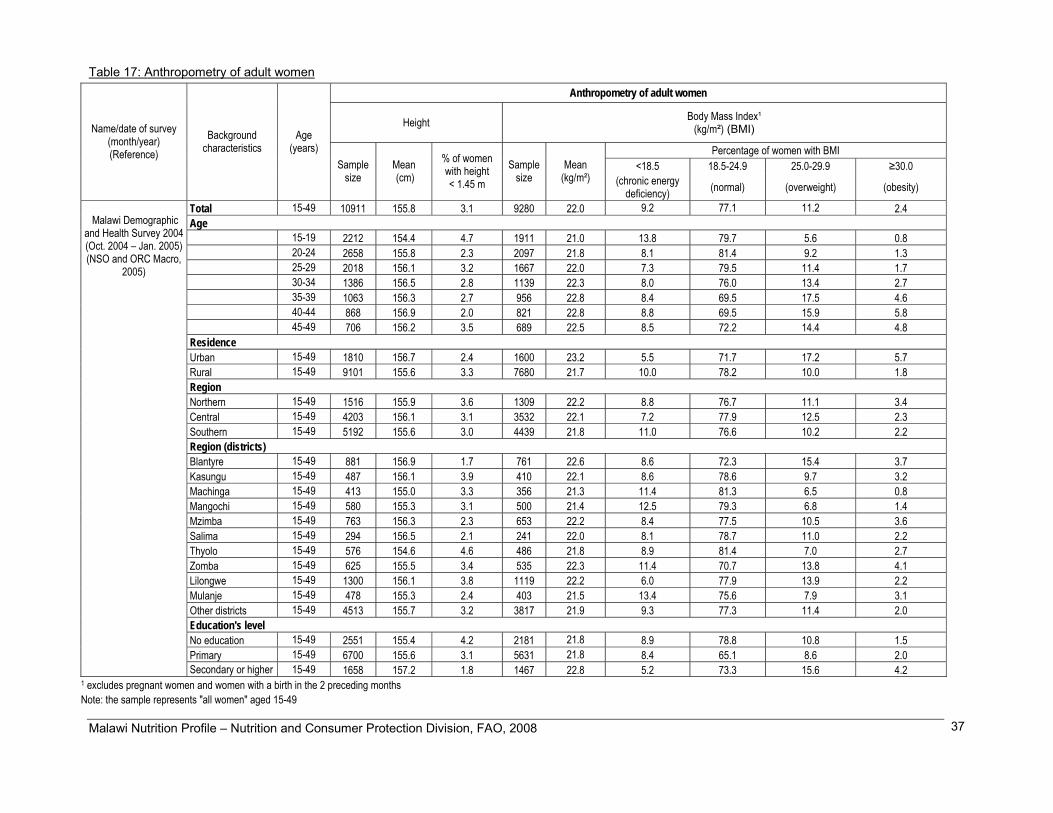
Malawi Nutrition Profile – Nutrition and Consumer Protection Division, FAO, 2008 37
Table 17: Anthropometry of adult women Anthropometry of adult women
Height Body Mass Index¹ (kg/m²) (BMI)
Percentage of women with BMI <18.5 18.5-24.9 25.0-29.9 ≥30.0
Name/date of survey (month/year) (Reference)
Background characteristics
Age (years)
Sample size
Mean (cm)
% of women with height < 1.45 m
Sample size
Mean (kg/m²) (chronic energy
deficiency) (normal) (overweight) (obesity)
Total 15-49 10911 155.8 3.1 9280 22.0 9.2 77.1 11.2 2.4 Age 15-19 2212 154.4 4.7 1911 21.0 13.8 79.7 5.6 0.8 20-24 2658 155.8 2.3 2097 21.8 8.1 81.4 9.2 1.3 25-29 2018 156.1 3.2 1667 22.0 7.3 79.5 11.4 1.7 30-34 1386 156.5 2.8 1139 22.3 8.0 76.0 13.4 2.7 35-39 1063 156.3 2.7 956 22.8 8.4 69.5 17.5 4.6 40-44 868 156.9 2.0 821 22.8 8.8 69.5 15.9 5.8 45-49 706 156.2 3.5 689 22.5 8.5 72.2 14.4 4.8 Residence Urban 15-49 1810 156.7 2.4 1600 23.2 5.5 71.7 17.2 5.7 Rural 15-49 9101 155.6 3.3 7680 21.7 10.0 78.2 10.0 1.8 Region Northern 15-49 1516 155.9 3.6 1309 22.2 8.8 76.7 11.1 3.4 Central 15-49 4203 156.1 3.1 3532 22.1 7.2 77.9 12.5 2.3 Southern 15-49 5192 155.6 3.0 4439 21.8 11.0 76.6 10.2 2.2 Region (districts) Blantyre 15-49 881 156.9 1.7 761 22.6 8.6 72.3 15.4 3.7 Kasungu 15-49 487 156.1 3.9 410 22.1 8.6 78.6 9.7 3.2 Machinga 15-49 413 155.0 3.3 356 21.3 11.4 81.3 6.5 0.8 Mangochi 15-49 580 155.3 3.1 500 21.4 12.5 79.3 6.8 1.4 Mzimba 15-49 763 156.3 2.3 653 22.2 8.4 77.5 10.5 3.6 Salima 15-49 294 156.5 2.1 241 22.0 8.1 78.7 11.0 2.2 Thyolo 15-49 576 154.6 4.6 486 21.8 8.9 81.4 7.0 2.7 Zomba 15-49 625 155.5 3.4 535 22.3 11.4 70.7 13.8 4.1 Lilongwe 15-49 1300 156.1 3.8 1119 22.2 6.0 77.9 13.9 2.2 Mulanje 15-49 478 155.3 2.4 403 21.5 13.4 75.6 7.9 3.1 Other districts 15-49 4513 155.7 3.2 3817 21.9 9.3 77.3 11.4 2.0 Education's level No education 15-49 2551 155.4 4.2 2181 21.8 8.9 78.8 10.8 1.5 Primary 15-49 6700 155.6 3.1 5631 21.8 8.4 65.1 8.6 2.0
Malawi Demographic
and Health Survey 2004 (Oct. 2004 – Jan. 2005) (NSO and ORC Macro,
2005)
Secondary or higher 15-49 1658 157.2 1.8 1467 22.8 5.2 73.3 15.6 4.2 1 excludes pregnant women and women with a birth in the 2 preceding months Note: the sample represents "all women" aged 15-49

Malawi Nutrition Profile – Nutrition and Consumer Protection Division, FAO, 2008 38
Table 17: Anthropometry of adult women (cont.) Anthropometry of adult women
Height Body Mass Index¹ (kg/m²) (BMI)
Percentage of women with BMI <18.5 18.5-24.9 > 25.0
Name/date of survey (month/year) (Reference)
Background characteristics
Age (years)
Sample size
Mean (cm)
% of women with height < 1.45 m
Sample size
Mean (kg/m²)
(chronic energy deficiency) (normal) (overweight and obesity) Total 15-49 13036 155.8 3.0 11125 21.9 8.8 79.4 11.8 Age 15-19 2805 154.5 4.9 2457 20.9 16.6 78.1 5.3 20-24 2913 155.9 2.7 2276 21.8 6.7 83.8 9.5 25-29 2379 155.9 2.6 1947 22.1 6.0 80.8 13.2 30-34 1549 156.6 2.1 1301 22.2 7.2 79.4 13.4 35-39 1409 156.1 2.1 1259 22.7 5.6 75.1 19.3 40-44 1042 156.2 2.6 976 22.6 6.1 76.1 17.8 45-49 938 156.2 2.0 910 22.2 8.3 78.3 13.4 Residence Urban 15-49 2089 157.0 1.9 1845 23.2 5.5 71.1 23.4 Rural 15-49 10947 155.5 3.2 9280 21.6 9.4 81.1 9.5 Region Northern 15-49 1438 155.3 3.6 1227 21.9 7.5 82.4 10.1 Central 15-49 5236 156.1 2.5 4416 22.0 7.7 80.3 12.0 Southern 15-49 6362 155.5 3.3 5482 21.8 9.9 78.0 12.1 Region (districts) Blantyre 15-49 1305 157.0 1.6 1155 22.9 6.5 70.7 22.8 Karonga 15-49 262 155.7 4.3 223 22.0 8.0 80.0 12.0 Kasungu 15-49 475 156.2 2.8 391 22.1 8.2 78.6 13.2 Lilongwe 15-49 1844 156.7 1.4 1554 22.4 5.1 79.3 15.6 Machinga 15-49 472 155.3 2.1 386 21.4 11.7 76.8 11.5 Mangochi 15-49 630 154.7 4.4 541 21.6 9.7 79.3 11.0 Mulanje 15-49 614 154.8 3.7 540 21.4 12.8 78.0 9.2 Mzimba 15-49 596 155.4 2.9 509 21.8 7.8 82.4 9.8 Salima 15-49 292 155.4 3.4 242 21.4 12.3 79.9 7.8 Thyolo 15-49 680 155.0 4.1 587 21.4 10.9 81.4 7.7 Zomba 15-49 841 155.5 2.9 730 21.7 8.4 81.2 10.4 Other districts 15-49 5023 155.5 3.5 4268 21.7 9.6 81.3 9.1 Education's level No education 15-49 3517 155.4 3.2 2987 21.8 7.6 82.3 10.1 Primary 15-49 8067 155.5 3.2 6824 21.7 10.0 79.9 10.1
Malawi
Demographic and Health Survey
2000 (July-Nov., 2000)
(NSO and ORC Macro, 2001)
Secondary or higher 15-49 1452 158.0 1.2 1315 23.2 5.2 70.3 24.5 1 excludes pregnant women and women with a birth in the 2 preceding months Note: the sample represents "all women" aged 15-49; n.a.: not available

Malawi Nutrition Profile – Nutrition and Consumer Protection Division, FAO, 2008 39
Table 17: Anthropometry of adult women (cont.) Anthropometry of adult women
Height Body Mass Index¹ (kg/m²) (BMI)
Percentage of women with BMI <18.5 18.5-24.9 ≥25.0 ≥30.0
Name/date of survey (month/year) (Reference)
Background characteristics
Age (years)
Sample size
Mean (cm)
% of women with height < 1.45 m
Sample size
Mean (kg/m²) (chronic energy
deficiency) (normal) (overweight) (obesity)
Total < 20- ≥35 2788 156.0 2.8 2200 21.7 9.8 n.a. n.a. n.a. Age < 20 291 154.8 3.0 226 21.0 13.4 n.a. n.a. n.a. 20-34 1784 156.1 2.9 1391 21.8 8.6 n.a. n.a. n.a. ≥35 713 156.0 2.5 583 21.8 11.0 n.a. n.a. n.a. Residence Urban < 20- ≥35 323 157.0 1.1 260 22.5 7.1 n.a. n.a. n.a. Rural < 20- ≥35 2465 155.8 3.0 1941 21.6 10.1 n.a. n.a. n.a. Regions Northern < 20- ≥35 335 155.5 3.2 266 22.2 7.2 n.a. n.a. n.a. Central < 20- ≥35 1137 156.4 2.2 879 22.2 7.3 n.a. n.a. n.a. Southern < 20- ≥35 1316 155.7 3.2 1055 21.1 12.4 n.a. n.a. n.a. Education's level No education < 20- ≥35 1432 155.5 3.5 1132 21.3 11.9 n.a. n.a. n.a. Primary < 20- ≥35 1264 156.2 2.3 988 22.0 7.5 n.a. n.a. n.a.
Malawi
Demographic and Health Survey
1992 (Sept.-Nov., 1992) (NSO and Macro International Inc.,
1994
Secondary or higher < 20- ≥35 (91) (159.3) (0.5) (80) (24.0) (7.2) n.a. n.a. n.a. 1 excludes pregnant women and women with a birth in the 2 preceding months Note: the sample represents mothers with a birth in the five years preceding the survey. n.a.: not available Results in parenthesis are based on small samples and therefore must be interpreted with caution.

Malawi Nutrition Profile – Nutrition and Consumer Protection Division, FAO, 2008 40
Anthropometry of adult men There is currently no data available on anthropometry of adult men in Malawi.
II.6 Micronutrient deficiencies
Iodine deficiency disorders (IDD)
Prevalence of goitre and urinary iodine level
Presently, no data on iodine deficiency disorders (IDD) are available at national level. The most recent survey providing information on IDD is a survey conducted in 1996 in 7 districts3 located in Northern and Central regions of Malawi (Mdebwe and Banda, 1996). The sample was comprised of 9 434 school-age children (age not specified), boys and girls, randomly selected from 32 schools. Among these children, total goitre rate was 28% (Mdebwe and Banda, 1996; WHO Database on iodine deficiency disorders). This prevalence indicated that IDD were a “moderate” public health problem in the selected districts (prevalence of goitre 20.0-29.9%) according to WHO criteria (WHO, 2001a). One-quarter of these school-age children were affected by goitre grade 1 and 3% had visible goitre (goitre grade 2). The prevalence of total goitre was slightly higher among girls than among boys. Children living in the districts of Ntcheu (Central region) and Chitipa (Northern region) had a higher prevalence of goitre than children living in other districts. IDD were a severe public health problem (prevalence of goitre ≥30%) in four districts out of seven (Mdebwe and Banda, 1996; WHO Database on iodine deficiency disorders; WHO, 2001a). Another survey conducted in 1996 measured urinary iodine concentration among school-age children aged 6-14 years (MICAH, not dated; WHO Database on iodine deficiency disorders). The sample was comprised of 685 children selected from households living in 14 districts4 of Malawi. Overall, the results indicated that median urinary iodine concentration was 140 µg/L, indicative of an adequate iodine status. The percentage of children with urinary iodine concentration <20 µg/L was estimated to be 16% (MICAH, not dated; WHO Database on iodine deficiency disorders; WHO, 2001a). High levels of IDD in Malawi might be related to low consumption of iodine-rich foods such as fish and to poor availability of iodine in the soil, especially in some parts of the country that are mountainous (Central region) where iodine levels in crops are consequently low. Updated and national representative data are necessary to assess the current nationwide magnitude of IDD as a public health problem in Malawi.
3 Districts included in this survey: Chitipa, Dedza, Lilongwe East, Mchinji, Mzimba, Ntcheu and Rumphi. 4 Districts included in this survey: Balaka, Chikwawa, Chiradzulu, Chitipa, Dedza, Lilongwe, Machinga, Mangochi, Mchinji, Mulanje, Mzimba, Ntcheu, Rumphi and Zomba.
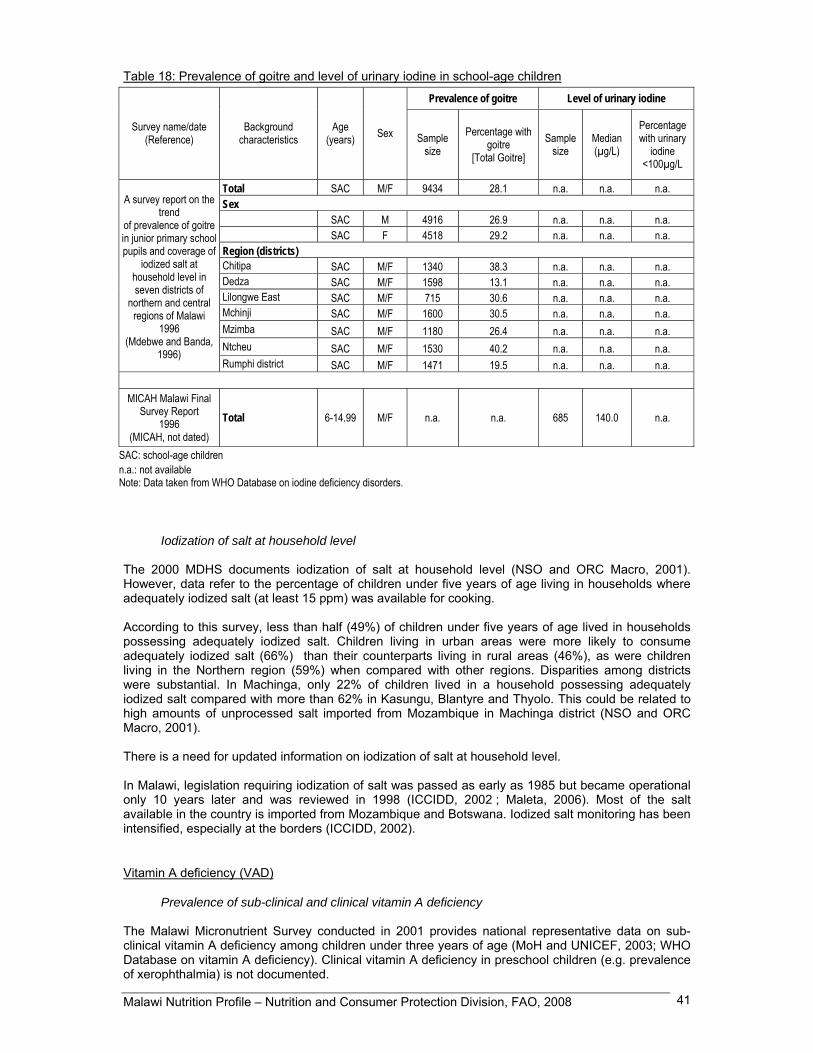
Malawi Nutrition Profile – Nutrition and Consumer Protection Division, FAO, 2008 41
Table 18: Prevalence of goitre and level of urinary iodine in school-age children
Prevalence of goitre Level of urinary iodine
Survey name/date (Reference)
Background characteristics
Age (years) Sex Sample
size Percentage with
goitre [Total Goitre]
Sample size
Median (µg/L)
Percentage with urinary
iodine <100µg/L
Total SAC M/F 9434 28.1 n.a. n.a. n.a. Sex SAC M 4916 26.9 n.a. n.a. n.a. SAC F 4518 29.2 n.a. n.a. n.a. Region (districts) Chitipa SAC M/F 1340 38.3 n.a. n.a. n.a. Dedza SAC M/F 1598 13.1 n.a. n.a. n.a. Lilongwe East SAC M/F 715 30.6 n.a. n.a. n.a. Mchinji SAC M/F 1600 30.5 n.a. n.a. n.a. Mzimba SAC M/F 1180 26.4 n.a. n.a. n.a. Ntcheu SAC M/F 1530 40.2 n.a. n.a. n.a.
A survey report on the
trend of prevalence of goitre in junior primary school pupils and coverage of
iodized salt at household level in seven districts of
northern and central regions of Malawi
1996 (Mdebwe and Banda,
1996) Rumphi district SAC M/F 1471 19.5 n.a. n.a. n.a.
MICAH Malawi Final
Survey Report 1996
(MICAH, not dated) Total 6-14.99 M/F n.a. n.a. 685 140.0 n.a.
SAC: school-age children n.a.: not available Note: Data taken from WHO Database on iodine deficiency disorders.
Iodization of salt at household level The 2000 MDHS documents iodization of salt at household level (NSO and ORC Macro, 2001). However, data refer to the percentage of children under five years of age living in households where adequately iodized salt (at least 15 ppm) was available for cooking. According to this survey, less than half (49%) of children under five years of age lived in households possessing adequately iodized salt. Children living in urban areas were more likely to consume adequately iodized salt (66%) than their counterparts living in rural areas (46%), as were children living in the Northern region (59%) when compared with other regions. Disparities among districts were substantial. In Machinga, only 22% of children lived in a household possessing adequately iodized salt compared with more than 62% in Kasungu, Blantyre and Thyolo. This could be related to high amounts of unprocessed salt imported from Mozambique in Machinga district (NSO and ORC Macro, 2001). There is a need for updated information on iodization of salt at household level. In Malawi, legislation requiring iodization of salt was passed as early as 1985 but became operational only 10 years later and was reviewed in 1998 (ICCIDD, 2002 ; Maleta, 2006). Most of the salt available in the country is imported from Mozambique and Botswana. Iodized salt monitoring has been intensified, especially at the borders (ICCIDD, 2002).
Vitamin A deficiency (VAD)
Prevalence of sub-clinical and clinical vitamin A deficiency The Malawi Micronutrient Survey conducted in 2001 provides national representative data on sub-clinical vitamin A deficiency among children under three years of age (MoH and UNICEF, 2003; WHO Database on vitamin A deficiency). Clinical vitamin A deficiency in preschool children (e.g. prevalence of xerophthalmia) is not documented.

Malawi Nutrition Profile – Nutrition and Consumer Protection Division, FAO, 2008 42
According to this survey, 59% of children aged 0.5-3.07 years had serum retinol level below the cutoff point of 0.70 µmol/L (MoH and UNICEF, 2003; WHO Database on vitamin A deficiency). Vitamin A deficiency is a public health problem in populations where the prevalence of low serum retinol in preschool children is above 15% (WHO, 1996). As a consequence, in 2001 vitamin A deficiency was identified as a severe public health problem in Malawi. In young children, sub-clinical and clinical vitamin A deficiencies increase the severity of common infections, particularly diarrhoea and measles, and increase the subsequent risk of death (WHO/FAO, 2004). The same survey revealed that boys were more likely to have sub-clinical vitamin A deficiency than girls. Differentials among regions were substantial, ranging from 40% of children with low serum retinol in the Northern region to 63% in the Central region (MoH and UNICEF, 2003; WHO Database on vitamin A deficiency). In the Northern region, the diet tends to be more diversified than in Central and Southern regions (see II.1 Surveys of dietary diversity and variety), and hence consumption of foods rich in vitamin A (animal products such as meat, milk, egg yolk, fruit and vegetables rich in vitamin A) may be more common among population living in the North. Moreover, the percentage of households owning poultry and cattle is significantly higher in the Northern region than elsewhere (PMS, 2000). The 2004 MDHS also revealed that a larger proportion of young children were given fruit and vegetables rich in vitamin A in the Northern region when compared to other regions (NSO and ORC Macro, 2005). These observations may explain the lower prevalence of sub-clinical vitamin A deficiency among young children living in this region. The 2001 Malawi Micronutrient Survey also provides data on sub-clinical vitamin A deficiency among school-age children, women and men (MoH and UNICEF, 2003). Prevalence of low serum retinol (<0.70 µmol/L) was 38% among children aged 6-13 years, 57% among women (15-49 years) and 37% among men (20-55 years) (MoH and UNICEF, 2003; WHO Database on vitamin A deficiency).
Table 19: Prevalence of vitamin A deficiency in preschool children
Prevalence of low level of serum retinol Clinical signs of xerophthalmia
Survey name/date (Reference)
Background characteristics
Age* (years) Sex
Sample size
Percentage with serum retinol
<0.70 µmol/L Sample
size Type of sign Percentage
Total 0.5-3.07 M/F 476 59.2 n.a. n.a. n.a. Sex 0.5-3.07 M 228 62.6 n.a. n.a. n.a. 0.5-3.07 F 248 55.9 n.a. n.a. n.a. Residence Urban 0.5-3.07 M/F (38) (58.0) n.a. n.a. n.a. Rural 0.5-3.07 M/F 438 59.3 n.a. n.a. n.a. Region Northern 0.5-3.07 M/F 149 40.3 n.a. n.a. n.a. Central 0.5-3.07 M/F 175 63.4 n.a. n.a. n.a.
Malawi
Micronutrient Survey 2001
2001 (MoH and
UNICEF, 2003)
Southern 0.5-3.07 M/F 152 59.9 n.a. n.a. n.a. Age*: 2-5 years or other non-standard age n.a.: not available. Notes: Data taken from WHO Database on vitamin A deficiency. Results in parenthesis are based on small samples and therefore must be interpreted with caution. Two national surveys document clinical vitamin A deficiency in mothers: the 2000 MDHS and the 2004 MDHS (NSO and ORC Macro, 2001; NSO and ORC Macro, 2005). According to the 2004 MDHS, 6% of mothers experienced night blindness, the most common manifestation of clinical vitamin A deficiency, during their last pregnancy. The prevalence of night blindness adjusted for daytime blindness was 1%, which is lower than the WHO level (5%) indicating that vitamin A deficiency is a public health problem (NSO and ORC Macro, 2005; WHO, 1996).

Malawi Nutrition Profile – Nutrition and Consumer Protection Division, FAO, 2008 43
In rural areas, prevalence adjusted for daytime blindness was three-fold (1.4%) that in urban areas (0.4%). Differences across regions were also marked (NSO and ORC Macro, 2005). Comparison with data from the 2000 MDHS shows that the non-adjusted percentage of night blindness (percentage adjusted not provided in the 2000 MDHS) seems to have slightly increased from 4% in 2000 to 6% in 2004-2005 (NSO and ORC Macro, 2005; NSO and ORC Macro, 2001). However, the small percentages and the large difference between the non-adjusted and adjusted percentages, make it difficult to assess trends in clinical vitamin A deficiency among mothers. The low prevalence of clinical signs does not preclude the existence of sub-clinical deficiency in this vulnerable population group. Table 20: Prevalence of vitamin A deficiency in mothers during their last pregnancy
Prevalence of night blindness during pregnancy¹ Survey name/date
(Reference) Background
characteristics Age
(years) Number of mothers Percentage non adjusted Percentage adjusted for daytime
blindness
Total 15-49 7271 5.8 1.2 Residence Urban 15-49 1041 2.2 0.4 Rural 15-49 6231 6.4 1.4 Region Northern 15-49 924 4.6 0.9 Central 15-49 2959 7.0 1.4 Southern 15-49 3389 5.1 1.2 Region (districts) Blantyre 15-49 520 3.1 0.9 Kasungu 15-49 330 5.6 0.9 Machinga 15-49 284 3.7 1.0 Mangochi 15-49 411 6.8 1.9 Mzimba 15-49 464 3.8 0.8 Salima 15-49 199 5.8 1.5 Thyolo 15-49 386 6.0 1.8 Zomba 15-49 389 5.1 0.3 Lilongwe 15-49 1013 6.9 0.9 Mulanje 15-49 296 4.3 1.3
Malawi
Demographic and Health Survey
2004 2004-2005
(NSO and ORC Macro, 2005)
Other districts 15-49 2981 6.6 1.5 ¹ During last pregnancy of women with a live birth in the 5 years preceding the survey. The very low contribution of animal products (which contain high amounts of absorbable retinol) to the diet and insufficient intake of fruit and vegetables rich in vitamin A may contribute to high levels of vitamin A deficiency in Malawi. Beta-carotene, the main provitamin in vegetable sources of vitamin A, which are more affordable than animal products, is generally less well absorbed than retinol. In addition to vitamin A obtained through the diet, vitamin A supplements may be received by children as part of primary prevention programmes. Women may get vitamin A supplements during the postpartum period to assist both the women and their breastfeeding children.
Vitamin A supplementation The 2004 MDHS and the 2000 MDHS document vitamin A supplementation among children and mothers at national level (NSO and ORC Macro, 2005; NSO and ORC Macro, 2001). In 2004-2005, 65% of children aged 6-59 months had received vitamin A supplements in the six months preceding the survey. There were substantial differences in supplementation according to children’s residence. Children living in rural areas were slightly less likely to receive vitamin A supplements than children living in urban areas. Supplementation coverage was lowest in Mzimba (53%) and Machinga (54%) districts (NSO and ORC Macro, 2005).
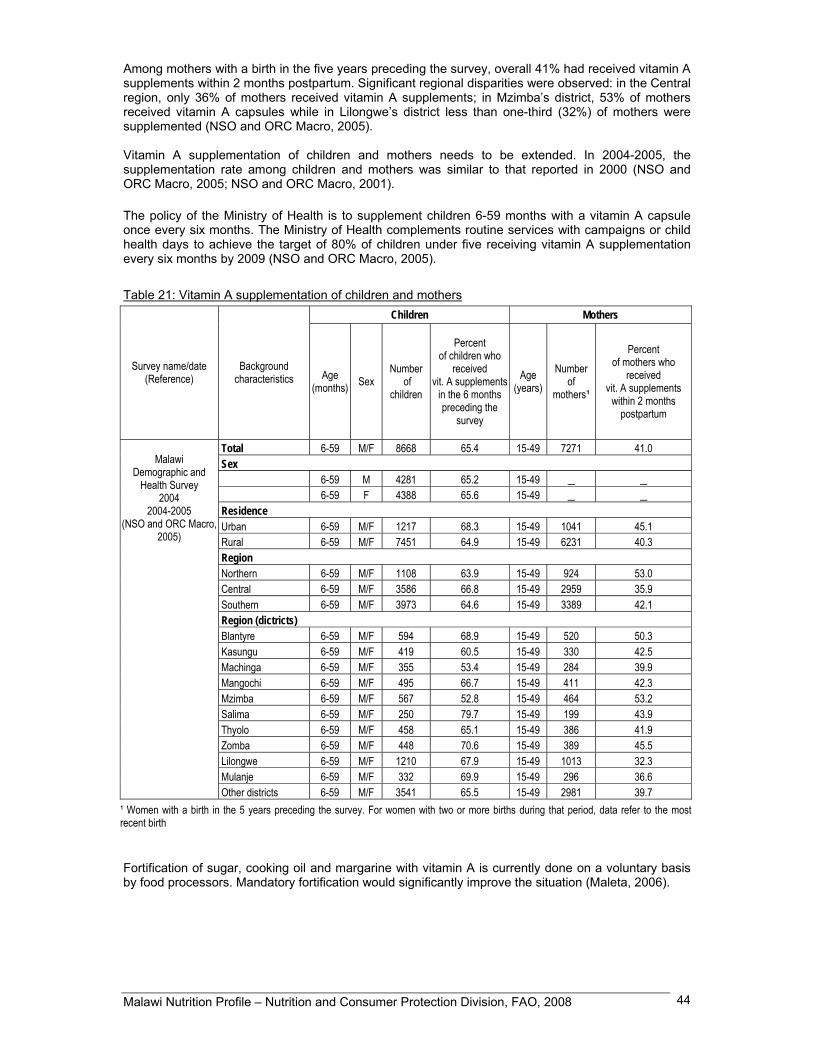
Malawi Nutrition Profile – Nutrition and Consumer Protection Division, FAO, 2008 44
Among mothers with a birth in the five years preceding the survey, overall 41% had received vitamin A supplements within 2 months postpartum. Significant regional disparities were observed: in the Central region, only 36% of mothers received vitamin A supplements; in Mzimba’s district, 53% of mothers received vitamin A capsules while in Lilongwe’s district less than one-third (32%) of mothers were supplemented (NSO and ORC Macro, 2005). Vitamin A supplementation of children and mothers needs to be extended. In 2004-2005, the supplementation rate among children and mothers was similar to that reported in 2000 (NSO and ORC Macro, 2005; NSO and ORC Macro, 2001). The policy of the Ministry of Health is to supplement children 6-59 months with a vitamin A capsule once every six months. The Ministry of Health complements routine services with campaigns or child health days to achieve the target of 80% of children under five receiving vitamin A supplementation every six months by 2009 (NSO and ORC Macro, 2005).
Table 21: Vitamin A supplementation of children and mothers Children Mothers
Survey name/date (Reference)
Background characteristics Age
(months) Sex Number
of children
Percent of children who
received vit. A supplements
in the 6 months preceding the
survey
Age (years)
Number of
mothers¹
Percent of mothers who
received vit. A supplements
within 2 months postpartum
Total 6-59 M/F 8668 65.4 15-49 7271 41.0 Sex 6-59 M 4281 65.2 15-49 _ _ 6-59 F 4388 65.6 15-49 _ _ Residence Urban 6-59 M/F 1217 68.3 15-49 1041 45.1 Rural 6-59 M/F 7451 64.9 15-49 6231 40.3 Region Northern 6-59 M/F 1108 63.9 15-49 924 53.0 Central 6-59 M/F 3586 66.8 15-49 2959 35.9 Southern 6-59 M/F 3973 64.6 15-49 3389 42.1 Region (dictricts) Blantyre 6-59 M/F 594 68.9 15-49 520 50.3 Kasungu 6-59 M/F 419 60.5 15-49 330 42.5 Machinga 6-59 M/F 355 53.4 15-49 284 39.9 Mangochi 6-59 M/F 495 66.7 15-49 411 42.3 Mzimba 6-59 M/F 567 52.8 15-49 464 53.2 Salima 6-59 M/F 250 79.7 15-49 199 43.9 Thyolo 6-59 M/F 458 65.1 15-49 386 41.9 Zomba 6-59 M/F 448 70.6 15-49 389 45.5 Lilongwe 6-59 M/F 1210 67.9 15-49 1013 32.3 Mulanje 6-59 M/F 332 69.9 15-49 296 36.6
Malawi
Demographic and Health Survey
2004 2004-2005
(NSO and ORC Macro, 2005)
Other districts 6-59 M/F 3541 65.5 15-49 2981 39.7 ¹ Women with a birth in the 5 years preceding the survey. For women with two or more births during that period, data refer to the mostrecent birth Fortification of sugar, cooking oil and margarine with vitamin A is currently done on a voluntary basis by food processors. Mandatory fortification would significantly improve the situation (Maleta, 2006).
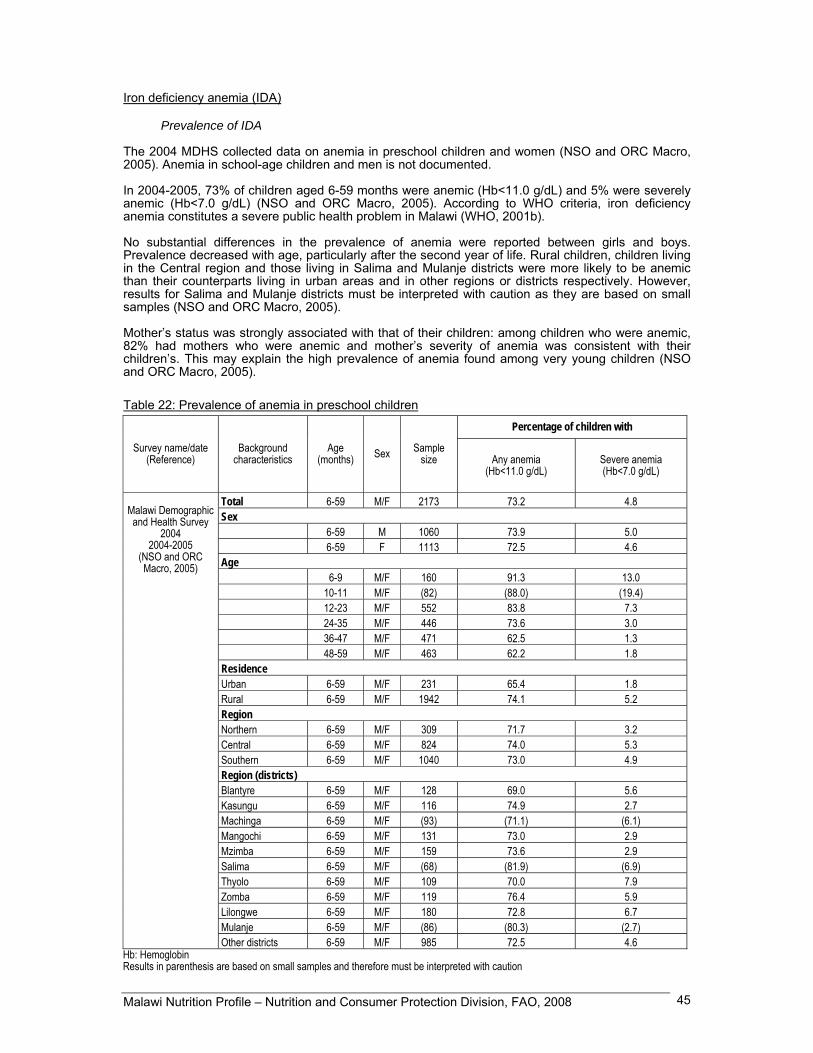
Malawi Nutrition Profile – Nutrition and Consumer Protection Division, FAO, 2008 45
Iron deficiency anemia (IDA)
Prevalence of IDA
The 2004 MDHS collected data on anemia in preschool children and women (NSO and ORC Macro, 2005). Anemia in school-age children and men is not documented. In 2004-2005, 73% of children aged 6-59 months were anemic (Hb<11.0 g/dL) and 5% were severely anemic (Hb<7.0 g/dL) (NSO and ORC Macro, 2005). According to WHO criteria, iron deficiency anemia constitutes a severe public health problem in Malawi (WHO, 2001b). No substantial differences in the prevalence of anemia were reported between girls and boys. Prevalence decreased with age, particularly after the second year of life. Rural children, children living in the Central region and those living in Salima and Mulanje districts were more likely to be anemic than their counterparts living in urban areas and in other regions or districts respectively. However, results for Salima and Mulanje districts must be interpreted with caution as they are based on small samples (NSO and ORC Macro, 2005). Mother’s status was strongly associated with that of their children: among children who were anemic, 82% had mothers who were anemic and mother’s severity of anemia was consistent with their children’s. This may explain the high prevalence of anemia found among very young children (NSO and ORC Macro, 2005). Table 22: Prevalence of anemia in preschool children
Percentage of children with
Survey name/date (Reference)
Background characteristics
Age (months) Sex Sample
size Any anemia (Hb<11.0 g/dL)
Severe anemia (Hb<7.0 g/dL)
Total 6-59 M/F 2173 73.2 4.8 Sex 6-59 M 1060 73.9 5.0 6-59 F 1113 72.5 4.6 Age 6-9 M/F 160 91.3 13.0 10-11 M/F (82) (88.0) (19.4) 12-23 M/F 552 83.8 7.3 24-35 M/F 446 73.6 3.0 36-47 M/F 471 62.5 1.3 48-59 M/F 463 62.2 1.8 Residence Urban 6-59 M/F 231 65.4 1.8 Rural 6-59 M/F 1942 74.1 5.2 Region Northern 6-59 M/F 309 71.7 3.2 Central 6-59 M/F 824 74.0 5.3 Southern 6-59 M/F 1040 73.0 4.9 Region (districts) Blantyre 6-59 M/F 128 69.0 5.6 Kasungu 6-59 M/F 116 74.9 2.7 Machinga 6-59 M/F (93) (71.1) (6.1) Mangochi 6-59 M/F 131 73.0 2.9 Mzimba 6-59 M/F 159 73.6 2.9 Salima 6-59 M/F (68) (81.9) (6.9) Thyolo 6-59 M/F 109 70.0 7.9 Zomba 6-59 M/F 119 76.4 5.9 Lilongwe 6-59 M/F 180 72.8 6.7 Mulanje 6-59 M/F (86) (80.3) (2.7)
Malawi Demographic and Health Survey
2004 2004-2005
(NSO and ORC Macro, 2005)
Other districts 6-59 M/F 985 72.5 4.6 Hb: Hemoglobin Results in parenthesis are based on small samples and therefore must be interpreted with caution
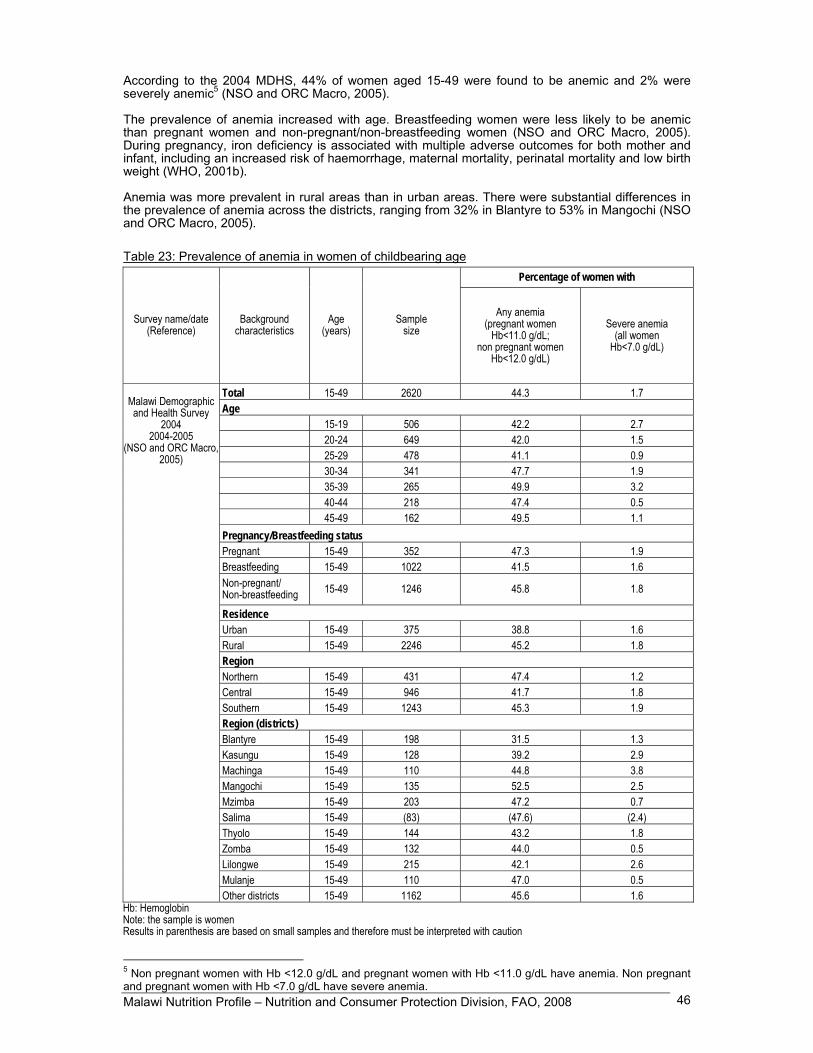
Malawi Nutrition Profile – Nutrition and Consumer Protection Division, FAO, 2008 46
According to the 2004 MDHS, 44% of women aged 15-49 were found to be anemic and 2% were severely anemic5 (NSO and ORC Macro, 2005). The prevalence of anemia increased with age. Breastfeeding women were less likely to be anemic than pregnant women and non-pregnant/non-breastfeeding women (NSO and ORC Macro, 2005). During pregnancy, iron deficiency is associated with multiple adverse outcomes for both mother and infant, including an increased risk of haemorrhage, maternal mortality, perinatal mortality and low birth weight (WHO, 2001b). Anemia was more prevalent in rural areas than in urban areas. There were substantial differences in the prevalence of anemia across the districts, ranging from 32% in Blantyre to 53% in Mangochi (NSO and ORC Macro, 2005). Table 23: Prevalence of anemia in women of childbearing age
Percentage of women with
Survey name/date (Reference)
Background characteristics
Age (years)
Sample size
Any anemia (pregnant women
Hb<11.0 g/dL; non pregnant women
Hb<12.0 g/dL)
Severe anemia (all women
Hb<7.0 g/dL)
Total 15-49 2620 44.3 1.7 Age 15-19 506 42.2 2.7 20-24 649 42.0 1.5 25-29 478 41.1 0.9 30-34 341 47.7 1.9 35-39 265 49.9 3.2 40-44 218 47.4 0.5 45-49 162 49.5 1.1 Pregnancy/Breastfeeding status Pregnant 15-49 352 47.3 1.9 Breastfeeding 15-49 1022 41.5 1.6 Non-pregnant/ Non-breastfeeding 15-49 1246 45.8 1.8
Residence Urban 15-49 375 38.8 1.6 Rural 15-49 2246 45.2 1.8 Region Northern 15-49 431 47.4 1.2 Central 15-49 946 41.7 1.8 Southern 15-49 1243 45.3 1.9 Region (districts) Blantyre 15-49 198 31.5 1.3 Kasungu 15-49 128 39.2 2.9 Machinga 15-49 110 44.8 3.8 Mangochi 15-49 135 52.5 2.5 Mzimba 15-49 203 47.2 0.7 Salima 15-49 (83) (47.6) (2.4) Thyolo 15-49 144 43.2 1.8 Zomba 15-49 132 44.0 0.5 Lilongwe 15-49 215 42.1 2.6 Mulanje 15-49 110 47.0 0.5
Malawi Demographic and Health Survey
2004 2004-2005
(NSO and ORC Macro,2005)
Other districts 15-49 1162 45.6 1.6 Hb: Hemoglobin Note: the sample is women Results in parenthesis are based on small samples and therefore must be interpreted with caution
5 Non pregnant women with Hb <12.0 g/dL and pregnant women with Hb <11.0 g/dL have anemia. Non pregnant and pregnant women with Hb <7.0 g/dL have severe anemia.
Malawi Nutrition Profile – Nutrition and Consumer Protection Division, FAO, 2008 47
Anemia can result both from diet-related causes and from infectious and parasitic diseases. Dietary iron sources include meat and offals, fish, legumes, etc. Bioavailability of heme iron found in foods of animal origin (meat and offals, poultry, fish and seafood) is high, while the bioavailability of non-heme iron from foods of vegetable origin is low. Moreover, effective absorption of iron is determined by the presence of dietary factors that enhance (ascorbic acid or vitamin C) or inhibit (phytates present in cereal bran and cereal grains; phenolic compounds) its absorption (WHO, 2001b). The Malawian diet is cereal-based. The supply of foods of animal origin remains low and the high cost of these products limits their consumption by households. The high prevalence of anemia in Malawi may be therefore primarily related to low dietary intake of bioavailable iron. Besides insufficient intake, chronic infections, including malaria and HIV/AIDS, can cause anemia (INACG, 2002). The high prevalence of anemia in Malawi may be attribuable in part to high incidence of infectious diseases among the population, in particular endemic malaria, tuberculosis and HIV/AIDS. A recent national survey revealed that children with malaria parasitemia have twice the risk of iron deficiency of children with no parasitemia (Maleta, 2006). Intestinal helminths such as hookworm, roundworm and Schistosomiasis are also important risk factors for anemia. In Malawi, it was estimated that 14% of school children had hookworm, 4% had roundworm and 3% had Schistosoma mansoni (Maleta, 2006). In July 2007, the Child Health Day campaign for vitamin A and deworming reached 956 000 children under-five (UNICEF, 2008).
Interventions to combat IDA The 2000 MDHS and the 2004 MDHS document iron supplementation of women (NSO and ORC Macro, 2001; NSO and ORC Macro, 2005). In 2004-2005, 76% of women received iron supplementation during pregnancy. However, only 18% reported taking iron supplements for at least 90 days during pregnancy, as recommended (NSO and ORC Macro, 2005). The compliance however has increased compared to 2000 when only 12% of women reported taking iron supplements during 90 or more days (NSO and ORC Macro, 2001). In Malawi iron supplementation is implemented through the antenatal clinics. Since malaria is endemic in the country, anti-malarial prophylaxis during pregnancy also helps improve iron status and prevent malaria which is associated with undernutrition and increased risk of low birth weight. The above interventions (iron supplementation and anti-malarial prophylaxis among pregnant women) are also complemented by other non nutritional interventions such as provision through antenatal clinics of free or subsidized insecticide treated nets (Maleta, 2006).
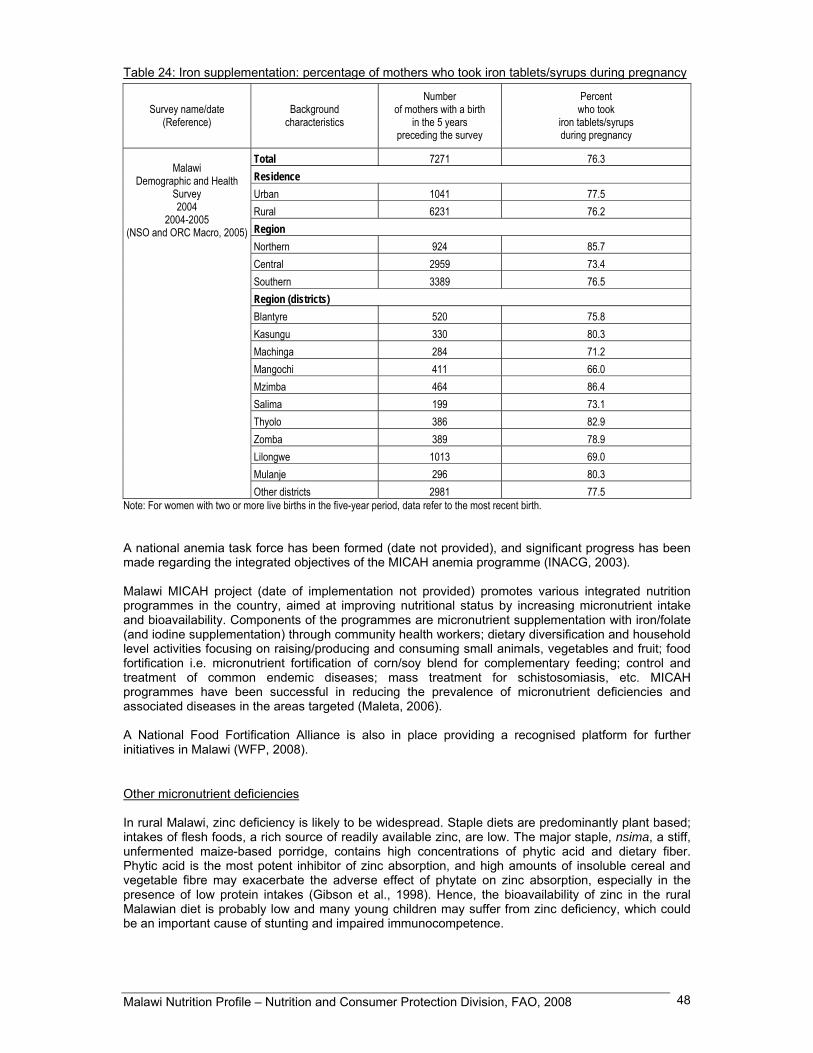
Malawi Nutrition Profile – Nutrition and Consumer Protection Division, FAO, 2008 48
Table 24: Iron supplementation: percentage of mothers who took iron tablets/syrups during pregnancy
Survey name/date (Reference)
Background characteristics
Number of mothers with a birth
in the 5 years preceding the survey
Percent who took
iron tablets/syrups during pregnancy
Total 7271 76.3 Residence Urban 1041 77.5 Rural 6231 76.2 Region Northern 924 85.7 Central 2959 73.4 Southern 3389 76.5 Region (districts) Blantyre 520 75.8 Kasungu 330 80.3 Machinga 284 71.2 Mangochi 411 66.0 Mzimba 464 86.4 Salima 199 73.1 Thyolo 386 82.9 Zomba 389 78.9 Lilongwe 1013 69.0 Mulanje 296 80.3
Malawi
Demographic and Health Survey 2004
2004-2005 (NSO and ORC Macro, 2005)
Other districts 2981 77.5 Note: For women with two or more live births in the five-year period, data refer to the most recent birth. A national anemia task force has been formed (date not provided), and significant progress has been made regarding the integrated objectives of the MICAH anemia programme (INACG, 2003). Malawi MICAH project (date of implementation not provided) promotes various integrated nutrition programmes in the country, aimed at improving nutritional status by increasing micronutrient intake and bioavailability. Components of the programmes are micronutrient supplementation with iron/folate (and iodine supplementation) through community health workers; dietary diversification and household level activities focusing on raising/producing and consuming small animals, vegetables and fruit; food fortification i.e. micronutrient fortification of corn/soy blend for complementary feeding; control and treatment of common endemic diseases; mass treatment for schistosomiasis, etc. MICAH programmes have been successful in reducing the prevalence of micronutrient deficiencies and associated diseases in the areas targeted (Maleta, 2006). A National Food Fortification Alliance is also in place providing a recognised platform for further initiatives in Malawi (WFP, 2008).
Other micronutrient deficiencies In rural Malawi, zinc deficiency is likely to be widespread. Staple diets are predominantly plant based; intakes of flesh foods, a rich source of readily available zinc, are low. The major staple, nsima, a stiff, unfermented maize-based porridge, contains high concentrations of phytic acid and dietary fiber. Phytic acid is the most potent inhibitor of zinc absorption, and high amounts of insoluble cereal and vegetable fibre may exacerbate the adverse effect of phytate on zinc absorption, especially in the presence of low protein intakes (Gibson et al., 1998). Hence, the bioavailability of zinc in the rural Malawian diet is probably low and many young children may suffer from zinc deficiency, which could be an important cause of stunting and impaired immunocompetence.

Malawi Nutrition Profile – Nutrition and Consumer Protection Division, FAO, 2008 49
II.7 Policies and programmes aiming to improve nutrition and food security In July 2005, the Government determined that the operational framework and organizational strategies of the Food and Nutrition Security Policy (FNSP) did not adequately address nutrition issues, despite having been developed since 2003 and formally adopted in early 2005. As a consequence in 2007 it was decided (although still waiting for cabinet approval) that the FNSP was to be split up into two separate policies: a Food Security Policy (FSP) and a National Nutrition Policy (NNP). The NNP was developed to put emphasis on the nutrition dimension as a separate issue from food security, through complementary policies. Also a Food and Nutrition Security Joint Task Force, which includes representatives of the Government and development stakeholders, was created in 2001 to share and discuss matters related to Food and Nutrition Security. The Department of Nutrition, HIV and AIDS under the Office of the President and Cabinet was created in 2005 to lead the implementation of the NNP, facilitating standardization, coordination and improvement of the quality of nutrition services delivery within all sectors of the economy with the goal of improving the nutritional status of all Malawians. The above mentioned nutrition dimension of Malawi’s development objectives is also found in the Malawi Growth and Development Strategy (MGDS) of 2006 (building on the previous Poverty Reduction Strategy Paper) under the thematic area of Prevention and Management of Nutrition Disorders, HIV and AIDS. Apart from the Food Security Policy (2006), the NNP is also closely linked, among others, to the Malawi Gender Policy (2000), the Implementation Plan (2004), Infant and Young Child Nutrition Policy (2005) and National HIV and AIDS Framework In particular, the NNP recognises nutrition as a cross-cutting issue and calls for the placement of nutrition, HIV and AIDS specialists in each ministry and department. Joint planning efforts are expected to ensure a comprehensive national approach to the issue of nutrition. To this end, the Nutrition, HIV and AIDS Business Strategy was developed and outlines outputs, strategies and activities, as well as the roles and responsibilities of stakeholders (including various ministries, development partners, the private sector, civil society) and the Department of Nutrition itself in the implementation of nutrition services. The NNP is centred around the following themes: i) capacity building, ii) prevention/ treatment of nutrition disorders, iii) dietary diversification and food utilisation, iv) food safety and quality, v) the nutritional needs of vulnerable groups and vi) nutrition advocacy. Towards implementation of the NNP, a National Nutrition Programme exists, providing a detailed framework for policy implementation, outlining activities and time frames for realisation of the vision, mission and objectives of the policy. The programme identifies eleven key priority areas, corresponding to the NNP themes, that will facilitate improvement of nutrition service delivery. At the moment, a number of nutrition-related programmes and interventions are being implemented in Malawi. Currently, the Ministries of Health and Agriculture are in the process of taking full ownership of an Integrated Nutrition and Food Security Surveillance System, monitoring trends in nutritional status of approximately 9,100 under-five children in growth monitoring clinics throughout all districts. The Department of Nutrition is also currently advocating the creation of a Nutrition Information System through which relevant Ministries and partners would be able to consolidate nutrition data and information into a single database. In Malawi, the prevalence of micronutrient deficiencies has led to the development of a number of national programmes to improve the situation. Dietary Diversification and Modification is a programme encouraging the production and consumption of iron and Vitamin A rich foods. In addition, it promotes food fortification, led by the Ministry of Trade and Industry. In 1995, the National Salt Iodization Act, as part of the Public Health Act, was developed to facilitate eradication of IDD by establishing that all imported salt must be fortified. The National Salt Iodization Committee is a multisectoral committee which includes the Ministry of Health, the Ministry of Trade and Industry, the Ministry of Education, the Ministry of Agriculture and Food Security, the Ministry of Women and Child Development, the Malawi Bureau of Standards, the Consumer Association of Malawi and the Malawi Revenue Authorities, with support from UNICEF and WHO. With regard to Vitamin A supplementation, a national programme has been on-going for over 20 years, providing biannually Vitamin A supplements to children aged 6–59 months . Thanks to this programme, which is part of the country’s services for underfives, lactating mothers also benefit from the supplements. However, coverage is below 50% of the targeted beneficiaries (many households are failing to continue going back to health centres to access the supplements). Therefore the
Malawi Nutrition Profile – Nutrition and Consumer Protection Division, FAO, 2008 50
government is promoting campaigns such as the Child Health Days/Weeks (with door to door visits), through which the programme is able to cover 80% of beneficiaries (Nutrition Unit, 2007). The iron national supplementation programme has also been ongoing for over 20 years. This national programme targets pregnant women, providing them with iron supplements. These supplements can be accessed by pregnant women through antenatal visit in clinics as well as through traditional birth attendants. Further important nutrition programmes include Community Therapeutic Care (CTC), Integrated Management of Childhood Illnesses (IMCI) (which includes a large nutrition component) and supplementary feeding for children as well as nutrition support for adolescents and adults. Additionally, the Ministry of Education with other partners, are implementing school feeding programmes as well as a school health and nutrition programme. A review of the nutrition curricula is currently underway and nutrition education and activities such as school gardens feature in many programmes. Nutrition education is not limited to schools but is also being implemented through health care centres and community organizations. With the development of the NNP, there has been a strong drive in nutrition initiatives over the last year and a half. Infant and young child feeding policy and guidelines have been finalized, and there has been an increase in efforts to develop sets of dietary recommendations and nutrition guidelines for Malawi. The success of the NNP and related programmes will depend on the support from partners and from considerable capacity development.

Malawi Nutrition Profile – Nutrition and Consumer Protection Division, FAO, 2008 51
Reference list BAD. 2005. Malawi – Document de stratégie par pays 2005-2009. Banque Africaine de Développement, Fonds Africain de Développement, Département des Opérations par Pays, Régions Nord, Est et Sud. (available at http://www.afdb.org/pls/portal/docs/PAGE/ADB_ADMIN_PG/DOCUMENTS/OPERATIONSINFORMATION/MALAWI%20-%20DOCUMENT%20DE%20STRAT%C3%89GIE%20PAYS%202005-09%20(24%20NOV.2005).PDF) Devereux, S., Baulch, B., Phiri, A. & Sabates-Wheeler, R. 2006. Vulnerability to chronic poverty and malnutrition in Malawi. Report for DFID Malawi. (available at http://www.ids.ac.uk/UserFiles/File/poverty_team/social_protection/MalawiVulnerabilityReport_Final.pdf) FAO. 2008. Current food security situation : Malawi. ESTG. Food and Agriculture Organization of the United Nations. Rome. FAO. 2006a. The State of Food Insecurity in the World 2006. Food and Agriculture Organization of the United Nations. Rome. (available at ftp://ftp.fao.org/docrep/fao/009/a0750e/a0750e00.pdf) FAO. 2006b. FAO briefs on import surges, No.2 Malawi : Maize, sugar and dairy products. Case studies prepared by national experts. Commodities and Trade Division, Food and Agriculture Organization of the United Nations. Rome. (available at ftp://ftp.fao.org/docrep/fao/009/ah625e/ah625e00.pdf) FAO. 2005. Malawi facing serious food crisis. FAO Newsroom. Food and Agriculture Organization of the United Nations. Rome. (available at http://www.fao.org/newsroom/en/news/2005/107298/index.html) FAO. 2004. Human energy requirements. Report of a Joint FAO/WHO/UNU Expert Consultation, Rome, 17-24 October 2001. FAO Food and Nutrition Technical Report Series No. 1. Rome. FAO. FAOSTAT. Statistical database. Food and Agriculture Organization of the United Nations. Rome. (available at http://faostat.external.fao.org/faostat) Accessed in 2007 FAO. FAOSTAT statistical database on Agricultural Production, Livestock Primary. Statistics Division. Food and Agriculture Organization of the United Nations. Rome. (available at http://faostat.fao.org/site/405/default.aspx ) Accessed in 2007 FAO. FAOSTAT statistical database on Irrigation. Statistics Division. Food and Agriculture Organization of the United Nations. Rome. (available at http://faostat.fao.org/site/405/default.aspx ) Accessed in 2007 FAO. FAOSTAT statistical database on Land Use. Statistics Division. Food and Agriculture Organization of the United Nations. Rome. (available at http://faostat.fao.org/site/405/default.aspx ) Accessed in 2007 FAO. FAOSTAT statistical database on Population, Annual series. Statistics Division. Food and Agriculture Organization of the United Nations. Rome. (available at http://faostat.fao.org/site/405/default.aspx ) Accessed in 2007

Malawi Nutrition Profile – Nutrition and Consumer Protection Division, FAO, 2008 52
FAO. AQUASTAT. 2006. Country profile, Malawi. FAO’s Information System on Water and Agriculture. Food and Agriculture Organization of the United Nations. Rome. (available at http://www.fao.org/nr/water/aquastat/countries/malawi/index.stm) FAO, Forestry Division. FAO Forestry country profile – Malawi. Food and Agriculture Organization of the United Nations. Rome. (available at http://www.fao.org/forestry/site/countryinfo/en/) Accessed in 2007 FAO, Statistics Division. Major food and agricultural commodities and producers. Food and Agriculture Organization of the United Nations. Rome. (available at http://www.fao.org/es/ess/top/country.html;jsessionid=4F01DD5AAE7E963652C5831210297960) Accessed in 2007 FAO/FAD. 2005. Fishery and aquaculture country profile, Malawi. Food and Agriculture Organization of the United Nations, Fisheries and Aquaculture Department. Rome. (available at http://www.fao.org/fishery/countrysector/FI-CP_MW) FAO/GIEWS. GIEWS workstation. Global Information and Early Warning System on food and agriculture [GIEWS]. Food and Agriculture Organization of the United Nations. Rome. (available at http://www.fao.org/giews/workstation/english/index.htm) Accessed in 2007 FAO/WFP. 2005. Special report FAO/WFP crop and food supply assessment mission to Malawi – 20 June 2005. FAO Global Information and Early Warning System on Food and Agriculture, World Food Programme. Rome. (available at http://www.fao.org/docrep/008/J5509e/J5509e00.htm) FAO/WFP. 2004. Special report FAO/WFP crop and food supply assessment mission to Malawi – 8 July 2004. Food and Agriculture Organization of the United Nations, World Food Programme. Rome. (available at http://www.reliefweb.int/library/documents/2004/fao-mlw-8jul.pdf) FAO/WFP. 2002. Special report FAO/WFP crop and food supply assessment mission to Malawi – 29 May 2002. FAO Global Information and Early Warning System on Food and Agriculture, World Food Programme. Rome. (available at http://vam.wfp.org/thematic-pages/hiv-aids-and-ovc/CFSAM%20Malawi%20report%20(May%202002).pdf) FEWS. 2006. Food security update February 2006. Famine Early Warning Systems Network, United States Agency for International Development. (available at http://www.fews.net/centers/innerSections.aspx?f=mw&m=1001846&pageID=monthliesDoc) FEWS. 2005. Food security update February 2005. Famine Early Warning Systems Network, United States Agency for International Development. (available at http://www.fews.net/centers/innerSections.aspx?f=mw&m=1001531&pageID=monthliesDoc) FEWS. 2001. Monthly food security report, mid-May – mid-June 2001. Famine Early Warning Systems Network, United States Agency for International Development. (available at http://www.fews.net/centers/files/Malawi_200105en.pdf) Frankenberger, T., Luther, K., Fox, K. & Mazzeo, J. 2003. Livelihood erosion through time: macro and micro factors that influenced livelihood trends in Malawi over the last 30 years. CARE. Gibson, R.S., Yeudall, F., Drost, N., Mtimuni, B. & Cullinan, T. 1998. Dietary interventions to prevent zinc deficiency. Am. J. Clin. Nur., 68 (2 Suppl.): 484S-487S. (available at : http://www.ajcn.org/cgi/reprint/68/2/484S.pdf) GoM. 2006. Malawi Growth and Development Strategy. From poverty to prosperity 2006-2011. Government of Malawi. (available at http://siteresources.worldbank.org/MALAWIEXTN/Resources/MGDS_2006_Final.pdf)
Malawi Nutrition Profile – Nutrition and Consumer Protection Division, FAO, 2008 53
GoM & UNICEF. 2005. National nutrition survey report, December 2005. Government of Malawi and United Nations Children’s Fund. Haggblade, S. & Zulu, B. 2003. The recent cassava surge in Zambia and Malawi. Conference paper No. 9, Paper presented at the InWEnt, IFPRI, NEPAD, CTA conference « Successes in African Agriculture » Pretoria, December 1-3, 2003. (available at http://www.ifpri.org/events/conferences/2003/120103/papers/paper9.pdf) ICCIDD. 2002. Prevalence and control programme data – Malawi. International Council for Control of Iodine Deficiencies Disorders. IFAD, Rural Poverty Portal. Malawi. International Fund for Agricultural Development. Rome. (available at http://www.ruralpovertyportal.org/english/regions/africa/mwi/index.htm) ILO. C182 Worst forms of child labour convention, 1999. International Labour Office. Geneva. Switzerland. (available at: http://www.ilo.org/ilolex/cgi-lex/convde.pl?C182) INACG. 2003. Integrating programs to move iron deficiency and anemia control. Report of the 2003 International Nutritional Anemia Consultative Group Symposium. (available at http://inacg.ilsi.org/file/INACGfinal.pdf) INACG. 2002. Anemia, iron deficiency, and iron deficiency anemia. International Nutritional Anemia Consultative Group. Washington D.C. (available at http://inacg.ilsi.org/file/Anemia.pdf) Kisymobe, C. 2000. Annual report of the aflatoxin research project on groundnuts in Malawi for the period from August 1,1997 – January 1999. (available at http://www.fao.org/prods/gap/database/gap/files/1424_MALRP99.HTM) Maleta, K. 2006. Undernutrition. Community Health Department, College of Medicine, Blantyre, Malawi. Malawi Medical Journal, 18 (4): 189-205. (available at http://www.mmj.medcol.mw/issues/nutrition2006vol18.4.pdf) Mdebwe, H.J. & Banda, T.W. 1996. A survey report on the trend of prevalence of goitre in junior primary school pupils and coverage of iodized salt at house hold level in seven districts of northern and central regions of Malawi. Ministry of Health and Population. Lilongwe. Menon, R. 2007. Famine in Malawi : causes and consequences. Human Development Report 2007/2008 Thematic Papers. Human Development Report Office Occasional Paper. United Nations Development Programme. (available at http://hdr.undp.org/en/reports/global/hdr2007-2008/papers/menon_roshni_2007a_malawi.pdf) MICAH. Not dated. MICAH Malawi final survey report. Micronutrient and Health Malawi, World Vision Malawi. MoEPD. 2004. Malawi Economic Growth Strategy. Volume II : main report. Ministry of Economic Planning and Development. Lilongwe. (available at http://www.sdnp.org.mw/malawi/malawi-econo-growth-strategy-july04.pdf) MoH & UNICEF. 2003. Malawi micronutrient survey. Ministry of Health, Malawi and UNICEF. MNVAC. 2002. Malawi emergency food security assessment report. Malawi National Vulnerability Assessment Committee in collaboration with the SADC FANR Vulnerability Assessment Committee. (available at http://www.sadc.int/english/fanr/food_security/Documents/Malawi/July%20-%20August%202002%20Malawi%20Emergency%20Assessment%20Report.pdf) MVAC. 2007. Malawi’s 2007 bumper harvest : is everyone food secure ? Malawi Vulnerability Assessment Committe Forecast 2007-2008 Agricultural Consumption Year, June 2007 Brief. (available at http://documents.wfp.org/stellent/groups/public/documents/ena/wfp154071.pdf)

Malawi Nutrition Profile – Nutrition and Consumer Protection Division, FAO, 2008 54
NEC. 2000. Poverty analysis of the Malawi Integrated Household Survey, 1997-98. National Economic Council, Poverty Monitoring System. (available at http://www.nso.malawi.net/data_on_line/economics/ihs/poverty_profile.pdf) NEPAD & FAO. 2005. Support to NEPAD-CAADP Implementation. TCP/MLW/2906 (I). Volume IV of V. New Partnership for Africa’s Development (NEPAD), Comprehensive Africa Agriculture Development Programme (CAADP), Food and Agriculture Organization of the United Nations, Investment Center Division. Governement of the Republic of Malawi. (available at ftp://ftp.fao.org/docrep/fao/008/ae750e/ae750e00.pdf) Ngwira, N., Kamchedzera, G. & Semu, L. 2003. Malawi Strategic Country Gender Assessment (SCGA). Volume 1: main report. Presented to the World Bank and UNDP. (available at http://siteresources.worldbank.org/EXTAFRREGTOPGENDER/Resources/MalawiSCGA.pdf) NSO. 2005a. Integrated Household Survey 2004-2005. Volume I Household socio-economic characterisctics. National Statistical Office. Zomba. Malawi. (available at http://www.nso.malawi.net/data_on_line/economics/ihs/IHS2/IHS2_Report.pdf) NSO. 2005b. Malawi trade statistics brief, December 2005 (Provisional figures). National Statistical Office. Zomba. Malawi. (available at http://www.nso.malawi.net/data_on_line/economics/Trade%20on%20NSO%20website/Malawi%202005%20Trade%20Statistics%20Brief_Release.pdf) NSO. 2005c. Poverty in Malawi from the Second Integrated Household Survey. National Statistical Office. Zomba. Malawi. (available at http://www.nso.malawi.net/data_on_line/economics/ihs/IHS2/poverty_05.ppt) NSO & Macro International Inc. 1994. Malawi Demographic and Health Survey 1992. National Statistical Office, Zomba, Malawi, and Macro International Inc. Calverton, Maryland USA. (available at http://www.measuredhs.com/pubs/pub_details.cfm?ID=89&ctry_id=24&SrchTp=ctry&flag=sur) NSO & MLVT. 2004. Malawi Child Labour Survey 2002. National Statistical Office and Ministry of Labour and Vocational Training. Government of Malawi and International Labour Organization. (available at http://www.ilo.org/ipecinfo/product/viewProduct.do;jsessionid=0a038009cf2ca1753f85ed347ec9b9eed39abd89cca?productId=940) NSO & ORC Macro. 2005. Malawi Demographic and Health Survey 2004. National Statistical Office, Zomba, Malawi, and ORC Macro, Calverton, Maryland, USA. (available at http://www.measuredhs.com/pubs/pub_details.cfm?ID=%20575&ctry_id=24&SrchTp=ctry&flag=sur) NSO & ORC Macro. 2003. Malawi DHS EdData Survey 2002: Education Data for Decision-making. National Statistical Office, Zomba, Malawi and ORC Macro, Calverton, Maryland, USA. (available at http://www.dhseddata.com/rpt/MalawiFinal.PDF) NSO & ORC Macro. 2001. Malawi Demographic and Health Survey 2000. National Statistical Office, Zomba, Malawi, and ORC Macro, Calverton, Maryland, USA. (available at http://www.measuredhs.com/pubs/pub_details.cfm?ID=337&ctry_id=24&SrchTp=ctry&flag=sur) Nutrition Unit. 2007. Child Health Days Report. Ministry of Health, Malawi. ODI. Not dated. Malawi food security issues paper – draft – for forum for food security in Southern Africa. Overseas Development Institute. London. (available at http://www.odi.org.uk/food-security-forum/docs/MalawiCIP.pdf) PMS. 2000. The state of Malawi’s poor : Agriculture and making a living from the land. PMS policy brief No. 7, November 2000. Poverty Monitoring System, Malawi. (available at http://www.ifpri.org/themes/mp18/malawipms/pmsbrief07.pdf)
Malawi Nutrition Profile – Nutrition and Consumer Protection Division, FAO, 2008 55
R&D & FIAN. 2006. The human right to food in Malawi. Report of an international fact-finding mission. Rights and Democracy, Canada, Foodfirst Information and Action Network, Germany. RoM. 2005. Malawi HIV and AIDS monitoring and evaluation report 2005. Follow-up to the Declaration of Commitment on HIV and AIDS (UNGASS). Republic of Malawi, Office of the President and Cabinet. (available at http://data.unaids.org/pub/Report/2006/2006_country_progress_report_malawi_en.pdf) RoM & WB. 2006. Malawi poverty and vulnerability assessment, investing in our future. Draft for discussion. Republic of Malawi and World Bank. (available at http://www.aec.msu.edu/fs2/mgt/caadp/malawi_pva_draft_052606_final_draft.pdf) Sahley, C., Groelsema, B., Marchione, T. & Nelson, D. 2005. The governance dimensions of food security in Malawi. USAID’s Bureau of Democracy, Conflict and Humanitarian Assistance, Office of Democracy and Governance (DCHA/DG) and the Office of Food for Peace (DCHA/FFP). (available at http://www.foodsec.org/docs/171005_HIV_governance.pdf) UN. 2006. UN Malawi humanitarian situation report, October 2006. United Nations Malawi. (available at http://www.unmalawi.org/reports/Sit_reports/un_sitrep06oct2006.pdf) UNDAF. 2007. UNDAF Malawi 2008-2011. United Nations Development Assistance Framework Malawi. (available at http://www.unmalawi.org/reports/undaf/undaf_malawi_2008-2011.pdf) UNDP. 2006. Human Development Report 2006. United Nations Development Programme. New York. USA. (available at http://hdr.undp.org/hdr2006/) UNDP. 2004. Human Development Report 2004. United Nations Development Programme. New-York. New York. USA. (available at http://hdr.undp.org/reports/global/2004/) UNESCO. 2006. Education for all - Global Monitoring Report 2007. United Nations Educational, Scientific and Cultural Organization. Paris. (available at http://unesdoc.unesco.org/images/0014/001477/147794E.pdf) UNESCO. 2004. Global Education Digest 2004. UNESCO Institute for Statistics. Montreal. (available at http://www.uis.unesco.org/TEMPLATE/pdf/ged/2004/GED2004_EN.pdf) UNICEF. 2008. UNICEF humanitarian action Malawi in 2008. Country Report Malawi. UNICEF Humanitarian Action Report 2008. United Nations Children’s Fund. New York. USA (available at : http://www.unicef.org/har08/files/har08_Malawi_countrychapter.pdf) UNICEF. 2007a. The State of World’s Children 2007. United Nations Children’s Fund. New York. USA. (available at http://www.unicef.org/sowc07/docs/sowc07.pdf) UNICEF. 2007b. Malawi humanitarian situation report, September 2007. United Nations Children’s Fund. New York. USA. (available at http://www.unicef.org/infobycountry/files/Malawi_external_Humanitarian_Update_24sep07.pdf) UNICEF. 2005. The State of World’s Children 2005. United Nations Children’s Fund. New York. USA. (available at http://www.unicef.org/publications/files/SOWC_2005_(English).pdf) UNICEF. Statistics Databases. United Nations Children’s Fund. New York. USA. (available at http://www.unicef.org/statistics/) Accessed in 2007 UNICEF & WHO. 2004. Low birthweight: country, regional and global estimates. United Nations Children’s Fund and World Health Organization. (available at http://www.unicef.org/publications/files/low_birthweight_from_EY.pdf) UNPD. World population prospects: The 2006 revision population database. United Nations Population Division. New York. USA. (available at http://esa.un.org/unpp/) Accessed in 2007

Malawi Nutrition Profile – Nutrition and Consumer Protection Division, FAO, 2008 56
UNSTAT. Millennium indicators database. United Nations Statistics Division. New York. USA. (available at http://unstats.un.org/unsd/mi/mi_goals.asp) Accessed in 2007 WB. 2008. Malawi country brief (update March 2008). World Bank. Washington D.C. (available at http://web.worldbank.org/WBSITE/EXTERNAL/COUNTRIES/AFRICAEXT/MALAWIEXTN/0,,menuPK:355882~pagePK:141132~piPK:141107~theSitePK:355870,00.html) WB. 2007. Project performance assessment report – Republic of Malawi – Emergency drought recovery project. Report No. 39849. Document of The World Bank. (available at http://lnweb18.worldbank.org/oed/oeddoclib.nsf/DocUNIDViewForJavaSearch/394F6CDC602CEFE585257307006A1B1C/$file/malawi_ppar.pdf) WB. World Development Indicators Database. World Bank. Washington D.C. (available at http://devdata.worldbank.org/data-query/) Accessed in 2007 WFP. 2008. Food fortification – Malawi. World Food Programme. Rome. (available at http://www.wfp.org/country_brief/africa/malawi/factsheets/Food_Fortification_Fact_Sheet_Jan_2008.pdf) WFP. 2007. The food aid monitor June 2007 - 2006 food aid flows. Food Aid Monitor. World Food Programme. Rome. (available at http://www.wfp.org/interfais/index2.htm) Whiteside, M. 2000. Ganyu labour in Malawi and its implication for livelihood security interventions – an analysis of recent literature and implications for poverty alleviation. ODI, Agricultural Research and Extension Network, Network Paper No. 99. (available at http://www.odi.org.uk/networks/agren/papers/agrenpaper_99.pdf) WHO. 2006a. Country cooperation strategy at a glance. World Health Organization. Geneva. Switzerland. (available at http://www.who.int/countryfocus/resources/ccsbrief_malawi_mwi_06_en.pdf) WHO. 2006b. Malawi country profile. Health action in crisis. World Health Organization. Geneva. Switzerland. (available at http://www.who.int/hac/crises/mwi/background/Malawi_June06.pdf) WHO. 2002. Meeting on advisory group on maternal nutrition and low birthweight. World Health Organization. Geneva. Switzerland. (available at http://www.who.int/nutrition/publications/advisory_group_lbw.pdf) WHO. 2001a. Assessment of iodine deficiency disorders and monitoring their elimination, a guide for programme managers. Second edition. WHO/NHD/01.1. World Health Organization. Geneva. Switzerland. (available at http://www.who.int/nutrition/publications/en/idd_assessment_monitoring_eliminination.pdf) WHO. 2001b. Iron deficiency anaemia, assessment, prevention, and control, a guide for programme managers. WHO/NHD/01.3. World Health Organization. Geneva. Switzerland. (available at http://www.who.int/nutrition/publications/en/ida_assessment_prevention_control.pdf) WHO. 1996. Indicators for assessing vitamin A deficiency and their application in monitoring and evaluating intervention programmes. WHO/NUT/96.10. World Health Organization. Geneva. Switzerland. (available at http://whqlibdoc.who.int/hq/1996/WHO_NUT_96.10.pdf) WHO. 1995. Physical status: the use and interpretation of anthropometry. WHO Technical Report Series 854. World Health Organization. Geneva. Switzerland. (available at http://whqlibdoc.who.int/trs/WHO_TRS_854.pdf)

Malawi Nutrition Profile – Nutrition and Consumer Protection Division, FAO, 2008 57
WHO. Database on anaemia. Vitamin and Mineral Nutrition Information System (VMNIS). World Health Organization. Geneva. Switzerland. (available at http://www.who.int/vmnis/anaemia/data/en/index.html) Accessed 2007 WHO. Database on iodine deficiency disorders. Vitamin and Mineral Nutrition Information System (VMNIS). World Health Organization. Geneva. Switzerland. (available at http://www.who.int/vmnis/en/ ) Accessed in 2007 WHO. Database on vitamin A deficiency. Vitamin and Mineral Nutrition Information System (VMNIS). World Health Organization. Geneva. Switzerland. (available at http://www.who.int/vmnis/vitamina/data/en/index.html) Accessed in 2007 WHO/FAO. 2004. Vitamin and mineral requirements in human nutrition. Report of a joint WHO/FAO Expert Consultation. World Health Organization and Food and Agriculture Organization of the United Nations. WHO/FAO. 2003. Diet, nutrition and the prevention of chronic diseases. Report of a joint WHO/FAO Expert Consultation. WHO Technical Report Series 916. World Health Organization. Geneva. Switzerland. (available at http://whqlibdoc.who.int/trs/WHO_TRS_916.pdf) Wobst, P., Lofgren, H., Tchale, H. & Morrison, J. 2004. Pro-poor development strategies for Malawi: an economy-wide analysis of alternative policy scenarios.