Embed Size (px)
Citation preview

REPUBLIC OF RWANDA
RWANDA NATIONAL WATER RESOURCES MASTER PLAN
.
MINIRENA-RNRA
OCTOBER 2015

Rwanda National Water Resources Master Plan Page i
MINIRENA-RNRA OCTOBER 2015
TABLE OF CONTENTS
Table of contents ___________________________________________________________ i
List of figures _____________________________________________________________ iv
List of tables ______________________________________________________________ iv
List of abbreviations and acronyms ____________________________________________ vi
List of Terms _____________________________________________________________ viii
1 Introduction ___________________________________________________________ 1
1.1 Context of the NWRMP ___________________________________________________ 1
1.2 Objectives of the master plan ______________________________________________ 1 1.2.1 General objective _______________________________________________________________ 2 1.2.2 Specific objectives _______________________________________________________________ 2
1.3 Scope of the master plan __________________________________________________ 3
1.4 Brief outline of the Master Plan phase report __________________________________ 4
1.5 Introduction on Rwanda National Water Resources Master plan __________________ 5
1.6 Resources assessment ____________________________________________________ 7 1.6.1 Annual resources assessment at level 1 catchments ___________________________________ 7 1.6.2 Monthly resources assessment at level 1 catchment __________________________________ 10 1.6.3 Water quality situation at level 1 catchment ________________________________________ 16 1.6.4 Additional resources opportunities at level 1 catchment _______________________________ 21 1.6.5 Sustaining water resources at level 1 catchment _____________________________________ 23 1.6.6 Resources assessment of level 3 surface catchment __________________________________ 28
1.7 Demand assessment _____________________________________________________ 29 1.7.1 Current consumptive water use at level 1 catchment _________________________________ 29 1.7.2 unadjusted water demand projections at level 1 catchment ____________________________ 30 1.7.3 adjusted demand assessment of level 1 catchment ___________________________________ 48
1.8 Water Resources development program _____________________________________ 93
1.9 Issues, Conclusions and recommendations ___________________________________ 97 1.9.1 observations and recommended actions for the CKIV catchment ________________________ 97 1.9.2 observations and recommended actions for the CRUS catchment _______________________ 99 1.9.3 observations and recommended actions for the NNYU catchment ______________________ 101 1.9.4 observations and recommended actions for the NMUK catchment _____________________ 103 1.9.5 observations and recommended actions for the NNYL catchment ______________________ 105 1.9.6 observations and recommended actions for the NAKN catchment ______________________ 107 1.9.7 observations and recommended actions for the NAKU catchment ______________________ 109 1.9.8 observations and recommended actions for the NAKL catchment ______________________ 112 1.9.9 observations and recommended actions for the NMUV catchment _____________________ 115 1.9.10 recommended actions at the national level ______________________________________ 118
2 Rwanda Water MIS ___________________________________________________ 123
2.1 Rationale _____________________________________________________________ 123 2.1.1 What is the Water MIS? ________________________________________________________ 123 2.1.2 Modular design of the Water MIS ________________________________________________ 124 2.1.3 Water MIS limitations __________________________________________________________ 126

Rwanda National Water Resources Master Plan Page ii
MINIRENA-RNRA OCTOBER 2015
2.2 Water MIS Resources Module ____________________________________________ 130 2.2.1 Overall purpose of the resources module __________________________________________ 130 2.2.2 Data content of the resources module ____________________________________________ 130 2.2.3 Process and tools of the resources module _________________________________________ 131
2.3 Water MIS Balances Module _____________________________________________ 135 2.3.1 Overall purpose of the Balances module ___________________________________________ 135 2.3.2 Data content of the Balances module _____________________________________________ 135 2.3.3 Process and tools of the Balances module _________________________________________ 136
2.4 Water MIS water use and Permit Module ___________________________________ 136 2.4.1 Overall purpose of the Permits module ____________________________________________ 136 2.4.2 The Water Permit procedure ____________________________________________________ 137 2.4.3 Data for the permit procedure ___________________________________________________ 139 2.4.4 Process and tools of the Permit module ___________________________________________ 140
2.5 Geoserver Mapping server _______________________________________________ 141
2.6 Water MIS architecture _________________________________________________ 143
2.7 Water MIS installation, operation and maintenance __________________________ 145 2.7.1 Manuals _____________________________________________________________________ 145 2.7.2 Hosting issues ________________________________________________________________ 145 2.7.3 Collaboration with Meteo Rwanda _______________________________________________ 146 2.7.4 Operation and maintenance costs ________________________________________________ 146
2.8 Conclusion on the Water MIS and the way forward ___________________________ 147
2.9 Introduction __________________________________________________________ 152
2.10 Implementation of IWRM ________________________________________________ 153
2.11 update on the institutional structure for IWRM 'under construction' _____________ 156 2.11.1 Strategy __________________________________________________________________ 159 2.11.2 Planning __________________________________________________________________ 159 2.11.3 Management (Implementation and Exploitation) _________________________________ 160 2.11.4 Monitoring ________________________________________________________________ 161
2.12 Proposition of the institutional structure for the implementation of IWRM ________ 162 2.12.1 Monitoring of water related natural resources ___________________________________ 163 2.12.2 Strategy development for management of water resources and their use _____________ 168 2.12.3 Planning for the development of water resources for essential and beneficial use _______ 174 2.12.4 implementation of resources development works ________________________________ 188 2.12.5 Exploitation of resources development works ____________________________________ 191 2.12.6 Monitoring of use interventions _______________________________________________ 193 2.12.7 Closure of permit for intervention in natural hydrological cycle ______________________ 197
2.13 transitional mechanism for essential catchment water management services with district territorial authority preserved ____________________________________________ 199
2.13.1 Introduction _______________________________________________________________ 199 2.13.2 The need for catchment based water management services ________________________ 200 2.13.3 Current status of catchment based water management provisions in Rwanda __________ 202 2.13.4 Proposed approach for improved catchment planning _____________________________ 203 2.13.5 Proposed transitional structure for catchment based water management provisions and 'lean' government arrangements ________________________________________________________ 204 2.13.6 Complementary measures ___________________________________________________ 207
2.14 Road map for the implementation of the institutional structure for IWRM ________ 207 2.14.1 Basic Issues ________________________________________________________________ 208 2.14.2 Action Plan for a workable institutional structure for the water sector ________________ 209
2.15 Road map for the implementation of the legal structure for IWRM ______________ 219

Rwanda National Water Resources Master Plan Page iii
MINIRENA-RNRA OCTOBER 2015
Knowledge transfer and capacity building _____________________________________ 229
2.16 Activities undertaken during the study _____________________________________ 229
2.17 Further knowledge transfer and capacity building requirements ________________ 231
3 Cross cutting issues (gender, ICT, environment, sustainable development) _______ 235
4 Summary and principal conclusions and recommendations ___________________ 237

Rwanda National Water Resources Master Plan Page iv
MINIRENA-RNRA OCTOBER 2015
LIST OF FIGURES
Figure 1: Level 1 catchment division of Rwanda ___________________________________________________ 6 Figure 2: Chemical surface water quality situation in Rwanda (total nitrogen and phosphorus) ____________ 17 Figure 3: Nutrient water quality situation in Rwanda (BOD5, COD) ___________________________________ 17 Figure 4: Management cycle for water resources assessment in Rwanda ______________________________ 24 Figure 5: Requirement for special investigations on impact of irrigation (Akanyaru basin) ________________ 25 Figure 6: Requirement for special investigations on impact of irrigation _______________________________ 27 Figure 7: Strategic Planning of Water Resources (Mukungwa basin) __________________________________ 28 Figure 8: Annual GDP (real growth rate) for Rwanda from 1999 - 2011________________________________ 34 Figure 9: Annual flow schedule for nine catchments - medium demand situation 2012 ___________________ 88 Figure 10: Annual flow schedule for nine catchments - high demand situation 2020 _____________________ 89 Figure 11: Annual flow schedule for nine catchments - high demand situation 2030 _____________________ 90 Figure 12: Annual flow schedule for nine catchments - high demand situation 2040 _____________________ 91 Figure 13: Monthly flow schedule for nine catchments - high demand situation August 2040 ______________ 92 Figure 14: Schematic presentation of the modular nature of the Water MIS. __________________________ 125 Figure 15: Level 1 catchment division in Rwanda. ________________________________________________ 127 Figure 16: Schematic representation of the work flow for the resources module _______________________ 131 Figure 17: One-to-many relationships between Stations, Sensors and Timeseries. ______________________ 134 Figure 18: Geoserver example data (e.g. Catchment level 1 boundaries) ______________________________ 142 Figure 19: Webmapping services configuration diagram __________________________________________ 143 Figure 20: Diagram of the Water MIS architecture. ______________________________________________ 144 Figure 21: Schematic presentation of the components acting upon the Water MIS operation. ____________ 148 Figure 22: Diagram of the institutional framework for water management in Rwanda __________________ 158 Figure 23: Main institutional entities involved in water resources monitoring__________________________ 164 Figure 24: Main institutional entities involved in IWRM strategy development _________________________ 169 Figure 25: Main institutional entities involved in IWRM planning ___________________________________ 175 Figure 26: Main institutional entities involved in water resources development ________________________ 189 Figure 27: Main institutional entities involved in water resources exploitation _________________________ 191 Figure 28: Main institutional entities involved in water use monitoring _______________________________ 194 Figure 29: Main institutional entities involved in the closure of a water permit ________________________ 197
LIST OF TABLES
Table 1: Hydrological information on the level I catchment units for NWRMP ___________________________ 7 Table 2: Lake Kivu catchment monthly meteorological and hydrological data __________________________ 11 Table 3: Rusizi catchment monthly meteorological and hydrological data _____________________________ 11 Table 4: Upper Nyabarongo catchment monthly meteorological and hydrological data __________________ 12 Table 5: Mukungwa catchment monthly meteorological and hydrological data _________________________ 12 Table 6: Lower Nyabarongo catchment monthly meteorological and hydrological data __________________ 13 Table 7: Akanyaru catchment monthly meteorological and hydrological data __________________________ 13 Table 8: Upper Akagera catchment monthly meteorological and hydrological data ______________________ 14 Table 9: Lower Akagera catchment monthly meteorological and hydrological data ______________________ 14 Table 10: Muvumba catchment monthly meteorological and hydrological data _________________________ 15 Table 11: Classification thresholds for water quality _______________________________________________ 18 Table 12: Overview of current water use in the different catchments of Rwanda ________________________ 30 Table 13: Overview of population extrapolation date for Rwanda ____________________________________ 31 Table 14: Evolution of poverty in Rwanda _______________________________________________________ 32 Table 15: Evolution of extreme poverty in Rwanda ________________________________________________ 33 Table 16: Evolution of inequality in Rwanda - based on Gini coefficient and 90th to 10th percentile method. _ 33 Table 17: Summary of thematic areas and priorities for EDPRS2 _____________________________________ 35 Table 18: Adjusted water balance CKIV 2012 - 2020 - 2030 - 2040. ___________________________________ 51

Rwanda National Water Resources Master Plan Page v
MINIRENA-RNRA OCTOBER 2015
Table 19: Resources and demand pie chart graph for CKIV 2040 - high demand scenario _________________ 52 Table 20: Monthly demand distribution for CKIV 2040 - high demand scenario _________________________ 52 Table 21: Adjusted water balance CRUS 2012 - 2020 - 2030 - 2040. __________________________________ 54 Table 22: Resources and demand pie chart graph for CRUS 2040 - high demand scenario _________________ 55 Table 23: Monthly demand distribution for CRUS 2040 - high demand scenario _________________________ 55 Table 24: Adjusted water balance NNYU 2012 - 2020 - 2030 - 2040. __________________________________ 57 Table 25: Resources and demand pie chart graph for NNYU 2040 - high demand scenario ________________ 58 Table 26: Monthly demand distribution for NNYU 2040 - high demand scenario ________________________ 59 Table 27: Adjusted water balance NMUK 2012 - 2020 - 2030 - 2040. _________________________________ 61 Table 28: Resources and demand pie chart graph for NMUK 2040 - high demand scenario ________________ 62 Table 29: Monthly demand distribution for NMUK 2040 - high demand scenario ________________________ 62 Table 30: Adjusted water balance NNYL 2012 - 2020 - 2030 - 2040. __________________________________ 64 Table 31: Resources and demand pie chart graph for NNYL 2040 - high demand scenario _________________ 66 Table 32: Monthly demand distribution for NNYL 2040 - high demand scenario _________________________ 66 Table 33: Adjusted water balance NAKN 2012 - 2020 - 2030 - 2040. __________________________________ 69 Table 34: Resources and demand pie chart graph for NAKN 2040 - high demand scenario ________________ 71 Table 35: Monthly demand distribution for NAKN 2040 - high demand scenario ________________________ 71 Table 36: Adjusted water balance NAKU 2012 - 2020 - 2030 - 2040. __________________________________ 73 Table 37: Resources and demand pie chart graph for NAKU 2040 - high demand scenario ________________ 74 Table 38: Monthly demand distribution for NAKU 2040 - high demand scenario ________________________ 75 Table 39: Adjusted water balance NAKL 2012 - 2020 - 2030 - 2040. __________________________________ 77 Table 40: Resources and demand pie chart graph for NAKL 2040 - high demand scenario _________________ 78 Table 41: Monthly demand distribution for NAKL 2040 - high demand scenario _________________________ 79 Table 42: Adjusted water balance NMUV 2012 - 2020 - 2030 - 2040. _________________________________ 81 Table 43: Resources and demand pie chart graph for NMUV 2040 - high demand scenario ________________ 83 Table 44: Monthly demand distribution for NMUV 2040 - high demand scenario ________________________ 83 Table 45: Summary of government related investment costs - low growth scenario (in MRWF) ____________ 94 Table 46: Summary of government related investment costs - medium growth scenario (in MRWF)_________ 94 Table 47: Summary of government related investment costs - high growth scenario (in MRWF) ____________ 94 Table 48: Overview of investment costs per catchment per demand category and per planning period for the medium growth scenario ____________________________________________________________________ 96 table 49: List of level 1 catchments in Rwanda __________________________________________________ 127 table 50: Examples of intervention- and permit types _____________________________________________ 139 Table 51: Data transfer analysis in the Resources module (module requiring the most transfer demanding module) _________________________________________________________________________________ 145 table 52: cost estimation for the installation and operation and maintenance of the Water MIS. __________ 146 Table 53: Opportunities and risks related to the Water MIS ________________________________________ 148 table 54: Road map for the improvement of the institutional structure for IWRM. ______________________ 209 table 55: Road map for improvement and completion of the legal structure for IWRM. __________________ 219

Rwanda National Water Resources Master Plan Page vi
MINIRENA-RNRA OCTOBER 2015
LIST OF ABBREVIATIONS AND ACRONYMS
ABAKIR Lake Kivu and Rusizi River Basin Authority
BSC Broadband Systems Corporation
CC Catchment Committee
CLIMWAT Program and database for the preparation of climate water balances from FAO.
CROPWAT Program and database for the preparation of crop water balances from FAO
CWMO Catchment Water Management Office
DC District Committee
DDP District Development Plan
DTM Digital Terrain Model
DWRM Directorate of Water Resources Management
EAC East African Community
EC European Commission
EDPRS Economic Development Poverty Reduction Strategy
EIA Environmental Impact Assessment
EICV Integrated Household Living Conditions Survey (Enquête Intégrale sur les Conditions de Vie des ménages)
EWSA Energy, Water and Sanitation Authority
FAO Food and Agriculture Organisation (UN)
FONERWA National Climate Change and Environment Fund
GB Gigabyte
GIS Geographic Information System
GoR Government of Rwanda
GWP Global Water Partnership
HFO Heavy Fuel Oil
hm³ Cubic hectometer - equal to 1 million cubic meter
ICLD International Commission on Large Dams
ICT Information Communication Technology
IRD Institut de Recherche pour le Développement
IWMI International Water Management Institute
IWRM Integrated Water Resources Management
JICA Japan International Cooperation Agency
KML Keyhole Markup Language (file extension: .kml)
LVBC Lake Victoria Basin Commission
LVEMP Lake Victoria Environmental Management Project
LWH Land Husbandry Water Harvesting and Hillside irrigation
MAR Mean Annual Runoff
MB Megabyte
MCM Million Cubic Meter
MDGs Millennium Development Goals
MIDIMAR Ministry of Disaster Management and Refugee Affairs
MIGEPROF Ministry of Gender and Family Promotion

Rwanda National Water Resources Master Plan Page vii
MINIRENA-RNRA OCTOBER 2015
MINAFFET Ministry of Foreign Affairs and Cooperation
MINAGRI Ministry of Agriculture and Animal Resources
MINALOC Ministry of Local Government
MINECOFIN Ministry of Finance and Economic Planning
MINEDUC Ministry of Education
MINICOM Ministry of Trade and Industry
MININFRA Ministry of Infrastructure
MINIRENA Ministry of Environment and Natural Resources
MINISANTE Ministry of Health
MIS Management Information System
MODIS Moderate Resolution Imaging Spectro radiometer
MoU Memorandum of Understanding
MPF Maximum Probable Flood
NAEB National Agricultural Export Development Board
NBI Nile Basin Initiative
NELSAP Nile Equatorial Lakes Subsidiary Action Program
NGO Non-governmental Organization
NISR National Institute of Statistics Rwanda
NWCC National Water Consultative Commission
NWRMP National Water Resources Master Plan
PAIGELAC Inland Lakes Intergrated Development and Management Support Project
PGNRE National Program for Water Resource Management
PNEAR Rural Water and Sanitation Programme (Programme National d'Alimentation en eau Potable et assainissement en milieu rural)
RAB Rwanda Agriculture Board
RAB Rwanda Agriculture Board
RARDA Rwanda Animal Resources Development Authority
RBC Rwanda Biomedical Center
RDB Rwanda Development Board
RDMS Relational Database Management System
REMA Environment Management Authority
RIMP Rwanda Irrigation Master Plan
RIWSP Rwanda Integrated Water Security Program
RMF Regional Maximum Flood
RNRA Rwanda Natural Resources Authority (Authority operating under MINIRENA)
RSSP Rural Sector Support Program
RURA Rwanda Utilities Regulatory Agency
RWA Rwanda Water Authority
RWH Rainwater Harvesting
RWRIS Rwanda Water Resources Information System
RWU Registered Water User
SC Sector Committees
SRTM Shuttle Radar Topography Mission
TCM Thousand cubic meter
ToR Terms of Reference

Rwanda National Water Resources Master Plan Page viii
MINIRENA-RNRA OCTOBER 2015
TRMM Tropical Rainfall Measuring Mission
UICN International Union for Conservation of Nature (Union internationale pour la conservation de la nature)
UNDP United Nations Development Programme
UNESCO United Nations Educational, Scientific and Cultural Organization
WA Water Authority
WASH Water and Sanitation Hygiene Promotion
Water MIS Water Management Information System
WHO World Health Organization
WIC Water Interministerial Committee
WLA Water Laboratory Alliance
WMO World Meteorological Organization
WRM Water Resources Management
WMS Web Map Service
WUA Water User Association
LIST OF TERMS
The terms in this list are used throughout the report and may be interpreted differently by different
users. Without pretending to provide a true definition that can be agreed upon by all, the clarifications
below try to bring a common understanding between authors and readers of these terms. Unless
mentioned otherwise, all terms are described as used for this study.
CATCHMENT MASTER PLAN
A Catchment Master Plan defines the timely development of natural water resources for primary or commercial
use purposes while aiming at a careful combination of least effort and costs for optimum benefits in terms of
financial, economic, social and environmental parameters. The Master Plan relates to both the resources supply
and demand side and may consequently comprise demand management measures. The goal of the 'catchment
master plan' is the rational development of water resources. A series of nine indicative Catchment Master Plans
has been formulated within the framework of the NWRMP study; it is recommended that these are further
developed with stakeholder participation.
CATCHMENT WATER MANAGEMENT PLAN
A catchment water management plan defines the management of water resources both in the natural
hydrological cycle and in and between numerous primary - and commercial use cycles in order to secure, under
all hydrological conditions, maximum benefits in terms of financial, economic, social and environmental
parameters. The goal of the 'catchment water management plan' is the rational exploitation of water resources.
The catchment water management plan is especially important for highly committed catchments. No such plans
have been formulated within the framework of the NWRMP study
DAM VOLUME
This is the volume of dam material (diverse materials) that is required to built a dam assuming upstream and
downstream slope and strict linear interpolation of lateral valley slopes. The dam volumes in this report are
mostly very approximate and over estimated. The ratio between reservoir and dam volume is nevertheless a

Rwanda National Water Resources Master Plan Page ix
MINIRENA-RNRA OCTOBER 2015
useful indicator of the relative effectiveness of potential surface water storage sites. (also see Reservoir
Volume).
ENVIRONMENTAL FLOW (OR DEMAND)
Environmental flows describe the quantity, timing, and quality of water flows required to sustain freshwater and
estuarine ecosystems and the human livelihoods and well being that depend on these ecosystems. Through
implementation of environmental flows, water managers strive to achieve a flow regime, or pattern, that
provides for human uses and maintains the essential processes required to support healthy river ecosystems.
The concept of the term 'environmental flow' in the Master Plan report mostly refers to surface flow exclusively
but the concept should in fact refer to both the hydrological surface- and groundwater flow that should remain
available in terms of water quantity and quality over time for the 'benefit' of the natural environment.
EQUITABLE ACCESS
A term mostly associated with the right to (drinking) water and sanitation for all hence relating to primary use.
The terms can also be considered for commercial use. It does not imply equitable distribution (see below).
EQUITABLE DISTRIBUTION
A term associated with distribution of scarce water resources. It is often wrongly presented as an ideal
distribution mode under conditions of scarcity when all users would obtain an equal fraction of their normal
water allocation. Strict equitable distribution is likely to engender substantial economic, social and
environmental costs as compared with a distribution that is tailor made for normal, excess and drought
conditions. A tailor made rational distribution for normal and extreme conditions should be specified in a
catchment water management plan and in the water permits issued for that catchment.
GROWTH SCENARIOS (LOW, MEDIUM AND HIGH)
This report considers three water demand growth scenarios labeled 'low', 'medium' and 'high'. These growth
scenarios are based on projections of population increase, a water supply service level per person and water
dependant development opportunities. The aspired growth scenario as per Rwandan strategy documents (Vision
2020, EDPRS, ...) is a combination of low population growth (driving primary water use) with strong growth of
water dependant development opportunities (industrial use, irrigation, etc., or commercial water use) and the
least favorable scenario would be the combination of highest population growth with stagnant development.
The population growth is an extension of the growth scenarios that have been developed by the NISR up to 2022
and which are the result of gradual reduction of population growth rates.
The fraction urban population is inspired by UN projections and yields significant growth of urban population
and very moderate growth of rural population (a tendency that can be observed when comparing 2002 and 2012
census data for predominantly rural sectors).
The per capita daily water demand is estimated from typical values for developing countries. Because the two
elements of the growth scenarios (population growth and water related development) counteract from most
favorable to least favorable scenario, they have been dissociated for the following combinations:
high water demand growth scenario: a combination of high population growth and high flight of the
water dependant development opportunities
medium water demand growth scenario: a combination of medium population growth and average
increase of water dependant development opportunities
low water demand growth scenario: a combination of low population growth and moderate increase of
the water dependant development opportunities:
Further details on population growth are provided in annex C4_2 of the Exploratory phase report and details on
the growth scenarios are provided in the same report chapters 4.2. and 4.4.
IWRM

Rwanda National Water Resources Master Plan Page x
MINIRENA-RNRA OCTOBER 2015
A process which promotes the coordinated development and management of water, land and related resources,
in order to maximize the resultant economic and social welfare in an equitable manner without compromising
the sustainability of vital ecosystems.” (from: Technical Committee of the Global Water Partnership)
RESERVOIR VOLUME
This is the volume of water that can be effectively stored upstream of a dam. The reservoir volumes in this
report are mostly very approximate and under estimated because based on strict linear interpolation of
longitudinal and lateral valley slopes. (also see Dam Volume)
WATER PERMIT
A water permit is a written agreement (or a contract) between a water user and the Rwandan government in the
person of the Minister of State in charge of Water and conveys rights and obligations to both parties.
The water user obtains the right to intervene in a precisely specified manner (location, method, calendar, other
conditions may apply) in the natural hydrological cycle. It is not a right to abstract a specific volume of water,
the risk of resources availability remains with the water user and the government nor any other party can
guarantee abstraction success.
WATER USE AND DEMAND (AND A SERIES OF RELATED TERMS)
WATER USE: a real quantity of water that has been used for a specific purpose. The use may be within
the natural hydrological cycle (e.g. fishing) or it may require a local and temporary abstraction
(hydropower) or a complete shift in the natural hydrological cycle (drinking water abstracted from a
well for consumptive use with fractional drainage to surface flow).
Water use may depend on water qualities like flow regime, location, level and physical, biological and
chemical water qualities; water use is likely to alter these qualities to some extent (from marginally to
very substantially)
CONSUMPTIVE WATER USE: the fraction of water use that is not returned to the abstraction location in
the natural hydrological cycle. Water used for beer production is consumptive, water used for washing
the beer bottles is non consumptive and can be returned to the natural hydrological cycle after treatment
to contain impact on the natural resource and downstream water users.
PRIMARY WATER USE: water use which is needed to directly sustain livelihood and comprises drinking
water supply, environmental demand and possibly other demand categories; the lack of provision for
this use will lead to the untimely demise of a living being.
COMMERCIAL WATER USE: water use which is intended to generate financial benefits; the lack of
provision for this use will lead to the loss of income to the user
WATER DEMAND: this is a virtual quantity of water that is needed to satisfy some perceived need from a
user, either for primary use (drinking water, household requirements, small garden, etc.) or for
commercial purposes.
CONSUMPTIVE WATER DEMAND: the fraction of water demand that is not returned to the abstraction
location in the natural hydrological cycle (analogous to consumptive water use)
UNADJUSTED (CONSUMPTIVE) WATER DEMAND: this term is exclusively valid for this study and should
be understood to be the demand in a catchment irrespective of i) resources availability and ii) proper
investigation of the viability of the use process.
ADJUSTED (CONSUMPTIVE) WATER DEMAND: this term is exclusively valid for this study and should be
understood to be the demand in a catchment after investigation of the (financial, economic, social and
environmental) viability of the use processes and adjustment to available resources. Adjusted water
demand may be increased or decreased from the unadjusted water demand.

Rwanda National Water Resources Master Plan Page 1
MINIRENA-RNRA OCTOBER 2015
1 INTRODUCTION
1.1 CONTEXT OF THE NWRMP
Water is a key issue to be addressed and solved in order to meet a number of the Millennium
Development Goals (MDGs). About 300 million people in Africa, a third of the continent's
population, are living under "water scarcity" conditions. To address this, the African Water
Vision for 2025 has set to develop the full potential of Africa's water resources for
sustainable growth in the region's economic and social development.
The National Policy for Water Resources Management has been recently reviewed (04/2011).
The scope and purpose of this new policy states that [page 2] "Water is a key resource in the
socio-economic development of Rwanda. The availability of an adequate quantity of water of
good quality is an important factor in development. Its proper management is a national
development imperative which requires putting in place appropriate water resources
management, development and utilization frameworks and measures. This would facilitate
the setting of priorities and the optimal utilization of the water resources of the country.”
The central role of water resources as a key driver for Rwanda’s social and economic
development and poverty reduction is fully acknowledged in Rwanda’s flagship policy
documents, government program, joint sector review reports and political goals.
In this respect Rwanda’s Vision 2020 states as follows:
“The country is endowed with reserves that could provide enough water for both human
consumption and agricultural purposes. These include substantial rainfall (900 to 1800 mm
per year) and the abundance of lakes, streams and watercourses…” [p. 17].
The Economic Development and Poverty Reduction Strategy (2013-2018) sets priority on
full coverage of quality water and sanitation services and irrigation expansion to increase
productivity and enhance food security. It recognizes the imminent pressure from this
expansion on water resources management [§ 3.35].
The national policy presents the approach of Rwanda’s Environment and Natural Resources
sector on the way that the water resources of the country will contribute to the achievement of
the overarching national policy objectives as stipulated in Vision 2020, the EDPRS and other
similar high level national policies, and breaks them down into concrete principles, objectives
and statements.
The policy is formulated with a view to implementation. Its objectives and statements are
formulated so as to be directly translatable into activities, implementation responsibilities and
associated indicators. The implementation of the National Water Resources Master Plan is
one of the first steps towards the translation of the national policy for Water Resources
Management into concrete actions.
1.2 OBJECTIVES OF THE MASTER PLAN
The objectives of the National Water Resources Master plan are defined by a single general
objective complemented with a number of specific objectives. These are presented and
commented in the next paragraphs.

Rwanda National Water Resources Master Plan Page 2
MINIRENA-RNRA OCTOBER 2015
1.2.1 GENERAL OBJECTIVE
The general objective of this Master Plan is to ensure a sustainable water resources
development, utilization and management in the country.
The National Policy for Water Resources Management emphasizes [p. 15] that "water is a
cross-cutting natural resource, whose use cuts across all sectors, including domestic
consumption, agriculture, commerce and industry, as well as ecological uses for
environmental conservation, such as forests, fisheries and wildlife. The management of water
resources therefore is best undertaken within a framework that provides for decision making
in an integrated manner."
Integrated Water Resources Management (IWRM) has been defined by the Technical
Committee of the Global Water Partnership as “a process which promotes the coordinated
development and management of water, land and related resources, in order to maximize the
resultant economic and social welfare in an equitable manner without compromising the
sustainability of vital ecosystems.”
Operationally, the IWRM approach involves applying knowledge from various disciplines as
well as the insights from diverse stakeholders to devise and implement efficient, equitable
and sustainable solutions to water and development problems. As such, IWRM is a
comprehensive, participatory planning and implementation tool for developing and managing
water resources in a way that balances social and economic needs, and that ensures the
protection of ecosystems for future generations.
Water’s many different uses—for agriculture, for healthy ecosystems, for people and
livelihoods—demands coordinated action. An IWRM approach is an open, flexible process,
bringing together decision-makers across the various sectors that impact on water resources,
and bringing all stakeholders to the table to set policy and make sound, balanced decisions in
response to specific water challenges faced. In the Dublin Principles it has been agreed to
consider water as an 'economic commodity' in order to emphasize its scarcity. One of the
major fields of focus has been to increase women's involvement in drinking water and
sanitation projects, especially in the developing countries. International Water Management
Institute (IWMI), UNESCO and International Water and Sanitation Centre are some of the
institutes that have undertaken research in this area.
In conclusion, the development of a Master plan for sustainable water resources
development should not just be limited to the assessment of national water resources and
national water resources needs and uses over time. The Master plan shall be a blueprint for a
process of sustainable water, land and related resources development and management with
the aim to maximize economic and social welfare in an equitable manner while safeguarding
the environment.
1.2.2 SPECIFIC OBJECTIVES
The specific objectives of the Master Plan are to:
Quantify available water resources (surface and groundwater, in time and space)
Quantify water resources demand by sector and catchment
Rwanda National Water Resources Master Plan Page 3
MINIRENA-RNRA OCTOBER 2015
Identify surplus and deficit areas both in time and space
Propose a management plan for optimal and rational utilization of available quantity
of water resources
Qualify all available water resources in the study area
1.3 SCOPE OF THE MASTER PLAN
The scope of the study is defined by the geographical coverage and the temporal horizon and
resolution; these are briefly discussed in the next paragraphs.
GEOGRAPHICAL COVERAGE
The principal focus of the Master Plan will be the territory of Rwanda, administratively
subdivided in four provinces and the city of Kigali, and at a lower tier, in 30 districts.
In hydrological terms, Rwanda is located at the pinnacle of two major basins (Nile and Congo
basins). It is consequently indispensable that Rwanda shares at least some of its water
resources with its downstream neighbors. Also, several catchments are shared between
Rwanda and its neighbors notably Burundi for the Rusizi, Akanyaru and Akagera Rivers,
Tanzania for the Akagera River, Uganda for the Muvumba River and finally the DRC for the
Lake Kivu and the Rusizi River. These shared catchments need special consideration and
cooperation. Some institutional arrangements are operational either bilateral (Commission
Mixte between Rwanda and Burundi) or regional (e.g. EAC, NBI, ABAKIR; these latter two
are specifically on water resources).
The hydrological analysis will take into account complete physical catchments in Rwanda
and its neighbors until the exit of the water body from the Rwandan national territory.
TEMPORAL HORIZON AND RESOLUTION
The time horizon of this Master Plan will cover the period up to 2040 with intermediate
planning steps for 2020, 2030 and 2040.
As regards resources availability and current and projected demand, a monthly temporal
resolution has been applied. This is especially crucial where irrigation demand is intended to
be developed because this demand is increasing during the dry season months when resources
availability is at its lowest.
CONCLUSION
In conclusion, the Master Plan has been conducted over a time span of almost 30 years with
two intermediate planning dates and a monthly time resolution on the basis of hydrological
boundaries which extend beyond the strict countries borders: 2 river basins, 9 catchments
adjusted as per study findings for surface and groundwater resources, water use, soil
characteristics, existing administrative boundaries and water management requirements.

Rwanda National Water Resources Master Plan Page 4
MINIRENA-RNRA OCTOBER 2015
1.4 BRIEF OUTLINE OF THE MASTER PLAN PHASE REPORT
This paragraph presents an overview of the content of this report. This content responds to
the tasks specified in the work plan for the Master plan phase:
task 2_1: Development Water MIS
task 2_2: Cross cutting issues
task 2_3: Operation and maintenance plan
task 2_4: Legal and institutional strengthening
task 2_5: Knowledge transfer and capacity building
task 2_6: Implementation plan
task 2_7: Detailed cost estimate
task 2_8: Draft/Final report NWRMP and workshop
In response, the Master Plan report presents the following elements:
the National Water Resources Master plan is presented in chapter Error! Reference
source not found.. During the course of the preparation of the national master plan it
became evident that this national master plan could not be reasonable made without
the preparation of corresponding master plans at the catchment level. These are
produced as separate documents appendixes 01 up to 09 for each catchment and
compiled for the national master plan. The Master plan presents the resources (per
catchment with monthly time resolution), consumptive water demand over the
planning period up to 2040 with intermediate demand projections for 2020 and 2030,
catchment water balances and national flow schedules for the entire planning period
with demand adjustments as per available resources, a national investment program
and a listing of issues and recommendations. This element addresses the tasks 2_6
(implementation plan), 2_7 (detailed cost estimate) and 2_8 (NWRMP report).
chapter 3 provides detail on the Water MIS; the idea, the basic concept (modular
design), and the limitations followed by an explanation of the resources -, the
balances - and the water demand, use and permit modules (3 modules), the geo
mapping server. The chapter is completed with a description of the architecture,
installation, and operation and maintenance aspects, and a conclusion with
recommendations for the way forward. A series of 4 manuals for installation and
O&M of the software is presented as appendixes 10 up to 13. This element addresses
the tasks 2_1 (development Water MIS) and 2_3 (operation and maintenance plan).
the aspect of legal and institutional strengthening (task 2_4) is presented in chapter 4.
From an analysis of the IWRM management requirements, an update on the existing
institutional framework for water management in Rwanda and a comprehensive
proposition for improvements, a road map for an IWRM compliant institutional
structure and for the corresponding legal changes is presented. This element addresses
the task 2_4 (legal and institutional strengthening).
the crucial aspect of knowledge transfer and capacity building is presented in chapter
5. It gives detail of the training and knowledge transfer efforts provided during the
master plan study which were almost exclusively directed to the RNRA-IWRM
division, and the further requirements in this field for the benefit of the RNRA-IWRM
as well as a series of other institutional entities involved in IWRM compliant water
management. This element addresses the task 2_5 (knowledge transfer and capacity
building).

Rwanda National Water Resources Master Plan Page 5
MINIRENA-RNRA OCTOBER 2015
chapter 6 presents a discussion on cross cutting issues; most of these are very
embedded in the study (ICT, environment, sustainable development) and do not
require further discussion. On the contrary, the issue of gender which is understood as
a coy term for disadvantaged groups, is discussed with some detail and suggestions
for further study and an action plan are presented. This element addresses the task 2_2
(cross cutting issues).
The last chapter 7 is an executive summary of the master plan report with emphasis on
necessary and recommended actions resulting from this Master Plan document.
1.5 INTRODUCTION ON RWANDA NATIONAL WATER RESOURCES MASTER PLAN
This chapter presents the National Water Resources Master Plan for Rwanda. This 'national'
Master Plan could not be made without the formulation of a series of nine Master Plan at the
catchment level. These Catchment Master Plan are presented as nine appendixes to this
National Master Plan (see appendixes 01-09 with post fixes for the catchment code).
In effect, one of the first tasks that has been done within the framework of this study, is the
review/update of the 'existing' (sub-)catchment division (task 1_3). The basic notion behind
this review was to facilitate IWRM which requires knowledge on the incoming and outgoing
water resources in a domain (catchment, sub catchment or smaller spatial unit) over a time
step (day, week, month, season, year).
The original catchment division in Rwanda did not comply with this notion where:
upper and lower Nyabarongo were merged which obscures the Mukungwa outflow
the upper and lower Akagera were separated over Rweru Lake which obscures the
very significant inflow from the Ruvubu river (Tanzania, Burundi)
The Mulindi and Muvumba rivers were separated whereas this is essentially the same
River with an extensive passage in Uganda
The results of the new catchment division are presented in Figure 1 on the next page. Details
including justification for first level - and further subdivision of the catchments according to
surface and groundwater hydrology are provided in previous reports including a technical
note on catchment division and the exploratory phase report in its chapter 2.
This chapter on the National Water Resources Master Plan is structured as follows:
Paragraph 1.6 informs on the hydrological resources generated in the nine catchments
with detail on rainfall, evaporation losses, surface water runoff and renewable
groundwater up to monthly detail with a 5 step probability assessment varying from
once in twenty year dry, once in three year dry, once in two year dry/wet, once in
three year wet and once in twenty year wet. Additional information is provided on the
generation of additional resources, on the protecting water resources availability and
on the required approach for the resources assessment at level 3 which will be
required for water management in highly committed catchments and areas.
Water demand in the nine catchments is presented and interpreted in paragraph 1.7. It
informs on current consumptive water use, unadjusted demand which is the water
requirement when supply would be 'unlimited', and on adjusted demand which is the
water requirement that can reasonably be provided from the available renewable
resources (from the catchment's own or transferred resources).

Rwanda National Water Resources Master Plan Page 6
MINIRENA-RNRA OCTOBER 2015
Paragraph 1.8 presents the government related investment costs for the development
of water resources and the provision of water services at different future dates (2020,
2030 and 2040) for three assumed population and services growth scenarios (low,
medium and high) and structured for total urban, rural, irrigation and other services
(industries in the widest sense). Full details of these costs are available in annex C2_6
to this report and for each catchment in the already mentioned appendixes.
The last paragraph 1.9 of this chapter gives a full listing of issues, conclusions and
recommendations for each one of the nine catchments and, as regards the
recommendations, also for the national level.
Here below the map with the updated catchment division for Rwanda (nine catchments)
Figure 1: Level 1 catchment division of Rwanda

Rwanda National Water Resources Master Plan Page 7
MINIRENA-RNRA OCTOBER 2015
1.6 RESOURCES ASSESSMENT
This sub paragraph focuses on the hydrological resources. The first section presents the key hydrological resources for each catchment
complemented by their monthly distribution including probability in the next section. Further details are provided on enhanced resources
mobilization, protection of resources and resources assessment at small catchments (level 3 with an indicative area of 50 to 200 km²)
1.6.1 ANNUAL RESOURCES ASSESSMENT AT LEVEL 1 CATCHMENTS
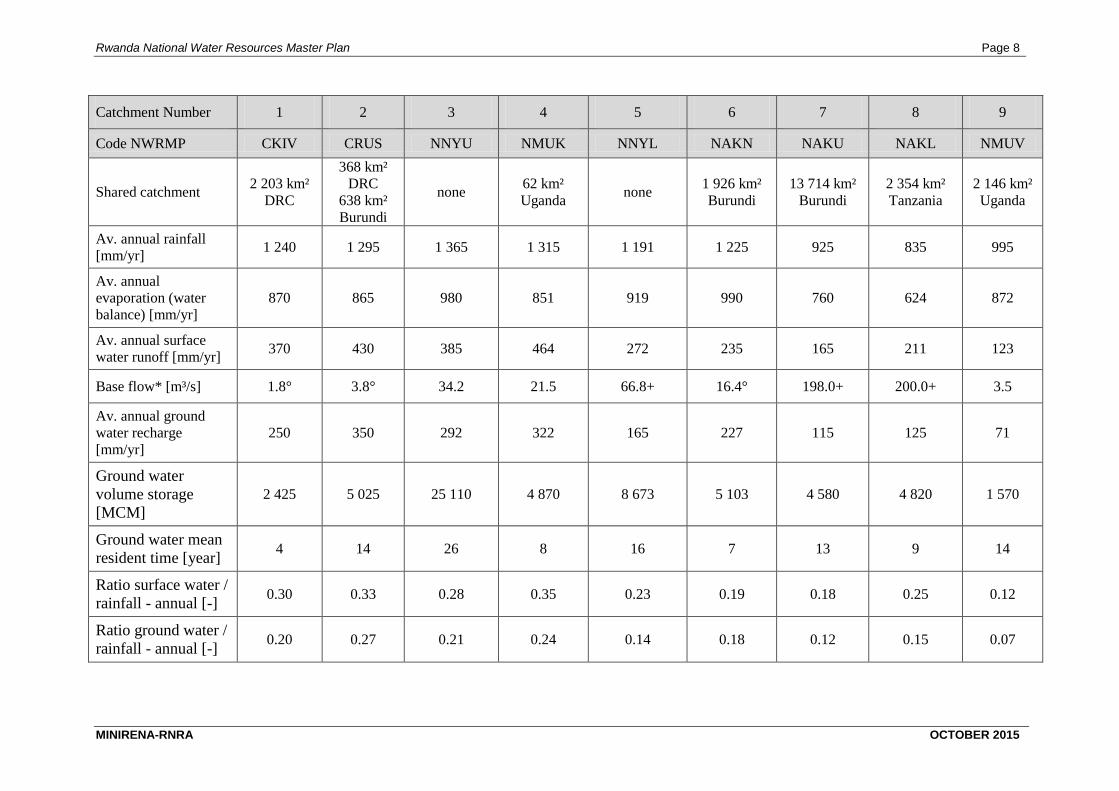
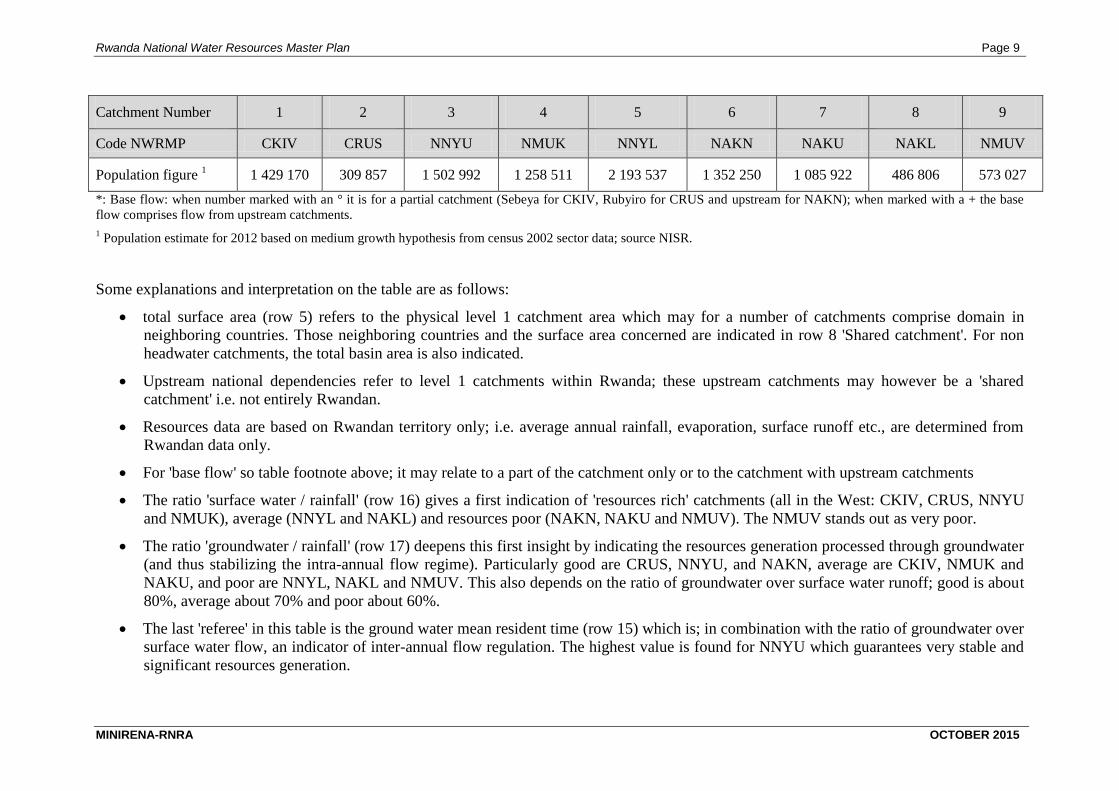
Key hydrological resources data for each level 1 catchment are presented in the table below.
Table 1: Hydrological information on the level I catchment units for NWRMP
Catchment Number 1 2 3 4 5 6 7 8 9
Code NWRMP CKIV CRUS NNYU NMUK NNYL NAKN NAKU NAKL NMUV
Name: Lake Kivu Rusizi Upper
Nyaborongo Mukungwa
Lower
Nyabarongo Akanyaru
Upper
Akagera
Lower
Akagera Muvumba
Surface area [km²] in
Rwanda 2 425 km² 1 005 km² 3 348 km² 1 887 km² 3 305 km² 3 402 km² 3 053 km² 4 288 km² 1 565 km²
Total surface area
[km²]
7 323 km²
incl. lake
2 695 km²
2 011 km²,
total basin:
9 334 km²
3 348 km² 1 949 km² 3 305 km² 5 328 km²
3 053 level 1
basin, total
basin 30 632
km²
6 648 level 1
basin, total
basin 37 288
km²
3 711 km²
Upstream national
dependencies none Lake Kivu none none
Upper
Nyaborongo
& Mukungwa
none
Upper &
Lower
Nyabarongo
& Akanyaru
Upper
Akagera none
Upstream
international
dependencies
none Lake Kivu
DRC none
Insignificant
(Uganda) none none none
Ruvubu river
Burundi none
Rwanda National Water Resources Master Plan Page 8
MINIRENA-RNRA OCTOBER 2015
Catchment Number 1 2 3 4 5 6 7 8 9
Code NWRMP CKIV CRUS NNYU NMUK NNYL NAKN NAKU NAKL NMUV
Shared catchment 2 203 km²
DRC
368 km²
DRC
638 km²
Burundi
none 62 km²
Uganda none
1 926 km²
Burundi
13 714 km²
Burundi
2 354 km²
Tanzania
2 146 km²
Uganda
Av. annual rainfall
[mm/yr] 1 240 1 295 1 365 1 315 1 191 1 225 925 835 995
Av. annual
evaporation (water
balance) [mm/yr]
870 865 980 851 919 990 760 624 872
Av. annual surface
water runoff [mm/yr] 370 430 385 464 272 235 165 211 123
Base flow* [m³/s] 1.8° 3.8° 34.2 21.5 66.8+ 16.4° 198.0+ 200.0+ 3.5
Av. annual ground
water recharge
[mm/yr]
250 350 292 322 165 227 115 125 71
Ground water
volume storage
[MCM]
2 425 5 025 25 110 4 870 8 673 5 103 4 580 4 820 1 570
Ground water mean
resident time [year] 4 14 26 8 16 7 13 9 14
Ratio surface water /
rainfall - annual [-] 0.30 0.33 0.28 0.35 0.23 0.19 0.18 0.25 0.12
Ratio ground water /
rainfall - annual [-] 0.20 0.27 0.21 0.24 0.14 0.18 0.12 0.15 0.07
Rwanda National Water Resources Master Plan Page 9
MINIRENA-RNRA OCTOBER 2015
Catchment Number 1 2 3 4 5 6 7 8 9
Code NWRMP CKIV CRUS NNYU NMUK NNYL NAKN NAKU NAKL NMUV
Population figure 1 1 429 170 309 857 1 502 992 1 258 511 2 193 537 1 352 250 1 085 922 486 806 573 027
*: Base flow: when number marked with an ° it is for a partial catchment (Sebeya for CKIV, Rubyiro for CRUS and upstream for NAKN); when marked with a + the base
flow comprises flow from upstream catchments.
1 Population estimate for 2012 based on medium growth hypothesis from census 2002 sector data; source NISR.
Some explanations and interpretation on the table are as follows:
total surface area (row 5) refers to the physical level 1 catchment area which may for a number of catchments comprise domain in
neighboring countries. Those neighboring countries and the surface area concerned are indicated in row 8 'Shared catchment'. For non
headwater catchments, the total basin area is also indicated.
Upstream national dependencies refer to level 1 catchments within Rwanda; these upstream catchments may however be a 'shared
catchment' i.e. not entirely Rwandan.
Resources data are based on Rwandan territory only; i.e. average annual rainfall, evaporation, surface runoff etc., are determined from
Rwandan data only.
For 'base flow' so table footnote above; it may relate to a part of the catchment only or to the catchment with upstream catchments
The ratio 'surface water / rainfall' (row 16) gives a first indication of 'resources rich' catchments (all in the West: CKIV, CRUS, NNYU
and NMUK), average (NNYL and NAKL) and resources poor (NAKN, NAKU and NMUV). The NMUV stands out as very poor.
The ratio 'groundwater / rainfall' (row 17) deepens this first insight by indicating the resources generation processed through groundwater
(and thus stabilizing the intra-annual flow regime). Particularly good are CRUS, NNYU, and NAKN, average are CKIV, NMUK and
NAKU, and poor are NNYL, NAKL and NMUV. This also depends on the ratio of groundwater over surface water runoff; good is about
80%, average about 70% and poor about 60%.
The last 'referee' in this table is the ground water mean resident time (row 15) which is; in combination with the ratio of groundwater over
surface water flow, an indicator of inter-annual flow regulation. The highest value is found for NNYU which guarantees very stable and
significant resources generation.

Rwanda National Water Resources Master Plan Page 10
MINIRENA-RNRA OCTOBER 2015
1.6.2 MONTHLY RESOURCES ASSESSMENT AT LEVEL 1 CATCHMENT
The tables presented in this paragraph indicate the total annual and monthly values for the average or 50% reliability values for rainfall, actual or
water balance evaporation and groundwater. Water balance evaporation is inferior to potential evaporation due to resources restrictions.
For surface water flow, probability values are presented which are needed to produce functional water balances that indicate both magnitude and
frequency of resources deficits:
Rs5% stands for a probability of 5% that the indicated annual or monthly flow values will be exceeded. This corresponds with a once in
twenty years (resources abundance) event (lots of resources but they are rarely available)
Rs35% stands for a probability of 35% that the indicated annual or monthly flow values will be exceeded. This corresponds approximately
with a once in three years (resources abundance) event.
Rs50% stands for a probability of 50% that the indicated annual or monthly flow values will be exceeded. This corresponds with a once in
two years event (one year it may be less, the next year it may be more; please note the 'may').
Rs65% stands for a probability of 65% that the indicated annual or monthly flow values will be exceeded. This corresponds approximately
with a two in three years event. (there are only modest resources but they will mostly be available - on average twice in three years).
Rs95% stands for a probability of 95% that the indicated annual or monthly flow values will be exceeded. This corresponds with a ninteen
out of twenty years event. (there are very little resources but they will almost always be available - on average 19 out of 20 years).
N.B.: The monthly probability value is a distribution of the annual value. The true monthly probability value would be extremer (higher and
lower) and their cumulative occurrence would be very exceptional.
N.B.: For surface water hydrology, the 50% probability value is typically not identical to the average value because of the skewed probability
distribution. The average value typically exceeds the 50% probability value because of extreme flow events (whether for an annual, monthly or
other time step)

Rwanda National Water Resources Master Plan Page 11
MINIRENA-RNRA OCTOBER 2015
Table 2: Lake Kivu catchment monthly meteorological and hydrological data
volume data
in '000 m³
annual
total oct nov dec jan feb mar apr may jun jul aug sep
Rainfall avge 3 007 000 390 985 402 898 247 030 243 143 273 489 320 513 396 879 221 951 65 206 46 898 111 352 286 656
ETa avge -2 109 408 -203 639 -197 070 -195 807 -203 639 -183 932 -195 807 -181 911 -172 310 -166 752 -109 652 -101 820 -197 070
Rs5% 1 417 336 83 101 81 156 84 013 82 855 128 614 117 495 156 967 130 919 117 975 156 485 164 763 112 992
Rs35% 895 407 72 544 71 553 71 675 62 498 78 047 78 185 96 092 92 687 74 746 67 442 66 545 63 393
Rs50% 810 129 64 543 67 339 62 048 58 089 70 341 72 761 85 407 83 324 65 669 59 102 61 504 60 003
Rs65% 762 033 59 982 61 875 59 614 56 590 64 768 69 613 75 506 78 760 63 128 56 980 56 640 58 577
Rs95% 633 986 51 828 57 346 50 777 50 931 52 479 50 229 64 280 60 631 51 807 48 458 47 734 47 486
gr.w.50% 606 250 51 679 52 360 50 777 50 931 51 612 50 229 51 612 53 108 51 612 48 458 47 498 46 376
Table 3: Rusizi catchment monthly meteorological and hydrological data
volume data
in '000 m³
annual
total oct nov dec jan feb mar apr may jun jul aug sep
Rainfall avge 1 301 475 148 682 185 142 132 921 140 700 107 893 149 494 163 293 105 322 21 105 10 891 33 484 102 549
ETa avge -869 288 -83 920 -81 213 -80 692 -83 920 -75 799 -80 692 -74 966 -71 009 -68 718 -45 188 -41 960 -81 213
Rs5% 785 627 59 189 80 191 95 900 53 534 51 018 62 242 110 416 103 210 48 591 29 330 48 891 43 115
Rs35% 459 635 29 794 39 700 45 539 44 455 36 725 53 036 61 698 53 676 32 766 22 267 17 641 22 338
Rs50% 379 596 25 524 34 947 39 539 30 975 32 244 38 875 45 122 47 330 28 500 20 045 16 279 20 217
Rs65% 335 702 22 201 29 933 37 421 23 399 27 965 32 954 41 388 41 352 26 120 18 102 15 828 19 038
Rs95% 205 632 17 448 15 743 20 720 17 698 20 678 17 588 16 719 29 014 17 607 10 808 11 050 10 558
gr.w.50% 269 036 21 609 22 330 23 410 23 050 23 770 23 410 25 211 29 173 25 211 18 008 15 847 18 008

Rwanda National Water Resources Master Plan Page 12
MINIRENA-RNRA OCTOBER 2015
Table 4: Upper Nyabarongo catchment monthly meteorological and hydrological data
volume data
in '000 m³
annual
total oct nov dec jan feb mar apr may jun jul aug sep
Rainfall avge 4 570 020 402 451 443 896 468 254 396 271 433 898 488 613 687 112 619 128 103 976 47 989 125 425 353 008
ETa avge -3 280 198 -316 665 -306 450 -304 486 -316 665 -286 020 -304 486 -282 877 -267 948 -259 304 -170 512 -158 333 -306 450
Rs5% 1 858 415 138 436 136 591 143 245 163 932 178 526 183 368 185 509 206 542 142 537 123 629 122 377 133 725
Rs35% 1 397 023 98 741 124 979 119 083 112 942 116 062 125 847 143 764 141 071 118 539 101 229 99 054 95 711
Rs50% 1 202 282 93 734 100 109 99 927 96 617 97 539 107 570 126 569 129 294 101 163 87 014 78 548 84 198
Rs65% 1 060 332 84 857 88 299 89 847 82 106 82 537 86 997 117 140 119 050 81 118 74 991 74 612 78 779
Rs95% 884 495 66 953 72 108 72 734 72 187 74 505 72 843 90 663 93 948 76 374 64 894 64 219 63 066
gr.w.50% 977 616 74 002 79 700 80 392 79 787 82 349 80 512 100 208 103 840 84 415 71 726 70 980 69 706
Table 5: Mukungwa catchment monthly meteorological and hydrological data
volume data
in '000 m³
annual
total oct nov dec jan feb mar apr may jun jul aug sep
Rainfall avge 2 563 290 236 636 269 023 174 629 180 000 216 211 283 671 387 342 345 515 113 436 44 756 104 322 207 749
ETa avge -1 658 081 -160 069 -154 905 -153 912 -160 069 -144 578 -153 912 -142 989 -135 443 -131 074 -86 191 -80 034 -154 905
Rs5% 1 518 572 131 749 164 627 178 394 98 713 100 871 110 822 157 046 146 911 127 432 104 583 92 474 104 951
Rs35% 886 599 68 467 87 657 69 652 57 517 62 176 63 545 95 396 105 610 88 052 63 913 59 728 64 887
Rs50% 766 459 62 255 70 863 62 308 55 621 58 885 59 070 77 944 95 686 66 335 49 251 51 673 56 569
Rs65% 678 644 55 832 58 885 55 174 48 804 54 016 55 621 67 546 81 603 55 042 47 408 47 777 50 936
Rs95% 511 148 34 826 48 303 47 172 42 223 41 775 34 431 52 252 57 174 43 065 39 301 36 116 34 510
gr.w.50% 627 665 45 453 56 196 53 717 50 412 49 585 45 453 64 461 66 113 53 717 49 585 47 519 45 453

Rwanda National Water Resources Master Plan Page 13
MINIRENA-RNRA OCTOBER 2015
Table 6: Lower Nyabarongo catchment monthly meteorological and hydrological data
volume data
in '000 m³
annual
total oct nov dec jan feb mar apr may jun jul aug sep
Rainfall avge 3 935 064 364 081 427 255 294 257 297 249 387 522 471 975 685 270 436 232 107 562 69 824 112 050 281 788
ETa avge -3 035 774 -293 069 -283 615 -281 797 -293 069 -264 708 -281 797 -261 799 -247 982 -239 982 -157 806 -146 535 -283 615
Rs5% 1 326 684 94 382 116 797 129 692 112 083 119 469 116 557 163 914 156 350 99 833 78 173 64 834 74 599
Rs35% 929 046 62 576 84 225 73 718 68 738 73 252 87 327 117 368 117 145 73 290 59 153 54 749 57 504
Rs50% 848 870 58 585 75 168 72 133 62 985 69 387 72 348 101 115 107 112 69 155 53 382 52 050 55 450
Rs65% 786 114 57 373 71 344 66 814 57 528 63 222 64 380 95 325 96 483 64 215 51 009 46 721 51 700
Rs95% 633 802 45 188 54 583 52 307 49 586 51 934 53 577 75 826 75 628 48 402 42 429 40 508 43 833
gr.w.50% 544 628 41 858 50 561 48 452 45 932 48 107 48 593 49 287 48 593 45 816 39 303 37 523 40 603
Table 7: Akanyaru catchment monthly meteorological and hydrological data
volume data
in '000 m³
annual
total oct nov dec jan feb mar apr may jun jul aug sep
Rainfall avge 4 167450 414 508 492 280 408 796 353 858 358 493 460 370 716 197 408 780 106 141 26 616 122 587 298 824
ETa avge -3 369589 -355 939 -331 856 -331 093 -338 587 -309 732 -338 722 -297 526 -291 804 -289 897 -102 227 -119 773 -262 433
Rs5% 1 248 658 74 172 109 085 128 465 89 581 118 511 113 420 167 240 170 708 79 532 61 315 68 819 67 810
Rs35% 866 158 59 890 77 863 73 058 73 575 68 228 80 707 111 251 112 898 64 086 50 843 42 392 51 367
Rs50% 774 661 54 490 68 652 69 979 67 758 62 281 70 365 96 823 100 495 54 783 43 937 39 988 45 110
Rs65% 706 238 51 682 62 774 65 558 59 873 58 473 64 345 86 703 89 091 49 217 38 868 39 093 40 562
Rs95% 430 507 32 783 33 200 34 551 39 433 32 230 50 611 63 623 46 054 32 720 22 384 21 414 21 503
gr.w.50% 531 701 36 569 38 563 39 893 51 861 49 866 56 515 63 623 47 872 45 212 36 569 33 244 31 914

Rwanda National Water Resources Master Plan Page 14
MINIRENA-RNRA OCTOBER 2015
Table 8: Upper Akagera catchment monthly meteorological and hydrological data
volume data
in '000 m³
annual
total oct nov dec jan feb mar apr may jun jul aug sep
Rainfall avge 2 824 025 295 911 333 080 204 216 198 431 326 572 355 787 475 395 291 572 45 124 35 000 50 476 212 460
ETa avge -2 320 280 -223 996 -216 771 -215 381 -223 996 -202 319 -215 381 -200 096 -189 535 -183 421 -120 613 -111 998 -216 771
Rs5% 673 170 48 331 57 528 60 128 56 777 57 305 61 020 63 323 67 324 61 353 53 412 41 207 45 463
Rs35% 531 383 39 194 45 497 49 594 46 844 45 537 47 169 52 143 54 762 51 294 35 623 30 154 33 573
Rs50% 502 501 35 147 43 340 46 852 44 265 44 003 44 342 51 118 53 228 48 053 33 576 27 096 31 481
Rs65% 478 721 32 941 40 081 44 896 42 082 42 116 42 754 50 314 52 144 45 871 30 856 25 153 29 512
Rs95% 350 708 26 089 31 449 28 983 32 004 35 245 33 536 36 804 41 338 27 453 21 543 16 322 19 941
gr.w.50% 351 095 26 118 31 484 29 015 32 039 35 284 33 573 36 845 41 384 27 484 21 567 16 340 19 963
Table 9: Lower Akagera catchment monthly meteorological and hydrological data
volume data
in '000 m³
annual
total oct nov dec jan feb mar apr may jun jul aug sep
Rainfall avge 3 580 480 393 260 470 944 326 708 218 289 325 014 438 273 640 590 312 672 85 912 75 506 63 890 229 422
ETa avge -2 673 845 -258 129 -249 802 -248 201 -258 129 -233 149 -248 201 -230 587 -218 417 -211 371 -138 993 -129 065 -249 802
Rs5% 1 285 266 73 080 82 640 97 397 98 981 105 763 115 277 136 037 142 848 134 544 114 129 106 544 78 026
Rs35% 964 603 59 628 65 017 72 784 78 192 78 205 90 840 102 955 107 707 96 775 82 500 68 334 61 665
Rs50% 874 040 56 391 60 588 69 081 71 164 71 196 76 402 91 208 97 439 86 018 75 166 62 834 56 553
Rs65% 814 376 52 479 57 393 61 835 64 558 69 924 71 661 84 199 92 047 79 178 70 200 60 077 50 823
Rs95% 593 775 35 191 40 411 42 008 50 423 56 371 56 287 59 817 68 756 58 442 48 887 40 876 36 306
gr w 50% 536 000 31 767 36 479 37 921 45 517 50 886 50 810 53 997 62 066 52 756 44 130 36 899 32 773

Rwanda National Water Resources Master Plan Page 15
MINIRENA-RNRA OCTOBER 2015
Table 10: Muvumba catchment monthly meteorological and hydrological data
volume data
in '000 m³
annual
total oct nov dec jan feb mar apr may jun jul aug sep
Rainfall avge 1 557 175 150 113 186 348 122 989 87 238 73 159 186 486 259 368 182 068 52 453 27 952 67 637 161 363
ETa avge 1 364 335 -131 711 -127 462 -126 645 -131 711 -118 965 -126 645 -117 657 -111 448 -107 853 -70 921 -65 855 -127 462
Rs5% 290 071 22 974 34 164 26 179 18 623 20 148 20 605 36 243 36 165 20 772 18 006 17 761 18 433
Rs35% 198 480 16 342 17 065 16 883 15 839 15 739 16 398 18 235 18 018 16 420 15 951 15 683 15 907
Rs50% 185 593 15 314 16 080 15 957 14 706 14 901 15 337 17 124 16 990 15 169 14 694 14 666 14 655
Rs65% 172 744 14 287 15 169 14 923 14 007 13 656 14 169 16 063 15 962 14 141 13 403 13 400 13 564
Rs95% 108 685 8 662 11 025 10 689 8 358 6 390 7 572 13 716 13 684 8 423 5 602 6 246 8 320
gr w 50% 110 376 8 797 11 196 10 855 8 488 6 490 7 690 13 929 13 896 8 554 5 689 6 343 8 449
Further to the catchment 'quality' assessment discussed in the previous paragraph (the ratios 'surface water - rainfall', 'groundwater - rainfall' and
the ground water residence time) the monthly surface flow distribution tables are an excellent means to appreciate renewable resources intra
annual (comparing between wet and subsequent dry season values for different probabilities) and inter annual (comparing between 50% and
95% respectively 5% probability) flow stability.
For instance, when comparing the ratio of lowest over highest monthly values for the NNYU (upper Nyabarongo) with those of NMUV
(Muvumba), the values for NNYU are of the order of 0.6 to 0.7 irrespective of the probability, but vary between 0.4 up to 0.85 depending on the
monthly flow probability (0.8 for average events, 0.5 for wet events and 0.4 for dry events).
When comparing the ratio of monthly volume data at 50 and 95 % reliability for NNYU with those of NMUV we see ratios of the order of 1.3
for the upper Nyabarongo against values of 1.5 up to 2.5 for Muvumba.
This indicates that the flow stability for Muvumba is poor with a reduced ability to store wet season excess resources and a near collapse of the
dry season resources during a dry year. The flow generated from the Nyabarongo catchment remains significant under all circumstances as this
catchment has storage and infiltration rates to store and regulate extreme flow events.
A systematic appreciation and a graphical representation of these tables is presented in each of the Catchment Master Plan (see appendixes 01 -
09)

Rwanda National Water Resources Master Plan Page 16
MINIRENA-RNRA OCTOBER 2015
1.6.3 WATER QUALITY SITUATION AT LEVEL 1 CATCHMENT
The surface - and ground water quality situation has been examined in the Exploratory Phase
report chapter 4.5. Available and new water quality data have been collected and
contamination levels have been assessed for the following categories:
chemical composition (major ions, salts, pollutants and heavy metals)
nutrient level (specifically N and P containing molecules) such as degrable organic
matter
micro biological contamination
sediment load and morphological quality of rivers
The chemical water quality has been studied based on data from several campaigns organized
by RNRA and NUR that were made available1 and own sampling campaigns carried out in
2012 and 2013 on different river sections. These samples were analyzed for in situ
parameters (- pH, - electric conductivity, - temperature, - oxygen in mg/L and as saturation, -
turbidity, - total suspended solids), - major chemical constituents such as total nitrogen, total
phosphorus, some heavy metals (Cu, Zn, As) and non-toxic metals indicative of strong
reduction (Fe).
The results of these findings are presented in the two figures below.
1
N.B. NUR data consisted of 3, 14, 8 and 7 batches or combined 32 samples taken. An additional 14 samples
were taken by the client. Parameters characterize the physico-chemical quality, nutrient status and organic load
adequately. Copper (Cu), Zink (Zn) and Arsenic (As) are good indicators for pollution with heavy metals.
Investigations of mining impact requires site specific sampling at a scale of 10-100 of meters due to the high
sorption of heavy metals and a specific choice of parameters according to site and mine mineralogy. Thresholds
as indicated in NUR data agree with WHO and EPA regulations for some parameters but needed to be adjusted
for Phosphorus, Nitrogen, BOD5 and COD. The acceptable threshold for total Phosphorus was lowered to 0.05
mg/L according to EPA regulations instead of 5 mg/L. The threshold for BOD5 at 30 mg/L is still considered a
very high value according to EPA and WHO recommendations and was therefore used as an upper threshold for
satisfactory conditions while very good quality requires a BOD5 of < 5 mg/L and good quality at least a BOD5
of < 10 mg/L. The threshold values in Table 11 have been adjusted accordingly.

Rwanda National Water Resources Master Plan Page 17
MINIRENA-RNRA OCTOBER 2015
Figure 2: Chemical surface water quality situation in Rwanda (total nitrogen and phosphorus)
Figure 3: Nutrient water quality situation in Rwanda (BOD5, COD)

Rwanda National Water Resources Master Plan Page 18
MINIRENA-RNRA OCTOBER 2015
The chemical and nutrient water quality is divided into 5 classes ranging from very good,
good, satisfactory, modified to strongly modified. The target for water quality management
should aim at a good water quality.
The benchmark for water quality and the target of good quality are conditions corresponding
to a natural state of the river. Good water quality is characterized by conditions in which the
river section fulfills all hydrological and ecological functions. Very good conditions exceed
these standards significantly. The river section of very good quality has a high ecological
value in terms of purification, storage and provision of recources exceeding standards.
Satisfactory conditions are above the recommended conditions but indicate already a
noticable anthropogenic impact. A modified section does not reach the water quality
standards given by national law or by WHO and indicates anthropogenic impact that affects
the hydrological or ecological functioning of the river. Strongly modified sections are far
from the water quality standars and objectives set and require significant action to restore
natural and good conditions.
Table 11: Classification thresholds for water quality
Classification
for chemical
quality
Description
Physico-
chemical water
quality especially
(N & P)
Nutrient status and
impact of organic
load (BOD5, DOC)
Very good
All parameters are better than
standards or recommended
values, all hydrological and
ecological functions of storing,
filtering, purifying and
providing water are vital
N < 3 mg/L
and
P < 0.05 mg/L
BOD < 5 mg/L and
COD < 10 mg/L and
E. coli < 4 cts. and
Faecal Coliforms
<100 cts.
Good
Parameters reach or are better
than standards or recommended
values, hydrological and
ecological functions of storing,
filtering, purifying and provision
are intact
N: 3-5 mg/L
and
P: 0.05-0.1 mg/L
BOD < 10 mg/L and
COD < 20 mg/L and
E. coli < 4 cts. and
Coliforms 100-400
cts. Per 100 ml
satisfactory
Most but not all parameters
correspond to recommended
values, river section is partly
affected by anthropogenic
impact but still mostly
responding to its ecosystem
functions
N: 5-10 mg/L and
P: 0.1-0.25 mg/L
BOD 10-30 mg/L and
COD 20-50 mg/L
or
E. coli 4-10 cts.
or
Coliforms 100-400
cts.
Modified
Anthropogenic impacts are
evident, some parameters exceed
recommended values or
regulations, some ecosystem
functions of filtering, puriying or
provisioning are affected
N 5-10 mg/L or
P 0.25-0.5 mg/L
BOD 30-50 mg/L and
COD 50-75 mg/L
or
E. coli > 10 cts. and
Coliforms > 400 cts.
Strongly
modified
Several key parameters indicate
strong anthropogenic impact,
N > 10 mg/L and
P > 0.5 mg/L
BOD > 50 mg/L and
COD >75 mg/L

Rwanda National Water Resources Master Plan Page 19
MINIRENA-RNRA OCTOBER 2015
several ecosystem functions are
affected, major measures need to
be taken to restore ecosystem
functions in the river section
and
E. coli > 10 cts and
Coliforms > 400 cts.
A classification needs to take into account the natural and original state. High organic load is
not natural in upland rivers but natural for the outflow of a wetland. Such baseline studies of
the natural state of rivers need to be carried out before anthropogenic impact can be assessed
and are not available for Rwanda. Therefor indicators for the natural state of rivers need to be
derived from studies of unpolluted tropical rivers and international recommendations. For
river chemical quality two main parameters are considered: Nitrate and phosphate.
Nitrogen is a limiting factor and nutrient in freshwater aquatic systems. It is recommended
that total nitrogen is lower than 3 mg/L in rivers draining into reservoirs, for running waters
not draining into lakes and reservoirs a natural threshold of 5-10 mg/L is recommended and
natural. As nitrogen forms part of a complex cycle, it can be transformed to nitrate, nitrite,
ammonium and nitrogen (gas) depending on environmental conditions.
For the surface water quality mapping presented in Figure 2, the nitrogen threshold for very
good quality was 3 mg/L, 3-5 mg/L was considered a good and 3-10 mg/L a satisfactory
value, values above 10 mg/L indicate anthropogenic impact. Sources stem from sewage and
fertilizers in agriculture. Any organic material contains nitrogen and can be transformed to
nitrate by mineralization. Therefore land use changes also release nitrates. Tropical soils
however, have a higher anions exchange capacity and can partially store nitrate. If
concentrations above 10 mg/L are observed, it is evident that fertilizers or sewage have
modified the nitrogen concentration. Sources can be reduced and limited by water treatment
and careful administration and use of fertilizers.
The EPA (Environmental Protection Agency, United States) water quality criteria states that
phosphates should not exceed .05 mg/l or 50 µg/L if streams discharge into lakes or
reservoirs, .025 mg/l or 25 µg/L within a lake or reservoir, and .1 mg/l or 100 µg/L in streams
or flowing waters not discharging into lakes or reservoirs to control algal growth (USEPA,
1986). Surface waters that are maintained at 10 to 30 µg/l of total phosphorus tend to remain
uncontaminated by algal blooms. Phosphate itself does not have notable adverse health
effects. Phosphate levels greater than 1.0 may interfere with coagulation in water treatment
plants and deteriorate the result of water treatment and microbiological removal. Phosphate is
a limiting factor for plant growth in freshwater aquatic systems and high phosphate
concentrations stimulate primary production in lakes and reservoirs such as algae. The natural
background levels of total phosphorus are generally less than 0.05 mg/l. Sources of phosphate
are natural (weathering and erosion of material) and anthropogenic from fertilizers or sewage.
Thus settlements and agriculture are the main sources. There is strong sorption of phosphate
and therefore transport takes place in particulate form attached to sediments. Erosion control
and water treatment can reduce phosphate concentrations.
In the second map presented in Figure 3 indicators of pollution with organic material or
sewage such as the chemical oxygen demand by slow degradation with strong reductants
(COD), the biochemical oxygen demand by rapid degradation (BOD) and lastly - biological
indicators of pollution such as feacal coliforms and e. coli bacteria have been analyzed and
visualized per river section on a national map. Biochemical Oxygen Demand (BOD5) is
defined as the amount of oxygen required by bacteria to decompose organic matter for a
specified time (usually 5 days) under aerobic conditions.

Rwanda National Water Resources Master Plan Page 20
MINIRENA-RNRA OCTOBER 2015
BOD5 is commonly used to measure natural organic pollution. This value is important as it
controls the level of oxygen in rivers which in turn controls the living conditions for higher
organisms. Main sources for organic loads are sewage from settlements, sewage from
breweries and slaughterhouses, but also regionally specific sources such as coffee washing
sites. The natural oxygen concentration of tropical rivers ranges from 5 to 10 mg/L oxygen. A
BOD5 exceeding this threshold would have the capacity to annihilate the oxygen content in a
natural river water within 5 days. Fortunately, rivers are aerated and dissolve oxygen from the
atmosphere. This aeration capacity depends on the turbulence of rivers and is higher in high
mountain reaches and lower in low mountain reaches. Combining all aspects the acceptable
BOD depends on the reaeration capacity. As a rule of thumb BOD5 of < 5 mg/L is very good,
< 10 represents good conditions and satisfactory conditions are given by BOD5 of 10-30
mg/L.
Chemical Oxygen Demand is defined as the oxygen equivalent of the organic portion of the
sample that is susceptible to oxidation by a strong chemical oxidant. However, this oxidation
is slower and not fully realized in natural rivers. COD is therefore higher and accordingly the
thresholds for very good (10 mg/L), good (20 mg/L and satisfactory conditions (50 mg/L) are
higher. Sources of COD can be anthropogenic but also natural and include dissolved organic
matter from wetlands. Especially particulate organic matter that is not easily dissolved
(lignine) contributes to COD. COD can be reduced by controlling erosion and by the same
measures that reduce BOD5.
The water quality index for organic pollution contains 4 indicators and parameters, chemical
oxygen demand (COD), biological oxygen demand (BOD), the counts and number of e. coli
bacterio per 100 ml sample and of faecal coliforms per 100 ml water. For E. coli and faecal
coliforms the number of counts per 100 ml sample are indicators of the hygienic conditions.
High counts indicate a direct pollution by sewage (anthropogenic) or other sources of faecies
(cattle, animals). They pose a direct health risk for human activities and need to be kept as
low as possible.
In summary, heavy metals only occur locally. Elevated concentrations of Arsenic were found
in one geothermal source at Burambo and is of geogenic origin – still this source cannot be
used without further treatment. Elevated concentrations of copper (Cu) were found in 5
samples in e.g. Muvumba, Nyabugogo, and Nyabarongo water. Elevated Zinc (Zn) was found
in some instances. These can result from natural sources but often they result from mining
activities and ore washing facilities. It is important to monitor these facilities and to develop
regulations, procedures and technology to limit pollution from the planning phase of the
mining operation by an environmental impact assessment (E.I.A) for each operation and
phase. It is even more important to watch the nexus between industries or other polluting
activities, water and agriculture as an indirect use or drinking water as a direct use. Heavy
metal pollution of irrigated fields common in Rwanda downstream of mining or industrial
operations can lead to an enrichment of metals. Therefore, also remote connections of water
quality impacts need to be accounted for.
The main problems of water quality are:
high loads of e. coli and coliform bacteria (and others not measured) from untreated
sewage
high organic loads and high biological oxygen demands (BOD) and chemical oxygen
demands and resulting low concentrations of oxygen (mg/L)
very high sediment loads and turbidity

Rwanda National Water Resources Master Plan Page 21
MINIRENA-RNRA OCTOBER 2015
A river that is strongly affected is Sebeya river with high loads of sediments and high bacteria
counts. The Nyabugogo carries high loads of nutrients (total nitrogen and phosphorus). It is
important to continue monitoring sediment loads, chemical status and nutrient load. Based on
these findings sources need to be identified and measures identified to reduce these loads.
The percentage of households with access to sanitation and then treatment needs to be
increased, especially for areas with high density of population (Nyabugogo and Sebeya,
Musanze). The Nyabarongo being also an indirect recharge source for the water supply of
Kigali it is important to monitor, protect and reduce loads of organic matter and nutrients to
this river too. No specific problems with fluoride were noted. Fluoride can be a problem in
volcanic rock aquifers and needs to be monitored in the north (Musanze, Mukungwa) and in
the South-West (Rusizi). Fluoride concentrations should not exceed 1 mg/L.
1.6.4 ADDITIONAL RESOURCES OPPORTUNITIES AT LEVEL 1 CATCHMENT
For the mobilization of additional resources at the level 1 catchment two methods are
commonly applied:
the construction of surface water storage facilities and
the reuse of waste water from any use process
These modalities of these methods will be briefly discussed in this section.
ARTIFICIAL SURFACE WATER STORAGE RESERVOIRS
The impact of an artificial surface water storage reservoirs on the natural hydrological cycle
is a redistribution of the surface water availability from the wet months to the dry months
(catchment regulation) at the cost of an increase of the water balance evaporation losses over
the redistributed volume. The precise impact depends on a series of meteorological,
catchment and reservoir parameters including operation rules as applied for the specific
reservoir in question.
Within the context of the Irrigation Master Plan, a list of 107 potential surface water storage
reservoir sites was identified and a further 36 sites were identified by the LWH project (1 or 2
sites are identical - details are available in annex C2_3_5). Within the context of the
catchment Master Plan formulations, these potential dam sites have been considered for their
relevance for the purpose of irrigation as well as for the enhancement of dry season resources
availability.
While essential characteristics of these sites were mostly not available, a very approximate
yet systematic assessment of sites has been done which permitted to present a number of
evaluation criteria for all the potential sites. Because the evaluation is largely based on the
interpretation of data from 1 on 50 000 topographic maps with 25 meter contour lines, the
precision of the method is not very high. However, it is assumed that the method is good
enough to differentiate between good and poor sites in a catchment. The assessment did not
comprise any geotechnical consideration of dam or reservoir site. Particularly the following
indicators were used:
dam height at which irrigation command area water demand can be reasonably served;
there is interest to remain below the 15 m large dam threshold of the ICLD
(International Commission on Large Dams); dams heights were raised or lowered by

Rwanda National Water Resources Master Plan Page 22
MINIRENA-RNRA OCTOBER 2015
5 m steps from 14 m starting point with a minimum of 6 and a maximum of 24
meters.
reservoir effective volume; the higher the better; volumes below 1 MCM are of little
interest
the ratio of the reservoir effective volume over the MAR (Mean Annual Runoff);
when the reservoir volume exceeds the 60 or 70 % of MAR, the reservoir operation
may become gradually less efficient for intra annual flow regulation contributing
more to evaporation losses than to effective dry season water use;
the ratio of reservoir volume over irrigation demand; the indicator is calculated but for
most catchments additional capacity is very useful (see reservoir effective volume)
the ratio of reservoir volume over dam volume; this indicator is without a doubt very
imprecise but excellent to identify and discard poor dam sites.
Details of the method and results are indicated in each of the catchment Master Plans (see
appendixes 01 - 09°
Especially in the more undulating hills of the Eastern catchments (NAKU, NAKL, NMUV)
and considering the significant projected demand in combination with limited resources, a
number of important sites has been endorsed. These sites can be used for dam irrigation but
are evenly relevant for other uses (hydropower, DWS, industrial use, other irrigation, etc.)
It is expected that the reservoir storage capacities defined from the 1 in 50 000 topographic
maps, are significantly underestimated. In the context of resources assessment and the
formulation of catchment master plans with monthly water balance, this is only prudent.
REUSE OF WASTE WATER
A further prospect for the generation of additional resources is the realization of water reuse
activities. Opportunities are available where large amounts of water are used that are not
entirely consumptive. These conditions are typically found in urban water supply, sizeable
industrial users, mining, coffee washing stations, hydropower installations, and the irrigation
sector. For all opportunities that are identified there are a number of aspects to consider:
what is the used water availability over time? Is it sufficient or can it be developed as
a complementary resource?
where is the used water available? Is it at a convenient location? Does it need
conveyance? Does it need lift?
what is the used water quality? Is the quality acceptable for restitution in the natural
hydrological cycle? Is the quality satisfactory for the intended water use? Does it need
treatment? Does it need treatment after the water use for restitution in the natural
hydrological cycle?
what are the alternative options for mobilizing the necessary resources? What are the
long term financial, social and environmental consequences of the water reuse option
in comparison with the alternative solution or solutions?
As for any other water resources development activity, potential water reuse opportunities
should be processed through a normal project cycle of i) identification of demand, ii)
inventory of possible solutions, iii) selection of best solution, iv) validation of best solution

Rwanda National Water Resources Master Plan Page 23
MINIRENA-RNRA OCTOBER 2015
(is the solution good enough?), v) design, implementation and exploitation of validated best
solution.
Hence, water reuse opportunities should not be implemented per se because it sounds in
agreement with the IWRM approach. On the other hand, when assessing water reuse
opportunities, they should be validated in a holistic context, considering (environmental)
costs of the non-reused waste water in the equation (irrespective of whoever may be
responsible for the waste water and its costs).
For the national and catchment Master Plans, and the water balances that define the
foundation of these Master Plans, water reuse opportunities have not been considered other
than by disregarding water demand for non consumptive hydropower water use, and
recommending less water efficient irrigation infrastructure at specific locations.
It is expected that future catchment balances and more in depth catchment master plans in
highly committed catchments will have ample opportunity for the development of water reuse
solutions.
1.6.5 SUSTAINING WATER RESOURCES AT LEVEL 1 CATCHMENT
Several pressures may affect water resources sustainability at all catchment levels: Pressure
changes can be internal when they result from changes in land use, pollution, impacts from
water sectors such as agriculture or be external for instance climate change. The key
objective of water resources management in Rwanda is to assure a sustainable use of water
resources. In order to achieve this objective, specific strategies need to be adopted for dealing
with internal and external pressures:
Implementation of monitoring programs for operational, surveillance and
investigative monitoring to assure sustainable water resources in terms of quantity and
quality
Environmental impact assessment for activities from all sectors affecting water
resources, such as mining, agriculture and urbanization
Development of capacities of strategic planning of water resources and continuous
update of the Masterplan of Water Resources of Rwanda for increasing resilience of
the water resources systems and water supplies to climate change and other changes
(global change)
1.6.5.1 IMPLEMENTATION OF MONITORING PROGRAMS
The status of water resources needs to be monitored continuously by an efficient and
comprehensive monitoring program covering surface and groundwater and both quantity and
quality.
The Masterplan provides a division of catchments at three levels (1, 2 and 3) and a definition
of surface and groundwater bodies. These are the surface and groundwater systems to be
monitored. Monitoring must be based on indicators as well as benchmarks with which the
indicators are compared. The Rwanda National Water Resources Masterplan provides
benchmarks for both surface and groundwater quantity and quality. The benchmark are based

Rwanda National Water Resources Master Plan Page 24
MINIRENA-RNRA OCTOBER 2015
on the analysis of all available records of surface water levels and discharges and on new
investigations on groundwater levels and water quality in rivers and groundwater.
Operational monitoring of water resources in level 1 catchments provides a continuous track-
record of surface and groundwater levels and discharge and of water quality parameters. The
data obtained from operational monitoring programs indicate whether water resources
indicators remain within the bounds of variability or whether they trend indicating changes to
hydrological systems. The work done for the Masterplan and a status assessment based on
these investigations already indicate that some water bodies and basins are at risk.
These water bodies at risk are affected by land use changes and suffer actual or imminent
depletion of water resources. Water bodies at risk can also be affected by pollution or are at
risk of being affected in the near future. For these basins monitoring needs to be intensified
and a closer surveillance monitoring of changes needs to be carried out. Impacts and resulting
changes can be tracked by surveillance monitoring programs that lead to a status assessment
and a definition of water management targets and time frames. Once these management
targets are defined, adequate measures can be developed and implemented to revert changes
and achieve environmental or hydrological targets. This management cycle (Figure 4) leads
to a continuous monitoring of water resources.
Figure 4: Management cycle for water resources assessment in Rwanda
In some cases investigative monitoring is needed to develop regional expertise and
knowledge on potential impacts and risks for water resources. Some special investigations
have been carried out during the Masterplan study:

Rwanda National Water Resources Master Plan Page 25
MINIRENA-RNRA OCTOBER 2015
Groundwater recharge assessment using isotope methods has been carried out for the
first time defining the replenishment and sustainable yield of aquifers
Flood risk assessments have been carried out for topographic flood risk and for the
Mpazi basin in Kigali proposing a flood mitigation plan
Monitoring in small basins has been launched and carried out for the first time to
monitor floods from small basins.
Further investigative monitoring programs need to follow up in the future in order to provide
a basis for IWRM in Rwanda:
The impact of different irrigation schemes on water resources must be assessed by
special investigation programs. This is of paramount importance. Because of the
ambitious irrigation program defined in the Irrigation Master Plan of Rwanda, even
small impacts on the hydrological cycle may have significant consequences on water
services. This is especially important for the eastern part of Rwanda (Akagera) with a
balanced or even seasonally negative water balance. An example is given in Figure 5.
Different types of irrigation need to be investigated in terms of their impact on water
resources, water quality and sediment transport. Irrigation practice needs to be
improved and adapted in a way to sustain water resources.
The impact of urbanization of flood risk needs to be investigated. The case of Mpazi -
Nyabugogo for Kigali showed that flood production can increase by orders of
magnitude in urbanized basins. Urbanization schemes need to take heed of their
footprint on flood generation.
Figure 5: Requirement for special investigations on impact of irrigation (Akanyaru basin)

Rwanda National Water Resources Master Plan Page 26
MINIRENA-RNRA OCTOBER 2015
1.6.5.2 ENVIRONMENTAL IMPACT ASSESSMENT
Internal pressures need to be controlled and the RNRA-IWRM needs to assure that
developments and envisaged interventions affecting sustainable water resources use are
anticipated, where possible entirely avoided or otherwise controlled by Integrated Water
Resources Management. A thorough analysis of developments that may affect water
resources needs to be carried out regularly.
Changes in land use practice and developments in all sectors that may or will affect water
resources need to be evaluated by environmental impact assessment (EIA): Major
construction works infrastructure development, mining, development of irrigation schemes,
urbanization and the impact these activities have on water resources in terms of quantity and
quality need to be assessed by EIAs. EIAs need to follow thorough standards and be carried
out with public participation and independent institutions not having specific interest in the
results or outcomes of EIAs (avoiding conflicts of interest).
Monitoring data indicate that there are several activities that may cause local or even regional
impacts:
Mining activities are on the increase and, unless corrective measures are implemented
systematically, these mines will have an impact on the aquatic environment by
releasing heavy metals from the mined ore and from chemicals used in the mining
process. Mining infrastructure, such as tailings dams, need to be assessed for their
impact on the hydrological cycle in terms of water quantity and water quality. This
includes two aspects: For each mine a 'mine water balance' must be established
defining in and outgoing water needs for all mining activities (also indirect ones). The
source of water and the treatment of release of water need to be described in detail in
an EIA and the anticipated impact on the environment and on other sectors must be
assessed. This sector integration is crucial as heavy metals may enter the food chain
(use of water for irrigation and pollution of food grown from irrigated agriculture).
Environmental assessment of activities needs to be carried out for mine infrastructure
and include an evaluation of floods and risks from failure of infrastructure and
measures to control these risks.
Irrigated agriculture may have an impact on water resources. It is fully recognized that
it is of paramount importance to develop food production. Still, the development must
also take into account impact on water resources and on other irrigation schemes. The
need for special investigations has been mentioned in the previous chapter. It is
strongly recommended that impact assessments on flow regime of downstream basins
becomes part of every feasibility study for irrigation schemes and that irrigation
schemes be equipped with monitoring facilities to monitor and document the impact.
The EIA process involves a sequence of steps starting from social baseline studies, involving
a detailed project description and thorough study and impact analysis. It is important that the
predicted outcomes be monitored as well. The results must be reviewed in the beginning for
re-assessed and continued approval (or additional corrective measures) after some time (1, 3
or 5 years) based on the monitoring results.
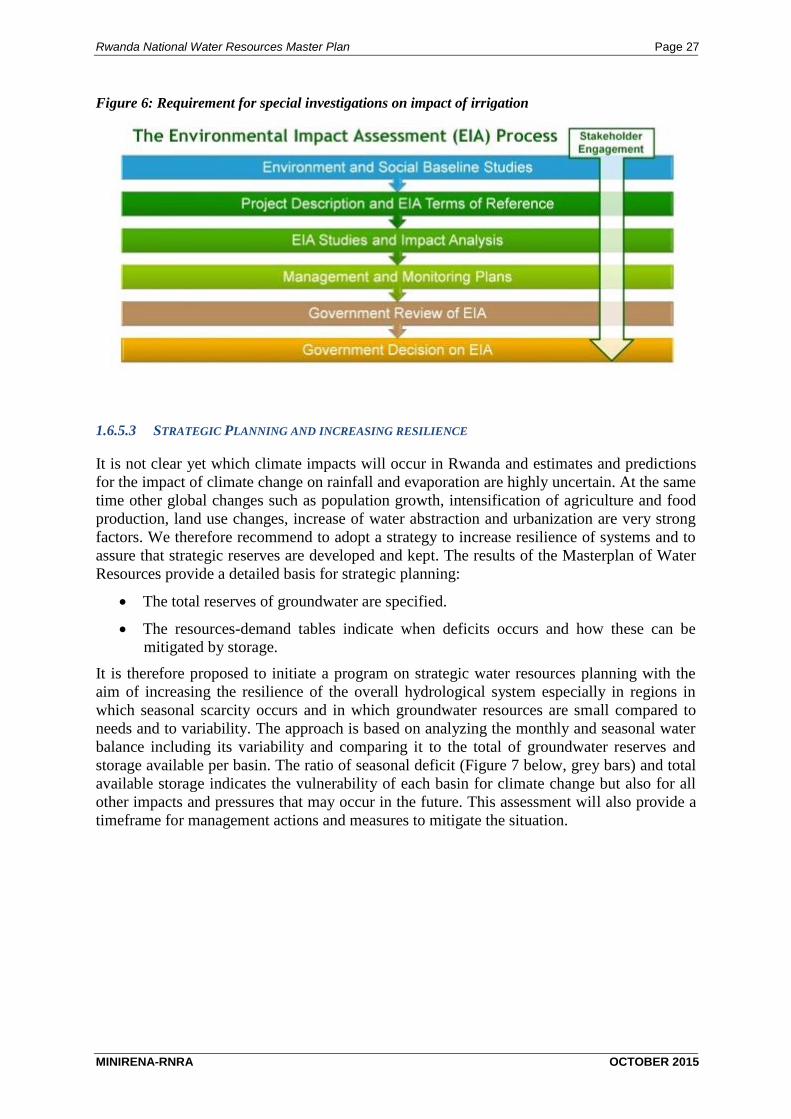
Rwanda National Water Resources Master Plan Page 27
MINIRENA-RNRA OCTOBER 2015
Figure 6: Requirement for special investigations on impact of irrigation
1.6.5.3 STRATEGIC PLANNING AND INCREASING RESILIENCE
It is not clear yet which climate impacts will occur in Rwanda and estimates and predictions
for the impact of climate change on rainfall and evaporation are highly uncertain. At the same
time other global changes such as population growth, intensification of agriculture and food
production, land use changes, increase of water abstraction and urbanization are very strong
factors. We therefore recommend to adopt a strategy to increase resilience of systems and to
assure that strategic reserves are developed and kept. The results of the Masterplan of Water
Resources provide a detailed basis for strategic planning:
The total reserves of groundwater are specified.
The resources-demand tables indicate when deficits occurs and how these can be
mitigated by storage.
It is therefore proposed to initiate a program on strategic water resources planning with the
aim of increasing the resilience of the overall hydrological system especially in regions in
which seasonal scarcity occurs and in which groundwater resources are small compared to
needs and to variability. The approach is based on analyzing the monthly and seasonal water
balance including its variability and comparing it to the total of groundwater reserves and
storage available per basin. The ratio of seasonal deficit (Figure 7 below, grey bars) and total
available storage indicates the vulnerability of each basin for climate change but also for all
other impacts and pressures that may occur in the future. This assessment will also provide a
timeframe for management actions and measures to mitigate the situation.

Rwanda National Water Resources Master Plan Page 28
MINIRENA-RNRA OCTOBER 2015
Figure 7: Strategic Planning of Water Resources (Mukungwa basin)
The analysis carried out for the masterplan indicates that level 1 basins Lower Nyabarongo,
Akanyaru, Upper and lower Akagera and Muvumba will require a specific strategic planning.
In order to increase the resilience of the entire water resources system strategic reserves in the
Mukungwa basin and in the Upper Nyabarongo should be developed and kept. Redistribution
systems such as a 'natural flow path - water carrier' from Mukungwa can further improve the
resilience. The strongest impact on resilience however, will result from demand management.
Demand management is based on knowing resources in real time and on the capacity of
implementing actions timely and based on the analysis of monitoring data.
1.6.6 RESOURCES ASSESSMENT OF LEVEL 3 SURFACE CATCHMENT
The estimation of water resources for level 3 is generic. The Water MIS includes all data
from rainfall stations and from climatological stations. Based on these data rainfall maps and
evaporation data, catchment climatic water balance models on a monthly basis have been
established. In addition, runoff, peak flow, 100 year floods, 50 year floods, 10 year floods,
mean annual flow, low flow for different quantiles (95%, 65%, 50%, 35% and 5%) have been
determined and estimated for all available stations and for all basins as reported in the
exploratory phase report. All runoff values have been transformed to specific values, e.g.
mean annual runoff, peak flow or quantiles in l/s*km² or in mm/m² or in m³/s per 100 km².
Based on the relationships presented in the Exploratory Phase report, rainfall, evaporation,
runoff and recharge can now be estimated for any basin based on catchment size, location,
landuse, and geology.

Rwanda National Water Resources Master Plan Page 29
MINIRENA-RNRA OCTOBER 2015
1.7 DEMAND ASSESSMENT
This sub-chapter on demand assessment will present the volumes of consumptive use for the
current (2012) situation, the unadjusted, and finally the adjusted consumptive water demand
per catchment for 2012, 2020, 2030 and 2040.
The volume of consumptive use is rather approximate and only available as an annual sum.
The 'unadjusted' consumptive water demand per month per catchment is based on
assumptions that are mostly applied uniformly for all catchments and which ignore water
resources availability. For the 'adjusted' consumptive water demand per month per catchment
the catchment's own renewable water resources (again per month and per catchment) have
been considered as well as possible transfers of supplemental resources from upstream
catchments.
The adjusted water demand for the different time horizons form the basis for a water
resources development program which will be presented in the next sub-chapter 1.8.
1.7.1 CURRENT CONSUMPTIVE WATER USE AT LEVEL 1 CATCHMENT
Information on actual water use in Rwanda is scarce and incomplete. Information could be
obtained from EWSA on water supply production capacities for urban centers and on
presumably operational water supply infrastructure in rural areas (protected springs,
boreholes and piped water supply systems.
Information on the current command areas under different types of irrigation (rain water
harvesting irrigation ponds, marshland development, irrigation from surface water sources
(lake and river sources) and from dams) could be obtained from the Ministry of Agriculture.
This ministry also provided a specification of the water use from coffee washing stations.
Water use for other purposes (all industrial, ecological, administrative, emergency,
ornamental, etc.) when not included in the EWSA production systems, remains unaccounted
for.
Notwithstanding the delicate basis for the estimation of current water use this has been
assessed for each catchment on the basis of the following water use assumptions:
protected spring at 0.25 l/s continuously unless other discharge is specified
borehole at 6.5 m³/day
urban or rural piped water supply system at indicated production capacity
rainwater harvesting irrigation pond at 1000 m³/year
marshland development at 2000 m³/ha/year (this is additional to water use from
undeveloped marshland)
irrigation from surface or groundwater resource between 6 000 m³/ha/year for the
western areas an 8 000 m³/ha/year for the eastern areas
irrigation from dam site a maximum of two filling cycles per year or if unknown
dependant on catchment area expressed in km² which will yield a volume when
multiplied with inflow estimated between 800 mm/year for the eastern areas and 1200
mm/year for the western areas.
The assumptions for potable water supply are likely to lead to a substantial overestimation of
actual water use but there is likely a significant component of unregistered water use from

Rwanda National Water Resources Master Plan Page 30
MINIRENA-RNRA OCTOBER 2015
(unsafe) water sources. Irrigation water use is assuming full exploitation of developed areas
which is not always the case. Results are presented in the table below.
Table 12: Overview of current water use in the different catchments of Rwanda
Level 1
basin
code
Surface
area level 1
basin [km²]
renewable
resource
['000 m³]
Potable water
supply use
['000 m³]
Irrigation
water use
['000 m³]
Total water
use in
['000 m³]
% 2012 Total
water use over
resource
CKIV 2,180 898,000 5,917 440 6,357 0.71%
CRUS 504 432,000 954 890 1,844 0.43%
NNYU 3,162 1,290,000 8,400 1,193 9,593 0.74%
NMUK 1,586 905,000 3,659 0 3,659 0.40%
NNYL 3,269 899,000 11,983 7,983 19,967 2.22%
NAKN 3,265 798,000 10,815 21,195 32,010 4.01%
NAKU 2,939 504,000 9,776 16,034 25,809 5.12%
NAKL 3,223 907,000 880 8,404 9,284 1.02%
NMUV 1,587 193,000 875 9,742 10,617 5.50%
Higher water use is registered for lower Nyabarongo (NNYL) and upper Akagera (NAKU)
catchments which is related to the water use for the city of Kigali and irrigation development
in the Nyabarongo valley. Akanyaru catchment (NAKN) features both significant potable
water supply and irrigation development (mainly tributaries of Akanyaru valley). Muvumba
catchment (NMUV) indicates the highest water use which is exclusively related to irrigation
development.
Although the registration of actual water use is virtually absent and actual water use will
exceed these recorded data, the table permits to conclude that water use is still very low. The
further and accelerated development of water resources constitutes both a requirement in
terms of attaining millennium development goals with respect to water supply and sanitation
as well as a major development opportunity for water dependant commercial ventures of any
type in the fields of agriculture and industry.
1.7.2 UNADJUSTED WATER DEMAND PROJECTIONS AT LEVEL 1 CATCHMENT
The water demand projections have been discussed and proposed in chapter 4.4 of the
exploratory phase report for the 2012, 2020, 2030 and 2040 time horizons. It was presented
that the consumptive water demand is based on three foremost and interrelated drivers i.e.
population growth, increased standards of living, and economic development:
population growth is a major driver of water demand either directly through urban
and rural water supply and sanitation services, as well as indirectly through services
(e.g. energy, housing, transport, etc. that may likely require water) and a variety of
economic activities (food production, services, etc.) at household level or larger
industrial units. Population growth projections up to 2022 are based on a study by
NISR2 which presented annual population growth rates from 2007 (with an observed
2 NISR- 2009: National Population Projection 2007 - 2022.

Rwanda National Water Resources Master Plan Page 31
MINIRENA-RNRA OCTOBER 2015
annual growth rate of about 2,7 % and preceding trend data) up to 2022 (with
projected annual growth rates of 2, 2,5 and 2,8 % according to low, medium and high
population growth scenarios). The trends of these annual population growth rates have
been extrapolated by this Master Plan study up to 2040 to decline to annual growth
rates of 0.5, 1.3 and 2% according to the low, medium and high population growth
scenarios. The population peak will consequently be reached beyond the Master Plan
planning period (2040).
A further important tendency is the likelihood that the main part of the population
increase will be absorbed by urban centers almost exclusively. This tendency is
confirmed when analyzing the 2002 - 2012 census data for urban and rural sectors. In
fact, when a thriving commercial farming population needs to evolve from the current
self-sufficiency status quo, the area per farming family needs to increase which will
prevent (or even reverse!) further population growth in rural areas.
Detailed explanations on these population data have been presented in annex C4_2
(Population extrapolation data) of the Exploratory Phase Report.
The population extrapolation data for the different projection dates and growth
scenarios are presented in Table 13 below.
Table 13: Overview of population extrapolation date for Rwanda
Level 1
basin code
and
population
category
Population extrapolation data in thousands
2012 2020 2030 2040
low med. high low med. high low med. high low med. high
CKIV-rural
1 431
1 552 1 637 1 664 1 701 1 887 1 993 1 635 1 929 2 166
CKIV-urban
108
266 280 285 470 521 550 757 893 1 002
CKIV-total
1 539
1 818 1 918 1 949 2 171 2 408 2 544 2 391 2 821 3 168
CRUS-rural
327
370 390 396 409 454 480 407 480 539
CRUS-urban
20
40 42 43 80 89 94 132 156 175
CRUS-total
347
410 432 439 490 543 573 539 636 714
NNYU-rural
1 421
1 515 1 599 1 625 1 615 1 791 1 892 1 604 1 893 2 126
NNYU-urban
165
358 378 384 623 691 730 860 1 015 1 139
NNYU-total
1 586
1 873 1 976 2 009 2 238 2 482 2 621 2 464 2 907 3 265
NMUK-rural
1 095
1 096 1 157 1 176 1 183 1 312 1 385 1 198 1 413 1 587
NMUK-urban
249
491 518 526 713 791 836 890 1 050 1 179
NMUK-total
1 344
1 587 1 675 1 702 1 896 2 103 2 221 2 088 2 464 2 766
NNYL-rural
1 420
1 326 1 399 1 422 1 354 1 502 1 586 1 238 1 460 1 640
NNYL-urban
881
1 392 1 469 1 493 1 893 2 100 2 218 2 339 2 759 3 098
NNYL-total
2 301
2 719 2 868 2 915 3 247 3 602 3 804 3 576 4 220 4 738
NAKN-rural
1 181
1 267 1 337 1 359 1 325 1 469 1 552 1 327 1 566 1 758
NAKN-urban
309
494 521 529 778 863 912 989 1 167 1 311
NAKN-total
1 490
1 761 1 857 1 888 2 103 2 333 2 464 2 316 2 733 3 069
NAKU-rural
865
854 901 916 878 974 1 028 719 848 952
NAKU-urban
320
545 575 585 793 880 929 1 122 1 324 1 487
NAKU-total
1 184
1 399 1 476 1 500 1 671 1 854 1 958 1 841 2 172 2 439

Rwanda National Water Resources Master Plan Page 32
MINIRENA-RNRA OCTOBER 2015
Level 1
basin code
and
population
category
Population extrapolation data in thousands
2012 2020 2030 2040
low med. high low med. high low med. high low med. high
NAKL-rural
514
555 585 595 585 648 685 515 608 682
NAKL-urban
39
98 103 105 195 216 228 343 405 455
NAKL-total
552
652 688 700 779 864 913 858 1 013 1 137
NMUV-rural
556
595 628 638 627 696 735 628 741 832
NMUV-urban
77
153 161 164 266 295 312 356 419 471
NMUV-total
633
748 789 802 893 991 1 047 984 1 161 1 304
TOTAL-rural
8 809
9 130 9 632 9 790 9 677 10 733 11 336 9 271 10 937 12 282
TOTAL-urban
2 167
3 837 4 047 4 114 5 812 6 447 6 809 7 788 9 188 10 318
TOTAL-total 10 976
12 967 13 680 13 904 15 490 17 180 18 145 17 059 20 126 22 600
Overall the population is expected to increase by a minimum 55 to more than 100%
over the planning period and depending on the growth scenario. There is overall a
very significant increase in urban population from less than 20% as of 2012 to about
50% by 2040. This seems to be particularly significant at the lower Nyabarongo and
upper Akagera catchments that host the predominantly urban districts of Gasabo,
Kicukiro and Nyarugenge. By 2040, about two third of the population of these
catchments will be city dwellers!
living standards are very complementary to the population growth projections in the
sense that they have a direct effect on the average per capita daily water demand /
consumption and an indirect effect through increased consumption of other goods and
services. Previous growth of livings standards in Rwanda can be gained from a further
NISR3 report that provides statistical information on levels of poverty (i.e.
consumption poverty), levels of extreme poverty (i.e. lack of basic necessities) and
the evolution of inequality based on EICV surveys in 2000/01, 2005/06 and 1010/11.
Table 14: Evolution of poverty in Rwanda
3 NISR - 2012: The evolution of poverty in Rwanda from 2000 to 2011: results from the household surveys
(EICV).

Rwanda National Water Resources Master Plan Page 33
MINIRENA-RNRA OCTOBER 2015
Table 15: Evolution of extreme poverty in Rwanda
Table 16: Evolution of inequality in Rwanda - based on Gini coefficient and 90th to 10th percentile
method.
Source for Table 14, Table 15 and Table 16 : NISR - 2012: The evolution of poverty in
Rwanda from 2000 to 2011: results from the household surveys (EICV).
Whilst further details can be obtained in the referenced report, it is clear that Rwanda's
strategies for poverty reduction are effective with significant reductions of poverty,
extreme poverty and inequality especially over the period from 2005/6 to 2010/11.
Although there is no guarantee that such past successes will continue unabatedly over
the entire planning period of the NWRMP, this study on poverty and inequality
reduction provide ample proof that a significant increase of living standards needs to
be considered for especially the Water Supply and Sanitation sector through increased
per capita daily water demand consumption.
The living standards are expected to increase over the entire duration of the Master
Plan planning period.
economic development is a major driver of additional water demand through the
implementation of a number of commercial ventures that depend on water resources.
The essential role of water in economic development is found either as a mostly

Rwanda National Water Resources Master Plan Page 34
MINIRENA-RNRA OCTOBER 2015
consumptive component (e.g. potable water supply4, irrigation sector, beer
production, etc.) or as an indispensable process element (cooling water, energy, heat
exchange, etc.) in a wide variety of production processes and further opportunities.
Rwanda has registered significant growth of its GDP over the past years (see Figure 8
below). Considering its status as a resources poor country with severe infrastructure
limitations and extreme population density, this is quite a feat. In fact, Rwanda is
highlighted in the IMF Regional Economic Outlook for Sub-Saharan Africa5 as one in
a group of six resources poor countries6 that show significant economic growth over
the past two decades. Although there is differentiation in growth 'engines' between
these six countries, the common denominator for all is a comprehensive policy vision
and strategic framework.
Figure 8: Annual GDP (real growth rate) for Rwanda from 1999 - 20117
The Rwandan policy vision and strategic approach are defined in its 'Vision 2020' and
the 'Economic Development and Poverty Reduction strategy 2013-2018' respectively.
The principal thematic areas and priorities for EDPRS2 are listed in the table below
(source: Economic Development and Poverty Reduction Strategy 2013 - 2018 -
Shaping our Development - Government of Rwanda ).
4 It may be clear from the listing of potable water supply as an economic activity, that
the boundaries between the three discussed drivers for water demand is not very strict;
they tend to reinforce each other.
5 IMF
Regional Economic Outlook - Sub-Saharan Africa - Keeping the pace - October
2013
6 Burkina Faso, Ethiopia, Mozambique, Rwanda, Tanzania, Uganda
7 source: http://www.indexmundi.com/g/g.aspx?c=rw&v=66

Rwanda National Water Resources Master Plan Page 35
MINIRENA-RNRA OCTOBER 2015
Table 17: Summary of thematic areas and priorities for EDPRS2
The principal growth sectors of this strategy are the agriculture sector (building on
major export crops coffee, tea, horticulture) with a focus on irrigation and land
husbandry, the construction sector (transport, housing, construction materials), mining
sector (clean mining), industry sector (food processing and any further options in and
around urban centers that help absorbing surplus labor force from rural areas),
tourism, education, service sector (including finance industry), and energy sector
(hydropower and other green energies). The private sector will be actively engaged in
the realization of this strategy.
From this strategy it is clear that water for economic development is principally
required for the agriculture sector and more precisely the irrigation sector. Demand
for the hydropower sector is important yet almost entirely non consumptive so that
their impact on water resources availability is none. Demand for the industry sector is
currently minor and the above listed orientations do not foretell major forays in
available water resources. However, if left without supervision, some industrial
operators may significantly affect water resources quality even when their actual
demand is limited at the scale of a catchment's water resources.
As regards irrigation water demand, the indications of the IMP (Irrigation Master
Plan) will be adjusted in each catchment for the probable water resources availability
minus demand from other categories. This means that a number of identified potential
irrigation command areas cannot be realized and an optimization process should be
implemented to pick the best options for actual development.
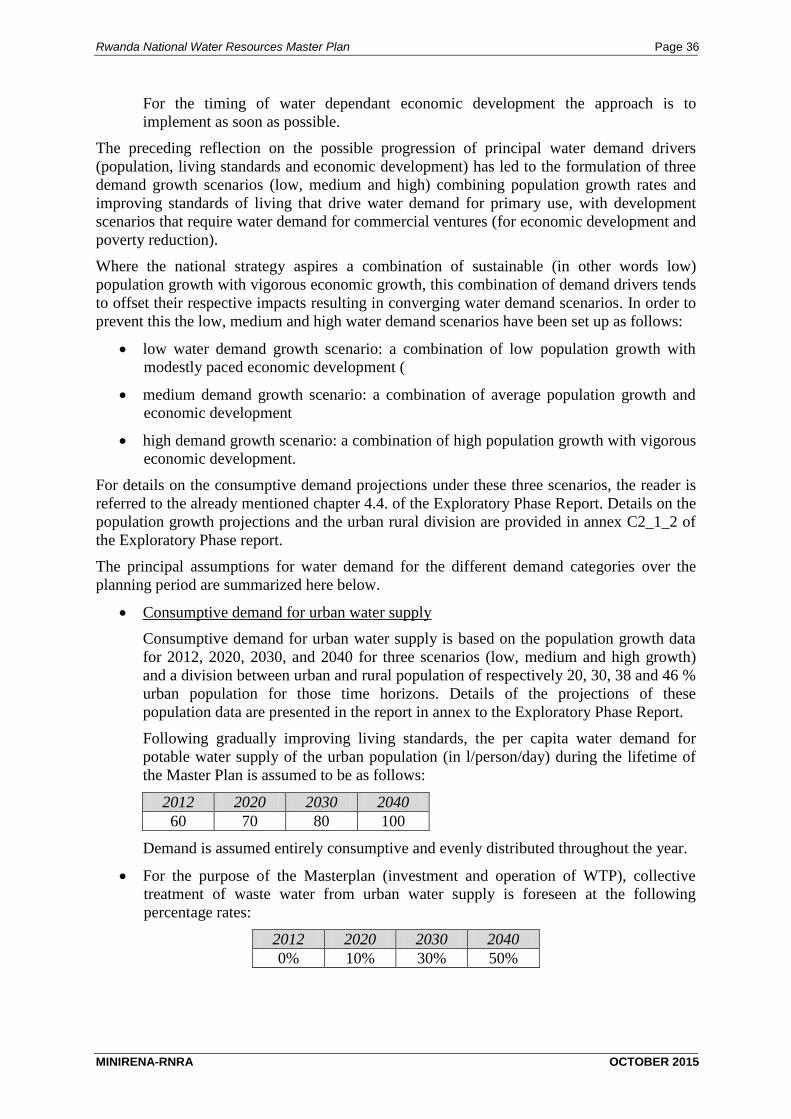
Rwanda National Water Resources Master Plan Page 36
MINIRENA-RNRA OCTOBER 2015
For the timing of water dependant economic development the approach is to
implement as soon as possible.
The preceding reflection on the possible progression of principal water demand drivers
(population, living standards and economic development) has led to the formulation of three
demand growth scenarios (low, medium and high) combining population growth rates and
improving standards of living that drive water demand for primary use, with development
scenarios that require water demand for commercial ventures (for economic development and
poverty reduction).
Where the national strategy aspires a combination of sustainable (in other words low)
population growth with vigorous economic growth, this combination of demand drivers tends
to offset their respective impacts resulting in converging water demand scenarios. In order to
prevent this the low, medium and high water demand scenarios have been set up as follows:
low water demand growth scenario: a combination of low population growth with
modestly paced economic development (
medium demand growth scenario: a combination of average population growth and
economic development
high demand growth scenario: a combination of high population growth with vigorous
economic development.
For details on the consumptive demand projections under these three scenarios, the reader is
referred to the already mentioned chapter 4.4. of the Exploratory Phase Report. Details on the
population growth projections and the urban rural division are provided in annex C2_1_2 of
the Exploratory Phase report.
The principal assumptions for water demand for the different demand categories over the
planning period are summarized here below.
Consumptive demand for urban water supply
Consumptive demand for urban water supply is based on the population growth data
for 2012, 2020, 2030, and 2040 for three scenarios (low, medium and high growth)
and a division between urban and rural population of respectively 20, 30, 38 and 46 %
urban population for those time horizons. Details of the projections of these
population data are presented in the report in annex to the Exploratory Phase Report.
Following gradually improving living standards, the per capita water demand for
potable water supply of the urban population (in l/person/day) during the lifetime of
the Master Plan is assumed to be as follows:
2012 2020 2030 2040
60 70 80 100
Demand is assumed entirely consumptive and evenly distributed throughout the year.
For the purpose of the Masterplan (investment and operation of WTP), collective
treatment of waste water from urban water supply is foreseen at the following
percentage rates:
2012 2020 2030 2040
0% 10% 30% 50%

Rwanda National Water Resources Master Plan Page 37
MINIRENA-RNRA OCTOBER 2015
Consumptive demand for rural water supply
Consumptive demand for this use group is complementary to the urban demand with
the same projections and distribution over the level 1 and 2 catchments.
Following gradually improving living standards, the per capita water demand over the
life time of the master plan is initially different but gradually converges between rural
and urban population as presented in the following table:
2012 2020 2030 2040
40 60 80 100
Demand is assumed entirely consumptive and evenly distributed throughout the year.
Collective waste water treatment is not considered necessary over the life time of the
master plan.
Consumptive demand for environmental water use
The consumptive demand for this use sector is de facto zero. However, a minimum
flow of about one third of the surface flow should remain available on a monthly
basis. This will be duly considered in the next chapter on the water balance.
Consumptive demand for industrial water use
Lacking any workable information on consumptive water use from industrial units, an
industrial water demand per population head in l/cap/day has been applied for
different growth scenarios as follows:
scenario 2012 2020 2030 2040
low 2 3 5 8
medium 2 4 7 15
high 2 5 10 20
Demand is assumed entirely consumptive and evenly distributed during the year.
The initial demand (2 l/cap/day) reflects the assessment that current supply for
industrial use is essentially included in the water supply statistics of EWSA, that the
demand for a number of industrial uses are developed separately (non hydropower
energy, coffee washing stations, etc.). and that the level of industrial production in
Rwanda is very low. The growth projections between the scenarios (factor 4 versus
factor 10 demand increase) is impossible to substantiate. The safest approach here is
to start monitoring the major industrial users with EWSA or exclusive supply through
the Water MIS and adjust the demand growth projections if ever they proof to be very
insufficient.
Heat exchange based power generation (non hydro / solar)
Separate from this demand for industrial processes, the government policy for the
energy sector foresees a very substantial increase of power production from
hydropower and other means. As these other means are generally based on heat

Rwanda National Water Resources Master Plan Page 38
MINIRENA-RNRA OCTOBER 2015
exchange (whether methane gas (300 MW in Kivu), geothermal (310 MW in Rusizi
and Mukungwa), diesel generation (diesel or HFO, current 47 MW installed capacity
plus 20 MW additional located in lower Nyabarongo) or peat (capacity not listed,
opportunities in Rusizi, Akanyaru)). A list of existing and potential (non hydro / solar
based) power generation installations is presented in annex to the Exploratory Phase
Report.
For the current and potential installations it is assumed that operation time is 90% and
that the water demand is 2 000 m³/GWh generated which is assumed entirely
consumptive and evenly distributed over the year.
Current production capacity (of diesel and HFO based production) is considered for
2012, while the full additional production capacity is considered for 2020 remaining
constant thereafter.
Coffee washing stations
Another group that we could identify with specific demand is for coffee washing
stations. These stations operate essentially during the months of March, April and
sometimes early May and require natural waters which are mostly obtained from
natural springs which are developed for this specific purpose. The table below gives
the actual and potential water consumption from the installed coffee washing
machines to which we have added a suggested annual demand for future years 2020,
2030 and 2040 at 90% of potential capacity unless actual consumption is higher. We
assume all water to be consumptive with abstraction of 40% in March, 40% in April
and 20% in May. Total demand is not very important on the scale of the Master Plan.
Level 1 basin code
Actual
consumption
['000 m³/annum]
Potential
consumption
['000 m³/annum]
Future
consumption
['000 m³/annum
CKIV 27.216 41.620 37.5
CRUS 10.584 10.080 10.0
NNYU 3.961 8.320 7.5
NMUK 0.084 0.940 0.9
NNYL 10.790 22.280 20.1
NAKN 5.054 10.480 9.5
NAKU 7.486 10.010 9.0
NAKL 1.461 1.940 1.8
NMUV 0.102 0.300 0.3
Consumptive demand for mining and quarries
Also for mining and quarries there is no workable information available. In line with
the demand from the industrial use group, we suggest the following demand
projections:
scenario 2012 2020 2030 2040
low 1 2 3 4
medium 1 2 4 7
high 1 3 5 10
Demand is assumed entirely consumptive and evenly distributed during the year.

Rwanda National Water Resources Master Plan Page 39
MINIRENA-RNRA OCTOBER 2015
The initial demand (1 l/cap/day) is a mere token water use and reflects the observation
that current water supply for mining is an entirely unregistered recirculation of surface
water, or even a 'negative' use when extracting excess water from mines. The growth
projections between the scenarios (factor 4 versus factor 10 demand increase) is
impossible to substantiate. The safest approach here is to start monitoring the major
industrial users with EWSA or exclusive supply through the Water MIS and adjust the
demand growth projections if ever they proof to be very insufficient.
Consumptive demand for livestock
Demand for livestock is based on the number of cattle per catchment. The table below
indicates the daily water consumption for the different kind of cattle commonly raised
in Rwanda.
Cattle type Assumed daily water
demand [l/head/day]
Number of cow
equivalent
Cow - local 20 1
Cow - improved - milk 50 2.5
Goat 8 0.4
Sheep 8 0.4
Swine 15 0.75
Chicken / Rabbit 0.5 0.025
Although the records of the number of cattle per administrative unit are notoriously
imprecise (fear for taxation, jealousy, ...), we have used the records at district level
and converted them to animals per catchment and then the animals to 'cow
equivalents' (see table above).
Water demand is entirely consumptive and considered evenly distributed over the
year.
As we couldn't obtain data on the number of cows of improved race for milk
production, we assume for 2012 that some 10 % of the bovines is of improved race
and requires effectively 50 l/head/day.
Considering the availability of grazing and fodder land and the limits of the carrying
capacity of such land (~1.2 cow/ha), we assume that the number of cattle remains
more or less constant over the life time of the Master Plan. There is however an
increase in the ratio of improved milk cows over total cow population as follows:
% bovine type 2012 2020 2030 2040
Cow - improved - milk 10 25 40 55
Cow - local 90 75 60 45
Consumptive demand for rain dependant agriculture
This water use is considered integral part of the natural hydrological cycle and does
not qualify as 'consumptive' water demand over the full time horizon of the
Masterplan (2012 - 2040).

Rwanda National Water Resources Master Plan Page 40
MINIRENA-RNRA OCTOBER 2015
Consumptive demand for irrigated agriculture
The consumptive demand per hectare for the irrigation methods commonly applied in
Rwanda is based on the same assumptions as presented for water use for irrigated
agriculture (see preceding paragraph 1.7.1; more details are available in the
Exploratory Phase Report).
The demand for irrigation is considered entirely consumptive with the distribution
over the year concentrated during the dry season (at a minimum 50% of annual
demand). Further details are indicated in chapter 4.3.1 of the Exploratory Phase
Report under the bullet 'Water use for irrigated agriculture'.
Consumptive demand for hydropower generation
Irrespective of the actual realization of potential hydropower projects, the
consumptive demand for this use sector is and remains zero.
Consumptive demand for fisheries
Consumptive demand for fisheries in natural water bodies (mostly lakes) as well as in
artificial ones (irrigation reservoirs) is considered zero throughout the Master Plan
lifetime.
For fish in basins a consumptive demand in thousands of cubic meters per month per
hectare is considered as follows (consumptive demand in 1 000 m³/month/ha pond):
oct nov dec jan feb mar apr may jun jul aug sep
1.0 1.0 1.0 2.0 1.0 0.5 0.5 1.0 2.0 2.0 2.0 1.0
This is based on a water demand of 7 mm/day (evaporation and seepage) during 365
days, about 1 000 mm of rainfall or an annual demand of 1 500 mm/year or 15 000
m³/ha/year.
The demand for 2012 is based on the actually exploited pond areas as given by the
PAIGELAC project (104 ha).
For the potential situation as regards fisheries in ponds we suggest 2% of the potential
irrigation domain in marshlands. After reaching 0.5% in 2020 (1 100 ha) and 1% in
2030 (2 200 ha) , the potential of 2 % (4 400 ha) will be attained in 2040.
Consumptive demand for recreational purposes
Notwithstanding that this demand may require occasional flow regulation for
adjustment of water levels, consumptive water demand for this use is rated zero over
the full time horizon of the Master Plan (2012 - 2040)
Consumptive demand for navigation / transport
Notwithstanding that this demand may require occasional flow regulation for
adjustment of water levels, consumptive water demand for this use is rated zero over
the full time horizon of the Master Plan (2012 - 2040)

Rwanda National Water Resources Master Plan Page 41
MINIRENA-RNRA OCTOBER 2015
Consumptive demand for reserved areas and eco-tourism
This water use is considered integral part of the natural hydrological cycle and does
not qualify as 'consumptive' water demand over the full time horizon of the
Masterplan (2012 - 2040).
Details of the unadjusted water demand projections are presented in chapters 3.3.1. of each of
the nine Catchment Master Plans presented in appendixes 01 up to 09. Based on this
unadjusted demand, the unadjusted water balance is reproduced from the exploratory phase
report in chapters 3.3.2. of the nine Catchment Master Plans. The main conclusions for each
of the nine catchments is presented in the paragraphs below.
1.7.2.1 MAIN OBSERVATIONS ON WATER USE AND THE UNADJUSTED DEMAND AND WATER
BALANCE FOR CKIV
Current registered demand is insignificant with less than 1% of the annually renewable
resources which stand at almost 900 MCM/yr.
Under full development by 2040 the main demand categories are expected to be:
with a demand of 124 MCM/yr, irrigation from surface water stands at 14% of the
renewable resource. It is noted that this irrigation demand is foreseen to be provided
from Lake Kivu waters which are alkaline (pH 9) and less suitable for irrigation. The
large scale development of this resource for this purpose as proposed in the RIMP,
may be questioned. Further irrigation demand from dam, marshland development and
rainwater harvesting may raise water demand to about 150 MCM/yr or about 17% of
the renewable resources.
rural drinking water supply may reach a demand of almost 80 MCM per year or 9% of
the renewable resources. Urban water supply reaches almost half the rural demand to
claim 4% of the renewable resources.
water supply for industries and mining may reach 23 and 11.5 MCM/yr to claim
together less than 4% of the renewable resource.
while important for economic development, other demand categories (coffee washing
stations, livestock, fishponds, hydropower, other power, etc.) present only marginal
demand (10 MCM or about 1 ‰).
In terms of its unadjusted water balance, the Lake Kivu catchment seems to have ample
resources overall at a monthly time interval for the unadjusted projected demand up to the
2040 all demand scenarios (low medium and high). It is only at this planning horizon and
under the assumption of a once in twenty year dry year, that the environmental flow criterion
is partially compromised during the months of January and June, July and August.
The overall water demand is scheduled to reach about 35% of the average renewable resource
(313 over 898 MCM). Apart from the issue of water quality suitability for irrigation, or
otherwise less realistic or feasible ventures, there seems little need to adjust water demand
from a water balance point of view.

Rwanda National Water Resources Master Plan Page 42
MINIRENA-RNRA OCTOBER 2015
1.7.2.2 MAIN OBSERVATIONS ON WATER USE AND THE UNADJUSTED DEMAND AND WATER
BALANCE FOR CRUS
Current registered demand is insignificant with less than 1% of the annually renewable
resources which stand at almost 432 MCM/yr.
Under full development by 2040 the main demand categories are expected to be:
rural drinking water supply may reach a demand of almost 20 MCM per year or
almost 5% of the renewable resources. Urban water supply requires about a third of
the rural demand to claim 1.5 % of the renewable resources.
with a demand of about 8 MCM/yr, irrigation in marshland remains under 2 % of the
renewable resource. There is a slight increase from irrigation from rainwater
harvesting and dam sites. Opportunities for the development of irrigation from surface
water and from groundwater resources have not been identified.
water supply for industries and mining is expected to reach 8 MCM/yr to claim
together less than 2% of the renewable resource.
while important for economic development, other demand categories (coffee washing
stations, livestock, fishponds, hydropower, other power, etc.) present only marginal
demand (under 3 MCM/year or less than 1 %).
In terms of its unadjusted water balance, the Rusizi catchment seems to have ample resources
overall at a monthly time interval for the unadjusted projected demand up to the 2040 all
demand scenarios (low medium and high). It is only at this planning horizon and under the
assumption of a once in twenty year dry year, that the environmental flow criterion is
partially compromised during the months of April and July and September.
The overall water demand is scheduled to reach about 10% of the average renewable resource
(46 over 432 MCM/year). For reasons of correction of the water balance, there seems little
need to adjust water demand.
1.7.2.3 MAIN OBSERVATIONS ON WATER USE AND THE UNADJUSTED DEMAND AND WATER
BALANCE FOR NNYU
Current registered demand is insignificant with less than 1% of the annually renewable
resources which stand at almost 1.290 MCM/yr.
Under full development by 2040 the main demand categories are expected to be:
the combined irrigation sector demand for this catchment stands at about 190
MCM/yr which represents about 15% of the average renewable resource and more
than half of the potential water demand.
with a demand of 78 MCM/year rural drinking water supply claims about 6% of the
resource which reaches about 9% (120 MCM/year) in combination with urban water
demand.
water supply for industries and mining is expected to reach 36 MCM/yr to claim
together less than 3% of the renewable resource.
while important for economic development, other demand categories (coffee washing
stations, livestock, fishponds, hydropower, etc.) present rather insignificant demand in

Rwanda National Water Resources Master Plan Page 43
MINIRENA-RNRA OCTOBER 2015
comparison with the catchment's renewable resources (under 12 MCM/year or less
than 1 %).
In terms of its unadjusted water balance, the Upper Nyabarongo catchment seems to have
ample resources overall at a monthly time interval for the unadjusted projected demand up to
the 2040 all demand scenarios (low medium and high). It is only at this planning horizon and
under the assumption of a once in twenty year dry year, that the environmental flow criterion
is partially compromised during the months of June up to September.
The overall water demand is scheduled to reach about 28% of the average renewable resource
(356 over 1,290 MCM/year). For reasons of correction of the water balance, there seems little
need to adjust water demand.
1.7.2.4 MAIN OBSERVATIONS ON WATER USE AND THE UNADJUSTED DEMAND AND WATER
BALANCE FOR NMUK
Current registered demand is insignificant with less than 0.5 % of the annually renewable
resources which stand at almost 905 MCM/yr.
Under full development by 2040 the main demand categories are expected to be:
rural drinking water supply may reach a demand of almost 60 MCM per year or some
6% of the renewable resources. With a demand of 43 MCM/year urban water supply
is also significant and the two categories combined claim about 11% of the renewable
resources.
water supply for industries and mining may reach about 30 MCM/year which
represents about 3% of the renewable resource.
irrigation demand is relatively insignificant with just 13 MCM/year or about 1.5% of
the renewable resource. Irrigation of marshland is the largest category.
other demand categories (coffee washing stations, livestock, fishponds, hydropower,
other power, etc.) present only marginal demand (under 7 MCM/year or less than 1
%) but are important for economic development opportunities.
In terms of its unadjusted water balance, the Mukungwa catchment seems to have ample
resources overall at a monthly time interval for the unadjusted projected demand under all
conditions.
The overall water demand is scheduled to reach about 17 % of the average renewable
resource (152 over 905 MCM/year). For reasons of correction of the water balance, there
seems little need to adjust water demand.
1.7.2.5 MAIN OBSERVATIONS ON WATER USE AND THE UNADJUSTED DEMAND AND WATER
BALANCE FOR NNYL
Current registered demand in the lower Nyabarongo catchment is rather insignificant
reaching just over 2% of the annually renewable resources which stand at almost 899
MCM/yr.
Under full development by 2040 the main demand categories are expected to be:

Rwanda National Water Resources Master Plan Page 44
MINIRENA-RNRA OCTOBER 2015
the combined irrigation sector demand for this catchment is rather extreme with a
demand of 170 MCM/year from surface water irrigation, almost 110 MCM/year from
groundwater irrigation, 60 MCM/year due to marshland development and almost 25
MCM/year from the development of storage reservoirs. The total demand is about 370
MCM/year which represents about 41% of the average renewable resources.
urban water demand is important with a maximum demand of 113 MCM/year which
may be complemented by rural water supply to the tune of 60 MCM/year for a total
demand of 173 MCM/year or some 19% of the renewable resource.
water supply for industries and mining is expected to reach 52 MCM/yr to claim
together some 6% of the renewable resource.
other demand categories (coffee washing stations, livestock, fishponds, hydropower,
other power, etc.) present limited demand (under 15 MCM/year or close to 2 %) but
are economically important.
In terms of its unadjusted water balance which is based on an implementation rate of the
development opportunities at about a third per decade (2014-2020, 2021-2030, 2031-2040),
the Lower Nyabarongo catchment is bound to come under stress from 2030 onwards. For the
2040 planning situation (full development), the water balance indicates that demand during
some months of the dry season cannot even be satisfied under the assumption of a once in
twenty year wet year. This may be attributed to the unbridled development of the irrigation
sector which requires important resources during the least favorable time (dry season).
The overall water demand is scheduled to reach about 68% of the average renewable resource
(607 over 899 MCM/year). It is absolutely imperative that the different water demand
categories are examined with the intend to obtain a workable water balance for this
catchment.
1.7.2.6 MAIN OBSERVATIONS ON WATER USE AND THE UNADJUSTED DEMAND AND WATER
BALANCE FOR NAKN
Standing at about 4% of the annually renewable resources which reach almost 800 MCM/yr
(798 MCM/yr), current registered demand is modest.
Under full development by 2040 the main demand categories are expected to be:
the combined irrigation sector demand for this catchment is rather extreme with a
demand of 195 MCM/year from surface water irrigation, almost 120 MCM/year from
marshland irrigation, 38 MCM/year from the development of surface water storage
reservoirs and 17 MCM/year from ground water resources. The total demand is about
370 MCM/year which represents about 46% of the average renewable resources.
rural water demand is scheduled to reach 64 MCM/year which may be complemented
by urban water supply to the tune of 48 MCM/year for a total demand of 112
MCM/year or some 14% of the renewable resource.
water supply for industries and mining is expected to reach 34 MCM/yr to claim
together some 4% of the renewable resource.
With 18 MCM/year, the demand from fishponds becomes somewhat significant at
about 2% of the average renewable resource.

Rwanda National Water Resources Master Plan Page 45
MINIRENA-RNRA OCTOBER 2015
other demand categories (coffee washing stations, livestock, hydropower, other
power, etc.) present limited demand (under 15 MCM/year or close to 2 %) but are
significant for economic development.
In terms of its unadjusted water balance which is based on an implementation rate of the
development opportunities at about a third per decade (2014-2020, 2021-2030, 2031-2040),
the Akanyaru catchment is bound to come under stress from 2020 onwards. For 2030 the
situation becomes difficult whereas for the 2040 planning situation (full development), the
water balance indicates that demand during some months of the dry season cannot even be
satisfied under the assumption of a once in twenty year wet year. This may be attributed to
the unbridled development of the irrigation sector which requires important resources during
the least favorable time (dry season).
The overall water demand is scheduled to reach about 68% of the average renewable resource
(541 over 798 MCM/year). It is absolutely imperative that the different water demand
categories are examined with the intend to obtain a workable water balance for this
catchment.
1.7.2.7 MAIN OBSERVATIONS ON WATER USE AND THE UNADJUSTED DEMAND AND WATER
BALANCE FOR NAKU
Standing at about 5% of the annually renewable resources which reach some 500 MCM/yr
(504 MCM/yr), current registered demand is modest.
Under full development by 2040 the main demand categories are expected to be:
the combined irrigation sector demand for this catchment is rather extreme with a
demand of 407 MCM/year from surface water irrigation, 72 MCM/year from
marshland irrigation and 48 MCM/year from the development of surface water
storage reservoirs. The total demand is about 458 MCM/year which represents about
92% of the average renewable resources.
urban water demand is scheduled to reach 54 MCM/year which may be
complemented by demand from urban water supply at a rate of 35 MCM/year for a
total demand of 89 MCM/year or some 18 % of the renewable resource.
water supply for industries and mining is expected to reach 27 MCM/yr to claim
combined some 5 % of the renewable resource.
With 11 MCM/year, the demand from fishponds becomes somewhat significant at
about 2% of the average renewable resource.
other demand categories (coffee washing stations, livestock, etc.) present limited
demand (under 3 MCM/year or less than 1 %) but are significant for economic
development.
In terms of its unadjusted water balance which is based on an implementation rate of the
development opportunities at about a third per decade (2014-2020, 2021-2030, 2031-2040),
the upper Akagera catchment is bound to come under stress from 2020 onwards. Already by
2030 the situation becomes very difficult whereas for the 2040 planning situation (full
development), the water balance is completely unmanageable unless external resources are
mobilized. The unmanageable water balance is largely due to the unbridled development of

Rwanda National Water Resources Master Plan Page 46
MINIRENA-RNRA OCTOBER 2015
the irrigation sector which requires important resources during the least favorable time (dry
season).
The (unadjusted) overall water demand is scheduled to reach about 130% of the average
renewable resource (657 over 504 MCM/year). It is absolutely imperative that the different
water demand categories are examined with the intend to obtain a workable water balance for
this catchment. There may further be need to mobilize external resources.
1.7.2.8 MAIN OBSERVATIONS ON WATER USE AND THE UNADJUSTED DEMAND AND WATER
BALANCE FOR NAKL
Current registered demand is very modes claiming just 1% of the annually renewable
resources which stand at 907 MCM/yr.
Under full development by 2040 the main demand categories are expected to be:
the combined irrigation sector demand for this catchment is very important with a
demand of 263 MCM/year from surface water irrigation, 65 MCM/year from
marshland irrigation, 68 MCM/year from groundwater irrigation and 12 MCM/year
from the development of surface water storage reservoirs. The total demand is about
410 MCM/year which represents about 45% of the average renewable resources.
rural water demand is scheduled to reach 25 MCM/year which may be complemented
by demand from urban water supply at a rate of 17 MCM/year for a total demand of
42 MCM/year or some 5 % of the renewable resource.
water supply for industries and mining is expected not to exceed 12 MCM/yr which
represents just 1% of the renewable resource.
demand from fish ponds is foreseen at a maximum 11 MCM/year; this demand
becomes somewhat significant at about 1% of the average renewable resource.
other demand categories (mainly livestock) present limited demand (under 3
MCM/year or some 3 ‰) but they are significant drivers for economic development.
In terms of its unadjusted water balance which is based on an implementation rate of the
development opportunities at about a third per decade (2014-2020, 2021-2030, 2031-2040),
the lower Akagera catchment is bound to undergo some limited stress during drier years from
2030 onwards. By 2040 the water supply situation becomes difficult at the end of the dry
season for all but the wettest years (once in twenty years wet or better) whence rationing or
other measures will be required.
The overall water demand is scheduled to reach about 53% of the average renewable resource
(477 over 907 MCM/year). It is imperative that especially the irrigation sector demand be
examined with the intend to secure a viable water balance for this catchment up to 2040. It is
possible to mobilize external resources.
1.7.2.9 MAIN OBSERVATIONS ON WATER USE AND THE UNADJUSTED DEMAND AND WATER
BALANCE FOR NMUV
Standing at about 5 to 6% of the annually renewable resources which reach only 193
MCM/year, current registered demand is modest.

Rwanda National Water Resources Master Plan Page 47
MINIRENA-RNRA OCTOBER 2015
Under full development by 2040 the main demand categories are expected to be:
the combined irrigation sector demand for this catchment is important with a demand
of 81 MCM/year from surface water irrigation, 51 MCM/year from marshland
irrigation and about 11 MCM/year from the development of surface water storage
reservoirs. The total demand is about 145 MCM/year which represents 75% of the
average renewable resources.
rural water demand is scheduled to reach 30 MCM/year which may be complemented
by demand from urban water supply at a rate of 17 MCM/year for a total demand of
47 MCM/year or some 24 % of the renewable resource.
water supply for industries and mining is expected not to attain a maximum level of
14 MCM/yr which represents nonetheless 7% of the renewable resource.
demand from fish ponds may reach 8 MCM/year, this demand is significant at about
4% of the average renewable resource.
other demand categories (mainly livestock, with some smaller hydropower sites in the
NMUV_1 sub catchment - Gicumbi district) present limited demand (about 2
MCM/year or some 1 %) but they are significant drivers for economic development.
In terms of its unadjusted water balance which is based on an implementation rate of the
development opportunities at about a third per decade (2014-2020, 2021-2030, 2031-2040),
the Muvumba catchment already encounters limited stress during during the dry season for
drier years. By 2020, environmental flow requirements will be routinely compromised during
both the dry and wet season, by 2030 the water supply situation will be very difficult to
manage, while by 2040 it will be impossible to correctly manage the water demand during
most of the year for any hydrological year. With a potential demand at 75% of the average
renewable resources, the irrigation sector is the main cause for this condition.
The overall water demand is scheduled to reach about 112% of the average renewable
resource (216 over 193 MCM/year). It is imperative that especially the irrigation sector
demand be examined with the intend to secure a viable water balance for this catchment up to
2040. The mobilization of external resources (interbasin transfer), is not very evident and
most of the catchment is located outside of Rwanda (2 146 km² of the catchment is located in
Uganda against 1 568 km² in Rwanda) with rather complex flow patterns.
1.7.2.10 SUMMARY OF WATER USE AND THE UNADJUSTED DEMAND AND WATER BALANCE FOR
NNYL
Current water use is moderate or even insignificant for each of the nine identified catchments
of Rwanda.
As regards the unadjusted water balances, the Muvumba (NMUV) and Akanyaru (NAKN)
catchments show signs of imminent water stress conditions. Both of these catchments are
headwaters so a interbasin transfer is not an obvious solution to complement resources.
When considering the circumstance that the Rubyiro catchment in Rusizi level 1 catchment
(CRUS) generates about one third of the catchment resources but caters for almost all
demand, this sub area (level 2 catchment CRUS_1) may also be put forward for special
consideration. The required level of detail for such investigation is not envisaged under this
national water resources Master Plan study.

Rwanda National Water Resources Master Plan Page 48
MINIRENA-RNRA OCTOBER 2015
The situation in the lower Nyabarongo (NNYL) and the upper and lower Akagera (NAKU
and NAKL respectively) catchments, is less pressing but it is unmistakable that water supply
problems will arise prior to 2040 if and when all envisaged development activities are
implemented without further consideration. It is in principle possible to complement the
resources of these catchments by means of a transfer from upstream catchments (interbasin
transfer) with surplus resources.
The Upper Nyabarongo (NNYU) and Mukungwa (NMUK) catchments have abundant
resources and constitute a true water tower for the entire Nile basin in Rwanda providing
resources for future interbasin transfers backed by, especially for the upper Nyabarongo,
major groundwater reserves. A similar condition is encountered for the Lake Kivu catchment
(CKIV) where renewable resources exceed water demand up to 2040. This is also the case for
the CRUS catchment with the exception for the particular conditions in the CRUS_1
subcatchment (Rubyiro river).
It should be mentioned that an analysis at level 1 catchment that reveals little or no stress
condition, does not preclude possible stress conditions at specific locations and at specific
times in smaller tributaries of the level 1 catchment.
1.7.3 ADJUSTED DEMAND ASSESSMENT OF LEVEL 1 CATCHMENT
The unadjusted demand discussed in the previous section (paragraph 1.7.2 and
subparagraphs) is based on a set of assumptions which may present slight alterations as per
the region (from East to West), but these assumptions are then applied without much
consideration for catchment specific conditions including resources availability. This
approach has proven very useful because it directly indicates which catchments are likely to
encounter water supply difficulties sometime during the planning period of the Master Plan.
The results have been presented in the preceding paragraph.
Based on this identification of possible stress conditions, the objective of this section is to
'resolve' the identified stress condition. This resolutions follows a logical process as follows:
The first question to address is whether all projected demand is relevant and feasible?
The demand in the group of primary use (urban and rural water supply, livestock to
some extent) will only be curtailed when absolutely necessary. In the group of
industrial demand it doesn't make sense to curtail a demand that is not very important
in terms of quantity of water but which is known to contribute significantly to the
national economy (e.g. coffee washing stations, other power, livestock, etc.).
However, when resources are limited, it may be considered to adopt a strategy to refer
new water intense industries (or even transfer existing industries) to other catchments
that have a better balance between resources and demand. In the group of irrigation
demand a number of development options has been identified as less likely to be
financially and economically feasible. This specifically relates to hill side irrigation
requiring significant lift from the water source to the irrigation command area. For
this purpose, the lake and river command areas identified in the RIMP have been
divided in four groups according to the required lift up to 25, from 25 - 50, from 50 to
100 and finally above 100 m lift (see annex C2_3_4 for details). It is not necessarily
required that a command area requiring a lift above 100 m is not feasible but the
exploitation costs rise to a level which imposes a very high exploitation standard
which is unlikely to be easily obtained at a large scale.

Rwanda National Water Resources Master Plan Page 49
MINIRENA-RNRA OCTOBER 2015
It is also recommended to verify if the water allocation per demand category is
correct; if not adjustments (increase or decrease of allocation per person, hectare,
other driver) need to be made. Please note that the Master Plan operates at a larger
scale and the allocation per demand category needs to be a representative value that is
preferably not underestimated. The 'precision' of the allocation estimate is especially
important for larger demand categories and in fact rather unimportant for smaller
demand categories. The precision also refers to the time of the year when the
allocation is likely to take place.
The next step is to verify if catchment resources are generally sufficient to cater for
the confirmed projected demand throughout the year up to the conclusion of the
Master Plan planning period. If such is the case the implementation schedule of
especially the commercial demand can be checked. If resources are available it makes
sense to implement the feasible commercial opportunities as early as possible.
if the catchment resources are not sufficient to cater for the projected demand there
are a number of options:
o curtailing on feasible demand. There are many possibilities; not developing a
profitable commercial venture, developing a commercial venture which will
not be fully supplied under more or less exceptional conditions (e.g. partial
supply during part of the year occurring once in ten years); introducing
allocation rules for water supply between primary and commercial use,
applying demand management principles, etc.
o regulation of catchment (surface water) resources. This applies typically to the
development of surface water storage by means of larger dams that allow to
carry water over from the wet season months to the following dry season
months. When suitable conditions are available it is also possible to recharge
groundwater reservoirs for later use.
o reuse of used water. This may vary from very simple reuse of irrigation
drainage waters to much more sophisticated collection, treatment and
redistribution of urban water supply for any appropriate use either as an
exclusive or complementary sources of water supply
o transfer of resources from a lateral or upstream catchment. Again this may
involve a very simple release of (stored) water through a natural river to be
captured downstream, or capital intensive piped conveyance system possibly
involving tunneling, pumping stations, etc.
Depending on the situation of the catchment with respect to the ecological and
environmental consequences of temporary stress conditions (limited, reversible
temporary impact), the economic and social viability of occasional non- or limited
supply to primary use and commercial water use ventures, the investment and
operational costs of additional resources development works (resources regulation,
reuse, transfer, etc.), and in general the water resources management skills that can be
called upon, a blend of the above indicated solutions may be proposed.
The findings for this verification and adjustment process for each catchment are presented in
the following subparagraphs.

Rwanda National Water Resources Master Plan Page 50
MINIRENA-RNRA OCTOBER 2015
1.7.3.1 ADJUSTED DEMAND AND WATER BALANCE FOR CKIV
Details of the demand analysis for the CKIV catchment are given in paragraph 3.3.3. of the
Catchment Master Plan for the Lake Kivu catchment (appendix 01CKIV).
From paragraph 1.7.2.1 it is clear that the water balance of the catchment does not impose
adjustment of the different demand categories.
Consequently, all demand for potable water supply, sanitation, industries, mining, livestock,
fisheries, hydropower, non consumptive and other energy demand was reviewed and
thereupon maintained as is. There are however a number of changes in the irrigation sector
found necessary as follows:
irrigation by means of rainwater harvesting ponds: increased demand (double from
Exploratory phase report estimate) due to presumed higher intensity use of same
number of ponds (from 1 000 m³/yr to 2 000 m³/yr)
irrigation by means of marshland development: because of the interesting
performance and reduced investment and operational costs of this method, the full
development potential as identified in the RIMP has been put forward for
development during the first stage of the Master Plan, the period prior to 2020. The
per hectare water demand for this method (2 000 m³/ha/yr) has not been changed. The
annual and monthly demand for 2020 and 2030 have been increased to the level
initially foreseen for 2040. The 2040 water demand has not been changed.
irrigation from surface water sources: this irrigation method is expensive in
investment and exploitation costs; the latter especially when irrigating land at higher
level from the water source level. For this reason, the 20 000 + ha foreseen in the
RIMP report has been separated in 4 altitude classes and only the lower 2 altitude
classes (0-25 and 25-50 m lift from source level) for a total of 6 100 ha command
area, have been considered for gradual development during the lifetime of the Master
Plan. The per hectare water demand for this method (6 000 m³/ha/yr) has not been
changed. This resulted in a very substantial demand reduction from 124 MCM/year to
37 MCM/year. There is an issue with the alkaline water quality of Lake Kivu water
which seems not very suitable for irrigation.
irrigation with surface water storage reservoirs: this irrigation method is very
expensive in investment cost (dam development and irrigation command area) and an
effort has been made to assess the viability of the different sites identified in the
RIMP. Out of 11 identified sites 4 have been judged as sufficiently interesting in
terms of site configuration and storage volume. The water demand from this irrigation
method was initially based on command area (assuming that storage was sufficient).
The update of the demand (which comprises multipurpose use) has given the same
results (from 17.1 MCM/year to 17.6 MCM/year).
The adjusted water balance for the CKIV catchment is presented in the table below.
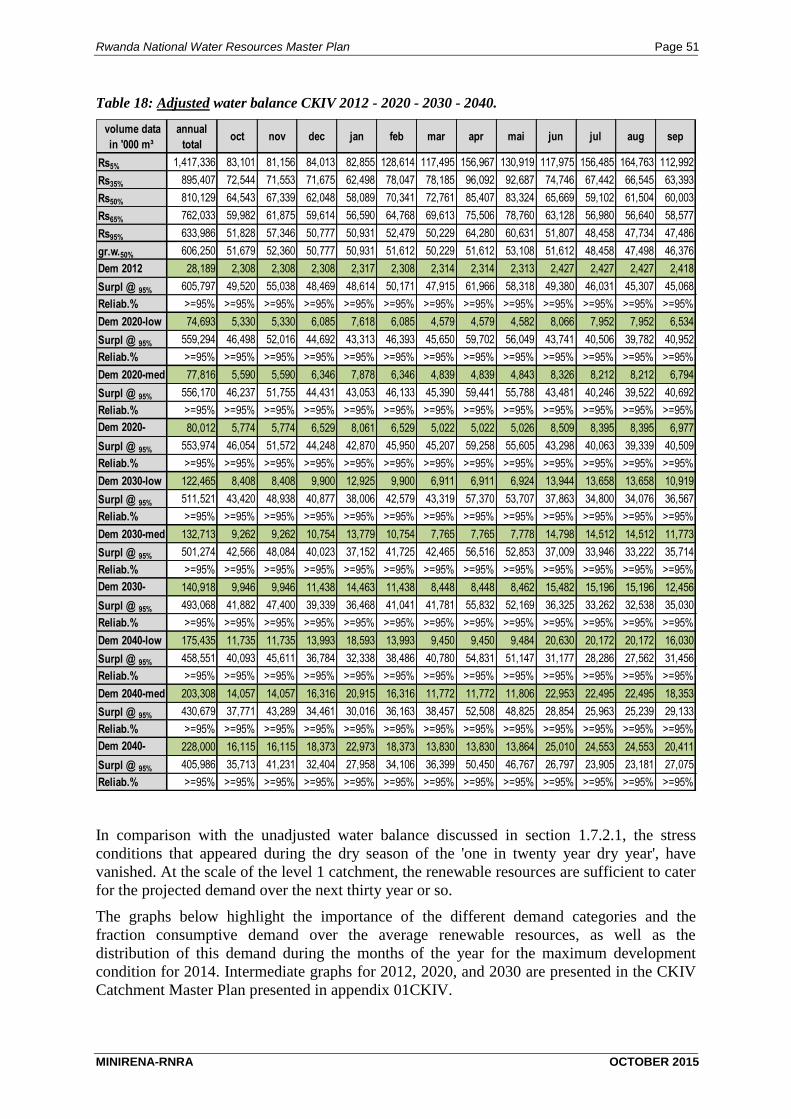
Rwanda National Water Resources Master Plan Page 51
MINIRENA-RNRA OCTOBER 2015
Table 18: Adjusted water balance CKIV 2012 - 2020 - 2030 - 2040.
volume data
in '000 m³
annual
totaloct nov dec jan feb mar apr mai jun jul aug sep
Rs5% 1,417,336 83,101 81,156 84,013 82,855 128,614 117,495 156,967 130,919 117,975 156,485 164,763 112,992
Rs35% 895,407 72,544 71,553 71,675 62,498 78,047 78,185 96,092 92,687 74,746 67,442 66,545 63,393
Rs50% 810,129 64,543 67,339 62,048 58,089 70,341 72,761 85,407 83,324 65,669 59,102 61,504 60,003
Rs65% 762,033 59,982 61,875 59,614 56,590 64,768 69,613 75,506 78,760 63,128 56,980 56,640 58,577
Rs95% 633,986 51,828 57,346 50,777 50,931 52,479 50,229 64,280 60,631 51,807 48,458 47,734 47,486
gr.w.50% 606,250 51,679 52,360 50,777 50,931 51,612 50,229 51,612 53,108 51,612 48,458 47,498 46,376
Dem 2012 28,189 2,308 2,308 2,308 2,317 2,308 2,314 2,314 2,313 2,427 2,427 2,427 2,418
Surpl @ 95% 605,797 49,520 55,038 48,469 48,614 50,171 47,915 61,966 58,318 49,380 46,031 45,307 45,068
Reliab.% >=95% >=95% >=95% >=95% >=95% >=95% >=95% >=95% >=95% >=95% >=95% >=95% >=95%
Dem 2020-low 74,693 5,330 5,330 6,085 7,618 6,085 4,579 4,579 4,582 8,066 7,952 7,952 6,534
Surpl @ 95% 559,294 46,498 52,016 44,692 43,313 46,393 45,650 59,702 56,049 43,741 40,506 39,782 40,952
Reliab.% >=95% >=95% >=95% >=95% >=95% >=95% >=95% >=95% >=95% >=95% >=95% >=95% >=95%
Dem 2020-med 77,816 5,590 5,590 6,346 7,878 6,346 4,839 4,839 4,843 8,326 8,212 8,212 6,794
Surpl @ 95% 556,170 46,237 51,755 44,431 43,053 46,133 45,390 59,441 55,788 43,481 40,246 39,522 40,692
Reliab.% >=95% >=95% >=95% >=95% >=95% >=95% >=95% >=95% >=95% >=95% >=95% >=95% >=95%
Dem 2020-
high
80,012 5,774 5,774 6,529 8,061 6,529 5,022 5,022 5,026 8,509 8,395 8,395 6,977
Surpl @ 95% 553,974 46,054 51,572 44,248 42,870 45,950 45,207 59,258 55,605 43,298 40,063 39,339 40,509
Reliab.% >=95% >=95% >=95% >=95% >=95% >=95% >=95% >=95% >=95% >=95% >=95% >=95% >=95%
Dem 2030-low 122,465 8,408 8,408 9,900 12,925 9,900 6,911 6,911 6,924 13,944 13,658 13,658 10,919
Surpl @ 95% 511,521 43,420 48,938 40,877 38,006 42,579 43,319 57,370 53,707 37,863 34,800 34,076 36,567
Reliab.% >=95% >=95% >=95% >=95% >=95% >=95% >=95% >=95% >=95% >=95% >=95% >=95% >=95%
Dem 2030-med 132,713 9,262 9,262 10,754 13,779 10,754 7,765 7,765 7,778 14,798 14,512 14,512 11,773
Surpl @ 95% 501,274 42,566 48,084 40,023 37,152 41,725 42,465 56,516 52,853 37,009 33,946 33,222 35,714
Reliab.% >=95% >=95% >=95% >=95% >=95% >=95% >=95% >=95% >=95% >=95% >=95% >=95% >=95%
Dem 2030-
high
140,918 9,946 9,946 11,438 14,463 11,438 8,448 8,448 8,462 15,482 15,196 15,196 12,456
Surpl @ 95% 493,068 41,882 47,400 39,339 36,468 41,041 41,781 55,832 52,169 36,325 33,262 32,538 35,030
Reliab.% >=95% >=95% >=95% >=95% >=95% >=95% >=95% >=95% >=95% >=95% >=95% >=95% >=95%
Dem 2040-low 175,435 11,735 11,735 13,993 18,593 13,993 9,450 9,450 9,484 20,630 20,172 20,172 16,030
Surpl @ 95% 458,551 40,093 45,611 36,784 32,338 38,486 40,780 54,831 51,147 31,177 28,286 27,562 31,456
Reliab.% >=95% >=95% >=95% >=95% >=95% >=95% >=95% >=95% >=95% >=95% >=95% >=95% >=95%
Dem 2040-med 203,308 14,057 14,057 16,316 20,915 16,316 11,772 11,772 11,806 22,953 22,495 22,495 18,353
Surpl @ 95% 430,679 37,771 43,289 34,461 30,016 36,163 38,457 52,508 48,825 28,854 25,963 25,239 29,133
Reliab.% >=95% >=95% >=95% >=95% >=95% >=95% >=95% >=95% >=95% >=95% >=95% >=95% >=95%
Dem 2040-
high
228,000 16,115 16,115 18,373 22,973 18,373 13,830 13,830 13,864 25,010 24,553 24,553 20,411
Surpl @ 95% 405,986 35,713 41,231 32,404 27,958 34,106 36,399 50,450 46,767 26,797 23,905 23,181 27,075
Reliab.% >=95% >=95% >=95% >=95% >=95% >=95% >=95% >=95% >=95% >=95% >=95% >=95% >=95%
In comparison with the unadjusted water balance discussed in section 1.7.2.1, the stress
conditions that appeared during the dry season of the 'one in twenty year dry year', have
vanished. At the scale of the level 1 catchment, the renewable resources are sufficient to cater
for the projected demand over the next thirty year or so.
The graphs below highlight the importance of the different demand categories and the
fraction consumptive demand over the average renewable resources, as well as the
distribution of this demand during the months of the year for the maximum development
condition for 2014. Intermediate graphs for 2012, 2020, and 2030 are presented in the CKIV
Catchment Master Plan presented in appendix 01CKIV.

Rwanda National Water Resources Master Plan Page 52
MINIRENA-RNRA OCTOBER 2015
Table 19: Resources and demand pie chart graph for CKIV 2040 - high demand scenario
Table 20: Monthly demand distribution for CKIV 2040 - high demand scenario
For the period up to 2040, annual demand increases to about 25% of the average renewable
resources (this was 35% for the unadjusted water balance in section 1.7.2.1). The principal
consumptive demand categories remain rural water supply, urban water supply, irrigation
from Lake Kivu, industries, mining, irrigation from dam sites and other power.
The distribution of demand during the year is somewhat uneven with an approximate factor 2
between dry and wet season months
Further issues on water resources and their use are related to flooding, pollution, erosion and
appropriate land use aiming for economic, social and environmental sustainability.
Rwanda National Water Resources Master Plan Page 53
MINIRENA-RNRA OCTOBER 2015
Details on water use and demand under extreme conditions and exploitation risks as obtained
from the District Survey, are discussed in section 3.3.5.1. of the CKIV Catchment Master
Plan presented in appendix 01CKIV.
1.7.3.2 ADJUSTED DEMAND AND WATER BALANCE FOR CRUS
Details of the demand analysis for the CRUS catchment are given in paragraph 3.3.3. of the
Catchment Master Plan for the Rusizi catchment (appendix 02CRUS).
From paragraph 1.7.2.2 it is evident that the water balance of the catchment does not impose
adjustment of the different demand categories. However, when considering the concentration
of demand almost exclusively in the Rubyiro tributary which generates but a third of the
catchments resources, there may be need to adjust demand for a viable long term water
balance. Nevertheless, the review of demand did not reveal any need to reduce demand for
any category other than the irrigation sector as follows:
irrigation by means of rainwater harvesting ponds: based on an increased estimate of
the number of filling cycles of the ponds demand per pond is increased from 1 000 to
2 000 m³/year (10 filling cycles of a 200 m³ pond).
irrigation by means of marshland development: due to the unavailability of resources
beyond the currently developed 445 ha, no further extension of the irrigation
infrastructure is foreseen. When the currently developed command area can be
irrigated from the Rusizi River supplies, further development upstream in the
Bugarama plain is possible from the Rubyiro River resources. The irrigated area
remains standing at the current command area of 445 ha. The potential irrigation area
identified in the RIMP (4,075 ha) cannot be developed for lack of available water
resources.
irrigation from surface water sources: it seems that the lower section of the Bugarama
plain can be irrigated from the Rusizi River by means of an upstream intake with
gravity flow which can replace the limited resources of the Rubyiro River. The RIMP
report does not mention any potential for this type of irrigation yet it is suggested to
irrigate about 555 ha through this method for a water demand tentatively estimated at
10,000 m³/ha. This development is only possible when provided from the surplus
resources of the CKIV catchment (a de facto catchment transfer of 6 MCM by means
of natural lake/river flow) and when a suitable rice variety can be identified that
supports the less ideal water quality of the Rusizi water.
irrigation with surface water storage reservoirs: this irrigation method is expensive in
investment cost (dam development and irrigation command area) and an effort has
been made to assess the viability of the different sites identified in the RIMP. The
only identified dam site has been found to provide a negligible storage volume for a
dam of 24 m high. This opportunity has been judged expensive and of little interest.
No storage reservoirs are foreseen during the lifetime of the Master Plan.
The adjusted water balance for the CRUS catchment is presented in the table below.

Rwanda National Water Resources Master Plan Page 54
MINIRENA-RNRA OCTOBER 2015
Table 21: Adjusted water balance CRUS 2012 - 2020 - 2030 - 2040.
volume data
in '000 m³
annual
totaloct nov dec jan feb mar apr may jun jul aug sep
Rs5% 785,627 59,189 80,191 95,900 53,534 51,018 62,242 110,416 103,210 48,591 29,330 48,891 43,115
Rs35% 459,635 29,794 39,700 45,539 44,455 36,725 53,036 61,698 53,676 32,766 22,267 17,641 22,338
Rs50% 379,596 25,524 34,947 39,539 30,975 32,244 38,875 45,122 47,330 28,500 20,045 16,279 20,217
Rs65% 335,702 22,201 29,933 37,421 23,399 27,965 32,954 41,388 41,352 26,120 18,102 15,828 19,038
Rs95% 205,632 17,448 15,743 20,720 17,698 20,678 17,588 16,719 29,014 17,607 10,808 11,050 10,558
gr.w.50% 269,036 21,609 22,330 23,410 23,050 23,770 23,410 25,211 29,173 25,211 18,008 15,847 18,008
Dem 2012 7,134 518 518 518 522 518 521 521 521 745 745 745 741
Surpl @ 95% 198,498 16,930 15,225 20,201 17,176 20,160 17,067 16,198 28,493 16,862 10,063 10,305 9,817
Reliab.% >=95% >=95% >=95% >=95% >=95% >=95% >=95% >=95% >=95% >=95% >=95% >=95% >=95%
Dem 2020-low 17,985 1,192 1,192 1,423 1,906 1,423 954 954 962 2,129 2,103 2,103 1,645
Surpl @ 95% 187,648 16,257 14,552 19,297 15,792 19,255 16,634 15,765 28,052 15,479 8,705 8,948 8,913
Reliab.% >=95% >=95% >=95% >=95% >=95% >=95% >=95% >=95% >=95% >=95% >=95% >=95% >=95%
Dem 2020-med 18,685 1,250 1,250 1,481 1,965 1,481 1,012 1,012 1,021 2,187 2,161 2,161 1,704
Surpl @ 95% 186,947 16,198 14,493 19,238 15,733 19,197 16,576 15,707 27,993 15,420 8,647 8,889 8,854
Reliab.% >=95% >=95% >=95% >=95% >=95% >=95% >=95% >=95% >=95% >=95% >=95% >=95% >=95%
Dem 2020-high 19,179 1,291 1,291 1,522 2,006 1,522 1,053 1,053 1,062 2,228 2,202 2,202 1,745
Surpl @ 95% 186,454 16,157 14,452 19,197 15,692 19,156 16,535 15,666 27,952 15,379 8,606 8,848 8,813
Reliab.% >=95% >=95% >=95% >=95% >=95% >=95% >=95% >=95% >=95% >=95% >=95% >=95% >=95%
Dem 2030-low 24,561 1,741 1,741 1,972 2,476 1,972 1,493 1,493 1,512 2,698 2,633 2,633 2,195
Surpl @ 95% 181,071 15,707 14,002 18,747 15,222 18,706 16,095 15,226 27,502 14,909 8,175 8,417 8,363
Reliab.% >=95% >=95% >=95% >=95% >=95% >=95% >=95% >=95% >=95% >=95% >=95% >=95% >=95%
Dem 2030-med 26,872 1,934 1,934 2,165 2,668 2,165 1,686 1,686 1,704 2,891 2,826 2,826 2,387
Surpl @ 95% 178,761 15,515 13,810 18,555 15,030 18,513 15,902 15,033 27,310 14,716 7,982 8,225 8,171
Reliab.% >=95% >=95% >=95% >=95% >=95% >=95% >=95% >=95% >=95% >=95% >=95% >=95% >=95%
Dem 2030-high 28,722 2,088 2,088 2,319 2,823 2,319 1,840 1,840 1,859 3,045 2,980 2,980 2,542
Surpl @ 95% 176,911 15,360 13,655 18,400 14,876 18,359 15,748 14,879 27,155 14,562 7,828 8,070 8,016
Reliab.% >=95% >=95% >=95% >=95% >=95% >=95% >=95% >=95% >=95% >=95% >=95% >=95% >=95%
Dem 2040-low 31,915 2,350 2,350 2,582 3,126 2,582 2,082 2,082 2,121 3,349 3,244 3,244 2,804
Surpl @ 95% 173,718 15,098 13,393 18,138 14,572 18,097 15,506 14,637 26,893 14,259 7,564 7,806 7,754
Reliab.% >=95% >=95% >=95% >=95% >=95% >=95% >=95% >=95% >=95% >=95% >=95% >=95% >=95%
Dem 2040-med 38,199 2,874 2,874 3,105 3,650 3,105 2,606 2,606 2,645 3,872 3,768 3,768 3,328
Surpl @ 95% 167,434 14,574 12,869 17,614 14,048 17,573 14,983 14,113 26,369 13,735 7,040 7,283 7,230
Reliab.% >=95% >=95% >=95% >=95% >=95% >=95% >=95% >=95% >=95% >=95% >=95% >=95% >=95%
Dem 2040-high 43,766 3,338 3,338 3,569 4,114 3,569 3,070 3,070 3,109 4,336 4,231 4,231 3,792
Surpl @ 95% 161,867 14,110 12,406 17,151 13,585 17,109 14,519 13,649 25,905 13,271 6,576 6,819 6,766
Reliab.% >=95% >=95% >=95% >=95% >=95% >=95% >=95% >=95% >=95% >=95% >=95% >=95% >=95%
In comparison with the unadjusted water balance presented in section 1.7.2.2, the stress
conditions that appeared during the months of April and the dry season of the 'one in twenty
year dry year', have not completely vanished. At the scale of the level 1 catchment, the
renewable resources seem however sufficient to cater for the projected demand over the next
thirty year or so as just the environmental demand is somewhat affected during this rather
extreme situation.
The graphs below highlight the importance of the different demand categories and the
fraction consumptive demand over the average renewable resources, as well as the
distribution of this demand during the months of the year for the maximum development

Rwanda National Water Resources Master Plan Page 55
MINIRENA-RNRA OCTOBER 2015
condition for 2014. Intermediate graphs for 2012, 2020, and 2030 are presented in the CRUS
Catchment Master Plan presented in appendix 02CRUS.
Table 22: Resources and demand pie chart graph for CRUS 2040 - high demand scenario
Table 23: Monthly demand distribution for CRUS 2040 - high demand scenario
For the period up to 2040, annual demand increases to about 10 % of the average renewable
resources (this was identical for the unadjusted water balance in section 1.7.2.2). The
principal consumptive demand categories are rural water supply, urban water supply, surface
water irrigation from Rusizi River and industries. Minor demand categories are mining, fish
ponds, marshland irrigation and irrigation from rain water harvesting.

Rwanda National Water Resources Master Plan Page 56
MINIRENA-RNRA OCTOBER 2015
The distribution of demand during the year is rather constant which is related to the
predominance of demand from drinking water supply over the irrigation sector's demand.
Further issues on water resources and their use are related to flooding, pollution, erosion and
appropriate land use aiming for economic, social and environmental sustainability.
Details on water use and demand under extreme conditions and exploitation risks as obtained
from the District Survey, are discussed in section 3.3.5.1. of the CRUS Catchment Master
Plan presented in appendix 02CRUS.
1.7.3.3 ADJUSTED DEMAND AND WATER BALANCE FOR NNYU
Details of the demand analysis for the NNYU catchment are given in paragraph 3.3.3. of the
Catchment Master Plan for the Upper Nyabarongo catchment (appendix 03NNYU).
From paragraph 1.7.2.3 it is clear that the water balance of the catchment does not impose
adjustment of the different demand categories. Consequently, all demand for potable water
supply, sanitation, industries, mining, livestock, fisheries, hydropower, non consumptive and
other energy demand was reviewed and thereupon maintained as is. Notwithstanding the
abundance of resources, there are a number of adjustments in the irrigation sector deemed
necessary as follows:
irrigation by means of rainwater harvesting ponds: based on an increased estimate of
the number of filling cycles of the ponds demand per pond is increased from 1 000 to
2 000 m³/year (10 filling cycles of a 200 m³ pond).
irrigation by means of marshland development: because of the interesting
performance and reduced investment and operational costs of this method, the full
development potential as identified in the RIMP has been maintained. Considering the
important area to be developed for this irrigation method (almost 23.000 ha), the
implementation schedule is set to a third of the area per planning period (2012 - 2020,
2020 - 2030 and 2030 - 2040) which is somewhat accelerated from the initial regime
presented in section 1.7.2.3. The total area to be developed by 2040 and the per
hectare water demand for this method (2 000 m³/ha/yr) have not been changed.
irrigation from surface water sources: this irrigation method is expensive in
investment and exploitation costs; the latter especially when irrigating land at higher
elevation level from the water source level. For this reason, the 6,755 ha foreseen in
the RIMP report have been separated in 4 altitude classes and only the lower 2
altitude classes (0-25 and 25-50 m command area elevation level above source level)
for a total of 2,200 ha command area, have been considered for development during
the lifetime of the Master Plan. The per hectare water demand for this method (6 000
m³/ha/yr) has not been changed. Adjusted demand from this use category has
consequently been reduced to a third of the demand from the potential irrigation areas
identified in the RIMP or from 38 MCM/year to 13 MCM/year.
irrigation with surface water storage reservoirs: this irrigation method is rather
expensive in investment cost for both dam and state of the art irrigation command
area development. An effort has been made to assess the viability of the different sites
identified in the RIMP. Out of 26 identified sites 7 have been found sufficiently
interesting in terms of site configuration and storage volume. The corresponding
command area is 2,048 ha (out of 6,772 ha for 26 sites). With this select and more

Rwanda National Water Resources Master Plan Page 57
MINIRENA-RNRA OCTOBER 2015
practical number of dams to be constructed and an improved estimate of the retained
water quantities, the projected demand has dropped from 44 to 31 MCM/year for the
2040 time horizon. Details on the endorsed reservoir sites are provided in the Upper
Nyabarongo catchment Master Plan in appendix 03NNYU.
Irrigation from groundwater: this irrigation method is similarly susceptible to thwart
viable exploitation due to high energy costs (for pumping). The presumably viable
command area has been estimated at about a quarter of the area proposed in the RIMP
(9,955 ha). Water demand at the 2040 time horizon has been reduced from 60 to 15
MCM/annum. Details are provided in the Upper Nyabarongo catchment Master Plan
in appendix 03NNYU.
The resulting adjusted water balance for the NNYU catchment is presented in the next table:
Table 24: Adjusted water balance NNYU 2012 - 2020 - 2030 - 2040.
volume data
in '000 m³
annual
totaloct nov dec jan feb mar apr may jun jul aug sep
Rs5% 1,858,415 138,436 136,591 143,245 163,932 178,526 183,368 185,509 206,542 142,537 123,629 122,377 133,725
Rs35% 1,397,023 98,741 124,979 119,083 112,942 116,062 125,847 143,764 141,071 118,539 101,229 99,054 95,711
Rs50% 1,202,282 93,734 100,109 99,927 96,617 97,539 107,570 126,569 129,294 101,163 87,014 78,548 84,198
Rs65% 1,060,332 84,857 88,299 89,847 82,106 82,537 86,997 117,140 119,050 81,118 74,991 74,612 78,779
Rs95% 884,495 66,953 72,108 72,734 72,187 74,505 72,843 90,663 93,948 76,374 64,894 64,219 63,066
gr.w.50% 977,616 74,002 79,700 80,392 79,787 82,349 80,512 100,208 103,840 84,415 71,726 70,980 69,706
Dem 2012 31,329 2,534 2,534 2,556 2,614 2,556 2,506 2,506 2,513 2,771 2,763 2,763 2,713
Surpl @ 95% 853,167 64,419 69,574 70,179 69,573 71,949 70,337 88,156 91,435 73,603 62,132 61,456 60,353
Reliab.% >=95% >=95% >=95% >=95% >=95% >=95% >=95% >=95% >=95% >=95% >=95% >=95% >=95%
Dem 2020-low 83,388 5,018 5,018 5,663 7,069 5,663 4,318 4,318 4,375 10,891 10,785 10,785 9,485
Surpl @ 95% 801,108 61,935 67,090 67,072 65,118 68,842 68,525 86,345 89,573 65,483 54,110 53,434 53,581
Reliab.% >=95% >=95% >=95% >=95% >=95% >=95% >=95% >=95% >=95% >=95% >=95% >=95% >=95%
Dem 2020-med 86,624 5,288 5,288 5,932 7,339 5,932 4,588 4,588 4,645 11,161 11,054 11,054 9,755
Surpl @ 95% 797,872 61,665 66,821 66,802 64,848 68,573 68,255 86,075 89,304 65,213 53,840 53,165 53,311
Reliab.% >=95% >=95% >=95% >=95% >=95% >=95% >=95% >=95% >=95% >=95% >=95% >=95% >=95%
Dem 2020-high 88,892 5,477 5,477 6,121 7,528 6,121 4,777 4,777 4,834 11,350 11,243 11,243 9,944
Surpl @ 95% 795,603 61,476 66,632 66,613 64,659 68,383 68,066 85,886 89,115 65,024 53,651 52,976 53,122
Reliab.% >=95% >=95% >=95% >=95% >=95% >=95% >=95% >=95% >=95% >=95% >=95% >=95% >=95%
Dem 2030-low 150,771 8,444 8,444 10,007 13,366 10,007 6,767 6,767 6,882 21,011 20,712 20,712 17,652
Surpl @ 95% 733,724 58,509 63,665 62,727 58,821 64,498 66,076 83,895 87,067 55,364 44,182 43,507 45,414
Reliab.% >=95% >=95% >=95% >=95% >=95% >=95% >=95% >=95% >=95% >=95% >=95% >=95% >=95%
Dem 2030-med 161,331 9,324 9,324 10,887 14,246 10,887 7,647 7,647 7,762 21,891 21,592 21,592 18,532
Surpl @ 95% 723,164 57,629 62,785 61,847 57,941 63,618 65,196 83,015 86,187 54,484 43,302 42,627 44,534
Reliab.% >=95% >=95% >=95% >=95% >=95% >=95% >=95% >=95% >=95% >=95% >=95% >=95% >=95%
Dem 2030-high 169,788 10,028 10,028 11,592 14,950 11,592 8,352 8,352 8,467 22,595 22,297 22,297 19,237
Surpl @ 95% 714,707 56,925 62,080 61,143 57,236 62,913 64,491 82,311 85,482 53,779 42,597 41,922 43,829
Reliab.% >=95% >=95% >=95% >=95% >=95% >=95% >=95% >=95% >=95% >=95% >=95% >=95% >=95%
Dem 2040-low 222,735 12,226 12,226 14,707 20,130 14,707 9,517 9,517 9,746 31,598 31,093 31,093 26,174
Surpl @ 95% 661,760 54,727 59,883 58,027 52,056 59,798 63,326 81,146 84,202 44,776 33,801 33,126 36,892
Reliab.% >=95% >=95% >=95% >=95% >=95% >=95% >=95% >=95% >=95% >=95% >=95% >=95% >=95%
Dem 2040-med 251,459 14,619 14,619 17,101 22,524 17,101 11,911 11,911 12,140 33,992 33,487 33,487 28,568
Surpl @ 95% 633,036 52,334 57,489 55,634 49,662 57,404 60,932 78,752 81,809 42,383 31,407 30,732 34,498
Reliab.% >=95% >=95% >=95% >=95% >=95% >=95% >=95% >=95% >=95% >=95% >=95% >=95% >=95%
Dem 2040-high 276,906 16,740 16,740 19,221 24,645 19,221 14,031 14,031 14,260 36,112 35,607 35,607 30,689
Surpl @ 95% 607,589 50,213 55,368 53,513 47,542 55,284 58,812 76,631 79,688 40,262 29,287 28,612 32,377
Reliab.% >=95% >=95% >=95% >=95% >=95% >=95% >=95% >=95% >=95% >=95% >=95% >=95% >=95%

Rwanda National Water Resources Master Plan Page 58
MINIRENA-RNRA OCTOBER 2015
In comparison with the unadjusted water balance discussed in section 1.7.2.3, which showed
negligible stress during the dry season for the 2040 horizon, in the dry month of July, these
stress signals have now completely vanished and the catchment's own demands including
environmental flow requirements are met under any scenario up till the end of the master plan
time horizon.
The graphs below highlight the importance of the different demand categories and the
fraction consumptive demand over the average renewable resources, as well as the
distribution of this demand during the months of the year for the maximum development
condition for 2014. Intermediate graphs for 2012, 2020, and 2030 are presented in the NNYU
Catchment Master Plan presented in appendix 03NNYU.
Table 25: Resources and demand pie chart graph for NNYU 2040 - high demand scenario
79%
3%
6%
2%
1%
0%
0%1%
0%
4%
1%
2%
1%
0%
21%
Resources (1289 MCM) & 2040 high demand (277 MCM)
Renewable resources
Urban DWS
Rural DWS
WS industry
WS mining
Coffee WS
Livestock
Fish ponds
Irr. RWH
Irr. marshld
Irr. surf.w
Irr. Dam
Irr. gr.w
Other power
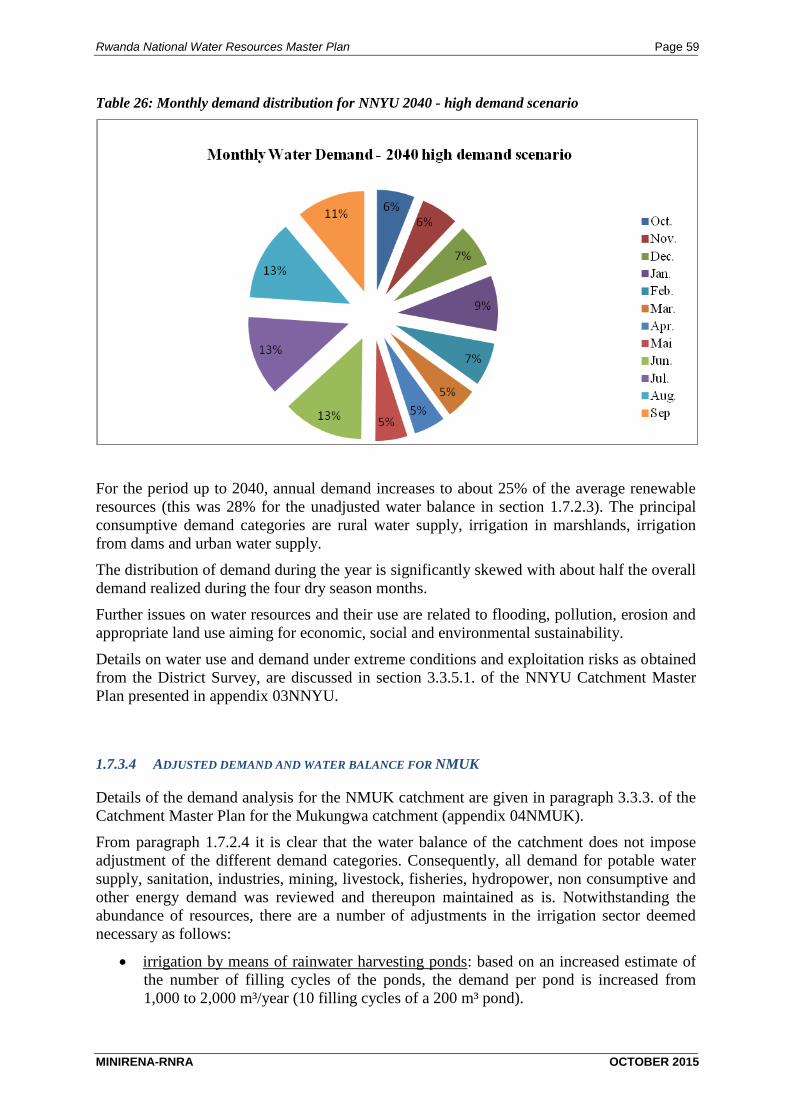
Rwanda National Water Resources Master Plan Page 59
MINIRENA-RNRA OCTOBER 2015
Table 26: Monthly demand distribution for NNYU 2040 - high demand scenario
For the period up to 2040, annual demand increases to about 25% of the average renewable
resources (this was 28% for the unadjusted water balance in section 1.7.2.3). The principal
consumptive demand categories are rural water supply, irrigation in marshlands, irrigation
from dams and urban water supply.
The distribution of demand during the year is significantly skewed with about half the overall
demand realized during the four dry season months.
Further issues on water resources and their use are related to flooding, pollution, erosion and
appropriate land use aiming for economic, social and environmental sustainability.
Details on water use and demand under extreme conditions and exploitation risks as obtained
from the District Survey, are discussed in section 3.3.5.1. of the NNYU Catchment Master
Plan presented in appendix 03NNYU.
1.7.3.4 ADJUSTED DEMAND AND WATER BALANCE FOR NMUK
Details of the demand analysis for the NMUK catchment are given in paragraph 3.3.3. of the
Catchment Master Plan for the Mukungwa catchment (appendix 04NMUK).
From paragraph 1.7.2.4 it is clear that the water balance of the catchment does not impose
adjustment of the different demand categories. Consequently, all demand for potable water
supply, sanitation, industries, mining, livestock, fisheries, hydropower, non consumptive and
other energy demand was reviewed and thereupon maintained as is. Notwithstanding the
abundance of resources, there are a number of adjustments in the irrigation sector deemed
necessary as follows:
irrigation by means of rainwater harvesting ponds: based on an increased estimate of
the number of filling cycles of the ponds, the demand per pond is increased from
1,000 to 2,000 m³/year (10 filling cycles of a 200 m³ pond).

Rwanda National Water Resources Master Plan Page 60
MINIRENA-RNRA OCTOBER 2015
irrigation by means of marshland development: because of the interesting
performance and reduced investment and operational costs of this method, the full
development potential as identified in the RIMP has been put forward for equal
development during the first and second stage of the Master Plan, the period prior to
2020 and the period from 2021 - 2030. The per hectare water demand for this method
(2,000 m³/ha/yr) has not been changed. The annual and monthly demand for 2020 has
been increased to 50% of the full potential and from 2030 onwards up to 2040 the full
potential is assumed (initially foreseen for 2040). The 2030-2040 water demand has
not been changed.
irrigation with surface water storage reservoirs: this irrigation method is mostly rather
expensive in investment cost (dam development and irrigation command area) and an
effort has been made to assess the viability of the sole site identified in the RIMP. The
site appears interesting but surely not ideal. The site is considered for implementation
during the 2030-2040 investment period which results in a demand of 2.425 MCM per
annum as against 1.866 MCM per annum for the unadjusted version.
The adjusted water balance for the NMUK catchment is presented in the table below.
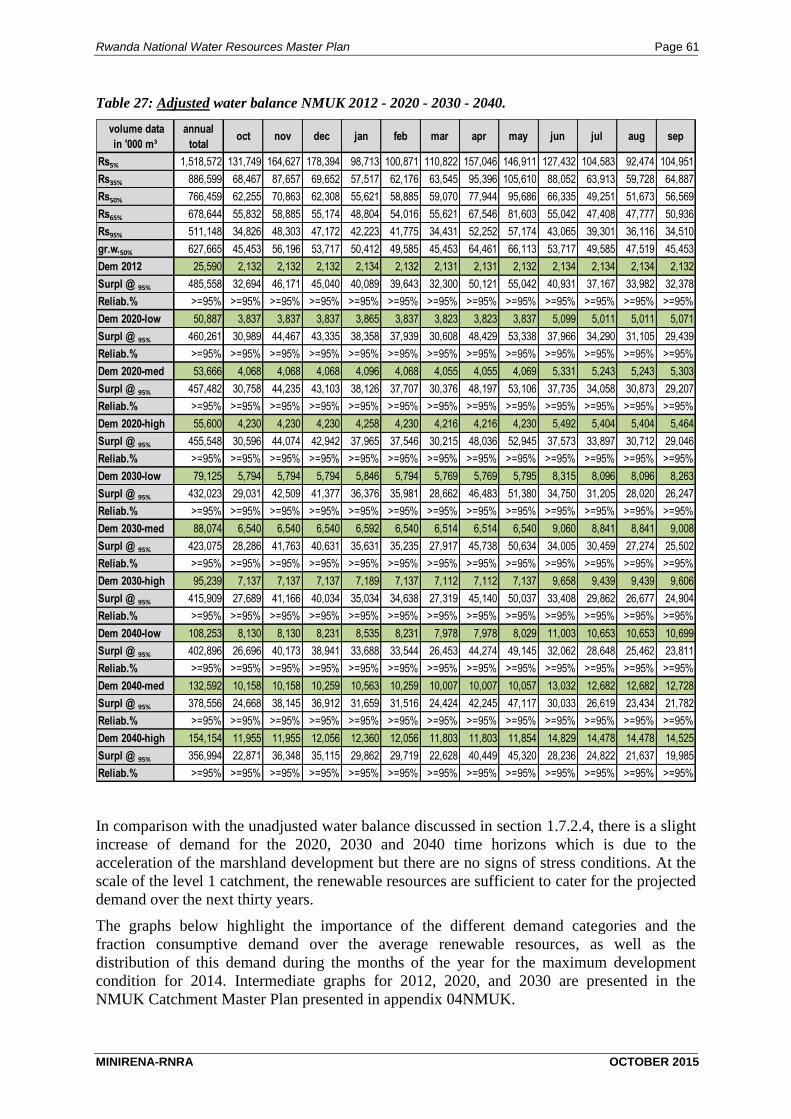
Rwanda National Water Resources Master Plan Page 61
MINIRENA-RNRA OCTOBER 2015
Table 27: Adjusted water balance NMUK 2012 - 2020 - 2030 - 2040.
volume data
in '000 m³
annual
totaloct nov dec jan feb mar apr may jun jul aug sep
Rs5% 1,518,572 131,749 164,627 178,394 98,713 100,871 110,822 157,046 146,911 127,432 104,583 92,474 104,951
Rs35% 886,599 68,467 87,657 69,652 57,517 62,176 63,545 95,396 105,610 88,052 63,913 59,728 64,887
Rs50% 766,459 62,255 70,863 62,308 55,621 58,885 59,070 77,944 95,686 66,335 49,251 51,673 56,569
Rs65% 678,644 55,832 58,885 55,174 48,804 54,016 55,621 67,546 81,603 55,042 47,408 47,777 50,936
Rs95% 511,148 34,826 48,303 47,172 42,223 41,775 34,431 52,252 57,174 43,065 39,301 36,116 34,510
gr.w.50% 627,665 45,453 56,196 53,717 50,412 49,585 45,453 64,461 66,113 53,717 49,585 47,519 45,453
Dem 2012 25,590 2,132 2,132 2,132 2,134 2,132 2,131 2,131 2,132 2,134 2,134 2,134 2,132
Surpl @ 95% 485,558 32,694 46,171 45,040 40,089 39,643 32,300 50,121 55,042 40,931 37,167 33,982 32,378
Reliab.% >=95% >=95% >=95% >=95% >=95% >=95% >=95% >=95% >=95% >=95% >=95% >=95% >=95%
Dem 2020-low 50,887 3,837 3,837 3,837 3,865 3,837 3,823 3,823 3,837 5,099 5,011 5,011 5,071
Surpl @ 95% 460,261 30,989 44,467 43,335 38,358 37,939 30,608 48,429 53,338 37,966 34,290 31,105 29,439
Reliab.% >=95% >=95% >=95% >=95% >=95% >=95% >=95% >=95% >=95% >=95% >=95% >=95% >=95%
Dem 2020-med 53,666 4,068 4,068 4,068 4,096 4,068 4,055 4,055 4,069 5,331 5,243 5,243 5,303
Surpl @ 95% 457,482 30,758 44,235 43,103 38,126 37,707 30,376 48,197 53,106 37,735 34,058 30,873 29,207
Reliab.% >=95% >=95% >=95% >=95% >=95% >=95% >=95% >=95% >=95% >=95% >=95% >=95% >=95%
Dem 2020-high 55,600 4,230 4,230 4,230 4,258 4,230 4,216 4,216 4,230 5,492 5,404 5,404 5,464
Surpl @ 95% 455,548 30,596 44,074 42,942 37,965 37,546 30,215 48,036 52,945 37,573 33,897 30,712 29,046
Reliab.% >=95% >=95% >=95% >=95% >=95% >=95% >=95% >=95% >=95% >=95% >=95% >=95% >=95%
Dem 2030-low 79,125 5,794 5,794 5,794 5,846 5,794 5,769 5,769 5,795 8,315 8,096 8,096 8,263
Surpl @ 95% 432,023 29,031 42,509 41,377 36,376 35,981 28,662 46,483 51,380 34,750 31,205 28,020 26,247
Reliab.% >=95% >=95% >=95% >=95% >=95% >=95% >=95% >=95% >=95% >=95% >=95% >=95% >=95%
Dem 2030-med 88,074 6,540 6,540 6,540 6,592 6,540 6,514 6,514 6,540 9,060 8,841 8,841 9,008
Surpl @ 95% 423,075 28,286 41,763 40,631 35,631 35,235 27,917 45,738 50,634 34,005 30,459 27,274 25,502
Reliab.% >=95% >=95% >=95% >=95% >=95% >=95% >=95% >=95% >=95% >=95% >=95% >=95% >=95%
Dem 2030-high 95,239 7,137 7,137 7,137 7,189 7,137 7,112 7,112 7,137 9,658 9,439 9,439 9,606
Surpl @ 95% 415,909 27,689 41,166 40,034 35,034 34,638 27,319 45,140 50,037 33,408 29,862 26,677 24,904
Reliab.% >=95% >=95% >=95% >=95% >=95% >=95% >=95% >=95% >=95% >=95% >=95% >=95% >=95%
Dem 2040-low 108,253 8,130 8,130 8,231 8,535 8,231 7,978 7,978 8,029 11,003 10,653 10,653 10,699
Surpl @ 95% 402,896 26,696 40,173 38,941 33,688 33,544 26,453 44,274 49,145 32,062 28,648 25,462 23,811
Reliab.% >=95% >=95% >=95% >=95% >=95% >=95% >=95% >=95% >=95% >=95% >=95% >=95% >=95%
Dem 2040-med 132,592 10,158 10,158 10,259 10,563 10,259 10,007 10,007 10,057 13,032 12,682 12,682 12,728
Surpl @ 95% 378,556 24,668 38,145 36,912 31,659 31,516 24,424 42,245 47,117 30,033 26,619 23,434 21,782
Reliab.% >=95% >=95% >=95% >=95% >=95% >=95% >=95% >=95% >=95% >=95% >=95% >=95% >=95%
Dem 2040-high 154,154 11,955 11,955 12,056 12,360 12,056 11,803 11,803 11,854 14,829 14,478 14,478 14,525
Surpl @ 95% 356,994 22,871 36,348 35,115 29,862 29,719 22,628 40,449 45,320 28,236 24,822 21,637 19,985
Reliab.% >=95% >=95% >=95% >=95% >=95% >=95% >=95% >=95% >=95% >=95% >=95% >=95% >=95%
In comparison with the unadjusted water balance discussed in section 1.7.2.4, there is a slight
increase of demand for the 2020, 2030 and 2040 time horizons which is due to the
acceleration of the marshland development but there are no signs of stress conditions. At the
scale of the level 1 catchment, the renewable resources are sufficient to cater for the projected
demand over the next thirty years.
The graphs below highlight the importance of the different demand categories and the
fraction consumptive demand over the average renewable resources, as well as the
distribution of this demand during the months of the year for the maximum development
condition for 2014. Intermediate graphs for 2012, 2020, and 2030 are presented in the
NMUK Catchment Master Plan presented in appendix 04NMUK.

Rwanda National Water Resources Master Plan Page 62
MINIRENA-RNRA OCTOBER 2015
Table 28: Resources and demand pie chart graph for NMUK 2040 - high demand scenario
83%
5%
7%
2%1%
0%
0%
0%
1%1%
0%
0%
0%
0%
17%
Resources (905 MCM) & 2040 high demand (154 MCM)
Renewable resources
Urban DWS
Rural DWS
WS industry
WS mining
Coffee WS
Livestock
Fish ponds
Irr. RWH
Irr. marshld
Irr. surf.w
Irr. Dam
Irr. gr.w
Other power
Table 29: Monthly demand distribution for NMUK 2040 - high demand scenario
For the period up to 2040, annual demand increases to about 17% of the average renewable
resources (this was identical for the unadjusted water balance in section 1.7.2.4). The
principal consumptive demand categories remain rural water supply, urban water supply,
industrial demand, mining and mainly marshland development.
The distribution of demand during the year is rather constant which is related to the
predominance of demand from drinking water supply over the irrigation sector's demand.

Rwanda National Water Resources Master Plan Page 63
MINIRENA-RNRA OCTOBER 2015
Further issues on water resources and their use are related to high costs of potable water
installations especially for the lava region, flooding, pollution and appropriate land use
aiming for economic, social and environmental sustainability.
Details on water use and demand under extreme conditions and exploitation risks as obtained
from the District Survey, are discussed in section 3.3.5.1. of the NMUK Catchment Master
Plan presented in appendix 04NMUK.
1.7.3.5 ADJUSTED DEMAND AND WATER BALANCE FOR NNYL
Details of the demand analysis for the NNYL catchment are given in paragraph 3.3.3. of the
Catchment Master Plan for the Lower Nyabarongo catchment (appendix 05NNYL).
From paragraph 1.7.2.5 it is clear that the water balance of the catchment does impose
adjustment of the different demand categories. Nevertheless, the review of the different
demand categories did not reveal any good reason to reduce demand for any category other
than the irrigation sector. For the latter the following changes are proposed:
irrigation by means of rainwater harvesting ponds: based on an increased estimate of
the number of filling cycles of the ponds demand per pond is increased from 1,000 to
2,000 m³/year (10 filling cycles of a 200 m³ pond).
irrigation by means of marshland development: because of the interesting
performance and reduced investment and operational costs of this method, the full
development potential as identified in the RIMP has been maintained but the
implementation has been accelerated slightly (2030 planning period). The per hectare
water demand for this method (2,000 m³/ha/yr) has been left unaltered.
irrigation from surface water sources: this irrigation method is expensive in
investment and exploitation costs. Due to the lack of available resources for this type
of irrigation, the command area as indicated in the RIMP (12,245 ha) has been
reduced to 5,000 ha of which 2,000 ha at a level of max 25 m along the Muhazi Lake
and 3,000 ha at a level of max 50 m along the Nyabarongo river. This development is
assumed completed by 2030. The per hectare water demand for this method (7,000
m³/ha/yr for the central region) has not been changed. Adjusted demand from this use
category has consequently been reduced to 35 MCM/year.
irrigation with surface water storage reservoirs: this irrigation method is very
expensive in investment cost (dam development and irrigation command area) and an
effort has been made to assess the viability of the different sites identified in the
RIMP. Out of 30 identified sites 12 have been judged as sufficiently interesting in
terms of site configuration and storage volume. Their total storage capacity is about
36 MCM. There is also a cost effective and simple method to use Lake Muhazi as
water reservoir for irrigation. A storage of about 16 MCM can be made available
which permits to irrigate an additional command area of 3,600 ha along Lake Muhazi
at a level between 25 and 50 m above lake level. Details are provided in the Lower
Nyabarongo Catchment Master Plan in appendix 05NNYL.
irrigation demand from groundwater: this irrigation method is also susceptible to
bring high exploitation costs for pumping. The area viable for exploitation has been
estimated at about 25% of the area identified in the RIMP (15,550 ha). Water demand

Rwanda National Water Resources Master Plan Page 64
MINIRENA-RNRA OCTOBER 2015
from this reduced command area (~3,900 ha) is estimated at 27 MCM/year which is
proportionally implemented over the period from 2012 - 2040.
The adjusted water balance for the NNYL catchment is presented in the table below.
Table 30: Adjusted water balance NNYL 2012 - 2020 - 2030 - 2040.
volume data
in '000 m³
annual
totaloct nov dec jan feb mar apr may jun jul aug sep
Rs5% 1,326,684 94,382 116,797 129,692 112,083 119,469 116,557 163,914 156,350 99,833 78,173 64,834 74,599
Rs35% 929,046 62,576 84,225 73,718 68,738 73,252 87,327 117,368 117,145 73,290 59,153 54,749 57,504
Rs50% 848,870 58,585 75,168 72,133 62,985 69,387 72,348 101,115 107,112 69,155 53,382 52,050 55,450
Rs65% 786,114 57,373 71,344 66,814 57,528 63,222 64,380 95,325 96,483 64,215 51,009 46,721 51,700
Rs95% 633,802 45,188 54,583 52,307 49,586 51,934 53,577 75,826 75,628 48,402 42,429 40,508 43,833
gr.w.50% 544,628 41,858 50,561 48,452 45,932 48,107 48,593 49,287 48,593 45,816 39,303 37,523 40,603
Dem 2012 55,216 4,361 4,361 4,361 4,813 4,361 3,927 3,927 4,363 5,306 5,292 5,292 4,854
Surpl @ 95% 578,585 40,827 50,222 47,946 44,774 47,573 49,649 71,899 71,265 43,096 37,138 35,217 38,979
Reliab.% >=95% >=95% >=95% >=95% >=95% >=95% >=95% >=95% >=95% >=95% >=95% >=95% >=95%
Dem 2020-low 161,950 11,056 11,056 11,056 15,761 11,056 6,397 6,397 11,060 20,761 20,648 20,648 16,056
Surpl @ 95% 471,851 34,132 43,527 41,251 33,825 40,878 47,180 69,429 64,569 27,641 21,782 19,860 27,777
Reliab.% >=95% >=95% >=95% >=95% >=95% >=95% >=95% >=95% >=95% >=95% >=95% >=95% >=95%
Dem 2020-med 166,822 11,462 11,462 11,462 16,167 11,462 6,803 6,803 11,466 21,167 21,054 21,054 16,462
Surpl @ 95% 466,980 33,726 43,122 40,845 33,419 40,472 46,774 69,023 64,163 27,235 21,376 19,454 27,371
Reliab.% >=95% >=95% >=95% >=95% >=95% >=95% >=95% >=95% >=95% >=95% >=95% >=95% >=95%
Dem 2020-high 170,169 11,741 11,741 11,741 16,446 11,741 7,082 7,082 11,745 21,446 21,333 21,333 16,741
Surpl @ 95% 463,633 33,447 42,843 40,566 33,140 40,193 46,495 68,744 63,884 26,956 21,097 19,175 27,093
Reliab.% >=95% >=95% >=95% >=95% >=95% >=95% >=95% >=95% >=95% >=95% >=95% >=95% >=95%
Dem 2030-low 291,723 19,352 19,352 19,352 29,260 19,352 9,567 9,567 19,356 39,260 38,976 38,976 29,352
Surpl @ 95% 342,079 25,836 35,231 32,955 20,327 32,582 44,010 66,259 56,272 9,142 3,454 1,532 14,481
Reliab.% >=95% >=95% >=95% >=95% >=95% >=95% >=95% >=95% >=95% >=95% >=95% >=95% >=95%
Dem 2030-med 307,049 20,629 20,629 20,629 30,537 20,629 10,844 10,844 20,634 40,537 40,253 40,253 30,629
Surpl @ 95% 326,753 24,558 33,954 31,677 19,050 31,304 42,732 64,982 54,995 7,865 2,176 255 13,204
Reliab.% >=95% >=95% >=95% >=95% >=95% >=95% >=95% >=95% >=95% >=95% >=95% >=95% >=95%
Dem 2030-high 319,322 21,652 21,652 21,652 31,560 21,652 11,867 11,867 21,656 41,560 41,276 41,276 31,652
Surpl @ 95% 314,480 23,536 32,931 30,655 18,027 30,282 41,710 63,959 53,972 6,842 1,154 0 12,181
Reliab.% >=95% >=95% >=95% >=95% >=95% >=95% >=95% >=95% >=95% >=95% >=95% >=65% >=95%
Dem 2040-low 409,210 26,830 26,830 26,830 40,522 26,830 13,460 13,460 26,834 55,554 55,100 55,100 41,862
Surpl @ 95% 224,592 18,358 27,753 25,477 9,064 25,104 40,117 62,366 48,795 0 0 0 1,971
Reliab.% >=95% >=95% >=95% >=95% >=95% >=95% >=95% >=95% >=95% >=65% >=35% >=5% >=95%
Dem 2040-med 450,897 30,304 30,304 30,304 43,996 30,304 16,934 16,934 30,308 59,028 58,574 58,574 45,336
Surpl @ 95% 182,904 14,884 24,280 22,003 5,590 21,630 36,643 58,892 45,321 0 0 0 0
Reliab.% >=95% >=95% >=95% >=95% >=95% >=95% >=95% >=95% >=95% >=65% >=35% >=5% >=65%
Dem 2040-high 487,828 33,381 33,381 33,381 47,074 33,381 20,011 20,011 33,385 62,106 61,652 61,652 48,413
Surpl @ 95% 145,974 11,807 21,202 18,926 2,513 18,553 33,565 55,815 42,243 0 0 0 0
Reliab.% >=95% >=95% >=95% >=95% >=95% >=95% >=95% >=95% >=95% >=65% >=5% >=5% >=65%
In comparison with the unadjusted water balance discussed in section 1.7.2.1, the stress
conditions do not seem to have been solved to a definite extent:
the 2020 unadjusted balance did not show any sign of stress and, notwithstanding a
slight increase in demand (due to the acceleration of development opportunities), this
condition is preserved for the adjusted water balance. Please note that there is already
significant storage capacity created in the catchment (about 10 MCM spread over

Rwanda National Water Resources Master Plan Page 65
MINIRENA-RNRA OCTOBER 2015
different locations; see Nyabarongo Catchment Master Plan in appendix 05NNYL for
details).
the 2030 unadjusted balance showed a little bit of stress which compromised the
environmental flow criterion. The annual demand of the adjusted water balance has
been slightly reduced (by some 7 MCM/annum) but the stress remains mostly
unaltered. When considering that the catchment contains about 24 MCM of storage
from artificial reservoirs and a potential 16 MCM management storage from Lake
Muhazi, the monthly dry season surplus that can be released from these reservoirs can
be close to 7 MCM/month which leaves meaningful (3 m³/s), though formally
insufficient, flow available for sustaining minimum hydro-ecological requirements
during the dry season.
with resources insufficient even for the once in twenty years wet year, the 2040
unadjusted balance was evidently not sustainable. For the adjusted balance, annual
demand has been reduced by 120 MCM or some 20% of demand. The dry season
situation is improved but remains precarious especially for the high demand scenario
(insufficiency of resources even for the once in three year wet year). The additional
storage capacity from artificial reservoirs and the management storage from Lake
Muhazi stand at 52 MCM which means that a monthly surplus of about 10
MCM/month is available. A better use of this surplus storage volume can be made
when it is released when most required, especially during the months of July and
August. Indicatively, the 'once in three year dry year' resources plus the targeted
distribution of the storage allow to supply for the 2040 demand exclusive of
environmental demand. In 'better' hydrological years there is some environmental
flow. In years with lesser flow, part of the demand should be satisfied from reuse
(easily achievable in irrigation), temporary overexploitation of groundwater resources,
temporary suspension of demand, or transfer from Mukungwa and upper Nyabarongo
catchments.
In conclusion, at the scale of the level 1 catchment, the catchment's own renewable resources
are just sufficient to cater for the projected demand over the next thirty year or so.
The graphs below highlight the importance of the different demand categories and the
fraction consumptive demand over the average renewable resources, as well as the
distribution of this demand during the months of the year for the maximum development
condition for 2014. Intermediate graphs for 2012, 2020, and 2030 are presented in the NNYL
Catchment Master Plan presented in appendix 05NNYL.

Rwanda National Water Resources Master Plan Page 66
MINIRENA-RNRA OCTOBER 2015
Table 31: Resources and demand pie chart graph for NNYL 2040 - high demand scenario
46%
12%
7%
4%
2%0% 1% 1%
0%
7%
4%
13%
3%
0%
54%
Resources (899 MCM) & 2040 high demand (488 MCM)
Renewable resources
Urban DWS
Rural DWS
WS industry
WS mining
Coffee WS
Livestock
Fish ponds
Irr. RWH
Irr. marshld
Irr. surf.w
Irr. Dam
Irr. gr.w
Other power
Table 32: Monthly demand distribution for NNYL 2040 - high demand scenario
For the period up to 2040, annual demand increases to about 54 % of the average renewable
resources (this was 68% for the unadjusted water balance in section 1.7.2.5). The principal
consumptive demand categories remain irrigation from dam, urban and rural water supply,
irrigation from surface water, marshland and industries.
The distribution of demand during the year is significantly skewed with almost half the
overall demand realized during the four dry season months.

Rwanda National Water Resources Master Plan Page 67
MINIRENA-RNRA OCTOBER 2015
This catchment soon requires state of the art water management procedures that is based on
both resources and water use monitoring and strict rules for resources development and
exploitation. A water use permit system and a decentralized management entity under the
auspices of the RNRA, will be mandatory to materialize this.
Further issues on water resources and their use are related to the high cost of development for
rural drinking water supply, flooding, pollution, erosion and appropriate land use aiming for
economic, social and environmental sustainability.
Details on water use and demand under extreme conditions and exploitation risks as obtained
from the District Survey, are discussed in section 1.7.2.5 of the NNYL Catchment Master
Plan presented in appendix 05NNYL.
1.7.3.6 ADJUSTED DEMAND AND WATER BALANCE FOR NAKN
Details of the demand analysis for the NAKN catchment are given in paragraph 3.3.3. of the
Catchment Master Plan for the Akanyaru catchment (appendix 06NAKN).
From paragraph 1.7.2.6 it is evident that the water balance of the catchment requires
adjustment of the different demand categories. Notwithstanding this prerequisite, the review
of the different demand categories did not reveal any good reason to reduce demand for any
category other than the irrigation sector. For the latter the following changes are proposed
irrigation by means of rainwater harvesting ponds: based on an increased estimate of
the number of filling cycles of the ponds demand per pond is increased from 1,000 to
2,000 m³/year (10 filling cycles of a 200 m³ pond).
irrigation by means of marshland development: notwithstanding the interesting
performance and reduced investment and operational costs of this method, the full
development potential as identified in the RIMP cannot be implemented because of
insufficiency of available dry season resources by 2040. In order to correct the
unadjusted water balance, the potential irrigation area of 59,000 ha will be curtailed to
about 45,000 ha which reduces demand from about 120 MCM/year to 90 MCM/year.
Part of the developed area will run into supply difficulties about once every four years
whence the dry season production should not be engaged or supply should be topped
up from groundwater resources.
irrigation from surface water sources: this irrigation method is expensive in
investment and exploitation costs; the latter especially when irrigating land at higher
level from the water source level. Due to the unavailability of dry season water
resources and giving preference to the marshland development (see previous bullet)
no developments are scheduled for this category. The water demand for a single
existing project (along Lake Cyohoha) has however been accounted for over the entire
Master Plan time period. The entire potential irrigation area identified in the RIMP of
26,000 ha cannot be developed and the 195 MCM/year demand is reduced to 0.34
MCM/year.
irrigation with surface water storage reservoirs: this irrigation method is expensive in
investment cost (dam development and irrigation command area) yet it allows to carry
over resources from the wet season to the dry season which reduces the vulnerability
of the Akanyaru peat marshland for irreversible settling. The seemingly most
interesting dam sites identified in the RIMP and by LWH project have been scheduled

Rwanda National Water Resources Master Plan Page 68
MINIRENA-RNRA OCTOBER 2015
for gradual implementation over the entire Master Plan period (2012-2040). A total of
14 projects have been endorsed for a total storage capacity of about 47 MCM with an
estimated demand of 80 MCM/year. A schematic map of the reservoir sites and
further details are provided in the Akanyaru catchment Master Plan report in appendix
06NAKN.
irrigation demand from groundwater: this irrigation method is also susceptible to
bring high exploitation costs for pumping. The area viable for exploitation has been
estimated at about 25% of the area identified in the RIMP (2,380 ha). Water demand
from this reduced command area is estimated at 4 MCM/year which can be
implemented prior 2020.
Waste water treatment from urban and industrial water supply may provide a surplus which
has so far been ignored
The adjusted water balance for the NAKN catchment is presented in the table below.

Rwanda National Water Resources Master Plan Page 69
MINIRENA-RNRA OCTOBER 2015
Table 33: Adjusted water balance NAKN 2012 - 2020 - 2030 - 2040.
volume data
in '000 m³
annual
totaloct nov dec jan feb mar apr may jun jul aug sep
Rs5% 1,248,658 74,172 109,085 128,465 89,581 118,511 113,420 167,240 170,708 79,532 61,315 68,819 67,810
Rs35% 866,158 59,890 77,863 73,058 73,575 68,228 80,707 111,251 112,898 64,086 50,843 42,392 51,367
Rs50% 774,661 54,490 68,652 69,979 67,758 62,281 70,365 96,823 100,495 54,783 43,937 39,988 45,110
Rs65% 706,238 51,682 62,774 65,558 59,873 58,473 64,345 86,703 89,091 49,217 38,868 39,093 40,562
Rs95% 430,507 32,783 33,200 34,551 39,433 32,230 50,611 63,623 46,054 32,720 22,384 21,414 21,503
gr.w.50% 531,701 36,569 38,563 39,893 51,861 49,866 56,515 63,623 47,872 45,212 36,569 33,244 31,914
Dem 2012 51,041 3,803 3,803 3,803 5,123 3,803 2,494 2,494 3,804 5,824 5,793 5,793 4,504
Surpl @ 95% 379,466 28,980 29,397 30,748 34,309 28,427 48,118 61,129 42,250 26,896 16,591 15,621 16,999
Reliab.% >=95% >=95% >=95% >=95% >=95% >=95% >=95% >=95% >=95% >=95% >=95% >=95% >=95%
Dem 2020-low 148,461 7,642 7,642 7,642 10,964 7,642 4,471 4,471 7,643 23,464 23,369 23,369 20,142
Surpl @ 95% 282,046 25,142 25,558 26,910 28,469 24,588 46,140 59,152 38,411 9,256 0 0 1,361
Reliab.% >=95% >=95% >=95% >=95% >=95% >=95% >=95% >=95% >=95% >=95% >=65% >=65% >=95%
Dem 2020-med 151,534 7,898 7,898 7,898 11,220 7,898 4,727 4,727 7,900 23,720 23,626 23,626 20,398
Surpl @ 95% 278,973 24,886 25,302 26,654 28,212 24,332 45,884 58,896 38,155 9,000 0 0 1,105
Reliab.% >=95% >=95% >=95% >=95% >=95% >=95% >=95% >=95% >=95% >=95% >=65% >=65% >=95%
Dem 2020-high 153,676 8,076 8,076 8,076 11,399 8,076 4,906 4,906 8,078 23,899 23,804 23,804 20,576
Surpl @ 95% 276,831 24,707 25,124 26,475 28,034 24,153 45,706 58,717 37,976 8,821 0 0 926
Reliab.% >=95% >=95% >=95% >=95% >=95% >=95% >=95% >=95% >=95% >=95% >=65% >=65% >=95%
Dem 2030-low 237,981 11,487 11,487 11,487 16,491 11,487 6,783 6,783 11,489 38,991 38,755 38,755 33,987
Surpl @ 95% 192,526 21,297 21,713 23,065 22,941 20,743 43,828 56,840 34,565 0 0 0 0
Reliab.% >=95% >=95% >=95% >=95% >=95% >=95% >=95% >=95% >=95% >=65% >=65% >=65% >=65%
Dem 2030-med 247,907 12,314 12,314 12,314 17,318 12,314 7,610 7,610 12,316 39,818 39,582 39,582 34,814
Surpl @ 95% 182,600 20,469 20,886 22,237 22,114 19,916 43,001 56,013 33,738 0 0 0 0
Reliab.% >=95% >=95% >=95% >=95% >=95% >=95% >=95% >=95% >=95% >=65% >=50% >=50% >=65%
Dem 2030-high 255,856 12,976 12,976 12,976 17,981 12,976 8,273 8,273 12,978 40,481 40,245 40,245 35,476
Surpl @ 95% 174,651 19,807 20,224 21,575 21,452 19,253 42,339 55,350 33,076 0 0 0 0
Reliab.% >=95% >=95% >=95% >=95% >=95% >=95% >=95% >=95% >=95% >=65% >=50% >=35% >=65%
Dem 2040-low 298,497 16,134 16,134 16,134 23,359 16,134 9,505 9,505 16,136 45,859 45,481 45,481 38,634
Surpl @ 95% 132,010 16,649 17,066 18,417 16,073 16,096 41,107 54,118 29,918 0 0 0 0
Reliab.% >=95% >=95% >=95% >=95% >=95% >=95% >=95% >=95% >=95% >=65% >=35% >=5% >=65%
Dem 2040-med 325,496 18,384 18,384 18,384 25,609 18,384 11,755 11,755 18,386 48,109 47,731 47,731 40,884
Surpl @ 95% 105,011 14,400 14,816 16,168 13,823 13,846 38,857 51,868 27,668 0 0 0 0
Reliab.% >=95% >=95% >=95% >=95% >=95% >=95% >=95% >=95% >=95% >=65% >=35% >=5% >=50%
Dem 2040-high 349,414 20,377 20,377 20,377 27,603 20,377 13,748 13,748 20,379 50,103 49,725 49,725 42,877
Surpl @ 95% 81,093 12,406 12,823 14,174 11,830 11,853 36,864 49,875 25,675 0 0 0 0
Reliab.% >=95% >=95% >=95% >=95% >=95% >=95% >=95% >=95% >=95% >=50% >=35% >=5% >=50%
In comparison with the unadjusted water balance discussed in section 1.7.2.1, the stress
conditions do not seem to have been entirely solved:
for the 2020 adjusted balance we observe an increase of annual water demand by
some 12 MCM which is related to the early implementation of admissible commercial
water use (irrigation activities). The dry season surplus during the once in twenty year
dry year is zero and the frequency of demand not being met is in-between once every
three years and once every twenty years. When considering that storage capacity to
the amount of 13 MCM is programmed for construction and that this will allow for an
extra flow of some 3 MCM per month over the three driest months, the 95 %
reliability minimum monthly flow can be raised from 21.5 to 24.5 MCM which is just

Rwanda National Water Resources Master Plan Page 70
MINIRENA-RNRA OCTOBER 2015
ahead of the dry season monthly demand (23.4 to 23.8 MCM/month depending on the
scenario). The water balance is tight but in manageable equilibrium for the 2020
situation.
for the 2030 adjusted balance the annual adjusted demand has been reduced by some
31 MCM which is related to the non implementation of a number of irrigation
activities (especially irrigation from surface water). The storage capacity programmed
for implementation stands at close to 30 MCM which allows for surplus dry season
resources of some 6 MCM/month; not enough to guarantee sufficient resources for the
once in twenty year dry conditions but enough to make sure that marshland irrigation
can be successful during the dry season for most years (4 MCM/month better than the
once in three year dry conditions; possibly once in 5 to 10 years).
for the 2040 adjusted balance the demand has been reduced by a very substantial 190
MCM as compared with the unadjusted version. In comparison with the 2030
situation there is some additional demand that mostly comes from the non irrigation
categories and stands for an additional 7 to 8 MCM/month during the dry season. The
total storage of 47 MCM will allow for a monthly surplus of 8 to 10 MCM/month
which brings the frequency of dry season stress rather approximately to a 'once in
three' to 'once in five' year event.
Note that less water-efficient irrigation methods (surface irrigation) allow for dry season
water reuse and are thus beneficial for practical water management with a stretched water
balance.
Note also that the wet season 'yellows' that show up from 2030 onwards, all occur under the
95% reliability or once in twenty year dry conditions with surpluses that are insufficient for
the rather arbitrary environmental flow requirement; hence, this is not really problematic.
In conclusion, the limited (Rwandan) renewable resources of the catchment are stretched but
manageable. It is important to monitor the resources and demand situation as it evolves
during the lifetime of the Master Plan and to adjust the plan when needed.
The vulnerable spot of the entire catchment is the dry season water table of the Akanyaru
marshland which should be maintained at higher levels in order to prevent irreversible
settling which may even bring a lowering of the Cyohoha south Lake water table with
possibly grave and unpredictable consequences.
A further risk factor is the early sedimentation of the numerous surface storage reservoirs.
The construction of this series of 14 reservoirs which is essential for sustainable water
management in the catchment should be accompanied with effective erosion protection
measures8. It is understood that Minagri has experience with the containment of reservoir
sedimentation.
The graphs below highlight the importance of the different demand categories and the
fraction consumptive demand over the average renewable resources, as well as the
distribution of this demand during the months of the year for the maximum development
condition for 2014. Intermediate graphs for 2012, 2020, and 2030 are presented in the CKIV
Catchment Master Plan presented in appendix 01CKIV.
8 The examination of the catchment water balances has not considered sediment deposition in the live storage
capacity of the surface water storage reservoirs.

Rwanda National Water Resources Master Plan Page 71
MINIRENA-RNRA OCTOBER 2015
Table 34: Resources and demand pie chart graph for NAKN 2040 - high demand scenario
56%
6%
8%
3%
1%
0%
1%2% 1%
11%0%
10%
1%
0%
44%
Resources (798 MCM) & 2040 high demand (349 MCM)
Renewable resources
Urban DWS
Rural DWS
WS industry
WS mining
Coffee WS
Livestock
Fish ponds
Irr. RWH
Irr. marshld
Irr. surf.w
Irr. Dam
Irr. gr.w
Other power
Table 35: Monthly demand distribution for NAKN 2040 - high demand scenario
For the period up to 2040, annual demand increases to about 44 % of the average renewable
resources (this was 68% for the unadjusted water balance in section 1.7.2.6).
The principal consumptive demand categories are rural water supply, urban water supply,
irrigation from dam sites and marshland irrigation. Demand for industries, mining and
fishponds is not very important in terms of consumptive use but is likely to yield very
significant revenue per cubic meter.

Rwanda National Water Resources Master Plan Page 72
MINIRENA-RNRA OCTOBER 2015
The distribution of demand during the year is rather uneven with more than half the demand
realized during the four dry season months (June - September).
Further issues on water resources and their use are related to drought in some selected
tributaries, flooding, pollution, erosion and appropriate land use aiming for economic, social
and environmental sustainability. The vulnerability of the peat-based Akanyaru marshland is
specifically important and a reasonably high water table should be guaranteed at all time.
Details on water use and demand under extreme conditions and exploitation risks as obtained
from the District Survey, are discussed in section 3.3.5.1. of the NAKN Catchment Master
Plan presented in appendix 06NAKN.
1.7.3.7 ADJUSTED DEMAND AND WATER BALANCE FOR NAKU
Details of the demand analysis for the NAKU catchment are given in paragraph 3.3.3. of the
Catchment Master Plan for the Upper Akagera catchment (appendix 07NAKU).
From paragraph 1.7.2.7 it is clear that the water balance of the catchment is not sustainable
and requires a reduction of demand. Nonetheless, demand for potable water supply,
sanitation, industries, mining, livestock, fisheries, hydropower, non consumptive and other
energy demand was reviewed and thereupon maintained as is. A number of changes is
however proposed for the irrigation sector as follows:
irrigation by means of rainwater harvesting ponds: based on an increased estimate of
the number of filling cycles of the ponds demand per pond is increased from 1,000 to
2,000 m³/year (10 filling cycles of a 200 m³ pond).
irrigation by means of marshland development: because of the interesting
performance and reduced investment and operational costs of this method, the full
development potential as identified in the RIMP has been put forward for
development during the first and second stages of the Master Plan (2012-2020 and
2020-2030) The per hectare water demand for this method remains at 2,000 m³/ha/yr.
irrigation from surface water sources: this irrigation method is expensive in
investment and exploitation costs; the latter especially when irrigating land at higher
level from the water source level. For this reason, for the limited resources of this
catchment and for the not so convincing soil suitability of the areas identified in the
RIMP, the 55,000 ha foreseen in the RIMP report has reconsidered. The area
identified has been separated in 4 'lift classes' from which only the lowest lift class (0-
25 m lift from source level) is retained for irrigation development for a total command
area of 11,500 ha plus 1969 ha already implemented. The per hectare water demand
for this method (7,000 m³/ha/yr) has not been changed. This resulted in a reduction of
water demand from 407 MCM/year to 94 MCM/year.
irrigation with surface water storage reservoirs: this irrigation method is expensive in
investment cost (dam development and irrigation command area) and an effort has
been made to assess the viability of the different sites identified in the RIMP and from
the LWH report. Out of 20 identified sites 11 have been found sufficiently interesting
in terms of site configuration and storage volume. The water demand from this
irrigation method was initially based on command area (assuming that storage was
sufficient) and the runoff in the catchment. The update of the demand (which

Rwanda National Water Resources Master Plan Page 73
MINIRENA-RNRA OCTOBER 2015
comprises multipurpose use) has given a similar result (from 47.4 MCM/year to 49.5
MCM/year).
The upper Akagera catchment requires a dry season transfer of 82 MCM for 2040 once in
twenty year dry conditions which can be provided by upper Nyabarongo and Mukungwa
catchments under the same (dry) conditions.
The adjusted water balance for the NAKU catchment is presented in the table below.
Table 36: Adjusted water balance NAKU 2012 - 2020 - 2030 - 2040.
volume data
in '000 m³
annual
totaloct nov dec jan feb mar apr may jun jul aug sep
Rs5% 673,170 48,331 57,528 60,128 56,777 57,305 61,020 63,323 67,324 61,353 53,412 41,207 45,463
Rs35% 531,383 39,194 45,497 49,594 46,844 45,537 47,169 52,143 54,762 51,294 35,623 30,154 33,573
Rs50% 502,501 35,147 43,340 46,852 44,265 44,003 44,342 51,118 53,228 48,053 33,576 27,096 31,481
Rs65% 478,721 32,941 40,081 44,896 42,082 42,116 42,754 50,314 52,144 45,871 30,856 25,153 29,512
Rs95% 350,708 26,089 31,449 28,983 32,004 35,245 33,536 36,804 41,338 27,453 21,543 16,322 19,941
gr.w.50% 351,095 26,118 31,484 29,015 32,039 35,284 33,573 36,845 41,384 27,484 21,567 16,340 19,963
Dem 2012 39,841 2,940 2,940 2,940 3,890 2,940 2,936 2,000 2,942 4,103 4,061 4,061 4,089
Surpl @ 95% 310,867 23,149 28,509 26,043 28,114 32,305 30,600 34,804 38,397 23,351 17,483 12,261 15,853
Reliab.% >=95% >=95% >=95% >=95% >=95% >=95% >=95% >=95% >=95% >=95% >=95% >=95% >=95%
Dem 2020-low 145,989 8,074 8,074 8,074 12,926 8,074 7,988 3,316 8,076 20,426 20,357 20,357 20,246
Surpl @ 95% 204,719 18,015 23,375 20,909 19,077 27,171 25,548 33,488 33,262 7,027 1,186 0 0
Reliab.% >=95% >=95% >=95% >=95% >=95% >=95% >=95% >=95% >=95% >=95% >=95% >=65% >=65%
Dem 2020-med 148,462 8,280 8,280 8,280 13,132 8,280 8,194 3,522 8,282 20,632 20,563 20,563 20,452
Surpl @ 95% 202,246 17,809 23,169 20,703 18,871 26,965 25,342 33,282 33,056 6,821 980 0 0
Reliab.% >=95% >=95% >=95% >=95% >=95% >=95% >=95% >=95% >=95% >=95% >=95% >=65% >=65%
Dem 2020-high 150,174 8,423 8,423 8,423 13,275 8,423 8,336 3,664 8,425 20,775 20,706 20,706 20,595
Surpl @ 95% 200,534 17,666 23,026 20,560 18,729 26,822 25,199 33,140 32,914 6,678 838 0 0
Reliab.% >=95% >=95% >=95% >=95% >=95% >=95% >=95% >=95% >=95% >=95% >=95% >=65% >=65%
Dem 2030-low 243,734 13,373 13,373 13,373 21,862 13,373 13,197 5,066 13,374 34,362 34,190 34,190 34,003
Surpl @ 95% 106,974 12,717 18,077 15,610 10,141 21,873 20,339 31,738 27,964 0 0 0 0
Reliab.% >=95% >=95% >=95% >=95% >=95% >=95% >=95% >=95% >=95% >=65% >=35% >=5% >=5%
Dem 2030-med 251,622 14,030 14,030 14,030 22,520 14,030 13,854 5,723 14,032 35,020 34,847 34,847 34,661
Surpl @ 95% 99,086 12,059 17,419 14,953 9,484 21,215 19,682 31,081 27,307 0 0 0 0
Reliab.% >=95% >=95% >=95% >=95% >=95% >=95% >=95% >=95% >=95% >=65% >=35% >=5% >=5%
Dem 2030-high 257,939 14,556 14,556 14,556 23,046 14,556 14,380 6,249 14,558 35,546 35,373 35,373 35,187
Surpl @ 95% 92,769 11,533 16,893 14,427 8,958 20,689 19,155 30,555 26,780 0 0 0 0
Reliab.% >=95% >=95% >=95% >=95% >=95% >=95% >=95% >=95% >=95% >=65% >=35% >=5% >=5%
Dem 2040-low 285,647 16,507 16,507 16,507 26,214 16,507 16,151 7,161 16,508 38,714 38,438 38,438 37,996
Surpl @ 95% 65,061 9,583 14,943 12,476 5,790 18,739 17,385 29,643 24,830 0 0 0 0
Reliab.% >=95% >=95% >=95% >=95% >=95% >=95% >=95% >=95% >=95% >=65% >=5% >=5% >=5%
Dem 2040-med 307,102 18,294 18,294 18,294 28,002 18,294 17,939 8,949 18,296 40,502 40,226 40,226 39,784
Surpl @ 95% 43,606 7,795 13,155 10,688 4,002 16,951 15,597 27,855 23,042 0 0 0 0
Reliab.% >=95% >=95% >=95% >=95% >=95% >=95% >=95% >=95% >=95% >=65% >=5% >=5% >=5%
Dem 2040-high 326,109 19,878 19,878 19,878 29,586 19,878 19,523 10,533 19,880 42,086 41,810 41,810 41,368
Surpl @ 95% 24,599 6,211 11,571 9,105 2,418 15,367 14,013 26,271 21,458 0 0 0 0
Reliab.% >=95% >=95% >=95% >=95% >=95% >=95% >=95% >=95% >=95% >=65% >=5% <5% >=5%
In comparison with the unadjusted water balance discussed in section 1.7.2.7 which proved
completely unmanageable by 2040, the stress conditions seem to have been 'reduced' except
for the dry season months:

Rwanda National Water Resources Master Plan Page 74
MINIRENA-RNRA OCTOBER 2015
for the 2020 adjusted scenario we observe a slight decrease of annual water demand
by some 10 MCM to about 150 MCM/year, but the dry season demand shows a slight
increase and the stress conditions persist during exceptionally dry years whence
environmental flow requirements may not be honored.
for the 2030 adjusted scenario the annual water demand has decreased by 80 MCM to
about 250 - 260 MCM/year. The dry season demand exceeds the renewable resources
except for the wettest years, there is need for either local storage carry over from wet
season to dry season or a transfer from upstream catchments. The wet season situation
is fully under control.
for the 2040 scenario the adjusted water balance demand has been reduced by 330
MCM to about 325 MCM/year which is slightly less than the twenty year dry year
renewable resources. The wet season situation is very manageable but the dry season
reveals absolute lack of resources with the dry season monthly demand exceeding
even the two in three years wet conditions renewable resources.
Notwithstanding these observations the adjusted water balance is manageable because of the
provision of surface water storage capacity within the catchment (26 MCM capacity by 2040)
and an inter-basin transfer from the upstream catchments of at least 82 MCM (minimum for
the once in twenty year dry conditions; less would be needed for 'normal' years).
In conclusion, the adjusted water balance table corroborates the notion that the proposed
water demand scenarios are tight but can be handled successfully. This requires
comprehensive monitoring of actual water use and renewable resources.
The graphs below highlight the importance of the different demand categories and the
fraction consumptive demand over the average renewable resources, as well as the
distribution of this demand during the months of the year for the maximum development
condition for 2014. Intermediate graphs for 2012, 2020, and 2030 are presented in the NAKU
Catchment Master Plan presented in appendix 07NAKU.
Table 37: Resources and demand pie chart graph for NAKU 2040 - high demand scenario
35%
11%
7%
3%
2%
0%
1% 2%0%
10%
19%
10%
0%
0%
65%
Resources (504 MCM) & 2040 high demand (326 MCM)
Renewable resourcesUrban DWSRural DWSWS industryWS miningCoffee WSLivestockFish pondsIrr. RWHIrr. marshldIrr. surf.wIrr. DamIrr. gr.wOther power

Rwanda National Water Resources Master Plan Page 75
MINIRENA-RNRA OCTOBER 2015
Table 38: Monthly demand distribution for NAKU 2040 - high demand scenario
For the period up to 2040, annual demand increases to about 65% of the average renewable
resources (this was a completely unrealistic 130% for the unadjusted water balance in section
1.7.2.7). Notwithstanding the very substantial reduction of irrigation sector demand, the
principal consumptive demand categories are irrigation (surface water, marshland and dam
sites), urban and rural water supply and industries and mining.
The distribution of demand during the year is concentrated on the dry season which requires
half the annual demand during its four months duration.
It is clear that this catchment requires state of the art resources and demand management
especially as regards the irrigation developments which should be closely monitored.
Considering the limited availability of water resources it is of utmost importance to select the
best suitable land and aim for rational water use. Beyond the requirements of the primary use
category (water to sustain livelihood), the highest return per cubic meter of water should be
considered (if not rule). This generally means that the irrigation sector is the lowest priority
user but within this sector there should be differentiation in priority between perennial crops
(fruit trees, etc.) and seasonal crops, and between investment level costs (localized irrigation
versus surface irrigation. Even when the irrigation sector may be the prime sector to endure
the fluctuations of water availability, this doesn't mean that other sectors should not respond
to temporarily reduced resources availability.
Further issues on water resources and their use are related to flooding, pollution, erosion and
appropriate land use aiming for economic, social and environmental sustainability.
Details on water use and demand under extreme conditions and exploitation risks as obtained
from the District Survey, are discussed in section 3.3.5.1. of the NAKU Catchment Master
Plan presented in appendix 07NAKU.

Rwanda National Water Resources Master Plan Page 76
MINIRENA-RNRA OCTOBER 2015
1.7.3.8 ADJUSTED DEMAND AND WATER BALANCE FOR NAKL
Details of the demand analysis for the NAKL catchment are given in paragraph 3.3.3. of the
Catchment Master Plan for the Lower Akagera catchment (appendix 08NAKL).
The unadjusted water balance for this catchment as presented in paragraph 1.7.2.8 clearly
indicated that there is need for demand to be reduced in order to maintain a sustainable
exploitation in case of full development by 2040. This reduction is specifically sought in the
irrigation sector. Due to the important difference between the 2012 census data (~30 % above
the projections based on the 2002 census data), the water demand from rural water supply has
been revised upward. The changes from the unadjusted demand projections are as follows:
rural drinking water supply has been increased by 31% for every time horizon and
demand scenario of the Master Plan to account for the difference between the 2012
census data and the population projection data (from 2002 census) for this catchment.
Due to the marginal demand from other categories this correction wasn't applied
elsewhere.
irrigation by means of rainwater harvesting ponds: based on an increased estimate of
the number of filling cycles of the ponds demand per pond is increased from 1,000 to
2,000 m³/year (10 filling cycles of a 200 m³ pond).
irrigation by means of marshland development: because of the interesting
performance and reduced investment and operational costs of this method, the full
development potential as identified in the RIMP (33,355 ha) has been allowed for
with an annual demand of 2,500 m³/ha. The implementation schedule has been put
forward a little bit in order to make optimum use of available resources. (2020 - 2030
- 2040 assumed implementation status is: 10,600 - 25,600 - 33,355 ha). The dry
season water availability in the command areas of the Kamiramugezi and Karangaza
rivers may be limited.
irrigation from surface water sources: this irrigation method is expensive in
investment and exploitation costs; the latter especially when irrigating land at higher
level from the water source level. For this reason, the 33,000 + ha foreseen in the
RIMP report has been separated in 4 altitude classes and only the lower 2 altitude
classes (0-25 and 25-50 m lift from source level) for a total of 18,000 ha command
area, have been considered for gradual development during the lifetime of the Master
Plan. The per hectare water demand for this method (8,000 m³/ha/yr) has not been
changed. Adjusted demand from this use category has consequently been reduced to
55 % of the initial demand (from 263 MCM/year to 144 MCM/year).
irrigation with surface water storage reservoirs: this irrigation method is expensive in
investment cost (dam development and irrigation command area and an effort has
been made to assess the viability of the different sites identified in the RIMP. Eight
out of 10 identified sites have been found sufficiently interesting in terms of site
configuration and storage volume. A total storage volume of 21 MCM is supported
but any further storage volume up to about 115 MCM for the total catchment will be
effective and beneficial to the regulation and increased use of water resources. The
water demand from this irrigation method progresses from 2, via 21 and 38 to 48
MCM/yr for 2012, 2020, 2030 and 2040 time horizon. This was initially set at 12
MCM/yr.
irrigation demand from groundwater: this irrigation method is also susceptible to
bring high exploitation costs for pumping. The area viable for exploitation has been

Rwanda National Water Resources Master Plan Page 77
MINIRENA-RNRA OCTOBER 2015
estimated at about 50 60 % of the area identified in the RIMP (8,548 ha). Water
demand from this reduced command area (~5,000 ha) is estimated at 40 MCM/year
which is gradually implemented over the period from 2012 - 2040.
The lower Akagera catchment requires a dry season transfer of 43 MCM for 2040 once in
twenty year dry conditions which can be provided by upper Nyabarongo and Mukungwa
catchments under the same conditions along with the transfer to the upper Akagera
catchment's transfer of 82 MCM.
The adjusted water balance for the NAKL catchment is presented in the table below.
Table 39: Adjusted water balance NAKL 2012 - 2020 - 2030 - 2040.
volume data
in '000 m³
annual
totaloct nov dec jan feb mar apr may jun jul aug sep
Rs5% 1,285,266 73,080 82,640 97,397 98,981 105,763 115,277 136,037 142,848 134,544 114,129 106,544 78,026
Rs35% 964,603 59,628 65,017 72,784 78,192 78,205 90,840 102,955 107,707 96,775 82,500 68,334 61,665
Rs50% 874,040 56,391 60,588 69,081 71,164 71,196 76,402 91,208 97,439 86,018 75,166 62,834 56,553
Rs65% 814,376 52,479 57,393 61,835 64,558 69,924 71,661 84,199 92,047 79,178 70,200 60,077 50,823
Rs95% 593,775 35,191 40,411 42,008 50,423 56,371 56,287 59,817 68,756 58,442 48,887 40,876 36,306
gr.w.50% 536,000 31,767 36,479 37,921 45,517 50,886 50,810 53,997 62,066 52,756 44,130 36,899 32,773
Dem 2012 22,454 1,605 1,605 1,605 2,050 1,605 1,602 1,165 1,606 2,425 2,384 2,384 2,418
Surpl @ 95% 571,321 33,586 38,805 40,403 48,373 54,766 54,684 58,652 67,150 56,018 46,503 38,492 33,888
Reliab.% >=95% >=95% >=95% >=95% >=95% >=95% >=95% >=95% >=95% >=95% >=95% >=95% >=95%
Dem 2020-low 128,576 6,864 6,864 6,864 11,852 6,864 6,783 1,959 6,864 18,477 18,436 18,436 18,313
Surpl @ 95% 465,199 28,327 33,547 35,144 38,571 49,507 49,504 57,858 61,891 39,965 30,451 22,440 17,993
Reliab.% >=95% >=95% >=95% >=95% >=95% >=95% >=95% >=95% >=95% >=95% >=95% >=95% >=95%
Dem 2020-med 129,905 6,975 6,975 6,975 11,963 6,975 6,893 2,069 6,975 18,588 18,547 18,547 18,424
Surpl @ 95% 463,870 28,217 33,436 35,034 38,460 49,396 49,393 57,748 61,781 39,855 30,340 22,329 17,882
Reliab.% >=95% >=95% >=95% >=95% >=95% >=95% >=95% >=95% >=95% >=95% >=95% >=95% >=95%
Dem 2020-high 130,758 7,046 7,046 7,046 12,034 7,046 6,965 2,141 7,046 18,659 18,618 18,618 18,495
Surpl @ 95% 463,017 28,145 33,365 34,962 38,389 49,325 49,322 57,677 61,709 39,783 30,269 22,258 17,811
Reliab.% >=95% >=95% >=95% >=95% >=95% >=95% >=95% >=95% >=95% >=95% >=95% >=95% >=95%
Dem 2030-low 260,630 13,036 13,036 13,036 23,219 13,036 12,872 3,017 13,036 39,219 39,116 39,116 38,891
Surpl @ 95% 333,145 22,156 27,375 28,973 27,204 43,335 43,414 56,800 55,720 19,223 9,771 1,760 0
Reliab.% >=95% >=95% >=95% >=95% >=95% >=95% >=95% >=95% >=95% >=95% >=95% >=95% >=65%
Dem 2030-med 264,886 13,390 13,390 13,390 23,574 13,390 13,227 3,372 13,391 39,574 39,471 39,471 39,246
Surpl @ 95% 328,889 21,801 27,020 28,618 26,849 42,981 43,060 56,445 55,365 18,869 9,416 1,405 0
Reliab.% >=95% >=95% >=95% >=95% >=95% >=95% >=95% >=95% >=95% >=95% >=95% >=95% >=65%
Dem 2030-high 268,160 13,663 13,663 13,663 23,847 13,663 13,500 3,645 13,664 39,847 39,744 39,744 39,519
Surpl @ 95% 325,615 21,528 26,747 28,345 26,576 42,708 42,787 56,172 55,092 18,596 9,143 1,132 0
Reliab.% >=95% >=95% >=95% >=95% >=95% >=95% >=95% >=95% >=95% >=95% >=95% >=95% >=65%
Dem 2040-low 370,418 18,955 18,955 18,955 34,093 18,955 18,628 4,146 18,956 54,940 54,775 54,775 54,284
Surpl @ 95% 223,357 16,236 21,455 23,053 16,330 37,416 37,659 55,671 49,800 3,503 0 0 0
Reliab.% >=95% >=95% >=95% >=95% >=95% >=95% >=95% >=95% >=95% >=95% >=65% >=65% >=50%
Dem 2040-med 381,470 19,876 19,876 19,876 35,014 19,876 19,549 5,067 19,877 55,861 55,696 55,696 55,205
Surpl @ 95% 212,305 15,315 20,534 22,132 15,409 36,495 36,738 54,750 48,879 2,582 0 0 0
Reliab.% >=95% >=95% >=95% >=95% >=95% >=95% >=95% >=95% >=95% >=95% >=65% >=65% >=50%
Dem 2040-high 391,178 20,685 20,685 20,685 35,823 20,685 20,358 5,876 20,686 56,670 56,505 56,505 56,014
Surpl @ 95% 202,597 14,506 19,725 21,323 14,600 35,686 35,929 53,941 48,070 1,773 0 0 0
Reliab.% >=95% >=95% >=95% >=95% >=95% >=95% >=95% >=95% >=95% >=95% >=65% >=65% >=50%

Rwanda National Water Resources Master Plan Page 78
MINIRENA-RNRA OCTOBER 2015
In comparison with the unadjusted water balance discussed in section 1.7.2.8, the stress
conditions do not seem to have been solved:
current situation without any stress identified; some demand assumptions were
adjusted.
for the 2020 adjusted balance the demand is higher by some 15 MCM/year to about
130 MCM/year. This is related to the somewhat accelerated implementation of
development opportunities (irrigation) The environmental flow requirement is a little
bit comprised at the end of the dry season under a once in twenty year dry condition.
No major issue however.
for the 2030 adjusted scenario the annual water demand is higher by some 25
MCM/year to about 270 MCM/year and for the same reason as above. There is
significant impact on the environmental flow which is however in practice not the
case because of storage facilities and transfer of resources from upper catchments.
for the 2040 scenario the adjusted water balance demand is lower by some 85
MCM/year which is due to the more realistic development levels of especially hill
side and borehole irrigation. The impact on the environmental flow is less extreme in
the balance but remains evident. In practice the balance will be fitting due to storage
reservoirs and interbasin transfers.
In conclusion: while the table still highlights stress conditions, the additional measures,
transfer and carrying over of resources from the wet to the dry season, assure a sustainable
and manageable water balance up to 2040 under the high growth scenario.
The graphs below highlight the importance of the different demand categories and the
fraction consumptive demand over the average renewable resources, as well as the
distribution of this demand during the months of the year for the maximum development
condition for 2014. Intermediate graphs for 2012, 2020, and 2030 are presented in the
NNAKL Catchment Master Plan presented in appendix 08NAKL.
Table 40: Resources and demand pie chart graph for NAKL 2040 - high demand scenario
57%
2%
4%
1%
1%
0%
0%
1%
0%
9%
16%
5%
4%
0%
43%
Resources (907 MCM) & 2040 high demand (391 MCM)
Renewable resources
Urban DWS
Rural DWS
WS industry
WS mining
Coffee WS
Livestock
Fish ponds
Irr. RWH
Irr. marshld
Irr. surf.w
Irr. Dam
Irr. gr.w
Other power

Rwanda National Water Resources Master Plan Page 79
MINIRENA-RNRA OCTOBER 2015
Table 41: Monthly demand distribution for NAKL 2040 - high demand scenario
For the period up to 2040, annual demand increases to about 43 % of the average renewable
resources (this was 53 % for the unadjusted water balance in section 1.7.2.1).
The principal consumptive demand categories are irrigation (surface water, marshland and
dam sites), with additional demand for rural and urban water supply. industries and mining.
Water demand for industries, mining, livestock and fisheries is not very important but
contributes significantly to revenue generation.
More than half the annual demand is registered during the four wet season months when
resources availability is at its lowest.
State of the art water management procedures will be required sooner or later in order to
control implementation of water resources development works and their exploitation. The
access to groundwater resources (a very reliable source of supply) should be incorporated in
these management procedures and preferably allocated to primary use categories (notably
drinking water supply).
Further issues on water resources and their use are related to flooding, pollution and
appropriate land use aiming for economic, social and environmental sustainability.
Details on water use and demand under extreme conditions and exploitation risks as obtained
from the District Survey, are discussed in section 3.3.5.1. of the NAKL Catchment Master
Plan presented in appendix 08NAKL.
1.7.3.9 ADJUSTED DEMAND AND WATER BALANCE FOR NMUV
Details of the demand analysis for the NMUV catchment are given in paragraph 3.3.3. of the
Catchment Master Plan for the Muvumba catchment (appendix 09NMUV).
From the unadjusted water balance presented in paragraph 1.7.2.9 it is absolutely clear that
the water balance of the catchment requires a substantial downward revision of demand.

Rwanda National Water Resources Master Plan Page 80
MINIRENA-RNRA OCTOBER 2015
Although the bulk of water demand comes from the irrigation sector, it is also proposed that
the demand from industries be limited to the 2040 medium demand scenario (on the premise
that water intensive industries be referred to other catchments with richer water availability).
The changes of water demand in the irrigation sector are as follows:
irrigation by means of rainwater harvesting ponds: based on an increased estimate of
the number of filling cycles of the ponds demand per pond is increased from 1,000 to
2,000 m³/year (10 filling cycles of a 200 m³ pond).
irrigation by means of marshland development: because of the interesting
performance and reduced investment and operational costs of this method, the full
development potential as identified in the RIMP has been put forward for
development during the first and second stages of the Master Plan, the period prior to
2020 and between 2020 and 2030. The per hectare water demand for this method has
been adjusted to 2,500 m³/ha/yr). In order to support the water requirements during
the second stage of the Master Plan a series of 4 reservoirs is proposed with a
combined storage capacity of 34 MCM (or more).
irrigation from surface water sources: this irrigation method is expensive in
investment and exploitation costs; the latter especially when irrigating land at higher
level from the water source level. Considering the imminent water stress in this
catchment, no extension of this irrigation method is foreseen but the currently
developed 400 ha can be maintained. The potential irrigation area foreseen in the
RIMP was more than 10,000 ha but available water resources are deemed largely
insufficient.
irrigation with surface water storage reservoirs: this irrigation method is expensive in
investment cost (dam development and irrigation command area and an effort has
been made to assess the viability of the different sites identified in the RIMP and from
the LWH report. All the 9 identified sites have been judged as sufficiently interesting
in terms of site configuration and storage volume. Four of these sites are required to
support the marshland irrigation and their water requirements are considered declared
under that category. The water demand from 5 further sites to be implemented during
the 2030 - 2040 planning period has been estimated at some 26 MCM.
The adjusted water balance for the NMUV catchment is presented in the table below.
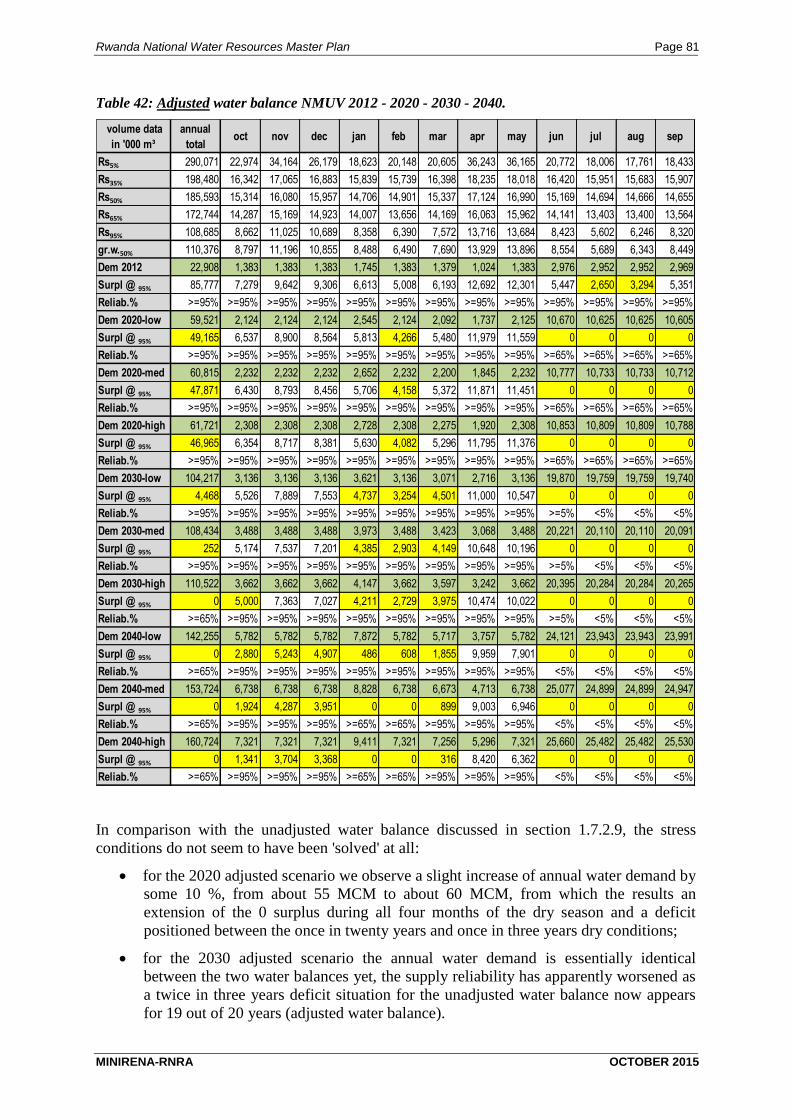
Rwanda National Water Resources Master Plan Page 81
MINIRENA-RNRA OCTOBER 2015
Table 42: Adjusted water balance NMUV 2012 - 2020 - 2030 - 2040.
volume data
in '000 m³
annual
totaloct nov dec jan feb mar apr may jun jul aug sep
Rs5% 290,071 22,974 34,164 26,179 18,623 20,148 20,605 36,243 36,165 20,772 18,006 17,761 18,433
Rs35% 198,480 16,342 17,065 16,883 15,839 15,739 16,398 18,235 18,018 16,420 15,951 15,683 15,907
Rs50% 185,593 15,314 16,080 15,957 14,706 14,901 15,337 17,124 16,990 15,169 14,694 14,666 14,655
Rs65% 172,744 14,287 15,169 14,923 14,007 13,656 14,169 16,063 15,962 14,141 13,403 13,400 13,564
Rs95% 108,685 8,662 11,025 10,689 8,358 6,390 7,572 13,716 13,684 8,423 5,602 6,246 8,320
gr.w.50% 110,376 8,797 11,196 10,855 8,488 6,490 7,690 13,929 13,896 8,554 5,689 6,343 8,449
Dem 2012 22,908 1,383 1,383 1,383 1,745 1,383 1,379 1,024 1,383 2,976 2,952 2,952 2,969
Surpl @ 95% 85,777 7,279 9,642 9,306 6,613 5,008 6,193 12,692 12,301 5,447 2,650 3,294 5,351
Reliab.% >=95% >=95% >=95% >=95% >=95% >=95% >=95% >=95% >=95% >=95% >=95% >=95% >=95%
Dem 2020-low 59,521 2,124 2,124 2,124 2,545 2,124 2,092 1,737 2,125 10,670 10,625 10,625 10,605
Surpl @ 95% 49,165 6,537 8,900 8,564 5,813 4,266 5,480 11,979 11,559 0 0 0 0
Reliab.% >=95% >=95% >=95% >=95% >=95% >=95% >=95% >=95% >=95% >=65% >=65% >=65% >=65%
Dem 2020-med 60,815 2,232 2,232 2,232 2,652 2,232 2,200 1,845 2,232 10,777 10,733 10,733 10,712
Surpl @ 95% 47,871 6,430 8,793 8,456 5,706 4,158 5,372 11,871 11,451 0 0 0 0
Reliab.% >=95% >=95% >=95% >=95% >=95% >=95% >=95% >=95% >=95% >=65% >=65% >=65% >=65%
Dem 2020-high 61,721 2,308 2,308 2,308 2,728 2,308 2,275 1,920 2,308 10,853 10,809 10,809 10,788
Surpl @ 95% 46,965 6,354 8,717 8,381 5,630 4,082 5,296 11,795 11,376 0 0 0 0
Reliab.% >=95% >=95% >=95% >=95% >=95% >=95% >=95% >=95% >=95% >=65% >=65% >=65% >=65%
Dem 2030-low 104,217 3,136 3,136 3,136 3,621 3,136 3,071 2,716 3,136 19,870 19,759 19,759 19,740
Surpl @ 95% 4,468 5,526 7,889 7,553 4,737 3,254 4,501 11,000 10,547 0 0 0 0
Reliab.% >=95% >=95% >=95% >=95% >=95% >=95% >=95% >=95% >=95% >=5% <5% <5% <5%
Dem 2030-med 108,434 3,488 3,488 3,488 3,973 3,488 3,423 3,068 3,488 20,221 20,110 20,110 20,091
Surpl @ 95% 252 5,174 7,537 7,201 4,385 2,903 4,149 10,648 10,196 0 0 0 0
Reliab.% >=95% >=95% >=95% >=95% >=95% >=95% >=95% >=95% >=95% >=5% <5% <5% <5%
Dem 2030-high 110,522 3,662 3,662 3,662 4,147 3,662 3,597 3,242 3,662 20,395 20,284 20,284 20,265
Surpl @ 95% 0 5,000 7,363 7,027 4,211 2,729 3,975 10,474 10,022 0 0 0 0
Reliab.% >=65% >=95% >=95% >=95% >=95% >=95% >=95% >=95% >=95% >=5% <5% <5% <5%
Dem 2040-low 142,255 5,782 5,782 5,782 7,872 5,782 5,717 3,757 5,782 24,121 23,943 23,943 23,991
Surpl @ 95% 0 2,880 5,243 4,907 486 608 1,855 9,959 7,901 0 0 0 0
Reliab.% >=65% >=95% >=95% >=95% >=95% >=95% >=95% >=95% >=95% <5% <5% <5% <5%
Dem 2040-med 153,724 6,738 6,738 6,738 8,828 6,738 6,673 4,713 6,738 25,077 24,899 24,899 24,947
Surpl @ 95% 0 1,924 4,287 3,951 0 0 899 9,003 6,946 0 0 0 0
Reliab.% >=65% >=95% >=95% >=95% >=65% >=65% >=95% >=95% >=95% <5% <5% <5% <5%
Dem 2040-high 160,724 7,321 7,321 7,321 9,411 7,321 7,256 5,296 7,321 25,660 25,482 25,482 25,530
Surpl @ 95% 0 1,341 3,704 3,368 0 0 316 8,420 6,362 0 0 0 0
Reliab.% >=65% >=95% >=95% >=95% >=65% >=65% >=95% >=95% >=95% <5% <5% <5% <5%
In comparison with the unadjusted water balance discussed in section 1.7.2.9, the stress
conditions do not seem to have been 'solved' at all:
for the 2020 adjusted scenario we observe a slight increase of annual water demand by
some 10 %, from about 55 MCM to about 60 MCM, from which the results an
extension of the 0 surplus during all four months of the dry season and a deficit
positioned between the once in twenty years and once in three years dry conditions;
for the 2030 adjusted scenario the annual water demand is essentially identical
between the two water balances yet, the supply reliability has apparently worsened as
a twice in three years deficit situation for the unadjusted water balance now appears
for 19 out of 20 years (adjusted water balance).

Rwanda National Water Resources Master Plan Page 82
MINIRENA-RNRA OCTOBER 2015
for the 2040 scenario the adjusted water balance demand has been reduced by 50 to 60
MCM (depending on the low, medium or high scenario) but this scenario still shows a
persistent deficit during the entire dry season for 19 out of 20 years.
Notwithstanding these observations the adjusted water balance is manageable because there
is in inter-seasonal storage of about 35 MCM (1 MCM existing, 34 MCM new capacity to be
implemented during 2020 - 2030) planned for the 2030 time horizon and about 43 MCM for
the 2040 time horizon. This storage permits to carry over surplus capacity from the wet
season to the dry season and provide sufficient resources for successful irrigation campaigns.
It can be read from the adjusted water balance table (Table 42 on preceding page) that the
storage capacity of about 35 MCM foreseen for the 2030 time horizon, will be filled even
during the once in twenty years dry year (surplus values at 95% dry conditions from the
month of October up to May).
This is not the case for the 2040 time horizon when 43 MCM9 of storage capacity has to be
filled from surplus supply during the preceding wet season. Based on the substantial increase
of renewable resources for the 65 % dry conditions, it can be deducted that seasonal carry
over will partly fail once every ten years or so. For these circumstances, proper allocation
procedures should be established which consider social, economic and environmental criteria
to manage the scarcity.
In conclusion, the adjusted water balance table corroborates the notion that the proposed
water demand scenarios are tight but can be handled successfully. This requires
comprehensive monitoring of actual water use and renewable resources. If significant
deviations from the plan occur, this catchment development plan needs to be adjusted.
The graphs below highlight the importance of the different demand categories and the
fraction consumptive demand over the average renewable resources, as well as the
distribution of this demand during the months of the year for the maximum development
condition for 2014. Intermediate graphs for 2012, 2020, and 2030 are presented in the
NMUV Catchment Master Plan presented in appendix 09NMUV.
9 This assessment does not consider sediment deposition in the live storage capacity of the different reservoirs.

Rwanda National Water Resources Master Plan Page 83
MINIRENA-RNRA OCTOBER 2015
Table 43: Resources and demand pie chart graph for NMUV 2040 - high demand scenario
17%9%
16%
3%
2%0% 1%
1%
1%
34%
2%
14%
0%
0%
83%
Resources (193 MCM) & 2040 high demand (161 MCM)
Renewable resources
Urban DWS
Rural DWS
WS industry
WS mining
Coffee WS
Livestock
Fish ponds
Irr. RWH
Irr. marshld
Irr. surf.w
Irr. Dam
Irr. gr.w
Other power
Table 44: Monthly demand distribution for NMUV 2040 - high demand scenario
4%4%
5%
6%
5%
4%
3%
5%
16%
16%
16%
16%
Monthly Water Demand - 2040 high
Oct.
Nov.
Dec.
Jan.
Feb.
Mar.
Apr.
Mai
Jun.
Jul.
Aug.
Sep
For the period up to 2040, annual demand increases to about 83% of the average renewable
resources (this was 112% for the unadjusted water balance in section 1.7.2.9). The principal
consumptive demand categories are again irrigation (mainly marshland and dam irrigation, no
long term resources for river supply), rural and urban water supply, with some
complementary demand from industries, mining, livestock and fish ponds.
The water use is massively concentrated during the four dry season months.

Rwanda National Water Resources Master Plan Page 84
MINIRENA-RNRA OCTOBER 2015
With a targeted water use of 83% of the average annual renewable resources, the practical
impossibility to provide for supplementary resources by means of inter basin transfer and
notwithstanding development of important surface water storage capacity and possible flow
from Uganda, it should be expected that partial deficits are encountered with a rather high
frequency (once every two years or even more often).
These deficits may only fractionally be supported by non irrigation sector use hence the bulk
of the deficits must be borne by the irrigation sector. This catchment requires state of the art
resources and demand management especially as regards the irrigation developments which
should be closely monitored. Considering the limited availability of water resources it of
utmost importance to select the best suitable land and aim for rational irrigation development
(not necessarily highest standard) and water use (not necessarily highest water efficiency).
Beyond the requirements of the primary use category (water to sustain livelihood), the
highest return per cubic meter of water should dominate. This generally means that the
irrigation sector is the lowest priority user but within this sector there should be
differentiation in priority between perennial crops (fruit trees, ...) and seasonal crops, and
between investment level costs (localized irrigation versus surface irrigation. Even when the
irrigation sector may be the prime sector to endure the fluctuations of water availability, this
doesn't mean that other sectors should not respond to temporarily reduced resources
availability.
Apart from the water scarcity in the entire north eastern part of the catchment, further issues
on water resources and their use are related to flooding, pollution and appropriate land use
aiming for economic, social and environmental sustainability.
Details on water use and demand under extreme conditions and exploitation risks as obtained
from the District Survey, are discussed in section 3.3.5.1. of the NMUV Catchment Master
Plan presented in appendix 09NMUV.
1.7.3.10 SUMMARY AND OVERVIEW OF ADJUSTED DEMAND AND WATER BALANCES
In the preceding paragraphs the particular relevance and adequacy of the different demand
categories have been reviewed, and the availability of the renewable resources of the different
catchments has been verified. For the catchments where resources are ultimately expected to
be insufficient for full development, a number of measures has been proposed ranging from
reduction of demand, intra annual regulation of resources (creation of surface water storage
capacity), and transfer of additional resources from other catchments. A further option is the
reuse of used water (if needed after treatment) which may ultimately become important when
the sanitation of urban water use pushes off and it is recommended to be implemented in the
irrigation sector. At the level of detail of this national study it is not very realistic to rely on
this technique but it should be taken up when more precise catchment Master Plans are
developed; this latter action is highly recommended.
The results of the review and verification of the water resources and their use in the nine
catchment can be summarized as follows:
1. Lake Kivu catchment:
o surplus water balance up to 2040 and beyond
o land and water resources protection mandatory
o development of surface water storage facilities (4 sites endorsed)
o development of rural and urban water supply

Rwanda National Water Resources Master Plan Page 85
MINIRENA-RNRA OCTOBER 2015
o surface water irrigation from lake Kivu if water quality issue can be solved
o micro scale hydropower potential
2. Rusizi catchment
o surplus water balance up to 2040 and beyond but imminent deficit in Rubyiro
tributary (CRUS_1)
o land and water resources protection mandatory
o development of rural and urban water supply
o surface water irrigation from Rusizi river if water quality issue can be solved
o micro and medium scale hydropower potential
3. Upper Nyabarongo catchment
o surplus water balance up to 2040 and beyond
o land and water resources protection mandatory
o development of surface water storage facilities (7 sites endorsed)
o development of rural and urban water supply
o marshland irrigation (23,000 ha)
o micro scale hydropower potential
4. Mukungwa catchment
o surplus water balance up to 2040 and beyond
o land and water resources protection mandatory
o development of rural and urban water supply
o micro scale hydropower potential
5. Lower Nyabarongo catchment
o tense equilibrium water balance up to 2040 (but no need for transfer)
o land and water resources protection mandatory
o superior water management essential
o development of surface water storage facilities (12 sites endorsed plus
development of Muhazi Lake as reservoir)
o development of urban and rural water supply
o marshland irrigation (30,000 ha)
o river and lake irrigation (5,000 ha)
o groundwater irrigation (4,000 ha)
o micro scale hydropower potential
6. Akanyaru catchment
o tense equilibrium water balance up to 2040 (transfer not possible)
o land and water resources protection mandatory with i) Akanyaru river
vulnerable and ii) drought prone tributaries in shallow granite deposits
o superior water management essential
o development of surface water storage facilities (14 sites endorsed)
o development of rural and urban water supply
o marshland irrigation (45,000 ha limit on potential of 59,000 ha)
o river and lake irrigation further development to be discontinued
o micro scale hydropower potential
7. Upper Akagera catchment
o deficit equilibrium water balance by 2040 (up to 82 MCM transfer by 2040)
o land and water resources protection mandatory
o superior water management essential
o development of surface water storage facilities (11 sites endorsed)

Rwanda National Water Resources Master Plan Page 86
MINIRENA-RNRA OCTOBER 2015
o development of urban and rural water supply
o marshland irrigation (25,000 ha limit on potential of 36,000 ha)
o river and lake irrigation (11,500 ha limit on potential of 55,000 ha)
o medium scale hydropower potential (Rusumo falls)
8. Lower Akagera catchment
o deficit equilibrium water balance by 2040 (up to 43 MCM transfer by 2040)
o land and water resources protection mandatory
o superior water management essential
o development of surface water storage facilities (8 sites endorsed)
o development of rural and urban water supply
o marshland irrigation (33,000 ha with likely recurrent deficits for
Kamiramugezi and Karangaza rivers)
o river and lake irrigation (18,000 ha suitable from potential of 33,000 ha)
o groundwater irrigation (5,000 ha)
9. Muvumba catchment
o extremely tense equilibrium water balance by 2040 (transfer not possible)
o land and water resources protection mandatory
o superior water management essential
o development of surface water storage facilities (9 sites endorsed for maximum
storage capacity development)
o development of rural and urban water supply
o marshland irrigation (26,000 ha supplied by 4 strategic reservoirs with
recurrent deficits)
o river and lake irrigation further development to be stopped
o micro scale hydropower potential
The review of the catchment water balances for the period from 2012 up to 2040 permits to
prepare annual flow schedules. These schedules are presented in the diagrams on the next
pages for the medium demand scenario of 2012 and the highest growth (maximum demand)
scenarios for 2020, 2030 and 2040 assuming average resources conditions (Figure 9 up to
Figure 12). Each schedule presents the Congo basin on the left and the Nile basin on the
right.
A brief explanation of the parameters presented in the flow schedule is as follows:
arrows indicate flow direction and the arrow width refers to the magnitude of flow.
'inflow' is the uncommitted annual volume in MCM that enters the catchment from
upstream
'flow' is the annual volume in MCM that is generated within the catchment on
Rwandan territory
'use' is the annual volume in MCM that is spent within the catchment
'balance' is the volume in MCM of changed ground or surface water resources; this
value is typically zero for an annual flow schedule but would be positive or negative
for monthly flow schedules
'transfer' is the volume in MCM that is specifically transferred from a surplus
catchment to a deficit catchment in order to sustain the water demand of the deficit
catchment
'outflow' is the uncommitted volume in MCM that leaves the catchment downstream

Rwanda National Water Resources Master Plan Page 87
MINIRENA-RNRA OCTOBER 2015
All volume are counted for the time step of the schedule; in this case a single year.
Within an international context, the flow schedules based on average resources conditions
and medium (1012) and high (later years) demand, indicate a moderate reduction of annual
outflow for the Congo basin from 1,295 MCM to 1,064 MCM (82 % remaining). For the Nile
basin the reduction is stronger from 5,077 MCM to 3,442 MCM (68 % remaining).
Similar schedules can be prepared for non average resources conditions; the 5%, 35%, 50%,
65% and 95% resources reliability conditions. Especially for the dryer resources conditions,
the impact from Rwandan use on the outflow will be stronger.
As already hinted while discussing the 'Balance', the annual flow schedules could be further
split to represent the monthly situation. The monthly flow schedules could then be compared
with the actual situation provided that the level of monitoring of resources and their use is
sufficient. Such practice is extremely helpful for adequate water management which will
soon be required for especially the lower Nyabarongo, Akanyaru, upper and lower Akagera,
and Muvumba rivers.
A sample of the monthly flow schedule for the high demand situation during the month of
August for the 2040 situation is presented in Figure 13. All catchment balances are negative
which implies that the catchment resources content (natural and artificial surface water
storage and groundwater storage) are being depleted. The catchment balances are estimated
from marshland (lowering of groundwater table) and surface water reservoir depletion only.
Further depletion from general groundwater reserves has not been accounted for.

Rwanda National Water Resources Master Plan Page 88
MINIRENA-RNRA OCTOBER 2015
Figure 9: Annual flow schedule for nine catchments - medium demand situation 2012

Rwanda National Water Resources Master Plan Page 89
MINIRENA-RNRA OCTOBER 2015
Figure 10: Annual flow schedule for nine catchments - high demand situation 2020

Rwanda National Water Resources Master Plan Page 90
MINIRENA-RNRA OCTOBER 2015
Figure 11: Annual flow schedule for nine catchments - high demand situation 2030

Rwanda National Water Resources Master Plan Page 91
MINIRENA-RNRA OCTOBER 2015
Figure 12: Annual flow schedule for nine catchments - high demand situation 2040

Rwanda National Water Resources Master Plan Page 92
MINIRENA-RNRA OCTOBER 2015
Figure 13: Monthly flow schedule for nine catchments - high demand situation August 2040
Rwanda National Water Resources Master Plan Page 93
MINIRENA-RNRA OCTOBER 2015
1.8 WATER RESOURCES DEVELOPMENT PROGRAM
The detailed Master Plan investment program for the medium growth scenario for each
catchment is presented in the corresponding Catchment Master Plan in the nine appendixes.
This investment program is presented as a table with the investment costs for the different
demand categories over three investment periods running from 2014 - 2020, 2021 - 2030 and
2031 - 2040.
The table for each catchment contains estimates for investment costs mostly as they may
incur to the government of Rwanda and based on the medium demand scenario. Thus costs
for drinking water supply and sanitation, industries, and monitoring are presented. Costs for
irrigation development have also been included although it is very questionable whether such
costs should be borne by government. In general all water resources development costs for
commercial ventures (hence including irrigation) should be borne by the private sector with
government or its representative as regulator and controller. The costs for such private
investments are not included in the investment tables.
The assumptions and calculations for the investment cost estimates for the different demand
categories are presented in annex C2_6. The procedure for the estimation of investment costs
per catchment is explained as follows:
all investment need is based on a volume of water to be produced per annum; this is
expressed in TCM/yr (Thousand Cubic Meter per year). The volume is derived from
the difference between the projected demand at the start and at the end of the planning
period. Where needed, the total volume is partitioned according to the different
demand locations in order to obtain a daily production capacity which is needed for
the assessment of the unit costs. For instance the production volume of urban water
supply for the CKIV catchment is partitioned between Rubavu, Karongi, Rusizi and 9
emerging centers.
the unit cost is the investment cost per cubic meter produced during the lifetime of the
investment (mostly averaged to 20 years, sometimes 10 or 15 years for the entire
investment comprising civil works and electromechanical equipment as may be the
case) expressed in RWF per cubic meter. The level of the investment cost per cubic
meter depends on the production capacity required. For instance, the cost of supply
for an installation with a capacity of 10,000 m³/day is estimated at 177 rwf/m³ against
219 rwf/m² for an installation with a capacity of 2,000 m³/day. The rwanda franc is
assumed constant for its average 2013 value over the entire investment period.
the investment finally expressed in MRWF (million Rwandan Franc) is the result of
the unit cost multiplied with the cubic meter volume produced during the lifetime of
the investment. For instance the expansion of water supply for Karongi for 661
TCM/yr at a unit investment cost of 219 rwf/m³ requires 2,895 Mrwf (count 661,000
m³/yr * 219 rwf/m³ * 20 year / 1,000,000).
Details of the investment costs per catchment for the medium growth scenario are presented
in catchment Master Plan documents. Summary tables for the low, medium and high growth
scenarios are presented here below.
The estimated investment cost for water resources development works for the medium
growth scenario are about 2.5 thousand billion RWF (~2.8 billion Euro) for the period up to
2020, with 2.7 and 5 thousand billion RWF for the following decades of 2021-2030 and
2031-2040.

Rwanda National Water Resources Master Plan Page 94
MINIRENA-RNRA OCTOBER 2015
The difference in investment between the different growth scenarios is not that important (a
maximum 18% difference between medium and low growth scenario for 2040, the difference
between medium and high growth is then just 13%). This can be explained by the fact that i)
differentiation of population growth between the growth scenarios is less than the population
increase over the entire planning period of more than 25 years and ii) irrigation and other
investments are development opportunities that may be developed irrespective of population
growth.
It further strikes that the difference between the first two planning periods is modest whereas
the investment over the third planning period is much higher. This can be explained by the
circumstance that the last planning period comprises reinvestment costs for the development
actions of the first planning period after 20 years.
Table 45: Summary of government related investment costs - low growth scenario (in MRWF)
investment period
demand category
2014-2020 2021-2030 2031-2040
Total urban WS and sanitation 269.304 461.298 1.068.462
Total rural WS and sanitation 874.680 552.365 1.253.283
Total WS for irrigation 946.650 1.139.693 1.489.843
Other investments 262.248 113.230 268.789
Grand total 2.299.157 2.382.246 4.069.116
Table 46: Summary of government related investment costs - medium growth scenario (in MRWF)
investment period
demand category
2014-2020 2021-2030 2031-2040
Total urban WS and sanitation 305.590 544.002 1.329.237
Total rural WS and sanitation 962.782 722.382 1.563.626
Total WS for irrigation 977.871 1.321.180 1.640.081
Other investments 230.803 133.388 433.318
Grand total 2.477.046 2.720.953 4.966.263
Table 47: Summary of government related investment costs - high growth scenario (in MRWF)
investment period
demand category
2014-2020 2021-2030 2031-2040
Total urban WS and sanitation 303.757 591.644 1.511.084
Total rural WS and sanitation 1.041.108 821.427 1.863.306
Total WS for irrigation 977.871 1.321.180 1.640.081
Other investments 257.192 213.777 578.270
Grand total 2.579.928 2.948.028 5.592.741
A more detailed overview of investment costs per catchment per demand category and per
planning period for the medium growth scenario is presented on the next table.

Rwanda National Water Resources Master Plan Page 95
MINIRENA-RNRA OCTOBER 2015
The vertical axis presents the investment cost in units of million RWF where 100,000 thus
represents 100 billion RWF.
The horizontal axis contains five lines: the first line indicates the catchment (CKIV, CRUS,
etc.) with the 1, 2, and 3 postfix representing the investment period of 2014-2020, 2021-2030
and 2031-2040 respectively.
The remaining lines of the vertical axis indicate the demand category and the number value
of the estimated investment (in MRWF) for the water demand category, for the specified
catchment and investment period. 'WS&S-urban' and 'WS&S-rural' lines stand for
investments in the water supply and sanitation sector in urban and rural areas. 'Irrigation' line
stands for the investment in the irrigation sector (rainwater harvesting, marshland, surface
irrigation, dam and groundwater). The 'other' line stands for other investment groups in as far
as government would be called upon to realize these investments; it mostly relates to water
and sanitation for industrial parks, monitoring, and miscellaneous activities like research
activities, special investigations, protection works, etc.
When considering that most investments for the 2014-2020 investment period come to the
term of their investment lifetime during the last decade of 2030-2040 and require
reinvestment, the following conclusions can be drawn:
investment for rural water supply is a large or even the largest investment component
for all catchments. When accounting for the reinvestment during the last planning
period there is however a gradual decline in 'new' investment. This is related to still
outstanding water related MDG investments for the current planning period (the
difference between demand and use). It should also be considered that most of the
population increase will be absorbed by urban or emerging urban areas with a likely
more or less stationary population count in the rural areas.
investment for urban water supply and sanitation is relatively timid during the current
planning period (except for NNYL which provides most of the water supply for
Kigali town), but it increases vigorously in all catchments for reasons of population
increase and migration from rural areas, as well as for the reinvestment of the current
investments by 2030.
Especially in the central and eastern catchments, the irrigation sector is a significant
investment target. With the exception of the Muvumba catchment, the level of
investment tends to remain fairly constant over the three planning periods. When
considering the reinvestment of the current planning period investments by 2030, this
implies that most development in this sector is programmed to be completed in the
next 15 to 20 years or so. It remains very questionable whether the Rwandan
government should spearhead this level of investment across all irrigation types.
other investments are quite modest for most catchments with the exception of the
lower Nyabarongo. This is probably related to the number of industrial parks in this
catchment and the presence of the city of Kigali. It is emphasized that the investment
for miscellaneous activities, though not very cost intensive, is important for the
attainment of adequate water management in the different catchments and the
protection of land and water resources.
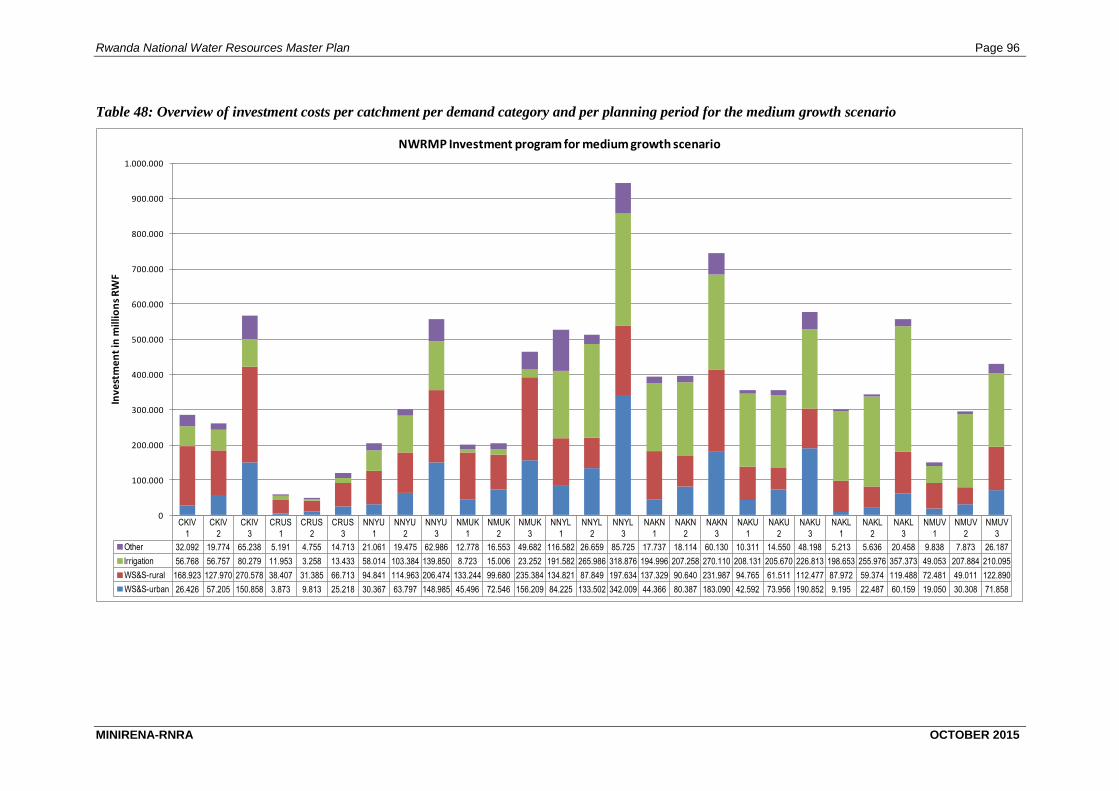
Rwanda National Water Resources Master Plan Page 96
MINIRENA-RNRA OCTOBER 2015
Table 48: Overview of investment costs per catchment per demand category and per planning period for the medium growth scenario
CKIV
1
CKIV
2
CKIV
3
CRUS
1
CRUS
2
CRUS
3
NNYU
1
NNYU
2
NNYU
3
NMUK
1
NMUK
2
NMUK
3
NNYL
1
NNYL
2
NNYL
3
NAKN
1
NAKN
2
NAKN
3
NAKU
1
NAKU
2
NAKU
3
NAKL
1
NAKL
2
NAKL
3
NMUV
1
NMUV
2
NMUV
3
Other 32.092 19.774 65.238 5.191 4.755 14.713 21.061 19.475 62.986 12.778 16.553 49.682 116.582 26.659 85.725 17.737 18.114 60.130 10.311 14.550 48.198 5.213 5.636 20.458 9.838 7.873 26.187
Irrigation 56.768 56.757 80.279 11.953 3.258 13.433 58.014 103.384 139.850 8.723 15.006 23.252 191.582 265.986 318.876 194.996 207.258 270.110 208.131 205.670 226.813 198.653 255.976 357.373 49.053 207.884 210.095
WS&S-rural 168.923 127.970 270.578 38.407 31.385 66.713 94.841 114.963 206.474 133.244 99.680 235.384 134.821 87.849 197.634 137.329 90.640 231.987 94.765 61.511 112.477 87.972 59.374 119.488 72.481 49.011 122.890
WS&S-urban 26.426 57.205 150.858 3.873 9.813 25.218 30.367 63.797 148.985 45.496 72.546 156.209 84.225 133.502 342.009 44.366 80.387 183.090 42.592 73.956 190.852 9.195 22.487 60.159 19.050 30.308 71.858
0
100.000
200.000
300.000
400.000
500.000
600.000
700.000
800.000
900.000
1.000.000
Inve
stm
en
t in
mill
ion
s R
WF
NWRMP Investment program for medium growth scenario

Rwanda National Water Resources Master Plan Page 97
MINIRENA-RNRA OCTOBER 2015
The last paragraph in this chapter in the National Water Resources Master Plan is dedicated
to the discussion of issues, conclusions and recommendations.
1.9 ISSUES, CONCLUSIONS AND RECOMMENDATIONS
The nine Catchment Master Plans each present a chapter (chapter 4) with the main observations and
conclusions a well as a series of necessary development actions and recommendations. These
observations along with the recommended actions are succinctly presented below for each catchment.
The last sections presents an action plan at national level
1.9.1 OBSERVATIONS AND RECOMMENDED ACTIONS FOR THE CKIV CATCHMENT
The main observations and conclusions on the CKIV catchment are:
predominance of good, deeply weathered soils with high infiltration rates in narrow
valleys with steep gradients. There is significant erosion which is related to land use.
high rainfall with a relatively short dry season.
overall significant surface flow generated from numerous small catchments each with
small base flow (~ less than 1 m³/s except for Sebeya River).
significant groundwater reserves yet difficult to access.
population to increase from 1.4 million to 3.2 million, urban population scheduled to
grow tenfold from one hundred thousand to a million.
very difficult accessibility; opportunity in Lake Kivu navigation.
the current level of water use is very low (registered use less than 1% of renewable
resources; current demand estimated at 4%).
the adjusted water balance for the Lake Kivu catchment up to 2040 indicates that all
essential demand and presumably viable commercial ventures can be developed without
restrictions or compromising environmental flow requirements.
even with the very low use level, there are already (minor) conflict over water use in the
catchment.
Necessary developments and recommendations are:
Water supply services in the rural domain is still insufficient for reasons of planning,
investment, exploitation and repair, resources decline or inadequate service solutions.
The development of a catchment based water supply plan is highly recommended (and so
far initiated by EWSA for Eastern Area, Akanyaru and upper Nyabarongo).
Water supply services in the urban domain seems mostly satisfactory yet there is
insufficient planning (EWSA service is responsive but not yet proactive). The water
supply planning for urban areas should be integrated in the catchment based plan
specified above.
Urban sanitation is a growth sector aiming at 50% of urban water supply being centrally
collected and treated by 2040. Currently there is no central treatment.

Rwanda National Water Resources Master Plan Page 98
MINIRENA-RNRA OCTOBER 2015
Water requirements for industry, mining, coffee washing stations, livestock and non
hydro-power power plants should be integrated in the catchment based plan specified
above (under rural demand). Any opportunity in these domains should be pursued
making sure they are operated in a socially and environmentally sustainable manner.
water supply for livestock can be viably generated from rainwater harvesting and is in
that format ideally suited to complement the 'one cow - one family' concept. It is
recommended that Minagri / RARDA investigates this option and promotes it.
rain fed agriculture shall remain the mainstay of the catchment's agricultural production.
The protection of the catchment's land resources is a huge priority. Appropriate land-use
(when needed by readjustment of land use), erosion protection by radical and bunch
terraces and other protective measures must remain the focus for the future of the
catchment
water supply from irrigation ponds is endorsed; additional training of farmers in the use
of the ponds may improve productivity from these facilities.
being relatively cheap and effective, water supply in marchlands is endorsed for the full
identified area of just over 4,000 ha in the catchment.
irrigation from Lake Kivu. The command area in the Irrigation master plan has been
reduced for command at an elevation higher than 25 m above the lake. A further issue is
the doubtful water quality of the Lake Kivu water for purposes of irrigation (alkaline and
slightly saline). There is nevertheless a reservation of 4,000 ha to be irrigated from Kivu
Lake.
irrigation from dams. With the narrow and steeply inclined valleys, it is difficult to find
good dam sites. Four dam sites have been judged sufficiently interesting for further study
and their water demand is considered in the master plan.
Small hydropower is of interest for the catchment but the scope for larger plants (>= 1
MW) is limited because of the less significant flow generated from the small catchments.
the stunning scenic beauty of the catchment is an asset for eco tourism.
In order to manage the catchment adequately from its current condition with hardly any use
to the 2040 situation whence about 25 % of the renewable resources may be mobilized for
primary use and a number of commercial ventures, a number of miscellaneous measures is
proposed that are valid for all catchments:
monitoring of rainfall resource and general climate data
monitoring of surface water resource quantity and quality
monitoring of groundwater resource quantity and quality.
monitoring of users' interventions in the natural hydrological cycle.
the development and use of a dedicated water management information system (Water
MIS, see chapter 2 in this report).
the formulation and introduction of a permit system for water use interventions. Details
are provided in chapter 2.4.2 (the water permit procedure as part of the Water MIS) and
in appendix 10.
the installation of a decentralized catchment water management office reliant on the
RNRA-IWRM. Details are provided in chapter 0

Rwanda National Water Resources Master Plan Page 99
MINIRENA-RNRA OCTOBER 2015
These points will be further discussed in paragraph 1.9.10. A necessary measure that is
specific to the Lake Kivu catchment is as follows:
The cause of the excessive erosion from the Sebeya river catchment needs to be
investigated and adequate corrective measures implemented shortly.
1.9.2 OBSERVATIONS AND RECOMMENDED ACTIONS FOR THE CRUS CATCHMENT
The main observations and conclusions on the CRUS catchment are:
predominance of good, deeply weathered soils with high infiltration rates in narrow
valleys with steep gradients. There is significant erosion which is related to land use;
artisanal mining and agriculture are the main culprits.
high rainfall with a relatively short dry season.
overall significant surface flow generated from two main tributaries Rubyiro (comprising
Gishoma basin) and Ruhwa rivers.
significant groundwater reserves that are however difficult to access.
population to double over the lifetime of the masterplan from 350,000 to 700,000; the
urban population is scheduled to grow almost tenfold from 20,000 to 175,000.
the catchment is isolated by its remoteness from the center of Kigali. Accessibility of the
catchment is very difficult especially as regards the eastern area on the fringes of the
Nyungwe forest. Positive points are the navigation on Lake Kivu (Rusizi) and the
accessibility of Bujumbura and Lake Tanganyika.
the current level of water use is very low (registered use is not even 0,5% of renewable
resources and the current demand estimated at less than 2%).
the examination for the adjusted water balance of the Rusizi catchment up to 2040
indicates that most of the demand is located in the Rubyiro catchment which generates
about a third of the available resources. While the catchment wide water balance does
not reveal any stress, there are already significant limitations in the Rubyiro catchment
especially as regards irrigation development. Catchment wide all essential demand
(primary use) and presumably viable commercial ventures can be developed with the
exception of dry season irrigation in the Bugarama valley.
even with the very low use level, there are already (minor) conflicts over water use in the
catchment.
Necessary developments and recommendations are:
Water supply services in the rural domain is still insufficient for reasons of planning,
investment, exploitation and repair, resources decline or inadequate service solutions.
The development of a catchment based water supply plan is highly recommended
(similar to CKIV catchment).
Water supply services in the urban domain seems mostly satisfactory and there are only
two minor urban centers (Rusizi which is located on the boundary with CKIV catchment
and Bugarama) so overall demand is limited even when growth may be significant over
time. The water supply planning for urban areas should be integrated in the catchment
based plan specified above.

Rwanda National Water Resources Master Plan Page 100
MINIRENA-RNRA OCTOBER 2015
Urban sanitation is a growth sector aiming at 50% of urban water supply being centrally
collected and treated by 2040. Currently there is no central treatment.
Water requirements for industry, mining, coffee washing stations, livestock and non
hydro-power power plants should be integrated in the catchment based plan specified
above (under rural demand). The exploitation of peat in the Gishoma valley does not
require any water (on the contrary) yet this exploitation reduces agricultural use and
excludes the development of an interesting site for surface water storage for the
Bugarama rice production. This exploitation is granted under a long term concession
issued after an EIA investigation. This operation should also be integrated in the
catchment based water management plan.
water supply for livestock can be viably generated from rainwater harvesting and is in
that format ideally suited to complement the 'one cow - one family' concept. It is
recommended that Minagri / RARDA investigates this option and promotes it.
rain fed agriculture shall remain the mainstay of the catchment's agricultural production.
The protection of the catchment's land resources is a huge priority. Appropriate land-use
(when needed by readjustment of land use), erosion protection by radical and bunch
terraces and other protective measures must remain the focus for the future of the
catchment.
water supply from irrigation ponds is endorsed; additional training of farmers in the use
of the ponds may boost their feasibility.
being relatively cheap and effective, water supply in marchlands is endorsed yet dry
season surface water resources from Rubyiro are insufficient to sustain much
development. Provided that the Bugarama rice irrigation scheme can be irrigated with
Rusizi water (see next point), the Rubyiro river can be used for non rice production
upstream in the valley for about 450 ha.
It is recommended to investigate the practicability of using Rusizi water for rice
production for about 550 ha in the lower Bugarama valley (or any larger area that can be
reached by gravity intake from the Rusizi). The Rusizi river water quality may prove
unsuitable due to high alkalinity level (soil and or plant nutrition issues) which would
block this option.
there are no viable dam sites identified in the catchment area. A viable site in the upper
reach of the Rubyiro river would be very valuable for flow regulation and sustaining dry
season flow for irrigation in the Bugarama valley.
In addition to the larger projects on the Rusizi river (international cooperation), there are
some interesting sites for micro hydropower in the range of 50 to 500 kW installed
capacity. Their development should be taken up by the private investors.
In order to manage the catchment adequately from its current condition with hardly any use
to the 2040 situation whence about 10 % of the renewable resources may be mobilized for
primary use and a number of commercial ventures (especially in the Rubyiro basin CRUS_1),
a number of miscellaneous measures is proposed. These points are common for all
catchments where watermanagement improvement is mandatory:
monitoring of rainfall resource and general climate data
monitoring of surface water resource quantity and quality
monitoring of groundwater resource quantity and quality.
Rwanda National Water Resources Master Plan Page 101
MINIRENA-RNRA OCTOBER 2015
monitoring of users' interventions in the natural hydrological cycle.
the development and use of a dedicated water management information system (Water
MIS, see chapter 2 in this report).
the formulation and introduction of a permit system for water use interventions. Details
are provided in chapter 2.4.2.
the installation of a decentralized catchment water management office reliant on the
RNRA-IWRM. Details are provided in chapter 0
1.9.3 OBSERVATIONS AND RECOMMENDED ACTIONS FOR THE NNYU CATCHMENT
The main observations and conclusions on the NMUK catchment are:
predominance of good, deeply weathered soils with relatively high infiltration rates.
There is significant erosion which is mainly due to agriculture and mining activities.
high rainfall with a relatively short dry season.
overall significant surface flow generated from a number of larger tributaries and the
upper Nyabarongo river.
very significant groundwater reserves that are however mostly difficult to access.
population to increase from 1.5 million to 3.3 million, urban population scheduled to
grow about sevenfold from one hundred and sixty thousand to almost 1.2 million.
difficult accessibility outside of the main roads (3 axes: Muhanga - Nyabihu; Muhanga -
Karongi and Huye - Nyamasheke).
the current level of water use is very low (registered use less than one percent of
renewable resources; current demand estimated at less than three percent).
the adjusted water balance for the Upper Nyabarongo catchment up to 2040 indicates
that all essential demand and presumably viable commercial ventures can be developed
without restrictions or compromising environmental flow requirements. The Upper
Nyabarongo, together with the Mukungwa catchment constitute the water tower for
Rwanda.
Necessary developments and recommendations are:
Water supply services in the rural domain is still insufficient for reasons of planning,
investment, exploitation and repair, resources decline or inadequate service solutions.
The development of a catchment based water supply plan is highly recommended and so
far initiated by EWSA for this catchment (ongoing).
Water supply services in the urban domain seems mostly satisfactory for the principal
urban centers of the catchment (Muhanga, Ruhango, Nyanza and Nyamagabe) but there
is a list of twenty emerging urban areas with generally insufficient supply which are not
registered with EWSA as emerging urban centers. The water supply planning for urban
areas should be integrated in the catchment based water supply plan specified above.
Urban sanitation is a growth sector aiming at 50% of urban water supply being centrally
collected and treated by 2040. Currently there is no central treatment.

Rwanda National Water Resources Master Plan Page 102
MINIRENA-RNRA OCTOBER 2015
Water requirements for industry, mining, coffee washing stations, livestock and non
hydro-power power plants should be integrated in the catchment based plan specified
above (under rural water supply).
water supply for livestock can be viably generated from rainwater harvesting. It is
recommended that Minagri / RARDA investigates this option and promotes it.
notwithstanding substantial investments in the irrigation sector, rain fed agriculture shall
remain the mainstay of the catchment's agricultural production. The protection of the
catchment's land resources and sustainable land use are huge priorities.
although irrigation ponds are likely to have more impact on farmer's household in dryer
areas (central and east), water supply from irrigation ponds is endorsed. Further research
and additional training of farmers in the use of the ponds may raise the profitability.
being relatively cheap and effective, water supply in marchlands is endorsed for the full
identified area of almost 23,000 ha in the catchment.
irrigation of hillsides from surface water has been curtailed as compared with the areas
proposed in the RIMP (Rwanda Irrigation Master Plan) mainly with respect to excessive
lift required. Where land and water resources are available and the required skills have
been acquired by farmers and cooperatives, an area of about 2,200 ha may be profitably
exploited.
irrigation from dams. A number of 7 out of 26 dam sites have been found to be most
interesting from a hydrological perspective. Further to the irrigation of command area,
these reservoirs have a positive effect on sustaining dry season flow especially when
irrigation infrastructure and operation rules are not directed at the highest possible water
efficiency. After further study, each site should be optimized for the highest possible
storage capacity that can be efficiently exploited for irrigation and other purposes
(hydropower, fish production, ...).
There is scope for the development of irrigation command area from groundwater. It is
suggested that groundwater is first and foremost allocated to drinking water supply.
Irrigation of alluvial plains from alluvial aquifers may proof effective and sustainable
and can be developed for motorized and human powered pumping equipment. It is
estimated that about 2,500 ha may be developed in this catchment.
There is substantial scope for the development of small hydropower in the catchment. A
number of sites have been developed recently (Rukarara river) and further (smaller) sites
are available.
In order to manage the catchment adequately from its current condition with hardly any use
to the 2040 situation whence about 21 % of the renewable resources may be mobilized for
primary use and commercial ventures, a number of miscellaneous measures is proposed.
These points are identical for all catchments:
monitoring of rainfall resource and general climate data
monitoring of surface water resource quantity and quality
monitoring of groundwater resource quantity and quality.
monitoring of users' interventions in the natural hydrological cycle.
the development and use of a dedicated water management information system (Water
MIS, see chapter 2 in this report).

Rwanda National Water Resources Master Plan Page 103
MINIRENA-RNRA OCTOBER 2015
the formulation and introduction of a permit system for water use interventions. Details
are provided in chapter 2.4.2.
the installation of a decentralized catchment water management office reliant on the
RNRA-IWRM. Details are provided in chapter 0
1.9.4 OBSERVATIONS AND RECOMMENDED ACTIONS FOR THE NMUK CATCHMENT
The main observations and conclusions on the NMUK catchment are:
predominance of good, deeply weathered soils with high infiltration rates. The western
part of the catchment presents partly steeply inclined highland on volcanic soils while the
eastern part shows the common configuration of narrow valleys with steep gradients in a
dendritic pattern. Especially in the eastern part of the catchment erosion is significant
which is due to agriculture and mining activities.
high rainfall with a relatively short dry season.
overall significant surface flow generated from the eastern valleys starting with the
Rugezi marshland. The western volcanic highlands present few permanent surface water
channels.
significant groundwater reserves yet difficult to access when not released from natural
springs
population to increase from 1.3 million to 2.8 million, urban population scheduled to
grow about fivefold from two hundred and fifty thousand to 1.2 million.
difficult accessibility outside of the main roads (axe - Kigali - Musanze - Rubavu)
the current level of water use is very low (registered use less than half a percent of
renewable resources; current demand estimated at about 3 percent).
the adjusted water balance for the Mukungwa catchment up to 2040 indicates that all
essential demand and presumably viable commercial ventures can be developed without
restrictions or compromising environmental flow requirements. The Mukungwa, together
with the Upper Nyabarongo catchment constitute the water tower for Rwanda.
Necessary developments and recommendations are:
Water supply services in the rural domain is still insufficient for reasons of planning,
investment, exploitation and repair, resources decline or inadequate service solutions.
The development of a catchment based water supply plan is highly recommended.
Water supply services in the urban domain seems rather satisfactory for Musanze town
but there is a list of emerging urban areas with lacking supply that are not registered with
EWSA as emerging urban centers. The water supply planning for urban areas should be
integrated in the catchment based water supply plan specified above.
Urban sanitation is a growth sector aiming at 50% of urban water supply being centrally
collected and treated by 2040. Currently there is no central treatment.
Water requirements for industry, mining, coffee washing stations, livestock and non
hydro-power power plants should be integrated in the catchment based plan specified
Rwanda National Water Resources Master Plan Page 104
MINIRENA-RNRA OCTOBER 2015
above (under rural demand). Any opportunity in these domains should be pursued
making sure they are operated in a socially and environmentally sustainable manner.
water supply for livestock can be viably generated from rainwater harvesting. It is
recommended that Minagri / RARDA investigates this option and promotes it.
rain fed agriculture shall remain the mainstay of the catchment's agricultural production.
Appropriate land use and the protection of the catchment's land resources are essential.
although irrigation ponds are likely to have more impact on farmer's household in dryer
areas (central and east), water supply from irrigation ponds is endorsed. Further research
and additional training of farmers in the use of the ponds may raise their profitability.
being relatively cheap and effective, water supply in marchlands is endorsed for the full
identified area of almost 5,000 ha in the catchment.
irrigation from dams. With the extreme infiltration rates in the west and the narrow and
steeply inclined valleys, it is difficult to find good dam sites and rainfall is abundant
throughout the catchment. A single dam site has been identified which has been
tentatively considered for implementation by 2040.
Small hydropower is of interest for the catchment and a number of larger capacity plants
is operational on the Mukungwa and upstream main waters for a combined capacity of
28 MW). The Giciye river has potential for development of further hydropower
production sites along with smaller rivers.
the scenic beauty of the catchment, the volcano park and its wildlife are invaluable assets
for (eco-) tourism.
In order to manage the catchment adequately from its current condition with hardly any use
to the 2040 situation whence about 17% of the renewable resources may be mobilized for
primary use and commercial ventures, a number of miscellaneous measures is proposed.
These points are essentially identical for all catchments; brief discussion is presented in
paragraph 1.9.10:
monitoring of rainfall resource and general climate data
monitoring of surface water resource quantity and quality
monitoring of groundwater resource quantity and quality.
monitoring of users' interventions in the natural hydrological cycle.
the development and use of a dedicated water management information system (Water
MIS, see chapter 2 in this report).
the formulation and introduction of a permit system for water use interventions. Details
are provided in chapter 2.4.2
the installation of a decentralized catchment water management office reliant on the
RNRA-IWRM. Details are provided in chapter 0
Rwanda National Water Resources Master Plan Page 105
MINIRENA-RNRA OCTOBER 2015
1.9.5 OBSERVATIONS AND RECOMMENDED ACTIONS FOR THE NNYL CATCHMENT
The main observations and conclusions on the NNYL catchment are:
predominance of good, deeply weathered soils with rather high infiltration rates in
narrow valleys with steep gradients. There is significant erosion which is related to land
use in particular agriculture and mining. Main pollution sources are the city of Kigali and
mining activities. The Nyabarongo River is a wide wetland with a very flat gradient.
medium to high rainfall with a relatively short dry season in the west and low to medium
rainfall with more pronounced dry seasons in the east (Nyabugogo tributary).
major inflow from the upper Nyabarongo and Mukungwa catchments.
significant surface flow generated from the Base, Mambu and Nyubugogo rivers with a
number of smaller tributaries that join the Nyabarongo or Nyabugogo rivers.
significant groundwater reserves that are relatively easy to abstract from the alluvial
aquifer of the Nyabarongo floodplain and from mainland aquifers in the north and east of
the catchment.
population to increase from 2.3 million to 4.7 million, urban population including the
city of Kigali scheduled to grow from nine hundred thousand to over 3 million.
difficult accessibility outside of the main roads (axe - Kigali - Musanze - Ruhango -
Gicumbi - Rwamagana).
the current level of water use is very low (registered use slightly over two percent of
renewable resources; current demand estimated at about six percent).
the adjusted water balance for the lower Nyabarongo catchment up to 2040 indicates that
all essential demand and presumably viable commercial ventures can be developed with
occasional restrictions and reducing allocations for environmental requirements during
less abundant hydrological years. The resources surpluses of upper Nyabarongo and
Mukungwa catchment make this water management possible as these surplus flows
sustain minimum environmental flow conditions in the Nyabarongo valley.
Necessary developments and recommendations are:
Water supply services in the rural domain is still insufficient for reasons of planning,
investment, exploitation and repair, resources decline or inadequate service solutions.
The development of a catchment based water supply plan is highly recommended.
Water supply services in the urban domain seems rather satisfactory for most of Kigali
and the other urban centers of the catchment. The district survey allowed to make a list
of emerging urban areas with insufficient supply that need to upgrade to an 'urban' water
supply status. The water supply planning for urban areas should be integrated in the
catchment based water supply plan specified above.
Urban sanitation is a growth sector aiming at 50% of urban water supply being centrally
collected and treated by 2040. Currently there is a public waste water collection and
treatment facility in one of the suburbs of Kigali.
Water requirements for industry, mining, coffee washing stations, livestock and non
hydro-power power plants should be integrated in the catchment based plan specified
above (under rural demand).

Rwanda National Water Resources Master Plan Page 106
MINIRENA-RNRA OCTOBER 2015
water supply for livestock can be viably generated from rainwater harvesting. It is
recommended that Minagri / RARDA investigates this option and promotes it.
rain fed agriculture shall remain the mainstay of the catchment's agricultural production.
Sustainable land use and the protection of the catchment's land resources are vital.
with respect to the irrigation sector, all apparently viable developments are supported
provided that water resources can be made available. For each irrigation mode the
recommendations are specified below.
water supply from irrigation ponds is endorsed. Further research and additional training
of farmers in the use of the ponds may raise the profitability at the family level.
being relatively cheap and effective as an irrigation method and with the catchment's
own resources being sufficient, water supply for marchland irrigation is endorsed for the
full identified area of some 30,000 ha in the catchment.
irrigation of hillsides from surface water has been curtailed as compared with the areas
proposed in the RIMP (Rwanda Irrigation Master Plan) mainly with respect to excessive
lift required. Where land and water resources are available and the required skills have
been acquired by farmers and cooperatives, an area of about 5,000 ha may be profitable
exploited along the Nyabarongo river (3,000 ha) and around Lake Muhazi (2,000 ha).
The command area around Lake Muhazi can be extended (from 2,000 ha to 5,600 ha)
provided that the lake is used as a storage reservoir. This requires the outlet structure to
be redesigned and reconstructed. The current dam and outlet structure are dangerous
because of i) badly repaired piping leading to dam collapse, and ii) insufficient spillway
capacity leading to dam overtopping and catastrophic breach.
irrigation from dams. All irrigation demand supported by surface water storage facilities
(comprising Lake Muhazi) is endorsed. The regulation volume that may effectively be
generated in this catchment is about 36 MCM or 52 MCM when including Lake Muhazi.
The construction and exploitation of surface reservoirs helps to sustain a minimum dry
season flow even with substantial water use.
irrigation from groundwater. Groundwater is a prime resource in the sense that it
typically carries no sediment and its availability is more dependable than surface water.
It should therefore firstly be allocated to primary uses (drinking water supply) and only
when surpluses remain to irrigation. We suggest to develop about 4,000 ha of irrigation
command area with supply from groundwater.
Small hydropower is of interest for the catchment and a number of interesting sites is
under study on the Base River and other tributaries.
In order to manage the catchment adequately from its current condition with a few
percentages of the renewable resources being used to the 2040 situation whence about 54 %
of its resources may be mobilized for primary use and commercial ventures, a number of
miscellaneous measures is proposed. These points are identical for all catchments:
monitoring of rainfall resource and general climate data
monitoring of surface water resource quantity and quality
monitoring of groundwater resource quantity and quality.
monitoring of users' interventions in the natural hydrological cycle.

Rwanda National Water Resources Master Plan Page 107
MINIRENA-RNRA OCTOBER 2015
the development and use of a dedicated water management information system (Water
MIS, see chapter 2 in this report).
the formulation and introduction of a permit system for water use interventions. Details
are provided in chapter 2.4.2
the installation of a decentralized catchment water management office reliant on the
RNRA-IWRM. Details are provided in chapter 0
1.9.6 OBSERVATIONS AND RECOMMENDED ACTIONS FOR THE NAKN CATCHMENT
The main observations and conclusions on the NAKN catchment are:
predominance of good, deeply weathered soils with rather high infiltration rates in
narrow valleys with steep gradients. There is significant erosion which is related to land
use in particularly agriculture. The lower Akanyaru is a wide peat based wetland with a
very flat gradient.
medium to high rainfall with a relatively short dry season in the west and low to medium
rainfall with more pronounced dry seasons in the east (Bugesera).
significant surface flow generated from the catchment in Rwanda and a significant
supplement generated in Burundi.
significant groundwater reserves that, unless released from natural springs, are difficult
to access with limited discharge (manual pumped borehole).
population to double from 1.5 million to 3.1 million, urban population scheduled to grow
from three hundred thousand to 1.3 million.
very difficult accessibility outside of the main roads (axe - Muhanga - Huye and a
crossing of the Akanyaru at Bisore (secondary road from Ruhango to Bugesera just north
of Cyohoha South lake)
the current level of water use is low (registered use at four percent of renewable
resources; current demand estimated at slightly over six percent).
the adjusted water balance for the Akanyaru catchment up to 2040 has been reduced as
regards the irrigation from surface water (river and lake) because dry season resources
are insufficient for that development by 2040. The current irrigation development along
Cyohoha South Lake (50 ha) can be maintained but further development of this type of
irrigation should not be allowed. Other essential demand and presumably viable
commercial ventures can be developed with occasional restrictions and reducing
allocations for environmental requirements during less abundant hydrological years.
Necessary developments and recommendations are:
Water supply services in the rural domain is still insufficient for reasons of planning,
investment, exploitation and repair, resources decline or inadequate service solutions.
The development of a catchment based water supply plan is highly recommended and
has been initiated by EWSA for this catchment.
Water supply services in the urban domain seems rather satisfactory for most of the
urban centers of the catchment. The district survey allowed making a list of emerging
urban areas with insufficient supply that need to upgrade to an 'urban' water supply

Rwanda National Water Resources Master Plan Page 108
MINIRENA-RNRA OCTOBER 2015
status. The water supply planning for urban areas should be integrated in the catchment
based water supply plan specified above.
Urban sanitation is a growth sector aiming at 50% of urban water supply being centrally
collected and treated by 2040. Reportedly there is a public waste water collection and
treatment facility in one of the suburbs of Huye.
Water requirements for industry, mining, coffee washing stations, livestock and non
hydro-power power plants should be integrated in the catchment based plan specified
above (under rural demand).
water supply for livestock can be viably generated from rainwater harvesting. It is
recommended that Minagri / RARDA investigates this option and promotes it.
rain fed agriculture shall remain the mainstay of the catchment's agricultural production.
Sustainable land use and the protection of the catchment's land resources are essential.
with respect to the irrigation sector, the renewable resources of the catchment are
insufficient to support all possible commercially viable developments. For each irrigation
mode the recommendations are specified below.
water supply from irrigation ponds is endorsed. Further research and additional training
of farmers in the use of the ponds may raise the profitability at the family level.
the catchments renewable resources are insufficient for the full development of the
potential area of 59,000 ha of marshland for dry season irrigation and a reduced
development of about 45,000 ha is proposed. This requires to select the best areas for
development.
the catchments renewable resources are insufficient for the development of hillside
irrigation from surface water. The currently developed area of 50 ha north of Cyohoha
Lake can be maintained but extension of such command area is not supported for lack of
Rwandan renewable resources.
irrigation from dams. This development allows carrying over resources from the wet
season to the dry season and therefore not only supports irrigation but also dry season
environmental flow and it provides opportunity for reuse. A list of 14 dam sites with a
combined capacity of 47 MCM has been endorsed. All dam development should be
geared to the maximum inter seasonal storage capacity even when the specific command
area to be irrigated may require less.
irrigation from groundwater. Groundwater is a prime resource in the sense that it does
not carry sediment and its supply reliability is generally better than for surface water. It
should therefore firstly be allocated to primary uses (drinking water supply) and only
when surpluses remain to irrigation. We suggest developing about 600 ha of irrigation
command area with supply from groundwater.
Small hydropower is of interest for the catchment and a number of interesting sites is
under study.
In order to manage the catchment adequately from its current condition with a few
percentages of use to the 2040 situation whence about 44 % of the renewable resources may
be mobilized for primary use and commercial ventures, a number of miscellaneous measures
is proposed. A number of points is valid for all catchments but some are specific for the
Akanyaru river catchment. The common points are:
monitoring of rainfall resource and general climate data

Rwanda National Water Resources Master Plan Page 109
MINIRENA-RNRA OCTOBER 2015
monitoring of surface water resource quantity and quality
monitoring of groundwater resource quantity and quality.
monitoring of users' interventions in the natural hydrological cycle.
the development and use of a dedicated water management information system (Water
MIS, see chapter 2 in this report).
the formulation and introduction of a permit system for water use interventions. Details
are provided in chapter 2.4.2
the installation of a decentralized catchment water management office reliant on the
RNRA-IWRM. Details are provided in chapter 0
Proposed measures that are specific to Akanyaru catchment are:
The district survey in Gisagara district has exposed drought in some upstream valley
bottoms. It is strongly recommended that this is further investigated for confirmation,
possible cause and remedial measures that may reverse the tendency. In this respect it is
mentioned that the water balance indicates a dry season stress situation as early as 2020,
the Cyohoha North Lake has all but vanished in early 2000, the Akanyaru marshland is a
peat marsh which is susceptible for irreversible settling when the water level recedes too
low. In conclusion, we have indications of rising drought conditions and aggravating
circumstances which call for a serious investigation.
Further to the previous point, it is essential that the Cyohoha South Lake outlet, be fully
and effectively protected against exploitation and the water and swamp land level be
monitored against a fixed benchmark. Any settling of the marshland at the lake outlet
may have very grave consequences for the Cyohoha South Lake.
With the Akanyaru catchment being dependant on the creation of surface water storage
for sustaining its dry season flow, the erosion protection measures should be reinforced,
especially in catchments whose surface runoff is stored in the future reservoirs.
There is need for local cooperation with Burundi for the management of shared water
resources particularly the Cyohoha South Lake and the Akanyaru marshland in order to
reconcile objectives and water management measures for the sustainable use and
protection of these resources. A study on this subject by SHER Ingénieurs Conseils s.a.
commissioned by NELSAP in 2011 is available.
1.9.7 OBSERVATIONS AND RECOMMENDED ACTIONS FOR THE NAKU CATCHMENT
The main observations and conclusions on the NAKU catchment are:
a mixture of rich and poorer soils with predominantly high infiltration rates in small
valleys with generally gentle gradients. The land remains vulnerable to erosion which is
related to land use in particular agriculture. The Akagera valley is a very wide wetland
with an extremely flat gradient and a water level dictated by the ridge of the Rusumo
Falls.
low to medium rainfall with a longer dry season that may extend up to over four months
without any significant rainstorm (> 4 - 6 mm).
major inflow from the lower Nyabarongo and the Akanyaru rivers.

Rwanda National Water Resources Master Plan Page 110
MINIRENA-RNRA OCTOBER 2015
significant surface flow generated from the catchment in Rwanda and a significant
supplement generated in Burundi; the inflow from the Ruvubu river just above the
Rusumo falls effectively doubles the total international catchment area and the flow.
significant groundwater reserves that are relatively easy to abstract from the alluvial
aquifer of the Akagera floodplain and from mainland aquifers in the East of the
catchment.
population to double from 1.2 million to 2.4 million up to 2040; the urban population is
scheduled to grow fivefold from three hundred thousand to 1.5 million. The fraction
urban population increases from about 25 to 60%.
difficult accessibility outside of the main roads (axes: Kigali - Nyamata- border with
Burundi and Kigali - Rwamagana - Kibungo - Rusumo Falls).
the current level of water use is still modest (registered use at five percent of renewable
resources; current demand estimated at eight percent).
the adjusted water balance for the upper Akagera catchment up to 2040 has been reduced
as regards the irrigation from surface water for command area with a lift above 50 m. All
other identified essential demand and presumably viable commercial ventures have been
maintained which will require a transfer from upper Nyabarongo and Mukungwa
catchments for dryer years of the 2031-2040 planning period.
Necessary developments and recommendations are:
Water supply services in the rural domain is still insufficient for a variety of reasons
including planning, investment, exploitation and repair, resources decline or inadequate
service solutions. The development of a catchment based water supply plan is highly
recommended.
Water supply services in the urban domain seems reasonably satisfactory for most of the
urban centers of the catchment. The district survey allowed to make a list of emerging
urban areas with insufficient supply that need to upgrade to an 'urban' water supply
status. The water supply planning for urban areas should be integrated in the catchment
based water supply plan specified above.
Urban sanitation is a growth sector aiming at 50% of urban water supply being centrally
collected and treated by 2040. Reportedly there is a public waste water collection and
treatment facility in one of the suburbs of Kigali.
Water requirements for industry, mining, coffee washing stations, livestock and non
hydro-power power plants should be integrated in the catchment based water supply plan
specified above (under rural demand)..
water supply for livestock can be viably generated from rainwater harvesting and is in
that format ideally suited to complement the 'one cow - one family' concept. It is
recommended that Minagri / RARDA investigates and promotes this water use option.
notwithstanding major investments in the irrigation sector, rain fed agriculture shall
remain the mainstay of the catchment's agricultural production. The protection of the
catchment's land resources and its adequate use is a huge priority.
with respect to the irrigation sector, the renewable resources of the catchment are
insufficient to support all identified commercially viable command area but the deficits

Rwanda National Water Resources Master Plan Page 111
MINIRENA-RNRA OCTOBER 2015
that will surface during dry in the last planning period (2031 - 2040) and onwards, can be
covered by transfer from the upper Nyabarongo and Mukungwa catchments. For each
irrigation mode the recommendations are specified below.
water supply from irrigation ponds is endorsed. Further research and additional training
of farmers in the use of the ponds may raise the profitability at the family level.
the catchments renewable resources are insufficient for the full development of the
potential area of 36,000 ha for dry season marshland irrigation and a reduced
development of about 25,000 ha is proposed. The dry season irrigation of such a reduced
command area nevertheless requires a transfer from upstream catchments. The reduction
of the command area calls for selective development of the most suitable areas.
the catchments renewable resources are insufficient for the development of hillside
irrigation from surface water. With a transfer from upstream catchment areas a total area
of 13,500 ha can be developed for hill side irrigation from surface waters (river or lake is
identical for this catchment) with a lift of less than 50 m.
irrigation from dams. This development allows to carry over resources from the wet
season to the dry season and therefore not only supports irrigation but also dry season
environmental flow. When discarding extremely efficient irrigation equipment there is
ample opportunity for water reuse. A list of 11 dam sites with a combined capacity of 26
MCM has been endorsed. All dam development should be geared to the maximum inter
seasonal storage capacity even when the command area to be irrigated may require less.
By 2040 there is need for a maximum dry season water transfer of 82 MCM (under least
favorable conditions) by natural river flow from the Mukungwa and upper Nyabarongo
catchments. For purposes of reference, this transfer is slightly less than half the average
annual renewable resources of the Muvumba catchment in Rwanda (82 against 193
MCM/yr).
In order to manage the catchment adequately from its current condition with a few
percentages of use to the 2040 situation whence about two third (65%) of the average
renewable resources may be mobilized for primary use and commercial ventures, a number of
miscellaneous measures is proposed. A number of points is valid for all catchments but some
are specific for the Akanyaru river catchment. The common points are:
monitoring of rainfall resource and general climate data
monitoring of surface water resource quantity and quality
monitoring of groundwater resource quantity and quality.
monitoring of users' interventions in the natural hydrological cycle.
the development and use of a dedicated water management information system (Water
MIS, see chapter 2 in this report).
the formulation and introduction of a permit system for water use interventions. Details
are provided in chapter 2.4.2
the installation of a decentralized catchment water management office reliant on the
RNRA-IWRM. Details are provided in chapter 0
Proposed measures that are specific to the upper Akagera catchment are:
The interplay between the Akagera River and its adjoining lakes is complex. The bi-
directional flow patterns depend on the sequence, relative magnitude and duration of

Rwanda National Water Resources Master Plan Page 112
MINIRENA-RNRA OCTOBER 2015
hydrological events in upsteam catchments and within the upper Akagera catchment
itself. The width and depth of the channels between Akagera river and lakes are a crucial
factor and any tampering with these channels may have far-reaching consequences for
especially the lakes. The rigorous protection and strict interdiction of any agricultural use
of the intersections between Akagera river and its lakes is crucial for maintaining the
hydrological functionality. This is mostly identical to the situation between Cyohoha
south lake and the Akanyaru river where very strict protection is however even more
critical because of the imminent stress conditions in that catchment, the unavailability of
a significant interbasin transfer and the absence of the Rusumo falls which secure a
minimum water level for the upper Akagera river.
With the upper Akagera catchment being dependant on the creation of surface water
storage for sustaining its dry season flow, the erosion protection measures should be
reinforced, especially in catchments that generate the inflow of the future reservoirs.
1.9.8 OBSERVATIONS AND RECOMMENDED ACTIONS FOR THE NAKL CATCHMENT
The main observations and conclusions on the NAKL catchment are:
a mixture of rich and poorer soils with predominantly high infiltration rates in three
relatively elongated valleys with generally gentle gradients (Akagera, Kamiramugezi and
Karangaza). The land remains vulnerable to erosion which is related to land use in
particular agriculture. The Akagera river has three distinct sections as follows: a narrow
valley descending from Rusumo falls, an extremely wide wetland with lakes with an
extremely flat gradient, and an overflow into a narrow valley with a more regular
gradient up to the confluence with the Mukungwa river.
low to medium rainfall with a longer dry season that may extend up to over four months
without any significant rainstorm (> 6 mm).
major inflow from the upper Akagera and Ruvubu rivers (catchment area in Tanzania
and Burundi). The latter river more or less doubles the upstream catchment area and
flow.
significant surface flow generated from the catchment in Rwanda and a significant
supplement generated in Tanzania. The two main tributaries in Rwanda (Kamiramugezi
and Karangaza) reduce to a trickle at the end of the dry season (ephemeral flow) when
demand is highest.
significant groundwater reserves that are relatively easy to abstract from the alluvial
aquifer of the Akagera floodplain and from mainland aquifers extending over much of
the central part of the catchment.
population to double from just over half a million to about 1,1 million up to 2040; the
urban population is currently insignificant (forty thousand) but may reach half a million.
The fraction urban population increases from about 7 % to almost half the catchment
population which will bring fundamental societal changes.
about a quarter of the catchment area is national park for wildlife conservation (Akagera
National Park) where water use is minimal (some rare ponds and boreholes for watering
wildlife that is restricted to roam within the park domain) .
difficult accessibility outside of the main roads (axe: Kagitumba - Kayonza - Rusumo) .

Rwanda National Water Resources Master Plan Page 113
MINIRENA-RNRA OCTOBER 2015
the current level of water use is still modest (registered use at one percent of renewable
resources; current demand estimated at two and a half percent).
the adjusted water balance for the upper Akagera catchment up to 2040 has been reduced
as regards the irrigation from surface water with lift above 50 m. All other identified
essential demand and presumably viable commercial ventures have been maintained
which will require a transfer from upper Nyabarongo and Mukungwa catchments starting
the 2031 - 2040 time horizon.
Necessary developments and recommendations are:
Water supply services in the rural domain is still insufficient for a variety of reasons
including planning, investment, exploitation and repair, resources decline, low
population density and inadequate service solutions. The development of a catchment
based water supply plan is highly recommended. The study for the improvement of the
Rural Water Supply in Rwanda by JICA (2008 - 2009) covered seven districts of the
Eastern Province and therefore most of the upper and lower Akagera catchments and part
of the Muvumba catchment. The report is very commendable and useful but as the title
states, it is limited to i) district boundaries which thwarts the finding of catchment based
least cost solutions and to ii) rural water supply which is only part of the water demand
and obscures the perception on the optimum allocation of limited available resources.
Water supply services in the urban domain seems reasonably satisfactory for most of the
urban centers of the catchment. The district survey allowed to make a list of emerging
urban areas with insufficient supply that need to upgrade to an 'urban' water supply
status. The water supply planning for urban areas should be integrated in the catchment
based water supply plan specified above.
Urban sanitation is a growth sector aiming at 50% of urban water supply being centrally
collected and treated by 2040. No public waste water collection facility is available in the
catchment.
Water requirements for industry, mining, coffee washing stations, livestock and non
hydro-power power plants should be integrated in the catchment based plan specified
above (under rural demand). Any opportunity in these domains should be pursued
making sure they are operated in a socially and environmentally sustainable manner.
water supply for livestock can be viably generated from rainwater harvesting and is in
that format ideally suited to complement the 'one cow - one family' concept. It is
recommended that Minagri / RARDA investigates this option and promotes it. The cost
for dedicated water supply systems for livestock watering in livestock intensification
zones (Mutara) in the catchment is integrated in the catchment investment plan.
notwithstanding major investments in the irrigation sector, rain fed agriculture and
livestock production remain the mainstay of the catchment's agricultural production. The
protection and optimum use of the catchment's land resources is a huge priority.
with respect to the irrigation sector, the renewable resources of the catchment are
insufficient to support all possible commercially viable developments but the deficits that
will surface from 2030 onwards, can be covered by transfer from the upper Nyabarongo
and Mukungwa catchments. For each irrigation mode the recommendations are specified
below.

Rwanda National Water Resources Master Plan Page 114
MINIRENA-RNRA OCTOBER 2015
water supply from rain dependant irrigation ponds is endorsed. Further research and
additional training of farmers in the use of the ponds may raise the profitability at the
family level.
the catchments renewable resources seem just sufficient for the full development of the
potential command area of 33,350 ha for dry season marshland irrigation leaving
insignificant surplus for dry season flow for other irrigation methods.
the catchments renewable resources are insufficient for the development of hillside
irrigation from surface water as identified in the RIMP (33,000 ha). With a transfer from
upstream catchments (upper Nyabarongo and Mukungwa notably) the command area
with a lift of less than 50 m or about 18,000 ha can be developed for hill side irrigation
from surface waters (river or lake is identical for this catchment)
irrigation from dams. This development allows to carry over resources from the wet
season to the dry season and therefore not only supports irrigation but also dry season
environmental flow. When discarding highly efficient irrigation equipment (drip,
localized irrigation), there is ample opportunity for water reuse. A list of 8 dam sites with
a combined capacity of 21 MCM has been endorsed. All dam development should be
geared to the maximum inter seasonal storage capacity (up to some 50 to 70% of the
mean annual runoff at dam site) even when the command area to be irrigated may require
less.
irrigation from groundwater. While specifying that groundwater resources should be
allocated with priority to primary use categories (drinking water supply), a tentative
command area of about 5,000 ha has been endorsed for the development of irrigation.
By 2040 there is need for a maximum transfer of 43 MCM (assuming the least favorable
conditions) by natural river flow from the Mukungwa and upper Nyabarongo
catchments.
In order to manage the catchment adequately from its current condition with a few
percentages of use to the 2040 situation whence almost half (43%) of the average renewable
resources may be mobilized for primary use and commercial ventures, a number of
miscellaneous measures is proposed. A number of points is valid for all catchments but some
are specific for the lower Akagera river catchment. The common points are
monitoring of rainfall resource and general climate data
monitoring of surface water resource quantity and quality
monitoring of groundwater resource quantity and quality.
monitoring of users' interventions in the natural hydrological cycle.
the development and use of a dedicated water management information system (Water
MIS, see chapter 2 in this report).
the formulation and introduction of a permit system for water use interventions. Details
are provided in chapter 2.4.2
the installation of a decentralized catchment water management office reliant on the
RNRA-IWRM. Details are provided in chapter 0

Rwanda National Water Resources Master Plan Page 115
MINIRENA-RNRA OCTOBER 2015
Proposed measures that are specific to the lower Akagera catchment are:
The area directly East of Muhazi Lake and to its north and south over most of the
Kamiramugezi catchment area, is suitable for large-scale motorized groundwater
abstraction. Such abstraction is still quite the exception. Each permitted intervention
should provide for regular or continuous monitoring of groundwater level either in the
borehole itself or in a monitoring borehole at some tens of meters from the production
borehole(s). The permitted user should relay this information to RNRA-IWRM which
should analyze this information for water management purposes.
The interplay between the Akagera River and its adjoining lakes is complex. The bi-
directional flow patterns depend on the sequence, magnitude and duration of
hydrological events in upstream catchments and within the lower Akagera catchment
itself. The width and depth of the channels between Akagera River and lakes are a
crucial factor and any tampering with these channels may have far-reaching
consequences for especially the lakes. The rigorous protection and strict interdiction of
any agricultural use of the intersections between Akagera river and its lakes is crucial for
maintaining the hydrological functionality. This is identical to the situation for the upper
Akagera and between Cyohoha south lake and the Akanyaru river. Except for the Lake
Nasho complex (three lakes) all channels are located within the domain of the Akagera
national Park.
With the lower Akagera catchment being dependant on the creation of surface water
storage for sustaining its dry season flow, erosion protection measures are essential for
long term use of storage capacity.
1.9.9 OBSERVATIONS AND RECOMMENDED ACTIONS FOR THE NMUV CATCHMENT
The main observations and conclusions on the NMUV catchment are:
there is a marked differentiation of land resources between the West and the East of the
catchment. The West features predominance of good, deeply weathered soils with rather
high infiltration rates in narrow valleys with steep gradients. There is significant erosion
which is related to land use in particularly agriculture. The East presents poorer soils on
undulating hills intersected by river valleys of the Muvumba river and its tributaries with
much richer soils. The Muvumba is a rather small river (5 to 10 m wide) in a larger
floodplain.
medium to high rainfall with a relatively short dry season in the West and significantly
lower rainfall with more pronounced dry seasons in the East (Mutara).
significant surface flow generated from the Mulindi catchment (NMUV_1) in Rwanda
which flows into Uganda for a roundtrip of about 50 km traversing significant extents of
marshland near Kabale to finally return as the Muvumba river. The upper reaches of the
NMUV_2 catchment (several tributaries in Gicumbi district) also generate significant
surface flow. The entire northern part of the catchment is transboundary with the Kizinga
and then the Muvumba River forming the border between Rwanda and Uganda.
meaningful groundwater reserves that are accessible in the West (where it seems less
needed) and from alluvial deposits in the main river valleys in the East.

Rwanda National Water Resources Master Plan Page 116
MINIRENA-RNRA OCTOBER 2015
population to double from 0.6 million to 1.3 million, urban population scheduled to grow
from less than one hundred thousand to half a million. The 2012 census data were found
to be more than 30% in excess of the population projection data derived from the 2002
census. Rural demand data have been corrected for this underestimation.
difficult (East) to very difficult (West) accessibility outside of the main roads (axes -
Kigali - Gicumbi - Gatuna and Kayonza - Gabiro - Nyagatare and Kagitumba plus some
secondary roads linking Gicumbi with Nyagatare and Gabiro.
the current level of water use is low (registered use at 5.5 percent of renewable resources
which is the highest level for the country; current demand estimated at slightly above 12
percent).
the adjusted water balance for the Muvumba catchment up to 2040 has been reduced as
regards the irrigation from surface water because dry season resources are insufficient for
that development by 2040. The current irrigation development in Musheli sector (400 ha)
can been maintained but any further extension of this type of irrigation in the eastern part
of the catchment (NMUV_2) should not be allowed. Other essential demand and
presumably viable commercial ventures can be developed with occasional restrictions
and minimizing allocations for environmental requirements during less abundant
hydrological years. It is further recommended that particularly water intensive industries
be relocated and or develop in other catchments.
Necessary developments and recommendations are:
Water supply services in the rural domain is still insufficient for a variety of reasons
including planning, investment, exploitation and repair, resources decline, low
population density or inadequate service solutions. The development of a catchment
based water supply plan is highly recommended. The already mentioned JICA study (see
preceding paragraph) covers the eastern part of the catchment.
Water supply services in the urban domain seems more or less satisfactory for most of
the urban centers of the catchment. The district survey allowed to make a list of
emerging urban areas with insufficient supply that need to upgrade to an 'urban' water
supply status. The water supply planning for urban areas should be integrated in the
catchment based water supply plan specified above.
Urban sanitation is a growth sector aiming at 50% of urban water supply being centrally
collected and treated by 2040.
Water requirements for industry, mining, coffee washing stations, livestock and non
hydro-power power plants should be integrated in the catchment based plan specified
above (under rural demand). Any opportunity in these domains should be pursued
making sure they are operated in a socially and environmentally sustainable manner.
water supply for livestock can be viably generated from rainwater harvesting and is in
that format ideally suited to complement the 'one cow - one family' concept. It is
recommended that Minagri / RARDA investigates this option and promotes it. The cost
for dedicated water supply systems for livestock watering in livestock intensification
zones (Mutara) in the catchment is integrated in the catchment investment plan.
notwithstanding major investments in the irrigation sector, rain fed agriculture and
livestock production remain the mainstay of the catchment's agricultural production. The
protection and optimum sustainable use of the catchment's land resources is of
paramount importance.

Rwanda National Water Resources Master Plan Page 117
MINIRENA-RNRA OCTOBER 2015
with respect to the irrigation sector, the renewable resources of the catchment are
insufficient to support all possible commercially viable developments. For each irrigation
mode the recommendations are specified below.
water supply from irrigation ponds is endorsed. Further research and additional training
of farmers in the use of the ponds may raise the profitability at the family level.
the catchments renewable resources are insufficient for the full development of the
potential area of 26,000 ha for dry season marshland irrigation. The development of this
domain is nevertheless supported on condition of the development of a series of 4 larger
storage reservoirs with a combined storage capacity of 34 MCM that carry over surface
flow from the wet to the subsequent dry season.
the catchments renewable resources are insufficient for the development of hillside
irrigation from surface water. The currently developed area of 400 ha in Musheli sector
can be maintained if the Muvumba dry season flow is sufficiently regulated by storage
capacity (see previous point). Considering that already 85% of the average renewable
resources are allocated, any further development of this type of irrigation will only create
further deficits elsewhere and is consequently ill advised.
irrigation from dams. This development allows to carry over resources from the wet
season to the dry season and therefore not only supports irrigation but also dry season
environmental flow and it provides opportunity for reuse. All 9 dam sites in the
catchment are endorsed. All dam development should be geared to the maximum inter
seasonal storage capacity even when the command area to be irrigated may require less.
A reasonable upper limit of the effective (combined) storage capacity is about 50 to 70%
of the mean annual runoff at the dam site. A further increase of surface water storage
capacity tends to increase evaporation losses more than effective use of the resource. The
development of the two reservoirs in the Mulindi catchment (NMUV_1) is endorsed but
has lower priority. The creation of storage capacity depending on runoff from Ugandan
territory requires a bilateral agreement which Uganda may unlikely sign and respect.
Small hydropower is of interest for the catchment and a number of interesting sites is
under study.
In order to manage the catchment adequately from its current condition with a few
percentages of use to the 2040 situation whence an extreme 85% of the average renewable
resources may be mobilized for primary use and commercial ventures, a number of
miscellaneous measures is proposed. With respect to the 85% targeted use, it should be
realized that for most years there will be reduced availability of resources and a number of
dry season uses may not always and entirely succeed. This situation calls for state of the art
water resources - and allocation management including timely communication with water
users. There is still time to develop this expertise over a significant number of years but a
start should be made as soon as possible.
A number of points is valid for all catchments but some are specific for the Muvumba river
catchment. The common points are
monitoring of rainfall resource and general climate data
monitoring of surface water resource quantity and quality
monitoring of groundwater resource quantity and quality.
monitoring of users' interventions in the natural hydrological cycle.
Rwanda National Water Resources Master Plan Page 118
MINIRENA-RNRA OCTOBER 2015
the development and use of a dedicated water management information system (Water
MIS, see chapter 2 in this report).
the formulation and introduction of a permit system for water use interventions. Details
are provided in chapter 2.4.2
the installation of a decentralized catchment water management office reliant on the
RNRA-IWRM. Details are provided in chapter 0
Proposed measures that are specific to the Muvumba catchment are:
the dependency of the Muvumba catchment on surface water storage for sustaining dry
season demand, imposes the reinforcement of effective erosion protection measures
especially in catchments that generate runoff for its reservoirs.
The imminent situation that the water resources of the Muvumba river are insufficient to
cater for all (dry season) demand in combination with the fact that the lower Muvumba is
a border river, makes it likely that cross border disputes will develop (if such is not
already the case). It is suggested to establish contact for local cooperation with Uganda
for the management of the shared waters especially the Kizinga and the lower reach of
the Muvumba. A study by SHER Ingénieurs Conseils s.a. commissioned by NELSAP in
2011 presenting possible modes of transboundary management or Akanyaru, Cyohoha
and Rweru water resources, is available.
1.9.10 RECOMMENDED ACTIONS AT THE NATIONAL LEVEL
The situation of limited use of the national water resources is undergoing some dramatic
changes towards imminent stress conditions in Muvumba, Akanyaru and the Rubyiro
tributary in the otherwise surplus Rusizi catchment, and looming stress conditions in lower
Nyabarongo, and upper and lower Akagera catchments. The looming stress conditions at the
latter three catchments can be managed by means of transfer from the long term surplus
catchments of upper Nyabarongo and Mukungwa. It can only be concluded that the necessary
improvement of water resources management in stressed catchments requires a similar
improvement in surplus catchments.
From the preceding review of observations and necessary actions it is evident that most of
these actions need to be implemented in all catchments. These actions relate to planning,
management, available opportunities and possible threats. These will be discussed in the next
sections:
1.9.10.1 FURTHER PLANNING ACTIONS
As regards planning of water resources the current water resources master plan is available as
is the irrigation master plan, the JICA study on rural water supply in the Eastern Province and
ongoing water use studies for Akanyaru and upper Nyabarongo catchment. Both the JICA
study and the Irrigation Master Plan are useful documents but based on administrative
boundaries which are unsuitable for water resources planning.
The water resources master plan comprises 9 catchment based Master Plans which can be
seen as a useful first draft based on all available information of water resources plus a number
of supplemental water resources investigations (especially on groundwater, small catchments
and water quality issues) as presented in the Exploratory Phase Report. The catchment master
plans are also a first projection of demand which is however not very detailed or precisely
located within the catchment.

Rwanda National Water Resources Master Plan Page 119
MINIRENA-RNRA OCTOBER 2015
It is therefore recommended to add to the nine catchment Master Plans with a more detailed
and localized resources and demand investigation quite similar to the studies currently
commissioned by EWSA
The recommended approach per catchment is based on:
exhaustive identification and assessment of demand areas and service volume
(comprising rural, urban, industries, administration, and other known water demand
like livestock, irrigation, hydropower, ecological requirements, etc.),
identification of supply locations and zoning of adequate least cost services (spring -
borehole - gravity pipeline - pumped pipeline - rainwater harvesting) considering
exploitation and investment costs (in this order). The use of appropriate technology
(notably the combination of pico hydropower to lift natural springs for potable water
supply by several hundreds of meters) should be incorporated in this approach.
prioritization of demand between primary use and commercial activities or more
detailed as may be suitable and based on appropriate and manageable justifications
(social relevance, economic relevance, environmental impact, level of investment of
the user intervention, revenue per cubic meter, water market mechanism, etc.)
more precise timing and localization of resources development implementation works
(spring - borehole - piped water supply systems)
more precise investment cost estimation specifically for potable water supply with due
consideration for the areas that are 'hard' to supply because of extreme distance and or
lift between source and supply level.
The planning exercise should apply GIS software with DTM layer and automation of
dynamic height from source10
. While the district is not a sound basis for water management
planning, all districts of the catchment should be fully implicated in the development of the
catchment water supply plan and they should derive from it for the formulation of their
district development plans.
As further resources monitoring information comes available, the RNRA-IWRM should
update the resources assessment per catchment and as needed per level 2 catchment
(particularly for CRUS_1 (Rubyiro) and NNYL_1 (Nyabugogo)).
1.9.10.2 MANAGEMENT ACTIONS AT THE NATIONAL LEVEL
The imminent development of water resources demand of the level 1 catchments requires a
number of measures that are implemented in each of the nine catchments. They were briefly
mentioned in the presentation of each catchment and some additional details are here
provided:
monitoring of rainfall resource and general climate data. This is currently done by
MeteoRwanda but the information is not systematically and timely relayed to
RNRA_IWRM for analysis and interpretation. This information is essential to interpret
10
This concept has been applied for the identification of irrigation command area from reservoir sites for the
Feasibility study for the development project for modern large scale agriculture around lake Nasho. "Réalisation
de l’Etude de faisabilité du Projet de Développement d’une Agriculture Moderne à Grande Echelle autour du
lac NASHO dans les Districts de Kirehe et Kayonza (Province de l'Est)" by SHER Ingénieurs Conseils s.a. -
February 2011 for Minagri - LWH.

Rwanda National Water Resources Master Plan Page 120
MINIRENA-RNRA OCTOBER 2015
extreme events (flooding, drought) and gradual shifts of resources availability whether or
not caused by anthropogenic climate change.
monitoring of surface water resource (currently done by RNRA-IWRM). As indicated in
the Exploratory Phase report, this information need to be extended covering both large
and representative small catchments including natural lakes and comprise water quality
data. The collected information needs to be stored, analyzed and interpreted for the
purpose of water management decisions (interventions in the natural hydrological cycle).
monitoring of groundwater resource. As indicated in the Exploratory Phase report,
specific groundwater strata need to be investigated in association with the surface water
resources. Investigations shall comprise groundwater levels by logger and water quality.
The collected information needs to be stored, analyzed and interpreted for the purpose of
water management decisions (interventions in the natural hydrological cycle.
monitoring of the interventions in the natural hydrological cycle. It has been indicated in
earlier reports that very little is known about the user's actual interventions in terms of
surface and groundwater abstractions, used water releases, flow regime changes, etc.
Obviously it is not realistic for government entities to realize this monitoring effort and
the recommendation is that water users report their interventions at regular time intervals
truthfully to the water management authority which may or may not verify these data,
prior to storing, analyzing and interpreting for the purpose of water management
decisions.
The above sources of information need to be lodged in a dedicated water management
information system (Water MIS, see relevant details in main report) which facilitates
storage, analysis and interpretation. A pilot system has been developed in the framework
of this study; details are provided in the next chapter 2.
There is need to regulate the interventions of water users' in the natural hydrological
cycle and to inform them on their rights and obligations in that respect. This is ideally
done by means of a permit system. One of the obligation of a water user is to inform the
management authority at regular time interval on the user's intervention (volumes
abstracted, released, water quality changes, etc.). A further recommended notion is to
inform all water users within a catchment on their respective permits. This will favor
permit compliant operations and control by the water users directly affected by any non
compliant operations. Finally, in the face of scarcity of resources, it should be clear that a
water permit is a permit and not a water right. The water user has obtained the
permission to intervene in the natural hydrological cycle in a specific manner described
in the permit. Whether that intervention actually yields any water is the risk of the water
user and not an obligation to be fulfilled by the water management authority. Ample
details are provided in chapter 2.4.2 on the Water MIS.
It is highly recommended that each catchment will be serviced by a catchment water
management office reliant on the RNRA-IWRM. This office can provide water
management services to water users, liaise between districts and head office, assist in
water related data collection, look into conflicts between water users, investigate
transboundary conflicts at the local level (Muvumba, Akanyaru and upper Akagera
(Rweru) catchments), inform water users on their respective permitted interventions,
investigate issues on flooding, drought, pollution, water quality, etc. Considering the
imminent stress situation for the Muvumba and Akanyaru catchments, the installation of
catchment water management offices may start immediately with these two catchments.

Rwanda National Water Resources Master Plan Page 121
MINIRENA-RNRA OCTOBER 2015
1.9.10.3 OTHER POINTS OF ATTENTION AT THE NATIONAL LEVEL
The current master plan has identified the major consumptive water use categories with the
possible maximum demand by 2040 for the primary use categories (all potable water supply,
environmental and social demand, livestock including fisheries) and the resources remaining
for the development of commercial ventures ((agro-) industries, mining, livestock, irrigation)
and for non consumptive demand (hydropower, navigation, recreation, etc.).
Within this context there are a number of points that require to be addressed at the national
level for a successful implementation at the catchment level. The main ideas are:
it very clear from the catchment development plans that a major shift from rural water
supply to urban water supply will take place during the master plan period. As regards
EWSA, this urban water supply is still concentrated around 15 centers. The district
survey has clearly indicated the existence of 'emerging' urban centers. It is
recommended that EWSA reviews its list of urban centers (including urban centers
like Nyamata) and extends it with the category of 'emerging urban centers'. The
emerging urban centers in each catchment are listed in the respective catchment
master plans (table in each chapter 3.3.3.1. on Urban drinking water supply of the
nine catchment Master Plans).
rainwater harvesting in urban high density areas. Rainwater harvesting is to some
extent a standard approach for areas that are difficult to service in rural areas. The
flooding study of the Nyabugogo has revealed the extreme impact of high density
housing areas on flooding (Mpazi basin features +70 % of high density tin roof area -
but there are quite a number of similar catchments in Kigali and elsewhere). The
development of rainwater harvesting solutions for these high density housing areas
may somewhat ease the intensity of the problem and it is further anticipated that such
a development will have a significant positive impact on the chores of women and
children. There is need to develop suitable technical solutions between RNRA and
knowledge institutes in Rwanda and possibly abroad.
rainwater harvesting for livestock watering. This approach is expected to marry
smoothly with the 'one cow - one family' poverty alleviation concept as well as with
small scale yet commercial livestock enterprises. A cheap prototype solution is since
many years operational in Gicumbi in a high rainfall area. There is no reason that the
concept wouldn't work in lesser rainfall areas but the optimum ratio between
impluvium, storage capacity and demand (number of cows) should be investigated for
different rainfall areas. One of the main problems is that stored water during the dry
season has a value of about 10 RWF per liter (10,000 FRW/m³ or 50,000 RWF for a
5m³ reservoir) in non serviced areas, and consequently requires protection against
theft during the dry season11
.
it was already briefly mentioned in paragraph 1.9.10.1 on further planning actions,
that the combination of pico hydro power development with potable water supply
constitutes an important opportunity where pico hydropower development which
typically requires a local use (flour milling, sawmill, utilities, etc.) because the
connection to the national grid is too expensive, would be used to lift water captured
from a natural spring. This is an opportunity that should be considered by EWSA but
11
This also seems a plausible reason that most irrigation ponds are used at the beginning of the dry season and
that they are not used to bridge the complete dry season.

Rwanda National Water Resources Master Plan Page 122
MINIRENA-RNRA OCTOBER 2015
local water resources know how (either from the district of the catchment water
management office) may localize potential opportunities.
Rwanda National Water Resources Master Plan Page 123
MINIRENA-RNRA OCTOBER 2015
2 RWANDA WATER MIS
2.1 RATIONALE
The Water Management Information System (Water MIS) has been developed as part of the
Rwanda National Water Resources Master Plan study (NWRMP).
Existing and new data have been collected and analyzed during the study phase for two major
purposes:
the establishment of the NWRMP and
the preparation of datasets to be integrated in the Water MIS
The NWRMP is essentially a forward looking but static planning tool for water resources and
their use; when resources alter (climate change) and water use and demand deviate from the
scenarios foreseen in the Master Plan, the plan becomes obsolete and a revision will be the
minimum requirement for the planning tool to remain relevant.
On the contrary, the Water MIS is a dynamic water management tool intended to support
water managers in their day to day decision making on the basis of continuously updated
information on resources and the interventions in the natural hydrological cycle.
To that effect, the Water MIS should facilitate a number of IWRM functions as follows:
monitoring of water resources
issuance of water permits for intervention in the natural hydrological cycle
management of issued permits including monitoring of water use
recipient of all information pertaining to water and water management
information portal for water professionals and water users
automated production of reports
etc.
In order to keep the system manageable and effective, specialist investigative functions which
are heavy on data demand and may be relevant at specific locations only (e.g. flood
simulation, groundwater modeling, economic and social simulations, etc.) are not included.
2.1.1 WHAT IS THE WATER MIS?
So what is this Water MIS? At its core, the Water MIS is a set of tools that has been provided
to the RNRA-IWRM department to support efficient planning and appropriate water
management decisions at catchment level.
The Water MIS can best be understood in the context of the information flow shown below:

Rwanda National Water Resources Master Plan Page 124
MINIRENA-RNRA OCTOBER 2015
The tools are essential for organized data collection, for processing and storage, for data
analysis and research, for data publication and finally for adequate water management
decisions.
These water management decisions take form in a Permit system. This permit system
regulates permitted interventions in the natural hydrological cycle. A pilot water permit
system has been developed during the NWRMP project as part of the Water MIS. This permit
system is a “translation” of a Permit Procedure proposed by SHER Ingénieurs Conseils s.a.
on the basis of the Water Law (N° 62 of 2008). This Permit Procedure (see annex C4_2) and
the required institutional framework for its actuation are discussed in some detail in chapter 0
on the Institutional and Legal action plan.
For appropriate management decisions to be made there must be room for regular data
analysis where the water resources are confronted with the current and projected water use
and demand. Water resources versus use/demand balances are established at catchment level.
Water resources and use data are to be collected and/or observed. Water demand data need to
be estimated12
. The Water MIS provides for specific tools to effectively store, update,
manage and publish water resources data and water use data. This data is needed for the data
analysis (essentially to establish the water balances and calculate the available water).
2.1.2 MODULAR DESIGN OF THE WATER MIS
The Water MIS is not a software suite of integrated applications but a set of tools that are
loosely linked and can be operated independently. It comprises of most relevant tools that
have been used and been proved efficient during the Master Plan study or that have been
developed where standardization and centralization of the storage and publishing of quality
data was deemed crucial. The advantages of the implementation of a set of independent tools
(compared with one integrated software suite) are:
Flexibility: if one tool does not prove to be adapted or appropriate, it can easily be
replaced by a similar tool.
Appropriation: procedures, tools and technologies that are effectively in place are as
much as possible conserved. The Water MIS only adds and replaces some instruments
12
Water demand data has been estimated in the NWRMP project following three population growth scenario up
to 2040.

Rwanda National Water Resources Master Plan Page 125
MINIRENA-RNRA OCTOBER 2015
in line with what exists and where the existing instruments are not sufficiently
effective or missing.
Durability: existing procedures can be improved in a more subtle way and some
additional implemented tools/procedures. These interventions are less disruptive than
putting in place a complete new integrated software suite; especially as the current
NWRMP project does not provide for a long term support for implementation.
A number of steps are kept “manual” as most of the data workflow as well as the permit
procedure are relatively new and should be tested and fully understood by the RNRA/IWRM
department before automation.
Preference has been given to software and tools without or with low licensing costs.
The Water MIS consists of three major modules:
the Water resources module,
the Water use module (with the permit system) and
the Water balances module.
All three modules are essential for adequate water management decision making.
Finally a “GIS Base” is provided by the Consultant. The GIS Base is a collection of files and
directories with relevant collected and produced (geo-)data and software for the
RNRA/IWRM department.
The overall configuration of the three modules is schematically presented in the figure below.
Figure 14: Schematic presentation of the modular nature of the Water MIS.

Rwanda National Water Resources Master Plan Page 126
MINIRENA-RNRA OCTOBER 2015
Data collection and input is organized for the Resources (A) and Use (C) Modules. The
Water MIS provides for updating the system by adding data on available water resources and
water use at any time by the RNRA staff.
Certain datasets have been generated during the NWRMP project: water resources (A & B),
water demand (E; including projections) and water demand-resources balances (G; projected
up to 2040). These datasets (essentially as presented in the preceding chapter Error!
Reference source not found.) have been integrated in the Water MIS.
As soon as the proposed permit system is implemented and water users and RNRA-IWRM
start exchanging information (decisions on permit requests by RNRA-IWRM and use
information provided by the users), the permit system module (C) should generate actual
water use data (not to be confused with water demand data estimations generated during the
NWRMP project). Once the permit registration and monitoring has been put in place
nationwide, covering the majority of the water users, the permit system can provide reliable
water use data that also could be used (in the same way as demand data) in the calculation of
balances.
Water balances per catchment are needed to estimate the available water after accumulated
abstraction by the registered water users. The water resources versus demand balances are
currently available up to 2040 (projections) from data generated during the NWRMP study:
showing monthly variations throughout the year
comparing different resources datasets and demand/use scenarii
The water balances are currently integrated in the Water MIS for the catchment level 1
divisions. They are of direct use in the management decisions (decision on a water use permit
request).
2.1.3 WATER MIS LIMITATIONS
A number of limitations of the Water MIS system are presented and explained in the
following paragraphs.
2.1.3.1 LIMITED REGIONALIZATION - WATER MANAGEMENT AT LEVEL 1 CATCHMENT
This version of the Water MIS is limited to water management at catchment level 1. Recall
that the boundaries of the level 1 catchment subdivision have been defined with the aim to
measure in- and outflow and to facilitate water management. The balance calculations as well
as the management decisions (permit system) consequently refer to the catchment level 1
divisions, as they have been defined during the NWRMP project. Rwanda consists of nine
catchments at level 1, each covering between 1 000 and 4 300km² (see map and table below).

Rwanda National Water Resources Master Plan Page 127
MINIRENA-RNRA OCTOBER 2015
Figure 15: Level 1 catchment division in Rwanda.
table 49: List of level 1 catchments in Rwanda
No Code Basin Catchment Name Surface [km²]
1 CKIV Congo Lake Kivu 2,425
2 CRUS Congo Rusizi 1,005
3 NNYU Nile Nyabarongo upper 3,348
4 NMUK Nile Mukungwa 1,887
5 NNYL Nile Nyabarongo lower 3,305
6 NAKN Nile Akanyaru 3,402
7 NAKU Nile Akagera upper 3,053
8 NAKL Nile Akagera lower 4,288
9 NMUV Nile Muvumba 1,565
It is highly recommended to extend the Water MIS to accommodate water management at
catchment level 3 divisions. This will require a substantial effort but will allow for substantial
improvement of water management decisions in highly committed catchments and parts of
catchments.
The hydrologic characteristics have been analyzed at the catchment level 1 conform to the
scope of the project. Further regionalization however is possible. Regionalization of
hydrological data is defined as the transfer (extrapolation or interpolation) of the hydrological
characteristics between spatial objects at different scales and at different locations. Thus,

Rwanda National Water Resources Master Plan Page 128
MINIRENA-RNRA OCTOBER 2015
regionalization consists of the definition of a model and its parameter values that can predict
hydrological characteristics at any scale or location for a certain period of the year.
There is a wealth of available information that could be used to further regionalize hydrologic
characteristics at lower levels (level 3 or even at site level) in a computerized and systematic
way. Thematic layers have for instance been prepared for hydrological characterization of the
basins at a more detailed scale. They present the geological and lithological characteristics,
the morphological and the land use characteristics for the whole country. For each catchment,
the areas of spatial overlap with the different thematic classes have been calculated. This is
needed to estimate the hydrological response of the measured hydrological catchments, which
depends on the percentage of these different thematic units. The relationship between the
measured runoff at the gauging stations and the basin characteristics with a multiple linear
regression can be transferred to other catchments or locations. Changes in the catchment
characteristics can be used to predict the hydrological impact.
The implementation of such a regionalization tool could allow the RNRA/IWRM team to:
Predict the available water resources (surface and groundwater) at any location in
Rwanda
Establish specific water resources – demand/use balances at catchment level 3 or even
at a specific (point) locations
The development of a more advanced regionalization tool has not been part of the ToR of the
current project. With the currently produced data and knowledge, the path is open for further
development and implementation of such a regionalization tool.
2.1.3.2 THE WATER MIS IS NOT AN ALERT SYSTEM
The Water MIS does not provide an appropriate framework for real time monitoring, needed
for an alert system (flooding alert system for instance). Data collection and analysis
frequency is done with the objective of sustainable integrated water resources management
on a yearly or monthly basis.
2.1.3.3 THE CURRENT VERSION OF THE WATER MIS IS A PILOT SYSTEM
The implemented system should be understood as a pilot. It needs to be tested in practice and
gradually improved along with the improvements of:
the observation and pre-processing procedures of hydrometric data
data analysis procedures
procedures related to water permit application, exploitation (and monitoring) and
closure
Except for data observation and collection, all these procedures are relatively new to the
IWRM unit of the RNRA, as they have been, for the first time, outlined and described in
detail during the NWRMP study.
Rwanda National Water Resources Master Plan Page 129
MINIRENA-RNRA OCTOBER 2015
For the Water MIS to be implemented as a complete toolset in an efficient and sustainable
way, its implementation should be accompanied by substantial further training and support
after the completion of the study.
It is recommended that the operation of the different components of the Water MIS is tested
for one catchment (for instance a catchment showing water stress signs like the Muvumba
catchment). After a testing period during which all the data management operations are done,
the Water MIS and its operation should be evaluated. The data management operations can
be summarized as follows:
observation/reception of raw data data pre-processing data storage data
analysis analysis of permit request or established water use delivery of a water
permit monitoring of a water permit exploitation permit closure
This evaluation will enable to identify the measures to be taken to improve the system and to
focus on institutional issues, human resources issues, data policy issues as well as technical
issues related to the Water MIS hardware and software.
During this evaluation further training and support to the RNRA staff should be defined in
detail. Specific training modules will most likely cover the following topics:
Maintenance of the Water MIS modules hosted by BSC and managed by the ICT team
of RNRA: management and maintenance of the Content Management Systems
Data pre-processing and data analysis for the estimation of the available per
catchment water resources; in dept use of software packages like Hydraccess and
other related (GIS based) tools; per catchment resources-demand or resources-use
balances estimations
Deployment of the permit system from a more centrally managed system to a
decentralized level
Further automation of currently manual procedures
2.1.3.4 THE PERMIT MODULE HANDLES ONLY PART OF THE WATER PERMIT PROCEDURE
The Water Permit Procedure identifies 5 different types of interventions in the natural
hydrological cycle for which a permit application would be required:
abstraction of surface water from a water course, river or lake
retention of surface water in a reservoir for later user
abstraction of groundwater from an aquifer
release of used water in the natural hydrological cycle
miscellaneous interventions that do not involve the abstraction of release of water per
se but which are likely to have some impact on the natural flow (regime changes,
water level, habitat, etc.)
This first version of the Water MIS Permit System accommodates for the permit and data
management of the three first intervention types. It is recommended that the intervention
types are completed and extended once the system containing a limited number of
intervention types has been tested. The monitoring of the permits (collection of monitoring
data) can currently not be standardized, as it has never been done before.

Rwanda National Water Resources Master Plan Page 130
MINIRENA-RNRA OCTOBER 2015
A permit system on release of used waters is very complex and its development requires a
substantial amount of time.
2.2 WATER MIS RESOURCES MODULE
The resources module of the Water MIS is the first module (see Figure 14) to be discussed in
this section. The overall purpose, the data content and the constituent tools and processes will
be presented in the following sub paragraphs.
2.2.1 OVERALL PURPOSE OF THE RESOURCES MODULE
The overall purpose of the resources module is as follows:
Organize raw, pre-processed and interpreted data
Secure access to resources data and secure data capitalization
Efficiently redistribute / publish data sets via Web based interface
Efficiently produce per catchment water resources parameters needed for the
calculation of balances and water use management
The Water MIS does not provide for real time monitoring.
2.2.2 DATA CONTENT OF THE RESOURCES MODULE
The data content of the resources module is the following:
The available stages measured in Rwanda (for surface and groundwater stations), the
discharge measurements and discharge calculations (for the stations for which
adequate rating curves are relevant and available) as well as related monthly
aggregated data
The rainfall data for relevant meteorological stations13
, as well as the daily and
monthly aggregated data
Other meteorological data (humidity, temperature) for a limited number of stations, as
well as related aggregated data.
Water quality data timeseries (per station or sampling location)
Ground water data timeseries (for instance coming from ground water monitoring
boreholes)
13
4 to 5 rainfall stations have been selected per catchment level 1.

Rwanda National Water Resources Master Plan Page 131
MINIRENA-RNRA OCTOBER 2015
2.2.3 PROCESS AND TOOLS OF THE RESOURCES MODULE
The Water MIS resources module is a set of tools that will facilitate to control the data
workflow from raw water resources data collection to data publication and interpretation.
This workflow is schematically presented in the figure below and discussed in the next
paragraphes.
Figure 16: Schematic representation of the work flow for the resources module
2.2.3.1 DATA COLLECTION: MANUAL/SEMI-MANUAL
Hydrometric measurements are done manually (on paper) and are being sent via SMS by the
data collectors to an online database. Measurements are typically being done twice daily.
Meteorological data is collected by the Meteo Rwanda and should be transferred on a
monthly basis to the RNRA. An agreement on the data exchange should be reached between
the RNRA and Meteo Rwanda. An example Memorandum of Understanding (MoU) between
the RNRA and Meteo Rwanda has been drafted and is presented in annex C4_7.
Water quality measurements are currently done as ad hoc studies. No predefined water
quality sampling network has been established to date. To obtain timeseries and to be able to
monitor water quality over time, water quality sample stations should be defined to monitor
water quality over time.
Ground water measurements are currently not collected, nor included in the water resources
module. The resources module can cater for groundwater timeseries. It is entirely conceivable
that groundwater monitoring boreholes are identified, the data collected and introduced into
the system to monitor for instance ground water levels over time.
2.2.3.2 DATA PRE-PROCESSING AND STORAGE
For the purpose of data pre-processing and storage of water resources data, Hydraccess has
been provided to the client.

Rwanda National Water Resources Master Plan Page 132
MINIRENA-RNRA OCTOBER 2015
The phases for water resources data preprocessing and storage are the following:
Quality check of raw data (completeness, dates, formats, gaps, outliers) and putting
the data in the right format before importing it. Because of the diversity of the sources
of data, this is a manual procedure.
Importing data in Hydraccess
Establishment of stage-discharge relations, using rating curves, calculated discharges
(tool: Hydraccess)
Compensation of piezometric height measurements (tool: Diver office14
). This data
can also be integrated into Hydraccess
Calculate aggregated timeseries (daily and monthly; tool: Hydraccess)
The RNRA and its predecessors have used Aqualium as the principal tool to store and
analyze hydrological data. Aqualium is a desktop database application that has been
developed in MS Access 2000 for the PGNRE (Projet de Gestion Nationale des Ressources
en Eau). The consultant proposes to replace Aqualium by Hydraccess for the following
reasons:
Hydraccess has been developed by the IRD (Institut de Recherche pour le
Développement, Montpellier, France). It is a software package that is very similar to
Aqualium with regard to its interface (both have been developed in MS Access) and
its functions, yet Hydraccess comprises much more functions than Aqualium. Some
of the most relevant functions for the RNRA/IWRM are various graphic functions
producing data performing hydrological calculations with simple or comparative
graphs export options in Excel.
Possibility of Stage – Discharge rating curves for bi-unique and not bi-unique stations
(in this case, water level gradient or relative altitude difference methods are
proposed), and plotting of discharge measurements on rating curve.
Data aggregation on various time steps, from one minute to one year, passing through
one day, 5 days, 10 days, 15 days and one month.
Production of water yearbook tables, on a daily or monthly basis.
Inventory and gap analysis of data existing in the database.
Reconstitution of floods entering a small reservoir, knowing the reservoir stage
variation, the spilled discharges, and rainfall above the reservoir.
Hydraccess has an extensive documentation integrated in the Help system
Hydraccess can be freely used by the RNRA/IWRM (confirmed by E-mail by the
Hydraccess developer Philippe Vauchel - [email protected] - on September
11th
2013).
14
Diver Office is a desktop software package running on Windows XP or newer, designed to manage and
process “Diver” data, piezometric data provided by divers (Schlumberger products have been used for the
current study; many other producers are available). The RNRA received a set of divers within de framework of
the NWRMP, together with Diver Office and the accompanying user manuals. These user manuals provide
details on the manipulation of Diver Office or it’s generated data.
Rwanda National Water Resources Master Plan Page 133
MINIRENA-RNRA OCTOBER 2015
Hydraccess not only caters for meteo data and stages/discharges, but also for any
water quality or groundwater data (measured or calculated)
Hydraccess is based on more than 30 years of development; its functionalities have been
extensively tested and improved. It has been successfully tested by the Consultant and has
been used as the primary tool for hydrological data processing during the NWRMP study.
The pre-processing and storage on desktop level can be done using tools and software
packages such as Microsoft Excel, Diver Office (for the compensation of piezometric
measurement time series generated by Divers), GIS software etc.
2.2.3.3 DATA PUBLICATION
Once the meteorological and hydrometric data have been pre-processed, they can be pushed
through to a server side Relational DataBase Management System (RDMS) with secured
Web access for publication allowing a controlled publication of data. The data publication is
done via a Web portal.
Specific tools have been developed for the synchronization of pre-processed data with server
side RDMS (online Water MIS Resources module). tools: Hydraccess Synchronization tool
& Water MIS Resources Web application.
Anyone can access the available monthly aggregated water resources data – stages,
discharges, discharge measurements, meteorological data,... - on the Water MIS Resources
Web application by plotting it and downloading it in Excel format. Detailed data sets (daily
aggregated or non aggregated data) can be accessed on the Water MIS Resources Web portal
with an appropriate account.
The technical specification defined for this Web based system are the following:
Hosting of all relevant water resources data that are useful for hydrological studies
Centralizing data in a unique database (avoid redundancy)
Accessing station information and timeseries data anywhere via Internet
Ease of use: find the data linked to the stations via a Web mapping application (online
GIS); include also the following layers: level 1, 2 catchment division, district
boundaries
Securing data access
Enforcing different security levels for data access, of which the most important are:
“anyone can access station data and monthly aggregated timeseries” and “only
(qualified) persons with an appropriate account can access the daily aggregated or
non-aggregated timeseries data”
Reducing the time of distribution of hydrologic data to third parties (just by providing
a user account)
Standardizing the data format for meteorological and hydrological data
Be able to manipulate large datasets in a secure and fast way
The data in the Web based system can be synchronized with Hydraccess (implying that the
Web based system is based on a data model similar to the Hydraccess data model). The

Rwanda National Water Resources Master Plan Page 134
MINIRENA-RNRA OCTOBER 2015
synchronization is a ONE WAY synchronization from the Hydraccess database to the
mySQL database of the Water MIS Resources Web portal.
The timeseries data related to the stations is structured in the following way: each station can
have 1 or more sensors attached to it and each sensor possesses data (time series).
Figure 17: One-to-many relationships between Stations, Sensors and Timeseries.
A STATION:
corresponds to a entity that is located in space (X and Y coordinates)
belongs to catchments (level 1, 2 and 3), administrative entities (Province, District
Sector) and that can be linked to a river
can have one or more sensors
Example: Gisenyi 70001 Hydrological station (Latitude: -1.70757500, Longitude:
29.26421000, Altitude:1460
A SENSOR:
belongs to a station
can produce “measured data” OR “calculated data”
has a unit, precision, is automated or not etc.
holds timeseries of different kinds
Example: The 70001 can have 3 sensors:
I-H instantaneous heights measurements
M-H monthly aggregated heights measurements
M-D: monthly aggregated calculated discharges

Rwanda National Water Resources Master Plan Page 135
MINIRENA-RNRA OCTOBER 2015
TIMESERIES:
Different kinds of timeseries exist: stages, rainfall etc…) which are stored in different
tables in Hydraccess
Each timeseries table is related to one sensor that explains how the timeseries was
measured or how it was calculated.
Example: Sensor I-H has data for the period between 1/9/1985 and 31/7/1993
2.2.3.4 ANALYSIS AND INTERPRETATION OF RESOURCES DATA
The analysis, interpretation and regionalization of water resources data is not automated and
has to be done using desktop tools by the RNRA specialists (hydrologists, data analysts…).
The Water MIS does not provide for automated tools for the analysis and interpretation of
resources data, such as the calculation and estimation of recharge, storage, yield, regimes,
available water etc. Hydraccess features extensive functionality in this field of data analysis
and interpretation.
2.3 WATER MIS BALANCES MODULE
The balances module of the Water MIS is the third module (see Figure 14) to be discussed in
this section. Again overall purpose, data content and the constituent tools and processes will
be presented in the following sub paragraphs.
2.3.1 OVERALL PURPOSE OF THE BALANCES MODULE
This module is designed for the publication of the water resources and water demand/use
balances per catchment for a certain period. This information shows whether catchments are
or will be under water stress for certain periods of time considering certain assumptions.
2.3.2 DATA CONTENT OF THE BALANCES MODULE
A water balance dataset consists of:
a resources volume in a domain for a number of time steps
a demand or a use volume in the same domain and time step
For the current version the domain is a level 1 catchment and the time step is a month. In as
far as the interrelations between domains are currently not automated, the water MIS can in
principle serve level 2 and level 3 catchments. Permit application evaluation in highly
committed domains requires testing at level 3 catchments which requires evaluation of the
interdependencies of resources and use in interrelated level 3 catchments.
Within the framework of the NWRMP study, monthly water resources availabilities have
been calculated for 5%-35%-50%-65%-95% reliabilities for surface water and for 50% of
ground water reliability for each of the nine catchments in Rwanda. Corresponding water

Rwanda National Water Resources Master Plan Page 136
MINIRENA-RNRA OCTOBER 2015
demand estimations per catchment up to 2040 have been done for three demand scenarios:
high, medium and low population growth, based on population data and the related water
demand (agriculture, drinking water, environmental, etc.).
These water balance data sets have been entered in the Water MIS. They are of direct use in
management decisions (Permit system) at catchment level 1. Before granting a permit to an
important water user, the RNRA officer should verify water availability against cumulated
water use for the catchment over the intended permit period.
It is of course possible to use different water demand or water use scenarios with projected
data.
In the future the balances could be produced based on data provided by the water users
(aggregated permit system data). Another example would be the establishment of the water
resources - demand balances following the implementation of a nationwide irrigation strategy
with a potential high impact of water availability.
2.3.3 PROCESS AND TOOLS OF THE BALANCES MODULE
2.3.3.1 DATA CALCULATION
The water resources and water demand or use parameters and values are entered manually in
an Excel spreadsheet per catchment and per month. The balances are then calculated for the
different water resources datasets and for the demand or use scenarios. The calculation of
those parameters and values are not automated which would anyway not be very effective at
a level 1 catchment.
Proper evaluation of permits in highly committed catchments and sections of catchment
would require at least a level 3 assessment and when automation is considered, it should be
done at this level 3. More details are provided in the section on Water Permits (section 2.4
and sub sections).
2.3.3.2 DATA PUBLICATION
The Water MIS Balances Web portal provides the Balances dataset of the NWRMP
published on an interactive Web page.
2.4 WATER MIS WATER USE AND PERMIT MODULE
The water use and permit module of the Water MIS is the second module (see Figure 14) to
be discussed in this section. The overall purpose, the permit procedure, the data content and
the permit process will be presented in the following sub paragraphs.
2.4.1 OVERALL PURPOSE OF THE PERMITS MODULE
The main purpose of the Water MIS Permit System is:
Rwanda National Water Resources Master Plan Page 137
MINIRENA-RNRA OCTOBER 2015
to facilitate the decision making process on permit applications; can the requested
intervention be successfully operated without undue impact on other water users and
therefore be granted as requested, granted after modification, granted with conditions
or should the permit not be granted?
to facilitate the collection and interpretation of actual water use data submitted by
registered users, the comparison of actual use data with permitted interventions and
with up to date resources data
The water permits module can be considered as a transformation of the Water Permit
Procedure into an information system in line with the institutional framework. The Water
Permit Procedure as formulated by the consultant is presented in annex C4_2.
In summary the Permit System module will:
Host all water permits and related data
Centralize this data in a unique database (avoid redundancy)
Allow decentralized data insert, update and management over the Internet
Secure the data access; Enforce different security levels for data access and
manipulation: the non registered visitor, the Registered Water User and the Water
Authority should, with different access permissions, be able to manipulate the system
Include Web mapping for locating abstraction, restitution and storage of water;
incorporating the following layers: level 1, 2, 3 catchment division, district and sector
boundaries and rivers
Standardize the permit data format
Put in place a workflow reflecting the water permit process
Trigger sending of emails on certain events within the workflow; also option to use
scheduled triggers
2.4.2 THE WATER PERMIT PROCEDURE
In its core the rationale of a water permit is to regulate the access of water users to the natural
hydrological cycle. The water permit is a prime tool to achieve best and efficient access to
water through regulation. This tool should however be operated by a proficient water
management organization equipped with proper tools (Water MIS, measurement, laboratory,
…) and complemented by an up to date Water Resources Master Plan.
The water permit is a written agreement (or a contract) between a water user and the
Rwandan government in the person of the Minister of State in charge of Water. Whereas this
agreement should be beneficial to both parties it is essential to structure this agreement along
their respective rights and obligations.
The water user aims to develop some water related activity with the objective to sustain
livelihood and/or pursue a commercial venture. The ‘right’ of the water user is the permission
to intervene in an explicitly defined manner at an explicitly defined location and for an
explicitly defined time, in the natural hydrological cycle. The ‘obligation’ of the water user
when granted the permit may likely be to provide information to the water management
authority on his interventions at specified time intervals over the total duration of the permit,
Rwanda National Water Resources Master Plan Page 138
MINIRENA-RNRA OCTOBER 2015
to pay agreed administration fees for services provided by government, to implement
mitigation measures as specified during the total duration of the permit and to reestablish the
conditions prior to the intervention when closing the permit. A water permit can not in any
way guarantee that the user’s intervention in the natural hydrological cycle will be successful
in terms of quantity of water abstracted; in that sense the terms ‘water right’ is misleading
and consequently inappropriate.
The Rwandan Government aims to secure the sustainable use of the natural resources, to
protect the interest of other water users and to promote the use of the natural water resources
for the purpose of sustainable development. The ‘right’ of the government is related to the
power of decision on any envisaged intervention including the temporary suspension of any
permit in case of emergency and or extreme conditions. The government should further have
the right to unrestricted water related information during all phases of the intervention
including access, inspection and testing of the water user’s installations at any time and for
any duration. The ‘obligation’ of the government is to provide state of the art water
management services to all water users which assure optimal decision making considering
economic, social and environmental criteria based on the best available knowledge. In order
to live up to this obligation, the government is bound to collect, analyze and comprehend
information on the state of the natural water resources and on each of the singular water use
interventions.
In order to structure the possible interventions in the natural hydrological cycle, these
interventions can be classified according to the following 5 types (intervention types):
abstraction of surface water from a water course, river or lake
retention of surface water in a reservoir for later user
abstraction of groundwater from an aquifer
release of used water in the natural hydrological cycle
miscellaneous interventions that do not involve the abstraction of release of water per
se but which are likely to have some impact on the natural flow (regime changes,
water level, habitat, etc.)
The first version of the Water MIS Permit System will only accommodate for the permit and
data management of the three first intervention types.
According to the law (62 of 2008) there are three regimes of water use or types of permit
(permit types):
Declaration regime; the declaration is intended for interventions that are unlikely to
have a major impact on the natural hydrological cycle or on other water uses; the
declaration can be operated without much supervision or control from water
management authorities
Authorization regime; the authorization is intended for interventions that have some to
significant impact on the natural hydrological cycle or on other water uses; the
authorization requires regular supervision and control from water management
authorities
Concession regime; the concession is intended for interventions that are expected to
have major impact on the natural hydrological cycle and or on other water uses; the
concession requires frequent and in depth supervision and control from water
management authorities.

Rwanda National Water Resources Master Plan Page 139
MINIRENA-RNRA OCTOBER 2015
The table below gives some suggested examples of interventions according to ‘intervention
type’ and ‘permit type’. The precise boundaries between the permit types require a decision
by the Rwandan Authorities; the values here suggested are just that; suggestions.
table 50: Examples of intervention- and permit types
Example Intervention
type permit type
small garden watering from river; < 5 are surface flow
abstraction
declaration
10 ha irrigation project along river authorization
500 ha hill side irrigation project river abstraction concession
not available: all surface flow storage requires at least an
authorization surface flow
storage
declaration
small dam (<15 m or …) authorization
large dam (>15 m or vol>… or vol/km>…) concession
borehole / well with hand pump groundwater
abstraction
declaration
borehole / well with motorized pump average capacity authorization
borehole / well with motorized pump and large capacity concession
not available: all used water disposal requires at least an
authorization used water
disposal
declaration
disposal of waste water quality RURA compliant authorization
disposal of waste water quality RURA non compliant concession
embankment protection plantation miscellaneous
intervention
declaration
bridge with embankment construction works authorization
floodplain drainage works, floodplain embankment concession
2.4.3 DATA FOR THE PERMIT PROCEDURE
The successful operation of the permit system (prior evaluation of 'success' and data
collection for exploitation) requires the following information:
The identification of the water user
The natural system in which the proposed intervention will be operated.
The description of the intended and actual (monitoring) extraction-retention-
restitution process and the planned infrastructural works with sufficient detail on
dimensions, capacities, etc. Information should be provided on anticipated impact on
the 'natural system' and other users if any. Further information should be provided on
proposed mitigation measures if any.
The purpose of use
The (aspired) duration of use
The payment modalities
The data collection for application, operation and closure of a permit is described in detail in
the Water Permit Procedure in Annex C4_2.

Rwanda National Water Resources Master Plan Page 140
MINIRENA-RNRA OCTOBER 2015
2.4.4 PROCESS AND TOOLS OF THE PERMIT MODULE
The sequence of the permit procedure is presented in the figure below:
These steps are discussed in the following paragraphs.
2.4.4.1 REGISTRATION OF THE WATER USER
The registration of the water user involves the following steps:
The Water user registers him/herself through the web portal making sure that
communication details (phone, email, address, etc.) are up to date. If needed the water
authority may assist the water user in the registration process and the water user may
also submit a paper form to this effect.
The water authority validates the user registration making sure he or she is not already
registered: the Water user gets an account from the Water Authority and becomes a
Registered Water User (RWU)
2.4.4.2 APPLICATION FOR A WATER PERMIT
The next step is the application for a water permit. Only RWUs can apply for a water permit.
The RWU submits an application for a permit (for water use). A minimum of
information has to be provided by the RWU (see details in the permit procedure in
annex)
The Water Authority verifies and assesses the permit application in two steps
o application completeness check (are all necessary data submitted?)
o hydrological viability check at level 1 catchment (is the permit likely to be
successful?)
Especially for highly committed areas it may be mandatory to check the permit viability at
the level 3 catchment. This is currently not possible but highly recommended.
A further issue is the EIA study. This is normally required for any intervention that requires
an authorization or a concession permit. The proper assessment of the EIA can only be made
when the actual abstraction volumes are known hence when the hydrological viability check
has been done.
It is suggested that both applications proceed in parallel but that the EIA is only approved
when the hydrological viability check is available.

Rwanda National Water Resources Master Plan Page 141
MINIRENA-RNRA OCTOBER 2015
While assessing the permit application, the WA completes the permit application. Once the
checks have been done, the Water Permit is issued as applied for, or with adjustments
(intervention calendar, duration, quantities, capacities), or with conditions (mitigation
measures) or the permit is declined.
The WA may be required to assist the RWU in the application process.
2.4.4.3 PERMIT EXPLOITATION MONITORING
The Water Permit is a contract concluded between the RWU and the WA. The Water Permit
will contain information on how much, how and when water will be abstracted, retained, or
released (or a combination). It will also contain information on how the RWU will perform
the water use monitoring (by providing water use data on a regular basis to the information
system of the WA).
The RWU provides water use data
The WA can do complementary investigations and complete water use data
2.4.4.4 PERMIT CLOSURE
On permit closure (due to duration expiry, on request of the RWU or demanded by WA for a
specific reason), information should first be provided by the RWU and then by the WA.
2.5 GEOSERVER MAPPING SERVER
The information in this paragraph has mainly been obtained from the following source:
http://geoserver.org. The site was accessed in September 2013.
GeoServer is a free and open source software server written in Java that allows users to
share and edit geospatial data in web mapping applications (online maps). Designed for
interoperability, it publishes data from any major spatial data source using open standards.
Implementing the Web Map Service (WMS)15
standard, GeoServer can publish maps in a
variety of output formats.
GeoServer is used in the Water MIS to publish specific layers using the WMS protocol.
Those layers are for instance, like shown in the red rectangle below, the Catchment level 1, 2
and 3, the Administrative boundaries and the Rivers layers. They can be visualized in Web
Mapping clients, such as the Water MIS resources start page. The overlays are WMS layers
published by a GeoServer.
15
http://www.opengeospatial.org/standards/wms

Rwanda National Water Resources Master Plan Page 142
MINIRENA-RNRA OCTOBER 2015
Figure 18: Geoserver example data (e.g. Catchment level 1 boundaries)
The diagram in Figure 19 below shows that both the Water MIS Resources and Water MIS
Permits Web portals use Web Mapping Services published by the GeoServer. The following
WMS layers will be published by Geoserver to be used in the Water MIS Resources Web
portal and the Water MIS Permit System:
level 1, 2, 3 catchment division (3 layers)
district and sector boundaries (2 layers)
rivers.
Notes:
1. The Stations (meteorological and hydrometric) and boreholes are produced and published by
the Water MIS Resources database directly (not via GeoServer).
2. The abstraction locations and return flow locations are managed and published by the Permit
System database (not via GeoServer).

Rwanda National Water Resources Master Plan Page 143
MINIRENA-RNRA OCTOBER 2015
Figure 19: Webmapping services configuration diagram
2.6 WATER MIS ARCHITECTURE
The overall Water MIS architecture is presented in the figure below.

Rwanda National Water Resources Master Plan Page 144
MINIRENA-RNRA OCTOBER 2015
Figure 20: Diagram of the Water MIS architecture.
The different tools and data of the Water MIS are partly hosted in desktop environment and
partly on servers. The Hydraccess application is a MS Access desktop database application
and hydrology tool. This tool can connect to a Hydraccess working database. A “Master”
version of the Hydraccess working database contains all the UP-TO-DATE resources data of
the department. This version should be maintained with care by the person in charge of the
Water MIS; regular backups should be made before and after each update of the database.
This desktop database can be synchronized with the database containing the Resources data
on a dedicated server hosted by BSC (Broadband Systems Corporation, www.bsc.rw), the
company where the RNRA Website is hosted. The Water MIS Resources, Balances and
Permit System Web applications are hosted on this server. GeoServer, used for publishing
WMS services could be hosted on RNRA servers or on the BSC servers (if technically and
administratively feasible). The ideal hosting situation would be dedicated server hosted by
BSC.
The Permit applications and the monitoring (orange rectangle) represents the data input
which can be done via the Internet clients.

Rwanda National Water Resources Master Plan Page 145
MINIRENA-RNRA OCTOBER 2015
2.7 WATER MIS INSTALLATION, OPERATION AND MAINTENANCE
2.7.1 MANUALS
The installation and deployment manuals as well as the end user and administration manual
for the Water MIS can be found in appendixes 11 to 15 respectively:
app_11_WATERMIS_Software requirements definition and specifications_vN.N
app_12_WaterMIS_Installation_Deployment_Manual_vN.N
app_13_WaterMIS_Resources_Balances_User_Manual_vN.N
app_14_WaterMIS_Geoserver_User_Manual_vN.N
app_15_WaterMIS_WaterMIS_PermitSystem_User_Manual_vN.N
2.7.2 HOSTING ISSUES
The Web applications are currently not installed on BSC hosted servers (the web services
provider for the RNRA). The hosting package of the RNRA at BSC is currently not adapted
for the hosting of the Water MIS Modules. A new hosting package should be acquired with
the following specifications:
Amount of dedicated storage space for the 3 Water MIS modules and Geoserver:
minimum 5Gb to preferably 10Gb
Data transfer: given the context of the Water MIS being a portal dedicated to
professionals in the Water sector, the expected data transfer will not be exceptionally
high, even though the front page includes a map. An important limiting factor of data
transfer is the fact that only a selected number of users can download non monthly
aggregated data. The public (“anonymous”) user has only access to monthly
aggregated data, which are very “light” pages (see table below).
Table 51: Data transfer analysis in the Resources module (module requiring the most transfer
demanding module)
Page Download amount when loading page for the first time
Download amount when loading page for the second time in the same browser
Start page (with map) approx 1500KB(*) 100KB (the rest from cache)
Stations overview page (table) approx 700KB approx 300KB (rest from cache)
Graph plotting with 30 years historic monthly aggregated data
approx. 200KB approx 40KB (rest from cache)
Graph plotting with 30 years historic instantaneous synoptic data (8 measurements/day)
approx. 6.2MB approx 6MB (rest from cache)
Graph plotting with 30 years historic daily data
approx. 1MB approx 1.9MB (rest from cache)
For the initial launch of the system (first few years), 2GB per month would be
sufficient (assuming 400 new users a month for the 3 modules and 20 users a month

Rwanda National Water Resources Master Plan Page 146
MINIRENA-RNRA OCTOBER 2015
that download large datasets of 10MB). The data transfer should be monitored
monthly.
Uptime of the website16
: minimum 95% (approx 36 hours down / month; as long it’s
mostly out of office hours)
Access to a dedicated sub-domain for the Water MIS: (name to be defined by RNRA-
IWRM). The subdomain name could be for instance http://water.rnra.gov.rw
Backup facilities (either cloud backup or on secured media)
Dedicated server: the upload of large datasets, specifically for the Resources module,
requires the specific PHP settings which are most likely against the BSC policy
(which might include longer script execution times)
Geoserver:
Specifically for the Water MIS, the Geoserver does not require extraordinary performance
because of the following reasons:
the published maps are very simple and few,
the number of users is expected to be less than 100 to 200 users a day (as the portal
targets water professionals),
only vector layers are to be published (no need to deal with raster mosaics or
pyramids, tiling or rendering issues).
2.7.3 COLLABORATION WITH METEO RWANDA
A data exchange collaboration should be implemented with Meteo Rwanda (as previously
mentioned). This collaboration could take the form of a memorandum of understanding
(MoU). An example of an MoU can be found in the Annex C4_7.
2.7.4 OPERATION AND MAINTENANCE COSTS
The tentative operation and maintenance costs for the Water MIS are presented in the table
below. The costs for installation of the system are indicated in the upper part of the table.
table 52: cost estimation for the installation and operation and maintenance of the Water MIS.
Cost for putting into production
Activity Unit Quantity Comments
Server hosting costs (for
Resources, Balances and
Permit System Web modules
€/month
Unknown
(BSC or
other)
BSC could not provide the Consultant
with a quotation; to be finalized
between the RNRA/ICT and BSC
Domain name creation €/month Free Available from RNRA (sub-domain)
Putting system into days 3 Including installation of local mirror
16
Measured by the percentage of time during which the website is publicly accessible and reachable via the
Internet.

Rwanda National Water Resources Master Plan Page 147
MINIRENA-RNRA OCTOBER 2015
production
Training days 3 Both RNRA-IWRM and RNRA ICT
(backups,…)
Documentation days 1 Client and server side (most of the
documentation is done)
Operations & Maintenance Costs
Activity Unit Quantity Comments Database management -
RNRA/ICT days/month 0.5 1 day per 2 months for maintenance
Web application
management - RNRA/ICT days/month 0.5 1 day per 2 months for maintenance
Geoserver management days/month 0.17 1 day every 6 months
The core Water MIS operational procedures like the data manipulation of Hydraccess, the
synchronization with the Water MIS Resources Web portal and the operation of the permit
system, should in the beginning be done by at least 2 or preferably 3 RNRA/IWRM
permanent and full time staff.
The exploitation of the system not only relates to the specific manipulation of Water MIS
tools but foremost to the overall process and procedures related to Water resources
estimation, balances calculation, data formatting and processing, permit application handling,
issuing of permits, monitoring etc.
2.8 CONCLUSION ON THE WATER MIS AND THE WAY FORWARD
The Water MIS toolset consists of a number of tools, software packages and procedures for
their operation (the latter being described in the manuals). The tools have been selected and
developed within the rationale of an integrated per catchment water resources-uses
management. Even though there are linkages between the tools, every tool can be operated
independently and is by consequence replaceable; this modular construction enhances the
opportunities for a more efficient appropriation of the tools (or possible replacement of a tool
if deemed inappropriate), for their targeted improvement and for acquiring specific technical
support.
The different Water MIS tools and modules should be regularly critically evaluated towards
the opportunities and risks, the toolset should be consequently improved and completed.
The current context of the IWRM department of the RNRA presents interesting opportunities
with regards to the operation and exploitation of the Water MIS. But we should also be aware
of the risks that could hamper the Water MIS operation and how the risks could be
circumvented. The following figure represents the theoretical components on which a
successful operation of the Water MIS depends.

Rwanda National Water Resources Master Plan Page 148
MINIRENA-RNRA OCTOBER 2015
Figure 21: Schematic presentation of the components acting upon the Water MIS operation.
The opportunities and risks are presented in the table below for each of the mentioned
components (Personnel, Data, Software, Hardware).
Table 53: Opportunities and risks related to the Water MIS
OPPORTUNITIES /
STRENGTH RISKS / WEAKNESS SOLUTIONS / ACTIONS
PERSONNEL / USERS
The RNRA/IWRM department
has recently expanded its
technical staff. Staff members
have been appointed to the
specific units (e.g. water
resources, permit delivery,
etc.) at central level
Staff turn-over (risk of loss
of technical know-how)
Lack of technical
competences with regard to
(1) operating the Water MIS
tools and (2) executing
procedures for IWRM
a) Staff retention policy
b) Training of staff (on
technical matters, on
software operation, on
IWRM procedures),
exposure of staff members
to the overall IWRM
procedures
Currently lack of personnel
at decentralized level
(support to Catchment
committees); this risk is real
when the system will be
rolled out/decentralized
Recruitment / training of
additional staff
The RNRA/ICT department
has recently expanded its
technical staff.
Lack of technical
competences with regard to
the maintenance of server
Training of staff

Rwanda National Water Resources Master Plan Page 149
MINIRENA-RNRA OCTOBER 2015
OPPORTUNITIES /
STRENGTH
RISKS / WEAKNESS SOLUTIONS / ACTIONS
based Water MIS tools
Water user can register and
apply online for water use as
well as follow-up it’s permits
(opportunity of reducing the
RNRA staff workload and
potentially improving data
quality)
Water user has insufficient
knowledge to do so
Additional support,
information and training
needed (to be provided by
the Water Authority to the
Water User)
DATA AND DATA PROCESSING
Data is available for a number
of hydrometric stations
Poor quality/non usable data
for certain stations
Incomplete data for certain
sub-catchments
Perform discharge
measurement and establish
rating curves
Rehabilitate
stations/establish new
stations
Data is available for a number
of meteo stations
Collected and pre-processed
by Meteo Rwanda: data
quality, formats and
provision not 100% under
control of RNRA
Establish own network for
data collection
Establish agreement with
Meteo Rwanda
Water MIS can accommodate
water quality and ground water
data time series
No monitoring network has
been established (incl. data
transfer procedures)
RNRA needs to establish a
monitoring network
Water use data can be
collected within permit system
Permit system is not fully
operational (currently pilot
system)
Make permit system
operational; putting permit
system in production17
Hydraccess allows advanced
data processing of hydrometric
and meteo data
Technical mastering of data
processing is insufficient
Additional training is
needed
SOFTWARE
Hydraccess has been
introduced as major desktop
tool for hydrological data
processing; Hydraccess can be
used for free
Lack of Microsoft Access
License on the computers of
staff using these tools
Licenses needs to be
acquired for staff using
those tools
Other MS Excel and MS
Access tools have also been
provided
Lack of Microsoft Access /
Excel Licenses
Licenses needs to be
acquired for staff using
those tools
The client-server packages
(accessible via network or the
Internet) have been developed
using open source solutions
- -
17
This issue has been discussed in chapter 2.4 and sub paragraphs. Full details on process and rationale of the
permit procedure is provided in appendix 10.

Rwanda National Water Resources Master Plan Page 150
MINIRENA-RNRA OCTOBER 2015
OPPORTUNITIES /
STRENGTH
RISKS / WEAKNESS SOLUTIONS / ACTIONS
(allowing further extension
and development)
Decentralized operation and
access of the resources Web
portal and Permit systems is
possible
Lack of Internet access in
Districts, at catchment level
or at Water User level will
not allow decentralized
access
Provide Internet access
Pilot system18
: The online
modules have currently been
installed in test version on the
RNRA/ICT servers allowing
extensive testing
Due to lack of support the
in-house testing will not be
concluded and the online
modules will not migrated
to a production environment
(on BSC servers)
Seek external assistance for
migration
Acquire adequate hosting
solution
HARDWARE/HOSTING
BSC (the current RNRA Web
services provider) disposes of
the right infrastructure for
hosting the client-server (Web
based) tools in production
Remark: The RNRA/ICT does
currently not dispose of the
right infrastructure to host the
Water MIS online modules
The RNRA hosting package
with BSC is currently
insufficient
Remark: even though the
RNRA/ICT staff has been
trained on installation and
configuration of the
different modules,
unforeseen problems might
occur when migrating to
BSC servers
A new hosting package is
needed with a dedicated
server solution
External specialized support
should be seeked for
additional training of
RNRA/ICT staff
Backup infrastructure
implementation has been
planned for
Backup infrastructure is not
put in place
Put in place backup
infrastructure OR outsource
backup services to the
hosting company
RNRA disposes of a network
with shared storage; the shared
storage for the department is
possible with secured
(password protected) access
Moving to a new building
could (temporarily) interrupt
access to the network and
shared storage space
Network access and shared
storage should be requested
by IWRM to the ICT
department
The limitations of the current version of the Water MIS have been discussed earlier in chapter
2.1.3.
The principal recommendation for the Water MIS to be implemented in an efficient and
sustainable way, is that its implementation should be accompanied by substantial further
training and support. After a testing period of maximum a few months, the Water MIS tools
and all related operations should be evaluated towards their opportunities, strengths,
18
This issue has been discussed in chapter 2.1.3.

Rwanda National Water Resources Master Plan Page 151
MINIRENA-RNRA OCTOBER 2015
weaknesses and threats and adequate solutions should be proposed for the improvement of
the system.
Over time, the IWRM Department should extend its toolset by further developing the tools
and integrating additional tools in the Water MIS. Certain procedures could be automated
after sufficient testing, but also according to the institutional framework that will be put in
place. The modular and open nature of the Water MIS allows for such developments.
Rwanda National Water Resources Master Plan Page 152
MINIRENA-RNRA OCTOBER 2015
Institutional and legal action plan
2.9 INTRODUCTION
Rwanda has adopted the notion of Integrated Water Resources Management (IWRM) as the
basic premise for the management of its national water resources.
According to the technical committee of the Global Water Partnership, IWRM is “a process
which promotes the coordinated development and management of water, land and related
resources, in order to maximize the resultant economic and social welfare in an equitable
manner without compromising the sustainability of vital ecosystems”.
One of the principles of IWRM is 'subsidiarity' or the notion of decision making at the most
appropriate level. The UNDP's 1997 report on decentralization19
noted that the principle of
subsidiarity is an important motivation for decentralizing governance: "Decentralization, or
decentralizing governance, refers to the restructuring or reorganization of authority so that
there is a system of co-responsibility between institutions of governance at the central,
regional and local levels according to the principle of subsidiarity, thus increasing the
overall quality and effectiveness of the system of governance, while increasing the authority
and capacities of sub-national levels.".
Although decentralization is not a condition 'sine qua non' for the implementation of IWRM,
it is clear that there are very significant benefits when optimizing information exchange and
management functions between different strata:
the Central level: management functions are provided by RNRA-IWRM and a series
of other central government entities. Communication protocols and coordination
platforms are required to synchronize the management functions between the
government entities as well as between the central to the decentralized levels. This
aims especially at coherent strategies, planning and resources development;
Decentralized level: management functions are provided by catchment, district and
sector entities. Similar communication protocols and coordination platforms are
required to optimize information exchange and management functions at catchment,
district and sector levels. The launch of these intermediate levels is essential to enrich
possibly abstract planning concepts with the situation on the ground;
User level: water users (professional organization, NGO, private person, ...) are
numerous and extremely diverse in intervention method and magnitude. The
relevance of their implication in management can hardly be over stated because they
are the ones who may actually know what they are doing.
This chapter on the institutional and legal framework required for IWRM will render these
notions much more concrete based on the following structure:
the first step in the next paragraph 2.10, is a further elaboration of the actual content
of IWRM, developed with the aim to highlight the management decisions,
with this background, the institutional structure 'under construction' as defined by the
water law (N° 62 of 2008) is presented in paragraph 2.11 with the aim to identify
19
UNDP, Decentralized Governance Programme: Strengthening Capacity for People - Centered Development,
Management Development and Governance Division, Bureau for Development Policy, September 1997, p.4;

Rwanda National Water Resources Master Plan Page 153
MINIRENA-RNRA OCTOBER 2015
possible omissions and inconsistencies. Most of this has already been presented in
great detail in chapter 8 of the exploratory phase report.
from here the next paragraph 2.12 depicts an 'ideal' institutional framework for the
implementation of the different IWRM compliant management functions. Different
identified management functions are elaborated in sub - paragraphs.
whereas the governments decentralization approach is operated through the districts,
the next section (paragraph 2.13) explores need and practical modalities for catchment
oriented water management services in Rwanda while maintaining the districts'
mandate on development policy and associated financial dealing in their respective
domains. This is essentially a transition mechanism for catchment management while
maintaining district territorial hegemony. It closes with some ideas on the institutional
structure under lean government conditions.
the next two paragraphs (2.14 and 2.15) present a road map with concrete actions for
respectively the implementation of the institutional structure and the corresponding
legal framework.
2.10 IMPLEMENTATION OF IWRM
IWRM means pro-active management of water resources in a domain by means of
implementation of effective water management decisions. The key issue that needs to be
answered each time is whether an aspiring water user can be permitted to intervene in some
way in the natural hydrological cycle at a specified location and for a specified time.
Such a request from an aspiring water user can be declined, partially approved, conditionally
approved or approved as requested by the applicant.
In order to provide a rational response to the aspiring user's request, he or she needs to make
very clear what intervention is intended:
what is the resource (rainfall, surface flow, groundwater from aquifer, re-use option)
where exactly will the intervention take place?
when (calendar, months, weekdays, time of day, ...) with starting date?
for how long (from a few months or weeks to 20 years or more)?
what is the method of intervention?
how much water is intended to be abstracted / needed?
what is the use (primary or commercial; if commercial what is the expected benefit
per m³; what are the consequences of a reduced permit (for both types of use)? what
are the consequences of a temporary reduction of abstraction volume?)
is any or all water returned to the natural hydrological cycle?
if so, where will the water be returned?
if so, what flow will be returned?
if so, is there any change of water quality?
to what extend is the natural resource going to change from the intervention?

Rwanda National Water Resources Master Plan Page 154
MINIRENA-RNRA OCTOBER 2015
to what extend are established water users going to be affected by the intervention?
if anything, does the aspiring water user envisages to undertake any action to mitigate
his impact on the resource and / or on other water users?
Of course, it is needed that the owner and the operator (if not the same legal person) of the
intervention in the natural hydrological cycle, are known and can be contacted by the relevant
authorities.
In order to proceed with the formulation of a rational response to the aspiring user's request
for permission to intervene in the natural hydrological cycle, it is further needed to know how
much water is available in the natural hydrological cycle, and what other water users are
doing with or without permission.
Therefore the following information is needed
assessment of total reserves and annually and monthly renewable resources of the
domain where the intervention is envisaged.
continuous monitoring of the state of the resources in this domain
management of water demand and use in the domain where the intervention is
envisaged:
o strategy development and implementation (what are our principles? how are
we going to proceed? - protection of resources, water quantity, water quality,
environment as a user, what uses of what resources are permitted (DWS,
Industry, irrigation, non consumptive uses, miscellaneous interventions),
disposal of used water, (de-)centralized management, prioritization of use
according to what principles (priority date, equitable distribution, market
mechanism), mitigation measures, payment / subsidy for water use, promotion
of water use for development, ...)
o planning (development of a master plan; in the core this is a calendar of
necessary and advantageous future works and interventions in the natural
hydrological cycle with all consequences (investment and exploitation costs,
operation and maintenance, staff and training, etc.))
o implementation (of resources development works based on viable and
authorized short or long term intervention under the declaration, authorization
or concession regime; it is the consultants opinion that the interventions
should be grouped according to the following:
direct abstraction of surface waters
significant storage of surface water for subsequent use
direct abstraction of groundwater
disposal of used water in surface or groundwater
miscellaneous interventions other than abstraction and or disposal;
fisheries, construction works, drainage, ...)
o exploitation of intervention works (actual exploitation should generally adhere
to the intervention for which an authorization has been requested and granted
or conditionally granted. Change in actual availability of resources due to
extreme meteorological conditions in the area or elsewhere (upstream or
downstream), or erroneous granting of permits, or inappropriate exploitation

Rwanda National Water Resources Master Plan Page 155
MINIRENA-RNRA OCTOBER 2015
of authorized interventions may all lead to temporary or even permanent
changes of the authorized intervention. A prioritization of authorized
interventions should be defined in the strategy
o monitoring of use interventions (this is in the first instance the registration of
the actual interventions in the natural hydrological cycle of each and every
intervention under an authorization or concession regime. It may likely
include monitoring of the natural resource at the abstraction and/or disposal
location, and possibly monitoring of the impact on other water uses due to
changes in regime or water quality.)
The final step in the formulation of the rational response to the aspiring user's request for
permission to intervene in the natural hydrological cycle, is the analysis of all this
information:
quality control of data
storage and registration
development of 'what-if' scenarios with the available information (current situation,
future situation, extreme conditions, climate change, ...) in order to define:
o if the intervention is likely to be successful over the requested intervention
period (water balance remains positive over the lifetime of the permit)
o if the impact of the aspired intervention on the natural resources is acceptable
o if the impact of the aspired intervention on standing permits is acceptable
decision taking on permit request; it is especially the 'what-if' simulation that will
guide the decision to grant the permit entirely as requested by the aspiring water user,
or otherwise to impose adjustments on water quantity (water quality for disposal
permits), intervention calendar, permit duration, or mitigation measures towards the
natural resource or other resources (water, land, or other) users.
Once that the permit has been granted (unconditionally without adjustments, conditionally,
partially, time restriction, ...) it may well occur during the life time of the permit, that
unforeseen conditions prevail and that permits in a certain area should be temporarily or
definitely be adjusted in order to protect and preserve the natural resource. This case may be
triggered by unavailability of the resource to certain permit holders or by monitoring of the
natural resource (or both instances). For this case a similar sequence of investigations applies:
quality control of data (on the exploitation of the permit and/or monitoring of natural
resource)
storage and registration
what is the cause of the unforeseen conditions (natural cause, improper assessment of
resources availability or authorized interventions, improper operation of some or all
authorized interventions).
development of 'what-if' scenarios (current situation, future situation, extreme
conditions, climate change, ...)
decision taking on permit exploitation (no adjustment, temporary adjustment, long
term adjustment, cancellation of permit)
The last phase of a permit is its closure. The closure can be requested by the water user (at the
end of the lifetime of the permit or earlier) or imposed by the water management authority (at
Rwanda National Water Resources Master Plan Page 156
MINIRENA-RNRA OCTOBER 2015
the end of the lifetime of the permit or earlier if the permit holder does not comply with the
obligations of the permit, or if resources proof to be insufficient (in the latter case an
authorized water user may possibly claim compensation)). The principle water management
investigations are:
what will be the impact of the closure (discontinuation) of the authorized intervention
on the natural resources (principally land and water) using 'what-if' scenarios for
current and future conditions.
what will be the impact of the closure of the permit on other water users, using 'what-
if' scenarios
decision taking on permit closure which will normally be granted but should include
mitigation measures related to the re-establishment of the conditions prior to the
intervention in the natural hydrological cycle.
The listing above is a concise summary of the issues that need to be investigated and the
services that need to be provided for the effective implementation of IWRM.
Hence, in the following paragraph we will specifically address the following matters:
when these investigations and services are as yet not developed, who should 'design'
them?
when properly designed and formulated, who should perform these services and with
what means
who should pay for these services?
These issues will be addressed in the next paragraph 2.12 and its subsections. In order to
provide the proper perspective
2.11 UPDATE ON THE INSTITUTIONAL STRUCTURE FOR IWRM 'UNDER CONSTRUCTION'
This paragraph presents a summary of institutional structure depicted in the Law 62 of 2008
(the Water Law) which contains elements that are already fully operational as well as
elements 'under construction'. The institutional structure will be discussed against the
backdrop of the water management functions, i.e. strategy, planning, implementation,
operation and monitoring.
The diagram in Figure 22 shows the principle entities of the institutional framework for water
management at four different levels:
user level; individual water users, water user organizations, commercial entities, ...;
their concern is local interest and access to the resource
district level; comprising the district government as well as district and sector
committees, their concern is the water management function within the district
catchment level; these entities are not explicitly provided for in the current legal
framework, their concern is the water management function within a clear
hydrological management unit which normally comprises a number of districts
central level; these entities look at national level and tend to be oriented per sector
The entities presented in the diagram have different colors with the following meaning:

Rwanda National Water Resources Master Plan Page 157
MINIRENA-RNRA OCTOBER 2015
White blocks represent existing institutional entities as the Prime Minister’s office,
different ministries, governmental agencies and most of the water users.
Green blocks embody institutional entities identified and defined in legal documents
but not yet operational (of fully operational). The National Water Consultative
Commission and Districts and Sector (Consultative) Committees.
Yellow blocks symbolize institutional entities identified in the Water Law but not yet
defined by a ministerial order as the Water Inter-ministerial Committee and the
Rwanda Water Authority.
Blue blocks characterize institutional entities not identified in existing legal
documents but recommended by the consultant for the purpose of IWRM. These are
the structures required at Catchment level: Catchment Councils and Catchment Water
Management Offices.
The arrows in the diagram symbolize a link between institutional entities:
Down arrow →: hierarchical link between the higher entity and the lower entity
Up arrow ←: consultation/participation link; for example the User consults the
RNRA-IWRM for an envisaged intervention; representation of District Consultative
Committees in Catchment Committees, etc.
Double arrow ↔ : communication link; for example between Catchment Committees
and Catchment Water Management Offices, between District Governments and
District Consultative Committees, etc.
The entities presented in the diagram and their role in water management according to the
different identified functions, strategy development, planning, implementation, operation and
monitoring, will be briefly discussed in the next paragraphs

Rwanda National Water Resources Master Plan Page 158
MINIRENA-RNRA OCTOBER 2015
Figure 22: Diagram of the institutional framework for water management in Rwanda

Rwanda National Water Resources Master Plan Page 159
MINIRENA-RNRA OCTOBER 2015
2.11.1 STRATEGY
The Ministry of Natural Resources (MINIRENA) defines the national water policy according
to the following principles and priorities:
protection of the resource
regulation of appropriate use,
precautionary management aiming at the prevention of irreversible risks, prevention
of pollution,
application of the principles of user-payer and polluter- payer and
creation of user’s associations for administrative management of resources use after
consultation with other ministries and institutions concerned.
The Ministry of Natural Resources also represents the Government in intergovernmental
organizations for international and regional cooperation on matters related to water.
Numerous other ministries stipulate their strategy with respect to the use of water resources
for their respective missions. These ministries assemble during the Water Inter-ministerial
Committee.
2.11.2 PLANNING
At the National level, the Water Law put in place in its article 16 the National Water
Consultative Commission. The Prime Minister's order n°143/03 of 24/05/2013 determines the
organization, functioning and composition of this Commission.
The law n°53 of 2011 establishes the Rwanda Natural Resources Authority (RNRA) and
determines its mission, organization and functioning. The Water Resources Planning function
is undertaken through its IWRM department, implemented since October 2012, with its
Water Resource Planning Unit (Water use planning, Permit Administration and Water
regulation). According to the article 3 of the law establishing the RNRA, this authority and
consequently its IWRM department has many missions. It is responsible for implementing
national policies, laws, strategies and regulations relating to the promotion and protection of
natural resources, including the water resource.
Consequently, the RNRA should advise the Government of Rwanda (GoR) on appropriate
mechanisms for conservation of natural resources and investment opportunities. For this
specific purpose regarding water resources, the IWRM department should institute
regulations and guidelines and initiate research and studies on water resources and publish its
results. This authority is also responsible of matters regarding the international level of
IWRM. It should implement international conventions ratified by the GoR and establish
cooperation and collaboration with other regional and international institutions with an aim of
harmonizing the performance and relations on matters relating to the management of water
resources.
At the decentralized level, the Water Law specifies, in the articles 20 and 21 the
establishment of Basin District committees and in the article 22 and 23 the establishment of
Basin Sector Committees, charged with the formulation of orientations and guidelines for
planning of the waters at the level of the sub-basin or aquifer. The ministerial order n°
005/16.01 of 24/05/20013 defines the composition of these “hydrographic basin committees”
with different representatives of the civil society from the district and sector levels.

Rwanda National Water Resources Master Plan Page 160
MINIRENA-RNRA OCTOBER 2015
These Basin District and Sector Committees have not yet been created. It should be noted that
the development of district and sector based Master Plan can only be successful when
processed at the level of a hydrographic basin which normally comprises a number of
districts whose territories are almost always divided between two or more "hydrographic
basins".
2.11.3 MANAGEMENT (IMPLEMENTATION AND EXPLOITATION)
The management of water resources (implementation and exploitation of resources
development works) is currently done by many private entities but implemented without
considering other demand which may easily lead to conflicts and sub optimal use of scarce
resources, both of which are largely preventable.
To remedy this problem, according to the law n°53 of 2011 establishing the RNRA the role
of the RNRA-IWRM is to provide supervision and follow up on activities in the sphere of
water management with firm technical advice on proper use of the resource, protection (with
the rehabilitation of places where natural resources are damaged in the country) and valuation
of natural resources.
In order to conserve the natural public water domains, the creation of a permit system is
essential. The Water Law stipulates, at its article 11, that: “The Authority having the water
resources under its responsibilities shall maintain register in which all issued authorizations
and concessions are recorded.”. Consequently, RNRA-IWRM, specifically its Water Permit
and Administration Unit (at the moment with two officers), has to provide this service. The
Water Law defines three regimes of water use (at the chapter V of the law), completed by the
Ministerial Order n°002/16.01 of 24/05/2013 determining the procedure for i) declaration, ii)
authorization and iii) concession for the utilization of water.
Whereas this classification of permit regimes according to their anticipated impact is a very
sound principal, it does not consider the mode of intervention in the Natural Hydrological
Cycle. In order for the RNRA-IWRM to provide supervision and follow up on activities in
the sphere of water management, it is absolutely essential that a distinction be made between
the type of intervention, i.e. groundwater, surface water, storage, etc.
In order to get a better grasp on the different modes of intervention in the Natural
Hydrological Cycle, the Consultant proposes a classification according to 5 types of
intervention:
1. abstraction of surface water from a water course, river or lake
2. retention of surface water in a reservoir for later use
3. abstraction of groundwater from an aquifer
4. release of used water in the natural hydrological cycle and
5. miscellaneous interventions (bridge and road construction in / across a floodplain,
flood retention and protection works , (temporary) deviation of a water course, river
training, erosion protection works, etc.)
During its lifetime, a permit for intervention has three distinct stages, involving different
actors and institutions: the application of the permit, the operation and the closure. The
classification of water permits according to intervention type has not been specified in any

Rwanda National Water Resources Master Plan Page 161
MINIRENA-RNRA OCTOBER 2015
legal text for Rwanda. It is understood that so far four water permits have been issued by
RNRA-IWRM.
Conflicts of water use are currently solved between the users with a possible intervention of
sector or district staff; interventions from central level are rare and dealt with at ministerial
level. With an increase of water use, the frequency and intensity of conflicts is bound to rise.
The support for conflict resolution at the decentralized level will start at the user level and
may gradually rise to sector, district and hydrographic basin level (catchment). It is suggested
that the Rwanda Water Authority may possibly be put forward as the highest instance of
conflict resolution. This Authority, which creation is already proclaimed by the Water Law
(article 17), may provide this service. The Water Law (or any other legal document for that
matter) does not define the function of the RWA.
2.11.4 MONITORING
In order for the monitoring of water resources to be comprehensive, it is necessary to monitor
the resource in the natural hydrological cycle (rainfall, surface water, groundwater) as well as
to monitor the use interventions.
The monitoring effort of the Government on the state of the water resources is laudable, yet
there are a number of weak spots which make that this monitoring effort is not fully exploited
and that the level of knowledge on the water resource may be increased for a very modest
supplemental effort:
rainfall monitoring data is generally satisfactorily;
surface water monitoring data is generally acceptable for large catchments but station
data is insufficient, lacking absolute topographic reference level, discharge
measurements are absent or at best out of date
surface water monitoring data is largely insufficient for small catchments
groundwater monitoring data is largely insufficient
Water quality monitoring is insufficient
Data management and interpretation of data is very weak
About water resources (rainfall, surface flow and groundwater), according to the Ministerial
order n°006/16,01 of 24/05/2013 determining the organization of water resources data
collection, treatment, management, exploration and communication, the RNRA-IWRM shall
put in place a water resources data monitoring network. This network can be integrated in the
Water Monitoring Information System (Water MIS) developed under the current Master Plan
study. According to this ministerial order, the RNRA-IWRM shall make a follow up on water
data collection activities. The Agency should manage (process, analyze, gather and store) the
water resources data in its database for decision makings. The Agency shall be required to
disseminate data on water resources through modern print or electronic communication
media. For the moment, four officers in the Water Resource Monitoring Unit are working on
quantity and quality monitoring.
Rainfall data are currently collected by MeteoRwanda. These data are essential for the
analysis and interpretation of surface and groundwater resources. A protocol for the sharing
of data between MeteoRwanda and RNRA-IWRM is under preparation and will be defined in
a Memorandum of Understanding between the MINIRENA (for IWRM) and the Ministry of
Infrastructure (for MeteoRwanda)

Rwanda National Water Resources Master Plan Page 162
MINIRENA-RNRA OCTOBER 2015
The monitoring of water use is not enforced with the result that water use data may be
recorded by a select few water users yet that the parameters collected serve the purpose of the
water user and not necessarily those of the water manager. This information is not exhaustive
and RNRA-IWRM does not have the tools to register and analyze this information.
The law n°53 of 2011 establishing the RNRA specifies that RNRA-IWRM has the duty of
follow up and supervision of activities relating to the proper use of natural resources. The
implementation of a permit system is an opportunity to impose water users to collect and
transmit essential information on their intervention in the Natural Hydrological Cycle. The
monitoring obligation of the water user should be specified in full detail in the permit. Where
needed, the user may obtain assistance from the RNRA-IWRM department with guidelines
and indications about correct procedures.
2.12 PROPOSITION OF THE INSTITUTIONAL STRUCTURE FOR THE IMPLEMENTATION OF IWRM
This chapter contains a detailed review of the operational or proposed actors and tools
(meteo- hydrological stations, water MIS, ....) for above indicated IWRM actions and
processes.
The institutional structure as identified in the exploratory phase report forms the basis for the
review which comprises essentially existing institutional operators. Where needed additional
entities will be suggested and for all entities (operational and proposed) the functions and
necessary tools (monitoring stations, water MIS, permit system, ...) will be reviewed. The
need for consultancy services for the formulation of processes and training of actors will be
indicated as will be the role of research partners for special investigations like environmental
flow, reserved areas, etc.
Finally, inadequacies of the legal framework will be identified.
These aspects will be discussed in the following sub paragraphs of this chapter for each of the
identified processes for IWRM:
monitoring of the state of water related natural resources and interpretation of data for
the assessment of total reserves and annually and monthly renewable resources at
level 1 catchment and lower levels
strategy development for the management of water demand and use
planning for the development of water resources for their use (Master Plan and water
balances)
implementation of resources development works (consider 3 levels, international,
national, local) including the handling of the permit request (5 types) leading to a
rational decision (based on water balances) followed by an EIA (and handling of
finances of the permit)
Exploitation of resources development works (again 3 levels) for the operation of the
permit according to 5 types leading to rational decisions for adjustment of permit
operation (based on water balances) if needed
Monitoring of use interventions
Closure of the permit for intervention in the natural hydrological cycle

Rwanda National Water Resources Master Plan Page 163
MINIRENA-RNRA OCTOBER 2015
2.12.1 MONITORING OF WATER RELATED NATURAL RESOURCES
Water resource monitoring, in the strictest sense, are the actions undertaken to track the state
of the water resources in the natural hydrological cycle.
The monitoring effort on the state of the water resources is laudable, but yet there are a
number of weak spots which make that this monitoring effort not fully exploited. The level of
knowledge on the water resource may be increased for a very modest supplemental effort:
rainfall monitoring data is generally satisfactorily;
surface water monitoring data is generally good for large catchments but station data
is insufficient, lacking absolute topographic reference level, discharge measurements
are absent or at best out of date. For small catchments the monitoring is not sufficient
while there is a lot of development actions that depend on this kind of information
groundwater monitoring data is systematically unavailable (unless from dedicated
projects of a temporary nature (this NWRMP study).
Water quality monitoring is insufficient
Data management and interpretation of data is generally rather insufficient. While matters
have improved with the availability of division and ministry wide servers, data are still found
stored on computers of different employees of the government institution with multiple
copies of the same dataset with slight alterations for corrections, omissions, errors, etc.
Analysis of data is typically done within the framework of a project. Hence, government
spends substantial efforts in the collection of water resources data but these data are mostly
not professionally handled and analyzed.
The principal entities involved in water resources monitoring are highlighted in Figure 23
(Meteo Rwanda of Mininfra, RNRA-IWRM and REMA of Minirena and divisions of other
ministries for instance RBC of Health Ministry for drinking water quality control).
Except for the highlighting of the responsible entities, this is the same diagram as presented
in Figure 22.

Rwanda National Water Resources Master Plan Page 164
MINIRENA-RNRA OCTOBER 2015
Figure 23: Main institutional entities involved in water resources monitoring
2.12.1.1 METEOROLOGICAL DATA MONITORING
Meteorological including precipitation data in Rwanda are monitored by MeteoRwanda
through a sufficiently dense network of automatic weather stations (10), climatological
stations (72), agro-synoptic stations (14) and simple rainfall stations (77). MeteoRwanda is an
autonomous institution that operates under MININFRA.
On request, the information on precipitation (and other meteorological phenomena (wind,
radiation, temperature, humidity)) will be transmitted free of charge to other ministries. Third
parties are required to pay for meteo data from MeteoRwanda.
The main issues with this function are:
RNRA - IWRM does not receive up to date (and historical) information on rainfall in
the country which is nevertheless essential in order to keep track of the nation's water
resources.
RNRA - IWRM does not receive real time information on rainfall events which is
essential for interpretation of extreme events and adequate flood management.
The same applies to MIDIMAR which should receive real time information for early
warning on imminent problems from excessive rainfall and risk of hail. Part of this
function as regards public information, is directly organized by MeteoRwanda itself.

Rwanda National Water Resources Master Plan Page 165
MINIRENA-RNRA OCTOBER 2015
In order to solve these issues it is recommended that there be established a direct
communication link between MeteoRwanda and RNRA-IWRM for both real time and quality
controlled transmission of meteorological and precipitation data between the two institutions:
Real time monitoring rainfall data (including hourly rainfall intensity) stations should
be selected for the needs of both MeteoRwanda and RNRA-IWRM. These real-time
data should be shared between the two institutions
Daily rainfall data for a number of stations should be selected for the needs of both
MeteoRwanda and RNRA-IWRM (this report suggests about 30 stations). These data
should be transmitted on a minimum monthly but preferably weekly basis and be up
to date for water management needs. The quality control for these data lies with
MeteoRwanda.
2.12.1.2 MONITORING SURFACE WATER RESOURCES QUANTITY/QUALITY
The RNRA-IWRM is in charge of the monitoring of surface and ground water resources. To
this effect it has developed the Rwanda Water Resources Information System (RWRIS)
which holds the records of a Surface Water Quality and Quantity Hydrometric stations
network. It comprises the former PGNRE database (which was based on the old
administrative boundaries) and allows for quality control and analysis of data. The average
daily flow for 6 important stations across the country is published through a bimonthly
bulletin.
This is a good development yet more is needed in terms of assessment of available resources
especially at small catchments (~100 km² which are important for especially irrigation and
small hydropower projects), flow quantity abstracted (see paragraph 2.12.6 on monitoring of
water use), and water quality issues (especially sediment, nutrients, toxic substances) at
vulnerable locations (downstream of urban areas, mining sites, industrial complexes,
agricultural areas and at vulnerable locations e.g. river - lake interfaces).
The main issues with this function are:
The level of knowledge on the surface water resource remains limited; there is
systematic observation of water levels and discharge at the major catchments
intersections but this information is not sufficiently analyzed and used for water
management decision making.
Surface water resources monitoring on small catchments has essentially been
introduced by this study (exploratory phase) and needs to be incorporated in the
monitoring strategy of RNRA-IWRM, especially since these small catchments
support important development activities in water supply, small hydropower and
irrigation.
The hydrographic stations are lacking benchmarks and absolute water levels, precise
coordinates, up to date discharge curves, and station data are not properly maintained.
Some of these problems could be solved by this study (station data, flow
measurements, correction of staff levels, etc.) but RNRA-IWRM needs to continue the
flow measurements.
Water quality monitoring is limited, implemented by a series of agencies for different
purposes, and not shared between those agencies (RNRA, RBC, REMA, EWSA,
knowledge institutes, ...).

Rwanda National Water Resources Master Plan Page 166
MINIRENA-RNRA OCTOBER 2015
Taking into account the needs described above, the following structure has been proposed
(see also chapter 6 on Monitoring in the Exploratory Phase Report:
The National Water Resources Monitoring Network comprising 8 stations that are
equipped with direct data transfer to RNRA and automatic water level and velocity
measurement and 5 stations for flood warning on large rivers. (Total of 13 stations)
The Hydrometric Network comprising 28 stations on rivers in Rwanda and 12
limnimetric stations on major lakes and wetlands
The Impact Monitoring Network comprising 10 stations equipped with data loggers
that are used to investigate emerging issues on small catchments that can be easily
shifted after some months (or a limited number of years) of investigation
The monitoring network of the NRNA-IWRM should serve the following purposes:
the renewable surface water resources as has been defined in the National Water
Resources Master Plan can be updated by additional data sets and the renewable
resources are updated at 3 to 5 year intervals;
provide background information for extreme events (floods and droughts - how
extreme is the extreme event; once in 6 months or once in 30 years?) and constitute a
framework for an early warning system and give directions for sound solutions
(retention, conveyance, flood (drought) proving)
indicate water scarcity from meteorological drought or over-abstraction in a
catchment or sub-catchment early enough to take necessary action to prevent social
and or economic damage and resources degradation
The surface water monitoring network provides the basic data to do all hydrological
calculations and assessments within RNRA-IWRM. These include:
estimation of runoff generation of different basins
flood frequency analysis for regions and catchments
validation of groundwater recharge estimates obtained with other methods
basic design data for infrastructural works (bridges, embankments, weirs, water
supply projects, irrigation projects, hydropower projects, etc.) - average flow, base
flow, flow duration curves, peak discharges, seasonal and monthly flow, probability
assessment, etc.
water quality status with specific emphasis on sediment, nutrients, toxic substances,
etc. within a context of cause (identification of the polluter) - effect (vulnerability of
the natural resources and different users for reduced water quality, restoration and
possible mitigation measures)
fundamental data for developing water resources sustainably e.g. for hydro-power
(flow duration curves), irrigation (sustainable yield),
data for the development of surface and groundwater resources for water supply on a
sustainable and reliable basis
State of the art hydrometry is an essential part of the services of the IWRM department of
RNRA. RNRA-IWRM must be equipped and have the capacity, budget and staff to carry out
the necessary missions.

Rwanda National Water Resources Master Plan Page 167
MINIRENA-RNRA OCTOBER 2015
2.12.1.3 MONITORING GROUNDWATER QUANTITY/QUALITY
Groundwater resources need to be monitored for several reasons:
Groundwater is driving the surface flow (springs, rivers).
Groundwater level and quality is an indicator of the long term state of the water
resources in a catchment area.
RNRA-IWRM is the entity in charge of monitoring of the ground water resource. Apart from
a few stations that have been monitored during the exploratory phase of this study, RNRA-
IWRM is not monitoring any groundwater data and the RWRIS is only registering surface
water data.
Hence, at the current state the RNRA-IWRM is not sufficiently aware of the natural state of
the groundwater resources in terms of total volume available, water levels and essential water
quality parameters, nor is it aware of the annual recharge, interaction with surface water
resources, and the current abstraction and used water infiltration.
It is needed that RNRA-IWRM identifies a series of observation wells for monitoring
purposes and starts monitoring of water levels and appropriate water quality parameters.
The current Master Plan study has provided a proposal for the monitoring of the essential
aquifers by RNRA- IWRM (see Exploratory Phase report chapter 6).
The proposed groundwater monitoring network needs to take into account two main uses:
Urban drinking water supply: EWSA is currently extending the use of groundwater
for urban water supply. Abstraction schemes from the Nyabarongo River floodplain
for Kigali and near Musanze town are in operation and extensions for both are
planned.
Rural water supply: groundwater is crucial for local water supply in rural areas: A
large number of boreholes are equipped with hand-pumps and in some cases with
electrical pumps supplied from the national grid or from solar panels. The
development and protection of natural springs is equally important for local water
supply and in some cases for gravity fed or pumped piped systems.
Groundwater quality is currently monitored by EWSA for its large drinking water abstraction
schemes especially for the purpose of water treatment needs (sediment) and by RBC
(Ministry of Health) specifically for pathogens and WHO compliance of the (rural) water
supply
The proposed RNRA - IWRM groundwater monitoring network consists of:
a select number of boreholes (minimum 9) which comprises one borehole in each of
the nine catchments and one borehole for each of the eight aquifer types where water
levels are monitored along with a surface water monitoring station and rainfall
monitoring station in order to assess the interaction between surface and groundwater
resources.
The water quality is also monitored for essential parameters (see chapter 6 of the
Exploratory Phase report) at regular time intervals (preferably at a three monthly time
interval but a lesser frequency - six months - is still acceptable)
New production boreholes along the Nyabarongo need to be equipped with data-
loggers and EWSA needs to monitor and report water levels along with abstraction
volumes to RNRA-IWRM.

Rwanda National Water Resources Master Plan Page 168
MINIRENA-RNRA OCTOBER 2015
EWSA should also share its water quality data with RNRA-IWRM.
The RWRIS needs to be updated in order to cater for groundwater data. The Water
MIS which has been developed in the framework of the current Master Plan study can
accommodate groundwater data (water stages, production data and water quality). If
the RWRIS does not provide specific functionalities beyond what is fully tested and
readily available in Hydraccess, it may be incorporated in the Water MIS as soon as
the Water MIS is operational and successfully tested.
The groundwater monitoring network provides essential information for all hydrological
calculations and assessments within RNRA-IWRM. These include:
catchment based total groundwater storage
estimation of average monthly and annual recharge of groundwater
special investigations on groundwater level 2 catchments
The first two investigations (catchment based storage and annual and monthly renewable
recharge; the latter by means of three different methods) have been conducted within the
framework of this Master Plan study. RNRA-IWRM needs to continue these findings and
update the Master Plan study findings at level 1 catchments and conduct or command further
studies at specific level 2 high yielding groundwater catchments as may be required for the
development of specific uses (water supply, irrigation, ...)
2.12.2 STRATEGY DEVELOPMENT FOR MANAGEMENT OF WATER RESOURCES AND THEIR USE
Institutional actors involved in the water resources management strategy development
function are depicted in the diagram of Figure 24 below. The Ministry of Natural Resources
(MINIRENA) is the principal actor in charge of strategy development for water resources
management. However, numerous ministries concerned with water resources and its use
elaborate their own strategy. In order to harmonize this state of affairs and to check
compliance with the guiding principles below, the creation of the Water Inter-ministerial
Committee, foreseen by the Water Law, could be an adequate tool. The RNRA-IWRM will
play an important role in this committee as Technical Coordination Secretariat. This
department is foreseen to elaborate the groundwork for the committee's reviews and
recommendations.
Although the Water Interministerial Committee is not yet operational, it is fair to mention
that the harmonization of the strategies between the ministries has so far been secured rather
efficiently by means of workshops attended by staff of the different ministries and by the
development of a number of guiding documents discussed in the following section.

Rwanda National Water Resources Master Plan Page 169
MINIRENA-RNRA OCTOBER 2015
Figure 24: Main institutional entities involved in IWRM strategy development
2.12.2.1 GUIDING PRINCIPLES
In its document “Water Resources Management sub-sector strategic plan (2011-2015)”, the
MINIRENA presents its WRM Policy with three main objectives while its main challenge for
the next 5 years is “meeting increasing multiple water demands, in the face of declining water
quantity and quality, and an inadequate governance framework”.
The first objective is to protect, conserve, manage and develop water, which is
considered as “a strategic natural resource for the country’s socioeconomic
development and ecosystems sustenance […] a strategic tool for Rwanda’s geo-
political cooperation and security.”
The second objective is based on the assessment that “Rwanda’s waters resources are
severely degraded - primarily due to land degradation resulting in siltation of water
bodies; pollution from point and non-point sources, including agricultural chemicals,
inappropriate human settlements and poor urban and industrial waste management”.
The resulting objective is to ensure that water resources are available in adequate
quantity and quality for the socio-economic and ecological needs of the present and
future generations.
The third objective is “to ensure that decisions affecting water resources management
are made in a coordinated manner and with the participation of all stakeholders at

Rwanda National Water Resources Master Plan Page 170
MINIRENA-RNRA OCTOBER 2015
local, national and trans-boundary levels”. This objective of coordinated internal use
and enhanced transboundary water cooperation is a critical and immediate priority for
the Government of Rwanda (GoR) as well as for the Lake Victoria Basin Commission
(LVBC), the Nile Basin Initiative (NBI), and the Lake Kivu and Rusizi River
authority (ABAKIR).
In order to attain these objectives, the WRM Policy 2011 has identified seven strategic
actions for IWRM that should be put into operation in or prior to 2015. Strategic actions are
formulations of approaches to ensure that the Vision 2020 and MDG targets are achieved:
1. Effective Water Governance framework that reflects the principles of IWRM
2. A Cost-effective Water monitoring system, water resources assessment and national
water resources Master plan is established
3. Critical watersheds and catchments are rehabilitated and basic ecological functions
restored by June 2016
4. Efficient and equitable water allocation and utilization framework
5. An effective framework for water-related disaster management and climate change
mitigation and adaptation is in place and implemented
6. Effective framework for management of shared waters (transboundary cooperation
framework)
7. Basic capacities installed and effective framework for sustained WRM capacity
development and knowledge management established.
N.B. Further details on the 7 strategic outcomes and their 39 outputs are provided in annex
C4_3.
This WRM policy document (2011-2015) emphasizes a number of priority actions; most
notably the elaboration of the Water resources Development and management master plan
(NWRMP) “since this has implications for the delivery of planned and on-going investments
in irrigation, hydropower, tourism, industrialization and water supply master plans”.
Further highlighted are the review of the water governance framework with a view of putting
in place a new institutional structure and capacity development in the WRM sub-sector, the
mobilization of technical assistance to establish the coordination mechanism and provide
technical guidance to WRM staff and policy-back stopping to MINIRENA leadership and
finally the development of a resource mobilization strategy (in consultation with
MINECOFIN) as a guideline for a dialogue with potential financing partners.
This WRM Policy fits into the National Development Vision and Strategic framework which
includes the Vision 2020, the 7-year Government Plan (2011- 2017) and the Economic
Development and Poverty Reduction Strategy (EDPRS).
The Vision 2020, which is a leading development roadmap, has important implications for
IWRM. One of the main premises of the Vision 2020 is the strategic shift from an agriculture
and natural resources-based economy, to a knowledge centered economy. Given that
agriculture accounts for nearly 70% of the total water use, reducing dependency on
agriculture could reduce pressure on water resources but it will increase water use in other
sectors e.g. industry. Moreover, a productive, high value and market oriented agriculture will
intensify the use of fertilizers and pesticides, thereby increasing pollution risks and boost
irrigation demand which will actually increase agricultural water demand.

Rwanda National Water Resources Master Plan Page 171
MINIRENA-RNRA OCTOBER 2015
Another main pillar of Vision 2020 is private sector-led development: it will facilitate public-
private partnerships in water service delivery and the GoR will divest from service provision
in favor of more strategic areas like watershed rehabilitation, water resources monitoring and
regulation.
Among the 231 priority activities identified by the GoR in the 7-year Government Plan
(2011-2017), several have particular implications for WRM, especially on environmental
issues and transboundary cooperation: - climate change management; - establishing a national
fund for environmental protection; - rehabilitating critically degraded ecosystems and
watersheds; - mainstreaming environmental conservation/protection into all development
activities; - consolidating decentralized governance and participatory service delivery; and -
promoting regional integration.
Water is also very significant for the realization of four priorities of the EDPRS (2007-2012).
It is i) an important input for the realization of increasing economic growth, ii) developing the
Private Sector, iii) improving land administration, and iv) enhancing sustainable land use
management practices.
Moreover, water is a vital input to tackle extreme poverty, especially to improved food
security. Reducing population growth by reducing infant mortality, promoting family
planning and education outreach programs has direct implications for sustainable WRM.
Finally, IWRM will contribute to the attainment of ensuring greater efficiency in poverty
reduction by promoting stakeholder participation, equity and social inclusion.
2.12.2.2 THE WATER INTER-MINISTERIAL COMMITTEE: AN ADEQUATE SOLUTION FOR A BETTER
WATER RESOURCES STRATEGY DEVELOPMENT
In Rwanda, water is dealt with by many ministries (agriculture, transport, navigation, power,
industry, mining, health, gender, environment, security, ...) but there is insufficient
coordination between them. Their focus is likely to be more on development of sector issues
than on integrated water resources management. All ministries develop their explicit strategy
to reach their objective which includes for a large number of ministries a specific approach
on water resources which is not necessarily fully compatible or cost effective between
themselves.
To change this practice, creation of an Interministerial Committee (IMC) could be a practical
platform for a single and comprehensive inter ministerial water management strategy
development. As per the 2008 Water Law (art.18), MINIRENA has to consult the Water IMC
prior to the submission of any strategic tool to the appropriate institutions. However, the
Water IMC is not yet established. Currently, MINIRENA applies a practical procedure for
stakeholder participation in the development of the policy documents: the Sector Working
Group. This group ensures coordination and monitoring of the sector program, including
dialogue and communication accross sector stakeholders (in particular other sector
institutions, cross-sectoral planning and regulatory bodies, NGOs and the private sector) and
provides an active platform for gathering and disseminating information. Yet, a
comprehensive vision comprising all ministries across all sectors (WASH, Minagri, Mininfra,
Minecom, Midimar, Minirena, Minisante, and many others) is not likely to evolve from one
sector inviting the others. The Water Interministerial Committee should be composed of all
Ministerial department representatives concerned with water resources and its use in their
domain.

Rwanda National Water Resources Master Plan Page 172
MINIRENA-RNRA OCTOBER 2015
Based on the fact that there is no ministerial order determining the composition, organization
and functioning of the Water IMC; given the point that MINIRENA is in charge of the
strategy function according to the law; and considering that several ministries have their own
water strategy, the Consultant proposes the following composition for the Water
Interministerial Committee:
the Minister of Natural Resources coordinates the Committee, he or she is in charge
of integrated water resources management and strategy development (or his/her
representative)
the Minister of Infrastructures, responsible for urban and rural potable water supply
and hydropower strategy development; further, the MININFRA is indirectly
implicated in surface flow resources and flood management and in the rainfall
resources management (by MeteoRwanda, by the Rwanda Housing Authority and by
the Rwanda Transport Development Authority) (or his/her representative)
the Minister of Finance and Economic Planning, responsible for urban and rural
potable water supply strategy development and for its role of financier in large water
projects (or his/her representative)
the Minister of Agriculture and Animal Resources, responsible for agro-industrial
use, livestock water demand, agriculture, irrigation, fisheries and flooding
management strategy development (or his/her representative)
the Minister of Disaster Management and Refugee Affairs, responsible for disaster
management and consequently, flood management and reserved areas strategy
development (or his/her representative)
the Minister of Local Government, responsible for urban and rural potable water
supply strategy development and the District and Sector Committees supervising (or
his/her representative)
the Minister of Trade and Industry, responsible for policy formulation, oversight
and monitoring in the sectors of industry and tourism, urban and rural potable water
supply (by the action of the RBS for quality regulation and standards setting) and
mining use (or his/her representative)
the Minister of Health, responsible for urban and rural potable water demand
strategy development (or his/her representative)
the Minister of Foreign Affairs and Cooperation, responsible for transboundary and
international water resources management and downstream commitments (or his/her
representative)
the Minister of Education, responsible for awareness campaigns on hygiene for
children (or his/her representative)
the Minister of Gender and Family Promotion, responsible for the promotion of a
gender-conscious approach for water resources strategy (or his/her representative)
the Minister of Defense, for its implication in flood management (or his/her
representative)
the Minister of East African Community, for its implication in the transboundary
and international water issues and commitments (or his/her representative)
the Minister in Charge of Cabinet Affairs, responsible for supervision of the

Rwanda National Water Resources Master Plan Page 173
MINIRENA-RNRA OCTOBER 2015
Interministerial Committee work (or his/her representative)
In case of absence of the Minister of Natural Resources, the Minister of Infrastructures will
coordinate the Committee. Members could appoint representatives when they cannot assist at
sessions of the Committee.
The Committee will meet on invitation of the coordinator, on his initiative or on the request
of other members.
The principal mission of the Water Inter-ministerial Committee is to be consulted on all
legislative draft bills regarding the water domain elaborated at the national level, as well as
on matters of national, regional or international level. The Water IMC will be a
harmonization tool between ministries, in order to assure coherence and coordination for the
water resources strategy development. The participation of cross-sectoral ministries will
clarify the issues and will make possible overall agreements on water resources strategy
development. Furthermore, the IMC will have to check compliance with the following
priorities:
Water is a good belonging to the State public domain. Its use constitutes a recognized
right accessible to all within the scope of applicable laws and regulations.
Protection and the appropriate use of water resources are of general interest and
constitute an imperative duty to all, including the State, local communities, private
sector, civil society and citizens.
Further, the Water IMC may prepare policy briefs and recommendations, and approve sector
investments plans and projects, in accordance with the following principles:
The principle of precaution aiming at preventing serious and irreversible risks for
water resources, by the adoption of the efficient measures;
The principle of prevention of pollution aiming at increasing the efficiency of a
process, thereby reducing the amount of pollution generated at its source. With a
comprehensive pollution prevention strategy, most pollution can be reduced, reused or
prevented.
The principles “user-payer and polluter-payer” according to which the users of water
resources and the polluters support the expenses resulting from their use and
pollution. The payment may be a direct payment or payment in kind through measures
of prevention, of pollution reduction and restoration of the resource in quality and in
quantity;
The principle of users associations for administrative management of water use
wherever such association is efficient and effective;
The Consultant proposes the creation, along with the Water Interministerial Committee, of a
Technical Coordination Secretariat, in order to facilitate the work of the Water IMC. This
Secretariat has to do the groundwork for the committee's reviews and recommendations. The
Secretariat will work in close cooperation with the represented ministries in order to prepare
the Committee’s decision taking meetings. More precisely, the Secretariat has to:
Advise the Committee on the formulation of national policies on water resources
Prepare guidelines for the establishment of an effective legal and institutional
framework for the implementation of the national policy on water resources
Obtain any information deemed necessary by the Committee for its rational and

Rwanda National Water Resources Master Plan Page 174
MINIRENA-RNRA OCTOBER 2015
adequate decision taking
This Technical Coordination Secretariat could be entrusting to the RNRA-IWRM officers.
The leader of the staff could be the Head of the RNRA-IWRM Department, assisted by
directors of all RNRA-IWRM units (see section 2.12.3.1 for details on the staff composition
of RNRA-IWRM).
The establishment of a Technical Secretariat to strengthen the Committees operations
(decision taking on matters of water management strategy) requires an update of the Water
Act with subsequent formulation of the Prime Minister's Order for the formulation of role,
duties, organization, staff composition and other amenities.
The forthwith establishment of the Water Interministerial Committee in combination with a
Technical Coordination Secretariat will constitute an adequate and efficient procedure for
water resources strategy development. In order to create the Water IMC, the Prime Minister’s
Order is required to define its role, duties, organization, staff composition and other
amenities.
2.12.3 PLANNING FOR THE DEVELOPMENT OF WATER RESOURCES FOR ESSENTIAL AND
BENEFICIAL USE
According to IWRM concepts that are the foundation of the EC's Water Framework
Directive, the primary purpose of planning is to provide a “Plan as an instrument for making
decisions in order to influence the future. Planning is a systematic, integrative and iterative
process that is comprised of a number of steps executed over a specified time schedule.
Planning culminates when all the relevant information has been considered and a course of
action has been selected. The plan is then produced and implemented in order to achieve the
goals and objectives. Planning has the capacity to increase the legitimacy of decisions to be
taken by enabling open and wide dialogue between the public, interest groups and
authorities. It’s crucial for the legitimacy of a planning process to start dialogue as early as
the phases of problem defining and setting the agenda”20
. Awareness of the interests of those
concerned by the planning process is essential.
The diagram below indicates the institutional entities involved in planning for the
development of water resources for essential and beneficial use.
Recalling the meaning of the colors of the different entities the currently operational
planning, the white boxes are currently operational entities, the green ones are defined by law
(defined by law and ministerial order) but not yet operational, the yellow ones are identified
by law (no ministerial order for its definition) but not yet established, and the blue ones are
deemed necessary but not indicated in any legal text.
Currently the entities involved in planning are the MINIRENA/RNRA at central level which
liaises with other ministries at central level and with district governments and users at
decentralized level.
As has been duly demonstrated in the Exploratory Phase Report, the planning at central level
is very much sectoral with each ministry making its own plans without much knowledge on
the resource yet considering the presumably available water resource its exclusive asset.
20
European Commission Common Implementation Strategy for the Water Framework Directive 2000/60/EC,
Guidance n°11 – Planning Process, p12

Rwanda National Water Resources Master Plan Page 175
MINIRENA-RNRA OCTOBER 2015
At the district level the water resources planning function is being included in the District
Development Plans which are five year plans developed by each district. There are many
reasons why the water resources planning at district level is not working: planning period is
too short, planning area too small (any cohesive catchment in Rwanda covers at least three
districts), planning area dissected (no district in Rwanda is entirely located in a single
catchment, many districts are located in three or even more catchments), ....
In order to circumvent these difficulties there is need for an intermediate planning level at the
catchment. It is proposed that two new entities are formed at the catchment level:
the 'catchment committee'; this is a representative body of covered district authorities,
district technicians involved in matters related to water (water supply, sanitation,
health, business development, irrigation, etc.) and representatives of water users
(same listing) to debate the development (and exploitation) of the common resource.
This entity being a representative body, there is need for professional water managers
at district level:
the 'catchment water management office'; this is proposed to be a decentralized office
of the RNRA-IWRM division operational in each of the nine catchments. Their role is
to support the catchment committee, to develop a medium to long term catchment
development plan and to make sure that the water matters of each DDP are coherent
and realistic with respect to the DDPs of the further districts located in the catchment.
Figure 25: Main institutional entities involved in IWRM planning

Rwanda National Water Resources Master Plan Page 176
MINIRENA-RNRA OCTOBER 2015
The RNRA-IWRM should evolve to the lead coordinator in charge of an integrated planning
function at central level and, with its decentralized entities in each catchment, the 'Catchment
Water Management Offices', at the decentralized level. It has the lead role for the redaction of
the Catchment water management plans (see annex C4_4 for details). These plans are written
in cooperation with Sector and District Committees which are the decentralized
representatives of local governments and users (water local associations and private entities).
RNRA-IWRM will provide technical support to the Catchment, District and Sector
Committees as needed.
The Rwanda Water Authority may act as overseer and highest instance of these catchment
committees and monitor and coordinate their implementation and activities.
Public participation in planning is further possible by means of the National Water
Consultative Commission. This entity should be involved in all development actions that are
likely to have a major impact on natural resources, other water users and the society in
general. The NWCC should be involved in the decision process on any concession permit
(see section 2.12.4 for information on the types of water permits) and shall represent civil
society.
The NWCC should also be involved in the approval of the Catchment Water Management
Plans as and when they are developed by the RNRA-IWRM.
Further entities assuring public participation in planning of water resources and their use, are
the District and especially Sector Committees.
The role of the Ministry of Natural Resources (MINERENA) is mostly strategic and it should
be less involved in planning other than being the ministry in command of the RNRA-IWRM.
Details of the planning function of the main entities will be presented in the next paragraphs.
The entities discussed are:
RNRA-IWRM
the National Water Consultative Commission
the catchment water management offices
the catchment committees
the Rwanda Water Authority
the district committees
the sector committees
2.12.3.1 RNRA-IWRM AS COORDINATOR OF THE IWR PLANNING FUNCTION
Rwanda National Resources Authority (RNRA) is a young institutional body under the
Ministry of Natural Resources, created by law n°53 of 25/01/2011 establishing RNRA and
determining its missions, organization and functioning with the aim to manage natural
resources (land, water, forest, mines and geology).
The IWRM department was established later as part of the RNRA and started its mission in
October 2012. Consequently, the RNRA-IWRM is still at its infancy. The main issues that
seem to affect its mission are the situation of human resources, financial means, and lack of

Rwanda National Water Resources Master Plan Page 177
MINIRENA-RNRA OCTOBER 2015
recognition by civil society and governmental institutions. These aspects are briefly discussed
here below:
HUMAN RESOURCES:
The staffing schedule cum organization chart of the RNRA-IWRM is provided in annex
C4_1_1 to this report. On a total specialist list of 26 staff, 5 positions remain vacant i.e:
Director of Water Research, Monitoring and Quality management unit yet all of the
12 staff members of this unit have been recruited; (1 position vacant)
Director of Water Resources Planning and Regulation Unit; from the 5 staff members
of this unit have 4 have been recruited (Water Regulation officer position is still
vacant; (2 positions vacant)
For the Transboundary and International Water Affairs unit, the Director is recruited
but none of the two officers have been recruited (Regional Water Programme Officer,
and International Water Affairs Officer). It seems that the duties of the officers are
effectively fulfilled by the director of this unit. (2 positions vacant)
As regards human resources position of the RNRA-IWRM, the following comments can be
made:
the staffing of the RNRA-IWRM is nearing completion but is somewhat thin in the
higher echelons (two of the three unit directors have not been recruited).
it seems that staff members are insufficiently trained on their duties which are
insufficiently defined. It is the novelty of the work processes and the partial absence
of senior staff which hold back the precise formulation of the staff members duties
and the on the job training.
staff members that are not educated on environmental and water related issues are at a
loss for their actual duties; they mention that they should receive additional training
on the principal environmental and IWRM concepts.
the RNRA-IWRM does not have staff at decentralized level (other than contract staff
in charge of data observation of hydrological stations)
In order to redress these issues it is suggested that i) the staffing is completed, ii) staff duties
are finalized (see also annex C4_1_1 on RNRA-IWRM organization) and staff members
obtain on the job training, iii) non 'technical' staff receives additional training on technical
issues, and iv) the staffing schedule of the RNRA-IWRM is extended with field officers that
run the 'Catchment Water Management Offices' (ideally 2 specialist staff per CWMO).
FINANCIAL MEANS:
Currently, the RNRA-IWRM does not generate income from water resources management
(levee a fee for its services) but receives payment from government that is however not
directly granted to the IWRM department but to the RNRA. Financially, the IWRM
department is therefore not autonomous.
It tries to finance some of its activities through direct project activities with donors.
It is recommended that administrative, monitoring and inspection functions in future be
financed by water users. This requires a substantial accounting effort. It is likely that this
effort be shared between RNRA and MINECOFIN.

Rwanda National Water Resources Master Plan Page 178
MINIRENA-RNRA OCTOBER 2015
For services provided in the sphere of climate change and environment, RNRA-IWRM could
access funding from FONERWA (national climate change and environment fund) which
would likely be in cooperation with REMA.
INTERNATIONAL COOPERATION; AN OPPORTUNITY FOR CAPACITY BUILDING
At international level, Rwanda is included in two hydrographic basins: the Nile and Congo
River Basin. International projects for the development of shared water resources (trans-
boundary) are typically managed by an international cooperation platform (several ministries
of several nations with NBI, NELSAP, ABAKIR and or regional projects like LVEMP) and
implemented through the private sector for study, implementation and construction
supervision. These international development activities are inherently political, with
substantial economic, social and environmental implications requiring strong engagement of
diplomatic institutions.
RNRA-IWRM, through its Transboundary and International Water Affairs Unit and its Water
Resources Planning and Regulation Unit, has an important role to play in this international
cooperation.
As suggested by RNRA-IWRM officers, the Consultant endorses close cooperation on water
resources management with neighboring countries. Particularly the experience of Uganda
since 2004 with its Water Permit procedure (see section 2.12.4 on water resources
development and section 2.12.5 on water resources management), which is a novelty in
Rwanda, may be very valuable as it seems to work rather well.
Uganda is also implementing the decentralization of water resources management to regional
“Water Management Zones” and catchments through creation of Catchment Management
Organizations with effective participation of citizens and local governments.
Finally, it is especially for the Muvumba catchment that Rwandan and Ugandan water
resources are closely connected and international cooperation on planning and
implementation for its limited resources will be very beneficial to both countries
The two Ministries (Ministry of Natural Resources in Rwanda and Ministry of Water and
Environment in Uganda) and the two departments (the RNRA-IWRM department in Rwanda
and the DWRM in Uganda) could work towards this cooperation by means of study tours and
seminars.
THE LACK OF RECOGNITION OF THE RNRA-IWRM
The RNRA-IRWM is a young institution with insufficient recognition by the public and other
governmental entities. First, there is a lack of knowledge about the importance of water
resources management. This is a new concept in Rwanda and few people are aware of its
importance for the future. It is the role of the RNRA-IWRM to point out the need for a
rational water resources management plan, at national and catchment level and the essential
tools to the formulation and continued updating of this plan (based on resources monitoring
and analysis, permitted use interventions monitoring by the water users themselves, analysis,
demand projections and updated planning).
The function of the Water Users’ Capacity Building Officer is to reinforce Water Users’
capacities by supporting the creation of Local Water Users Associations, assisting them with
the identification of their water needs, the registration as a water user, the formulation of a

Rwanda National Water Resources Master Plan Page 179
MINIRENA-RNRA OCTOBER 2015
water permit and in general supporting their involvement in water resources planning,
implementation and exploitation of resources.
The availability of catchment Water Management Offices has the potential to bring the
mission of the RNRA-IWRM close to the water users.
It is recommended that a nationwide awareness campaign be implemented with the following
key elements:
the importance of integrated water resources management and the building blocks of
IWRM and the consequences of maintaining the current status quo (water resources
use is entirely unregulated
the role of water users in integrated water resources management
how to become a registered water user
how to acquire a water permit (for surface water abstraction, storage, or groundwater
abstraction)
the rights and obligations associated with a water permits
the interdependency between the EIA and the water permit
the role of the RNRA-IWRM department in integrated water resources management
the division of IWRM responsibilities between RNRA-IWRM and EWSA (a water
user), REMA (environmental agency in charge of environmental monitoring including
EIA compliancy), RDB (issuing EIAs), RURA (defining water quality standards)
Details on the water permit procedure and rationale are presented in appendix 10. The
campaign methods should be multiple: website, poster campaigns, national tv and radio
broadcasts, educational awareness in schools, etc.
THE RNRA-IWRM AND OTHER WATER RESOURCES PLANNERS
The water resources planning function essentially entails a repetitive cycle of monitoring of
resources, monitoring of interventions in the natural hydrological cycle (abstraction,
retention, disposal, other changes), analysis and interpretation of monitoring data, demand
projections and updated planning. Traditionally some of these functions have been performed
by other institutional entities and it is very clear that this leads to a variety of problems that
need to be recognized before they can be solved.
The required cooperation between RNRA-IWRM and some entities that are traditionally
involved in some aspect(s) of water resources planning will be discussed here below for:
MeteoRwanda
EWSA as a water supply and sanitation service provider
EWSA as an electrical power supply service provider
MINAGRI and its projects (LWH, RSSP, RARDA, etc.)
District governments
MeteoRwanda is in charge of rainwater monitoring. The MeteoRwanda website
(http://www.meteorwanda.gov.rw) informs as follows on its mission: to provide accurate,
timely weather and climate information and products for the general welfare of the Republic

Rwanda National Water Resources Master Plan Page 180
MINIRENA-RNRA OCTOBER 2015
of Rwanda. It has already been discussed in detail that the main issue is the timely transfer of
a selected set of rainfall data between MeteoRwanda and RNRA-IWRM; at least a monthly
transfer of up to date data. This may likely require that information transfer within
MeteoRwanda requires speeding up.
EWSA as a water supply and sanitation service provider is the company that provides
water in Rwanda and is considered as a national utility since 1976 (under the name
ELECTROGAZ). Nowadays, EWSA is a recognized institution, well-known by water
consumers and other governmental bodies.
EWSA generates potable water supply for urban areas as well as for rural areas. Recently,
EWSA has started the production of Water Supply Master Plans per catchment (the Akanyaru
and upper Nyabarongo catchment Water Supply Master Plans are the first two on their list)
which is a sound approach.
This approach should be based on resources assessment and demand projections for urban
population, rural population, and industrial and other uses. Obviously the resources
assessment is an issue for which RNRA-IWRM is responsible and EWSA demand
projections cannot include a comprehensive assessment of other uses, e.g. irrigation,
fisheries, mining, hydropower, energy, livestock, etc.
Within the context of this study, a series of nine 'catchment master plans' has been produced
which specifies renewable resources at catchment level and reasonable development per
demand category. These 'catchment master plan' provide a sound basis for a more potable
water supply oriented planning exercise at catchment level specifically searching for the most
efficient way of maintaining a satisfactory service level for potable water supply (and
sanitation) for a variety of domestic, industrial and administrative uses in rural and urban
areas of a catchment
In the perspective of RNRA-IWRM, EWSA is a water user and should apply for water user
registration and permit registration of all its production sites, as soon as RNRA-IWRM has
finalized these procedures (user registration and water permit registration).
EWSA as an electrical power supply service provider. The second mandate of EWSA is
the provision of electrical power to the general public. In as far as the power production is
generated with hydropower, geothermal power or heat exchange processes there is a
substantial water demand which has been considered in this study.
With respect to hydropower, this demand is based on the projects identified in the
hydropower atlas study. A batch of potential hydropower sites (20 large and 69 small sites) is
under study for delegation to private investors. This study is essentially based on a large
number of site investigations (about 320 sites investigated). However, for a comprehensive
assessment and optimization of hydropower potential by means of river based optimization of
in and outflow locations and stream flow regulation, a more comprehensive catchment based
study would be recommended. The study would be GIS based keeping track of inflow area
and river gradient while progressing downward followed by summary site inspections.
EWSA should apply for a water permit as any regular water user should do as soon as
RNRA-IWRM has finalized the user registration and water permit registration processes.
Minagri and its delegated projects are very active in the irrigation sector with numerous
projects of marshland development, dam construction and direct abstraction from river or
lake water resources. Minagri is continuously developing its expertise in these techniques. As
has been found during the preparation of this master plan study, it appears that these projects
are identified on a piece meal basis with limited or insufficient knowledge on the renewable

Rwanda National Water Resources Master Plan Page 181
MINIRENA-RNRA OCTOBER 2015
resource and without consideration for other water uses (even ignoring claims from other
uses within the ministry).
In order to correct this situation, the catchment master plan limits proposed in this study (e.g.
no direct abstraction for irrigation development in Akanyaru and Muvumba catchments)
should be followed by this ministry and its delegated projects. It may be recommended that
the RIMP study be updated with the findings of the current study; the potential irrigation area
(600.000+ ha) indicated is unrealistic at least as regards water resources availability.
Further, Minagri or any beneficiary formal water user organization should apply for a water
permit for any water resources development activity (marshland development, direct
abstraction from surface or groundwater, reservoir sites, etc.) and the works should not be
started prior to obtaining a permit from RNRA-IWRM.
The relation between district governments and the RNRA-IWRM is also somewhat
difficult. While RNRA-IWRM does not have any field officer (it seems that no field officers
are foreseen), it tries to obtain part of its information from water or environmental districts
officers. Generally these officers do not have specific experience in water management and
they work for the district (or sometimes for EWSA). Consequently, RNRA-IWRM cannot
fully rely on these officers to obtain information or to provide adequate service to water
users. It appears that the cooperation between district staff and REMA is far more effective.
This issue may improve substantially when RNRA-IWRM is represented at catchment level
by Catchment Water Management Offices who can engage in a more frequent and closer
cooperation with the district staff than the current head office staff. A further solution to the
problem is the implementation of the awareness campaign previously mentioned (this chapter
under the heading 'lack of recognition of the RNRA-IWRM'.
2.12.3.2 THE NATIONAL WATER CONSULTATIVE COMMISSION IN IWR PLANNING
Due to a lack of horizontal (cross sector) and vertical (national - local) planning, the planning
function is currently weak and conflicting. The National Water Consultative Commission,
foreseen by the Water Law (article 16) and the Prime Minister’s Order n°143/03 of
24/05/2013 determining the composition, organization and functioning of the NWCC, could
become a tool for improved planning. Moreover, the Commission may be one of the principal
tools contributing to the respect of the Integrated Water Resources Management theory and
the Aarhus convention21
, namely the public participation.
The main purpose of public participation is to improve decision-making, by ensuring that
decisions are soundly based on shared knowledge, experiences and scientific evidence, that
decisions are influenced by the views and experience of those affected by them, that
innovative and creative options are considered and that new arrangements are workable, and
acceptable to the public.
“Key potential benefits that can result from public participation are (which are not mutually
exclusive):
Increasing public awareness of environmental issues as well as the environmental
situation in the related river basin district and local catchment;
21 UNECE's “Convention on access to information, public participation in decision-making and access to
justice in environmental matters”, Aarhus, Denmark, on 25 June 1998.

Rwanda National Water Resources Master Plan Page 182
MINIRENA-RNRA OCTOBER 2015
Making use of knowledge, experience and initiatives of the different stakeholders and
thus improving the quality of plans, measures and river basin management;
Public acceptance, commitment and support with regard to decision taking processes;
More transparent and more creative decision making;
Less litigation, misunderstandings, fewer delays and more effective implementation;
Social learning and experience–if participation results in constructive dialogue with
all relevant parties involved then the various publics, government and experts can
learn from each other’s “water awareness”.”22
Through participation, long term, widely acceptable solutions for planning can be arrived at.
This can avoid potential conflicts, problems of management and costs in the long term. The
NWCC has the potential to be this tool at central level.
The mission, composition and functioning are presented below.
MISSION
In order to facilitate the RNRA-IWRM work and to reach a better cross-sector planning
function, the article 16 of the Water Law proposes the creation of the National Water
Consultative Commission. This organ should be consulted on the following matters:
“1° planning projects in the water domain elaborated to the national level or the large
hydrographic basin level and on the revision of these projects, in order to assure
quality standards and optimum use of available resources;
2° projects of water supply and water transfer from basin to basin, with national
character as well as in the large-scale projects of the same category of provincial
character;
3° any water related issue, in case the Minister deems it necessary.”
The National Water Consultative Commission shall be consulted for projects at the national-
and the hydrographic basin level (to be understood as either Nile or Congo basin) and should
review all projects envisaged across all sectors. Moreover, the NWCC may issue a statement
on decrees and orders regarding water field, either by the Government’s demand, or by its
own initiative. This institution may also give its opinion about catchment master plans and, in
case of authorization (sometimes) or concession (always), on the draft permit and on RNRA-
IWRM assessment. Its competencies extend on the whole natural and anthropogenic water
cycle.
COMPOSITION
The Prime Minister’s Order n°143/03 of 24/05/2013 determining the organization,
functioning and composition of the National Water Consultative Commission defines a
composition presented in annex C4_1_4) dominated by senior level civil servants with three
representatives for the private sector, knowledge institutes, and NGOs in as far as these are
related to water.
As a public participation tool, and following the recommendation of the article 16 of Water
Law, the National Water Consultative Commission could be reinforced with representatives
of decentralized government and representatives of various public and private water users.
22
European Commission Common Implementation Strategy for the Water Framework Directive 2000/60/EC,
Guidance n°8 – Public Participation in Relation to the Water Framework Directive, p14

Rwanda National Water Resources Master Plan Page 183
MINIRENA-RNRA OCTOBER 2015
Hence, the Commission should comprise members who represent industry, middle class,
farmers, workers, fishermen, consumers, environmental protection associations, cities and
villages, water and sanitation operators etc. A list of suggested members to be considered for
inclusion in the NWCC is presented in annex C4_1_4.
Mandates are personal and for a period of four years. The commission comprises a board
composed of the president, the secretary and a representative of each college. It organizes the
work of the Commission, ensures day to day management and handles the annual budget
allocated to this organ.
FUNCTIONING
According to the Prime Minister’s Order n°143/03, “the NWCC is a consultative organ
without legal personality and financial and administrative autonomy. It's recommendations
are not mandatory. The Commission's recommendations are implemented by the Ministry of
Natural Resources.
The Commission will be chaired by the Minister of Natural Resources; in case of his/her
absence, he/she shall be deputized by the Minister in charge of water supply (MININFRA).
The director of RNRA-IWRM shall act as the Secretary of the Consultative Commission. The
Office of the Prime Minister shall be the supervising Authority of the National Consultative
Commission at the national level. The commission shall meet once in six months and
whenever it is considered necessary. Decisions will be taken with absolute majority.”
2.12.3.3 THE CATCHMENT WATER MANAGEMENT OFFICES AND IWR PLANNING
Considering, that the preparation and formulation of the water management plan is entrusted
to District Committees in the Water Law, that the district domain is not appropriate for
elaborating an integrated water management plan, and given the Committee member’s skills,
it is the IWRM department of RNRA that has the real resources (information and know-how)
for elaborating and submitting water plan to the District Committees.
Inside the two hydrographic basins (Nile and Congo River basins), nine catchments were
defined. These catchments could be managed by decentralized branch offices of RNRA-
IWRM: the Catchment Water Management Offices (CWMO). Please note that these entities
are proposed by the consultant and that they are currently not foreseen by the law.
The goals and objectives of the CWMOs are to make more efficient and targeted the
management and the protection of water resources of the given basin in accordance to the
catchment master plan, the Water Law and the National Water Policies. To achieve these
aims, the CWMOs may fulfill the following functions (planning and other functions):
Based on the National Water Resources Masterplan and the Water Law, develop
catchment master plans by coordinating sector and public interests into development
of those plans;
Implement catchment master plans in coordination with the Catchment, District and
Sector Committees;
Develop draft prospective/long-term projects for management, use and protection of
water resources of the catchment based on the peculiarities and problems of the
catchment;
Serve as a link between the RNRA-IWRM, the Catchment Committees and the

Rwanda National Water Resources Master Plan Page 184
MINIRENA-RNRA OCTOBER 2015
community served by the Catchment;
Support waters users during the water permit procedure and intervene on the field to
investigate the local situation (for complex cases) or for information purposes;
CWMOs could express their approval or concern about the application and the
corresponding RNRA-IWRM assessment;
Receive complains and solve issues raised by communities concerning water
resources management and protection at local level;
Control water extraction records, reliability of water metering devices according to the
water permit specifications, as well as the water protection zones;
o Control and ensure that water use does not exceed limits allowed by water
permits and submit a report on that to RNRA-IWRM;
o Periodically conduct qualitative and quantitative control analysis of water and
wastewaters discharged into water catchment by means of specialized
laboratories (controlled by REMA);
o Submit report on the conducted works to RNRA-IWRM.
These branch offices would optimize the RNRA-IWRM functioning. The major interest of
these decentralized offices is to accommodate the relation between central administration,
decentralized committees and water users in a proper water management domain.
Considering the limited financial resources, the number of branch offices and their functions
could at first be developed for highly committed and vulnerable catchments (for instance,
Muvumba, Akanyaru catchment).
The Consultant suggests that these CWMOs being composed of at least two officers (see
annex C4_1_5 for tentative job description of these officers):
A planning and monitoring officer (profile: environmental engineer or public
administration degree with experience in the Water Sector and Water Users’ Capacity
Building)
A, hydrologist (profile: technician with a hydrology degree and a strong field
experience in Water Sector)
These two officers may be supported by one or two permanent staff as a driver and/or office
manager. They may have their own office or be accommodated government offices at a
suitable urban center within the catchment.
2.12.3.4 THE CATCHMENT COMMITTEES AND IWR PLANNING
The creation of Catchment Committees at the level of the nine catchment is highly
recommended because the territorial division of the 30 districts does not overlap with the nine
catchments whereas a territorial coherence is mandatory for elaborating and implementing an
integrated water resources management plan per catchment. Please note that these entities are
proposed by the consultant and that they are currently not foreseen by the law.
The aim is to create a platform for catchment wide planning and water management by all
districts and sections comprising a catchment area. These CCs are « Inter-district
committees », comprising representatives of district committees and representatives from
civil society, in order to allow a public consultation on the Catchment master plan.

Rwanda National Water Resources Master Plan Page 185
MINIRENA-RNRA OCTOBER 2015
These Inter-district committees could be formed by representatives located in the concerned
catchment area with a college of representative of district authorities and representatives of
civil society.
A detailed list of suggested representatives of the CC is given in annex C4_1_6.
The President of the CC should be elected by all the members of the CC, among the
Presidents of all the District committees located in the concerned Catchment area for a short
duration (for instance one year).
The principal function of these CCs is to be a platform for an inter-district dialogue regarding
the elaboration of the Catchment master plan and management issues that may arise. CCs
should only have an advisory role on the elaboration of the Catchment master plans and
follow-up its implementation.
The Catchment Committee is assisted by an Executive Secretary with following activities:
Responsible current management of catchment affairs;
Coordinates planning and implementation activities;
Supports staff's work within the execution of all their activities;
Reports CCs meetings and submits a copy the MINIRENA, the RNRA-IWRM, the
CMWOs located in the concerned Catchment area and the District Committees
located in the concerned Catchment area
This Executive Secretary is nominated among the persons in charge of environment/water of
all the districts located in the Catchment area. CCs may seek advice from experts depending
on certain items on the agenda; notably the experts of the Catchment Water Management
Office, the branch office of RNRA-IWRM.
2.12.3.5 THE RWANDA WATER AUTHORITY AND IWR PLANNING
The Rwanda Water Authority is identified in the Water Law but not yet defined by a
ministerial order.
As the Rwanda Water Authority is already enshrined by the Water Law at the article 17 but
without specific missions, the consultant proposes its creation as Arbitrator to Conflict
resolution for administration cases and Catchments Committees Coordinator.
Further details on this authority are presented in annex C4_1_3.
2.12.3.6 THE DISTRICT COMMITTEES AND IWR PLANNING
In order to clarify and simplify water resources management at decentralized level, the Water
Law, in its article 20, defines the District Committees for hydrographic basins.
MISSION OF THE DISTRICT COMMITTEES
The Water Law defines the missions of District Committees for hydrographic basins (art.21):
1. to propose the initial version of the master plan and management of the basin waters
as provided for in this Law;

Rwanda National Water Resources Master Plan Page 186
MINIRENA-RNRA OCTOBER 2015
2. to propose the delimitation, if necessary, of under-basins and the designation of the
aquifer for which an integrated management of the water resource must be done;
3. to formulate orientations and proposals concerning the planning and management of
the waters of under-basins or aquifer;
4. to formulate propositions of arbitration or solution in case of conflict of water uses;
5. to formulate opinions on all technical or financial questions that is submitted to it by
the administration.
6. to value the relevance and the feasibility of basin organisms, to prepare their
installation in the event that it would be judged necessary.
Please note that District Committees are consultative: they can “propose” or “formulate”
orientations on the water management. The development of a master plan for the integrated
management of water resources at district level is essentially impossible at this level because
it does not overlap the hydrographic basin. A single district may exceptionally be located
within a single hydrographic basin, but most of districts are divided between at least two if
not three or more hydrographic basins. Further a single hydrographic basin will comprise a
number of districts (typically 5 to 10 districts to form a single hydrographic basin). A map
showing the overlap between level 1 catchments and the districts is presented in annex C4_5
Hence, in practice, the district should not be commissioned to produce a basin water
management plan because it has inappropriate territorial boundaries for that task. All districts
with territory in a specific catchment should however be implicated in the formulation and
implementation of the catchment master plan. The realization of the plan can be assigned to
the RNRA-IWRM and the Catchment Water Management Offices.
COMPOSITION AND FUNCTIONING OF THE DISTRICT COMMITTEES
According to Ministerial Order nº005/16.01 of 24/05/2013 determining the organization and
functioning of hydrographic basin committees, the hydrographic basin committee at district
level shall be composed of by different actors of civil society and district officers (see annex
C4_1_7 for details on the composition of District committees.
We suggest that the composition of the District Committee may be reconsidered because of
its essentially advisory role:
the presence of representatives of the central administration relating to water does not
need to be mandatory.
the representative of the administration may forego their right of vote (i.e., “the staff
in charge of agriculture, animal resources, land, urbanization, urban development,
infrastructure forests, environment at the District level” and “the staff of the National
Authority in charge of Natural Resources operating at the level of the hydrographic
basin”); the rights of vote would be granted to the:
On the contrary, it is suggested that the right of vote be delegated to:
Representatives of the elected members at the decentralized level: “representatives of
committees for hydrographic basins at Sector level”
Representatives of the different water users organizations: “representative of National
Women Council at District level”, “a representative of the National Youth Council at
the District level”, “ two (2) representatives of farmers at District level”, “a
representative of water user organizations in the field of agriculture at District level”,
“a representative of water users in domestic activities at the District level”, “two (2)

Rwanda National Water Resources Master Plan Page 187
MINIRENA-RNRA OCTOBER 2015
representatives of non-government organizations operating in the field of water in the
District” and “a representative of the Private Sector at the District level”.
The President would be elected by the representatives of these two groups. Representatives
from the administration may participate as observers and advisors.
As the Ministerial Order n°005/16.01 of 24/05/2013 determining the organization, and
functioning of hydrographic basin committees declares: “the representatives of different
organs shall be nominated and made available by the respective organs that they represent.
The Mayor of the District shall convene the first meeting of the hydrographic basin
Committee at District level in which management members shall be elected. The officer in
charge of water resources (if he/she exists) or environmental affairs shall be the Secretary of
the Committee. The meetings of district committees are held once per quarter and whenever
it is considered necessary. The President shall convene the meeting in writing, through the
Mayor of the District. Invitations shall reach the Committee members at least fifteen (15)
days before the meeting is held. The invitation must indicate the items on the agenda of the
meeting. An extraordinary meeting shall be convened whenever it is considered necessary.
All meetings of the District Committee shall be reported. The reports shall be submitted to
the hydrographic basin committee at a higher level in a period not exceeding fifteen (15) days
after the meeting is held. The President of the hydrographic basin Committee at the District
level shall submit the report to the Mayor of the District who further shall submit it to the
Minister in charge of water resources in a period of fifteen (15) days after the reception of the
report. Members of the District Committees shall operate on a voluntary basis. ”
District Committees may seek advice from experts depending on certain items on the agenda;
notably the experts of the Catchment Water Management Office, the decentralized entity of
RNRA-IWRM at level of catchment.
2.12.3.7 THE SECTOR COMMITTEES AND IWR PLANNING
The mission of the sector committees is rather similar to the mission of the district
committees. At sector level, basin committees could exist “where it is deemed necessary”
(art.22 of the Water Law). They may take place occasionally for dealing with particular cases
and for a limited period of time. According to the Water Law (art.23), responsibilities of
committees at sector level are the following:
1. to propose the initial version of the local master plan;
2. to fix management procedures for the under-basin waters or the aquifer, provided for
under this Law;
3. to formulate at its level propositions and opinions
In this respect, the 'local master plan' should be understood in two stages. Prior to the
formulation of the catchment Master Plan, the local Master Plan is a valuable contribution
with specific local know-how but cannot in the wider context of the catchment be more than a
'wish list' of required development actions (primary use - water supply) and inactions
(primary use - environmental restrictions) as well as of development opportunities (demand
for commercial ventures - irrigation, hydropower, industries, etc.).
The second stage is after the formulation of the catchment master plan when the local 'wish
list' options have been analyzed and optimized in the larger context of the catchment and
these options upgrade to development actions with defined location, capacity, timing and
entity in charge of implementation and exploitation.
Rwanda National Water Resources Master Plan Page 188
MINIRENA-RNRA OCTOBER 2015
Details on the organization and functioning of the Sector Committee are provided in annex
C4_1_8
2.12.4 IMPLEMENTATION OF RESOURCES DEVELOPMENT WORKS
2.12.4.1 INTRODUCTION
The diagram below highlights the main actors involved in the water resources
implementation function.
All water resources development activities require a permit. The permit can be applied for
through the Water MIS. An aspiring water user first has to register to become a 'registered
Water User (RWU). Only registered Water Users can apply for a water permit.
Water users can get help from district officers in charge of water and, in the future, by the
Catchment Water Management Offices.
For large projects, the draft permit and the RNRA-IWRM assessment have to be submitted to
the National Water Consultative Commission which could revise this document and give its
approval or opposition, and/ or comment it.
For projects expected to have significant impact on the environment or other water users, an
Environmental Impact Assessment (EIA) is needed which the aspiring water user may obtain
with the RDB. REMA is in charge of the compliance monitoring of the EIA. Where the EIA
study requires the level of intervention in the natural hydrological cycle to be known, the
hydrological assessment needs to be completed prior to the EIA study.

Rwanda National Water Resources Master Plan Page 189
MINIRENA-RNRA OCTOBER 2015
Figure 26: Main institutional entities involved in water resources development
2.12.4.2 THE WATER PERMIT APPLICATION PROCEDURE
The Water Law specifies three different regimes of water permits. The declaration regime,
intended for interventions that are unlikely to have a major impact on the natural hydrological
cycle or on other water uses. The authorization, intended for intervention that have significant
impact on the natural hydrological cycle or on other water uses. The concession regime,
intended for interventions that are expected to have major impact on the natural hydrological.
Further, in order to structure the possible interventions in the natural hydrological cycle, a
classification of 5 types of permits is suggested: abstraction of surface water from a water
course, river or lake; retention of surface water in a reservoir for later user; abstraction of
groundwater from an aquifer; release of used water in the natural hydrological cycle and
miscellaneous interventions.
During its lifetime, a water permit has three distinct stages, involving different actors and
institutions: i) the application , ii) the operation and finally ii) the closure. In this chapter on
resources development for use, we will discuss the water permit application procedure and
the actors' involvement. An detailed write up of the permit procedure suggested by the
consultant is presented in appendix 10 to this main report.
The application will start at the level of users: the water user aims to develop some water
related activity with the objectives to sustain livelihood and/or pursue a commercial venture;
he has rights and obligation, given the fact that the water permit is a written agreement
between himself and the Rwandan government.

Rwanda National Water Resources Master Plan Page 190
MINIRENA-RNRA OCTOBER 2015
To start a permit procedure, he must first register himself on-line as a “water user” with a
unique ID according to his nature (NGO, WLA, company...). In this process, the District staff
(or, in the future, the 'Catchment Water Management Office') could intervene in order to help
the user23
. After this stage, he should register for a water permit, entering all data through the
Water MIS (ID, type of intervention, location, type of permit regime…). At this level, the
water user should receive the help of a district/sector/catchment water management officer to
fulfill the application without mistakes.
For the next step, the permit is processed mostly at central level where RNRA-IWRM will
intervene when the permit application has been entered in the Water MIS by means of a
completeness check and a hydrological viability check. The RNRA-IWRM is committed to
send a copy of its assessment to the water user within 20 working days.
With the creation of the “Water Permit System”, in case of an authorization or a concession,
an EIA is required to obtain the water permit, “showing the quantity of water which will be
used compared to its overall quantity” (art. 37 and 38 of the Water Law) and insuring that
licensed investment comply with the Country’s environmental laws. The EIA is “a
systematic, reproducible and multilevel process of identification, prediction and analysis of
significant environmental impacts (positive or negative) of a proposed project or activity and
its practical alternatives on the physical, biological, cultural and socio-economic
characteristics of a particular geographic area in order to provide information necessary for
enhancing decision making”24
. According to RNRA-IWRM Water Permit staff, the demand
for an EIA has to come from the applicant himself. The user has to go to the RDB with his
project brief. After a field inspection by this institution, the dossier is submitted to a REMA
registered consultant who products a report and a positive or negative opinion on the project.
RDB could comment this recommendation and deliver the certificate; a copy is directly sent
to REMA. When projects concern RNRA competencies (mines, water…), a copy is sent to
this institution also.
The workflow between RDB and RNRA-IWRM officers is not yet established as the water
permit system is still not known by RDB officers. Moreover, the user has to go himself to
RDB and after recuperating the certificate, he has to come back to RNRA-IWRM with his
EIA. To improve this situation, the Consultant recommends the redaction of a memorandum
between these two institutions in order to formalize the workflow. Further, RNRA-IWRM
may proceed with the accreditation of suitable consultants for the assessment of water
permits.
If the water user does not agree with the permit assessment of the RNRA-IWRM, he shall
have the right to bring his case to a competent court or to the Rwanda Water Authority.
Without any opposition of the water user or the RDB/REMA, RNRA-IWRM will send off its
assessment to the CWMO and/or the District for information purposes. Without negative
opinion, and in the case of authorization (sometimes) or concession (always), the draft permit
and the RNRA-IWRM assessment will be submitted to the National Water Consultative
Commission, which could revise these documents.
23 This help could be located in a « one-stop center » at each district; the population is used to
this platform, already used for land issues or water supply problems.
24 REMA, General Guidelines and Procedure for Environmental Impact Assessment ,
2006, p.1

Rwanda National Water Resources Master Plan Page 191
MINIRENA-RNRA OCTOBER 2015
When the permit application process has been finally concluded, the draft permit will be
printed in two originals and submitted to the water user for signature. Then, the two originals
will be send to the Minister of Natural Resources for signature and send to water user and
RNRA-IRWM (stored in the Water MIS).
2.12.5 EXPLOITATION OF RESOURCES DEVELOPMENT WORKS
2.12.5.1 INTRODUCTION
The diagram below highlights the institutional entities involved in the exploitation of
resources development works. Exploitation is by many users as EWSA, water local
associations and cooperatives of farmers. The control of exploitation is done within the
permit granted by MINIRENA with the technical support of the RNRA-IWRM and its
decentralized entities at the Catchment level, CWMOs.
In this section, the Consultant elaborates some propositions for the resolution of disputes on
water resources use and permit exploitation. While the first step is between users themselves,
the conflict could be submitted at superior levels: first the sector, than to the district
government authority with the district environment officer, then at the Catchment level with
CWMO’s and Catchment Committees. If at this stage, a solution is not found, it can be dealt
with by the Rwanda Water Authority with technical support from the RNRA-IWRM.
Figure 27: Main institutional entities involved in water resources exploitation

Rwanda National Water Resources Master Plan Page 192
MINIRENA-RNRA OCTOBER 2015
2.12.5.2 WATER RESOURCES EXPLOITATION AND CONFLICT RESOLUTION
During the exploitation of a permit, it is needed to monitor if the actual operation more or less
complies with the permitted operations. When there is abundance of resources the
consequences of a deviation between actual and permitted operations does not interfere with
exploitations elsewhere and reasonable deviations can be condoned. What shouldn't be
allowed under any circumstance however, is that the water user deliberately provides wrong
information on the actual abstractions. In the case of higher committed areas, all water users
should comply quite strictly with the stipulations in their permits. In the case of conflict there
are may be four levels of resolution identified as follows:
WATER MANAGEMENT AND CONFLICT RESOLUTION AT THE USER LEVEL (LEVEL 1)
The Water User has rights but also obligations: the permit holder should be explicitly aware
that he has an obligation to provide correct information on his interventions in a timely
manner as specified in the permit (water use data).
The first level of conflict resolution constitutes the negotiation: involved parties meet to reach
a mutually acceptable solution. This solution does not imply participation of a third party,
only the involved parties and their representatives participate. They present proposals to
reach an agreement, in a private process. Indeed, it does not have a legal character; the
decision is taken by the parts. Consequently, it is not compulsory to follow the found
solution. This process involves only users who are in conflict
It is recommended that the operation conditions of all permits in a catchment are accessible to
all Water Users that operate permits in a catchment: other water users/operators are a source
of information on non-compliant operation of neighboring permits. This approach should
however not lead to autonomous actions other than negotiations between permit holders.
WATER MANAGEMENT AND CONFLICT RESOLUTION BY THE LOCAL AUTHORITIES (LEVEL 2)
The second level involves the implication of the local authorities when the two belligerent
parties are unable to find common ground. In this case, the Water/Environmental District
Officer may occupy the position of facilitator. He/she will have several obligations during
this process. The officer will assist in meeting design and help keep the meeting on track.
He/she will clarify and accept communication from parties and frame a problem
constructively based on the permitted interventions and the available resources. His/her
principle role will be to suggest procedures for achieving agreement and summarise direction.
However, the Water/Environmental officer must not judge or criticize; he/she will not push
his/her own ideas.
WATER MANAGEMENT AND CONFLICT RESOLUTION BY CATCHMENT WATER MANAGEMENT
OFFICES (LEVEL 3)
If the conflict cannot be solved by the local authorities, the next step is to try to find a
solution by the Catchment Water Management Offices; the mediation may take the form of a
specialized investigation where the catchment water management officer formulates an
opinion if needed with support from RNRA-IWRM. For conflict resolution it is however
required that both water users accept the opinion of the catchment water management offices.
If such is not the case, the last resort is the Rwanda Water Authority.
CONFLICT RESOLUTION BY THE RWANDA WATER AUTHORITY (LEVEL 4)
If a conflict does not find a solution at the preceding three levels, it can be brought to the
Rwanda Water Authority. This entity should make a full fledged investigation on the issue,
typically involving the RNRA-IWRM on technical matters and local government on local

Rwanda National Water Resources Master Plan Page 193
MINIRENA-RNRA OCTOBER 2015
matters. The Rwanda Water Authority has decision power on issues of water resources
management.
2.12.5.3 WATER RESOURCES EXPLOITATION AND EXTREME CONDITIONS
In the case of extreme drought or other circumstances (drought, flood, other calamities), the
Minister in charge of water (MINIRENA) has the responsibility to declare an emergency
situation in order to safeguard livelihood of the general public and the natural resources
including water resources and the environment.
Consequently, the permit holder should be aware that the conditions of his/her permit can be
adjusted in case of extreme conditions (when a water stress situation is declared for a specific
duration for instance), erroneous issuance of a permit or improper exploitation of this and/or
other permits
2.12.6 MONITORING OF USE INTERVENTIONS
Considering the multitude of interventions, it is not possible for government to keep track of
water use. It is for this reason that the monitoring of use should be delegated to the user with
an occasional control by a government entity which has the possibility to warn and ultimately
apply a penalty in the case of inappropriate use. In this section, the Consultant will present
the institutional functioning for monitoring water use data. As suggested above, water users
are the major actors in this process, supported by water/environment district officers who will
help them with data collection if needed. This function of the district agents could be taken
over by Catchment Water Management officers, when this new entity becomes available in a
catchment. Their mission is to collect (with users), interpret and analyze at the first step the
data. Through the Water MIS, RNRA-IWRM will have to analyze this information, verify the
collective water use data against water resources monitoring. If needed, this department will
send a feedback to user and make occasional verification of correctness of information.
The entities involved in this function are indicated in the diagram below.

Rwanda National Water Resources Master Plan Page 194
MINIRENA-RNRA OCTOBER 2015
Figure 28: Main institutional entities involved in water use monitoring
2.12.6.1 IMPROVING THE CURRENT SITUATION
Even with the current limited water use, there is a multitude of water users which are
intervening as they please wherever they please: EWSA, Local Water Users associations,
farmers’ cooperatives, etc. Currently, the RNRA-IWRM monitors some use interventions and
some users do monitor their own interventions but for the sole purpose of their internal
management procedures (EWSA water supply for instance) and this information is not
relayed to the RNRA-IWRM. There is an enormous amount of information which can be
obtained if the proper monitoring of data is done by users themselves through the Water MIS,
controlled by the RNRA-IWRM and decentralized offices.
In monitoring of water use for the purpose of potable water supply, EWSA is responsible for
monitoring of water supply installations and their operation. To this effect EWSA operates a
large database of water abstraction, production and network expansion, spanning several
decades. It is obvious that the RNRA, which should keep track of the balance between
available water resources and demand, is not informed on the actual use of the resource for
purposes of drinking water supply. In order to correct this situation, EWSA should obtain
water permits for its abstractions from ground and surface water resources for all piped water
supply systems, and it should provide information on actual abstractions at e.g. a monthly
interval for each of these systems.

Rwanda National Water Resources Master Plan Page 195
MINIRENA-RNRA OCTOBER 2015
For the monitoring of environmental demand, the main problem is the lack of knowledge on
need and impact of environmental flow. Currently, RNRA-IWRM monitors the surface water
resource at the major rivers and has the task to monitor underground water also. But this
function should address water quantity and quality parameters and be extended onto these
critical watersheds and wetlands. The issuance of authorizations and concessions by RNRA-
IWRM is currently not operational and not based on an assessment of available resources,
current use of those resources (for other than environmental demand) and projected demand
(for other than environmental purposes).
Monitoring of industrial water use currently falls under the responsibility of EWSA which is
normally based on monthly meter readings whereas monitoring of mining use is mostly the
responsibility of the miner himself. This information is available but is not transferred to
RNRA. For reasons of demand projection, it would however be useful if RNRA-IWRM
could access such information. But for the time being, RNRA-IWRM does not seem to have
the capacity to manage and analyze such information. The practical implementation of the
water and environmental laws is required (permits for water abstraction and waste water
disposal, improved communication with RNRA-IWRM, decentralized water management,
compliance with EIA, etc.).
For the monitoring of agricultural use, the example of irrigation projects shows the
importance of communication between users and the RNRA-IWRM. All irrigation projects
should be declared (RWH pond irrigation, marshland rehabilitation, development of dam,
abstraction from natural lake of river, abstraction from groundwater, and reuse of water from
other sources (e.g. urban waste water,...)) prior to implementation which only should take
place whence a permit is issued by RNRA-IWRM. Hence, as for other uses, the responsibility
for the monitoring of water use and its communication to RNRA-IWRM, should be delegated
to users. In this case, it means the private user or in most cases the cooperative managing the
irrigation infrastructure. The WUA may be delegated to provide such information.
2.12.6.2 WORKLOAD OF WATER USE MONITORING
It will be the responsibility of water users themselves to complete and update their data
through the Water MIS. The information elements to be collected at the frequency specified
in the permit (as the case maybe from annual to monthly) are:
Water users ID and permit ID (all permits)
Start-and end date of the exploitation period (all permits)
Realized volume of abstraction (flow and groundwater permit) or retention (storage
permit) (only for authorization and concession permits)
Operational status of the installations (all permits)
Update on water use (all permits)
Change of contact details of the owner (all permits)
Change of operator or contact details of the operator (all permits)
Realized return flow quantity, flow rate, calendar and water quality (for authorization
and concession permits)

Rwanda National Water Resources Master Plan Page 196
MINIRENA-RNRA OCTOBER 2015
Status of protection and mitigation measures and their impact (for authorization and
concession permits only)
Payments modalities (if any) of the permit
The data is collected directly in the Water MIS either by the water user or with the assistance
from district staff or with the assistance from staff from the CMWO or directly from the
RNRA-IWRM.
The RNRA-IWRM should collect, control, storage, analyze, interpret and update the water
use data provided by the water users. The principal aim of this information is to see that
permits are exploited within the framework of their specifications.
The first step at the RNRA-IWRM office is the storage of these data in the data base/Water
MIS, analysis of these collective water use data and then interpretation of collective water use
data and verification against water resources monitoring. The storage should be made by the
two Water Data and Information Management officers who have a technical competency for
that. After the storage, the analysis and interpretation of these collective water use data
should be made both by the Water Data and Information Management system unit (two
officers) and the Water Permit administration (two officers), who should have the
responsibility to verify against the permit data and information done by users. Water Permit
administration officers are the competent officers to know the Water Permit Procedure and
there are responsible, at the central level, to know what is asking from the water users.
After the storage and analysis of this information, the second step for the RNRA-IWRM is to
check the quality control of these permit data and update it. The RNRA-IWRM should use
the Water MIS as a communication and information collection platform and control the
updates on the operational status of the declaration permits and more detailed and frequent
update on the status of authorization and concession permits.
The RNRA-IWRM may verify the correctness of the information entered in the Water MIS
and may demand assistance from the CMWO staff. When the actual water use deviates
significantly from the permitted quantity, the owner may be contacted directly (or via the
CMWO) in order to investigate this anomaly and, when needed and possible, take actions to
prevent a recurrence. The return flows are compared with the abstracted volume, the water
use, and the permitted return flows (in terms of quantity, calendar and water quality).
Even if he does not intervene in the monitoring of use, the Water Use Planning officer is
responsible for the training of stakeholders. Consequently, he should also explain to the water
users, through meetings with them on the field, the Water MIS concept and its importance for
the IWRM.
The Consultant suggests a training of the full RNRA-IWRM’s staff about the utilization of
the Water MIS. For the monitoring of use interventions, the concerned staff (mentioned
above) should know how to use the Water MIS (from the storage to the analysis) but should
also know how to explain it to water users. Currently, the Water MIS is only used by Water
Resource Monitoring officers. As the RNRA-IWRM works as a team, the Consultant
suggests an internal training which could be made by the Water Resources Monitoring
officers (four officers) to the whole staff. If necessary, they could request specific assistance
from the Consultant’s staff.

Rwanda National Water Resources Master Plan Page 197
MINIRENA-RNRA OCTOBER 2015
2.12.7 CLOSURE OF PERMIT FOR INTERVENTION IN NATURAL HYDROLOGICAL CYCLE
In the diagram below, we present the actors who intervene during the closure of a water
permit.
Figure 29: Main institutional entities involved in the closure of a water permit
2.12.7.1 MODALITIES FOR CLOSURE OR CONTINUATION OF A WATER PERMIT
The closure of a water permit may be called for under one of the following situation, linked
to its expiration of duration and choices of the actors:
The permit duration is expired and the Registered Water User (RWU) does not
request an extension of the permit duration
The permit duration is not expired but the RWU has no interest in the further
exploitation
The permit is not yet expired but the RNRA-IWRM aspires to put an end to or
substantially reduce the intervention
The closure of the permit could further be decided as a result of an inappropriate exploitation
by the user, verified on the ground by the CMWOs and requested by the RNRA-IWRM and
decided by the RWA.
The closure may also be the consequence of an erroneous assessment from the RNRA-IWRM
or CMWOs (including erroneous field observations). In this case, the permit is temporary

Rwanda National Water Resources Master Plan Page 198
MINIRENA-RNRA OCTOBER 2015
closed for further investigations, and compensation payment may be due to the disadvantaged
user (case to be decided by the RWA).
However, before the expiration of the duration of the permit, there are different situations,
linked to the needs of the RWU or the catchment situation, in order to continue the permit
operation:
If the RWU wishes to continue operating the installations under the same conditions,
the RWU must request such extension prior to the expiration of the permit lifetime
If the water resources in a catchment are moderately exploited there is not much
benefit in the closure of permit so the continuation of the permit under the same
conditions can be routinely approved. More or less standard approval of continuation
of permit exploitation is also suggested for all declaration permits under all
conditions. The duration of the new permit can be negotiated with the RWU.
When it is desirable that a permit (authorization or concession) be continued, even when
unaltered or slightly altered, it is suggested that a new permit application procedure is started.
This has advantages for keeping track of permitted use levels over time.
For the continuation of the permits there are particular situations for flow permits and
groundwater permits in highly committed catchments and aquifers:
For the flow permits operated by commercial entities that wish to continue their operations in
highly committed catchments, the RWU may look for alternative modes of water abstraction
(e.g. daily or intra seasonal storage) or reductions of water demand through process
improvements, water reuse options, etc.
For large capacity groundwater abstraction permits operated by commercial entities in highly
committed aquifers, it is recommended that the “waiting list” of the aquifer is checked for
primary use operations. When no such operations are recorded the permit may be continued
under new conditions and for a limited period of time (not exceeding 5 years). If this time
period is insufficient for a viable commercial exploitation, alternative water resources may be
investigated by the RNRA-IWRM in cooperation with REMA and RDB, or the permit may
be given for a longer time period.
2.12.7.2 ACTORS INVOLVED IN THE CLOSURE OF A WATER PERMIT
In the case of the closure of a permit, the water user will have to proceed as follows:
Inform the RNRA-IWRM on his registered water user ID and the permit ID that will
be closed
The water user must realize any corrective measure for the closure of the permit that
was defined upon the opening of the permit unless modified by the next point.
Discuss any corrective measures that the user proposes for the closure (demobilization
of equipment…) with the RNRA-IWRM or the CWMO officer. Likewise, the RNRA-
IWRM or the CWMO officer in its place, could propose in its turn necessary
corrective measures; however, if the user does not agree, he could request a revision
at RWA. When a final decision has been reached, the user must implement them to a
satisfying standard to the opinion of the RNRA-IWRM; if he/she fails, RNRA-IWRM
may take to implement these works at the cost of the water user.
Rwanda National Water Resources Master Plan Page 199
MINIRENA-RNRA OCTOBER 2015
Any outstanding payment of registration fees and the like must be paid by the RWU.
When the permit is closed before its expiration by RNRA-IWRM, there should be a
possibility for the user to oppose the discontinuation of the permit and the proposed
compensation payments. As an administration could not arbitrate litigation between
another administration and a user, this case could be deal with the Rwanda Water
Authority (RWA) or a competent court if this new organ is not created.
The closure of the permit may happen when the permit is not yet expired but the RNRA-
IWRM aspires to put an end to or substantially reduce the permitted intervention; the
premature permit closure will be ground for compensation payments from the Government of
Rwanda.
When the permit will not be continued, the RNRA-IWRM needs to analyze the data record of
the permit (for the installed intervention equipment for abstraction and return flow, operation
procedure, abstracted or stored volumes, return flow quantities and water quality, corrective
and mitigation measures during operation, compliance of permit duration and payment of due
fees…); it may proceed with a field visit, sometimes in association with REMA and RDB
officers, to assess the current status of the intervention equipment and to estimate the impact
from this equipment.
The RNRA-IWRM needs to estimate the impact of the closure of the permit on the
hydrological situation in the catchment. The correct closure of the permit is finally registered
in the Water MIS and kept for record.
2.13 TRANSITIONAL MECHANISM FOR ESSENTIAL CATCHMENT WATER MANAGEMENT SERVICES
WITH DISTRICT TERRITORIAL AUTHORITY PRESERVED
2.13.1 INTRODUCTION
An institutional framework for IWRM compliant water management has been proposed in the
preceding section 2.12. This framework is largely inspired by the 2008 Water Act which
provides adequate guidelines for such IWRM compliant water management.
However, the guidelines defined in the Water Act do not provide for water management
services at the catchment level. Where these services were found to be essential for IWRM,
they are duly proposed in the institutional study under the format of (i) a catchment
committee (a representative body where government administration and water user
representatives from the districts that make up the catchment, can debate and ultimately
decide upon water resources planning, - implementation and - exploitation issues at the
catchment level), and (ii) a 'Catchment Water Management Office' that generates water
management knowhow and advises representative bodies and water users in general on all
matters pertaining to water management (planning, resources protection, intervention permits,
resources development, resources exploitation, and monitoring of natural resources and
interventions in the natural hydrological cycle).
Whereas the notion of catchment based water management is fully supported, the
introduction of a catchment based water management level does not fit easily with the
established modus operandi of decentralized government which operates above all through
the districts as the custodians of land and water resources and as executives of financial
processes for government interventions (project development and resources protection).

Rwanda National Water Resources Master Plan Page 200
MINIRENA-RNRA OCTOBER 2015
The implementation of a new layer of government superimposed on the district layer is
obviously uncalled for and does not conform with the government intentions to provide
effective services through a 'lean government' concept.
The purpose of this section is therefore to describe a minimal yet adequate institutional set up
that abides by the command of the districts over their domain yet allows for the smooth
integration and consideration of catchment based water management necessities in such
command.
Prior to the proposition of such a structure in paragraph 2.13.5, we will briefly delve into the
need for catchment based water management services in paragraph 2.13.2, into the current
status of catchment based water management provisions (paragraph 2.13.3) and suggested
approach for catchment planning studies (paragraph 2.13.4).
2.13.2 THE NEED FOR CATCHMENT BASED WATER MANAGEMENT SERVICES
Recall the five essential water management functions as follows:
1. strategy development
2. planning of resources protection and - development
3. implementation of resources development (and protection works)
4. exploitation of resources development
5. monitoring of water resources in the natural hydrological cycle and in an, in principle,
unlimited number of user intervention cycles.
We will discuss whether these five functions must be provided at catchment level or if they
can possibly be provided at a different level (national/central, district, or otherwise)
STRATEGY DEVELOPMENT is typically a prerogative that is exercised at ministerial level
under which a ministry defines in what way and with what means it will organize its water
management activities. The Water Interministerial committee has been proposed to
synchronize and align these strategies (avoiding redundancies and promoting cooperation)
hence strategy development is not decided upon at catchment level. Strategy development
does not require intervention at catchment level.
On the contrary, PLANNING of resources protection and resources development is only
possible at the catchment level. It is easy to see that the district and catchment domains do not
in the least align (district boundaries are often waterways which are the central pathway of
the catchment). In fact, the domain of each and every district in Rwanda is located in at least
two catchments (Rusizi) whereas for most of them the number of catchments varies between
3 and 5 or even more. Conversely, the area of each of the catchments in Rwanda comprises at
least three districts (Rusizi again) but typically the number of districts in a catchment varies
between 5 and 12.
Planning of water resources development can only be done when the available (surface and
groundwater) resources are known. With the results of the current NWRMP study, these
resources are now known at the catchment level and the allocation of resources development
between the districts need to be negotiated at the level of the catchment.

Rwanda National Water Resources Master Plan Page 201
MINIRENA-RNRA OCTOBER 2015
The planning function can be presented in a Catchment Master Plan. A description of the
Catchment Master Plan is presented in the table of contents section under the 'list of terms'.
The planning function can only be successfully handled at the catchment level.
When the planning of resources development has been developed in a concerted manner at
the catchment level (dividing the cake between the districts), the actual IMPLEMENTATION OF
RESOURCES DEVELOPMENT (when such implementation is financed by government) can be
done under the supervision of the district, provided that such implementation is in agreement
with the overall resources development plan defined for the catchment.
In fact, whether de developer is government, or a private entity that wishes to invest and
operated in a district makes no difference. Any water resources development activity:
needs to be in agreement with the planned interventions in a catchment,
requires a water permit under different regimes (declaration for minor intervention,
authorization for any intervention with significant impact on natural resources and
standing water users, and concession for major interventions with regional
implications) and intervention modes (currently three as there are (i) direct abstraction
of water from surface water, (ii) retention of surface waters behind a dam, and (iii)
pumping of water from groundwater).
requires approval from the local authority (district/sector).
The water resources development activities with an expected significant impact
(authorization or concession regime) also require an EIA. It is suggested that the permit
application process and the EIA study be aligned.
Provided that the envisaged intervention in the natural hydrological cycle is permitted and in
conformity with the planned developments, the implementation function can be successfully
handled by the districts and there is no absolute need for a catchment based supervision.
The EXPLOITATION OF THE DEVELOPED RESOURCES needs to be in accordance with the
issued water permit that should describe in detail the rights and obligations of the water user
on the one hand and the government of Rwanda on the other hand. Whereas it is possible that
suitably trained district staff supervises the exploitation of developed resources (a pumping
station in a river or lake, a dam on a river or water course, a borehole (with hand pump or
motorized)) in lowly committed catchments (demand at 5 to 10 % of the average renewable
resources), this option becomes unworkable for highly committed catchments (already at say
15% of the average renewable resources). For the highly committed catchments under
conditions of stress (hence every dry season), the control and guidance of permit exploitation
through a number of (partial) districts that make up a catchment, becomes totally ineffective.
For highly committed catchments (Muvumba is the first catchment in Rwanda approaching
this status) it becomes essential to define a set of objective rules for operational water
management under conditions of water stress that are implemented throughout the catchment.
This set of rules can be presented as the Catchment Water Management Plan. A description
of the Catchment Water Management Plan is presented in the table of contents section under
the 'list of terms'
In conclusion, when water resources management becomes demanding, the catchment is the
only suitable intervention platform for water resources exploitation. This stated, it is
conceivable that district technical staff participates in the operation of the Catchment Water
Management Plan, provided that they are suitably trained and informed on the stipulations of
the individual permits and the set of rules (the Catchment Water Management Plan),.

Rwanda National Water Resources Master Plan Page 202
MINIRENA-RNRA OCTOBER 2015
The last essential water management function is the MONITORING OF WATER RESOURCES in
the natural hydrological cycle and in an, in principle, unlimited number OF USER
INTERVENTION cycles.
This resources monitoring function can only be meaningfully defined at the catchment level.
The monitoring of user interventions is an exhaustive task which is proposed to be
implemented by the water users themselves with support, supervision and control from
relevant authorities. It is very well conceivable that district technical staff when suitably
trained and informed, participates in the monitoring of especially major water users
(exploiting a permit under an authorization of concession regime), and provides support and
guidance for all water users.
In conclusion, the catchment level is fundamental to the water resources development
planning function (function 2), for the rational exploitation of resources in highly committed
catchment (function 4), and for monitoring of natural resources (function 5). In fact, the
catchment level is indispensable for each function that deals with catchment resources,. This
does not necessarily mean that a new and autonomous authority is required; the aspired
functionality may very well be provided by means of communication and negotiation
between lower tier entities that make up the catchment. A proposition is presented in
section 2.13.5.
2.13.3 CURRENT STATUS OF CATCHMENT BASED WATER MANAGEMENT PROVISIONS IN RWANDA
There are currently no institutional entities in Rwanda that manage water resources or
otherwise operate at the catchment level.
This study presents a Catchment Master Plan for each catchment. Each plan presents the
renewable surface - and groundwater resources, an estimate of current water use through
developed resources, demand projections for 2012, 2020, 2030, and 2040 for the essential
water demand categories (in short water supply, industrial and mining water demand,
livestock, irrigation, hydropower and environmental requirements) adjusted to the available
resources, main issues and prospects and a cost estimate of government investment
requirements over the entire planning period. Where transfers from upstream to downstream
catchments are required and possible, these transfers have been quantified with the
anticipated date that such transfer may be called upon.
As they are based on a reasonably accurate assessment of monthly renewable resources and
estimate of future monthly demand for each catchment, these Catchment Master Plan are
useful documents that may serve as a first outline of catchment based water resources
development plans. However they have been developed within the context of the National
Water Resources Master Plan and are not sufficiently detailed on local resources and demand
nor did they allow for comprehensive stakeholder involvement.
EWSA has initiated catchment based water supply plans for the Eastern Province25
, the
Akanyaru catchment (NAKN), and the upper Nyabarongo catchment (NNYU).
It is commendable that EWSA adopts such catchment based approach, yet the drawback is
that they, as per their mandate, focus on potable water supply for urban and rural areas with
25
this first attempt was associated to the Eastern Province but this administrative domain covers all of the lower
Akagera catchment (NAKL) as well as some additional areas in parts of Upper Akagera (NAKU) and Muvumba
catchments (NMUV)

Rwanda National Water Resources Master Plan Page 203
MINIRENA-RNRA OCTOBER 2015
some associated industrial demand. EWSA does not necessarily consider other demand
categories as there are the major ones irrigation and environment as well as a series of smaller
demand categories e.g. hydropower, energy, fisheries, livestock, etc.
Hence, there is need for a comprehensive approach that is outlined in the following
paragraph.
2.13.4 PROPOSED APPROACH FOR IMPROVED CATCHMENT PLANNING
The proposed approach for improved catchment planning should combine the results of the
catchment master plans with the approach so far implemented by EWSA while extending to
all demand categories.
The catchment based approach should comprise an exhaustive identification and assessment
of water use and demand areas and required monthly service volume (comprising rural and
urban potable water demand with due allowance for future growth, industrial demand with all
subcategories (mining, energy, agro industrial, etc.), irrigation demand, fisheries and
livestock, environmental demand for normal and reserved areas, etc.). This exhaustive
identification should be build on the awareness on current use and demand, on development
plans available at sector and district levels (District Development Plans) and on stakeholder
involvement (through the sector and district committees). Great care should be taken that the
district and sector data are allocated to the proper catchment and not randomly duplicated in
the 'wrong' catchment.
These demand investigations should be presented in a GIS database clearly highlighting
current primary and commercial use, current demand (current level of services plus non
developed primary and commercial use ventures), and future demand projections (future
projected level of services and viable commercial water use ventures for which renewable
resources are long term available).
The demand investigations should be completed with the identification of supply locations
and zoning of adequate least cost services (spring - borehole - gravity pipeline - pumped
pipeline - rainwater harvesting - the combination of pico hydropower to carry natural spring
water to elevated hills) considering exploitation and investment costs (in this order) for all
demand categories. For highly committed catchments or highly committed parts of a
catchment, a ranking of priorities between demand categories should be defined. Indicatively,
primary use categories - potable water supply, livestock, environment - should be give
(partial) priority over commercial use categories. Further ranking of priorities between
commercial users can be based on costs and consequences (to the commercial operator, civil
society and the environment) of non or partial supply.
The supply zoning exercise should apply GIS software with a reasonably accurate digital
terrain model that allows for the automatic identification of areas that can be serviced from a
specific source (spring, dam site, reservoirs, etc.). This concept has been applied at a smaller
scale for the identification of irrigation command area from reservoir sites for the Feasibility
study for the development project for modern large scale agriculture around lake Nasho
(2 500 ha). "Réalisation de l’Etude de faisabilité du Projet de Développement d’une
Agriculture Moderne à Grande Echelle autour du lac NASHO dans les Districts de Kirehe et
Kayonza (Province de l'Est)" by SHER Ingénieurs Conseils s.a. - February 2011 for Minagri
- LWH.

Rwanda National Water Resources Master Plan Page 204
MINIRENA-RNRA OCTOBER 2015
A catchment planning exercise of this depth cannot be delegated to EWSA as it far exceeds
its mandate. RNRA-IWRM seems to be the entity in charge of such investigation which may
likely require the services of an experienced consulting engineer.
2.13.5 PROPOSED TRANSITIONAL STRUCTURE FOR CATCHMENT BASED WATER MANAGEMENT
PROVISIONS AND 'LEAN' GOVERNMENT ARRANGEMENTS
ON CATCHMENT BASED WATER MANAGEMENT SERVICES
From the previous paragraphs it is clear that the functions of water resources development
planning, water resources exploitation and water resources monitoring can only be
meaningfully implemented when exercised at the catchment level.
As the government of Rwanda operates its development policy and associated financial
dealings through the districts, it is counterproductive to create a superimposed institutional
layer. However, there is an evident need to provide part of the essential water management
services at catchment level.
The aspired IWRM compliant institutional structure proposed in section 2.12 presents two
new entities at the catchment level which are the 'Catchment Committees' and the 'Catchment
Water Management Offices'.
The 'catchment committee' was proposed as a representative body of covered26
district
authorities, district technicians involved in matters related to water (water supply,
sanitation, health, business development, irrigation, environment, etc.) and
representatives of water users (same listing) to debate and formulate a joint opinion on
the planned development, implementation and exploitation of the common resource.
The 'catchment water management office' was proposed as a decentralized office of
the RNRA-IWRM division operational in each of the nine catchments. Their role is to
support the catchment committee as well as district and sector committees on all water
related matters with adequate information and technical investigations and opinions
on any water issues within the catchment area, to develop a medium to long term
catchment master plan in cooperation with the covered districts and with
representatives of all water users in the area, to ensure that the water matters of each
DDP are coherent and realistic with respect to the catchment master plan and the
DDPs of the further districts located in the catchment, to develop a catchment water
management plan in cooperation with the covered districts and with representatives of
all water users in the area to effectively manage conditions of water scarcity (or
excess), to support adequate water resources monitoring in the catchment area and to
interpret and signal any irregular results, to support and verify water use monitoring
by water users and to interpret and signal any irregular results, to provide support to
actual and prospective water users on any water management matters.
Even when government funds would be amply available a full scale implementation if this
structure is not realistic for a short or medium term implementation. Considering the
complexity of the issues at hand, it is proposed to start a single pilot in the Muvumba
catchment. The following approach is proposed as a transition mechanism and a learning
experience:
26
Meaning that the district is partly or (exceptionally) almost totally located within (covered by) the catchment
area.

Rwanda National Water Resources Master Plan Page 205
MINIRENA-RNRA OCTOBER 2015
The duties of the catchment water management office for the soon to be highly
committed catchment of Muvumba, will be provided by two staff members of the
RNRA-IWRM division. Preferably these staff members will be a hydrologist
(bachelors or possibly masters) and a business oriented professional (BBA or possibly
MBA). These staff members are based in the offices of the RNRA - IWRM but they
will frequently visit the Muvumba catchment area notably the districts of Nyagatare
(935 km² representing 54% of the district domain and 58 % of the catchment area), of
Gicumbi (455 km² represents 56% of the district domain and 28 % of the catchment
area) and Gatsibo (152 km² represents 12 % of the district domain and 10 % of the
catchment area)27
. These staff members will be full time available for the provision of
government water management services in the Muvumba catchment. When deemed
necessary, consultancy support services for the formulation of detailed catchment
master plan, catchment water management plan, formulation of water permits in the
catchment area, the implementation of resources monitoring stations, or any other
provisions, will be provided.
Sector Committees are implemented in those sectors that are located within the
Muvumba catchment area. They collect information and debate issues of water
resources planning, development, exploitation and monitoring within their domain.
The RNRA - IWRM staff members will support these committees in the identification
of participants, information provision, preparation and conduct of their meetings and
any other requirements that may come up.
Three District Committees are implemented (Nyagatare, Gicumbi and Gatsibo)
covering the domain within the Muvumba catchment. They collect information and
debate issues of water resources planning, development, exploitation and monitoring
within their domain. The RNRA - IWRM staff members will support these
committees in the identification of participants, information provision, preparation
and conduct of their meetings and any other requirements that may come up.
A single Catchment Committees is implemented for the Muvumba catchment. The
RNRA - IWRM staff members will support this committee in the identification of
participants, information provision, preparation and conduct of their meetings and any
other requirements that may come up. They debate issues of water resources planning,
development, exploitation and monitoring within their domain.
As a starting arrangement, the institutional structure proposed in the NWRMP study will thus
only be implemented in the catchment of Muvumba exclusive of a decentralized Catchment
Water Management Office. The full services of this office will however be provided by two
staff members of the RNRA-IWRM with consultancy services in support (for processing of
detailed catchment master plan, water management plan, permit investigations, etc.). The full
services have been specified under the 'catchment water management office' heading earlier
in this paragraph.
It should be expected that such a pilot water management structure will require at least two
years to take hold and deliver first results.
When this pilot is successful (adequate water management services are provided by
government) in the above proposed format, it can be extended to other catchments. It is
27
The district of Burera covers 56 km² in the Muvumba catchment which represents 3% of the catchment and
12% of the district. The Rulindo district covers 4 km² in this catchment. For reasons of simplicity, it is suggested
that this be ignored for the time being.

Rwanda National Water Resources Master Plan Page 206
MINIRENA-RNRA OCTOBER 2015
suggested that the pilot water management structure be thoroughly evaluated before being
extended to other catchments. Such evaluation may likely provide recommendations for
adjustments of the institutional structure, level of intervention and the procedures.
Depending on the actual workload of the RNRA-IWRM staff involved in the catchment
services and the tasks delegated to consultants, it may be possible that two RNRA-IWRM
staff members are in charge of three catchments. If this proofs to be a workable format, the
final stage would see six RNRA-IWRM staff members handling decentralized water
management services for the total nine catchment in Rwanda. The logical grouping could be:
central area with Upper Nyabarongo, Mukungwa and Lower Nyabarongo
western and southern area with Kivu, Rusizi and Akanyaru
eastern area with upper and lower Akagera and Muvumba catchments
ON LEAN GOVERNMENT STRUCTURE
Further to this practical approach for the introduction of catchment based water management
functions at the decentralized level (the districts), there is increased emphasis on lean and
efficient government institutions. In this light it may be assumed that the institutional
structure as depicted in the 2008 water act would probably be leaner these days. A reduction
of the proposed institutional structure would be possible along the following lines:
committees are representative bodies that convene a few times per year to discuss and
decide or recommend. There is little benefit in the cancellation of these entities and
we suggest that they all be maintained as presented in the general institutional
framework of Figure 22. This applies for the Water Interministerial Committee for
especially strategy alignment at central level and for the series of Catchment -,
District - and Sector Committees that assure stakeholder participation as well as
communication and alignment of resources use planning, development and
exploitation across the sectors and districts of a catchment.
if two new permanent structures at central level is considered too costly (Rwanda
Water Authority and National Water Consultative Commission), it is suggested that
the two be merged to Rwanda Water Authority (an ombudsman function for all
matters related to water: planning, development, exploitation including highest
instance of conflict resolution) to also provide the specific function of the National
Water Consultative commission (approval of national and regional permits).
it has been stated previously in this paragraph that the Catchment Water Management
Offices, do not need to be autonomous offices but can be decentralized antenna's of
the RNRA-IWRM under which auspices they are bound to provide water
management services and it may proof possible that experienced RNRA-IWRM staff
members provide these services for a group of catchments. These 'field' services to
water users and decentralized committees are crucially important for information
exchange, planning, resources development and exploitation, as well as support for
resources monitoring.
In practical terms this means that the existing institutional framework is essentially
maintained with improved communication and cooperation on data exchange between
government entities and between government and water users.

Rwanda National Water Resources Master Plan Page 207
MINIRENA-RNRA OCTOBER 2015
The RWA would be the only truly new institution, and the RNRA-IWRM provides part of its
services at the decentralized catchment level through catchment water management antenna.
There is little prospect for the provision of adequate water management services without
resources and use analysis and communication at catchment level and without the convening
committees at decentralized level.
2.13.6 COMPLEMENTARY MEASURES
Essential complementary measures are:
application of the water permit system
development of a system of accredited consultants for the study of permit
applications.
The Water Permit System developed and proposed in this Master Plan has been launched for
its nationwide implementation during the 2014 World Water Day. It should be realized that
there is a very substantial backlog to process the permits of standing water use.
Indicatively, the number of declaration permits (negligible impact comprising all protected
springs, boreholes, gravity water supply systems, etc.) may be of the order of some 50,000 or
substantially more. The number of authorizations and concessions (significant impact; larger
water supply systems with pumped surface water abstractions, irrigation projects,
hydropower, surface dams, pumped groundwater abstractions, etc.) may be of the order of
some 1,000 or substantially more (estimate a minimum of 30 per district or 100 per
catchment).
Obviously the RNRA-IWRM does not have the manpower to handle such a backlog. It is
suggested that consultancy services are provided to close this gap. In line with what has been
proposed in this section, it is suggested that this will be done firstly in the Muvumba
catchment.
It is also suggested to develop a system of consultant accreditation for the handling of water
user permit applications (similar to the accreditation system of REMA for EIA studies). The
accreditation should consider the types of permits (surface water direct abstraction, storage
permit, groundwater abstraction permit and used water disposal permit) as the hydrological
investigations necessary for each permit type are very different (base flow, monthly - annual
flow probability, hydro-geology and water quality aspects).
2.14 ROAD MAP FOR THE IMPLEMENTATION OF THE INSTITUTIONAL STRUCTURE FOR IWRM
This section presents a road map for establishing an effective institutional structure for
Integrated Water Resources Management. First, the basic issues are identified that follow
from the review of the water sector in previous sections of this chapter. Discussions with key
stakeholders of these basic issues and the requirements of the Water Law and Water Policy
have led to the definition of priorities for the NWRMP. Strategic guidance will be developed
for the achievement of these priorities. In accordance with these strategic considerations, near
term, medium term and long-term measures are identified.

Rwanda National Water Resources Master Plan Page 208
MINIRENA-RNRA OCTOBER 2015
2.14.1 BASIC ISSUES
Previous sections indicate that progress in water resources management is still insufficient,
particularly as it relates to planning and coordinated development, management, and
comprehensive monitoring of resources and particularly water use. This lag of progress is
related to two interdependent root causes:
Lack of adequate budgets. The overall water resources management tasks have been
seriously under-funded for many years. The funding of these tasks will have to increase
substantially to enable the responsible organizations to fulfill the responsibilities assigned to
them in the Water Law.
Institutional deficiencies. Insufficient staffing (referring to posts being filled, the staff
member's experience and adequate training), and insufficient cooperation and data exchange
among the various water sector organizations is a major issue that is contributing to
performance shortfalls in overall water resources management. The cooperation between
RNRA-IWRM and other governmental agencies involved in management (notably RDB,
REMA, MeteoRwanda) at central level and district and users at decentralized level, can and
should be improved.

Rwanda National Water Resources Master Plan Page 209
MINIRENA-RNRA OCTOBER 2015
2.14.2 ACTION PLAN FOR A WORKABLE INSTITUTIONAL STRUCTURE FOR THE WATER SECTOR
The analysis of the current and required institutional structure in the preceding sections has permitted to identify a number of necessary actions
for the improvement of the institutional structure. The actions are ordered for near, medium and long term implementation.
The action plan at near, medium and long term is presented in the table below
table 54: Road map for the improvement of the institutional structure for IWRM.
Priorities Subject Near Term
(2014 ~)
Medium Term
(2015 - 2020)
Long Term
(2020 +)
Monitoring of
Water
Resources
Rainfall
1. Cooperation on data exchange
between MeteoRwanda and RNRA-IWRM
on rainfall and meteorological data is
specified and implemented
Continuation of 1. Continuation of 1.
Surface Water
2. Training of RNRA-IWRM officers
on the Water MIS
3. Implementation of the National
Water Resources Monitoring Network
comprising 8 stations that are equipped
with direct data transfer to RNRA and
automatic water level and velocity
measurement and 5 stations for flood
warning on large rivers. (Total of 13
stations)
4. Implementation of the Hydrometric
Network comprising 28 stations on rivers in
Rwanda and 12 limnimetric stations on
major lakes and wetlands
5. Implementation of the Impact
Monitoring Network comprising 10 stations
equipped with piezometers with low
Continuation and extension of 2.
Continuation of 3.
Continuation of 4.
Continuation of 5
Continuation and extension of 2.
Continuation of 3.
Continuation of 4.
Continuation of 5

Rwanda National Water Resources Master Plan Page 210
MINIRENA-RNRA OCTOBER 2015
Priorities Subject Near Term
(2014 ~)
Medium Term
(2015 - 2020)
Long Term
(2020 +)
maintenance cost that are used to
investigate emergent issues, impacts and
that are shifted after the investigation
Groundwater
6. Awareness campaign for major
users about IWRM and collaboration with
them through Water permit system
(especially EWSA)
7. Equip RNRA-IWRM with tools for
controlling major users and implement
control of major users
Continuation of 7.
Continuation of 7
Strategy
Institutions
8. Establishment of the Water
Interministerial Committee (WIC)
including secretariat
Operation of WIC Operation of WIC
Guidance
Documents
9. Prepare second National policy on
protection, planning, use and management
of water resources for its operation in 2015
-2020.
10. Operate second National
policy on protection, planning,
use and management of water
resources. (start in 2015 -2020)
11. Prepare third National
policy on protection, planning,
use and management of water
resources.
Planning Institutions
12. a- Establishment of the National
Water Consultative Commission (NWCC)
including secretariat or -b- integrate the
functionality with RWA or -c- allow for
ad hoc solutions for controversial water
development works.
13. Establishment of Catchment
Continue as per 12-a, 12-b or 12-
c.
Operate, evaluate and adjust
Continue as per 12-a, 12-b or 12-
c.
Consider decentralized CWMO

Rwanda National Water Resources Master Plan Page 211
MINIRENA-RNRA OCTOBER 2015
Priorities Subject Near Term
(2014 ~)
Medium Term
(2015 - 2020)
Long Term
(2020 +)
Water Management functionality for
Muvumba catchment within RNRA-
IWRM offices preferably in the format
of a "one-stop-center" for information,
permit application including access to
Water MIS
14. Establishment of Catchment
Committees in Muvumba catchment
(CC)
15. Establishment of District and
Sector Committees in districts in
Muvumba catchment (DC and SC)
16. Training of RNRA-IWRM staff
on issues of planning and support of
CC, DC and SCs.
Muvumba Water Management
Office functionality and extent on
other catchments as needed;
Operation of existing CCs and
establishment of new CCs as
needed
Operation of existing DCs and
SCs and establishment of new
ones as needed
Continue training of staff as
required
services financed through water
permit administration fees, or
remain with catchment services at
RNRA-IWRM offices
Operation of existing CCs and
establishment of new CCs as
needed
Operation of existing DCs and
SCs and establishment of new
ones as needed
Continue training of staff as
required
Planning
products
17. National Water Resources Master
Plan finalized, published, distributed and
available for download through Water MIS.
18. Indicative Catchment Master Plans
improved at catchment level by RNRA-
IWRM with full user involvement through
CC, DC and SC as well as sector service
providers for drinking water supply
(EWSA) and the irrigation sector (Minagri -
Irrigation Task Force.
NWRMP used and updated as
required
Catchment Master Plans used,
improved and updated as required
NWRMP used and updated as
required
Catchment Master Plans used,
improved and updated as required
Financial
Aspects
19. In cooperation with MINECOFIN,
MINIRENA undertakes an assessment of
the financial aspects of water management
Implement and where needed
improve the financial mechanisms
Continue using the financial
mechanisms elaborated under 19.

Rwanda National Water Resources Master Plan Page 212
MINIRENA-RNRA OCTOBER 2015
Priorities Subject Near Term
(2014 ~)
Medium Term
(2015 - 2020)
Long Term
(2020 +)
services. This will include the following
activities:
o Financial analysis of the operations of
all agencies involved in water
management (budgeting, costing,
sourcing of funding).
o Design a financing structure for the
operations of all agencies by means of
tariffs, licenses, fees and tax- based
revenue sources to meet water resource
management needs. Development of
water should remain affordable and
institutions should be paid for their
services (management of water, not
water).
elaborated under 19.
Implementation
of Resources
Development
Works
Institutions
20. -a- Establish the Rwanda Water
Authority or -b- provide for ad hoc
solutions for any conflict and resolution on
water resources development issues (civil
court staff with special training).
21. Training of all RNRA-IWRM staff
(including staff in charge at catchment
level) in all aspects of Water Management;
Water MIS, Water Permit system, water
permit including user's rights and
obligations, EIA, etc.. This training may
include visits to neighboring countries
(Uganda) to adopt successes and avoid
pitfalls.
Continue operation of RWA
Continue training of staff as
required
Continue operation of RWA
Continue training of staff as
required

Rwanda National Water Resources Master Plan Page 213
MINIRENA-RNRA OCTOBER 2015
Priorities Subject Near Term
(2014 ~)
Medium Term
(2015 - 2020)
Long Term
(2020 +)
22. Training of RDB and REMA staff
involved in EIA applications and
monitoring, in Water Permit application
and monitoring.
23. Education of CC, DC, SC and all
water users on water resources management
through sessions with RNRA-IWRM
catchment staff and documents available
from the Water MIS and other web sources.
24. Establish a list of accredited
consultants for hydrological studies of
surface and groundwater abstractions and
surface water storage works (similar to the
EIA accredited consultants of REMA)
25. Implement a nationwide public
awareness campaign on all matters related
to water management, the role of RNRA-
IWRM, the new institutions and their
respective roles, the water permit system,
the rights and obligations of the general
public and registered water users in
particular
Repeat training as needed
Update educational material and
continue education of committee
members, water users and the
general public as required.
Keep the list of accredited
consultants up to date and keep
track of the quality of their
studies.
Repeat public awareness
campaign if so required
Repeat training as needed
Update educational material and
continue education of committee
members, water users and the
general public as required.
Keep the list of accredited
consultants up to date and keep
track of the quality of their
studies.
Water
Management
products
26. Finalize and implement water
permits system for i) direct abstraction from
surface water, ii) storage of surface water,
iii) direct abstraction from groundwater.
27. Finalize and implement the
hydrological viability check on all permits
Continue using the permit system
specified under 26
30. Finalize and implement
water permits for iv) used water
disposal and v) miscellaneous
interventions
Finalize and implement the
Continue using the
comprehensive permit system
specified under 26 and 30.
Continue using the hydrological

Rwanda National Water Resources Master Plan Page 214
MINIRENA-RNRA OCTOBER 2015
Priorities Subject Near Term
(2014 ~)
Medium Term
(2015 - 2020)
Long Term
(2020 +)
at catchment level 1
28. process and implement the
hydrological viability check on all permits
at catchment level 1
29. Implement the Water MIS for
continued resources monitoring and
analysis, the registration of water permits,
the registration of water use and the
analysis and interpretation of water
balances per catchment
hydrological viability check on all
permits at catchment level 3 (or
smaller)
Continue using the Water MIS for
state of the art water management
services
viability check at catchment level
3 (or smaller)
Continue using the Water MIS for
state of the art water management
services
Environmental
Impact
Assessment
31. Fine tune the work flow of water
permit and EIA assuring that the EIA study
and approval are based on the proper
intervention volume and capacities, the
implementation, operation and closure of
the intervention.
32. Fine tune the monitoring of the EIA
(by REMA) and the water permit (by
RNRA-IWRM, its catchment staff and
users) to avoid redundancy and
contradictions.
33. Update the EIA application process
(by RDB (conflict of interest!) or preferably
REMA) and finalize the Water permit
application procedure (RNRA-IWRM)
34. Update the EIA compliance
monitoring (REMA) and finalize the Water
permit monitoring process (RNRA-IWRM)
Continue using updated EIA
application process
Continue using updated EIA
compliance monitoring
Continue using updated EIA
application process
Continue using updated EIA
compliance monitoring

Rwanda National Water Resources Master Plan Page 215
MINIRENA-RNRA OCTOBER 2015
Priorities Subject Near Term
(2014 ~)
Medium Term
(2015 - 2020)
Long Term
(2020 +)
Exploitation of
Resources
Development
Works
Institutions
35. Training of selected RNRA-IWRM
staff (notably staff in catchment planning
but not exclusively) in all practical aspects
of water resources management under
normal and extreme conditions, including
professional handling of conflict resolution
36. Similar training of RWA (or a civil
court) by international experts and legal
specialists
37. Similar training of CC, DC and SC
on aspects of practical water management
and conflict resolution.
38. Catchment wide public awareness
campaign on water management issues
Repeat training as required
Repeat training as required
Repeat training as required
Continue campaign as required
Repeat training as required
Repeat training as required
Repeat training as required
Continue campaign as required
Handling of
water
management
issues
39. Definition of water management
principles for Muvumba catchment under i)
normal conditions, ii) conditions of highly
committed catchment, and iii) extreme
conditions:
o Prioritization of water uses (primary use
versus commercial use, added
principles, e.g. character and quantity of
losses from non-use, etc.)
o Handling of the different permit types
(direct abstraction, storage, groundwater
(or lake))
o Environmental protection and
ecological water use
Update definitions as required and
extend process to other
catchments
Update definitions as required and
extend process to other
catchments

Rwanda National Water Resources Master Plan Page 216
MINIRENA-RNRA OCTOBER 2015
Priorities Subject Near Term
(2014 ~)
Medium Term
(2015 - 2020)
Long Term
(2020 +)
o temporary suspension of permits
o water user own information and
inspection of actual water use; handling
of deliberately false information
o handling of non permitted interventions
o handling of other water users' or general
public complaints on water use.
o predefine handling of special conditions
(drought, flood) for specified domains
areas,
40. Implementation of water
management principles under i) normal
conditions, ii) conditions of highly
committed catchment, and iii) extreme
conditions by RWU, SC, DC, CC, RNRA-
IWRM catchment staff, RWA or civil
court; it may be considered to delegate the
water management services to a specialized
service provider.
41. Implement an awareness campaign
of the general public on practical issues of
water management; water use proxies, do's
and don'ts, opportunities, public access to
permit data, etc. These campaigns should
be 'catchment - wide'.
Continue implementation and
adjust processes if needed only
after evaluation of extreme
conditions that didn't work out
properly.
Replicate, adjust, repeat
awareness campaigns on
catchments as needed
Continue implementation and
adjust processes if needed only
after evaluation of extreme
conditions that didn't work out
properly.
Replicate, adjust, repeat
awareness campaigns on
catchments as needed
Water use
monitoring
42. Elaborate water use proxies (energy
demand (diesel or cashpower), energy
production (hydropower), water level in
RNRA-IWRM or its catchment
staff may continue working and
improving this important issue.
RNRA-IWRM or its catchment
staff may continue working and
improving this important issue.

Rwanda National Water Resources Master Plan Page 217
MINIRENA-RNRA OCTOBER 2015
Priorities Subject Near Term
(2014 ~)
Medium Term
(2015 - 2020)
Long Term
(2020 +)
reservoir, actually irrigated area, number of
standposts on water supply system, etc. in
order to facillitate water use monitoring and
the appraisal of monitoring results.
43. Define water use reporting
obligation very explicitly in the water
permit (especially authorization and
concession)
44. Water users report water use data as
per their permit (mostly in case of
authorization and concession; declaration is
generally free except for operational status).
45. Registered water use data should be
regularly verified (by RNRA-IWRM
catchment staff) as being realistic and more
or less coherent with permitted quantities. If
not, communication with RWU and
possible site inspection. Correct use data
should be registered, analyzed and
interpreted against domain water balance,
resources data, etc. in order to: i) improve
new permit contracts, ii) update catchment
water balances, iii) adjust and refine
resources monitoring, iv) update catchment
master plans, etc.
Repeat as required.
Replicate, adjust, repeat
awareness campaigns on
catchments as needed
Continue water use monitoring
exercise including analysis and
interpretation of data of improved
water management
Repeat as required.
Replicate, adjust, repeat
awareness campaigns on
catchments as needed
Continue water use monitoring
exercise including analysis and
interpretation of data of improved
water management
Permit closure
46. Finalize the process of water permit
closure with special emphasis on the
restitution of conditions prior to the
intervention based on permit specifications
and current conditions, implicating EWSA
Update if required
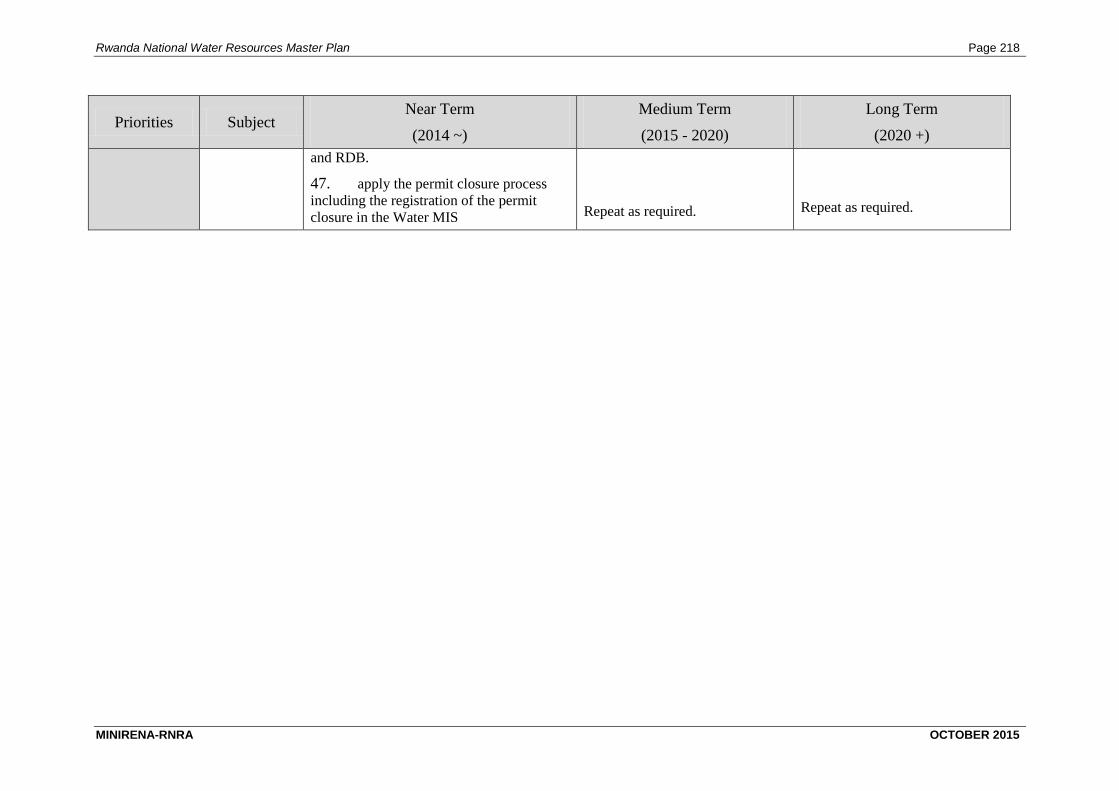
Rwanda National Water Resources Master Plan Page 218
MINIRENA-RNRA OCTOBER 2015
Priorities Subject Near Term
(2014 ~)
Medium Term
(2015 - 2020)
Long Term
(2020 +)
and RDB.
47. apply the permit closure process
including the registration of the permit
closure in the Water MIS
Repeat as required.
Repeat as required.

Rwanda National Water Resources Master Plan Page 219
MINIRENA-RNRA OCTOBER 2015
2.15 ROAD MAP FOR THE IMPLEMENTATION OF THE LEGAL STRUCTURE FOR IWRM
The legal structure for the implementation of IWRM is a work in progress. Indeed, the overall concept and the different elements that have been
defined are up to date and adequate, yet, inconsistencies have been found and a number of necessary institutions and entities have not yet been
identified or identified but not yet defined. Hence, changes, additions and improvements are required. The anticipated result is a leaner but
stronger, coherent and consistent legal framework, which puts more emphasis on the use of instruments for implementing the principles set out
in the laws.
The suggested changes as required for the final IWRM compliant institutional structure, are presented in the table below. Most of these changes
will not be needed when the transitional institutional structure as described in paragraph 2.13 is opted for.
table 55: Road map for improvement and completion of the legal structure for IWRM.
Institution Law/Article Suggested change
The Water
Interministerial
Committee
The Water Law establishes the Water Interministerial
Committee at the article 18:
“There shall be established in the Prime Minister’s office a
Water Interministerial Committee composed of ministerial
department representatives concerned with water in their
domain and whose supervision shall be by a Director in the
ministry of water. It shall be consulted on all legislative
drafts/Bills regarding planning in the water domain
elaborated at the national level, as well as on matters of
national, regional or international level.”
A Prime Minister’s order determining the organization,
functioning and composition of the National Water
Consultative Commission should be enshrined.
The Consultant proposes some suggestions for its
composition, missions and organization as well as the creation
of a Technical Coordination Commission which will
coordinate work between institutions
The National
Water
Consultative
Commission
The Water Law establishes the NWCC at the article 16 :
“There shall be established a National Water Consultative
Commission composed of:
1° Representatives of Government;
The Consultant suggests its modification as follows:
Replace: “There shall be established a National Water
Consultative Commission composed of:
1° Representatives of Government;

Rwanda National Water Resources Master Plan Page 220
MINIRENA-RNRA OCTOBER 2015
2° Representatives of various public and private water users.
The Minister chairs the Commission’s meetings. The
structure, the functioning and the composition of the
commission are fixed by the order of the Prime Minister. The
National Water Commission shall be consulted on the
following matters:
1° planning projects in the water domain elaborated to the
national level or the big hydrographic basin level and on the
revision of these projects;
2° projects of water supplying, planning, management and
transfer of water from basin to basin, with national
character as well as in the big projects of the same category
of provincial character;
3° any water related issue, in case the Minister deems it
necessary.
2° Representatives of various public and private water users.
“
By: “There shall be established a National Water
Consultative Commission composed of representatives of
decentralized governments and representatives of various
public and private water users.”
The Prime Minister’s order n°143/03 of 24/05/2013
determining the organization, functioning and composition
of the National Water Consultative Commission
The Consultant suggests some modifications of this Prime
Minister’s orders :
Chapter II : Article 3 : Composition of the NWCC :
The NWCC shall be composed of representatives of
decentralized government and representatives of various
public and private water users. Hence, the Commission may
comprise members, who represent industry, middle class,
farmers, workers, fishermen, consumers, environmental
protection associations, water leisure activities, cities and
villages, water and sanitation operators. Consequently, the
NWCC could be formed by:
a College of decentralized authorities: representatives
of districts

Rwanda National Water Resources Master Plan Page 221
MINIRENA-RNRA OCTOBER 2015
a College of civil society:
* socio-economical field
* associative field
Environmental issue
Gender issue
Human rights and rights of minorities
Religious entities
* operator
Rwanda Water
Authority
Article 17: Rwanda Water Authority A special Law shall
determine powers, responsibilities, organization and the
functioning of the National Water authority.
Catchment level
There is nothing in the Water Law about the Catchment
level.
After “The article 19 : boundaries of hydrographic basins”,
the Consultants proposes the formulation of a new article
(article 20) about the Surface Water Catchments division :
Article 20 : Surface Water Catchments division :
“Rwanda consists of nine surface water catchments. The
delimitation and the denomination of surface water
catchments are determined by the law.”
The Consultant suggests also a Ministerial Order determining
the main characteristics and management visions in the
Surface Water Catchments in Rwanda
Catchment Water
Management
Offices (CMWO)
There is nothing in the Water Law about decentralized
entities of the RNRA-IWRM at the Catchment level.
The Consultant proposes the creation of the CMWOs in the
Water Law :
In the Water Law, after the article (20), article (21) :
Article 21: Catchment Water Management Offices
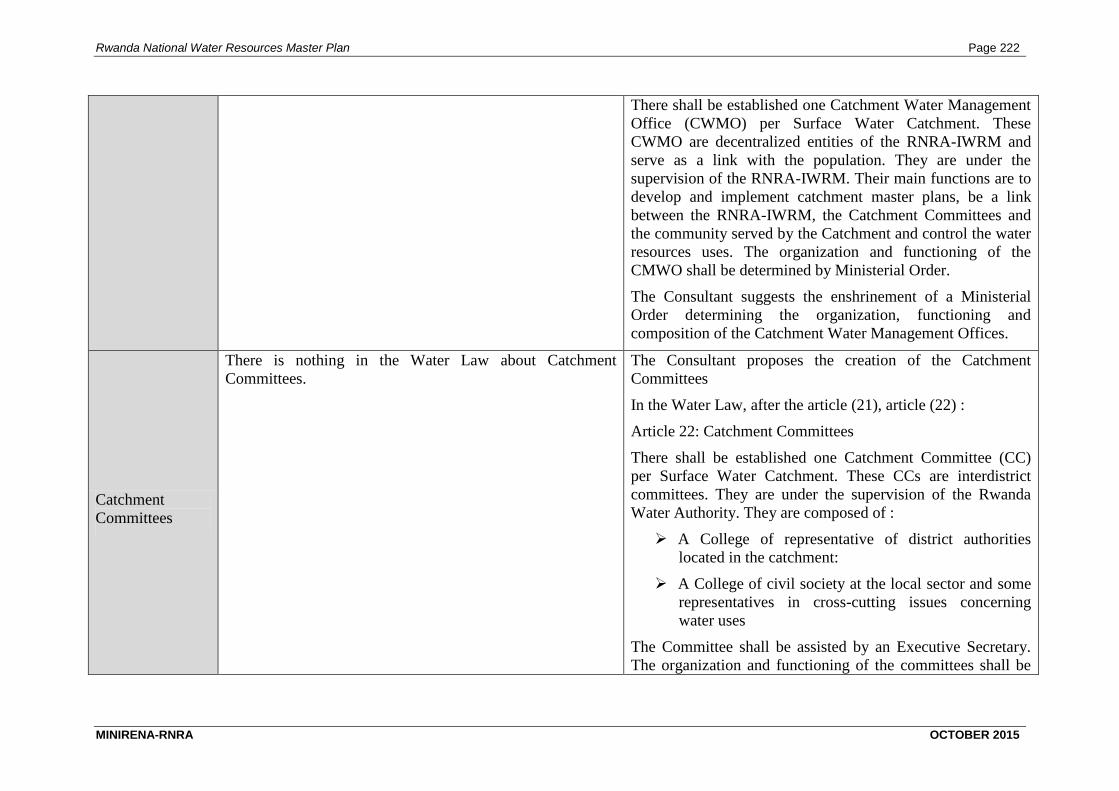
Rwanda National Water Resources Master Plan Page 222
MINIRENA-RNRA OCTOBER 2015
There shall be established one Catchment Water Management
Office (CWMO) per Surface Water Catchment. These
CWMO are decentralized entities of the RNRA-IWRM and
serve as a link with the population. They are under the
supervision of the RNRA-IWRM. Their main functions are to
develop and implement catchment master plans, be a link
between the RNRA-IWRM, the Catchment Committees and
the community served by the Catchment and control the water
resources uses. The organization and functioning of the
CMWO shall be determined by Ministerial Order.
The Consultant suggests the enshrinement of a Ministerial
Order determining the organization, functioning and
composition of the Catchment Water Management Offices.
Catchment
Committees
There is nothing in the Water Law about Catchment
Committees.
The Consultant proposes the creation of the Catchment
Committees
In the Water Law, after the article (21), article (22) :
Article 22: Catchment Committees
There shall be established one Catchment Committee (CC)
per Surface Water Catchment. These CCs are interdistrict
committees. They are under the supervision of the Rwanda
Water Authority. They are composed of :
A College of representative of district authorities
located in the catchment:
A College of civil society at the local sector and some
representatives in cross-cutting issues concerning
water uses
The Committee shall be assisted by an Executive Secretary.
The organization and functioning of the committees shall be

Rwanda National Water Resources Master Plan Page 223
MINIRENA-RNRA OCTOBER 2015
determined by Ministerial Order.
The Consultant suggests the enshrinement of a Ministerial
Order determining the organization, functioning and
composition of the Catchment Committees.
District
Committees
The Water Law defines District Committees at the article 20
and 21.
The Ministerial Order nº005/16.01 of 24/05/2013
determining the organization and functioning of
hydrographic basin committees.
The Consultant proposes to modify the Water Law and
suppress this ministerial order.
Article 20: District Committees for hydrographic basins
There shall be established a basin district committee
composed of:
1° administrations’ representatives concerned by water;
2° elected representatives of the local decentralized
communities;
3° representatives of the different categories of water users.
The Committee may in its work use competent people in the
water domain. The basin committee holds meetings in the
premises of a district or in any other place indicated by the
beneficiary entities. The Committee shall be assisted by an
Executive Secretary. The organization and functioning of the
committees shall be determined by Ministerial Order.
Article 23 : District Committees
There shall be established a district committee at the district
level which will participate in the elaboration and apply the
catchment master plan in their territory, elaborated at
catchment level.
It shall be composed of :
1° Representatives of the elected members at the decentralized
level: “representatives of committees for hydrographic basins
at Sector level”
2°Representatives of the different water users organizations:
“representative of National Women Council at District level”,
“a representative of the National Youth Council at the District
level”, “ two (2) representatives of farmers at District level”,
“a representative of water user organizations in the field of
agriculture at District level”, “a representative of water users
in domestic activities at the District level”, “two (2)
representatives of non-government organizations operating in
the field of water in the District” and “a representative of the
Private Sector at the District level”.

Rwanda National Water Resources Master Plan Page 224
MINIRENA-RNRA OCTOBER 2015
The district committee holds meetings in the premises of a
district or in any other place indicated by the beneficiary
entities. The Committee shall be assisted by an Executive
Secretary. The organization and functioning of the committees
shall be determined by Ministerial Order.
Article 21:The basin committee mission
The basin committee shall be charged with:
1° to propose the initial version of the master plan and
management of the basin waters as provided for in this Law.
2° to propose the delimitation, if necessary, of under-basins
and the designation of the aquifer for which an integrated
management of the water resource must be done;
3° to formulate orientations and proposals concerning the
planning and management of the waters of under-basins or
aquifer;
4° to formulate propositions of arbitration or solution in case
of conflict of water uses;
5° to formulate opinions on all technical or financial
questions that is submitted to it by the administration.
6° to value the relevance and the feasibility of basin
organisms, to prepare their setting up in the event that it
would be judged necessary.
The consultant proposes to suppress this article. The district
committee should not legally be empowered for producing
catchment master plan because it has different territorial
boundaries. As the district committee has only an advisory
function, it shall participate and apply the catchment master
plan in its territory, elaborated at RNRA-IWRM and
catchment level.
The Ministerial Order nº005/16.01 of 24/05/2013
determining the organization and functioning of
hydrographic basin committees.
The Consultant suggests a new Ministerial Order determining
the organization and functioning of district committees,
following the Consultant’s propositions
Sector
Committees
The Water Law defines Sector Committees at the article 22
and 23.

Rwanda National Water Resources Master Plan Page 225
MINIRENA-RNRA OCTOBER 2015
The Ministerial Order nº005/16.01 of 24/05/2013
determining the organization and functioning of
hydrographic basin committees.
Article 22: Basin committee at the sector level
There shall be established a committee for the management
of a small basin or aquifer at the level of the administrative
decentralized authority of the district to which it is
connected. Where it is deemed necessary, sub-basin or
hydrographic basin committee at the sector level. The
structure and functioning of this committee shall be the same
as set out for the basin committee at the district level.
The consultant suggests to replace this article by the following
text.
Article 22 : Sector Committees
There shall be established a committee at the sector level
which will participate in the elaboration and apply the
catchment master plan in their territory, elaborated at
catchment level.
The sector committee is composed of local water associations
for a public participation at the decentralized scale.
Article 23: Responsibilities of committees at sector level
The Sector committee shall have the following
responsibilities:
1° to propose the initial version of the local master plan;
2° to fix management procedures for the under-basin waters
or the aquifer, provided for under this Law;
3° to formulate at its level propositions and opinions.
The consultant proposes to modify this article. The sector
committee is not legally empowered for producing catchment
master plan.
The Ministerial Order nº005/16.01 of 24/05/2013 determining the organization and functioning of
hydrographic basin committees.
The Consultant proposes a Ministerial order determining the
organization and functioning of sector committees
Catchment Water
Management
Plans
Article 30: Hydrographic basin master plan and their
management In each hydrographic or aquifer correspondent
to a hydrographic unit or coherent hydrogeologic, a diagram
of waters planning and management fixes the general
objectives of water resources integrated management as well
The Consultant proposes to replace these two articles by only
one, based on surface water catchment areas and not
hydrographic or sub-basin areas :
Article 31 : Catchment Water Management Plans

Rwanda National Water Resources Master Plan Page 226
MINIRENA-RNRA OCTOBER 2015
as the aquatic ecosystems. It shall be established for a five
(5) years period by the basin committee in conditions
provided for by this Law and is approved by the
administrative authority. The arrangements must be
compatible with arrangements of the planning national
diagram and waters management.
Programs and administrative decisions in the water domain
must be either compatible or made compatible with diagram
arrangements of waters planning and management.
In each surface catchment, a diagram of waters planning and
management fixes the general objectives of water resources
integrated management as well as the aquatic ecosystems. It
shall be developed by the Catchment Water Management
offices for a six (6) years period in conditions provided for by
this Law with remarks and comments from the Catchment
committees and the National Water Consultative Commission.
Its implementation at the decentralized level is done by the
district and sector committees. The arrangements must be
compatible with arrangements of the planning national
diagram and waters management.
Programs and administrative decisions in the water domain
must be either compatible or made compatible with diagram
arrangements of waters planning and management.
Article 31: Management of sub-basins and aquifer
In sub-basins or aquifer correspondent to a hydrographic unit
or coherent geological hydrographic, a local diagram of
planning and management of waters can be instituted by the
committee of sub-basin or aquifer according to the same
modes that the diagram of waters planning and management
and to specify its objectives. It is approved by the
decentralized administrative authority territorially
competent.
Regimes of water
use
Chapter V “Regimes of Water Use” of the Water Law The consultant presents some suggestions for modification
and completion of this chapter.
Article 33: Declaration regime Operations submitted to the
declaration regime are those operations susceptible not to
present any serious dangers for health and public security
and not to have impacts limited on the out-flow of waters, on
the resource, on the quantitative and qualitative point of
view, as well as on the diversity of the aquatic environment.
Article 33 : Declaration regime
Interventions submitted to the declaration regime are those
interventions susceptible not to present any serious dangers
for health and public security and that are unlikely to have a
major impact on the natural hydrological cycle or on other
water uses. The declaration can be operated without much
supervision or control from water management authorities.
Article 34: Authorisation regime Are submitted to the
authorization regime, operations susceptible to present
Article 34 : Authorization regime
Are submitted to the authorization regime, interventions that

Rwanda National Water Resources Master Plan Page 227
MINIRENA-RNRA OCTOBER 2015
dangers for health and the public security, to be harmful to
the waters free out-flow, to reduce the water resource, to
attack its quality of water or the aquatic environment
diversity.
are susceptible to present dangers for health and the public
security and to have some significant impact on the natural
hydrological cycle or on other water uses.
The authorization requires regular supervision and control
from water management authorities.
Article 35: Concession regime
The following activities shall be submitted to the concession
regime:
1° operations and activities that are susceptible to present
serious dangers to
health and public security;
2° activities which may highly interfere with the free water
flow;
3° activities which may reduce both water quality and
quantity;
4° activities which may considerably increase the risk of
flooding;
5° activities which may seriously endanger the aquatic life;
6° operations of water use presenting a general interest
character or approved by relevant authority.
Article 35 : Concession regime
The concession is intended for interventions that are expected
to have major impact on the natural hydrogeological cycle and
or on other water uses. The concession requires frequent and
in depth supervision and control from water management
authorities.
Intervention
types for water
uses
There is nothing in the water law about intervention types The consultant suggests a new article, at the beginning of the
“Chapter VI : Particular Provisions”
Article 48 : Interventions types in the natural hydrological
cycle
There are five different types of interventions in the natural
hydrological cycle:

Rwanda National Water Resources Master Plan Page 228
MINIRENA-RNRA OCTOBER 2015
i) abstraction of surface water from a water course, river or
lake
ii) retention of surface water in a reservoir for later user
iii) abstraction of groundwater from an aquifer
iv) release of used water in the natural hydrological cycle
v) miscellaneous interventions that do not involve the
abstraction of release of water per se but which are likely to
have some impact on the natural flow
Ministerial order n°002/16.01 of 24/05/2013 determining
the procedure for declaration, authorization and concession
for the utilization of water
The consultant proposes the suppression of this ministerial
order in order to replace it by a new one, more precise and
complete and based on the proposed Water Permit procedure
Ministerial order determining the permit types and procedures
for the water permit system.

Rwanda National Water Resources Master Plan Page 229
MINIRENA-RNRA OCTOBER 2015
KNOWLEDGE TRANSFER AND CAPACITY BUILDING
Knowledge transfer and capacity building (task 2_5) are identified as an intermittent task
during the exploratory phase (concluded in May 2013) and as a 'continuous' task near the end
of the Master Plan preparation phase (concluded in January 2014). In effect, a series of
training sessions was organized during the month of November 2013.
The entire study and its productions fall under the heading of knowledge transfer and
capacity building. It is factual to mention that especially knowledge transfer is a two way
street; RNRA staff may benefit from the knowledge and expertise of the consultants staff but
in a similar way, the consultant's staff benefit from complementary experience, knowledge
and expertise of the client's staff members.
During the Master Plan study, capacity building is an issue which is mostly directed to the
benefit of especially the RNRA-IWRM. Upon completion of the Master Plan study and
pending the installation of further entities involved in water management services as
identified in the Master Plan study, further training and capacity building efforts will be
required. The next two paragraphs will summarize what has been done so far in the field of
knowledge transfer and capacity building, and what is still required.
2.16 ACTIVITIES UNDERTAKEN DURING THE STUDY
The mechanisms for knowledge transfer and capacity building that have been implemented
during the course of the Master Plan study are:
delivery of study results (several technical notes and formal reports);
o inception report
o technical note on Catchment division
o technical note on Nyabugogo Flooding (several versions plus presentations)
o technical note on special program
o exploratory phase report plus annexes
o paper on water permit procedure
o Catchment Master Plan reports (9 pcs, one for each catchment)
o Water MIS technical specifications and software requirements
o Water MIS Installation and Deployment Manual
o Water MIS Resources Balances User Manual
o Water MIS Geoserver User Manual
o Water MIS Permit System User Manual
o Master Plan main report (with annexes)
workshops with presentation and discussion of study results;
o inception report workshop (with 6 presentations)

Rwanda National Water Resources Master Plan Page 230
MINIRENA-RNRA OCTOBER 2015
o first and second progress report workshop (the second workshop was internal
to RNRA-IWRM; 8 plus 1 presentations)
o exploratory phase report workshop (with 6 presentations)
o master plan report workshop (with 5 presentations)
cooperation between the consultant and the client during field work. The fieldwork
has been concentrated during the exploratory phase; the main fields of investigation
are specified below and mostly all field work has been done with client's staff
participation:
o examination of all hydrological stations and reporting
o discharge measurements at selected hydrological stations and reporting
o infiltration measurements at selected sites and reporting
o installation and monitoring of data loggers for flow measurement at selected
small catchments
o installation and monitoring of data loggers for groundwater stages at selected
aquifers
o ground- and surface water sampling at selected locations for purposes of water
quality investigations and age-dating of groundwater
regular meetings took place between the consultant staff (team leader and others) and
client staff (DDG and others) when required for monitoring of study progress and
alignment of the study with clients expectations
the preparation of an e-learning platform for matters related to water resources and
their use (Hydraccess) has been installed recently;
dedicated training of consultant staff on specific issues, notably those related to the
operation of the different modules of the Water MIS (implemented during the month
of November 2013)
o Water MIS technical specifications
o water resources module : structure and introduction
o water resources module : end user overview of functions, administration and
user management
o water resources module: synchronization and importation of data
o water resources module: other content management (stations, sensors, time
series, ...)
o water balances: structure and introduction
o permit system: structure and introduction (including training on hydrological
viability test)
o permit system: administration and user management
o permit system: content management from application up to permit closure
o Hydraccess: introduction on use and capabilities
o GeoServer: introduction on use and capabilities

Rwanda National Water Resources Master Plan Page 231
MINIRENA-RNRA OCTOBER 2015
worksessions and training with RNRA-ICT department staff on hosting and other
technical issues including installation and deployment of the different server based
modules: Water Resources Module, Water Balances Module, Permit System,
Geoserver.
Notwithstanding this dedicated training on the Water MIS for its exploitation and
maintenance, it is unlikely that this comprehensive but once - off training will suffice for the
smooth implementation and operation of the Water MIS. This requirement is considered in
the next paragraph.
2.17 FURTHER KNOWLEDGE TRANSFER AND CAPACITY BUILDING REQUIREMENTS
Upon completion of the study, further knowledge transfer and capacity building will be
required for the existing RNRA-IWRM division as well as for new entities and the general
public. Without knowledge on staff availability and their capabilities it is not possible to
formulate a tailor made training program. We will here suffice with a listing of the likely
training and briefing requirements for the different institutional entities involved in the
IWRM operations.
RNRA-IWRM
o continued support of selected staff members in charge of the operation of the
system with the exploitation of the Water MIS including support for the
finalization of the Water Permit procedure as suggested by the consultant, data
exchange with MeteoRwanda, the development of proxies for estimating water
use, and other notions.
o continued support in data resources preparation, processing and interpretation
for the establishment of water resources balances and availability.
o (independent) support for the installation, operation and exploitation of fully
automated hydrometric equipment
o continued support for the operation of short term hydrometric stations with
dataloggers at small catchments, data collection and interpretation
o continued support for the installation and operation of groundwater stages
monitoring stations, data collection and interpretation
o continued support with the development of the permit procedures per
intervention type
o dedicated consultancy for the formulation of waste water disposal permits (in
combination with RURA/REMA and possibly other institutions)
o training on customer service for all aspects related to water permits, initiation,
exploitation and closure
o training on completeness check of permit applications
o training on hydrological viability check of permit applications at level 1
catchment
o dedicated consultancy for the development of hydrological viability check of
permit application at level 3 catchment

Rwanda National Water Resources Master Plan Page 232
MINIRENA-RNRA OCTOBER 2015
o support for the development of dedicated water management procedures at
catchment level especially in case of scarcity of resources or excess demand
(in cooperation with CWMO staff)
o dedicated consultancy and research for the development of adequate
environmental flow criteria in large and small catchments
RNRA-ICT
o continued support with the maintenance of the different software solutions
(specifically Drupal, Xataface and GeoServer)
o support for putting the online Water MIS modules into production
environment (deployment of solutions at BSC, after acquisition of adequate
hosting package)
o continued support with the disaster recovery (if needed)
WIC (Water Interministerial Committee)
o briefing of WIC members on aim and procedures of the WIC with special
emphasis on aspects of synchronization of IWRM strategy development; this
may be provided by RNRA-IWRM (secretariat)
o briefing of WIC members on interministerial procedural alignment (for water
permit and EIA applications between IWRM - RDB - REMA), data exchange
(rainfall between MeteoRwanda and IWRM) and planning alignment
(rainwater harvesting, hydropower with water supply, etc.)
RWA
o briefing of RWA staff on aim and procedures of the RWA with special
emphasis on aspects of planning documents approval and synchronization
between catchments and districts, verification and approval of water resources
development and exploitation aspects, highest level of water sector conflict
resolution
NWCC
o Briefing of NWCC members and employees on aim and procedures of the
NWCC with special emphasis on planning and the evaluation of large permits
CWMO (if decided that these entities will be implemented in at least one or several
catchments)
o comprehensive training on aspects of catchment water resources planning
o dedicated training on all aspects of water management with major emphasis on
planning

Rwanda National Water Resources Master Plan Page 233
MINIRENA-RNRA OCTOBER 2015
permit application, operation and closure as per the finally decided
procedures
aspects of resources development
aspects of resources exploitation
hands-on water management procedures on normal and extreme
hydrological conditions in combination with normal and highly
committed natural resources with due consideration of the resources
environment and the intervention methods, prioritization between
users, etc.
aspects of permit exploitation monitoring
o training of staff in aspects of conflict management and customer service
CC (if decided that these entities will be implemented in at least one or several
catchments)
o briefing of CC members on aim and procedures of the CC with special
emphasis on aspects of synchronization of IWRM water resources planning
procedures, resources development and operational water management
procedures development; this may be provided by RNRA-CWMO staff
DC
o Same as for CC with training provided by RNRA-WMO staff preferably in
combined sessions.
SC
o Same as for CC and DC with training provided by RNRA-WMO staff
preferably in combined sessions.
general public and water users (including government related water users, EWSA,
Districts, etc.)
o awareness campaign on the aspects of IWRM with specific emphasis on the
permit procedure (when finalized IWRM), the notion of a registered water
user, the notion of public information on issued water permits, and the nature
of the rights and obligations of water users related to the exploitation of their
permits.
o briefing of (new) aspiring water users on the user registration process, the
permit application process, the permit intervention types and regimes, the
permit holder's rights and obligations according to the permit including the
obligation to provide truthful information, public access to permitted
interventions, etc.
Rwanda National Water Resources Master Plan Page 234
MINIRENA-RNRA OCTOBER 2015
RDB and REMA
o briefing for the alignment of water permit and EIA application and monitoring
exercise.
accredited consultants and consultancy bureaus for permit application handling
o training and accreditation of selected and qualified service providers for the
assessment of surface water abstraction permits and the handling of large scale
direct abstraction permits for RWUs (hydrological modeling)
o training and accreditation of selected and qualified service providers in the
assessment of surface water storage permits and the handling of large scale
direct abstraction permits for RWUs (hydrological modeling)
o training and accreditation of selected and qualified service providers in the
assessment of groundwater abstraction permits and the handling of large scale
direct abstraction permits for RWUs (groundwater modeling)
o upon development of a full set of procedures for handling of waste water
disposal permits, training and accreditation of selected and qualified service
providers in the assessment of groundwater abstraction permits and the
handling of large scale direct abstraction permits for RWUs (water quality
modeling)

Rwanda National Water Resources Master Plan Page 235
MINIRENA-RNRA OCTOBER 2015
3 CROSS CUTTING ISSUES (GENDER, ICT, ENVIRONMENT, SUSTAINABLE
DEVELOPMENT)
The cross cutting issues as there are the environment, sustainability, capacity building and
information technology are very much core to the entire study and these issues are dealt with
extensively in the Exploratory Phase Report and this Master Plan Report. A further
discussion of these issues is not needed.
For the issue of gender however this is very different because none of the tasks identified for
the National Water Resources Master Plan study does address this issue. It is nonetheless
very significant especially where it concerns primary water use at the family level, but it
stretches effortlessly beyond this level when it involves the 'one cow - one poor family'
program (Minagri -RAB), the availability of water for the small vegetable garden within the
family 'rugo' with a direct impact on food security, food supply and household income, fair
and equitable access to water for commercial (agricultural) water use, and the prevention or
at the very least the control of pollution of natural resources.
Hence, where it is evident that women play a crucial role in the 'provision, management and
safeguarding of water' (with reference to the 1992 Dublin conference water principles), it
looks as if this role is still predominantly played as water user at the household level and the
question remains as to how their expertise and demands can be heard when water
management decisions at higher echelons are to be taken.
A first suggested step would be to examine existing documentation on the assessment of the
role of women in water management at all levels (strategy, planning, implementation,
exploitation, monitoring) and for all resources and uses. This examination shouldn't be
limited to the role and position of just women (gender in the strictest sense) but should be
extended to other specific social groups according to age (children, elders) or other relevant
characteristics e.g. occupation, level of education, sensory or physical disabilities, etc.
A logical point of entry would be the Ministry of Gender and Family Promotion (Migeprof)
and its operational structures (National Gender Cluster), as well as international organizations
(GWP Gender strategy; UN Women) and NGOs active in this field. Where it is quite unlikely
that the existing documentation would be exhaustive over the full breadth of the water sector,
it is probably worthwhile to complement this documentation study with a study of the access
to and involvement in the entire water management sector of gender and further relevant
social groups. Such a study could also include a structured assessments of the different
group's opinions and needs across the management levels and resources use in which they are
involved, the disadvantages (or better still the quantified costs) of the non involvement or
inequity of access in the water sector, and a strategic action plan. Pending the results of the
investigations, this action plan could comprise for instance:
a quota system for representatives of social groups for WUAs (if legally possible), for
sector -, district - and catchment councils, positive discrimination for equally
qualified women for the CWMOs and different water management offices at the
national level;
restrictions on children's chores for water collection during school hours;
wheel chair access for public water supply and sanitation facilities (at least in urban
areas, school grounds, etc.)

Rwanda National Water Resources Master Plan Page 236
MINIRENA-RNRA OCTOBER 2015
support (financial, technical or otherwise as needed and 'fair') for disadvantaged
groups in the development of commercial water related ventures
awareness campaign on the issue
etc.
Mainstreaming of the gender issue (as a genteelism for disadvantaged groups) in IWRM
requires a dedicated and comprehensive investigation of the relevant groups (the listing above
is probably incomplete), their issues and the realization of a tailor-made action plan to
address those issues.

Rwanda National Water Resources Master Plan Page 237
MINIRENA-RNRA OCTOBER 2015
4 SUMMARY AND PRINCIPAL CONCLUSIONS AND RECOMMENDATIONS
In essence, this report on the National Water Resources Master Plan of Rwanda contains
three core products: i) the Master Plan, ii) the Water MIS, and iii) the institutional and legal
road maps. These products may be used to transform the current, at times chaotic and rather
ineffective water management procedures which still work out because of very low use
levels, towards state of the art integrated water management capability that makes optimum
use of available (land and water) resources as a means for development and poverty
reduction.
The Master Plan is a comparison of the available renewable resources with water demand
from primary use (essentially water supply to sustain livelihood and the environment) and
from numerous water using commercial ventures in different categories (industrial, mining,
fisheries, livestock, irrigation, hydropower, navigation, recreation, etc.). Based on existing
population data, growth projections thereof and identified development opportunities, water
balances (water resources - water demand equilibriums) for the current situation and for
2020, 2030 and 2040 future dates have been estimated for nine catchments throughout
Rwanda (see chapter 1.5 and Figure 1 for details on the nine catchments).
The findings per catchment are as follows:
the Lake Kivu catchment (CKIV) belongs to the Congo river basin and the catchment
area is formed by all land that drains into Lake Kivu. The water balance is expected
to remain in surplus beyond the 2040 date. Key issues are: high rainfall, development
of potable water supply with a gradual shift from rural to urban demand over the
planning period, protection of land and water resources, rainfed agriculture, potential
for small hydropower development, limited scope for irrigation development as lake
waters are in principle less suitable for irrigation development;
the Rusizi River catchment (CRUS) belongs to the Congo river basin and the
catchment is formed by all land that drains in to the Rusizi River. The river
catchment comprises territory in the DRC and Burundi. The water balance is
expected to remain in surplus beyond the 2040 date. As most demand is located along
the Rubyiro river, the resources of this tributary (CRUS_2) are already extended. Key
issues are similar to the ones listed for CKIV. It is suggested to investigate the use of
Rusizi river water for rice production in the Bugarama valley.
the upper Nyabarongo River catchment (NNYU) belongs to the Nile river basin and
the catchment is formed by all land draining into the Nyabarongo river upstream of
its confluence with the Mukungwa River. The water balance is expected to remain in
surplus beyond the 2040 date. Key issues are: high rainfall, significant and stable
surface flow, large groundwater reserves, surplus resources for downstream
catchments, development of potable water supply shifting from predominantly rural
to predominantly urban supply over the planning period, protection of land and water
resources, rainfed agriculture production, dam construction, irrigation development,
significant small hydropower potential (run of river).
the Mukungwa River catchment (NMUK) belongs to the Nile river basin and the
catchment is formed by all land draining into the Mukungwa River upstream of its
confluence with the Nyabarongo River. The water balance is expected to remain in
surplus beyond the 2040 planning date. Key issues are: high rainfall, significant and
stable surface flow, natural springs, surplus resources for downstream catchments,

Rwanda National Water Resources Master Plan Page 238
MINIRENA-RNRA OCTOBER 2015
development of potable water supply shifting from predominantly rural to
predominantly urban supply over the planning period, protection of land and water
resources, rainfed agriculture production, significant small hydropower potential (run
of river).
The lower Nyabarongo River catchment (NNYL) belongs to the Nile river basin and
the catchment is formed by all land draining into the Nyabarongo river from its
confluence with the Mukungwa River down to its confluence with the Akanyaru
River. The water balance is expected to remain in equilibrium up to the 2040
planning date by optimizing irrigation development (reduction of high lift command
area). Key issues are: medium rainfall, significant and stable surface flow,
development of potable water supply in rural and urban areas (Kigali), protection of
land and water resources, rainfed agriculture, dam construction for flow regulation
and significant irrigation development (marshland, dam, hill side, groundwater),
Muhazi Lake management for irrigation and flow regulation, small hydropower.
The Akanyaru River catchment (NAKN) belongs to the Nile River basin and the
catchment is formed by all land draining into the Akanyaru river up till its confluence
with the Nyabarongo River which is the starting point of the Akagera River. The
river catchment comprises significant territory in Burundi. The catchment resources
will soon be stretched but water balance can maintain equilibrium up to 2040
planning date when significantly reducing and optimizing irrigation development.
Key issues are: medium rainfall, significant but less stable surface flow in extensive
marshland, development of water supply shifting from rural to urban predominance,
protection of land and water resources with wetland vulnerability (Akanyaru peat
marshland and Cyohoha lakes), rainfed agriculture, essential dam construction for
flow regulation and limited irrigation development (marshland, dam, groundwater
irrigation), further development of hill side irrigation must be barred, small
hydropower development
The upper Akagera River catchment (NAKU) belongs to the Nile River basin and the
catchment is formed by all land draining into the Akagera river from its start at the
confluence of the Nyabarongo and Akanyaru rivers up to the Rusumo Falls. The river
catchment comprises significant territory in Burundi and Tanzania. In order to
maintain equilibrium, the water balance requires a transfer of dry season water
resources from upstream catchments (NNYU and NMUK) by 2040. Key issues are:
medium rainfall, significant surface flow from upstream and lateral catchments in
extensive marshlands and lakes, high evaporation losses from marshland and lakes,
protection of land and water resources, development of water supply for rural and
urban areas (Kigali), rainfed agriculture, optimized irrigation development
(marshland and dam irrigation), hill side irrigation restricted to lower lift command
area (<50 m).
The lower Akagera River catchment (NAKL) belongs to the Nile River basin and the
catchment is formed by all land draining into the Akagera river downstream of
Rusumo Falls up to the confluence with the Muvumba River. The river catchment
comprises territory in Tanzania. In order to maintain equilibrium, the water balance
requires a transfer of dry season water resources from upstream catchments (NNYU
and NMUK) by 2040. Key issues are: low rainfall, significant but non perennial
surface flow in tributaries, significant evaporation losses from marshland and lakes,
significant and accessible groundwater resources, protection of land and water
resources with partly poor soils, demand of predominantly rural water supply,

Rwanda National Water Resources Master Plan Page 239
MINIRENA-RNRA OCTOBER 2015
national wildlife park, livestock water demand, irrigation development optimized for
marshland- dam and groundwater irrigation, hill side irrigation restricted to lower lift
command area (<50 m).
The Muvumba River catchment (NMUV) belongs to the Nile River basin and the
catchment is formed by all land draining into this river and its tributary the Mulindi.
The catchment is transboundary with Uganda and flow patterns are complicated. The
catchment's resources are currently stretched and a transfer from upstream
catchments is not practically possible. In order to maintain long term water balance
equilibrium there is need for significant dam development and optimization /
restriction of irrigation development. Key issues are: low rainfall, significant but less
stable surface flow, protection of land and water resources with partly poor soils,
demand of predominantly rural water supply, livestock water demand, irrigation
development optimized for marshland and dam irrigation, further development of hill
side irrigation should be banned
In addition to the key issues identified for each particular catchment, a number of nationwide
development opportunities are proposed as follows:
the substantial shift from rural to urban water supply is expected to center around the
current major urban centers (a list of 17) plus a number of emerging urban centers;
EWSA should consider these centers as such and extend its list of urban centers to
comprise at least part of the 118 identified emerging urban centers
rainwater harvesting in high density urban centers may help solve a number of issues;
research for viable technical solutions is recommended
rainwater harvesting for livestock water is a tested approach in some high rainfall
areas and may likely proof profitable in lower rainfall areas; it is recommended to
optimize and promote this approach
the development of pico hydropower (which is difficult to profitably develop for
communal purposes) for high lift of protected natural springs may proof a viable
technical solution for water supply in areas that are difficult to service by means of
gravity water supply systems. This is recommended for inclusion in water supply
master planning at catchment level.
For the planning period up to 2020, the government related investment costs associated with
the Master plan vary according to the scenario from 2.3 to 2.6 trillion RWF (~ 2.5 to 3 billion
euro) with most of the investment required for rural water supply and the irrigation sector and
slightly over 10% each for urban water supply and other investments.
Slightly increased investment amounts (+ 5 to 10% according to the demand scenario) are
required for the planning period from 2020 to 2030, with a significant increase of the
investment for urban water supply and sanitation against a reduction of the investment for
rural water supply. The investment in the irrigation sector increases to about 50% of overall
investment.
The final planning period sees a substantial increase in investment (up to 4.1, 5 or 5,6 trillion
RWF according to the growth scenario) which is related to reinvestment for expired water
supply facilities after 10 to 30 years. Investment for urban water supply further increases to
about a third of the overall investment.

Rwanda National Water Resources Master Plan Page 240
MINIRENA-RNRA OCTOBER 2015
Contrary to the Master Plan study which is a static planning tool that may eventually be
updated, the Water MIS is a dynamic water resources management tool which is conceived
for the collection, analysis and interpretation of water related data with the aim to facilitate
appropriate water management decisions. The idea is that new data are continuously fed into
the system, analyzed and interpreted with the result that the water management decisions are
made on the basis of up to date data.
The Water MIS consists of three modules as follows:
the water resources module; this module can store water resources data time series on
rainfall, surface flow stages quantity and quality, groundwater stages and quality,
evaporation data, etc. The data in this module are analyzed and interpreted to be used
for water balances. A first set of such interpreted data has been prepared through the
current Master Plan study. With additional resources data (longer time series, higher
spatial resolution, new parameters) the interpretation of water resources data can
improve and the interpreted data adjusted;
the water use and demand module; this module holds interpreted and projected
demand data for current and future times as has been prepared in the current Master
Plan study. A further very important part of this module is the Permit system. It
facilitates the water permit application process, it allows to register the essential
information of a water permit (user, description of resource domain, permitted
intervention from abstraction through to restitution), and to register the actual
intervention quantities and capacities realized.
the balances module: this module holds the creation of water balances at the
catchment level between interpreted resources data and processed and interpreted
demand data for current or future dates. A further option is the balance between
interpreted resources data and water use according to issued permits or between
resources data and water use data declared by the water users.
The system is accessible through the web for data feeding by water management staff or
registered water users (RWU).
The Water MIS is a pilot system and is still relatively limited; it is only handling data at a
spatial resolution of the level 1 catchment (nine units each about 1,500 to 3,000 km²), it is not
(and it will not be) an alert system, the permit application process handles only part of the
suggested permit types (direct abstraction from surface waters, surface water storage, and
groundwater abstractions), and most of the system is 'manual'. However, it consists of
modules and is therefore easily updateable and it allows for very easy data exchange between
water managers and water users.
The successful operation of the Water MIS depends on a number of factors that need to be
addressed:
in the sphere of personnel and users, there is need for:
o further support of RNRA-IWRM staff including ICT department
o installation and support of decentralized RNRA-IWRM staff
o support of water users in the use of the system
in the sphere of data and data processing, there is need for:
o data exchange between government entities (MeteoRwanda, and other with
RNRA-IWRM

Rwanda National Water Resources Master Plan Page 241
MINIRENA-RNRA OCTOBER 2015
o restore hydrological stations basic data, discharge measurements, rating curves
water quality data, groundwater data, small catchment data
o make the permit system operational for three intervention types and start
registering water users
o provide additional training in data handling, analysis and interpretation
Further facilities are needed in the spheres of software and hardware (Microsoft Office
licenses for Access database system, decentralized access to the Internet, final installation of
the system with dedicated RNRA/ICT server, web hosting package, backup solutions,
network access by IWRM, etc.)
The third essential product is the institutional and legal road map. Rwanda has made a
definite choice for the implementation of integrated water resources management for the
sustainable development and protection of its water resources. The 2008 Water Act is entirely
geared toward that approach defining a mostly adequate institutional structure for the
essential functions water Management functions (the institutional structure is schematically
depicted in Figure 22: water management framework in Rwanda):
water resources management strategy definition; the newly proposed Water Inter-
ministerial Committee is a not yet operational platform for synchronizing the different
strategies of the many ministries involved in water. The current status of strategy
definition between government entities is mostly adequate and coherent
water resources planning; this function has been identified as weak due to mostly
lacking vertical (central to decentralized) and horizontal (between water use sectors)
coordination. The water act has identified Minirena with the RNRA-IWRM
department as the pivotal entity for the development of planning products (for
instance NWRMP). For major projects the National Water Consultative Commission
is identified as a platform for review and discussion thus providing essential
horizontal coordination. For the mobilization of the decentralized knowledge, district
and sector committees are foreseen. A major problem with this scheme is that the
district and catchment domains do not in the least align with the result that planning at
district level is a void exercise because of the lack of awareness on available resources
and he inability to optimize scarce resources allocation. For this to be corrected it is
absolutely essential that an additional coordination layer at catchment level be
created. The consultant recommends on the one hand the representative body the
Catchment Committee (one for each catchment) where District and Sector
Committees can synchronize their planning aspirations, with on the other hand the
Catchment Water Management Office (one for each catchment) under the auspices of
the RNRA-IWRM that can provide professional support. The Rwanda Water
Authority is identified in the Water Act and can supervise and coordinate the planning
products at the catchment level
Water resources development: due to the weakness of the planning function, the
development function is affected. The core of the solution is the implementation of a
permit system under control of the RNRA-IWRM. A permit system is an essential
tool for monitoring of water use which can be delegated to the multitude of water
users with the prerequisite that the RNRA-IWRM is capable of collecting, verifying
and interpreting the data. In order to realize this feat, it is essential that the RNRA-

Rwanda National Water Resources Master Plan Page 242
MINIRENA-RNRA OCTOBER 2015
IWRM delegates staff in the catchments to assist and guide aspiring and established
water users; a further reason to install the Catchment Water Management Offices.
Water resources exploitation: the actual interventions of water users in the natural
hydrological cycle is currently largely unknown which makes water resources
management virtually impossible. The pillars for changing this are as follows:
o successful implementation of the permit system between the professionals of
the RNRA-IWRM (including their staff on the ground at the nine CWMOs)
and the registered water users
o definition of operational water management principles considering resources
and use variations (normal and extreme hydrology and normal and high
commitment of resources), prioritization of water uses between primary and
commercial use, different intervention and permit types, environment as a
water user, etc.
o implementation of the operational water management principles under
guidance of the CWMO staff and with supervision of RWA
o handling of conflicts at different levels (user, district, catchment, national)
implicating different mediators (users themselves, district government,
CWMO, RWA)
The responsibilities and functions of the different entities have been reviewed and where
needed strengthened. Along the way there will be need for training and education whether it
is professional permanent staff (CWMO, RWA, NWCC, RNRA-IWRM), elected and/or non
permanent committee members (SC, DC, CC, etc.) or whether it is the general public. A
substantial public awareness campaign on all matters relating to the water sector reform is
mandatory.
A transitional institutional structure combining catchment water resources assessment with
district domain authority has also been proposed which can be implemented immediately in
highly committed catchments (Muvumba).
The legal road map reviews the existing legal instruments and lists a number of suggestions
to modify the current boundaries of existing and newly proposed institutional entities.
The study completes with a brief review in chapter 0 of the current status of knowledge
transfer and capacity building and the proposition of further requirements in that field for
all essential operators involved in IWRM, followed by a brief discussion on cross cutting
issues in chapter 3 with the main emphasis on the mainstreaming of the gender issue in
IWRM where it is noted that gender is a substitute for disadvantaged groups.