Embed Size (px)
Citation preview
Republic of the Philippines
Investor Presentation
March 2018

2
Disclaimer
By viewing or accessing the information contained herein or participating in the presentation, you acknowledge and agree that (i) the information contained herein is strictly confidential and (ii) the
attached information is intended for the recipient of this information only and, except with the prior written consent of the Republic of the Philippines (the “Republic”), shall not be disclosed, reproduced
or distributed in any way to anyone else.
This presentation does not constitute or form part of, and should not be construed as, an offer to sell or the solicitation of an offer to buy or subscribe for securities of the Republic or an inducement to
enter into investment activity in any jurisdiction in which such offer, solicitation or inducement would be unlawful. No part of this presentation, nor the fact of its distribution, should form the basis of, or
be relied on in connection with, any contract or commitment or investment decision whatsoever.
This communication has been prepared by and is the sole responsibility of the Republic, which is the subject of this communication. It has not been reviewed, approved or endorsed by any advisor
retained by Republic. This communication is provided for information purposes only.
Nothing contained in this presentation has been independently verified or shall be relied upon as a promise or representation as to the past or future performance of the Republic. None of the Republic,
any of its officers, representatives, agents, advisors or employees accepts any responsibility for or makes any representation or warranty, express or implied, with respect to, and no reliance should be
placed on, the fairness, accuracy, completeness or correctness of the information contained herein. The Republic is under no obligation to update, modify or amend this communication or to otherwise
notify the recipient if information, opinion, projection, forecast or estimate set forth herein, changes or subsequently becomes inaccurate. None of the Republic, any of its officers, representatives,
agents, advisors or employees shall have any liability whatsoever (including without limitation any liability arising from negligence or otherwise) for any loss howsoever arising from any use of this
presentation or its contents or otherwise arising in connection with the presentation.
This presentation contains forward-looking statements, including statements about the beliefs and expectations of Republic. These statements are based on the Republic's current plans, estimates and
projections, as well as its expectations of external conditions and events. Forward-looking statements involve inherent risks and uncertainties and speak only as of the date they are made. As a result
of these risks, uncertainties and assumptions, undue reliance should not be placed on these forward-looking statements. A number of important factors could cause actual results or outcomes to differ
materially from those expressed in any forward-looking statements. The Republic is not obliged to, and does not intend to, update or revise any forward-looking statements made in this presentation
whether as a result of new information, future events or otherwise.
This presentation contains data sourced from and the views of independent third parties. In replicating such data in this presentation, none of the Republic, any of its officers, representatives, agents,
advisors or employees makes any representation, whether express or implied, as to the accuracy of such data. The replication of any views in this document should not be treated as an indication that
the Republic agrees with or concurs with such views.
The recipient is strongly advised to seek its own independent advice in relation to any investment, financial, legal, tax, accounting or regulatory issues discussed herein. Analyses and opinions
contained herein may be based on assumptions that if altered can change the analyses or opinions expressed. Nothing contained herein shall constitute any representation or warranty as to future
performance of any financial instrument, credit, currency, rate or other market or economic measure. Furthermore, past performance is not necessarily indicative of future results.
This communication is not for distribution to, or for the use of, individual or private customers (including those as defined by the rules of the UK’s Financial Services Authority (FSA)).
This communication is not for publication or distribution, directly or indirectly, in or into the United States or in any other jurisdiction in which such publication or distribution would be prohibited by
applicable law. The securities referred to in this communication have not been nor will be registered under the U.S. Securities Act of 1933, as amended (the "Securities Act") or any state or local
securities laws of the U.S. and may not be offered, sold or delivered in or into the United States except pursuant to an exemption from, or in a transaction not subject to, the registration requirements of
the Securities Act and applicable state or local securities laws of the United States. No public offering is being made in the United States or in any other jurisdiction where such an offering is restricted
or prohibited or where such offer would be unlawful. Any offering of securities will be made by means of an offering circular which will contain detailed information about the Republic and its economic
and other information. Neither this communication nor any portion hereof may be sent or transmitted into the U.S. or any jurisdiction where it is unlawful to do so. No money, securities or other
consideration is being solicited by this communication or the information contained herein and, if sent in response to this communication or the information contained herein, will not be accepted.
Neither this communication nor any information herein nor the fact of its distribution shall form the basis of, or be relied on in connection with, any contract or commitment or investment decision
whatsoever.

3
Table of Contents
Key Terms of the Inaugural Panda Bond….............................................................................4
Philippines – China Relations…..............................................................................................6
Strengthening Credit Profile……………………….......................................................................9
Favorable Macroeconomic Trends.........................................................................................12
Strong External Position….....................................................................................................17
Sound and Stable Financial System…………….......................................................................20
Sound and Strengthening Government Finances..................................................................22
Accelerating Infrastructure Development.............................................................................29
Annex: Socioeconomic Agenda of the Duterte Administration..............................................32

Key Terms of the Inaugural Panda Bond

5
Key Terms of the Inaugural Panda Bond
Offering Summary
Issuer Republic of the Philippines
Issue Size RMB 1.46 bn
Issuer RatingAAA National Scale by China Lianhe Credit Rating Co., Ltd;Baa2 by Moody’s , BBB by S&P, and BBB by Fitch
Issue Date 20th Mar 2018
Book Open Period 9:00am - 16:30pm on 20th Mar 2018
Tenor 3 year
Denoms RMB 1 million * 1 million
Trading and Custody
CIBM Trading; Bond Connect Eligible; PRC Law; Shanghai Clearing House
Settlement Date 23rd Mar 2018
Custody Institution Shanghai Clearing House

Philippines – China Relations

7
Trade between the two countries is expected to further flourish
Philippines – China Investment and Trade Relations
Year Total Export Import Balance of Trade
2014 18.3 8.5 9.9 (1.4)
2015 17.7 6.2 11.5 (5.3)
2016 21.9 6.4 15.6 (9.2)
2017 23.7 6.9 16.8 (9.9)
Note: Details may not add up to total due to roundingSource: Philippine Statistics Authority (PSA)
Robust Philippines-China bilateral merchandise trade
(USD bn)
Major investments between China and the Philippines
Filipino Investors in China Chinese Investors in the Philippines
• San Miguel Group - Beer• Liwayway (China) Co., Ltd - snack food• Solid Industrial (Shenzhen) Co., Ltd - electronic• SM City in China – retail • URC China Commercial Co., Ltd – biscuits• Philippine Airlines Shanghai Office – airline• Metrobank – financials• Eton Properties• Jollibee/Yong He King• Bench Body
• Shanghai Electric Transfer Engineering(Phil)• Dalian Wanyang Heavy Industries Co.,Ltd.• New Hope Central Luzon Agriculture Inc• HLD Clark Steel Pipe Co. Inc.• China State Construction Engineering Corporation• Wuhan Fiberhome International Technologies Phils., Inc.• National Grid Corporation of the Philippines• Sinosteel (Philippines) Co. Ltd. Inc
0.6
10.89.2
27.6
0.0
5.0
10.0
15.0
20.0
25.0
30.0
2015 2016 Jan-Nov 2016 Jan-Nov 2017
1,775.8%
199.2%
Strong growth of Chinese FDIs
Net equity FDI (USD mn) and y-o-y growth (%)
Source: Department of Trade and Industry
Source: Bangko Sentral ng Pilipinas (BSP)

8
Revitalized ties brings promise of massive development deals
Continued Progress in Expanding Philippine Ties with China
President Duterte participated in the Belt and Road Forum in May 2017
The PHP8-9tr infrastructure program of the Duterte Administration will remove transport bottlenecks and promote transport connectivity allowing the Philippines to fully benefit from the BRI
The Roll-on/Roll-off (RORO) Modernization Program of the government, designed to improve and promote the inter-island sea transportation will complement the country’s capability to take advantage of the BRI
Chinese financing and expertise are being tapped to accelerate development of infrastructure projects.
In Dec 2016, the Phil. Senate ratified the membership of the Philippines to the Asian Infrastructure Investment Bank (AIIB) . DPWH’s USD500mn Metro Manila Flood Management Project will be co-financed by AIIB and World Bank
In 2017, the following projects have been approved by the NEDA Board, which is chaired by President Duterte, for Chinese official development assistance: Chico River Pump Irrigation (USD55.1mn), New Kaliwa Dam (USD 222.4mn), PNR Long-haul Rail (Calamba-Bicol) (USD3.5bn), Binondo-intramuros Bridge (USD 91.2mn),
Estrella-Panteleon Bridge (USD27.3mn)
High Level Bilateral
Meetings
President Rodrigo Duterte’s state visit to China in Oct 2016 yielded USD24bn worth of aid and investment pledges
Chinese Premier Li Keqiang and President Duterte met in November 2017 during the ASEAN Meeting in Manila
Increased
Investments from
China
More than 20 infrastructure projects eyed for Chinese funding
Developing Export
Partner
China has resumed giving permits to Philippine companies exporting tropical fruits to China
Booming Tourist
Activity
Average number of
visa applications
processed by the
Philippine Embassy in
China is now at 1,400
per day compared to
less than 500 visa
applications in 2016
FY2017 visitor arrivals
from China reached a
total of 968K an
increase of 43.3%
Strengthening bilateral relations
The Belt and Road Initiative (BRI)

Strengthening Credit Profile
10
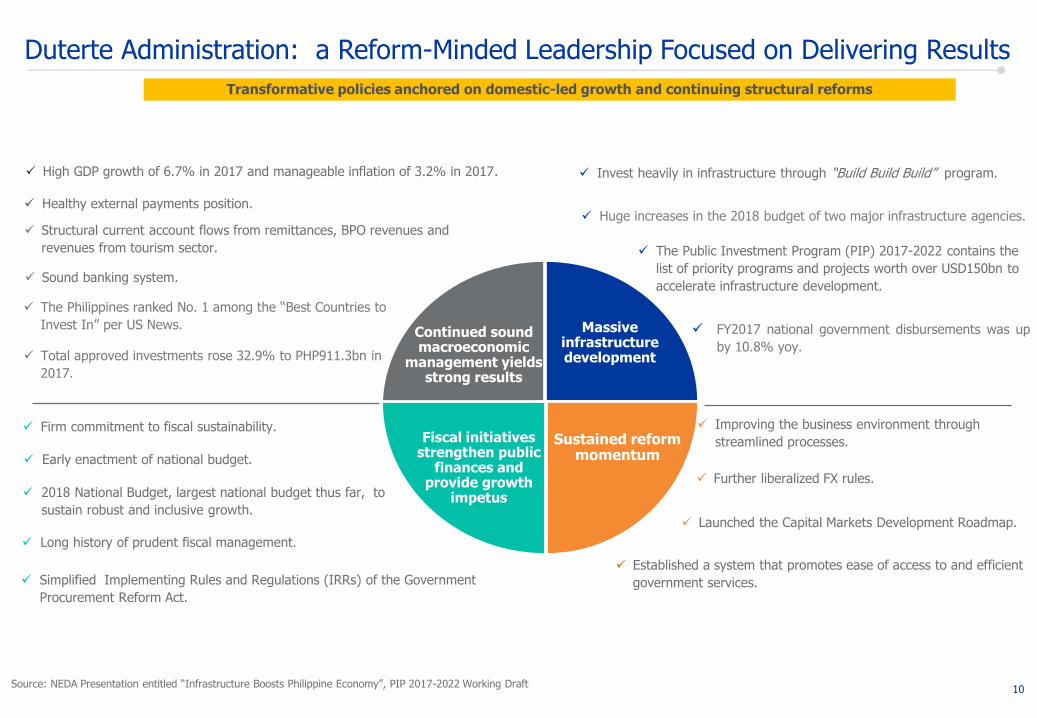
Duterte Administration: a Reform-Minded Leadership Focused on Delivering Results
The Philippines ranked No. 1 among the “Best Countries to
Invest In” per US News.
Transformative policies anchored on domestic-led growth and continuing structural reforms
High GDP growth of 6.7% in 2017 and manageable inflation of 3.2% in 2017.
Continued sound macroeconomic
management yields strong results
Fiscal initiatives strengthen public
finances and provide growth
impetus
Massive infrastructure development
Sustained reform momentum
Established a system that promotes ease of access to and efficient
government services.
Source: NEDA Presentation entitled “Infrastructure Boosts Philippine Economy”, PIP 2017-2022 Working Draft
Invest heavily in infrastructure through “Build Build Build” program.
Firm commitment to fiscal sustainability.
Long history of prudent fiscal management.
Huge increases in the 2018 budget of two major infrastructure agencies.
The Public Investment Program (PIP) 2017-2022 contains the
list of priority programs and projects worth over USD150bn to
accelerate infrastructure development.
Launched the Capital Markets Development Roadmap.
Structural current account flows from remittances, BPO revenues and
revenues from tourism sector.
Further liberalized FX rules.
Sound banking system.
Healthy external payments position.
Early enactment of national budget.
Improving the business environment through
streamlined processes.
Simplified Implementing Rules and Regulations (IRRs) of the Government
Procurement Reform Act.
2018 National Budget, largest national budget thus far, to
sustain robust and inclusive growth.
Total approved investments rose 32.9% to PHP911.3bn in
2017.
FY2017 national government disbursements was up
by 10.8% yoy.

11
Metric 2013 2014 2015 2016 2017
Credit Ratings• Fitch• Moody’s• S&P
BBB-/stable
Baa3/positive
BBB-/stable
BBB-/stable
Baa2/stable
BBB/stable
BBB-/positive
Baa2/stable
BBB/stable
BBB-/positive
Baa2/stable
BBB/stable
BBB/stable
Baa2/stable
BBB/stable
Real GDP Growth Rate (%) 7.1 6.1 6.1 6.9 6.7
GDP Per Capita* (USD), PPP Concept 6,546 6,953 7,332 7,810 8,297
GNI Per Capita* (USD), PPP Concept 7,953 8,426 8,869 9,401 9,972
Inflation Rate (2006 = 100) (%) 3.0 4.1 1.4 1.8 3.2
National Government Interest Payments(as % of Revenues)
18.8 16.8 14.7 13.9 12.6
Fiscal Balance (as % of GDP) -1.4 -0.6 -0.9 -2.4 -2.2
Tax Revenue (as % of GDP) 13.3 13.6 13.6 13.7 15.7
General Government Debt (as % of GDP) 39.2 36.4 36.2 34.6 36.4 (end-Jun)
Gross International Reserves (USD billion) 83.2 79.5 80.7 80.7 81.6
‒ Import Cover (months) 11.6 9.9 9.9 8.8 8.3
Overseas Filipinos’ Cash Remittances (USD billion)
23.0 24.6 25.6 26.9 28.1
Foreign Direct Investments (USD billion) 3.7 5.7 5.6 8.0 8.7 (Jan-Nov)
Current Account (as % of GDP) 4.2 3.8 2.5 -0.3 0.0 (Jan-Sep)
External Debt (as % of GDP) 28.9 27.3 26.5 24.5 23.4 (Jan-Sep)
Sustained Strengthening of Philippines Credit Profile
* At current pricesNA not availableSource: BSP’s Selected Economic and Financial Indicators, DOF, BTr

Favorable Macroeconomic Trends

13
7.16.9
6.7
6.2
5.0
4.2
3.3
6.46.7
6.9 6.8
5.1
5.9
3.9
7.4
6.7 6.66.3
5.35.0
3.5
0.0
1.0
2.0
3.0
4.0
5.0
6.0
7.0
8.0
India(BBB-/Baa2/BBB-)
Philippines(BBB/Baa2/BBB)
China(A+/A1/A+)
Vietnam(BB-/B1/BB-)
Indonesia(BBB-/Baa3/BBB)
Malaysia(A-/A3/A-)
Thailand(BBB+/Baa1/BBB+)
2016 2017 2018P
Philippines is one of the fastest growing economies in Asia
GDP growth of selected Asian economies
Rating: S&P/Moody’s/FitchIMF EstimatesSource: PSA; International Monetary Fund (IMF); Bloomberg L.P.

14
2.5 3.3 4.0 4.4 4.8 4.00.3
0.3
0.70.8
0.90.8
0.40.7
2.94.0
5.7
2.5
-0.3
0.2
-1.2-3.1
-4.5
-0.6
1990-1999 2000-2009 2010-2017 2015 2016 2017
Consumption Government Investment Net Exports Statistical Discrepancy
2.8
4.5
6.36.1
6.9
6.7
0.2 0.4 0.1 0.0 -0.10.3
0.71.2
2.42.2
2.8 2.51.8
2.8
3.83.9
4.2 3.9
1990-1999 2000-2009 2010-2017 2015 2016 2017
Agriculture Industry Services
69.3
69.3
68.7
10.3
10.5
10.5
24.2
28.0
28.6
-3.8
-7.8
-7.8
Household Expenditure Government Spending
Capital Formation Net ExportsSource: PSA National AccountsNote: Numbers may not add up due to rounding
Capital formation remains strong
Gross capital formation (PHP bn, constant prices)
… and is an increasingly key driver of growth
GDP breakdown by expenditure (%)
2011 2012 2013 2014 2015 2016 2017
Construction Durable Equipment Others
+2.8% -4.3%+27.9% +4.2%
Consumption and services as major drivers of growth
GDP breakdown by component
1,5531,490
1,1651,217
1,838
+18.4%
Contribution to growth: supply side (%)Contribution to growth: demand (%)
2,275
2016
2015
+9.0%
2017
2.8
4.5
6.3 6.1
6.96.7
2,480
Economic Rebalancing Towards a More Broad-Based Growth

15
1.12.0
3.23.7
5.7 5.6
8.07.3
8.7
0.0
2.0
4.0
6.0
8.0
10.0
2010 2011 2012 2013 2014 2015 2016 Jan-Nov2016
Jan-Nov2017
• Based on 2018 US News and World Report***,ROP is considered #1 out of 80 countries to investin (survey of US business decision makers)
• ROP is in the top 15 investment destinations ofchoice by multinationals for 2017-2019 based onUNCTAD’s World Investment Report 2017.
• 2017 Investment Climate Statements of the USState Department’s Bureau of Economic andBusiness Affairs cites ROP’s increased attractivenessas FDI destination
Rising Investments Highlight Confidence in Philippine Growth Prospects
Source: PSA, NEDA, BSP, UNCTAD, Bloomberg; * BOP Concept; ** Investment approved by the Philippines’ Investment Promotion Agencies – Board of Investments (BOI), Clark Development Corporation (CDC), Philippine Economic Zone Authority (PEZA), Subic Bay Metropolitan Authority (SBMA), Authority of the Freeport Area of Bataan (AFAB), BOI-Autonomous Region of Muslim Mindanao (BOI-ARMM), and Cagayan Economic Zone Authority (CEZA); ***Developed by US News and World Report together with Y&R's BAV Group and The Wharton School of the University of Pennsylvania
Average Growth of FDI, 2013-2016 (%)*
Sustained inflows from both foreign and local investors and bright prospects highlight confidence in ROP’s fundamentals
Net Foreign Direct Investment (FDI) Flows* (USD bn)
-20.3
-7.9
11.2 12.817.1
27.4
-30
-20
-10
0
10
20
30
Indonesia Thailand Vietnam Malaysia India Philippines
542.7
747.1697.7
754.0 755.9686.9 686.0
911.3
2010 2011 2012 2013 2014 2015 2016 2017
Investors continue to place their bets on ROP
+32.9%
YOY growth
Total Approved Foreign and Filipino Investments (PHP bn)
+20.1%
YOY growth

16
3.7
3.1
2.5
2.2
2.2
2.3
2.0
1.9
1.5
1.5
1.4
3.1
3.3
2.1
1.0
1.7
1.3
0.9
3.0
1.6
1.7
1.5
Iceland (A3/A/A)
Kazakhstan (Baa3/BBB-/BBB)
Panama (Baa2/BBB/BBB)
Peru (A3/BBB+/BBB+)
Thailand (Baa1/BBB+/BBB+)
Spain (Baa2/BBB+/BBB+)
Mexico (A3/BBB+/BBB+)
Uruguay (Baa2/BBB/BBB-)
Philippines (Baa2/BBB/BBB)
Colombia (Baa2/BBB-/BBB)
Poland (A2/BBB+/A-) CPI volatility GDP volatility
5.5
2.9
8.3
4.2
3.8
4.6
3.23.0
4.1
1.4 1.8
3.24.2 4.3 3.5
2006 2007 2008 2009 2010 2011 2012 2013 2014 2015 2016 2017 Jan-Feb2018
2018F 2019F
Inflation Target Band Headline CPI
Sustained Manageable Inflation Environment
Source: BSP; PSA
Inflation remains benign demonstrating monetary policy credibility
Headline CPI (yoy, %), 2006-100
Inflation condition supportive of growth
GDP, CPI volatility (20Y Standard Deviation, 2001-2020F)
Source: IMF World Economic Outlook, October 2017Rating: Moody’s/S&P/Fitch

Strong External Position

18Sources: BSP, IBPAP,NEDA, Department of Tourism
3.53.9
4.34.7 4.8
5.46.0
6.6
7.4
2.5 3.0
3.8 4.4
4.8 5.0 4.8
6.6
2010 2011 2012 2013 2014 2015 2016 2017 2018P
Arrivals Receipts
3.44.5 6.1 7.1 8.9 11 13.2 15.8 18.0 20.5 22.9 24.5 38.9
236 298 371 424527
640777 858
958 1,0441,146
1,250
1,800
2006 2007 2008 2009 2010 2011 2012 2013 2014 2015 2016E 2017P 2022P
Revenues Employment
Structural and ‘Sticky’ Current Account Flows
BPO – a strong driver of employment and revenues
BPO employment (‘000s) and revenues (USD bn)
Sustained growth of remittances over the years
Overseas Filipinos' cash remittances (USD bn)
Tourism industry providing key support to the current account
International visitor receipts (USD bn) and arrivals (mn)
+11.0% YOY growth
arrivals in 2017
• Business Process Outsourcing (BPO) and increasingly tourism sector act as additional, strong economic engines,helping ensure resiliency of ROP’s external payments position against external stresses
12.814.5
16.4 17.3 18.8 20.1 21.4 23.0 24.6 25.6 26.9 28.1 29.2
2006 2007 2008 2009 2010 2011 2012 2013 2014 2015 2016 2017 2018P
+4.3% YOY growth in
2017

19Source: BSP, Bloomberg
Reserve buffer provides protection against external payments shocks…
FX reserves (USD bn) and months of import cover
… while helping smoothen volatility in the foreign exchange market by enabling the necessary adjustments in a continued
volatile global environment
Implied Volatility (YOY %, as of March 9, 2018)
Sustained decline in external debt-to-GDP ratio underscores the health of external finances
External debt (USD bn) and external debt/GDP (%)
Healthy External Finances Shield the Economy from External Shocks
18.523.0
33.837.6
44.2
62.4
75.3
83.8 83.279.5 80.7 80.7 81.6
80.6
4.65.1
6.7 6.4
9.2
10.4
11.6
11.5 11.6
9.9 9.98.8
8.3 8.2
2005 2006 2007 2008 2009 2010 2011 2012 2013 2014 2015 2016 2017 Feb-18
International reserves Import cover
61.6 61.4
66.5 65.2 64.7
73.6 75.6 80.0 78.5 77.7 77.5 74.872.4
59.7
50.244.5
37.6 38.4 36.933.7 32.0 28.9 27.3 26.5 24.5 23.4
2005 2006 2007 2008 2009 2010 2011 2012 2013 2014 2015 2016 Jan - Sep 2017
External Debt External Debt Ratio
9.48.8 8.6
7.9
6.1 5.8 5.6
Korean WonJapanese
YenMalaysianRinggit
IndonesiaRupiah
PhilippinePeso Thai Baht
ChineseRenminbi

Sound and Stable Financial System

21
15.0
15.7
2005 2006 2007 2008 2009 2010 2011 2012 2013 2014 2015 2016 Sep2017Solo basis Consolidated basis
7,612
8,863
1.9 1.7
0
1
2
3
4
5
6
0
1,000
2,000
3,000
4,000
5,000
6,000
7,000
8,000
9,000
10,000
2007 2008 2009 2010 2011 2012 2013 2014 2015 2016 2017Loans outstanding (in PHP bn, LHS) NPL, Gross ratio (in %, RHS)
BSP Regulatory Requirement: 10%
International Standard: 8%
13,59115,161
10,507
11,725
0
2,000
4,000
6,000
8,000
10,000
12,000
14,000
16,000
2007 2008 2009 2010 2011 2012 2013 2014 2015 2016 2017
Assets (in PHP bn) Deposits (in PHP bn)
Solid asset growth
Total Asset and Deposit Levels (PHP bn)
Improved quality of loan portfolio
Total Loan Portfolio (PHP bn) and NPL ratio (%)
Strong capitalization well above international norms
Capital adequacy ratio (%) of U/KBs *
Source: BSPNote: Except otherwise indicated, statistics refers to Philippine Banking System
* UK/Bs – Universal and Commercial Bank
Sustained profitability
Net Profit and ROE
154.3 167.7
10.5 10.2
0
2
4
6
8
10
12
14
020406080
100120140160180
2007 2008 2009 2010 2011 2012 2013 2014 2015 2016 2017
Annualized Net Profit (in PHP bn, LHS) ROE (in %, RHS)
+11.6% YOY growth
in deposits (Dec 2017)
Sound banking system effectively funds productive sectors
Sound and Strengthening Government Finances

23
Double-digit revenue growth due to intensified implementation of administrative reforms
Note: Some values may not sum up to exact figure due to roundingSource: Bureau of the Treasury (BTr) and Department of Budget and Management (DBM)
National Government Fiscal Performance
Actual
Jan-Dec 2017 Jan-Dec 20172018
Program
PHP bn YoY Growth (%) % of GDP PHP bn
Total Revenues 2,473.1 12.6 15.72,788.9
15.9% of GDP12.8% YoY Growth
Tax Revenues 2,250.7 13.6 14.2 2,620.1
Bureau of Internal Revenues 1,772.3 13.1 11.2 2,025.4
Bureau of Customs 458.2 15.6 2.9 577.9
Non-Tax Revenues 222.4 3.2 1.4 166.8
Bureau of the Treasury 99.9 (1.8) 0.6 55.8
Privatization 0.8 26.3 0.0 2.0
Expenditure 2,823.8 10.8 17.93,312.6
18.9% of GDP17.3% YoY Growth
Surplus/(Deficit) (350.6) (0.8) (2.2) (523.7)(3.0) % of GDP
Primary Surplus/(Deficit) (40.1) (18.1) (0.3)
Sound Fiscal Position Creating Fiscal Space for Productive Public Investments

24
68.5
61.4
53.9 54.7 54.852.4 51 51.5
49.2
45.4 44.742.1 42.1
59.2
51.6
44.2 44.2 44.343.5 41.4
40.6 39.336.4 36.2
34.636.4*
2005 2006 2007 2008 2009 2010 2011 2012 2013 2014 2015 2016 2017
National Gov't Debt General Gov't Debt
Sustained decline in debt/GDP ratio
NG Debt and GG Debt (% of GDP)
*as of end-June 2017Sources: DOF, BTr
Long History of Prudent Fiscal Management Supports Growth Momentum

25
Focus on Social Services to empower human capital development
2018 and 2017 National Budget by Sector, PHP bn and % Share
Infrastructure and Other Capital Outlays get a big allocation
2018 National Budget by Expense Class, PHP bn and % Share
Huge increases in the budget of two major
infrastructure agencies
*Includes Philippine Health Insurance CorporationSource: DBM
Department2018 GAA (PHPbn)
2017 GAA (PHPbn)
Share to Total Budget(%)
2018 2017
Social Services 1,425.7 1,351.5 38.8 40.3
Economic Services 1,153.6 922.9 30.6 27.5
General Public Services 655.4 575.4 17.4 17.2
Debt Burden 370.8 351.6 9.9 10.5
Defense 161.5 148.7 4.3 4.4
Total 3,767.0 3,350.0 100 100
Note: Rounding off may not add up to total
Agency2018 GAA(PHPbn)
2017 GAA (PHPbn)
Growth Rate (%)
(2018 vs. 2017 )
DPWH 650.9 467.7 39.2
DOTr 68.1 55.7 22.3
Accelerating human capital development
Agency2018 GAA (PHPbn)
Programs/Projects
DepEd 580.6Implementation of K-to-12 Program, creation of teaching and non-teaching positions
SUCs 65.2 Operations and improvements of public education institutions
CHED 50.5 Scholarships, grants, and subsidies for higher education
TESDA 7.7Training of competitive and technically-proficient students who are employable
DOH* 170.4
Health for All Agenda: Doctors to the Barrios, construction of treatment and rehabilitation centers in provinces, improvement of existing health facilities, free services to the poor in government hospitals
DSWD 141.9Conditional Cash Transfer Program, social pension for indigent senior citizens, supplementary feeding program
Fiscal Policy Focused on Closing the Infrastructure Gap and Enhancing Human Capital

26
The borrowing strategy incorporates debt management objectives in meeting the financing program
National Government Financing 2015 – 2018
Source: Bureau of the Treasury
Strategic Financing Program
Particulars (in millions PHP) Actual 2015 Actual 2016 Actual 2017Program
2017Program
2018
NET FINANCING 242,851 330,939 758,929 584,780 634,863
External (Net) 64,782 -24,113 27,569 43,170 116,735
External (Gross) 189,538 149,523 168,103 182,770 179,720
Less: Amortization 124,756 173,636 140,534 139,600 62,985
Domestic (Net) 178,069 355,052 731,360 541,610 518,128
Domestic (Gross) 420,072 357,497 733,569 544,969 523,158
Treasury Bills -17,303 23,501 26,433 54,969 -
Fixed Rate T Bonds 437,375 333,996 707,136 490,000 -
Less: Net Amortization 242,003 2,445 2,209 3,359 5,030
Gross Borrowing 609,610 507,020 901,672 727,739 702,878
Total Amortization 366,759 176,081 142,743 142,959 68,015
Financing Mix (Domestic : External) 69:31 71:29 81:19 75:25 74:26

27
52 56 56 59 57 56 58 5864 66 67 65 65 67
48 4444 41
43 4442
42 36 34 3335 35
33
2004 2005 2006 2007 2008 2009 2010 2011 2012 2013 2014 2015 2016 2017
External Domestic
30
19
10 8 9 7 7 7 7
41
26
20 14 1210 10 10
18
29
54
7078 79 82 83 84
75
2005 2010 2011 2012 2013 2014 2015 2016 2017
Long-term: >10yrs Medium-term: 1yr to 10yr Short-term: <1yr
Ample domestic liquidity allows ROP to source majority of its financing needs from domestic market minimizing FX risks
Long-dated debt profile reduces refinancing risk
Unless otherwise indicated, graphs pertain to National Government (NG) debtSource: Bureau of the Treasury, BSP
Total debt breakdown (%)
Domestic debt breakdown (%) External debt breakdown (%)
10 4
9096
99.1 100 100 100 100 100 100 100
2003 2005 2010 2011 2012 2013 2014 2015 2016 2017
Long-term: >10yrs Medium-term: 1yr to 10yr Short-term: <1yr
* End Jun 2017
Steady decline in the Republic’s interest service burden
Interest payments / NG revenue (%) and Interest payments / NG expenditure (%)
35.436.9 36.7
31.7
23.6 22.624.8 24.4
20.5 20.418.8
16.8 14.7 13.912.6
27.029.2
31.129.7
23.321.4
19.6 19.317.9 17.6 17.2 16.2
13.9
11.9
11.0
2003 2004 2005 2006 2007 2008 2009 2010 2011 2012 2013 2014 2015 2016 2017
Interest Payments/Revenue Interest Payments/Expenditure
Fiscal Deficit is Increasingly being Funded from Domestic Sources
28
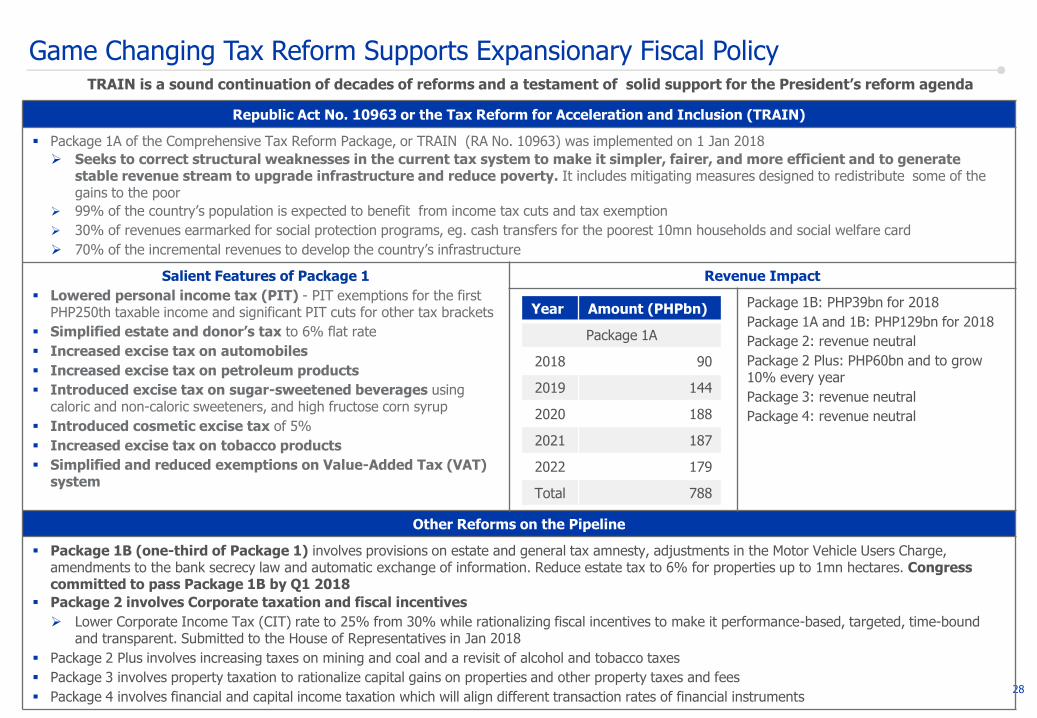
Game Changing Tax Reform Supports Expansionary Fiscal Policy
Republic Act No. 10963 or the Tax Reform for Acceleration and Inclusion (TRAIN)
Package 1A of the Comprehensive Tax Reform Package, or TRAIN (RA No. 10963) was implemented on 1 Jan 2018
Seeks to correct structural weaknesses in the current tax system to make it simpler, fairer, and more efficient and to generate stable revenue stream to upgrade infrastructure and reduce poverty. It includes mitigating measures designed to redistribute some of the gains to the poor
99% of the country’s population is expected to benefit from income tax cuts and tax exemption
30% of revenues earmarked for social protection programs, eg. cash transfers for the poorest 10mn households and social welfare card
70% of the incremental revenues to develop the country’s infrastructure
Salient Features of Package 1
Lowered personal income tax (PIT) - PIT exemptions for the first PHP250th taxable income and significant PIT cuts for other tax brackets
Simplified estate and donor’s tax to 6% flat rate
Increased excise tax on automobiles
Increased excise tax on petroleum products
Introduced excise tax on sugar-sweetened beverages using caloric and non-caloric sweeteners, and high fructose corn syrup
Introduced cosmetic excise tax of 5%
Increased excise tax on tobacco products
Simplified and reduced exemptions on Value-Added Tax (VAT) system
Revenue Impact
Package 1B: PHP39bn for 2018
Package 1A and 1B: PHP129bn for 2018
Package 2: revenue neutral
Package 2 Plus: PHP60bn and to grow 10% every year
Package 3: revenue neutral
Package 4: revenue neutral
Other Reforms on the Pipeline
Package 1B (one-third of Package 1) involves provisions on estate and general tax amnesty, adjustments in the Motor Vehicle Users Charge, amendments to the bank secrecy law and automatic exchange of information. Reduce estate tax to 6% for properties up to 1mn hectares. Congress committed to pass Package 1B by Q1 2018
Package 2 involves Corporate taxation and fiscal incentives
Lower Corporate Income Tax (CIT) rate to 25% from 30% while rationalizing fiscal incentives to make it performance-based, targeted, time-bound and transparent. Submitted to the House of Representatives in Jan 2018
Package 2 Plus involves increasing taxes on mining and coal and a revisit of alcohol and tobacco taxes
Package 3 involves property taxation to rationalize capital gains on properties and other property taxes and fees
Package 4 involves financial and capital income taxation which will align different transaction rates of financial instruments
TRAIN is a sound continuation of decades of reforms and a testament of solid support for the President’s reform agenda
Year Amount (PHPbn)
Package 1A
2018 90
2019 144
2020 188
2021 187
2022 179
Total 788
Accelerating Infrastructure Development

30
Public Investment Program (PIP) 2017-2022
Biggest, Boldest and Most Ambitious Infrastructure Program
Source: DBM Medium Term Fiscal Program as approved during the 170th DBCC Meeting on June 9, 2017 and 171st DBCC Meeting on December 22, 2017, DBM Presentation dated March 9, 2018 at the Philippine Economic Briefing in Davao (for updated 2017 and 2018 infrastructure spending program on an obligation basis), NEDA Presentation entitled “Infrastructure Boosts Philippine Economy” dated January 23, 2018; *PIP 2017-2022 Working Draft dated July 25, 2017; **9 projects without estimated cost yet; ***Purely private investments, corporate funds of GOCCs and internally generated funds of GFIs; Note: Exchange Rate Used is Midpoint of USD49-52 for 2018 DBCC Exchange Rate Assumption, December 22, 2017
Higher investment in
infrastructure is expected to
usher in the Golden Age of
Infrastructure
The country’s development partners are actively extending assistance to
fund the Build Build Build Program
Expanded and newly cemented relations emerging as major
contributors to the game changing infrastructure plan of the
government
4,490projects under the PIP 2017-2022* (USD150bn+)
75 Infrastructure
Flagship Projects
(USD45.3bn)**
Financing the Priority Infrastructure Projects 2017-2022
Mode of Implementation
No. of Projects Investment Requirements
(USD bn)
NG 4,095 95.5
ODA 68 19.9
PPP 39 25.3
Others*** 227 12.4
To be Determined 61 0.1
TOTAL 4,490 153.2
Infrastructure Spending Program (% of GDP)
4.2
5.1
5.4
5.8
5.9
6.1
5.4
6.1
6.8
6.9
6.9
7.3
2017
2018
2019
2020
2021
2022
Cash basis Obligation basis

31
Completed and
Operational4
Under Construction
8
Under Pre-
construction
416
12
4
7
AwardedUSD6.1bn
Under ProcurementUSD10mn
For Evaluation & Approval
Under Development
Under Review By Implementing Agencies
USD1.3bn
Robust Pipeline of Critical Infrastructure Projects75 Flagship Projects
High-impact Infrastructure Projects
- of which 23 projects worth over USD20bn
have been approved by the NEDA Board
Source: DBM, NEDA Presentation entitled “Infrastructure Boosts Philippine Economy” dated January 23, 2018; PPP Center Status
of PPP Projects as of March 7, 2018; *Amount does not include cost of 11 projects without estimate yet
Acronyms: National Economic and Development Authority (NEDA),Department of Public Works and Highways (DPWH), Department of Transportation (DOTr), National Irrigation Administration (NIA), Department of Agriculture (DA), Bases Conversion and Development Authority (BCDA), Department of Energy (DOE), Metropolitan Waterworks and Sewerage System (MWSS), Cebu Port Authority (CPA), Autonomous Region in Muslim Mindanao (ARMM)Note: Exchange Rate Used is Midpoint of USD49-52 of DBCC Exchange Rate Assumption for 2018, December 22, 2017
Agency Type of Project No. of
Projects
Amount
(USD mn)
DPWH Roads, Bridges and Flood control 31 17,386.2
DOTr Airport, Rail, Mass Transit & Ports 14 22,357.9
NIA Water 8 1,140.8
DA Ports 3 298.7
BCDA New Cities, Mass Transit, Rail & Airport 5 3,536.3
DOE Energy 2 14.8
MWSS, CPA, ARMM Water, Ports, Roads 3 595.1
Sub-Total 66 45,329.7
Cost to be Determined
DPWH Roads, Bridges and Flood control 5 TBD
BCDA New Cities 1 TBD
DOTr Airport, Rail, Mass Transit & Ports 1 TBD
DOE Energy 2 TBD
Sub-Total 9 TBD
69.5km Malolos-Clark Railway Project /PNR North 2 (USD4,186.6mn)
25km Metro Manila Subway Project (USD7,068.5mn)
72km PNR South Commuter Line Tutuban-Los Baños(USD2,457.4mn)
581km PNR Long-haul from Los Baños to Bicol, Sorsogon, Batangas (USD3,471.3mn)
Improving Growth Corridors in Mindanao Road Sector Project (USD419.7mn)
102.3km Mindanao Railway: Tagum-Davao City-DigosSegment (USD698.2mn)
Select NEDA Board Approved Flagship Infrastructure
Projects
Status of PPP projects
30projects
USD7.4bn*

Annex: Socioeconomic Agenda of the Duterte Administration

33
Strong mandate from people ensures political capital to advance transformational reforms that will move the economy to even higher growth plane and improve welfare of Filipinos. Action-oriented, results-driven leadership style of the President boosts prospects for a more robust investment climate characterized by common compliance to law and order in a more conducive regulatory environment
10-Point Socioeconomic Agenda of the Duterte Administration
ACCELERATE
INFRASTRUCTURE
SPENDING
INSTITUTE PROGRESSIVE
TAX REFORM
INCREASE
COMPETITIVENESS & EASE
OF DOING BUSINESS
CONTINUE SUCCESSFUL
MACROECONOMIC
POLICIES
PROMOTE RURAL
DEVELOPMENT
IMPROVE SOCIAL
PROTECTION
PROGRAMS
INVEST IN HUMAN CAPITALPROMOTE SCIENCE,
TECHNOLOGY & ARTS
ENSURE SECURITY OF LAND
TENURE & ADDRESS
BOTTLENECKS IN LAND
MANAGEMENT
STRENGTHEN
IMPLEMENTATION OF
RESPONSIBLE PARENTHOOD
& RH LAW
34
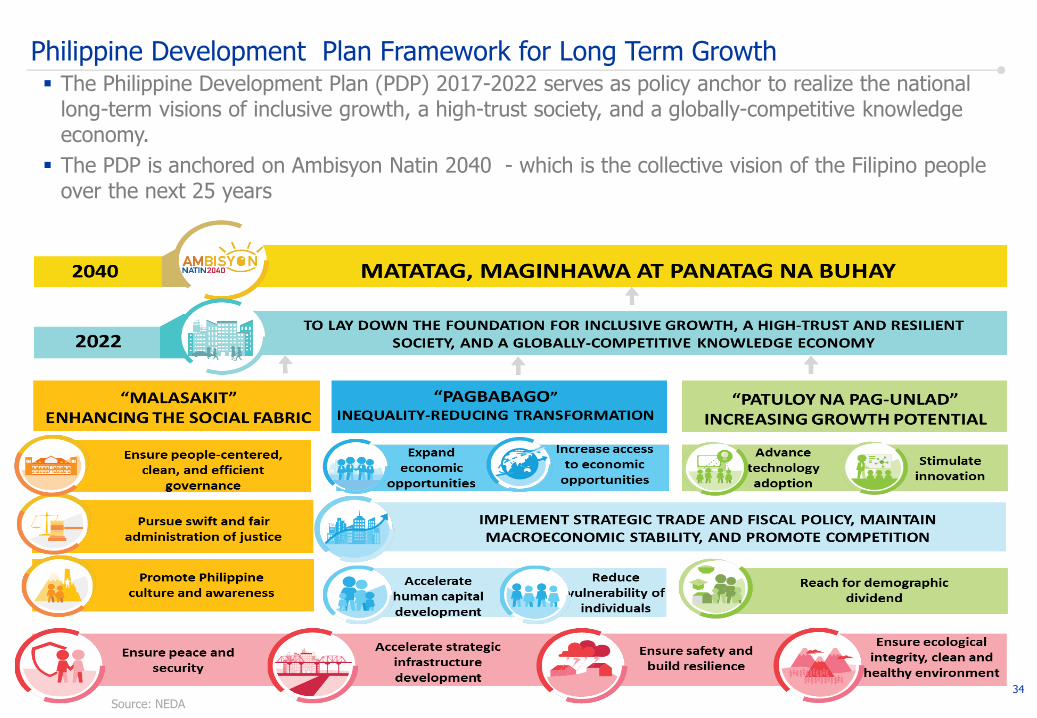
Philippine Development Plan Framework for Long Term Growth
Source: NEDA
The Philippine Development Plan (PDP) 2017-2022 serves as policy anchor to realize the national long-term visions of inclusive growth, a high-trust society, and a globally-competitive knowledge economy.
The PDP is anchored on Ambisyon Natin 2040 - which is the collective vision of the Filipino people over the next 25 years

Republic of the Philippines
Investor Presentation
March 2018