Embed Size (px)
Citation preview

Request for an Incidental Harassment Authorization to Allow the Non-Lethal Take of
Marine Mammals Incidental to Site Characterization Surveys of BOEM Lease Area
OCS-A 0521
Submitted To
National Marine Fisheries Service Office of Protected Resources
Silver Spring, MD
Submitted By
Mayflower Wind Energy LLC
Submitted October 2020 Revised December 2020
Revised April 2021

Mayflower Wind Energy LLC Request for an IHA Revised April 2021
Page ii
Request for an Incidental Harassment Authorization to Allow the Non-Lethal Take of Marine Mammals Incidental to Site Characterization Surveys of BOEM Lease Area OCS-A 0521 Submitted To Jolie Harrison, Division Chief Amy Fowler, Senior Analyst: ESA/MMPA Support Services NOAA Fisheries Office of Protected Resources Permits and Conservation Division 1315 East-West Highway, F/PR1 Room 13805, Silver Spring, MD 20910 Submitted By Mayflower Wind Energy LLC 2 Drydock Avenue Boston, MA 02210 Prepared by LGL Ecological Research Associates, Inc. 4103 S. Texas Avenue, Suite 211 Bryan, TX 77802 October 2020 Revised December 2020 Revised April 2021

Mayflower Wind Energy LLC Request for an IHA Revised April 2021
Page iii
TABLE OF CONTENTS
1.0 DESCRIPTION OF SPECIFIED ACTIVITY ........................................................................................................ 1
1.1. HRG SURVEY DETAILS .............................................................................................................................................. 1 1.2. HRG SURVEY SOUND SOURCES .................................................................................................................................. 3 1.3. GEOTECHNICAL SURVEY ............................................................................................................................................ 5 1.4. VESSEL DYNAMIC POSITIONING .................................................................................................................................. 5
2.0 DATES, DURATION, AND SPECIFIED GEOGRAPHIC REGION ........................................................................ 5
3.0 SPECIES AND NUMBERS OF MARINE MAMMALS ...................................................................................... 5
4.0 AFFECTED SPECIES STATUS AND DISTRIBUTION ...................................................................................... 11
4.1. CETACEANS .......................................................................................................................................................... 11 4.1.1. Fin Whale (Balaenoptera physalus) .......................................................................................................... 11 4.1.2. Humpback Whale (Megaptera novaeangliae) .......................................................................................... 12 4.1.3. Common Minke Whale (Balaenoptera acutorostrata) ............................................................................. 13 4.1.4. North Atlantic Right Whale (Eubalaena glacialis) ..................................................................................... 14 4.1.5. Sei Whale (Balaenoptera borealis) ............................................................................................................ 16 4.1.6. Atlantic White-Sided Dolphin (Lagenorhynchus acutus) ........................................................................... 17 4.1.7. Common Bottlenose Dolphin (Tursiops truncatus) ................................................................................... 18 4.1.8. Harbor Porpoise (Phocoena phocoena) .................................................................................................... 19 4.1.9. Pilot Whales (Globicephala spp.) .............................................................................................................. 20 4.1.10. Risso’s Dolphin (Grampus griseus) .......................................................................................................... 21 4.1.11. Short-beaked Common Dolphin (Delphinus delphis delphis) .................................................................. 22 4.1.12. Sperm Whale (Physeter macrocephalus) ................................................................................................ 23
4.2. PINNIPEDS ........................................................................................................................................................... 24 4.2.1. Gray Seal (Halichoerus grypus) ................................................................................................................. 24 4.2.2. Harbor Seal (Phoca vitulina vitulina) ......................................................................................................... 25
5.0 TYPE OF INCIDENTAL TAKING AUTHORIZATION REQUESTED ................................................................... 26
6.0 TAKE ESTIMATES FOR MARINE MAMMALS ............................................................................................. 26
6.1. BASIS FOR ESTIMATING POTENTIAL “TAKE” ................................................................................................................ 26 6.2. ACOUSTIC THRESHOLDS .......................................................................................................................................... 26 6.3. AREA POTENTIALLY EXPOSED TO SOUNDS ABOVE THRESHOLD LEVELS .............................................................................. 27
6.3.1. Level A ....................................................................................................................................................... 27 6.3.2. Level B ....................................................................................................................................................... 29
6.4. MARINE MAMMAL DENSITIES .................................................................................................................................. 31 6.5. REQUESTED TAKE .................................................................................................................................................. 33
7.0 ANTICIPATED IMPACT OF THE ACTIVITY .................................................................................................. 35
8.0 ANTICIPATED IMPACTS ON SUBSISTENCE USES ....................................................................................... 36
9.0 ANTICIPATED IMPACTS ON HABITAT ....................................................................................................... 36
10.0 ANTICIPATED EFFECTS OF HABITAT IMPACTS ON MARINE MAMMALS ................................................... 36
11.0 MITIGATION MEASURES TO PROTECT MARINE MAMMALS AND THEIR HABITAT.................................... 36
11.1. NUMBER OF PROTECTED SPECIES OBSERVERS ........................................................................................................... 37 11.2. PSO WATCH GUIDELINES ..................................................................................................................................... 37 11.3. DAY-TIME VISUAL MONITORING EQUIPMENT ........................................................................................................... 37 11.4. NIGHT-TIME VISUAL MONITORING EQUIPMENT ........................................................................................................ 37 11.5. DATA COLLECTION AND REPORTING ........................................................................................................................ 37

Mayflower Wind Energy LLC Request for an IHA Revised April 2021
Page iv
11.6. MITIGATION MEASURES ....................................................................................................................................... 37 11.6.1. Exclusion Zones ....................................................................................................................................... 38 11.6.2. Pre-Startup Observations ........................................................................................................................ 38 11.6.3. Ramp-up .................................................................................................................................................. 38 11.6.4. Shut-downs ............................................................................................................................................. 39
11.7. VESSEL STRIKE AVOIDANCE .................................................................................................................................... 39 11.8. SOUND SOURCE VERIFICATION ............................................................................................................................... 39
12.0 MITIGATION MEASURES TO PROTECT SUBSISTENCE USES ...................................................................... 40
13.0 MONITORING AND REPORTING............................................................................................................... 40
14.0 SUGGESTED MEANS OF COORDINATION ................................................................................................. 40
15.0 LITERATURE CITED ................................................................................................................................... 40
APPENDIX A – DISTANCES TO ACOUSTIC THRESHOLDS ........................................................................................ 51

Mayflower Wind Energy LLC Request for an IHA Revised April 2021
Page v
LIST OF ACRONYMS
~ approximately ADC analogue-digital converter AMAPPS Atlantic Marine Assessment Program for Protected Species BIA Biologically Important Area BOEM Bureau of Ocean Energy Management CETAP Cetacean and Turtle Assessment Program CPT cone penetration test dB decibel DMA Dynamic Management Area DP dynamic positioning e.g. for example EEZ Exclusive Economic Zone ESA Endangered Species Act hr hour HRG high-resolution geophysical ITA Incidental Take Authorization IR infrared IWC International Whaling Commission kHz kilohertz kJ kilo-Joule km kilometer LED light-emitting diode m meter MA WEA Massachusetts Wind Energy Area MBES multibeam echo sounder MMPA Marine Mammal Protection Act NARW North Atlantic right whale NEFSC NOAA Northeast Fisheries Science Center NLPSC Northeast Large Pelagic Survey Collaborative NMFS National Marine Fisheries Service NVD night vision device OCS Outer Continental Shelf OSP optimum sustainable population PAM passive acoustic monitoring PSO protected species observer RI/MA WEAs Rhode Island and Massachusetts Wind Energy Areas re 1 µ Pa referenced to one micro Pascal RL received level RWSAS Right Whale Sightings Advisory System SEFSC NOAA Southeast Fisheries Science Center SEL sound exposure level SMA Seasonal Management Area SPL sound pressure level SPLrms root-mean-square sound pressure level SPLcum cumulative sound pressure level SSS side scan sonar UME unusual mortality event USFWS United States Fish and Wildlife Service WTG wind turbine generator

Mayflower Wind Energy LLC Request for an IHA Revised April 2021
Page vi
Mayflower Wind Energy LLC Request for an IHA Revised April 2021
Page 1
1.0 DESCRIPTION OF SPECIFIED ACTIVITY
Mayflower Wind Energy LLC (Mayflower) is a joint venture between Shell New Energies US LLC (Shell) and OW North America LLC, formerly EDPR Offshore North America LLC (OW) co-owned on a 50:50 basis. In December 2018, Mayflower was awarded the BOEM ATL-4W OCS-A 0521 Lease Area (hereafter, the Lease Area), off the coast of Massachusetts, which covers approximately 127,388 acres. Lease Area OCS-A 0521 is located on the OCS approximately 60 km south of Martha’s Vineyard, MA. Mayflower intends to conduct a marine site characterization survey of the Lease Area as well as the export cable route from the Lease Area to landfall, commencing in June 2021. The objective of the survey is to acquire high resolution geophysical (HRG) and geotechnical data on the bathymetry, seafloor morphology, subsurface geology, environmental/biological sites, seafloor obstructions, soil conditions, and locations of any man-made, historical or archaeological resources within Lease Area OCS-A 0521 and along the potential export cable route corridors to support lease development in accordance with Bureau of Ocean Energy Management (BOEM) renewable energy regulations and associated guidelines pursuant to 30 CFR Part 585 as well as state of Massachusetts requirements.
The geophysical surveys would occur from June through December 31, 2021. Surveys would be carried out by up to four (4) different vessels—one operating primarily in the Lease Area and deep-water sections of the cable route (24 hr operations), a second operating primarily in the shallow water portion of the cable route and sometimes into the deep-water portion of the cable route (either daylight only operations or 24 hour operations), and up to two (2) shallow-draft vessels working in very shallow waters (daylight only operations). Up to four additional vessels may be used to conduct geotechnical sampling activities (vibracores, seabed core penetration tests (CPTs), and boreholes) during the same period as the geophysical surveys.
1.1. HRG Survey Details
Figure 1 shows the overall HRG survey area including the Lease Area and the two potential export cable routes from the Lease Area. For assessing potential impacts to marine mammals, the survey has been divided into two areas:
(1) Deep-water Survey Area – This includes the Lease Area where wind turbine generators (WTGs) and inter-array cables will be installed, shaded dark blue in Figure 1. It also includes portions of the potential export cable routes outside of Nantucket Sound and Narragansett Bay. The proposed survey in this area will primarily consist of 24-hour vessel operations, with some 12-hour per day vessel operations possible.
(2) Shallow-water Survey Area – This includes the rest of the export cable routes in shallow waters and very shallow nearshore waters near and inside Nantucket Sound and Narragansett Bay. Depending on vessel availability, survey operations in the shallow water area may occur only during daylight periods or may involve 24-hour survey operations. In the very shallow water areas, one or two shallow-draft (<5 m) vessels will conduct nearshore surveys operating only during daylight hours.
The linear distance (survey tracklines) and number of active sound source days for the anticipated
survey activity is summarized in Table 1. The number of active sound source days was calculated by dividing the total survey trackline lengths in each area by the approximate survey distance per day anticipated to be achieved in each zone. The range of estimates provided for the shallow-water area result from assuming either daylight only (12 hr per day) survey operations or 24-hr per day operations.

Mayflower Wind Energy LLC Request for an IHA Revised April 2021
Page 2
Table 1. Activity Details for 2021 Mayflower Geophysical Surveys from June 1 through December 31.
Location Approximate Survey Trackline (km)
Approximate Survey Distance
Per Day (km) Active Sound Source Days
Lease Area and deep-water section of the cable route 7000 80 88
Shallow-water section of the cable route 3250 30–60 55–109
Very shallow cable route 4100 15 274
Figure 1. Map of Mayflower Wind Lease OCS-A 0521 within the Massachusetts Wind Energy Area and the potential export cable routes to Falmouth, MA (area with black outline and diagonal line infill) and to Narragansett Bay (area outlined with red dashed line).

Mayflower Wind Energy LLC Request for an IHA Revised April 2021
Page 3
1.2. HRG Survey Sound Sources
Some of the sounds produced during the planned surveys have the potential to be audible to marine mammals (MacGillivray et al. 2014). Potential sound-generating equipment that may be used during the geophysical surveys are shown in Table 2, Table 3, and Table 4.
Only the equipment in Table 2 produces sounds that fall within the range of marine mammal hearing (see Section 6) and have the potential to result in behavioral harassment. Although single-beam echosounders and USBL systems (Table 4) produce sounds audible to some marine mammals, they are used for safe vessel navigation and equipment positioning purposes during HRG surveys and are not considered to have the potential to result in take (NMFS 2019 communication regarding Mayflower Letter of Concurrence). Equipment shown in Table 3 has operating frequencies that exceed the upper frequency range of marine mammal hearing and thus are not considered when estimating potential takes.
Table 2. 2021 Mayflower Wind Geophysical Survey Equipment with Operating Frequencies Below 200 kHz.
Equipment Type System Operating Frequency
Sparker
Geomarine Geo-Spark 400 tips, up to 800 J 0.01 – 1.9 kHz
Applied Acoustics Dura-Spark UHD
400 tips, up to 800 J 0.01 – 1.9 kHz
Boomer Applied Acoustics S-boom 0.01 – 5 kHz
Sub-bottom Profiler
Innomar SES-2000 SBP Primary frequencies:
~100kHz (band 85 – 115kHz) Secondary low frequencies
(band 2 – 22 kHz) EdgeTech 3100 with
SB 2-16 towfish 2 – 16 kHz
Edgetech DW-106 1 – 10 kHz Teledyne Benthos Chirp III 2 – 7 kHz
Knudson Pinger SBP 15 kHz

Mayflower Wind Energy LLC Request for an IHA Revised April 2021
Page 4
Table 3. 2021 Mayflower Wind Geophysical Survey Equipment with Operating Frequencies Above 200 kHz.
Equipment Type System Operating Frequency
Sidescan Sonar
EdgeTech 4200 300/600 kHz EdgeTech 4205 300/600/900 kHz EdgeTech 400 300/600 kHz
EdgeTech 2000 300/600 kHz
Multibeam Echosounder
Dual-head Kongsberg EM 2040 200-400 kHz
Dual-head Teledyne SeaBat T50 200-400 kHz
R2Sonic 2024 200-400 kHz
Table 4. 2021 Mayflower Wind Geophysical Survey Navigational Equipment and Geotechnical Survey Equipment.
Equipment Type System Operating Frequency
Single-beam Echosounder* Kongsberg EA 400 38 & 200 kHz
Teledyne Echotrac CV300 3.5-50 kHz & 100 kHz-1mHz
USBL*
Kongsberg HiPAP 35x/45x/50x models 20 - 30 kHz
Sonardyne Scout, Ranger, and MiniRanger models 19 - 34 kHz
Sonardyne Coastal Transponder 35 - 50 kHz
Surface Navigation including DGNSS/Gyrocompass/Attitude
Sensors
Applanix POSMV & Veripos Apex
N/A
CTD/SVP Teledyne RapidCast N/A Surface Navigation including
DGNSS/Gyrocompass/Attitude Sensors
Applanix POSMV & Veripos Apex
N/A
Gradiometer Geometrics G-882 Marine Magnetometer Transverse
Gradiometer Array
N/A
Vibracore 4 inch diameter N/A
CPT
Datem Neptune 3000 N/A Geoquip Marine GMC201 N/A WISON-APB (downhole) N/A
* Navigational Equipment

Mayflower Wind Energy LLC Request for an IHA Revised April 2021
Page 5
1.3. Geotechnical Survey
Within the Lease Area and along the export cable routes, a geotechnical campaign including vibracores, seabed CPT and borehole sampling will be conducted at approximately 750 locations by up to four additional vessels in June through December 2021. Camera systems that will be used for visual surveys of the seafloor and shallow sub-surface in all survey areas do not produce sounds. Geotechnical sampling will be conducted from a vessel with a Dynamic Positioning (DP) system.
During geotechnical surveying, sounds produced by vibracoring and CPT are within marine mammal hearing ranges. However, NMFS recently reported that the likelihood of vibracoring sounds rising to the level of take is so low as to be discountable because of the short duration of the activity and the fact that marine mammals are expected to react to the vessel and DP sounds before the vibracoring starts (e.g., NMFS 2018a, b, c). NMFS also reported recently that field studies have shown that CPT sounds are unlikely to exceed marine mammal acoustic harassment thresholds and are thus unlikely to result in takes (e.g., NMFS 2018a, b, c). Thus, the geotechnical sampling is not anticipated to result in marine mammal take and therefore is not considered further in this application.
1.4. Vessel Dynamic Positioning
Vessels conducting geotechnical surveys use DP systems to maintain vessel position at specific locations during sampling activities. DP systems use bow-thrusters that create non-impulsive sounds that are similar to other vessel sounds like the vessel’s main propeller(s). Although DP thruster sounds are within marine mammal hearing ranges, NMFS reported recently that monitoring of past projects during DP thruster use has shown a lack of behavioral response to these sounds by marine mammals and thus the probability that DP thruster use would result in marine mammal take is so low as to be discountable (e.g., NMFS 2018a, b, c). Vessel DP use is therefore not considered further in this application.
2.0 DATES, DURATION, AND SPECIFIED GEOGRAPHIC REGION
Mayflower's 2021 site characterization survey will occur within BOEM Renewable Energy Lease Area OCS-A 0521 offshore Massachusetts and along the potential export cable routes from the Lease Area to landfall at Falmouth, MA and within Narragansett Bay, RI (Figure 1). The Lease Area comprises approximately 127,388 acres (515.5 km2) and lies approximately 20 nautical miles (38 km) south-southwest of Nantucket. Water depths within the Lease Area range from 126–204 ft (38–62 m).
The survey is expected to begin on or after June 1, 2021 and conclude by December 31, 2021. Inclusive of any weather downtime and crew transfers the planned survey activities should be completed within this 7-month period. This includes up to four vessels operating concurrently for a combined total of approximately 470 vessel-days.
3.0 SPECIES AND NUMBERS OF MARINE MAMMALS
Table 5 lists the 26 marine mammal species that potentially could occur within the Lease Area and surrounding waters, along with their listing status under the Endangered Species Act (ESA), their relative likelihood of occurrence, and their documented abundance in the region. Additional details of species abundances are provided in Section 4 below in the individual species descriptions. The species in the region include six species of large baleen whale (mysticetes); 17 species of large and small toothed whales, dolphins, and porpoise (odontocetes); and three species of earless seals (phocid pinnipeds). It is unlikely that all 26 species would be present in the Lease Area during the site characterization survey because some of them are seasonal migrants and because their distributions vary among years based on factors such as oceanographic characteristics and prey availability. Seasonality and abundance reported in Table 5 and

Mayflower Wind Energy LLC Request for an IHA Revised April 2021
Page 6
discussed below were mainly derived from the Northeast Large Pelagic Survey Collaborative (NLPSC) aerial surveys of the Rhode Island/Massachusetts Wind Energy Areas (RI/MA WEAs) during 2011–2015 (Kraus et al. 2016), Roberts et al. (2016, 2017, 2018) habitat-based density models, and the Kenney and Vigness-Raposa (2010) marine mammal assessment for the Rhode Island Ocean Special Area Management Plan as well as the NOAA Fisheries 2018 Stock Assessment Report (Hayes et al. 2019). Additional sighting data from Atlantic Marine Assessment Program for Protected Species (AMAPPS) shipboard and aerial surveys is also reported where relevant.
Of the 26 marine mammal species listed in Table 5, eleven species are considered to be “rare” in the area based on sighting and distribution data: blue whale (Balaenoptera musculus), dwarf and pygmy sperm whales (Kogia sima and K. breviceps), Cuvier’s beaked whale (Ziphius cavirostris), four species of Mesoplodont beaked whales—Blainsville’s (Mesoplodon densirostris), Gervais’ (M. europaeus), Sowerby’s (M. bidens), and True’s (M. mirus)—Atlantic spotted dolphin (Stenella frontalis), striped dolphin (Stenella coeruleoalba), and harp seal (Pagophilus groenlandicus) (Hayes et al. 2019; Kenney and Vigness-Raposa 2010; Kraus et al. 2016; Roberts et al. 2016). Given the rarity of these species in the area and the relatively short duration of the proposed activities, the probability of these species being exposed to survey activities is quite low, and they are thus not considered further in this request. The short-finned pilot whale is also considered rare in this area; however, because the density and population estimates that we use (Roberts et al. 2017) consider both long- and short-finned pilot whales together as a pilot whale "guild", our take request for pilot whales would include a small percentage of short-finned pilot whales.
Other marine mammal species that have been documented to occur within the U.S. Atlantic Exclusive Economic Zone (EEZ) but are not expected to be present in the Lease Area based on a scarcity of sightings and their known habitat preferences and distributions are: the West Indian manatee (Trichechus manatus), Bryde’s whale (Balaenoptera edeni), beluga whale (Delphinapterus leucas), northern bottlenose whale (Hyperoodon ampullatus), killer whale (Orcinus orca), pygmy killer whale (Feresa attenuata), false killer whale (Pseudorca crassidens), melon-headed whale (Peponocephala electra), white-beaked dolphin (Lagenorhynchus albirostris), pantropical spotted dolphin (Stenella attenuata), Fraser’s dolphin (Lagenodelphis hosei), rough-toothed dolphin (Steno bredanensis), clymene dolphin (Stenella clymene), spinner dolphin (Stenella longirostris), hooded seal (Cystophora cristata), and ringed seal (Pusa hipsida) (CeTAP 1982; USFWS 2014; Hayes et al. 2019; Kenney and Vigness-Raposa, 2010; Kraus et al. 2016; Roberts et al. 2016). These 16 species are not considered further in this request.

Mayflower Wind Energy LLC Request for an IHA Revised April 2021
Page 7
Table 5. Marine mammal species that could be present in the BOEM OCS-A 0521 Renewable Energy Lease Area
Common Name (Species Name) and Stock ESA/MMPA Statusa Hearing Groupb Occurrence
in MA WEAc Seasonality in
MA WEAd
Abundancee (NOAA
Fisheries best available)
Abundancef (Roberts et al.
2016, 2017, 2018)
Mysticetes
Blue whale (Balaenoptera musculus) Western North Atlantic Stock
Endangered/ Strategic
Low-frequency cetacean Rare Mainly winter, but
rare year-round Unknown 11
Fin whale (Balaenoptera physalus) Western North Atlantic Stock
Endangered/ Strategic
Low-frequency cetacean Common
Year-round, but mainly spring and
summer 3,006 3,005
Humpback whale (Megaptera novaeangliae) Gulf of Maine Stock
Not Listed/Not Strategic
Low-frequency cetacean Common
Year-round, but mainly spring and
summer 1,396 248 Winter,
1,773 Summer
Minke whale (Balaenoptera acutorostrata) Canadian East Coast Stock
Not Listed/Not Strategic
Low-frequency cetacean Common
Spring, summer, and fall (March to
September) 2,591 652 Winter,
3,014 Summer
North Atlantic right whale (Eubalaena glacialis) Western North Atlantic Stock
Endangered/ Strategic
Low-frequency cetacean Common
Winter and spring (December to
May) 428
292 Winter, 394 Spring,
358 Summer, 124 Fall
Sei whale (Balaenoptera borealis) Nova Scotia Stock
Endangered/ Strategic
Low-frequency cetacean Common
Spring and summer (March to
June) 28 201 Winter,
453 Summer
Odontocetes
Atlantic spotted dolphin (Stenella frontalis) Western North Atlantic Stock
Not Listed/Not Strategic
Mid-frequency cetacean Rare NA 39,921
20,918 January, 22,787 April, 30,333 July,
24,325 October

Mayflower Wind Energy LLC Request for an IHA Revised April 2021
Page 8
Common Name (Species Name) and Stock ESA/MMPA Statusa Hearing Groupb Occurrence
in MA WEAc Seasonality in
MA WEAd
Abundancee (NOAA
Fisheries best available)
Abundancef (Roberts et al.
2016, 2017, 2018)
Atlantic white-sided dolphin (Lagenorhynchus acutus) Western North Atlantic Stock
Not Listed/Not Strategic
Mid-frequency cetacean Common Year-round 31,912
27,246 January, 35,909 April, 91,473 July,
77,042 October
Blainville’s, Gervais’, True’s, and Sowerby’s beaked whales (Mesoplodon densitostris, M. europaeus, M. mirus, and M. bidens) Western North Atlantic Stock
Not Listed/Not Strategic
Mid-frequency cetacean Rare NA 10,107 5,937g
Common bottlenose dolphin (Tursiops truncatus) Western North Atlantic Offshore Stockh
Not Listed/Not Strategic
Mid-frequency cetacean Common Year-round 62,851
69,251 January, 66,713 April, 75,620 July,
82,379 October
Cuvier's beaked whale (Ziphius cavirostris) Western North Atlantic Stock
Not Listed/Not Strategic
Mid-frequency cetacean Rare NA 5,744 7,731
Dwarf and pygmy sperm whale (Kogia sima and K. breviceps) Western North Atlantic Stock
Not Listed/Not Strategic
High-frequency cetacean Rare NA 7,750 6,197
Harbor porpoise (Phocoena phocoena) Gulf of Maine/Bay of Fundy Stock
Not Listed/Not Strategic
High-frequency cetacean Common
Year-round, but less abundant in
summer 75,079 13,782 Winter,
60,281 Summer
Pilot whale, long-finned (Globicephalus melas) Western North Atlantic Stock
Not Listed/Not Strategic
Mid-frequency cetacean Uncommon Year-round 39,215 27,597i
Pilot whale, short-finned (Globicaphalus macrorhynchus) Western North Atlantic Stock
Not Listed/Not Strategic
Mid-frequency cetacean Rare NA 28,924 27,597i
Risso’s dolphin (Grampus griseus) Western North Atlantic Stock
Not Listed/Not Strategic
Mid-frequency cetacean Uncommon Year-round 35,493
5,254 January, 10,631 April, 23,010 July,
7,883 October

Mayflower Wind Energy LLC Request for an IHA Revised April 2021
Page 9
Common Name (Species Name) and Stock ESA/MMPA Statusa Hearing Groupb Occurrence
in MA WEAc Seasonality in
MA WEAd
Abundancee (NOAA
Fisheries best available)
Abundancef (Roberts et al.
2016, 2017, 2018)
Short-beaked common dolphin (Delphinus delphis delphis) Western North Atlantic Stock
Not Listed/Not Strategic
Mid-frequency cetacean Common
Year-round, but more abundant in
summer 80,227
76,792 January, 98,027 April, 121,292 July,
113,119 October
Sperm whale (Physeter macrocephalus) North Atlantic Stock
Endangered/ Strategic
Mid-frequency cetacean Uncommon Mainly summer
and fall 4,349 4,199j
Striped dolphin (Stenella coeruleoalba) Western North Atlantic Stock
Not Listed/Not Strategic
Mid-frequency cetacean Rare NA 67,036 76,660
Pinnipeds
Gray seal (Halichoerus grypus) Western North Atlantic Stock
Not Listed/Not Strategic Phocid pinniped Common Year-round 27,131
10,709 January, 14,246 April, 11,961 July,
8,581 Octoberk
Harbor seal (Phoca vitulina) Western North Atlantic Stock
Not Listed/Not Strategic Phocid pinniped Common Year-round, but
rare in summer 75,834 10,709 January,
14,246 April, 11,961 July,
8,581 Octoberk
Harp seal (Pagophilus groenlandicus) Western North Atlantic Stock
Not Listed/Not Strategic Phocid pinniped Uncommon Winter and spring Unknownl
10,709 January, 14,246 April, 11,961 July,
8,581 Octoberk
a Listing status under the US Endangered Species Act (ESA) and Marine Mammal Protection Act (MMPA). b Hearing group according to NOAA Fisheries technical guidance (NMFS 2018). NOTE: Hearing groups names were recently revised by Southall et al. (2019). c Occurrence in the Massachusetts Wind Energy Area (MA WEA) is mainly derived from Hayes et al. (2019), Kenney and Vigness-Raposa (2010), Kraus et al. (2016), and Roberts et al. (2016). d Seasonality in the MA WEA was mainly derived from Kraus et al. (2016) and Kenney and Vigness-Raposa (2010). e "Best Available" population estimate is from NOAA Fisheries 2019 Stock Assessment Report (Hayes et al. 2020). f Abundance estimates are from habitat-based density modeling of the Atlantic EEZ from Roberts et al. (2016, 2017, and 2018). g The four Mesoplodont beaked whale species are grouped in Roberts et al. (2017).

Mayflower Wind Energy LLC Request for an IHA Revised April 2021
Page 10
h Common bottlenose dolphins occurring in the MA Wind Energy Area likely belong to the Western North Atlantic Offshore Stock. It is possible that some could belong to the Western North Atlantic Northern Migratory Coastal Stock (listed as depleted under the MMPA), but the northernmost range of that stock is south of the Lease Area.
i Long-finned and short-finned pilot whales are grouped in Roberts et al. (2017). j Roberts et al. (2017) sperm whale abundance estimate consists of 223 for the shelf area and 3,976 for the slope and abyss. k All phocid seals are considered together as a group in Roberts et al. (2018). l Hayes et al. (2019) report insufficient data to estimate the population size of harp seals in U.S. waters; however, the best estimate for the whole population is 7.4 million and this appears to be
stable.

Mayflower Wind Energy LLC Request for an IHA Revised April 2021
Page 11
4.0 AFFECTED SPECIES STATUS AND DISTRIBUTION
As discussed in Section 3 above, fifteen species of marine mammals are known to occur either commonly or uncommonly (but with some regularity) within the Lease Area and surrounding waters. The North Atlantic right whale (NARW), fin whale, sei whale, and sperm whale are all considered endangered under the ESA. These four species are also all considered strategic stocks under the Marine Mammal Protection Act (MMPA; Hayes et al. 2019). The common bottlenose dolphins occurring in the Lease Area would likely belong to the Western North Atlantic Offshore Stock, which is not considered strategic. It is possible, however, that some could belong to the Western North Atlantic Northern Migratory Coastal Stock, which is considered depleted under the MMPA and therefore a strategic stock, but the northernmost range of that stock is generally south of the Lease Area. The sections below provide additional details on the distribution, abundance, and status of the marine mammal species or stocks that could occur in the Lease Area.
4.1. Cetaceans
4.1.1. Fin Whale (Balaenoptera physalus) The fin whale is the second largest baleen whale and is widely distributed in all the world’s oceans,
but is most abundant in temperate and cold waters (Aguilar and García-Vernet 2018). Fin whales are presumed to migrate seasonally between feeding and breeding grounds, but their migrations are less well defined than for other baleen whales. In the North Atlantic, some feeding areas have been identified but there are no known wintering areas (Aguilar and García-Vernet 2018). Fin whales are found in the summer from Baffin Bay, Spitsbergen, and the Barents Sea south to North Carolina and the coast of Portugal (Rice 1998). Apparently not all individuals migrate, because in winter they have been sighted from Newfoundland to the Gulf of Mexico and the Caribbean Sea, and from the Faroes and Norway south to the Canary Islands (Rice 1998). Fin whales off the eastern United States, Nova Scotia, and the southeastern coast of Newfoundland are believed to constitute a single stock under the present International Whaling Commission (IWC) management scheme (Donovan 1991), which has been called the Western North Atlantic stock.
Distribution
In the U.S. Atlantic EEZ, fin whales are the most commonly observed large whale, accounting for almost half of all large whales sighted over the continental shelf during aerial surveys from Cape Hatteras to Nova Scotia (CETAP 1982). Western North Atlantic fin whales typically feed in the Gulf of Maine and the waters surrounding New England, but mating and calving (and general wintering) areas are largely unknown (Hain et al. 1992; Hayes et al. 2019). It is likely that fin whales occurring in the U.S. Atlantic EEZ undergo migrations into Canadian waters, open-ocean areas, and perhaps even subtropical or tropical regions. Hain et al. (1992) suggest that calving takes place during October to January in latitudes of the US mid-Atlantic region.
Kraus et al. (2016) suggest that, compared to other baleen whale species, fin whales have a high multi-seasonal relative abundance in the Rhode Island/Massachusetts (RI/MA) and MA WEAs and surrounding areas. Fin whales were observed during spring and summer of the 2011–2015 NLPSC aerial survey. This species was observed primarily in the offshore (southern) regions of the RI/MA and MA WEAs during spring and was found closer to shore (northern areas) during the summer months (Kraus et al. 2016). Calves were observed three times and feeding was observed nine times during the Kraus et al. (2016) study. Although fin whales were largely absent from visual surveys in the RI/MA and MA WEAs in the fall and winter months (Kraus et al. 2016), acoustic data indicated that this species was present in the RI/MA and MA WEAs during all months of the year. Fin whales were acoustically detected in the MA WEA on 87%

Mayflower Wind Energy LLC Request for an IHA Revised April 2021
Page 12
of study days (889/1,020 days). Acoustic detection data indicated a lack of seasonal trends in Fin whale abundance with slightly less detections from April to July (Kraus et al. 2016). Because the detection range for fin whale vocalizations is more than 200 km, detected signals may have originated from areas far outside of the RI/MA and MA WEAs; however, arrival patterns of many fin whale vocalizations indicated that received signals likely originated from within the Kraus et al. (2016) study area. Fin whales were observed in the MA WEA and nearby waters during spring and summer of the 2010–2017 AMAPPS surveys (NEFSC and SEFSC 2011–2018).
Abundance
Roberts et al. (2017) habitat-based density models provided abundance estimates of 1,629 fin whales in the U.S. Atlantic EEZ during February and 4,859 during June, which were the months predicted to have the lowest and highest abundances, respectively. The best available abundance estimate for the Western North Atlantic fin whale stock in U.S. waters from NMFS stock assessments is 3,006 individuals (Hayes et al. 2020).
Status
The status of the Western North Atlantic stock of fin whales relative to its optimum sustainable population (OSP) in the U.S. Atlantic EEZ is unknown, but the North Atlantic population is listed as Endangered under the ESA and MA ESA, and NMFS considers this a strategic stock. There are currently no critical habitat areas established for the fin whale under the ESA. The Lease Area is flanked by two Biologically Important Areas (BIAs) for feeding for fin whales—the area to the northeast in the southern Gulf of Maine is considered a BIA year-round, while the area to the southwest off the tip of Long Island is a BIA from March to October (LaBrecque et al. 2015).
4.1.2. Humpback Whale (Megaptera novaeangliae) Humpback whales are found in all ocean basins (Clapham 2018). This species is highly migratory,
traveling between mid- to high-latitude waters where it feeds during spring through fall and lower latitude wintering grounds where it calves and generally does not feed. Routine migratory distances are thousands of kilometers (Kennedy et al. 2014). Although considered to be mainly a coastal species, humpback whales often traverse deep pelagic areas while migrating (Baker et al. 1998; Calambokidis et al. 2001; Garrigue et al. 2002). In the North Atlantic, six separate humpback whale sub-populations have been identified by their consistent maternally determined fidelity to different feeding areas (Clapham and Mayo 1987). These populations are found in the Gulf of Maine, Gulf of St. Lawrence, Newfoundland/Labrador, western Greenland, Iceland, and Norway (Hayes et al. 2019). The large majority of humpback whales that inhabit the waters in the U.S. Atlantic EEZ belong to the Gulf of Maine stock. In the western North Atlantic, the Gulf of Maine humpback whale stock is recognized as a distinct feeding stock on the basis of strong site fidelity by individual whales to the region and more recent genetic analysis (Palsbøll et al. 2001; Vigness-Raposa et al. 2010; Hayes et al. 2019).
Distribution
Humpback whales in the Gulf of Maine stock typically feed in the waters between the Gulf of Maine and Newfoundland during spring, summer, and fall, but have been observed feeding in other areas, such as off the coast of New York (Sieswerda et al. 2015). Some humpback whales from the Gulf of Maine migrate to the West Indies in the winter, where they mate and calve their young (Katona and Beard 1990; Palsbøll et al. 1997). However, not all humpback whales from the Gulf of Maine stock migrate to the West Indies every winter because significant numbers of animals are observed in mid- and high-latitude regions at this time (Swingle et al. 1993).
Kraus et al. (2016) observed humpback whales in the RI/MA and MA WEAs and surrounding areas during all seasons of the 2011–2015 NLPSC aerial survey. Humpback whales were observed most often

Mayflower Wind Energy LLC Request for an IHA Revised April 2021
Page 13
during the spring and summer months, with a peak from April to June. Calves were observed 10 times and feeding was observed 10 times during the Kraus et al. (2016) study. That study also observed one instance of courtship behavior. Although humpback whales were only rarely seen during fall and winter surveys, acoustic data indicate that this species may be present within the MA WEA year-round, with the highest rates of acoustic detections in winter and spring (Kraus et al. 2016). Humpback whales were acoustically detected in the MA WEA on 56% of acoustic survey days (566/1,020 days). Acoustic detections do not differentiate between individuals, so detections on multiple days could be the same or different individuals. The mean detection range for humpback whales using passive acoustic monitoring (PAM) was 30–36 km, with a mean radius of 36 km for the PAM system. Kraus et al. (2016) estimated that 63% of acoustic detections of humpback whales represented whales within their study area. Humpback whales were observed in the MA WEA and nearby waters during the spring and summer of the 2010–2017 AMAPPS surveys (NEFSC and SEFSC 2011–2018).
Abundance
The most recent ocean basin-wide estimate of the North Atlantic humpback whale population is 11,570 (Palsbøll et al. 1997). Roberts et al. (2017) habitat-based density models provide abundance estimates of 248 humpback whales in the U.S. Atlantic EEZ during the winter and 1,773 during the summer. The best available abundance estimate for the Gulf of Maine humpback whale stock is 1,396 (95% credible interval 1363-1429), which was based on a state-space model of the sighting histories of individual whales identified using photo-identification techniques (Hayes et al., 2020). and this population appears to be increasing (Hayes et al. 2019).
Status
The entire humpback whale species was previously listed as endangered under the ESA. However, in September 2016, NOAA Fisheries identified 14 Distinct Population Segments (DPSs) of humpback whales and revised the ESA listing for this species (NMFS 2016b). Four DPSs were listed as endangered, one as threatened, and the remaining nine were deemed not warranted for listing. Humpback whales in the U.S. Atlantic EEZ belong to the West Indies DPS, which is considered not warranted for listing under the ESA (NMFS 2016b). The state of Massachusetts lists the humpback whale as Endangered under the MA ESA. The Gulf of Maine stock of humpback whales is no longer considered depleted by NMFS because it does not coincide with any listed DPS. It is also not considered strategic by NMFS because the U.S. fishery-caused mortality and serious injury does not exceed the potential biological removal (PBR) for this stock. For the period 2012 through 2016, the minimum annual rate of human-caused mortality and serious injury to the Gulf of Maine humpback whale stock averaged 9.7 animals per year (Hayes et al. 2019).
Humpback whales in the Western North Atlantic have been experiencing an Unusual Mortality Event (UME) since January 2016 that appears to be related to a larger than usual number of vessel collisions (NMFS 2020a). Of the whales examined, about half had evidence of human interaction (ship strike or entanglement). In total, 133 mortalities were documented through September 8th, 2020, as part of this event, including 23 off Massachusetts (NMFS 2020a). A BIA for humpback whales for feeding has been designated northeast of the Lease Area in the Gulf of Maine, Stellwagen Bank, and the Great South Channel from March through December (LaBrecque et al. 2015).
4.1.3. Common Minke Whale (Balaenoptera acutorostrata) Minke whales have a cosmopolitan distribution that spans ice-free latitudes (Stewart and Leather-
wood 1985). They occur in both coastal and offshore waters (Perrin et al. 2018b). Three species are recognized worldwide, with only the common Minke whale occurring in the northern hemisphere. Minke whales are generally observed alone or in small groups of two or three individuals; larger aggregations may occur at higher latitudes (Katona et al. 1993; Perrin et al. 2018b). There are four recognized populations in the Atlantic Ocean (Donovan 1991). Minke whales found in the U.S. Atlantic EEZ are considered part of

Mayflower Wind Energy LLC Request for an IHA Revised April 2021
Page 14
the Canadian East Coast stock, which inhabits the area from the western half of the Davis Strait (45°W) to the Gulf of Mexico (Hayes et al. 2019).
Distribution
The Minke whale is common off the U.S. east coast over continental shelf waters, especially off New England during spring and summer (CETAP 1982). It is the third most abundant large whale in the EEZ. There is a seasonal component to their distribution in the Northwest Atlantic. This species is most abundant in New England waters during spring through fall while September through April they are most abundant in deep oceanic waters throughout the North Atlantic (Hayes et al. 2019).
Kraus et al. (2016) observed Minke whales in the RI/MA and MA WEAs and surrounding areas primarily from May to June during the 2011–2015 NLPSC aerial survey. This species demonstrated a distinct seasonal habitat usage pattern that was consistent throughout the study. Minke whales were not observed between October and February, but acoustic data indicate the presence of this species in the winter months. Calves were observed twice, and feeding was also observed twice during the Kraus et al. (2016) study. Minke whales were acoustically detected in the MA WEA on 28% of project days (291/1,020 days). Minke whale acoustic presence data also exhibited a distinct seasonal pattern; acoustic presence was lowest in the months of December and January, steadily increased beginning in February, peaked in April, and exhibited a gradual decrease throughout the summer months (Kraus et al. 2016). Acoustic detection range for this species was small enough that over 99% of detections were limited to within the Kraus et al. (2016) study area. Minke whales were observed several times in the MA WEA and nearby waters during spring and summer of the 2010–2017 AMAPPS surveys (NEFSC and SEFSC 2011–2018).
Abundance
Roberts et al. (2017) habitat-based density models provide abundance estimates of 652 Minke whales in the U.S. Atlantic EEZ during winter (November–March) and 3,014 during summer (April–October) months. The best abundance estimate for the U.S. Atlantic EEZ from NOAA Fisheries stock assessments is 2,591 (Hayes et al. 2019). This estimate is likely biased low because it does not account for a number of Minke whales in Canadian waters and did not account for availability bias due to submerged animals.
Status
Minke whales are not listed as threatened or endangered under the ESA and the Canadian East Coast Stock is not considered strategic under the MMPA. Minke whales in the Western North Atlantic have been experiencing a UME since January 2017 with some evidence of human interactions as well as infectious disease but more study is required (NMFS 2020b). In total, 97 mortalities were documented through September 8th, 2020 as part of this event, including 33 mortalities in Massachusetts (NMFS 2020b). A BIA for Minke whales for feeding has been designated east of the Lease Area from March through November (LaBrecque et al. 2015).
4.1.4. North Atlantic Right Whale (Eubalaena glacialis) NARWs are among the rarest of all marine mammal species in the Atlantic Ocean. Likely only about
450 individuals remain in the population, and after appearing to be recovering from a low of about 270 animals in 1990, this population now appears to be declining (Pace et al. 2017). NARWs are skim feeders, swimming slowly at or below the surface with mouth open to capture prey, which consists entirely of zooplankton (Kenney 2018). Research suggests that NARWs must locate and exploit extremely dense patches of zooplankton to feed efficiently (Mayo and Marx 1990). These dense zooplankton patches are a primary characteristic of the spring, summer, and fall NARW habitats (Kenney et al. 1986, 1995). NARWs are usually observed in groups of less than 12 individuals, and most often as single individuals or pairs. Larger groups may be observed in feeding or breeding areas (Jefferson et al. 2008). The NARW is a

Mayflower Wind Energy LLC Request for an IHA Revised April 2021
Page 15
migratory species that travels from high-latitude feeding waters to low-latitude calving and breeding grounds.
Distribution
The Western Atlantic stock of NARWs ranges primarily from calving grounds in coastal waters of the southeastern United States to feeding grounds in New England waters and the Canadian Bay of Fundy, Scotian Shelf, and Gulf of St. Lawrence (Hayes et al. 2019). These whales undertake a seasonal migration from their northeast feeding grounds (generally spring, summer, and fall habitats) south along the U.S. east coast to their calving grounds in the waters of the southeastern United States (Kenney and Vigness-Raposa 2010). However, this species has been observed feeding in winter in the mid-Atlantic region and has been recorded off the coast of New Jersey in all months of the year (Whitt et al. 2013). Surveys demonstrate the existence of seven areas where NARWs congregate seasonally: the coastal waters of the southeastern United States, the Great South Channel, Jordan Basin, Georges Basin along the northeastern edge of Georges Bank, Cape Cod and Massachusetts Bays, the Bay of Fundy, and the Roseway Basin on the Scotian Shelf (Hayes et al. 2019).
Kraus et al. (2016) observed NARWs in the RI/MA and MA WEAs and surrounding waters in winter and spring during the 2011–2015 NLPSC aerial survey and observed 11 instances of courtship behavior. The greatest sightings per unit effort (SPUE) in the RI/MA and MA WEAs was in March. Seventy-seven unique individual NARWs were observed in the RI/MA and MA WEAs over the duration of the NLPSC surveys (Kraus et al. 2016). No calves were observed. Kraus et al. (2016) acoustically detected NARWs with PAM within the MA WEA on 43% of project days (443/1,020 days) and during all months of the year. Acoustic detections do not differentiate between individuals, so detections on multiple days could be the same or different individuals. NARWs exhibited notable seasonal variability in acoustic presence, with maximum occurrence in the winter and spring (January through March), and minimum occurrence in summer (July, August, and September). The mean detection range for NARWs using PAM was 15–24 km, with a mean radius of 21 km for the PAM system within the study area.
Roberts et al. (2016) predict that the highest density of NARWs in the MA WEA and adjacent waters occurs in April, and Kraus et al. (2016) reported greatest levels of SPUE of NARWs in the WEA in March. The NLPSC aerial surveys report no sightings of NARWs for the months of May through October, and reported only four sightings in December across all survey years (Kraus et al. 2016). NARWs were observed in the MA WEA and nearby waters during the winter, spring, and summer of the 2010–2017 AMAPPS surveys (NEFSC and SEFSC 2011–2018). Sightings of this species in the Lease Area are possible though NARWs are generally distributed further north at the time of year when the proposed survey is scheduled to occur.
Abundance
Roberts et al. (2017) habitat-based density models provide abundance estimates of 292 NARWs in the U.S. Atlantic EEZ during winter (December–March), 394 during spring (April–June), 358 during summer (July–September), and 124 during fall (October–November) months. The best abundance estimate available for the North Atlantic right whale stock is 428 individuals (95% credible intervals 406-4470 (Hayes et al., 2020). This estimate is based on a published state-space model of the sighting histories of individual whales identified using photo-identification techniques (Pace et al., 2017). Sightings histories were constructed from the photo-ID recapture database as it existed in October 2018. It is important to note the uncertainty due to the statistically-based estimation process used where uncertainties exist in the estimation of abundance because it is based on a probabilistic model that makes certain assumptions about the structure of the data (Hayes et al., 2020). The estimate does not consider that NARWs have been experiencing an UME since June 7, 2017, with 31 documented deaths as of July 28th, 2020 (NMFS 2020c). This unusual mortality event appears to be driven by entanglement in fishing gear (6 cases suspected or confirmed in the U.S. and 2 in Canada) and blunt force trauma associated with ship strikes (8 cases

Mayflower Wind Energy LLC Request for an IHA Revised April 2021
Page 16
suspected or confirmed in Canada and 2 in the U.S.) mainly in the Gulf of St. Lawrence, Canada. Cause of death findings for the unusual mortality event are based on full necropsies conducted on 18 of the 30 dead NARWs and support human interactions (vessel strikes and rope entanglements) as the cause of death for the majority of the whales (Daoust et al. 2017; NMFS 2020c).
Status
The size of the Western Atlantic stock of NARWs is considered extremely low relative to its OSP in the U.S. Atlantic EEZ (Hayes et al. 2019). The Western Atlantic Stock of NARWs is classified as a strategic stock under the MMPA and is listed as Endangered under the ESA and MA ESA. Historically, the population suffered severely from commercial overharvesting and has more recently been threatened by incidental fishery entanglement and vessel collisions (Knowlton and Kraus 2001; Johnson et al. 2005; Pace et al. 2017).
To protect this species from ship strikes, NOAA Fisheries designated Seasonal Management Areas (SMAs) in U.S. waters in 2008 (NMFS 2008). All vessels greater than 65 ft in overall length must operate at speeds of 10 knots or less within these areas during specific time periods. The Block Island Sound SMA overlaps with the southern portion of the MA WEA and is active between November 1 and April 30 each year. The Great South Channel SMA lies to the Northeast of the MA WEA and is active April 1 to July 31. In addition, the rule provides for the establishment of Dynamic Management Areas (DMAs) when and where NARWs are sighted outside SMAs. DMAs are generally in effect for two weeks and the 10 knots or less speed restriction is voluntary.
NOAA Fisheries has designated two critical habitat areas for the NARW under the ESA: the Gulf of Maine/Georges Bank region and the southeast calving grounds from North Carolina to Florida (NMFS 2016a). Two additional critical habitat areas in Canadian waters, Grand Manan Basin and Roseway Basin, were identified in Canada’s final recovery strategy for the NARW (Brown et al. 2009).
The Lease Area is encompassed by a NARW BIA for migration from March to April and from November to December (LaBrecque et al. 2015). The NARW BIA for migration includes the RI/MA and MA WEAs and beyond to the continental slope, extending northward to offshore of Provincetown, MA and southward to halfway down the Florida coast (LaBrecque et al. 2015). However, the proposed survey is scheduled to occur from April through September, which is outside the timing of this BIA.
4.1.5. Sei Whale (Balaenoptera borealis) The sei whale occurs worldwide, with a preference for oceanic waters (Horwood 2018). It is
uncommon in shelf waters. Sei whales undertake extensive seasonal migrations, feeding at subpolar latitudes during the summer and calving at lower latitudes in the winter. Sei whales often travel alone while migrating, but on feeding grounds they can be observed alone or in aggregations of 20-100 animals (Horwood 2018). Two stocks of sei whales are recognized in the western North Atlantic: the Labrador Sea Stock and the Nova Scotia Stock. Sei whales occurring within the Lease Area are considered part of the Nova Scotia stock, which includes continental shelf waters from the northeastern United States to areas south of Newfoundland (Hayes et al. 2017). The southern portions of the Nova Scotia stock’s range includes the Gulf of Maine and Georges Bank during spring and summer (Hayes et al. 2017).
Distribution
Sighting data suggest sei whale distribution is largely centered in the waters of New England and eastern Canada (Hayes et al. 2017; Roberts et al. 2016). There appears to be a strong seasonal component to sei whale distribution in U.S. waters. They are relatively widespread and most abundant in New England waters from spring to fall (April to July). During winter, the species is predicted to be largely absent (Roberts et al. 2016).

Mayflower Wind Energy LLC Request for an IHA Revised April 2021
Page 17
Kraus et al. (2016) observed sei whales in the RI/MA and MA WEAs and surrounding areas only between the months of March and June during the 2011–2015 NLPSC aerial survey. The number of sei whale observations was less than half that of other baleen whale species in the two seasons in which sei whales were observed (spring and summer). This species demonstrated a distinct seasonal habitat use pattern that was consistent throughout the study. Calves were observed three times and feeding was observed four times during the Kraus et al. (2016) study. Sei whales were not observed in the MA WEA and nearby waters during the 2010–2017 AMAPPS surveys (NEFSC and SEFSC 2011–2018). However, there were observations during the 2016 and 2017 summer surveys that were identified as being either a fin or sei whale. Sei whales are expected to be present in the Lease Area and surrounding waters but much less common than the other baleen whale species.
Abundance
Roberts et al. (2017) habitat-based density models provide abundance estimates of 201 sei whales in the U.S. Atlantic EEZ during winter (October–March) and 453 during summer (April–September). The best available abundance estimate for the Nova Scotia stock of sei whales from NMFS stock assessments is 28 individuals (Hayes et al., 2020). This estimate was generated from a summer shipboard and aerial survey conducted during June–August 2016 (Palka 2020). Additionally, this estimate used a two-team data collection procedure, which allowed estimation of abundance to be corrected for perception bias of the detected species as well as being corrected for availability bias (Laake and Borchers 2004; Hayes et al., 2020).
Status
Sei whales are listed as Endangered under the ESA and MA ESA and the Nova Scotia stock is considered strategic by NMFS. There are no critical habitat areas designated for the sei whale under the ESA. A BIA for feeding for sei whales occurs east of the Lease Area from May through November (LaBrecque et al. 2015).
4.1.6. Atlantic White-Sided Dolphin (Lagenorhynchus acutus) Atlantic white-sided dolphins occur in cold temperate to subpolar waters of the North Atlantic in
deep continental shelf and slope waters (Jefferson et al. 2008). They are often found concentrated in areas with high seafloor relief (Reeves et al. 2002). Though often found in shelf and slope waters, they can also be seen in coastal as well as deep oceanic waters (Cipriano 2018). Groups sizes can range from a few individuals to several hundred individuals. They can be seen feeding with large baleen whales or associating with other dolphin species (Cipriano 2018). The Western North Atlantic stock of Atlantic white-sided dolphins may consist of three separate populations: Gulf of Maine, Gulf of St. Lawrence, and Labrador Sea (Hayes et al. 2019). Animals observed off the eastern U.S. coast are part of the Gulf of Maine population, which is suggested as being separate from the nearby Gulf of St. Lawrence population based on distribution patterns and genetic analyses, but further research is necessary to support this.
Distribution
Within the U.S. Atlantic EEZ, the Gulf of Maine population of white-sided dolphins occurs from about 39°N to Georges Bank as well as in the Gulf of Maine and Lower Bay of Fundy (Hayes et al. 2019). Sighting data indicate seasonal shifts in distribution (Northridge et al. 1997). From January to May, they are found in low numbers from Georges Bank to Jeffreys Ledge off New Hampshire. During June to September, they occur in large numbers from Georges Bank to the lower Bay of Fundy. In October through December, they occur at intermediate densities from southern Georges Bank to the southern Gulf of Maine (Payne and Heinemann 1990).
Kraus et al. (2016) suggest that Atlantic white-sided dolphins occur infrequently in the RI/MA and MA WEAs and surrounding areas. Effort-weighted average sighting rates for Atlantic white-sided dolphins

Mayflower Wind Energy LLC Request for an IHA Revised April 2021
Page 18
could not be calculated because this species was only observed on eight occasions throughout the duration of the study (October 2011 through June 2015). No Atlantic white-sided dolphins were observed during the winter months, and this species was only sighted twice in the fall and three times in the spring and summer. It is possible that the NLPSC survey may have underestimated the abundance of Atlantic white-sided dolphins because this survey was designed to target large cetaceans and the majority of small cetaceans were not identified to species. Atlantic white-sided dolphins were seen during the spring and summer in the MA WEA and nearby waters during the 2010–2017 AMAPPS surveys (NEFSC and SEFSC 2011–2018).
Abundance
Roberts et al. (2018) habitat-based density models provide abundance estimates of 91,473 Atlantic white-sided dolphins in the U.S. Atlantic EEZ during July and 77,042 during October, months that coincide with the proposed survey activities. The best available abundance estimate is 31,912 generated from a shipboard and aerial survey conducted during June–September 2016 (Palka 2020) covering the area of Central Virginia to Maine (Hayes et al. 2020).
Status
The Atlantic white-sided dolphin is not listed as threatened or endangered under the ESA and the Western North Atlantic stock of Atlantic white-sided dolphins is not classified as strategic.
4.1.7. Common Bottlenose Dolphin (Tursiops truncatus) Bottlenose dolphins are one of the most well-known and widely distributed species of marine
mammal, found in most warm temperate and tropical seas in coastal as well as offshore waters (Wells and Scott 2018). They are commonly found in groups of two to 15 individuals, though aggregations of more than 1,000 individuals have been reported. They are considered generalist feeders and consume a wide variety of organisms, including fish, squid, and shrimp and other crustaceans (Jefferson et al. 2008).
Distribution
The common bottlenose dolphin is a cosmopolitan species that occurs in temperate and tropical waters worldwide. Two distinct morphotypes of bottlenose dolphin, coastal and offshore, occur along the eastern coast of the United States (Curry and Smith 1997; Hersh and Duffield 1990; Mead and Potter 1995; Rosel et al. 2009). The offshore morphotype inhabits outer continental slope and shelf edge regions from Georges Bank to the Florida Keys, and the coastal morphotype is continuously distributed along the Atlantic Coast from south of New York to the Florida Peninsula (Hayes et al. 2017). Offshore common bottlenose dolphin sightings occur from Cape Hatteras to the eastern end of Georges Bank (Kenney 1990). There are 17 coastal, offshore, bay, and estuarine stocks of common bottlenose dolphins in the U.S. Atlantic EEZ. Bottlenose dolphins encountered in the Lease Area would likely belong to the Western North Atlantic Offshore Stock (Hayes et al. 2018). However, it is possible that a few animals could be from the North Atlantic Northern Migratory Coastal Stock, but they generally do not range farther north than New Jersey.
Kraus et al. (2016) observed common bottlenose dolphins during all seasons within the RI/MA and MA WEAs in the 2011–2015 NLPSC aerial survey. This was the second most commonly observed small cetacean species and exhibited little seasonal variability in abundance. One sighting of common bottlenose dolphins in the Kraus et al. (2016) study included calves, and one sighting involved mating behavior. It is possible that the NLPSC survey may have underestimated the abundance of common bottlenose dolphins because this survey was designed to target large cetaceans and the majority of small cetaceans were not identified to species (Kraus et al. 2016). Common bottlenose dolphins were observed in the MA WEA and nearby waters during spring, summer, and fall of the 2010–2017 AMAPPS surveys (NEFSC and SEFSC 2011–2018).

Mayflower Wind Energy LLC Request for an IHA Revised April 2021
Page 19
Abundance
Roberts et al. (2018) habitat-based density models provide abundance estimates of 75,620 common bottlenose dolphins in the U.S. Atlantic EEZ during July and 82,379 during October, months that coincide with the proposed survey activities. The best available population estimate for the Western North Atlantic Offshore stock of bottlenose dolphins is 62,851 (Garrison 2020; Palka 2020) (Hayes et al. 2017). This estimate is from summer 2016 surveys covering waters from central Florida to the lower Bay of Fundy (Hayes et al., 2020). The best available estimate for the North Atlantic Northern Migratory Coastal Stock is 6,639 (Hayes et al. 2018).
Status
Common bottlenose dolphins of the western North Atlantic are not listed as threatened or endangered under the ESA. The Western North Atlantic Offshore Stock is not considered strategic under the MMPA (Hayes et al. 2020). However, the western North Atlantic Northern Migratory Coastal stock of common bottlenose dolphins is considered strategic by NOAA Fisheries because it is listed as depleted under the MMPA (Hayes et al. 2018).
4.1.8. Harbor Porpoise (Phocoena phocoena) The harbor porpoise inhabits cool temperate to subarctic waters of the Northern Hemisphere,
generally within shallow coastal waters of the continental shelf but occasionally traveling over deeper, offshore waters (Jefferson et al. 2008). They are usually seen in small groups of one to three; occasionally they form much larger groups (Bjørge and Tolley 2018). There are likely four populations in the western North Atlantic: Gulf of Maine/Bay of Fundy, Gulf of St. Lawrence, Newfoundland, and Greenland (Gaskin 1984, 1982; Hayes et al. 2019). Individuals found in the Lease Area would be almost exclusively from the Gulf of Maine/Bay of Fundy stock.
Distribution
During summer (July through September), harbor porpoises from the Gulf of Maine/Bay of Fundy stock are concentrated along the continental shelf within the northern Gulf of Maine and southern Bay of Fundy region (Hayes et al. 2019). During fall (October through December) and spring (April through June), they are more widely dispersed from New Jersey to Maine. During winter (January through March), they range from New Brunswick, Canada, to North Carolina (Hayes et al. 2019).
Kraus et al. (2016) indicate that harbor porpoises occur within the RI/MA and MA WEAs in fall, winter, and spring. Harbor porpoises were observed in groups ranging in size from three to 15 individuals and were primarily observed in the Kraus et al. (2016) study area from November through May, with very few sightings during June through September. It is possible that the NLPSC survey may have underestimated the abundance of harbor porpoise because this survey was designed to target large cetaceans and the majority of small cetaceans were not identified to species (Kraus et al. 2016). Harbor porpoises were observed in the MA WEA and nearby waters during spring and fall of the 2010–2017 AMAPPS surveys (NEFSC and SEFSC, 2011–2018).
Abundance
Roberts et al. (2017) habitat-based density models provide an abundance estimate of 13,782 harbor porpoise in the U.S. Atlantic EEZ during winter (October to May) and 60,281 during summer (June to September) months. The best available abundance estimate recorded by NMFS for this population is 75,079 which was generated from a U.S shipboard and aerial survey conducted during June–September 2016 (Palka 2020) from central Virginia to Maine (Hayes et al. 2020).

Mayflower Wind Energy LLC Request for an IHA Revised April 2021
Page 20
Status
The harbor porpoise is not listed as threatened or endangered under the ESA and is not listed under the MA ESA. The Gulf of Maine/Bay of Fundy Stock of harbor porpoises is not considered strategic.
4.1.9. Pilot Whales (Globicephala spp.) Two species of pilot whale occur within the Western North Atlantic: the long-finned pilot whale and
the short-finned pilot whale. In general, short-finned pilot whales tend to have a tropical and subtropical distribution whereas long-finned pilot whales prefer colder temperate waters (Olson 2018). The two species are difficult to differentiate at sea and cannot be reliably distinguished during most surveys (Hayes et al. 2019; Rone et al. 2012), so abundance and density estimates are often calculated for the two species combined (e.g. Roberts et al. 2017). Pilot whales are wide-ranging and globally abundant, and form large schools averaging 20-90 individuals comprised of socially stable pods of 10-20 whales (Olson 2018). They are often seen in mixed-species aggregations with common bottlenose dolphins and sometimes with other whale species. The two pilot whale species within the U.S. Atlantic EEZ are categorized into Western North Atlantic stocks.
Distribution
In U.S. Atlantic waters, pilot whales are distributed principally along the continental shelf edge off the northeastern U.S. coast in winter and early spring (CETAP 1982; Abend and Smith 1999; Hamazaki 2002; Payne and Heinemann 1993). In late spring, pilot whales move onto Georges Bank, into the Gulf of Maine, and into more northern waters, where they remain through late fall (CeTAP 1982; Payne and Heinemann 1993). Long-finned and short-finned pilot whales overlap spatially along the mid-Atlantic shelf break between New Jersey and the southern flank of Georges Bank (Hayes et al. 2019; Payne and Heinemann 1993). Long-finned pilot whales have occasionally been observed stranded as far south as South Carolina, and short-finned pilot whale have stranded as far north as Massachusetts (Hayes et al. 2019). The latitudinal ranges of the two species therefore remain uncertain. However, south of Cape Hatteras, most pilot whale sightings are expected to be short-finned pilot whales, while north of approximately 42°N, most pilot whale sightings are expected to be long-finned pilot whales (Hayes et al. 2019). Based on the distributions described in Hayes et al. (2019), pilot whale sightings in the Lease Area would most likely be long-finned pilot whales.
Kraus et al. (2016) observed pilot whales infrequently in the RI/MA and MA WEAs and surrounding areas during the 2011–2015 NLPSC aerial survey. Effort-weighted average sighting rates for pilot whales could not be calculated. No pilot whales were observed during the fall or winter, and these species were only observed 11 times in the spring and three times in the summer. Two of these sightings included calves. It is possible that the NLPSC survey may have underestimated the abundance of pilot whales, as this survey was designed to target large cetaceans and most small cetaceans were not identified to species (Kraus et al. 2016). No pilot whales were observed in the MA WEA and nearby waters during the 2010–2017 AMAPPS surveys from 2010¬2017 (NEFSC and SEFSC 2011–2018).
Abundance
Roberts et al. (2017) habitat-based density models provide an abundance estimate of 27,597 pilot whales in the U.S. Atlantic EEZ. This estimate includes both long-finned and short-finned pilot whales. According to NMFS, the best available population estimate for long-finned pilot whales in the western North Atlantic is 39,215 which is the sum of the estimates generated from the northeast U.S summer 2016 survey covering U.S waters from central Virginia to Maine and the Department of Fisheries and Oceans Canada summer 2016 survey covering Canadian waters from the U.S to Labrador (Hayes et al., 2020; Garrison 2020; Palka 2020; Lawson and Gosselin 2018). For short finned pilot whales, the best available estimate is 28,924 from summer 2016 surveys from central Florida to George’s Bank because those surveys covered the full range of this species in the U.S Atlantic waters (Hayes et al., 2019).

Mayflower Wind Energy LLC Request for an IHA Revised April 2021
Page 21
Status
Total annual estimated average fishery-related mortality or serious injury during 2012–2016 was 27 for long-finned pilot whales (Hayes et al. 2019). Total annual human-caused mortality for short-finned pilot whales during this period is unknown, but the mean annual fishing mortality due to pelagic longline fishing was estimated at 168 (Hayes et al. 2019). Neither pilot whale species is listed as threatened or endangered under the ESA and neither stock is considered strategic under the MMPA (Hayes et al. 2019).
4.1.10. Risso’s Dolphin (Grampus griseus) Risso’s dolphins are located worldwide in both tropical and temperate waters (Jefferson et al. 2008;
Jefferson et al. 2014). This species apparently prefers steep sections of the continental shelf edge and deep offshore waters 100–1000 m deep (Hartman 2018). They are known to frequent seamounts and escarpments (Kruse et al. 1999). Risso's dolphins are deep divers, feeding primarily on deep mesopelagic cephalapods such as squid, octopus, and cuttlefish and likely forage at night (Hartman 2018). This species has been seen associating with other delphinid species. Risso’s dolphins in the U.S. Atlantic EEZ are part of the Western North Atlantic stock (Hayes et al. 2019).
Distribution
The Western North Atlantic stock of Risso’s dolphins inhabits waters from Florida to eastern Newfoundland (Baird and Stacey 1991; Leatherwood et al. 1976). During spring, summer, and fall, Risso’s dolphins are distributed along the continental shelf edge from Cape Hatteras northward to Georges Bank (CeTAP 1982; Payne et al. 1984). During the winter, the distribution extends outward into oceanic waters (Payne et al. 1984).
Kraus et al. (2016) results from the 2011–2015 NLPSC aerial survey suggest that Risso’s dolphins occur infrequently in the RI/MA and MA WEAs and surrounding areas. Effort-weighted average sighting rates for Risso’s dolphins could not be calculated. No Risso’s dolphins were observed during summer, fall, or winter, and this species was only observed twice in the spring. It is possible that the NLPSC survey may have underestimated the abundance of Risso’s dolphins, as this survey was designed to target large cetaceans and the majority of small cetaceans were not identified to species. Risso’s dolphins were observed in the MA WEA and nearby waters during spring and summer of the 2010–2017 AMAPPS surveys (NEFSC and SEFSC 2011–2018).
Abundance
Roberts et al. (2018) habitat-based density models provide abundance estimates of 10,631 Risso's dolphins in the U.S. Atlantic EEZ during April, 23,010 during July, and 7,883 during October, months that coincide with the proposed survey activities. The best available abundance estimate for Risso’s dolphins in the Western North Atlantic stock from NOAA Fisheries stock assessments is 35,493, which is the sum of estimates from the 2016 NEFSC and Department of Fisheries and Oceans Canada (DFO) surveys (Hayes et al., 2020). The 2016 estimate is larger than those from 2011 because the 2016 estimate is derived from a survey area extending from Newfoundland to Florida (Hayes et al., 2020). Additionally, some of the 2016 survey estimates in US waters were corrected for availability bias (due to diving behavior), whereas the 2011 estimates were not corrected (Hayes et al., 2020).
Status
Risso's dolphins are not listed as threatened or endangered under the ESA and the Western North Atlantic stock is not considered strategic.

Mayflower Wind Energy LLC Request for an IHA Revised April 2021
Page 22
4.1.11. Short-beaked Common Dolphin (Delphinus delphis delphis) The common dolphin is one of the most abundant and widely distributed cetaceans, occurring in
warm temperate and tropical regions worldwide from about 60°N to 50°S (Perrin 2018a). These dolphins occur in schools of hundreds or thousands of individuals and often associate with pilot whales or other dolphin species (Perrin 2018a). Until very recently, short-beaked and long-beaked common dolphins were thought to be separate species but evidence now suggests that this character distinction is based on ecology rather than genetics (Perrin 2018a). A single species with three subspecies of common dolphin are recognized by the Society for Marine Mammalogy Committee on Taxonomy (Committee on Taxonomy 2018). The common dolphins occurring in the Lease Area would belong to the subspecies Delphinus delphis delphis and be of the short-beaked variety (Perrin 2018a). Short-beaked common dolphins in the U.S. Atlantic EEZ belong to the Western North Atlantic stock (Hayes et al. 2018).
Distribution
Within the U.S. Atlantic EEZ, short-beaked common dolphins general occur from Cape Hatteras, North Carolina to the Scotian Shelf (Hayes et al. 2019). This species is highly seasonal and migratory. In the U.S. Atlantic EEZ, they are distributed along the continental shelf between the 100- and 2,000-m isobaths (328–6,561.6 ft) and are associated with Gulf Stream features (CeTAP 1982; Hamazaki 2002; Hayes et al. 2019; Selzer and Payne 1988). Short-beaked common dolphins occur from Cape Hatteras northeast to Georges Bank (35° to 42°N) during mid-January to May and move as far north as the Scotian Shelf from mid-summer to fall (Selzer and Payne 1988).
Kraus et al. (2016) suggested that short-beaked common dolphins occur year-round in the RI/MA and MA WEAs and surrounding areas based on data from the 2011–2015 NLPSC aerial survey. They were the most frequently observed small cetacean species within the Kraus et al. (2016) study area. Short-beaked common dolphins were observed in the RI/MA and MA WEAs in all seasons but were most frequently observed during the summer months; observations of this species peaked between June and August. Two sightings of short-beaked common dolphins in the Kraus et al. (2016) study included calves, two sightings involved feeding behavior, and three sightings involved mating behavior. Sighting data indicate that short-beaked common dolphin distribution tended to be farther offshore during the winter months than during spring, summer, and fall. It is possible that the NLPSC survey may have underestimated the abundance of short-beaked common dolphins, because this survey was designed to target large cetaceans and the majority of small cetaceans were not identified to species (Kraus et al. 2016). Short-beaked common dolphins were observed in the MA WEA and nearby waters during all seasons of the 2010–2017 AMAPPS surveys (NEFSC and SEFSC 2011–2018).
Abundance
Roberts et al. (2018) habitat-based density models provide abundance estimates of 121,292 short-beaked common dolphins in the U.S. Atlantic EEZ during July and 113,119 during October, months that coincide with the proposed survey activities. According to NOAA Fisheries, the best available population estimate in the U.S. Atlantic EEZ for the Western North Atlantic short-beaked common dolphin stock is 80,227 based on shipboard surveys conducted in U.S waters of the western North Atlantic during the summer of 2016 (Garrison 2020; Palka, 2020).
Status
The short-beaked common dolphin is not listed as threatened or endangered under the ESA and the Western North Atlantic Stock of short-beaked common dolphins is not considered strategic.

Mayflower Wind Energy LLC Request for an IHA Revised April 2021
Page 23
4.1.12. Sperm Whale (Physeter macrocephalus) The sperm whale is the largest of the toothed whales, with males reaching lengths of 16 m and the
much smaller females reaching lengths of 11 m (Whitehead 2018). This species is widely distributed, occurring from the edge of the polar pack ice to the equator in both hemispheres (Whitehead 2018). In general, they are distributed over large temperate and tropical areas that have high secondary productivity and steep underwater topography, such as volcanic islands (Jacquet and Whitehead 1996). Their distribution and relative abundance can vary in response to prey availability, most notably squid (Jacquet and Gendron 2002). This species can remain submerged for over an hour and dive to depths as great as 1,000 m. Sperm whales form stable social groups and exhibit a geographic social structure—females and juveniles form mixed groups and primarily reside in tropical and subtropical waters whereas males are more solitary and wide-ranging and occur at higher latitudes (Whitehead 2002, 2003). A single stock of sperm whales is recognized for the North Atlantic, and Reeves and Whitehead (1997) and Dufault et al. (1999) suggest that sperm whale populations lack clear geographic structure.
Distribution
Though sperm whales mainly reside in deep-water habitats along the shelf edge and in mid-ocean regions, this species has been observed in relatively high numbers in the shallow continental shelf areas of southern New England (Scott and Sadove 1997). In the U.S. Atlantic EEZ waters, sperm whales appear to exhibit seasonal movement patterns (CETAP 1982; Scott and Sadove 1997). During the winter, they are concentrated to the east and north of Cape Hatteras. This distribution shifts northward in spring, when sperm whales are most abundant in the central portion of the mid-Atlantic bight to the southern region of Georges Bank. In summer, this distribution continues to move northward, including the area east and north of Georges Bank and the continental shelf to the south of New England. In fall months, sperm whales are most abundant on the continental shelf to the south of New England and remain abundant along the continental shelf edge in the mid-Atlantic bight.
Kraus et al. (2016) observed sperm whales four times in the RI/MA and MA WEAs and surrounding areas in the summer and fall during the 2011–2015 NLPSC aerial survey. Sperm whales, traveling singly or in groups of three or four, were observed three times in August and September of 2012, and once in June of 2015. Effort-weighted average sighting rates could not be calculated. The frequency of sperm whale clicks exceeded the maximum frequency of PAM equipment used in the Kraus et al. (2016) study, so no acoustic data are available for this species from that study. Sperm whales were observed only once in the MA WEA and nearby waters during the 2010–2017 AMAPPS surveys (NEFSC and SEFSC 2011–2018). This occurred during a summer shipboard survey in 2016.
Abundance
Roberts et al. (2017) habitat-based density models provide an abundance estimate of 4,199 sperm whales in the U.S. Atlantic EEZ. That estimate includes 223 animals in shelf waters and 3,976 in slope and abyssal waters. The most recent best available population estimate for the U.S. Atlantic EEZ from NMFS stock assessments is 4,349 which was derived from the sum of the 2016 surveys from Central Florida to the lower Bay of Fundy (Hayes et al., 2020). This estimate was generated from the sum of surveys conducted in 2016, and is likely an underestimate of total abundance, because these surveys were not corrected for sperm whale dive time.
Status
Sperm whales are listed as Endangered under the ESA and MA ESA, and the North Atlantic stock is considered strategic by NMFS. There are no critical habitat areas designated for the sperm whale under the ESA.

Mayflower Wind Energy LLC Request for an IHA Revised April 2021
Page 24
4.2. Pinnipeds
Three species of pinnipeds occur in the Atlantic Ocean near the Lease Area: the harbor seal, gray seal, and harp seal. All three pinniped species are more likely to occur in the region during winter and early spring, but could be seen at other times of the year.
4.2.1. Gray Seal (Halichoerus grypus) Gray seals are found throughout the temperate and subarctic waters of the North Atlantic (King
1983). In the northwestern Atlantic, they occur from Labrador south to Massachusetts (King 1983). Gray seals are the second most common pinniped in the U.S. Atlantic EEZ (Jefferson et al. 2008). This species inhabits temperate and sub-arctic waters and lives on remote, exposed islands, shoals, and unstable sandbars (Jefferson et al. 2008). These seals are generally gregarious and live in loose colonies while breeding (Jefferson et al. 2008). Though they spend most of their time in coastal waters, gray seals can dive to depths of 300 m (984 ft), and frequently forage on the OCS (Jefferson et al. 2008; Lesage and Hammill 2001). Gray seals form three populations in the Atlantic (Katona et al. 1993). Individuals occurring in the Lease Area belong to the Northwest Atlantic population, which is equivalent to the western North Atlantic stock (Hayes et al. 2019).
Distribution
The Northwest Atlantic population of gray seals ranges from New Jersey to Labrador (Hayes et al. 2019). There are three breeding concentrations in eastern Canada: Sable Island, the Gulf of St. Lawrence, and along the east coast of Nova Scotia (Lavigueur and Hammill 1993). In U.S. waters, gray seals currently pup at four established colonies from late December to mid-February: Muskeget and Monomoy Islands in Massachusetts, and Green and Seal Islands in Maine (Hayes et al. 2019). Pupping was also observed in the early 1980s on small islands in Nantucket-Vineyard Sound and since 2010 at Nomans Island in Massachusetts (Hayes et al. 2019). The distributions of individuals from different breeding colonies overlap outside the breeding season. Gray seals could be present year-round in the Lease Area (Hayes et al. 2019).
Kraus et al. (2016) observed gray seals in the RI/MA and MA WEAs and surrounding areas during the 2011–2015 NLPSC aerial survey, but this survey was designed to target large cetaceans so locations and numbers of seal observations were not included in the study report. Gray seals were regularly observed in the MA WEA and nearby waters during all seasons of the 2010–2017 AMAPPS surveys (NEFSC and SEFSC 2011–2018). Gray seals tagged near Cape Cod during Phase I of AMAPPS showed strong site fidelity to Cape Cod throughout the summer and fall then movement south and east toward Nantucket beginning in mid-December (Palka et al. 2017). One pup tagged in January spent most of the month that the tag was active in the MA WEA.
Abundance
There are no current estimates of the overall Northwest Atlantic gray seal population, but estimates are available for portions of the stock for certain time periods (Hayes et al. 2019). The total population of gray seals in Canada was estimated at 424,300 for 2016 (DFO 2017). For U.S. waters, NOAA Fisheries best estimate of the population is 27,131 (Hayes et al. (2019). Moxley et al. (2017) used Google Earth imagery to provide an estimate of between 30,000 and 50,000 gray seals in southeast Massachusetts from haul-out sites on Cape Cod, Nantucket, Martha's Vineyard, and smaller islands, sandbars, and shoals in the area. Roberts et al. (2018) provide abundance estimates of 11,961 for July and 8,581 for October for all phocid seals, which are primarily harbor and gray seals, in the U.S. Atlantic EEZ.
Status
Gray seals are not considered strategic under the MMPA, are not listed as threatened or endangered under the ESA and are not listed under the MA ESA. Gray seals have been experiencing a UME since July

Mayflower Wind Energy LLC Request for an IHA Revised April 2021
Page 25
of 2018, with elevated mortalities across Maine, New Hampshire, and Massachusetts (NMFS 2020d). There were 3,152 seal strandings (primarily harbor and gray seals, but also some harp and hooded seals) between July 1, 2018 and March 13, 2020 with 1,010 strandings in Massachusetts (NMFS 2020d). Evidence so far suggests phocine distemper virus as the cause of the strandings.
4.2.2. Harbor Seal (Phoca vitulina vitulina) The harbor seal has a wide distribution throughout coastal waters between 30ºN and ~80ºN
(Teilmann and Galatius 2018). It is the most common pinniped in the U.S. Atlantic EEZ (Katona et al. 1993). Harbor seals usually occur in coastal waters, commonly in bays, estuaries, and rivers. Most harbor seals haul out on land daily, although they can spend several days at sea feeding (Jefferson et al. 2008). Harbor seals complete both shallow and deep dives during hunting, depending on the availability of prey (Tollit et al. 1997). Although the stock structure of the Western North Atlantic population is unknown, it is thought that harbor seals found along the eastern U.S. and Canadian coasts represent one population that is termed the Western North Atlantic Stock (Andersen and Olsen 2010; Temte and Wiig 1991).
Distribution
In the western Atlantic, harbor seal distribution ranges from the eastern Canadian Arctic and Greenland south to New Jersey (Teilmann and Galatius 2018). Harbor seals are year-round inhabitants of the coastal waters of eastern Canada and Maine and they occur seasonally along the southern New England to New Jersey coasts from September through late May (Barlas 1999; Katona et al. 1993; Schneider and Payne 1983; Schroeder 2000). A northward movement from southern New England to Maine and eastern Canada occurs prior to the pupping season, which takes place from mid-May through June along the Maine coast (Kenney 1994; Richardson 1976; Whitman and Payne 1990; Wilson 1978). Harbor seals are generally present in the Lease Area seasonally, from September through May (Hayes et al. 2019).
Kraus et al. (2016) observed harbor seals in the RI/MA and MA WEAs and surrounding areas during the 2011–2015 NLPSC aerial survey, but this survey was designed to target large cetaceans so locations and numbers of seal observations were not included in the study report. Harbor seals have five major haul-out sites in and near the RI/MA and MA WEAs: Monomoy Island, the northwestern side of Nantucket Island, Nomans Land, the north side of Gosnold Island, and the southeastern side of Naushon Island (Payne and Selzer 1989). Payne and Selzer (1989) conducted aerial surveys and found that for haul-out sites in Massachusetts and New Hampshire, Monomoy Island had approximately twice as many seals as any of the 13 other sites in the study (maximum count of 1,672 in March of 1986). Harbor seals were observed in the MA WEA and nearby waters during spring, summer, and fall of the 2010–2017 AMAPPS surveys (NEFSC and SEFSC 2011–2018).
Abundance
The best estimate of abundance for harbor Seals in the Western North Atlantic Stock is 75,834 (Hayes et al. 2019). This estimate was derived from a coast-wide survey along the Maine coast during May and June 2012. Roberts et al. (2018) provide abundance estimates of 11,961 for July and 8,581 for October for all phocid seals, which are primarily harbor and gray seals, in the U.S. Atlantic EEZ.
Status
The Western North Atlantic Stock of harbor seals is not considered strategic under the MMPA; this species is not listed as threatened or endangered under the ESA and is not listed under the MA ESA. Harbor seals have been experiencing a UME since July of 2018, with elevated mortalities across Maine, New Hampshire, and Massachusetts (NMFS 2020d). There were 3,152 seal strandings (primarily harbor and gray seals, but also some harp and hooded seals) between July 1, 2018 and March 13, 2020 with 1,010 strandings in Massachusetts (NMFS 2020d). Evidence so far suggests phocine distemper virus as the cause of the strandings.
Mayflower Wind Energy LLC Request for an IHA Revised April 2021
Page 26
5.0 TYPE OF INCIDENTAL TAKING AUTHORIZATION REQUESTED
Mayflower is requesting an IHA pursuant to section 101(a)(5)(D) of the MMPA for incidental take by Level B harassment of small numbers of marine mammals during the site characterization survey activities described in Sections 1 and 2 in and around OCS-A 0521 and along potential export cable routes to Falmouth, MA or Narragansett Bay (Figure 1).
Site characterization surveys have the potential to take marine mammals by “Level B” harassment as a result of sound energy introduced to the marine environment. In the absence of mitigation measures, sounds that may “harass” marine mammals include pulsed sounds generated by the HRG survey equipment including the sub-bottom profiler and sparker. The potential effects will depend on the species of marine mammal, the behavior of the animal at the time of reception of the stimulus, as well as the received level (RL) of the sound. Disturbance reactions are likely to vary among some of the marine mammals in the general vicinity of the sound source. No Level A “take” by serious injury is reasonably expected, given the nature of the specified activities and the mitigation measures that are planned.
6.0 TAKE ESTIMATES FOR MARINE MAMMALS
All anticipated takes would be “takes by harassment”, involving temporary changes in behavior (i.e., Level B harassment). That is, acoustic exposure could result in temporary displacement of marine mammals from within ensonified zones or other temporary changes in behavioral state. The mitigation measures to be applied will reduce the already very low probability of Level A takes to the point of being discountable. The planned geophysical surveys are not expected to “take” more than small numbers of marine mammals and will have a negligible effect on the affected species or stocks. In the sections below, we describe methods to estimate “take by harassment” and present estimates of the numbers of marine mammals that might be affected during the planned activities.
6.1. Basis for Estimating Potential “Take”
The amount of potential “take by harassment” is calculated in this section by multiplying the expected densities of marine mammals in the survey area by the area of water likely to be ensonified by geophysical survey equipment above the applicable NMFS defined thresholds. The estimated numbers are based on the densities (individuals per unit area) of marine mammals expected to occur in the survey area in the absence of survey activities. The take estimates presented herein are likely overestimates of the numbers of animals exposed to a specified level of sound because some marine mammals tend to move away from anthropogenic sounds before the sound level reaches the criterion level. However, in some cases Protected Species Observer (PSO) data from HRG surveys in 2020 indicate that the presence of some species may be higher than predicted by the available density estimates. Therefore, PSO data from 2020 were also used to estimate potential takes in 2021 and the higher of the two estimates was requested. The area of water exposed to sounds above threshold levels is based on previously reported measurement and modeling data for the same or similar geophysical survey equipment planned for use by Mayflower and the extent and duration of the planned surveys, as described below.
6.2. Acoustic Thresholds
To assess potential auditory injury, Level A harassment, NMFS has established technical guidance (NMFS 2018) that establishes dual criteria for five different marine mammal hearing groups, four of which occur in the Lease Area (Table 6). Scientific recommendations for revisions to these classifications were recently published by Southall et al. (2019) but have not yet been incorporated into the NMFS guidelines.

Mayflower Wind Energy LLC Request for an IHA Revised April 2021
Page 27
The received level at which marine mammals may behaviorally respond to anthropogenic sounds varies by numerous factors including the frequency content, predictability, and duty cycle of the sound as well as the experience, demography and behavioral state of the marine mammals (Richardson et al. 1995; Southall et al. 2007; Ellison et al. 2012). Despite this variability, there is a practical need for a reasonable and specific threshold. NMFS currently defines the threshold for behavioral harassment, Level B take, as 160 dB re 1 µPa SPLrms [unless otherwise noted, all dB values hereafter are referenced to 1 µPa] for impulsive or intermittent sounds such as those produced by the HRG survey equipment to be used during the planned survey.
Table 6. Marine mammal functional hearing groups and Level A thresholds as defined by NMFS (2018) for species present in the survey area.
6.3. Area Potentially Exposed to Sounds above Threshold Levels
As described in Section 1.2 of this request, only some of the in-water equipment planned for use during this survey produces sounds audible to marine mammals. This includes sparkers, boomers, sub-bottom profilers, single-beam echosounders, and USBL systems (Table 1). The single-beam echosounders and USBL systems are necessary for navigational and equipment positioning purposes which are activities for which NMFS does not require authorization, so they are not considered further in this section. Equipment that operates in the water but outside the range of marine mammal hearing, at or above 200 kHz, includes the multi-beam echosounders and sidescan sonars, none of which are considered further in this section.
6.3.1. Level A Table 7 provides details on representative geophysical survey equipment that may be used by
Mayflower and could result in the taking of marine mammals. The equipment listed in Table 7 are surrogates for the larger list of potential equipment identified in Table 2. Methods used to estimate distances to threshold levels are described in Appendix A. The calculations are based on a combination of manufacturer provided source levels and operational parameters for the specific equipment as recommended by NMFS (2020) as well as source level and directional measurements of similar equipment reported by Crocker and Fratantonio (2016).
Sparkers
One of the sparker systems that may be used during the Mayflower surveys, the Applied Acoustics Dura-Spark, was measured by Crocker and Fratantonio (2016) but not with an energy setting near 800 J. A
Marine Mammal Hearing GroupGeneralized Hearing
RangeL pk,flat: 219 dB
L E,LF,24h: 183 dBL pk,flat: 230 dB
L E,LF,24h: 185 dBL pk,flat: 202 dB
L E,LF,24h: 155 dBL pk,flat: 218 dB
L E,LF,24h: 185 dB
Acoustic
Thresholds
Low-frequency cetaceans (LF)
Mid-frequency cetaceans (MF)
High-frequency cetaceans (HF)
Phocid pinnipeds (underwater) (PW)
7 Hz to 35 kHz
150 Hz to 160 kHz
275 Hz to 160 kHz
50 Hz to 86 kHz

Mayflower Wind Energy LLC Request for an IHA Revised April 2021
Page 28
similar alternative system, the SIG ELC 820 sparker, was measured with an input voltage of 750 J so that has been used as a surrogate as recommended by NMFS. As a conservative approach, the SIG ELC 820 sparker was assumed to be an omni directional source. Using these inputs, the distance to the high-frequency cetacean SELcum threshold was estimated to be 8 m while the distance to the SPLpeak threshold was estimated to be 4 m (Table 7). Distances to threshold criteria for all other hearing groups were either negligible or not reached.
Sub-bottom profilers
The Innomar SES-2000 parametric sub-bottom profiler was not measured by Crocker and Fratantonio (2016), so manufacturer-provided specifications were used to calculate the range to the Level A thresholds. As shown in Table 2, the Innomar SES-2000 sub-bottom profiler operates in two different frequency bands, with primary frequencies in the 85–115 kHz range and secondary frequencies in the 2–22 kHz range. The manufacturer-stated source level for the primary frequencies is 247 dB SPLpeak. The average difference between sub-bottom profiler SPLpeak and SPLrms source levels reported by Crocker and Fratantonio (2016) was 6 dB. Therefore, we assumed a SPLrms source level of 241 dB. The source level for the secondary frequencies is approximately 40 dB lower, or 203 dB SPLrms. The Innomar SES-2000 sub-bottom profiler has the highest source level of the planned equipment, but it operates at relatively high frequencies with most energy focused in a narrow beam. It also has a very high repetition rate (40 pulses per second) which places it into the intermittent (non-impulsive) source category. Altogether, this results in very short distances to Level A thresholds for all hearing groups except the high-frequency cetaceans, for which the SELcum distance is 58 m (Table 7).
Of the non-parametric sub-bottom profilers that may be used by Mayflower, the Teledyne Benthos Chirp III was determined to have the highest source level, so it was also selected as a representative sub-bottom profiling system. Crocker and Fratantonio (2016) measured source levels of a similar device, the Knudsen 3202 Chirp sub-bottom profiler, at several different power settings. The strongest power settings measured were determined to be applicable to a hull-mounted system, while the lowest power settings were determined to be applicable to the towfish version that may be used by Mayflower. The measured source level for the Knudsen 3202 at low power with an 8 millisecond pulse width was 199 dB SPLrms and a beamwidth of 82° (Crocker and Fratantonio 2016). Using the inputs from Crocker and Fratantonio (2016), distances to Level A criteria from this type of sub-bottom profiler system are expected to be nearly identical to the Innomar system described above (Table 7).
Boomer
Crocker and Fratantonio (2016) measured several different Boomer systems, including the Applied Acoustics S-Boom, which is the same model that may be used during the Mayflower HRG surveys. The source level measurements in Crocker and Fratantonio (2016) for the Applied Acoustics S-boom resulted in an estimated distance of <1 m to the high-frequency cetacean SELcum threshold and an estimated distance of 1 m to the SPLpeak threshold (Table 7). Distances to Level A thresholds for all other hearing groups were negligible or not reached.
Level A Take Summary
The largest distance to a Level A threshold from a sparker, sub-bottom profiler, or boomer source is anticipated to be 58 m for high-frequency cetaceans and less than 10 m for all other hearing groups (Table 7). The only high-frequency cetacean species present in this region is the harbor porpoise. Harbor porpoise are known to largely avoid vessels and anthropogenic sounds; thus, even in the absence of the mitigation measures proposed in Section 11, the potential for Level A harassment of this or any other species is very unlikely. Therefore, no Level A takes are expected or are being requested.
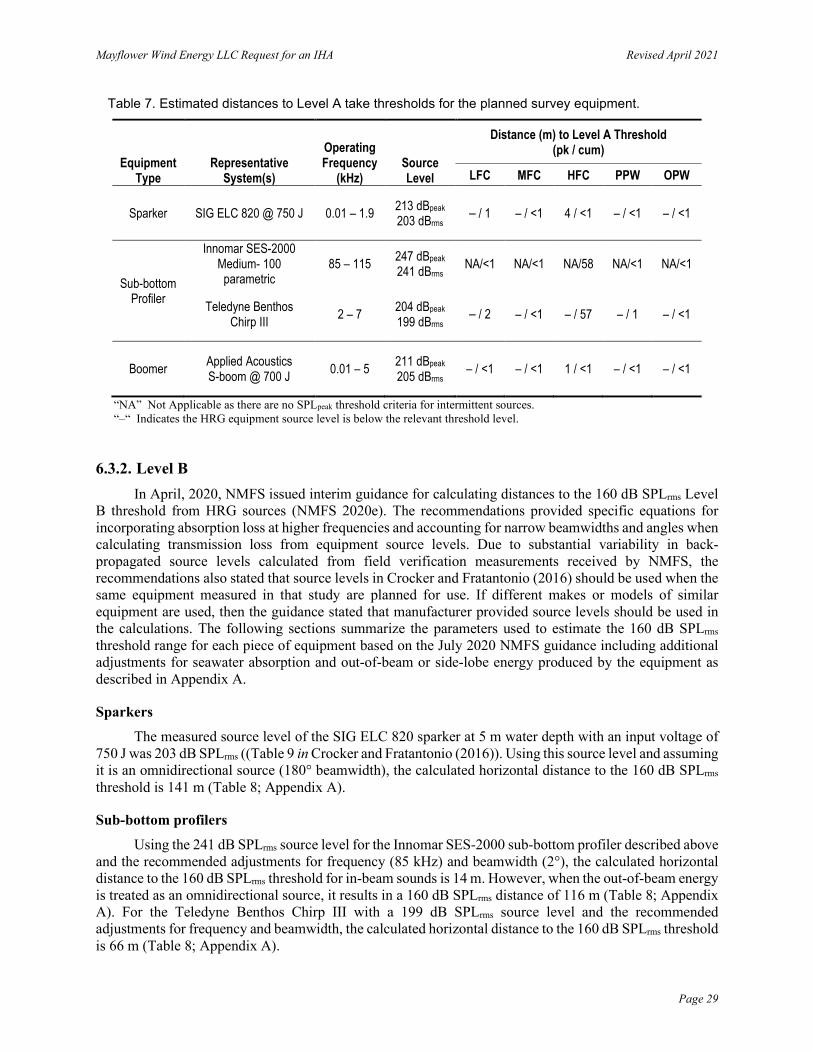
Mayflower Wind Energy LLC Request for an IHA Revised April 2021
Page 29
Table 7. Estimated distances to Level A take thresholds for the planned survey equipment.
Equipment Type
Representative System(s)
Operating Frequency
(kHz) Source Level
Distance (m) to Level A Threshold (pk / cum)
LFC MFC HFC PPW OPW
Sparker SIG ELC 820 @ 750 J 0.01 – 1.9 213 dBpeak 203 dBrms – / 1 – / <1 4 / <1 – / <1 – / <1
Sub-bottom Profiler
Innomar SES-2000 Medium- 100
parametric 85 – 115 247 dBpeak
241 dBrms NA/<1 NA/<1 NA/58 NA/<1 NA/<1
Teledyne Benthos Chirp III 2 – 7 204 dBpeak
199 dBrms – / 2 – / <1 – / 57 – / 1 – / <1
Boomer Applied Acoustics S-boom @ 700 J 0.01 – 5 211 dBpeak
205 dBrms – / <1 – / <1 1 / <1 – / <1 – / <1
“NA” Not Applicable as there are no SPLpeak threshold criteria for intermittent sources. “–“ Indicates the HRG equipment source level is below the relevant threshold level.
6.3.2. Level B In April, 2020, NMFS issued interim guidance for calculating distances to the 160 dB SPLrms Level
B threshold from HRG sources (NMFS 2020e). The recommendations provided specific equations for incorporating absorption loss at higher frequencies and accounting for narrow beamwidths and angles when calculating transmission loss from equipment source levels. Due to substantial variability in back-propagated source levels calculated from field verification measurements received by NMFS, the recommendations also stated that source levels in Crocker and Fratantonio (2016) should be used when the same equipment measured in that study are planned for use. If different makes or models of similar equipment are used, then the guidance stated that manufacturer provided source levels should be used in the calculations. The following sections summarize the parameters used to estimate the 160 dB SPLrms
threshold range for each piece of equipment based on the July 2020 NMFS guidance including additional adjustments for seawater absorption and out-of-beam or side-lobe energy produced by the equipment as described in Appendix A.
Sparkers
The measured source level of the SIG ELC 820 sparker at 5 m water depth with an input voltage of 750 J was 203 dB SPLrms ((Table 9 in Crocker and Fratantonio (2016)). Using this source level and assuming it is an omnidirectional source (180° beamwidth), the calculated horizontal distance to the 160 dB SPLrms threshold is 141 m (Table 8; Appendix A).
Sub-bottom profilers
Using the 241 dB SPLrms source level for the Innomar SES-2000 sub-bottom profiler described above and the recommended adjustments for frequency (85 kHz) and beamwidth (2°), the calculated horizontal distance to the 160 dB SPLrms threshold for in-beam sounds is 14 m. However, when the out-of-beam energy is treated as an omnidirectional source, it results in a 160 dB SPLrms distance of 116 m (Table 8; Appendix A). For the Teledyne Benthos Chirp III with a 199 dB SPLrms source level and the recommended adjustments for frequency and beamwidth, the calculated horizontal distance to the 160 dB SPLrms threshold is 66 m (Table 8; Appendix A).

Mayflower Wind Energy LLC Request for an IHA Revised April 2021
Page 30
Table 8. Estimated distances to Level B take thresholds for the planned survey equipment.
Equipment Type
Representative System(s)
Operating Frequency
(kHz)
Source Level
(dB rms)
Out-of-Beam Source Level
(dB rms) Beamwdith (degrees)
Distance to Level B Threshold
(m)
Sparker SIG ELC 820 @ 750 J 0.01 – 1.9 203 N/A 180 141
Sub-bottom Profiler
Innomar SES-2000 Medium- 100
parametric 85 – 115 241 205 2 116
Teledyne Benthos Chirp III 2 – 7 199 196 82 66
Boomer Applied Acoustics S-boom @ 700 J 0.01 – 5 205 N/A 61 90
Boomer
The measured source level of the Applied Acoustics S-Boom with an input voltage of 700 J was 205 dB SPLrms (Crocker and Fratantonio 2016). Using this source level and assuming it has a 61° beamwidth, the calculated horizontal distance to the 160 dB SPLrms threshold is 90 m (Table 8; Appendix A).
Ensonified Area
The largest distance to the 160 dB SPLrms Level B threshold is expected to be 141 m from the sparker. This distance was used as described in this section to estimate the area of water potentially exposed above the Level B threshold by the planned activities.
As shown in Table 1, up to 14,350 km of survey activity may occur from June through December 2021, including turns between lines or occasional testing of equipment while not collecting geophysical data. For the purposes of calculating take, the HRG survey activities have been split into two different areas, 1) the lease area plus the deep-water portion of the cable route, and 2) the shallow water portion of the cable route including very shallow water sections of the cable route.
Within the Lease Area and deep-water portion of the cable route, the vessel will conduct surveys at a speed of approximately 3 knots (5.6 km/hr) during mostly 24-hr operations. Allowing for weather and equipment downtime, the survey vessel is expected to collect geophysical data over an average distance of 80 km per day. Distributing the 7,000 km of survey data to be collected across the 7-month period of anticipated activity this results in approximately 12.5 survey days per month. Using a 160 dB SPLrms threshold distance of 141 m, the total daily ensonified area is estimated to be 22.6 km2, or an average of 282.8 km2 each month within the Lease Area and deep-water portion of the cable route.
Along the shallow-water portion of the cable route, survey vessels will also conduct surveys at a speed of approximately 3 knots (5.6 km/hr) during either daylight only or 24-hour operations. Survey operations in very shallow water will occur only during daylight hours. Allowing for weather and equipment downtime, the survey vessels are expected to cover an average distance of approximately 30–60 km per day in shallow waters and only 15 km per day in very shallow waters. Assuming daylight only operations and 30 km per day of surveys in shallow waters results in slightly larger ensonified area

Mayflower Wind Energy LLC Request for an IHA Revised April 2021
Page 31
estimates, so this operational assumption was used in estimating potential takes. Distributing the 3,250 km of survey data to be collected in shallow waters and the 4,100 km to be collected in very shallow waters across the 7-month period of anticipated activity results in approximately 15.5 and 39 survey days per month in shallow and very-shallow waters, respectively. Using a 160 dB SPLrms threshold distance of 141 m, the total daily ensonified area in shallow waters is estimated to be 8.5 km2, and in very-shallow waters 4.3 km2. Combined, these result in an average monthly ensonified area in the combined shallow water survey areas of 299.5 km2.
6.4. Marine Mammal Densities
Density estimates for all species except NARW within the deep and shallow portions of the survey areas were derived from habitat-based density modeling results reported by Roberts et al. (2016, 2017, 2018). Those data provide abundance estimates for species or species guilds within 10 km x 10 km grid cells (100 km2) on a monthly or annual basis, depending on the species. In order to select a representative sample of grid cells in and near the survey areas, a 10-km wide perimeter around the lease area and an 8-km wide perimeter around the cable routes were created in GIS (ESRI 2017). The perimeters were then used to select grid cells near the survey areas containing the most recent monthly or annual estimates for each species in the Roberts et al. (2016, 2017, 2018) data. The average monthly abundance for each species in each survey area was calculated as the mean value of the grid cells within each survey area in each month and then converted to density (individuals / 1 km2) by dividing by 100 km2 (Table 9, Table 10).
The estimated monthly densities of NARWs were based on updated model results from Roberts et al. (2020). These updated data for NARW are provided as densities (individuals/1 km2) within 5 km x 5 km grid cells (25 km2) on a monthly basis. The same GIS process described above was used to select the appropriate grid cells from each month and the monthly NARW density in each survey area was calculated as the mean value of the grid cells within each survey area as shown in Table 9 and Table 10.
The estimated monthly density of seals provided in Roberts et al. (2018) includes all seal species present in the region as a single guild. Based upon a recommendation from NMFS, we did not separate this guild into the individual species based on the proportion of sightings identified to each species within the dataset because so few of the total sightings used in the Roberts et al. (2018) analysis were actually identified to species (Table 9, Table 10).
Marine mammal densities from Roberts et al. (2018) data in areas immediately adjacent to the coast and within Nantucket Sound (Table 10) were used when calculating potential takes from survey activities within Narragansett Bay. This is a conservative approach since there have only been a few reported sightings of marine mammal species, besides seals, within Narragansett Bay (Raposa 2009).

Mayflower Wind Energy LLC Request for an IHA Revised April 2021
Page 32
Table 9. Average monthly densities for species that may occur in the Lease Area and along the deep-water section of the cable route during the planned survey period.
* Denotes species listed under the Endangered Species Act
Table 10. Average monthly densities for species that may occur along the shallow-water section of the cable route during the planned survey period.
* Denotes species listed under the Endangered Species Act
Jun Jul Aug Sep Oct Nov DecMysticetes
Fin Whale* 0.0025 0.0025 0.0024 0.0020 0.0013 0.0011 0.0012Humpback Whale 0.0012 0.0013 0.0009 0.0020 0.0015 0.0005 0.0006Minke Whale 0.0018 0.0007 0.0005 0.0005 0.0005 0.0003 0.0004North Atlantic Right Whale* 0.0002 0.0000 0.0000 0.0000 0.0001 0.0005 0.0028Sei Whale* 0.0002 0.0000 0.0000 0.0000 0.0000 0.0000 0.0000
OdontocetesAtlantic White-Sided Dolphin 0.0449 0.0318 0.0180 0.0183 0.0234 0.0249 0.0317Common Bottlenose Dolphin 0.0267 0.0585 0.0483 0.0546 0.0459 0.0223 0.0136Harbor Porpoise 0.0133 0.0088 0.0080 0.0067 0.0081 0.0267 0.0260Pilot Whales 0.0046 0.0046 0.0046 0.0046 0.0046 0.0046 0.0046Risso’s Dolphin 0.0001 0.0003 0.0006 0.0005 0.0002 0.0002 0.0004Short-Beaked Common Dolphin 0.0410 0.0432 0.0747 0.1187 0.1280 0.0903 0.1563Sperm Whale* 0.0001 0.0003 0.0003 0.0001 0.0001 0.0001 0.0000
PinnipedsSeals (Harbor and Gray) 0.0322 0.0078 0.0041 0.0054 0.0085 0.0091 0.0345
SpeciesEstimated Monthly Densities (Individuals/km2)
Jun Jul Aug Sep Oct Nov DecMysticetes
Fin Whale* 0.0003 0.0003 0.0003 0.0003 0.0002 0.0001 0.0001Humpback Whale 0.0001 0.0001 0.0000 0.0001 0.0002 0.0001 0.0017Minke Whale 0.0002 0.0000 0.0000 0.0000 0.0000 0.0000 0.0000North Atlantic Right Whale* 0.0000 0.0000 0.0000 0.0000 0.0000 0.0001 0.0005Sei Whale* 0.0000 0.0000 0.0000 0.0000 0.0000 0.0000 0.0000
OdontocetesAtlantic White-Sided Dolphin 0.0010 0.0006 0.0005 0.0008 0.0014 0.0011 0.0006Common Bottlenose Dolphin 0.2308 0.4199 0.3211 0.3077 0.1564 0.0813 0.0174Harbor Porpoise 0.0048 0.0023 0.0037 0.0036 0.0003 0.0214 0.0253Pilot Whales 0.0000 0.0000 0.0000 0.0000 0.0000 0.0000 0.0000Risso’s Dolphin 0.0000 0.0000 0.0000 0.0000 0.0000 0.0000 0.0000Short-Beaked Common Dolphin 0.0003 0.0002 0.0006 0.0009 0.0008 0.0010 0.0006Sperm Whale* 0.0000 0.0000 0.0000 0.0000 0.0000 0.0000 0.0000
PinnipedsSeals (Harbor and Gray) 0.2496 0.0281 0.0120 0.0245 0.0826 0.5456 1.3589
SpeciesEstimated Monthly Densities (Individuals/km2)

Mayflower Wind Energy LLC Request for an IHA Revised April 2021
Page 33
For comparison purposes and to account for local variation not captured by the predicted densities provided by Roberts et al. (2016, 2017, 2018, 2020), PSO data from the 2020 HRG surveys were analyzed to assess the appropriateness of the density-based take calculations. To do this, the total number of individual marine mammals sighted by PSOs within 150 m of a sound source (rounding up from the 141 m Level B take distance) from April 19 through September 19, 2020, a period of 23 weeks, were summed by species or “unidentified” species group when sightings were not classified to the species level. As a conservative approach, all sightings were included in this calculation regardless of whether the source was operating at the time. In order to include the “unidentified” individuals in the species-specific calculations, the number of individuals in each unidentified species group (e.g unidentified whale) was then added to the sums of the known species within that group (e.g. humpback whale, fin whale, etc.) according to the proportion of individuals within that group positively identified to the species level. With individuals from “unidentified” species sightings proportionally distributed among the species, we then divided the total number of individuals of each species by the number of survey weeks to calculate the average number of individuals of each species sighted within 150 m of the sound sources per week during the surveys.
6.5. Requested Take
The potential numbers of Level B takes were calculated by multiplying the monthly density for each species in each survey area shown in Table 9 and Table 10 by the respective monthly ensonified area within each survey area (see Section 6.3). The results are shown in the “Calculated Take” columns of Table 11. The survey area estimates were then summed to produce the “Total Density-based Calculated Take” and then rounded up to arrive at the number of “Density-based Takes” for each species (Table 11).
To account for potential local variation in animal presence compared to the predicted densities, the average weekly number of individuals for each species observed within 150 m of the HRG survey sound sources in 2020, regardless of their operational status at the time (see Section 6.4 for details), were multiplied by the anticipated 32-week survey period in 2021. These results are shown in the “Sightings-based Takes” column of (Table 11). The larger of the take estimates from the density-based and sightings-based methods are shown in the “Requested Take” column, except as noted below.
For six (6) species, humpback whale, North Atlantic right whale, sei whale, pilot whales, Risso’s dolphin, and sperm whale the Requested Take column reflects a rounding up of three (3) times the mean group size calculated from survey data in this region (Kraus et al. 2016; Palka et al. 2017). Three (3) times the group size was used rather than a single group size to account for more than one chance encounter with these species during the surveys.
The requested number of Level B takes as a percentage of the “best available” abundance estimates provided in the NMFS Stock Assessment Reports (Hayes et al. 2020) as well as those reported by Roberts et al. (2016, 2017, 2018) are also provided in Table 11. For the “Seal” guild, the estimated abundance for both gray and harbor seals was summed (Table 11).
Bottlenose dolphins encountered in the survey area would likely belong to the Western North Atlantic Offshore Stock (Hayes et al. 2019). However, it is possible that a few animals encountered during the surveys could be from the North Atlantic Northern Migratory Coastal Stock, but they generally do not range farther north than New Jersey. Also, based on the distributions described in Hayes et al. (2020), pilot whale sightings in the survey area would most likely be long-finned pilot whales, although short-finned pilot whales could be encountered in the survey area during the summer months.
For North Atlantic right whales, the implementation of a 500 m acoustic exclusion zone and the 500 m vessel separation distance identified in the vessel strike avoidance measures means that the likelihood of an exposure to received sound levels greater than 160 dB SPLrms is very low. In addition, most of the survey activity will take place during the time of year when right whales are unlikely to be present in this region. Nonetheless, it is possible that North Atlantic right whales could occur within 500 m of the vessel without first being detected by a Protected Species Observer (PSO), so we have requested the calculated potential take consistent with other species.

Mayflower Wind Energy LLC Request for an IHA Revised April 2021
Page 34
Table 11. Number of Level B takes requested and percentages of each stock abundance.
* Denotes species listed under the Endangered Species Act. a Source – Hayes et al. (2020); The “Seal” abundance value shown is the sum of gray and harbor seals. b Source – Roberts et al. (2016, 2017, 2018, 2020) ; The “Seal” abundance value shown is the sum of gray and harbor seals.
Lease Area & Deep Water Cable Route
Shallow Water Cable
Requested Take
MysticetesFin Whale* 3.7 0.5 4.1 5 1 6 3,006 3,005 0.2 0.2Humpback Whale 2.2 0.7 2.9 3 33 33 1,396 1,773 2.4 1.9Minke Whale 1.3 0.1 1.5 2 14 14 2,591 3,014 0.5 0.5North Atlantic Right Whale* 1.0 0.2 1.2 2 0 9 428 394 2.1 2.3Sei Whale* 0.1 0.0 0.1 1 0 6 28 453 21.4 1.3
OdontocetesAtlantic White-Sided Dolphin 54.6 1.8 56.4 57 0 57 31,912 91,473 0.2 0.1Common Bottlenose Dolphin 76.3 459.6 536.0 536 59 536 62,851 75,620 0.9 0.7Harbor Porpoise 27.6 18.4 46.0 46 0 46 75,079 60,281 0.1 0.1Pilot Whales 9.2 0.0 9.2 10 17 27 68,139 27,597 0.0 0.1Risso’s Dolphin 0.7 0.0 0.7 1 0 18 35,493 11,483 0.1 0.2Short-Beaked Common Dolphin 184.5 1.3 185.8 186 1,969 1,969 80,227 121,292 2.5 1.6Sperm Whale* 0.3 0.0 0.3 1 0 6 4,349 4,199 0.1 0.1
PinnipedsSeals (Harbor and Gray) 28.7 689.2 718.0 718 141 718 102,965 11,961 0.7 6.0
Species
Total Density-
based Calculated
Takes
Density-based Takes
Abundance NMFSa
Abundance Robertsb
Sightings-based Takes
Percent of NMFSa Stock Abundance
Density-based Take by Survey Region
Percent of Robertsb
Abundance

Mayflower Wind Energy LLC Request for an IHA Revised April 2021
Page 35
7.0 ANTICIPATED IMPACT OF THE ACTIVITY
All marine mammals use sound as a critical way to carry out life-sustaining functions, such as foraging, navigating, communicating, and avoiding predators. Marine mammals also use sound to learn about their surrounding environment by gathering information from other marine mammals, prey species, phenomena such as wind, waves, and rain, and from seismic activity (Richardson et al. 1995). The effects of sounds from HRG surveys could include either masking of natural sounds or behavioral disturbance (Richardson et al. 1995; Nowacek et al. 2007; Southall et al. 2007).
Behavioral disturbance includes a variety of effects, ranging from subtle to conspicuous changes in behavior, movement and respiration patterns as well as displacement (Southall et al. 2007). In some cases, behavioral responses to sound may result in a reduction of the overall exposure to that sound (e.g., Finneran et al. 2015; Wensveen et al. 2015).
Detailed data on reactions of marine mammals to anthropogenic sounds are limited to relatively few species and situations (see reviews by Richardson et al. 1995; Gordon et al. 2004; Nowacek et al. 2007; Southall et al. 2007). Behavioral reactions of marine mammals to sound are difficult to predict in the absence of site- and context-specific data. Reactions to sound, if any, depend on species, state of maturity, experience, current activity, reproductive state, time of day, exposure level, spectral content and directionality of the sound, and many other factors (Richardson et al. 1995; Wartzok et al. 2004; Southall et al. 2007; Weilgart 2007; Ellison et al. 2012). If a marine mammal reacts to an underwater sound by changing its behavior or moving a small distance, the impacts of the change are unlikely to be significant to the individual, let alone the stock or population (e.g., New et al. 2013a). However, if a sound source displaces marine mammals from an important feeding or breeding area for a prolonged period, impacts on individuals and populations could be significant (Lusseau and Bejder 2007; Weilgart 2007; Nowacek et al. 2015; New et al. 2013b; Forney et al. 2017).
Masking is the obscuring of sounds of interest by interfering sounds, generally at similar frequencies. Introduced underwater sound will, through masking, reduce the effective listening area and/or communication distance of a marine mammal species if the frequency of the source is close to that used as a signal by the marine mammal, and if the anthropogenic sound is present for a significant fraction of the time (Richardson et al. 1995; Clark et al. 2009; Jensen et al. 2009; Gervaise et al. 2012; Hatch et al. 2012; Rice et al. 2014; Erbe et al. 2016; Tenessen and Parks 2016). Conversely, if little or no overlap occurs between the introduced sound and the frequencies used by the species, communication is not expected to be disrupted. Also, if the introduced sound is present only infrequently, communication is not expected to be disrupted much, if at all. In addition to the frequency and duration of the masking sound, the strength, temporal pattern, and location of the introduced sound also play a role in the extent of the masking (Branstetter et al., 2013, 2016; Finneran and Branstetter, 2013; Sills et al., 2017). Loss of listening area or communication space could impact foraging success or result in the inability to locate conspecifics. The biological repercussions of these potential outcomes are largely unknown but given the operating frequencies and source levels of the HRG equipment, significant impacts from masking are not expected.
Some of the HRG survey equipment proposed for use during the site characterization surveys produces sounds with frequency ranges similar to those of marine mammal hearing and vocalizations and thus could result in masking of some biologically important sounds. The impulsive nature of these sounds, limited duration of the survey activities, and short distances over which they would be audible suggest that any masking experience by marine mammals would be localized and short term.
Given the many uncertainties in predicting the quantity and types of impacts of sound on marine mammals, it is common practice to estimate how many animals would be present within a particular distance of human activities and/or exposed to a particular level of anthropogenic sound (see Section 6). In most cases, this approach likely overestimates the numbers of marine mammals that would be affected in some biologically important manner. One of the reasons for this is that the selected distances/isopleths are based on limited studies indicating that some animals exhibited short-term reactions at this distance or

Mayflower Wind Energy LLC Request for an IHA Revised April 2021
Page 36
sound level, whereas the calculation assumes that all animals exposed to this level would react in a biologically significant manner.
The most likely behavioral change exhibited by marine mammals as a result of HRG survey activities would be displacement or moving away from the sound. It is presumed that displacement, if it were to occur, would be limited to the area surrounding the sound source that is ensonified to above the Level B thresholds of 160 dB SPLrms for impulsive sounds, and would only last for the duration that the sound source is active, with animals resuming regular behavior once the sound source ceases.
8.0 ANTICIPATED IMPACTS ON SUBSISTENCE USES
The Mayflower Lease Area survey activities will take place off the NE coast of the United States in the Atlantic Ocean. There are no traditional subsistence hunting areas in the region and thus no subsistence uses of marine mammals may be impacted by this action.
9.0 ANTICIPATED IMPACTS ON HABITAT
The altered soundscape resulting from sounds produced during HRG survey activities would be short term, localized, and would not permanently alter marine mammal acoustic habitat.
Collection of vibracore, seabed CPT, and borehole samples during geotechnical surveys would disturb benthic habitat where samples are taken and could impact water quality via sediment resuspension and dispersion. These impacts would be short term and localized to the immediate vicinity around sample sites within a large area of similar habitat. Permanent impacts to marine mammal habitat are not anticipated.
10.0 ANTICIPATED EFFECTS OF HABITAT IMPACTS ON MARINE MAMMALS
The altered soundscape in the vicinity of HRG survey activities could result in masking of sounds important to marine mammals or displacement of individuals from the survey area. Masking would only occur within relatively short distances while survey activities are underway and thus would be temporary and localized to the vicinity of the survey activities. It is expected that any displacement of marine mammals from the survey area would also be temporary and localized. Displaced individuals would be able to access areas of similar habitat near the area impacted by the survey activity.
11.0 MITIGATION MEASURES TO PROTECT MARINE MAMMALS AND THEIR HABITAT
The following monitoring and mitigation measures will be implemented on vessels conducting the geophysical surveys as described in Section 1.1 for which takes have been requested in Section 6. PSOs will be used to undertake visual watches, implement mitigation measures, and conduct data collection and reporting in accordance with the monitoring plan, the requirements in the IHA, and stipulations in the BOEM OCS-A 0521 lease. Except where noted, all PSOs will have completed a BOEM and NMFS accepted PSO training program as described in BOEM NTL 2016-G02. PSOs will have relevant observation experience in the Atlantic or Gulf of Mexico. All PSOs will be approved by NMFS prior to the start of survey operations. Upon completion of the project, Mayflower will provide a final report and data to NMFS. Takes are not anticipated for vessels when they are conducting geotechnical surveys, so the monitoring and mitigation measures described here will not apply during those activities.

Mayflower Wind Energy LLC Request for an IHA Revised April 2021
Page 37
11.1. Number of Protected Species Observers
Any vessel conducting HRG surveys on a 24-hr per day basis (i.e. including during darkness) will have four (4) PSOs on board to carry out the necessary monitoring. This will primarily apply to survey operations in the deep-water survey area, but may also apply if 24-hr per day survey operations occur in the shallow-water area.
Vessels conducting HRG survey activities only during daylight hours will have 2 PSOs on board. This will primarily apply to vessels operating in the shallow water survey area, but some activities may occur in the deep-water area as well.
Vessels conducting HRG survey activities in very-shallow waters using shallow-draft vessels are very limited in the number of personnel that can be onboard. In such cases, one visual PSO will be onboard and the vessel captain (or crew member on watch) will conduct observations when the PSO is on required breaks. All vessel crew conducting PSO watches will receive training in monitoring and mitigation requirements and species identification necessary to reliably carry out the mitigation requirements. Given the small size of these vessels, the PSO would effectively remain available to confirm sightings and any related mitigation measures while on break. This approach is similar to that proposed by NMFS for non-airgun HRG surveys in the Gulf of Mexico Incidental Take Regulations (NMFS 2018d) which would allow trained vessel crew to act as PSOs in waters less than 200 m deep.
11.2. PSO Watch Guidelines
One PSO shall be on watch during all daylight HRG and geotechnical operations. Two PSOs shall be on watch at all times during all nighttime HRG and geotechnical operations. No additional duties will be assigned to PSOs during their visual observation watches. PSOs will work in shifts such that no one observer works more than 4 consecutive hours without a 2-hour break or longer than 12 hours during any 24-hour period.
11.3. Day-time Visual Monitoring Equipment
All PSOs will be supplied with reticle binoculars to assist in making detections and estimating ranges. A digital SLR camera will be provided to record detection events, when possible, and verify species identification.
11.4. Night-time Visual Monitoring Equipment
The PSOs on duty will monitor for marine mammals and other protected species using night-vision goggles with thermal clip-ons and a hand-held spotlight (one set plus a back-up set), such that PSOs can focus observations in any direction.
11.5. Data Collection and Reporting
PSOs will collect data in accordance with standard reporting forms, software tools, and electronic data forms. These data will be summarized in a report describing the observation effort, sightings, and the extent and nature of potential takes within 90-days of survey completion.
11.6. Mitigation Measures
Proposed mitigation measures for use during the Mayflower site characterization survey activities are described in the following sections.

Mayflower Wind Energy LLC Request for an IHA Revised April 2021
Page 38
11.6.1. Exclusion Zones Acoustic exclusion zones to prevent Level A takes are typically established at the estimated Level A
threshold distances. Using this approach, acoustic exclusion zones applicable to marine mammals within each hearing group would be established based on results in Appendix A as follows:
• Low-frequency cetaceans = 2 m • Mid-frequency cetaceans = 1 m • High-frequency cetaceans = 58 m • Phocid pinnipeds in water = 1 m • Otariid pinnipeds in water = 1 m
Thus, a single exclusion zone of 2 m would be appropriate for all marine mammal species except high-frequency cetaceans. For high-frequency cetaceans (harbor porpoise), an exclusion zone of 58 m would be appropriate.
However, the BOEM lease agreement for the OCS-A 0521 Lease Area requires the following “Default Exclusion Zones” (Addendum C Section 4.3.6.1):
• 500 m separation distance from North Atlantic right whales as per vessel strike avoidance measures (see next section).
• 200 m exclusion zone for ESA-listed whales and sea turtles. • 100 m exclusion zone for harbor porpoise and humpback whales (in the absence of an
Incidental Take Authorization (ITA) from NMFS). • 50 m exclusion zone for all other non-listed marine mammals (in the absence of an ITA from
NMFS). Upon issuance of an IHA the following exclusion zones would be implemented based on an
appropriate combination of the two sets of exclusion zones listed above: • 500 m exclusion zone for North Atlantic right whales • 100 m exclusion zone for all other marine mammals
Besides the planned 500 m acoustic exclusion zone for North Atlantic right whales, the implementation of the 500 m separation distance from North Atlantic right whales based on the vessel strike avoidance rules will create an effective acoustic exclusion zone of 500 m for this species.
11.6.2. Pre-Startup Observations PSOs will conduct observations of a 500 m exclusion zone for a minimum of 30 minutes prior to the
start of sound sources operating at frequencies <200 kHz and continue until 30 minutes following cessation of sound source use. If a marine mammal, or other protected species, is observed within or approaching the appropriate exclusion zone during the pre-start period, survey equipment will not be activated until the animal(s) is confirmed by visual observation to have exited the relevant exclusion zone, or until an additional time period has elapsed with no further sighting of the animal (15 minutes for small delphinids and pinnipeds, 30 minutes for all other marine mammals, and 60 minutes for sea turtles).
11.6.3. Ramp-up When technically feasible, acoustic sources will be ramped up at the start or re-start of survey
activities. Ramp-up will begin with the power of the smallest acoustic source at its lowest practical power output. When technically feasible, the power will then be gradually turned up and other acoustic sources added in a way such that the source level would increase gradually.

Mayflower Wind Energy LLC Request for an IHA Revised April 2021
Page 39
11.6.4. Shut-downs Anytime a protected species is sighted within the applicable exclusion zone the PSO will call for an
immediate shutdown of the survey equipment. However, HRG survey equipment may continue to operate if delphinids or pinnipeds voluntarily approach the vessel (e.g. to bow ride) when the sound sources are at full operating power.
If the HRG equipment shuts down for reasons other than encroachment into the exclusion zone, resulting in the cessation of the HRG equipment for a period of greater than 20 minutes, restart of the survey equipment will only commence after clearance of the exclusion zone and implementation of ramp-up procedures. If the pause is less than 20 minutes, the equipment will be restarted as soon as practicable at its previous operational level as long as visual surveys were continued throughout the silent period and the exclusion zone remained clear of marine mammals.
11.7. Vessel Strike Avoidance
A number of measures intended to reduce the chance of vessels striking and injuring marine mammals and other protected species, such as sea turtles and giant manta rays, will be implemented while operating in the region in support of Mayflower's site characterization surveys. These measures include:
• Maintaining a vigilant watch for marine mammals and other protected species and slowing down or stopping vessels to avoid striking protected species.
• Complying with speed restrictions (≤10 knots) in North Atlantic right whale management areas including critical habitat, Seasonal Management Areas (SMAs), and active Dynamic Management Areas (DMAs).
• Reducing speed of vessels ≥65 feet in length to ≤10 knots between November 1 through July 31.
• Monitoring the NMFS North Atlantic Right whale reporting systems from the start of the surveys between November 1 through July 31, and during other times if a DMA is established in the operational area.
• Operate vessel at a speed of 10 knots or less in any DMA. • Reducing vessel speeds to ≤10 knots when mother/calf pairs, pods, or large assemblages of
marine mammals are observed. • Maintaining >500 m distance from North Atlantic right whales or an unidentified large
marine mammal; if a right whale comes within 100 m, then reducing speed and shifting the engines into neutral, if safe to do so.
• Maintaining >100 m from all ESA-listed marine mammals. • If underway, the vessel must reduce speed and shift the engine to neutral, and must not
engage the engines until the whale (e.g., large whale and/or ESA-listed whales besides NARW) has moved beyond 100 m.
• Maintaining >50 m from all other marine mammals, with the exception of delphinids and pinnipeds that approach the vessel, in which case the vessel operator must avoid excessive speed or abrupt changes in direction.
• Report sightings of all dead or injured marine mammals or sea turtles within 24 hrs.
11.8. Sound Source Verification
In 2019, NMFS expressed concerns with HRG sound source verification measurements previously collected in offshore wind leases in the Northeast and recommended developers requesting incidental take authorization to estimate zones of potential acoustic impact using standard modeling guidance (NMFS

Mayflower Wind Energy LLC Request for an IHA Revised April 2021
Page 40
2020e). Mayflower Wind did not conduct SSV measurements for 2019 or 2020 surveys and does not plan to collect SSV measurements as part of the planned 2021 surveys.
12.0 MITIGATION MEASURES TO PROTECT SUBSISTENCE USES
Not applicable. There are no subsistence uses of marine mammals impacted by this action.
13.0 MONITORING AND REPORTING
Planned monitoring activities have been described in Section 11 along with the associated mitigation measures. A marine mammal sighting and detection report will be provided to NMFS as required by authorization stipulations.
Sightings of any NARW will be reported to the RWSAS as soon as it is practical to do so. Sightings of any injured, distressed, or dead marine mammals will be reported by a PSO to NMFS as soon as it is practical to do so and in accordance with any requirements set forth in the IHA.
14.0 SUGGESTED MEANS OF COORDINATION
Mayflower will coordinate the planned marine mammal monitoring program associated with the seismic survey off the U.S. east coast (as summarized in § XI and XIII) with other parties that may have interest in the area and/or be conducting marine mammal studies in the same region during the proposed seismic survey.
15.0 LITERATURE CITED
Abend, A.G. and T.D. Smith. 1999. Review of distribution of the long-finned pilot whale (Globicephala melas) in the North Atlantic and Mediterranean. NOAA Tech. Memo. NMFS-NE-117. 22 p
Aguilar, A. and R. García-Vernet. 2018. Fin whale Balaenoptera physalus. p. 368-371 In: Würsig, B., J.G.M. Thewissen, and K.M. Kovacs (eds.), Encyclopedia of marine mammals, 3rd ed. Academic Press, San Diego, CA.
Andersen, L.W. and M.T. Olsen. 2010. Distribution and population structure of North Atlantic harbour seals (Phoca vitulina). NAMMCO Sci. Pub. 8:15-36.
Baird, R.W. and P.J. Stacey. 1991. Status of the Risso's dolphin, Grampus griseus, in Canada. Can. Field-Nat. 105(2):233-242.
Baker, C.S., L. Flórez-González, B. Abernethy, H.C. Rosenbaum, R.W. Slade, J. Capella, and J.L. Bannister. 1998. Mitochondrial DNA variation and maternal gene flow among humpback whales of the Southern Hemisphere. Mar. Mamm. Sci. 14(4):721-737.
Barlas, M.E. 1999. The distribution and abundance of harbor seals (Phoca vitulina concolor) and gray seals (Halichoerus grypus) in southern New England, winter 1998-summer 1999. M.A. thesis. Boston University, Boston, MA. 52 p.
Bjørge, A. and K.A. Tolley. 2018. Harbor porpoise Phocoena phocoena. p. 448-451 In: Würsig, B., J.G.M. Thewissen, and K.M. Kovacs (eds.), Encyclopedia of marine mammals, 3rd ed. Academic Press, San Diego, CA.

Mayflower Wind Energy LLC Request for an IHA Revised April 2021
Page 41
Branstetter, B.K., K.L. Bakhtiari, J.S. Trickey, and J.J. Finneran. 2016. Hearing mechanisms and noise metrics related to auditory masking in bottlenose dolphins (Tursiops truncatus). p. 109-116 In: A. Popper and A. Hawkins (eds.). The effects of noise on aquatic life II. Springer, New York, NY.
Branstetter, B.K., J.S. Trickey, K. Bakhtiari, A. Black, and H. Aihara. 2013. Auditory masking patterns in bottlenose dolphins (Tursiops truncatus) with natural, anthropogenic, and synthesized noise. J. Acoust. Soc. Am. 133(3):1811-1818. doi: 10.1121/1.4789939].
Brown, M.W., D. Fenton, K. Smedbol, C. Merriman, K. Robichaud-Leblanc, and J.D. Conway. 2009. Recovery strategy for the North Atlantic right whale (Eubalaena glacialis) in Atlantic Canadian waters [Final]. Species at Risk Act Recovery Strategy Series. Fisheries and Oceans Canada. vi + 66 p.
Calambokidis. J., G.H Steiger, J.M Straley, L.M. Herman, S. Cerchio, D.R. Salden, J. Urbán R., J.K. Jacobsen, O. von Ziegesar, K.C. Balcomb, C.M. Gabriele, M.E. Dahlheim, S. Uchida, G. Ellis, Y. Miyamura, P. Ladrón de Guevara P., M. Yamaguchi, F. Sato, S.A. Mizroch, L. Schlender, K. Rasmussen, J. Barlow and T.J. Quinn II. 2001. Movements and population structure of humpback whales in the North Pacific. Marine Mammal Science 17:769-794.
CeTAP (Cetacean and Turtle Assessment Program). 1982. A characterization of marine mammals and turtles in the Mid- and North Atlantic areas of the U.S. Outer Continental Shelf. Final report of the Cetacean and Turtle Assessment Program. University of Rhode Island, Kingston, RI. Under Contract AA551-CT8-48. 570 p.
Cipriano, F. 2018. Atlantic white-sided dolphin Lagenorhynchus acutus. p. 42-44 In: Würsig, B., J.G.M. Thewissen, and K.M. Kovacs (eds.), Encyclopedia of marine mammals, 3rd ed. Academic Press, San Diego, CA.
Clapham, P.J. 2018. Humpback whale Megaptera novaeangliae. p. 489-492 In: Würsig, B., J.G.M. Thewissen, and K.M. Kovacs (eds.), Encyclopedia of marine mammals, 3rd ed. Academic Press, San Diego, CA.
Clapham, P.J. and C.A. Mayo. 1987. Reproduction and recruitment of individually identified humpback whales, Megaptera novaeangliae, observed in Massachusetts Bay, 1979–1985. Can. J. Zool. 65(12):2853-2863. doi:10.1139/z87-434
Clark, C.W., W.T. Ellison, B.L. Southall, L. Hatch, S.M. Van Parijs, A. Frankel, and D. Ponirakis. 2009. Acoustic masking in marine ecosystems: intuitions, analysis, and implication. Mar. Ecol. Prog. Ser. 395:201-222. doi: 10.3354/meps08402.
Committee on Taxonomy. 2018. List of marine mammal species and subspecies. Society for Marine Mammalogy. Accessed online May 6, 2019 at https://www.marinemammalscience.org/species-information/list-marine-mammal-species-subspecies/
Crocker, S.E., and F.D. Fratantonio. 2016. Characteristics of Sounds Emitted During High-Resolution Marine Geophysical Surveys. NUWC-NPT Technical Report 12,203. 24 March 2016, Naval Undersea Warfare Center Division, Newport, RI.
Curry, B.E. and J. Smith. 1997. Phylogeographic structure of the bottlenose dolphin (Tursiops truncatus): stock identification and implications for management. Mol. Genet. Mar. Mammal. 3:327-247.
Daoust, P.-Y., E.L. Couture, T. Wimmer, and L. Bourque. 2017. Incident Report: North Atlantic Right Whale Mortality Event in the Gulf of St. Lawrence, 2017. Collaborative report produced by the Canadian Wildlife Health Cooperative, Marine Animal Response Society, and Fisheries and Oceans Canada, 256 pp.
DFO (Fisheries and Oceans Canada). 2017. Stock assessment of Canadian Northwest Atlantic grey seals (Halichoerus grypus). DFO Can. Sci. Advis. Rep. 2017/045. Retrieved from http://waves-vagues.dfo-mpo.gc.ca/Library/40646749.pdf on April 29, 2019.
Donovan, G.P. 1991. A review of IWC stock boundaries. Rep. Int. Whal. Commn Spec. Iss. 13:39-68.

Mayflower Wind Energy LLC Request for an IHA Revised April 2021
Page 42
Dufault, S., H. Whitehead, and M. Dillon. 1999. An examination of the current knowledge on the stock structure of sperm whales (Physeter macrocephalus) worldwide. J. Cetacean Res. Manage. 1(1):1-10.
Ellison, W.T., B.L. Southall, C.W. Clark, and A.S. Frankel. 2012. A new context-based approach to assess marine mammal behavioral responses to anthropogenic sounds. Conserv. Biol. 26(1):21-28. doi: 10.1111/j.1523-1739.2011.01803.x.
Erbe, C., C. Reichmuth, K. Cunningham, K. Lucke, and R. Dooling. 2016. Communication masking in marine mammals: a review and research strategy. Mar. Pollut. Bull. 103:15-38. doi: 10.1016/j.marpolbul.2015.12.007.
ESRI. 2017. ArcGIS Desktop: Release 10.6.1. Environmental Systems Research Institute. Redlands, California.
Finneran, J.J. and B.K. Branstetter. 2013. Effects of noise on sound perception in marine mammals. p. 273-308 In: H. Brumm (ed.). Animal communication and noise. Springer-Verlag, Berlin, Germany.
Finneran, J.J., C.E. Schlundt, B.K. Branstetter, J.S. Trickey, V. Bowman, and K. Jenkins. 2015. Effects of multiple impulses from a seismic air gun on bottlenose dolphin hearing and behavior. J. Acoust. Soc. Am. 137(4):1634-1646. doi: 10.1121/1.4916591].
Forney, K.A., B.L. Southall, E. Slooten, S. Dawson, A.J. Read, R.W. Baird, and R.L. Brownell, Jr. 2017. Nowhere to go: noise impact assessments for marine mammal populations with high site fidelity. Endang. Spec. Res. 32:391-413.
Garrigue, C., A. Aguayo, V.L.U. Amante-Helweg, C.S. Baker, S. Caballero, P. Clapham, R. Constantine, J. Denkinger, M. Donoghue, L. Florez-Gonzalez, J. Greaves, N. Hauser, C. Olavarria, C. Pairoa, H. Peckham, and M. Poole. 2002. Movements of humpback whales in Oceania, South Pacific. J. Cetacean Res. Manage. 4(3):255-260.
Garrison, L.P. 2020. Abundance of cetaceans along the southeast U.S east coast from a summer 2016 vessel survey. Southeast Fisheries Science Center, Protected Resources and Biodiversity Division, 75 Virginia Beach Dr., Miami, FL 33140. PRD Contribution # PRD-2020-04, 17 pp.
Gaskin, D.E. 1982. The ecology of whales and dolphins. Heineman Educational Books Ltd., London, U.K. 459 p.
Gaskin, D.E. 1984. The harbor porpoise Phocoena phocoena (L.): regional populations, status, and information on direct and indirect catches. Rep. Int. Whal. Comm. 34:569-586.
Gervaise, C., Y. Simard, N. Roy, B. Kinda, and N. Menard. 2012. Shipping noise in whale habitat: characteristics, sources, budget, and impact on belugas in Saguenay-St. Lawrence Marine Park hub. J. Acoust. Soc. Am. 132(1):76-89. doi: 10.1121/1.4728190.
Gordon, J.C.D., D. Gillespie, J. Potter, A. Frantzis, M.P. Simmonds, R. Swift, and D. Thompson. 2004. A review of the effects of seismic survey on marine mammals. Mar. Technol. Soc. J. 37(4):14-32.
Hain, J.H.W., M.J. Ratnaswamy, R.D. Kenney, and H.E. Winn. 1992. The fin whale, Balaenoptera physalus, in waters of the northeastern United States continental shelf. Rep. Int. Whaling Commn 42:653-669.
Hamazaki, T. 2002. Spatiotemporal prediction models of cetacean habitats in the mid-western North Atlantic Ocean (from Cape Hatteras, North Carolina, USA to Nova Scotia, Canada). Mar. Mammal Sci. 18(4):920-939. doi: 10.1111/j.1748-7692.2002.tb01082.x
Hartman, K.L. 2018. Risso's dolphin Grampus griseus p. 824-827 In: Würsig, B., J.G.M. Thewissen, and K.M. Kovacs (eds.), Encyclopedia of marine mammals, 3rd ed. Academic Press, San Diego, CA.
Hatch, L.T., C.W. Clark, S.M. Van Parijs, A.S. Frankel, and D.W. Ponirakis. 2012. Quantifying loss of acoustic communication space for right whales in and around a U.S. National Marine Sanctuary. Conserv. Biol. 26(6):983-994. doi: 10.1111/j.1523-1739.2012.01908.x.

Mayflower Wind Energy LLC Request for an IHA Revised April 2021
Page 43
Hayes, S.A., E. Josephson, K. Maze-Foley, and P.E. Rosel, eds. 2017. US Atlantic and Gulf of Mexico marine mammal stock assessments - 2016. U.S. Dep. Commer., Woods Hole, MA. NOAA Tech. Memo. NMFS-NE-241. 274 p.
Hayes, S.A., E. Josephson, K. Maze-Foley, and P.E. Rosel, eds. 2018. US Atlantic and Gulf of Mexico marine mammal stock assessments - 2017. U.S. Dep. Commer., Woods Hole, MA. NOAA Tech. Memo. NMFS-NE-245. 373 p.
Hayes, Sean A., E. Josephson, K. Maze-Foley, and P.E. Rosel, eds. 2019. US Atlantic and Gulf of Mexico marine mammal stock assessments - 2018. U.S. Dep. Commer., Woods Hole, MA. NOAA Tech. Memo. NMFS-NE-258. 298 p.
Hayes, S.A., E. Josephson, K. Maze-Foley, and P.E. Rosel, eds. 2020. US Atlantic and Gulf of Mexico marine mammal stock assessments - 2019. U.S. Dep. Commer., Woods Hole, MA. NOAA Tech. Memo. NMFS-NE-264. 468 p.
Hersh, S.L. and D.A. Duffield. 1990. Distinction between northwest Atlantic offshore and coastal bottlenose dolphins based on hemoglobin profile and morphometry. p. 129-139 In S. Leatherwood and R.R. Reeves (eds.), The bottlenose dolphin. Academic Press, San Diego, CA.
Horwood, J. 2018. Sei whale Balaenoptera borealis. p. 845-847 In: Würsig, B., J.G.M. Thewissen, and K.M. Kovacs (eds.), Encyclopedia of marine mammals, 3rd ed. Academic Press, San Diego, CA.
Jacquet, N. and D. Gendron. 2002. Distribution and relative abundance of sperm whales in relation to key environmental features, squid landings and the distribution of other cetacean species in the Gulf of California, Mexico. Mar. Biol. 141(3):591-601. doi: 10.1007/s00227-002-0839-0.
Jacquet, N. and H. Whitehead. 1996. Scale-dependent correlation of sperm whale distribution with environmental features and productivity in the South Pacific. Mar. Ecol. Prog. Ser. 135:1-9.
Jefferson, T.A., M.A. Webber, and R.L. Pitman. 2008. Marine mammals of the world: a comprehensive guide to their identification. Amsterdam: Elsevier. 592 p.
Jefferson, T.A., C.R. Weir, R.C Anderson, L.T. Ballance, R.D. Kenney, and J.J. Kiszka. 2014. Global distribution of Risso's dolphin Grampus griseus: A review and critical evaluation. Mammal Rev. 44(1):56-68. doi:doi:10.1111/mam.12008.
Jensen, F.H., L. Bejder, M. Wahlberg, N. Aguilar Soto, M. Johnson, and P.T. Madsen. 2009. Vessel noise effects on delphinid communication. Mar. Ecol. Prog. Ser. 395:161-175. doi: 10.3354/meps08204.
Johnson, A, G. Salvador, J. Kenney, J. Robbins, S. Landry and P. Clapham. 2005. Fishing gear involved in entanglements of right and humpback whales. Marr. Mamm. Sci. 21: 635-645
Katona, S.K. and J.A. Beard. 1990. Population size, migrations and feeding aggregations of the humpback whale (Megaptera novaeangliae) in the western North Atlantic Ocean. Rep. Int. Whal. Comm. Spec. Iss. 12:295-305.
Katona, S.K., D.T. Richardson, and V. Rough. 1993. A field guide to whales, porpoises, and seals from Cape Cod to Newfoundland, 4th ed revised. Washington, D.C.: Smithsonian Institution Press. 316 p.
Kennedy, A.S., A.N. Zerbini, O.V. Vásquez, N. Gandilhon, P.J. Clapham, and O. Adam. 2014. Local and migratory movements of humpback whales (Megaptera novaeangliae) satellite-tracked in the North Atlantic Ocean. Can. J. Zool. 92(1):8-17. doi: 10.1139/cjz-2013-0161.
Kenney, M.K. 1994. Harbor seal population trends and habitat use in Maine. M.Sc. thesis, University of Maine, Orono, ME.
Kenney, R.D. 1990. Bottlenose dolphins off the north-eastern United States. p. 369-386 In S. Leatherwood and R.R. Reeves (eds.), The bottlenose dolphin. Academic Press, San Diego, CA.
Kenney, R.D. 2018. Right whales Eubalaena glacialis, E. japonica, and E. australis. p. 817-822 In: Würsig, B., J.G.M. Thewissen, and K.M. Kovacs (eds.), Encyclopedia of marine mammals, 3rd ed. Academic Press, San Diego, CA.

Mayflower Wind Energy LLC Request for an IHA Revised April 2021
Page 44
Kenney, R.D. and K.J. Vigness-Raposa. 2010. Marine mammals and sea turtles of Narragansett Bay, Block Island Sound, Rhode Island Sound, and nearby waters: an analysis of existing data for the Rhode Island Ocean Special Area Management Plan. p. 634-970 In: Rhode Island Coastal Resources Management Council (ed.). Rhode Island Ocean Special Area Management Plan Volume 2. Appendix A: technical reports for the Rhode Island Ocean Special Area Management Plan.
Kenney, R.D., M.A.M. Hyman, R.E. Owen, G.P. Scott, and H.E. Winn. 1986. Estimation of prey densities required by western North Atlantic right whales. Mar. Mammal Sci. 2(1):1-13. doi:doi:10.1111/j.1748-7692.1986.tb00024.x
Kenney, R.D., H.E. Winn, and M.C. Macaulay. 1995. Cetaceans in the Great South Channel, 1979–1989: Right whale (Eubalaena glacialis). Cont. Shelf Res. 15(4):385-414. doi: 10.1016/0278-4343(94)00053-P
King, J.E. 1983. Seals of the world, 2nd ed. Oxford University Press, Oxford, U.K. 240 p.
Knowlton, A. R., & Kraus, S. D. 2001. Mortality & injury of right whales in NAtl (ship strike).pdf>. 193–208.
Kraus, S.D., S. Leiter, K. Stone, B. Wikgren, C. Mayo, P. Hughes, R.D. Kenney, C.W. Clark, A.N. Rice, B. Estabrook, and J. Tielens. 2016. Northeast large pelagic survey collaborative aerial and acoustic surveys for large whales and sea turtles. U.S. Dep. of the Interior, Bureau of Ocean Energy Management, Sterling, VA. OCS Study BOEM 2016-054. 117 p. + appx.
Kruse, S., D.K. Caldwell, and M.C. Caldwell. 1999. Risso’s dolphin Grampus griseus G. Cuvier, 1812. p. 183-212 In: S.H. Ridgway and R. Harrison, eds., Handbook of Marine Mammals, Academic Press, Cambridge, U.K.
Laake, J.L. and D.L. Borchers 2004. Methods for incomplete detection at distance zero. Pages 108-189 in: Advanced distance sampling, edited by S.T. Buckland, D.R. Andersen, K.P. Burnham, J.L. Laake, and L. Thomas. Oxford University Press, New York, NY.
LaBrecque, E., C. Curtice, J. Harrison, S.M. Van Parijs, and P.N. Halpin. 2015. 2. Biologically important areas for cetaceans within U.S. waters – east coast region. Aquat. Mammal. 41(1):17-29. doi: 10.1578/am.41.1.2015.17.
Lavigueur, L. and M.O. Hammill. 1993. Distribution and seasonal movements of grey seals, Halichoerus grypus, born in the Gulf of St. Lawrence and eastern Nova Scotia shore. Can. Field-Natur. 107(3):329-340.
Lawson J. and J-F. Gosselin in review. 2016. Estimates of cetacean abundance from the 2016 NAISS aerial surveys of eastern Canadian waters, with a comparison to estimates from the 2007 TNASS. NAMMCO SC/25/AE/09
Leatherwood, S., D.K. Caldwell, and H.E. Winn. 1976. Whales, dolphins, and porpoises of the western North Atlantic. A guide to their identification. NOAA Tech. Rep. NMFS Circ. 396. 176 p.
Lesage, V. and M.O. Hammill. 2001. The status of the grey seal, Halichoerus grypus, in the Northwest Atlantic. Can. Field-Natur. 115(4):653-662.
Lusseau, D. and L. Bejder. 2007. The long-term consequences of short-term response to disturbance experiences from whale watching impact assessment. Int. J. Comp. Psychol. 20(2):228-236.
MacGillivray, A.O., R. Racca, and Z. Li. 2014. Marine mammal audibility of selected shallow-water survey sources. J. Acoust. Soc. Am. 135(1):EL35-EL40. doi: 10.1121/1.4838296.
New, L.F., D.J. Moretti, S.K. Hooker, D.P. Costa, and S.E. Simmons. 2013b. Using energetic models to investigate the survival and reproduction of beaked whales (family Ziphiidae). PLOS ONE 8(7):e68725. doi: 10.1371/journal.pone.0068725.

Mayflower Wind Energy LLC Request for an IHA Revised April 2021
Page 45
New, L.F., J. Harwood, L. Thomas, C. Donovan, J.S. Clark, G. Hastie, P.M. Thompson, B. Cheney, L. Scott-Hayward, and D. Lusseau. 2013a. Modelling the biological significance of behavioural change in coastal bottlenose dolphins in response to disturbance. Func. Ecol. 27(2):314-322. doi: 10.1111/1365-2435.12052.
Mayo, C.A. and M.K. Marx. 1990. Surface foraging behaviour of the North Atlantic right whale, Eubalaena glacialis, and associated zooplankton characteristics. Can. J. Zool. 68(10):2214-2220. doi:10.1139/z90-308
Mead, J.G. and C.W. Potter. 1995. Recognizing two populations of the bottlenose dolphin (Tursiops truncatus) of the Atlantic coast of North America-morphologic and ecologic considerations. Int. Biol. Res. Ins. Rep. 5:31-43.
Moxley, J.H., A. Bogomolni, M.O. Hammill, K.M.T. Moore, M.J. Polito, L. Sette, W.B. Sharp, G.T. Waring, J.R. Gilbert, P.N. Halpin, and D.W. Johnston. 2017. Google haul out: earth observation imagery and digital aerial surveys in coastal wildlife management and abundance estimation. Bioscience 67(8):760-768. doi: 10.1093/biosci/bix059.
NEFSC and SEFSC (Northeast Fisheries Science Center and Southeast Fisheries Science Center). 2011. 2010 Annual report to the inter-agency agreement M10PG00075/0001: a comprehensive assessment of marine mammal, marine turtle, and seabird abundance and spatial distribution in US waters of the western North Atlantic Ocean. 70 p. Last accessed April 29, 2019 online at https://www.nefsc.noaa.gov/psb/AMAPPS/docs/Final_2010AnnualReportAMAPPS_19Apr2011.pdf.
NEFSC and SEFSC (Northeast Fisheries Science Center and Southeast Fisheries Science Center). 2012. 2011 Annual report to the inter-agency agreement M10PG00075/0001: a comprehensive assessment of marine mammal, marine turtle, and seabird abundance and spatial distribution in US waters of the western North Atlantic Ocean. 166 p. Last accessed April 29, 2019 online at https://www.nefsc.noaa.gov/psb/AMAPPS/docs/NMFS_AMAPPS_2011_annual_report_final_BOEM.pdf .
NEFSC and SEFSC (Northeast Fisheries Science Center and Southeast Fisheries Science Center). 2013. 2012 Annual report of a comprehensive assessment of marine mammal, marine turtle, and seabird abundance and spatial distribution in US waters of the western North Atlantic Ocean. 121 p. Last accessed April 29, 2019 online at https://www.nefsc.noaa.gov/psb/AMAPPS/docs/NMFS_AMAPPS_2012_annual_report_FINAL.pdf.
NEFSC and SEFSC (Northeast Fisheries Science Center and Southeast Fisheries Science Center). 2014. 2013 Annual report of a comprehensive assessment of marine mammal, marine turtle, and seabird abundance and spatial distribution in US waters of the western North Atlantic Ocean. 204 p. Last accessed April 29, 2019 online at https://www.nefsc.noaa.gov/psb/AMAPPS/docs/NMFS_AMAPPS_2013_annual_report_FINAL3.pdf .
NEFSC and SEFSC (Northeast Fisheries Science Center and Southeast Fisheries Science Center). 2015. 2014 Annual report of a comprehensive assessment of marine mammal, marine turtle, and seabird abundance and spatial distribution in US waters of the western North Atlantic Ocean. 197 p. Last accessed April 29, 2019 online at https://www.nefsc.noaa.gov/psb/AMAPPS/docs/NMFS_AMAPPS_2014_annual_report_Final.pdf.
NEFSC and SEFSC (Northeast Fisheries Science Center and Southeast Fisheries Science Center). 2016. 2015 Annual report of a comprehensive assessment of marine mammal, marine turtle, and seabird abundance and spatial distribution in US waters of the western North Atlantic Ocean – AMAPPS II. 128 p. Last accessed April 29, 2019. at

Mayflower Wind Energy LLC Request for an IHA Revised April 2021
Page 46
https://www.nefsc.noaa.gov/psb/AMAPPS/docs/NMFS_AMAPPS_2015_annual_report_Final.pdf.
NEFSC and SEFSC (Northeast Fisheries Science Center and Southeast Fisheries Science Center). 2017. 2016 Annual report of a comprehensive assessment of marine mammal, marine turtle, and seabird abundance and spatial distribution in US waters of the western North Atlantic Ocean – AMAPPS II. 153 p. Last accessed April 29, 2019 online at https://www.nefsc.noaa.gov/psb/AMAPPS/docs/Annual%20Report%20of%202016%20AMAPPS_final.pdf.
NEFSC and SEFSC (Northeast Fisheries Science Center and Southeast Fisheries Science Center). 2018. 2017 Annual report of a comprehensive assessment of marine mammal, marine turtle, and seabird abundance and spatial distribution in US waters of the western North Atlantic Ocean – AMAPPS II. 141 p. Last accessed April 29, 2019 online at https://www.nefsc.noaa.gov/psb/AMAPPS/docs/AMAPPS%202017%20annual%20report_final.pdf.
NMFS (National Marine Fisheries Service) 2008. Endangered Fish and Wildlife; final rule to implement speed restrictions to reduce the threat of ship collisions with North Atlantic Right Whales. Fed. Regist. 73: (19, 10 Oct., 2008): 60173-60191
NMFS (National Marine Fisheries Service) 2016a. Endangered and threatened species; critical habitat for endangered North Atlantic Right Whale. Fed. Regist. 81: (38, 27 Jan., 2016): 4837-4874
NMFS (National Marine Fisheries Service) 2016b. Endangered and threatened species; identification of 14 distinct population segments of the Humpback Whale (Megaptera novaeangliae) and revision of species-wide listing. Fed. Regist. 81: (62, 8 Sep., 2016): 62259-62320
NMFS (National Marine Fisheries Service). 2017. Takes of marine mammals incidental to specified activities; Taking marine mammal incidental to Site Characterization Surveys Off the Coast of New Jersey. Fed. Regist. 82:(129, 7 Jul., 2017): 31562-31575.
NMFS (National Marine Fisheries Service). 2018a. Takes of marine mammals incidental to specified activities; taking marine mammals incidental to site characterization surveys off of New York. Fed. Regist. 83:(36, 22 Feb., 2018): 7655-7680.
NMFS (National Marine Fisheries Service). 2018b. Takes of marine mammals incidental to specified activities; taking marine mammals incidental to marine site characterization surveys off of Delaware. Fed. Regist. 83:(65, 4 Apr., 2018): 14417-14443.
NMFS (National Marine Fisheries Service). 2018c. Takes of marine mammals incidental to specified activities; taking marine mammals incidental to marine site characterization surveys off of Rhode Island and Massachusetts. Fed. Regist. 83:(87, 4 May, 2018): 19711-19736.
NMFS (National Marine Fisheries Service). 2018f. Taking and importing marine mammals; Taking marine mammals incidental to geophysical surveys related to oil and gas activities in the Gulf of Mexico. Fed. Regist. 83:(121, 22 Jun., 2018): 29212-29310.
NMFS (National Marine Fisheries Service). 2019. Takes of marine mammals incidental to specified activities; Taking marine mammal incidental to Site Characterization Surveys Off the Coast of North Carolina. Fed. Regist. 84:(80, 25 Apr., 2019): 17384-17405.
NMFS (National Marine Fisheries Service). 2020a. 2016-2020 Humpback whale unusual mortality event along the Atlantic coast. Last accessed online September 21, 2020 at https://www.fisheries.noaa.gov/national/marine-life-distress/2016-2020-humpback-whale-unusual-mortality-event-along-atlantic-coast
NMFS (National Marine Fisheries Service). 2020b. 2017-2020 Minke whale unusual mortality event along the Atlantic coast. Last accessed online September 21, 2020 at https://www.fisheries.noaa.gov/national/marine-life-distress/2017-2020-minke-whale-unusual-mortality-event-along-atlantic-coast

Mayflower Wind Energy LLC Request for an IHA Revised April 2021
Page 47
NMFS (National Marine Fisheries Service). 2020c. 2017-2020 North Atlantic right whale unusual mortality event. Last accessed online September 21, 2020 at https://www.fisheries.noaa.gov/national/marine-life-distress/2017-2020-north-atlantic-right-whale-unusual-mortality-event#:~:text=Beginning%20in%202017%2C%20elevated%20mortalities,Unusual%20Mortality%20Event%20(UME).&text=To%20date%2C%20in%202020%2C%20one%20mortality%20has%20been%20documented
NMFS (National Marine Fisheries Service). 2020d. 2018–2020 Pinniped unusual mortality event along the northeast coast. Last accessed online September 21, 2020 at https://www.fisheries.noaa.gov/new-england-mid-atlantic/marine-life-distress/2018-2020-pinniped-unusual-mortality-event-along
NMFS (National Marine Fisheries Service). 2020e. Interim recommendation for sound source level and propagation analysis for high resolution geophysical (HRG) sources. Version 4.0. 2 April 2020.
Northridge, S., M.L. Tasker, A. Webb, and J.E. Williams. 1997. White-beaked Lagenorhynchus albirostris and Atlantic white-sided dolphin L. acutus distributions in northwest European and US North Atlantic waters. Rep. Int.l Whal. Commn 47:797-805.
Nowacek, D.P., L.H. Thorne, D.W. Johnston, and P.L. Tyack. 2007. Responses of cetaceans to anthropogenic noise. Mammal Rev. 37(2):81-115.
Nowacek, D.P., C.W. Clark, D. Mann, P.J.O. Miller, H.C. Rosenbaum, J.S. Golden, M. Jasny, J. Kraska, and B.L. Southall. 2015. Marine seismic surveys and ocean noise: time for coordinated and prudent planning. Front. Ecol. Environ. 13(7):378-386. doi: 10.1890/130286.
Olson, P.A. 2018. Pilot whales Globicephala melas and G. macrorhynchus. p. 701-705 In: Würsig, B., J.G.M. Thewissen, and K.M. Kovacs (eds.), Encyclopedia of marine mammals, 3rd ed. Academic Press, San Diego, CA.
Pace, R.M., III, P.J. Corkeron, and S.D. Kraus. 2017. State-space mark-recapture estimates reveal a recent decline in abundance of North Atlantic right whales. Ecol. Evol. (2017):1-12. doi: 10.1002/ece3.3406.
Palka, D.L., S. Chavez-Rosales, E. Josephson, D. Cholewiak, H.L. Haas, L. Garrison, M. Jones, D. Sigourney, G. Waring, M. Jech, E. Broughton, M. Soldevilla, G. Davis, A. DeAngelis, C.R. Sasso, M.V. Winton, R.J. Smolowitz, G. Fay, E. LaBrecque, J.B. Leiness, Dettloff, M. Warden, K. Murray, and C. Orphanides. 2017. Atlantic Marine Assessment Program for Protected Species: 2010-2014. U.S. Dep. of the Interior, Bureau of Ocean Energy Management Atlantic OCS Region, Washington, D.C. OCS Study BOEM 2017-071. 211 p.
Palka, D. 2020. Cetacean abundance estimates in US northwestern Atlantic Ocean waters from summer 2016 line transect surveys conducted by the Northeast Fisheries Science Center. Northeast Fish. Sci. Cent. Ref. Doc. 20-05.
Palsbøll, P.J., J. Allen, M. Bérube´, P.J. Clapham, T.P. Feddersen, P.S. Hammond, R.R. Hudson, H. Jørgensen, S. Katona, A.H. Larsen, F. Larsen, J. Lien, D.K. Mattila, J. Sigurjónsson, R. Sears, T. Smith, R. Sponer, P. Stevick, and N. Øien. 1997. Genetic tagging of humpback whales. Nature 388:767-769. doi: 10.1038/42005.
Palsbøll, P.J., J. Allen, T.H. Anderson, M. Berube, P.J. Clapham, T.P. Feddersen, N.A. Friday, P.S. Hammond, H. Jorgensen, S.K. Katona, F. Larsen, J. Lien, D.K. Mattila, F.B. Nygaard, J. Robbins, R. Sponer, R. Sears, J. Sigurjonsson, T.G. Smith, P.T. Stevick, G.A. Vikingsson, and N. Oien. 2001. Stock structure and composition of the North Atlantic humpback whale, Megaptera novaeangliae. Working Pap. SC/53/NAH11. Int. Whal. Comm., Cambridge, U.K.
Payne, P.M. and D.W. Heinemann. 1990. A distributional assessment of cetaceans in the shelf and shelf edge waters of the northeastern United States based on aerial and shipboard surveys, 1978-1988. Report to Nat. Mar. Fish. Serv. Northeast Fish. Sci. Ctr., Woods Hole, MA.

Mayflower Wind Energy LLC Request for an IHA Revised April 2021
Page 48
Payne, P.M. and D.W. Heinemann. 1993. The distribution of pilot whales (Globicephala spp.) in shelf/shelf edge and slope waters of the north-eastern United States, 1978-1988. Rep. Int. Whal. Commn Spec. Iss. 14:51-68.
Payne, P.M. and L.A. Selzer. 1989. The distribution, abundance, and selected prey of the harbor seal, Phoca vitulina concolor, in southern New England. Mar. Mammal Sci. 5(2):173-192. doi:doi:10.1111/j.1748-7692.1989.tb00331.x
Payne, P.M., L.A. Selzer, and A.R. Knowlton. 1984. Distribution and density of cetaceans, marine turtles, and seabirds in the shelf waters of the northeastern United States, June 1980-December 1983, based on shipboard observations. Rep. to Nat. Mar. Fish. Serv., Woods Hole, MA.
Perrin, W.F. 2018a. Common dolphin Delphinus delphis. p. 205-209 In: Würsig, B., J.G.M. Thewissen, and K.M. Kovacs (eds.), Encyclopedia of marine mammals, 3rd ed. Academic Press, San Diego, CA.
Perrin, W.F., S.D. Mallette, and R.L. Brownell, Jr. 2018b. Minke whales Balaenoptera acutorostrata and B. bonaerensis. p. 608-613 In: Würsig, B., J.G.M. Thewissen, and K.M. Kovacs (eds.), Encyclopedia of marine mammals, 3rd ed. Academic Press, San Diego, CA.
Raposa, K.B. 2009. Aquatic birds, marine mammals, and sea turtles. Chapter 11 in Raposa, K.B., and M.L. Schwartz (eds.). 2009. An Ecological Profile of the Narragansett Bay National Estuarine Research Reserve. Rhode Island Sea Grant, Narragansett, R.I. 176 pp.
Reeves, R.R. and H. Whitehead. 1997. Status of the sperm whale, Physeter macrocephalus, in Canada. Can. Field-Natur. 111(2):293-307.
Reeves, R.R., B.S. Stewart, P.J. Clapham, and J.A. Powell. 2002. Guide to marine mammals of the world. Chanticleer Press, New York, NY. 527 p.
Rice, D.W. 1998. Marine mammals of the world, systematics and distribution. Spec. Publ. 4. Soc. Mar. Mammal., Allen Press, Lawrence, KS. 231 p.
Rice, A.N., J.T. Tielens, B.J. Estabrook, C.A. Muirhead, A. Rahaman, M. Guerra, and C.W. Clark. 2014. Variation of ocean acoustic environments along the western North Atlantic coast: a case study in context of the right whale migration route. Ecol. Inform. 21:89-99. doi: 10.1016/j.ecoinf.2014.01.005.
Richardson, D.T. 1976. Assessment of harbor and gray seal populations in Maine 1974-1975. Final report for Marine Mammal Commission. Washington, DC.
Richardson, W.J., C.R. Greene, Jr., C.I. Malme, and D.H. Thomson. 1995. Marine mammals and noise. Academic Press, San Diego, CA. 576 p.
Roberts, J.J., L. Mannocci, and P.N. Halpin. 2017. Final project report: marine species density data gap assessments and update for the AFTT study area, 2016-2017 (opt. year 1). Document version 1.4 (unpublished report). Report prepared for Naval Facilities Engineering Command, Atlantic by Duke University Marine Geospatial Ecology Lab, Durham, NC. 76 p.
Roberts, J.J., L. Mannocci, R.S. Schick, and P.N. Halpin. 2018. Final project report: marine species density data gap assessments and update for the AFTT study area, 2017-2018 (opt. year 2). Document version 1.2 (unpublished report). Report prepared for Naval Facilities Engineering Command, Atlantic by Duke University Marine Geospatial Ecology Lab, Durham, NC. 113 p.
Roberts J.J., R.S. Schick, P.N. Halpin. 2020. Final Project Report: Marine Species Density Data Gap Assessments and Update for the AFTT Study Area, 2018-2020 (Option Year 3). Document version 1.4 and North Atlantic Right Whale version 10 data. Report prepared for Naval Facilities Engineering Command, Atlantic by the Duke University Marine Geospatial Ecology Lab, Durham, NC.
Roberts, J.J., B.D. Best, L. Mannocci, E. Fujioka, P.N. Halpin, D.L. Palka, L.P. Garrison, K.D. Mullin, T.V.N. Cole, C.B. Khan, W.A. McLellan, D.A. Pabst, and G.G. Lockhart. 2016. Habitat-based
Mayflower Wind Energy LLC Request for an IHA Revised April 2021
Page 49
cetacean density models for the U.S. Atlantic and Gulf of Mexico. Sci. Rep. 6:22615. doi: 10.1038/srep22615.
Rone, B.K., I. Pace, and M. Richard. 2012. A simple photograph-based approach for discriminating between free-ranging long-finned (Globicephala melas) and short-finned (G. macrorhynchus) pilot whales off the east coast of the United States. Mar. Mammal Sci. 28(2):254-275. doi: 10.1111/j.1748-7692.2011.00488.x.
Rosel, P.E., L. Hansen, and A.A. Hohn. 2009. Restricted dispersal in a continuously distributed marine species: common bottlenose dolphins Tursiops truncatus in coastal waters of the western North Atlantic. Mol. Ecol. 18(24):5030-5045.
Schneider, D.C. and P.M. Payne. 1983. Factors affecting haul-out of harbor seals at a site in southeastern Massachusetts. J. Mammal. 64(3):518-520.
Schroeder, C.L. 2000. Population status and distribution of the harbor seal in Rhode Island waters. M.Sc. Thesis, University of Rhode Island, Narragansett, RI. ## p.
Scott, T.M. and S.S. Sadove. 1997. Sperm whale, Physeter macrocephalus, sightings in the shallow shelf waters off Long Island, New York. Mar. Mammal Sci. 13(2):317-321. doi: 10.1111/j.1748-7692.1997.tb00636.x
Selzer, L.A. and P.M. Payne. 1988. The distribution of white‐sided (Lagenorhynchus acutus) and common dolphins (Delphinus delphis) vs. environmental features of the continental shelf of the northeastern United States. Mar. Mammal Sci. 4:141-153.
Sieswerda, P.L., C.A. Spagnoli, and D.S. Rosenthal. 2015. Notes on a new feeding ground for humpback whales in the Western New York Bight. Paper presented at the Southeast and Mid-Atlantic Marine Mammal Symposium, Virginia Beach, VI.
Sills, J.M., B.L. Southall, and C. Reichmuth. 2017. The influence of temporally varying noise from seismic air guns on the detection of underwater sounds by seals. J. Acoust. Soc. Am. 141(2):996-1008. doi: 10.1121/1.4976079].
Southall, B.L., J.J. Finneran, C. Reichmuth, P.E. Nachtigall, D.R. Ketten, A.E. Bowles, W.T. Ellison, D.P. Nowacek, and P.L. Tyack. 2019. Marine mammal noise exposure criteria: updated scientific recommendations for residual hearing effects. Aquat. Mamm. 45(2):125-232. doi: 10.1578/am.45.2.2019.125.
Southall, B.L., A.E. Bowles, W.T. Ellison, J.J. Finneran, R.L. Gentry, C.R.J. Greene, D. Kastak, D.R. Ketten, J.H. Miller, P.E. Nachtigall, W.J. Richardson, J.A. Thomas, and P.L. Tyack. 2007. Marine mammal noise exposure criteria: initial scientific recommendations. Aquat. Mamm. 33(4):411-522. doi: 10.1578/AM.33.4.2007.415.
Stewart, B.S. and S. Leatherwood. 1985. Minke whale Balaenoptera acutorostrata Lacépède, 1804. p. 91-136 In: S.H. Ridgway and R. Harrison (eds.), Handbook of marine mammals, vol. 3: the sirenians and baleen whales. Academic Press, London, U.K.
Swingle, W.M., S.G. Barco, T.D. Pitchford, W.A. Mclellan, and D.A. Pabst. 1993. Appearance of juvenile humpback whales feeding in nearshore waters of Virginia. Mar. Mammal Sci. 9(3):309-315. doi: 10.1111/j.1748-7692.1993.tb00458.x
Teilmann, J. and A. Galatius. 2018. Harbor seal Phoca vitulina. p. 451-455 In: Würsig, B., J.G.M. Thewissen, and K.M. Kovacs (eds.), Encyclopedia of marine mammals, 3rd ed. Academic Press, San Diego, CA.
Temte, J. and Ø. Wiig. 1991. Clines revisited: the timing of pupping in the harbour seal (Phoca vitulina). J. Zool. 224(4):617-632.
Tennessen, J.B. and S.E. Parks. 2016. Acoustic propagation modeling indicates vocal compensation in noise improves communication range for North Atlantic right whales. Endang. Spec. Res. 30:225-237. doi: 10.3354/esr00738.
Mayflower Wind Energy LLC Request for an IHA Revised April 2021
Page 50
Tollit, D.J., P.M. Thompson, and S.P.R. Greenstreet. 1997. Prey selection by harbour seals, Phoca vitulina, in relation to variations in prey abundance. Can. J. Zool. 75(9):1508-1518. doi:10.1139/z97-774.
USFWS (U.S. Fish and Wildlife Service). 2014. West Indian manatee (Trichechus manatus) Florida stock (Florida subspecies, Trichechus manatus latirostris). Accessed online April 4, 2019 at https://www.fws.gov/northflorida/manatee/SARS/20140123_FR00001606_Final_SAR_WIM_FL_Stock.pdf.
Vigness-Raposa, K.J., R.D. Kenney, M.L. Gonzalez, and P.V. August. 2010. Spatial patterns of humpback whale (Megaptera novaeangliae) sightings and survey effort: Insight into North Atlantic population structure. Mar. Mammal Sci. 26(1):161-175. doi: doi:10.1111/j.1748-7692.2009.00336.x.
Wartzok, D., A.N. Popper, J. Gordon, and J. Merrill. 2004. Factors affecting the responses of marine mammals to acoustic disturbance. Mar. Technol. Soc. J. 37(4):6-15. doi: 10.4031/002533203787537041.
Weilgart, L.S. 2007. A brief review of known effects of noise on marine mammals. Int. J. Comp. Psychol. 20:159-168.
Wells, R.S. and M.D. Scott. 2018. Bottlenose dolphin, Tursiops truncatus, common bottlenose dolphin. p. 118-125 In: Würsig, B., J.G.M. Thewissen, and K.M. Kovacs (eds.), Encyclopedia of marine mammals, 3rd ed. Academic Press, San Diego, CA.
Wensveen, P.J., A.M. von Benda-Beckmann, M.A. Ainslie, F.-P.A. Lam, P.H. Kvadsheim, P.L. Tyack, and P.J.O. Miller. 2015. How effectively do horizontal and vertical response strategies of long-finned pilot whales reduce sound exposure from naval sonar? Mar. Environ. Res. 106:68-81. doi: 10.1016/j.marenvres.2015.02.005.
Whitehead, H. 2002. Estimates of the current population size and historical trajectory for sperm whales. Mar. Ecol. Prog. Ser. 242:295-304.
Whitehead, H. 2003. Sperm whales: social evolution in the ocean: The University of Chicago Press, Chicago, IL. 431 p.
Whitehead, H. 2018. Sperm whale Physeter macroephalus. p. 919-925 In: Würsig, B., J.G.M. Thewissen, and K.M. Kovacs (eds.), Encyclopedia of marine mammals, 3rd ed. Academic Press, San Diego, CA.
Whitman, A.A. and P.M. Payne. 1990. Age of harbour seals, Phoca vitulina concolor, wintering in southern New England. Can. Field-Natur. 104(4):579-582.
Whitt, A.D., K. Dudzinski, and J.R. Laliberté. 2013. North Atlantic right whale distribution and seasonal occurrence in nearshore waters off New Jersey, USA, and implications for management. Endang. Spec. Res. 20(1):59-69. doi: 10.3354/esr00486.
Wilson, S.C. 1978. Social organization and behavior of harbor seals, Phoca vitulina concolor, in Maine. Final Report to U.S. Marine Mammal Commission in Fulfillment of Contract MM6AC013.

Mayflower Wind Energy LLC Request for an IHA Revised April 2021
Page 51
APPENDIX A – DISTANCES TO ACOUSTIC THRESHOLDS

Version 1.0 i
Distances to Acoustic Thresholds for High Resolution Geophysical Sources
Mayflower Wind
Submitted to:
Darren Ireland Vice President, LGL
Authors:
Zizheng Li Sam Denes
30 October 2020
P001528-002 Document 2239 Version 1.0
JASCO Applied Sciences (USA) Inc. 8630 Fenton Street, Suite 218
Silver Spring, MD 20910 USA Tel: +1-301-565-3500
www.jasco.com

Version 1.0 i
Suggested citation:
Li, Z. and S.L. Denes. 2020. Distances to Acoustic Thresholds for High Resolution Geophysical Sources: Mayflower Wind. Document 2239, Version 1.0. Technical memorandum by JASCO Applied Sciences for Mayflower Wind.
Disclaimer:
The results presented herein are relevant within the specific context described in this report. They could be misinterpreted if not considered in the light of all the information contained in this report. Accordingly, if information from this report is used in documents released to the public or to regulatory bodies, such documents must clearly cite the original report, which shall be made readily available to the recipients in integral and unedited form.

JASCO APPLIED SCIENCES Distances to Acoustic Thresholds for High Resolution Geophysical Sources
Version 1.0 ii
Contents
1. METHODS ...................................................................................................................... 3
1.1. Level A .............................................................................................................................................. 5
1.2. Level B .............................................................................................................................................. 6
2. SOURCES ...................................................................................................................... 6
2.1. Sparker .............................................................................................................................................. 6
2.2. Boomer .............................................................................................................................................. 8
2.3. Sub-bottom Profiler ........................................................................................................................... 8
3. DISTANCES .................................................................................................................. 13
3.1. Sparker ............................................................................................................................................ 13
3.2. Boomer ............................................................................................................................................ 13
3.3. Sub-bottom Profiler ......................................................................................................................... 14
4. SUMMARY ................................................................................................................... 14
LITERATURE CITED .......................................................................................................... 15
APPENDIX A. EQUIPMENT SPECIFICATION REFERENCE SHEETS .......................................... A-1

JASCO APPLIED SCIENCES Distances to Acoustic Thresholds for High Resolution Geophysical Sources
Version 1.0 3
1. Methods
We follow the methods specified in the unpublished Interim Recommendation for Sound Source Level and Propagation Analysis for High Resolution Geophysical (HRG) Sources (NOAA 2019) with modifications to account for energy emitted outside of the primary beam of the source. We note that there is an updated set of interim recommendations (Guan 2020) from the author of the 2019 guidance document. This updated method provides adjusted calculation methods to consider water depth in the prediction of the horizontal impact distance, the method described herein is equivalent to the case where the water depth is greater than the vertical component of the slant distance (see Figure 1 for a diagram). We have not considered water depth in the prediction of the horizontal impact distance, to allow for operational flexibility.
Figure 1. Excerpt from (Guan 2020). The calculation methods described herein is equivalent to the left diagram labelled (a).
The calculation method is described as follows.
The sonar equation is used to calculate the received sound pressure level:
𝑆𝑃𝐿(𝑟) = 𝑆𝐿 − 𝑃𝐿(𝑟), (1)
where SPL is the sound pressure level (dB re 1 μPa), r is the distance from the source (m), SL is the
source level (dB re 1 μPa m), and PL is the propagation loss as a function of distance. Propagation loss is calculated using:
𝑃𝐿(𝑟) = 20log10 (𝑟
1 m) dB + 𝛼(𝑓) ∙ 𝑟/1000, (2)
where 𝛼(𝑓) is the absorption coefficient (dB/km) and 𝑓 is frequency (kHz). The absorption coefficient is approximated by discarding the boric acid term from Ainslie (2010; p29; eq 2.2):
𝛼(𝑓) ≈ 0.000339𝑓2 + 48.5𝑓2 (75.62 + 𝑓2)⁄ . (3)
When a range of frequencies is produced by a source, we use the lowest frequency for determining the absorption coefficient.
The source level is either its in-beam value (for angles within the -3 dB beamwidth) or a single representative out-of-beam value. To account for energy emitted outside of the primary beam of the source, we estimate a representative out-of-beam source level and propagate the sound horizontally. For

JASCO APPLIED SCIENCES Distances to Acoustic Thresholds for High Resolution Geophysical Sources
Version 1.0 4
narrow-beam sources (up to 36° beam width) the out-of-beam source level is estimated by first calculating upper and lower bounds and then taking the average of these.
The method is described as follows. We assume the beam pattern 𝑏(𝑢) is that of an unshaded circular transducer:
𝑏(𝑢) = (2 𝐽1(𝑢) 𝑢⁄ )2, (4)
where 𝐽1(𝑢) is a first order Bessel function of the first kind, whose argument is a function of off-axis angle
𝜃 and beam width (full width at half maximum) 𝛿𝜃
𝑢 = 𝑢0sin 𝜃
sin𝛿𝜃
2
, (5)
where 𝑢0 = 1.614.
For the upper limit we choose the highest sidelobe level of the beam pattern, given by (Ainslie 2010; p265; Table 6.2)
𝐵max = −17.6 dB. (6)
For the lower limit we consider the asymptotic behaviour of the beam pattern in the horizontal direction
𝐽1(𝑢)~√2
π𝑢cos (𝑢 −
3π
4), (7)
where
𝑢 =𝑢0
sin𝛿𝜃
2
. (8)
In this way we obtain the lower limit as
𝐵min = 10 log10 (8
π 𝑢03 sin3
𝛿𝜃
2) dB. (9)
Finally, the out-of-beam source level is found by adding the arithmetic mean of 𝐵min and 𝐵max to the in-beam source level.
For broad beam sources (beam widths larger than 90°), we assumed the source was omnidirectional. For intermediate beam sources (beam widths between 36° and 90°), we interpolated the correction between the two methods. The resulting correction as a function of beam width is shown in Figure 2.
Figure 2. Correction for calculating out-of-beam source level (i.e., in the horizontal direction) from in-beam source level, as a function of source beam width.

JASCO APPLIED SCIENCES Distances to Acoustic Thresholds for High Resolution Geophysical Sources
Version 1.0 5
Separate sound levels were calculated using the in-beam source level at the angle corresponding to the - 3 dB half-width and the out-of-beam source level in the horizontal direction. The higher of the two sound levels was then selected for assessing impact distance.
1.1. Level A
This section describes the methods used to estimate the horizontal distances to the National Marine Fisheries Service (NMFS) acoustic thresholds for injury (Table 1). There are different thresholds for impulsive and non-impulsive (intermittent) sounds. According to Southall et al. (2007), “Harris (1998) proposed a measurement-based distinction of pulses and non-pulses that is adopted here in defining sound types. Specifically, a ≥ 3-dB difference in measurements between continuous and impulse [sound level meter] setting indicates that a sound is a pulse; a < 3-dB difference indicates that a sound is a non-pulse. We note the interim nature of this distinction for underwater signals and the need for an explicit distinction and measurement standard such as exists for aerial signals (ANSI 1986).”
A single pulse of short duration (T << 35 ms – the impulse setting averaging time) would always be considered a pulse using the Southall et al. (2007) criterion. For multiple pulses of short duration, the same reasoning holds if they are separated by an interval well in excess of either 125 ms (8 Hz repetition rate) or 1000 ms (1 Hz repetition rate), depending on whether a fast (125 ms) or slow (1000 ms) time constant is used. If the repetition rate is high enough (> 8 Hz, which we round to 10 Hz to be conservative) the multiple pulses effectively merge together and become one long non-impulse using the same Southall et al (2007) criterion, irrespective of the choice of time constant.
Thus, sources that operate with a repetition rate greater than 10 Hz were assessed with the non-impulsive (intermittent) source criteria; sources with a repetition rate equal to or less than 10 Hz were assessed with the impulsive source criteria.
Table 1. Peak sound pressure level (PK, dB re 1 µPa) and sound exposure level (SEL, dB re 1 µPa2·s) thresholds for injury (PTS onset) for marine mammals for impulsive and non-impulsive sound sources (NMFS 2018).
Functional hearing group Impulsive source
Non-impulsive (intermittent) source
PK Weighted SEL24h Weighted SEL24h
Low-frequency cetaceans (LFC) 219 183 199
Mid-frequency cetaceans (MFC) 230 185 198
High-frequency cetaceans (HFC) 202 155 173
Phocid pinnipeds in water (PPW) 218 185 201
Otariid pinnipeds in water (OPW) 232 203 219
NMFS provides a spreadsheet to calculate these distances, but it is not designed for high-resolution geophysical survey sources. The spreadsheet does not consider seawater absorption or beam patterns, both of which can substantially influence received sound levels. In order to account for these effects, we model sound levels using Equations 1–9, as follows.
Distances to peak thresholds were calculated using the peak source level and applying propagation loss from Equation 2. Peak levels were assessed for both in-beam and out-of-beam levels (the latter was assessed using the out-of-beam source level correction described previously).
For the weighted SEL thresholds, we performed the following steps:
1. Modeled propagation loss as a function of oblique range using Equation 2.
2. Modeled per-pulse SEL for a stationary receiver at a fixed distance off a straight survey line, using a vessel transit speed of 3.5 knots and source-specific pulse length and repetition rate. The off-line

JASCO APPLIED SCIENCES Distances to Acoustic Thresholds for High Resolution Geophysical Sources
Version 1.0 6
distance is referred to as the closest point of approach (CPA) and was performed for CPA distances between 1 m and 10 km. The survey line length was modeled as 10 km long (analysis showed longer
survey lines increased SEL by a negligible amount). SEL is calculated as 𝑆𝑃𝐿 + 10 log10𝑇
1 s dB, where
T is the pulse duration. Both in-beam and out-of-beam levels were included in the SEL calculation as per the described method above. A flat spectrum between the source minimum and maximum frequency is assumed, which was weighted according to the marine mammal hearing group weighting function (NMFS 2018) and summed across frequency.
3. Calculated the SEL for each survey line to produce curves of weighted SEL as a function of CPA distance.
4. Used the curves from Step 4 to estimate the CPA distance to the threshold.
This method accounts for the hearing sensitivity of the marine mammal group, seawater absorption, and beam width for downwards-facing transducers.
1.2. Level B
This section describes the methods used to estimate the horizontal distance to the root-mean-square
sound pressure level (SPL) 160 dB re 1 μPa isopleth for the purposes of estimating Level B harassment (NOAA 2005).
For pulses of duration less than 100 ms, the source level is calculated twice, with two different averaging times, the first equal to the pulse duration and the second equal to 100 ms, the latter chosen to represent a typical integration time for marine mammal hearing (Kastelein et al. 2010). For constructing soundscapes relevant to marine mammal hearing, a report of the Consortium for Ocean Leadership (COL 2018) also recommends this averaging time.
The pulse duration for some sources was unknown. For these sources, pulse duration was calculated from the difference between source level (SL) and energy source level (ESL) using:
𝑇 = 10(𝐸𝑆𝐿−𝑆𝐿)/10. (10)
For a downwards-pointing source with a beamwidth less than 180°, the horizontal impact distance (R) is calculated from the in-beam range using:
𝑅 = 𝑟 ∙ sin (𝛿𝜃
2), (11)
where 𝛿𝜃 is the -3 dB beamwidth.
2. Sources
The following subsections describe the source characteristics of HRG equipment that operates at and below 200 kHz (BOEM 2014). The horizontal impact distance to the Level A (Table 1) and Level B (160 dB re 1 μPa) thresholds were computed for each source by applying the methods from Section 1. We used the following assumptions when calculating impact distances:
• For sources that operate with different beam widths, we used the beam width associated with operational characteristics reported in Crocker and Fratantonio (2016).
• We use the lowest frequency of the source when calculating the absorption coefficient.
2.1. Sparker
Mayflower Wind plans to use a Geomarine Geo-Spark Ultra Hi-Res Sparker System and/or an Applied Acoustics Dura-Spark UHD sparker, both with 400 tips and a maximum source energy of 800 J. Under

JASCO APPLIED SCIENCES Distances to Acoustic Thresholds for High Resolution Geophysical Sources
Version 1.0 7
the direction of NMFS, source specifications in Crocker and Fratantonio (2016) for the SIG ELC 820 Sparker were used as a proxy for this system (750 J energy setting for 5 m source depth). Repetition rate was provided by Mayflower Wind. The frequency range was estimated from the 3 dB bandwidth reported in Crocker and Fratantonio (2016). The frequency range represents the largest bandwidth reported in Table 9 of Crocker and Fratantonio (2016).
Table 2. Sparker source specifications.
Equipment Frequency
(kHz)
Source Level (dB re 1 μPa m)
Peak Source Level
(dB re 1 μPa m)
Energy source level
(dB re 1 μPa2s m2)
Beam Widtha
(°)
Pulse Duration
(ms)
Repetition Rate (Hz)
Geomarine Geo-Spark 400 tip operating at 800 J
0.01 – 1.9 203 213 178 180 3.4 2
Applied Acoustics Dura-Spark UHD 400 tips, up to 800 J
0.01 – 1.9 203 213 178 180 3.4 2
aMulti-tip sparkers are typically activated simultaneously to direct energy downwards and so they should have a downwards-oriented directivity pattern. We have not been able to find published directivity information for sparkers so have conservatively assumed sparker sources are omnidirectional. This assumption will likely lead to a larger estimated horizontal impact distance than would be expected during operation.
Table 3. References for sparker specifications in Table 2.
Equipment Frequency
(kHz)
Source Level
(dB re 1 μPa m)
Peak Source
Level (dB re 1 μPa m)
Energy source level
(dB re 1 μPa2s m2)
Beam Width (°)
Pulse Duration (ms) Repetition Rate (Hz)
Geomarine Geo-Spark 400 tip operating at 800 J
SIG ELC 820 Sparker, 5 m source depth, 750 J setting (see Table 9 in Crocker and Fratantonio (2016))
Assumed omnidirectional
SIG ELC 820 Sparker, 5 m source depth, 750 J setting
(see Table 9 in Crocker and Fratantonio (2016))
Provided by Mayflower
Wind
Applied Acoustics Dura-Spark UHD 400 tips, up to 800 J
SIG ELC 820 Sparker, 5 m source depth, 750 J setting (see Table 9 in Crocker and Fratantonio (2016))
Assumed omnidirectional
SIG ELC 820 Sparker, 5 m source depth, 750 J setting
(see Table 9 in Crocker and Fratantonio (2016))
Provided by Mayflower
Wind

JASCO APPLIED SCIENCES Distances to Acoustic Thresholds for High Resolution Geophysical Sources
Version 1.0 8
2.2. Boomer
Mayflower Wind may use the Applied Acoustics S-Boom seismic source. Source specifications were obtained from Crocker and Fratantonio (2016) for the Applied Acoustics S-Boom with a single plate. The frequency range was estimated from the 3 dB bandwidth reported in Crocker and Fratantonio (2016).
Table 4. Boomer source specifications.
Equipment Frequency
(kHz)
Source Level
(dB re 1 μPa m)
Peak Source Level
(dB re 1 μPa m)
Energy source level
(dB re 1 μPa2s m2)
Beam Widtha
(°)
Pulse Duration
(ms)
Repetition Rate (Hz)
Applied Acoustics S-Boom Triple Plate
0.01 – 5a 205a 211a 172a 61a 0.6 3
Applied Acoustics S-Boom 0.01 – 6a 195a 204a 164a 98a 0.9 3 a Crocker and Fratantonio (2016) Table 6.
Table 5. References for boomer source specifications in Table 4.
Equipment Frequency
(kHz)
Source Level
(dB re 1 μPa m)
Peak Source Level
(dB re 1 μPa m)
Energy source level
(dB re 1 μPa2s m2)
Beam Width (°)
Pulse Duration
(ms)
Repetition Rate (Hz)
Applied Acoustics S-Boom Triple Plate
See Crocker and Fratantonio (2016) Table 6 for 700 J energy setting. Provided by
Mayflower Wind
Applied Acoustics S-Boom
See Crocker and Fratantonio (2016) Table 6 for 300 J energy setting and middle plate.
Provided by Mayflower Wind
2.3. Sub-bottom Profiler
Mayflower Wind plans to use a few sub-bottom profiler sources, including Edgetech 3100 with SB-216 towfish, Innomar SES-2000 Medium-100 parametric, Edgetech DW-106, Teledyne Benthos Chirp III, and Knudson Pinger SBP. Source specifications were obtained from Crocker and Fratantonio (2016) as shown in Table 6 and Table 7. The frequency range was estimated from the 3 dB bandwidth reported in Crocker and Fratantonio (2016).

JASCO APPLIED SCIENCES Distances to Acoustic Thresholds for High Resolution Geophysical Sources
Version 1.0 9
Table 6. Sub-bottom profiler source specifications. Table 7 lists the corresponding references.
Equipment Frequency
(kHz)
Source Level
(dB re 1 μPa m)
Peak Source Level
(dB re 1 μPa m)
Energy source level
(dB re 1 μPa2s m2)
Beam Width
(°)
Out-of-beam Source Level
(dB re 1 μPa m)
Pulse Duration
(ms)
Repetition Rate (Hz)
Edgetech 3100 with SB-216 towfish
2 – 16 179 184 159 51 166 9.1 10
Innomar SES-2000 Medium-100 parametric
85 – 115 241 247 214 2 205 0.07 – 2a 40
Edgetech DW-106 1 – 6 176 183 158 66 168 14.4 10
Teledyne Benthos Chirp III – towfish
2 – 7 199 204 177 82 196 5.8 10
Knudson Pinger SBP
15 180 187 156 71 174 4 2
aThe pulse duration of 2 ms was used for prediction calculations.

JASCO APPLIED SCIENCES Distances to Acoustic Thresholds for High Resolution Geophysical Sources
Version 1.0 10
Table 7. References for sub-bottom profiler source specifications in Table 6.
Equipment Frequency
(kHz) Source Level
(dB re 1 μPa m) Peak Source Level
(dB re 1 μPa m)
Energy source level
(dB re 1 μPa2s m2) Beam Width (°) Pulse Duration (ms)
Repetition Rate (Hz)
Edgetech 3100 with SB-216 towfish
Manufacturer specification
sheet or manual (Sect. A.2)
Considered EdgeTech Chirp 512i as a proxy for
source levels as the Chirp 512i has similar operation settings as the Chirp 216
(Appendix A.2). See Table 18 in Crocker and
Fratantonio (2016) for 100% power and 2-12 kHz
Considered EdgeTech Chirp 512i as a proxy for source levels as the Chirp 512i has similar operation
settings as the Chirp 216 (Appendix A.2).
See Table 18 in Crocker and
Fratantonio (2016) for 100% power and
2-12 kHz
Considered EdgeTech Chirp
512i as a proxy for source levels as the
Chirp 512i has similar operation settings as the
Chirp 216 (Appendix A.2). See Table 18 in Crocker
and Fratantonio (2016) for 100%
power and 2-12 kHz
Considered EdgeTech Chirp 512i as a proxy for
source levels as the Chirp 512i has similar
operation settings as the Chirp 216 (Appendix A.2). Conservative
estimate for the higher-frequency 216 towfish
based on the lower frequency 512i
measurements for 100% power and 2-12 kHz.
See Table 20 in in Crocker and Fratantonio
(2016).
Considered EdgeTech Chirp 512i as a proxy for source levels as the Chirp 512i has similar operation
settings as the Chirp 216 (Appendix A.2).
See Table 18 in Crocker and
Fratantonio (2016) for 100% power and
2-12 kHz
Provided by Mayflower Wind
Innomar SES-2000
Medium-100 parametric
Manufacturer specification
sheet or manual (Sect. A.1)
Specification sheet (Appendix A.1) indicates
peak source level of 247 dB re 1 μPa m (Jens
Wunderlich, Innomar, personal communication,
2019-07-18). Average difference between source
level and peak source level for sub-bottom
profilers measured by Crocker and Fratantonio
(2016) was 6 dB. We therefore estimate source
level is 241 dB re 1 μPa m, 6 dB less than the peak
source level.
Manufacturer specification sheet or
manual (Appendix A.1). Jens Wunderlich (Innomar,
personal communication, 2019-07-18) indicates this is
peak source level.
Calculated from pulse duration and source level (see Section 1, step 2)
Manufacturer specification sheet or
manual (Appendix A.1)
Manufacturer specification sheet or
manual (Appendix A.1).
Manufacturer specification
sheet or manual (Appendix A.1).

JASCO APPLIED SCIENCES Distances to Acoustic Thresholds for High Resolution Geophysical Sources
Version 1.0 11
Equipment Frequency
(kHz) Source Level
(dB re 1 μPa m) Peak Source Level
(dB re 1 μPa m)
Energy source level
(dB re 1 μPa2s m2) Beam Width (°) Pulse Duration (ms)
Repetition Rate (Hz)
Edgetech DW-106
Manufacturer specification
sheet or manual
Considered EdgeTech Chirp 512i as a proxy for
source levels as the Chirp 512i has similar operation settings as the Chirp 106
(Appendix A.2). See Table 18 in Crocker and
Fratantonio (2016) for 100% power and 1-6 kHz
Considered EdgeTech Chirp 512i as a proxy for source levels as the Chirp 512i has similar operation
settings as the Chirp 106 (Appendix A.2).
See Table 18 in Crocker and
Fratantonio (2016) for 100% power and
1-6 kHz
Considered EdgeTech Chirp
512i as a proxy for source levels as the
Chirp 512i has similar operation settings as the
Chirp 106 (Appendix A.2). See Table 18 in Crocker
and Fratantonio (2016) for 100%
power and 1-6 kHz
Considered EdgeTech Chirp 512i as a proxy for
source levels as the Chirp 512i has similar
operation settings as the Chirp 106 (Appendix A.2). See Table 20 in
Crocker and Fratantonio (2016) for 100% power
and 1-6 kHz
Considered EdgeTech Chirp 512i as a proxy for source levels as the Chirp 512i has similar operation
settings as the Chirp 106 (Appendix A.2).
See Table 18 in Crocker and
Fratantonio (2016) for 100% power and
1-6 kHz
Provided by Mayflower Wind
Teledyne Benthos
Chirp III – towfish*
Manufacturer specification
sheet or manual
Considered Knudsen 3202 Echosounder as a proxy for source levels as the
3202 has similar operation settings as the Teledyne
Benthos Chirp III. (Appendix A.2). See Table
21 in Crocker and Fratantonio (2016) for
power setting 1 with 8 ms pulse.
Considered Knudsen 3202 Echosounder as
a proxy for source levels as the 3202 has
similar operation settings as the
Teledyne Benthos Chirp III. (Appendix
A.2). See Table 21 in Crocker and
Fratantonio (2016) for power setting 1 with
8 ms pulse.
Considered Knudsen 3202
Echosounder as a proxy for source
levels as the 3202 has similar
operation settings as the Teledyne
Benthos Chirp III. (Appendix A.2). See Table 21 in Crocker
and Fratantonio (2016) for power
setting 1 with 8 ms pulse.
Considered Knudsen 3202 Echosounder as a proxy for source levels as the 3202 has similar
operation settings as the Teledyne Benthos Chirp III. (Appendix A.2). See Table 23 in Crocker and Fratantonio (2016) for power setting 1 with
8 ms pulse.
Considered Knudsen 3202 Echosounder as
a proxy for source levels as the 3202 has
similar operation settings as the
Teledyne Benthos Chirp III. (Appendix
A.2). See Table 21 in Crocker and
Fratantonio (2016) for power setting 1 with
8 ms pulse.
Provided by Mayflower Wind

JASCO APPLIED SCIENCES Distances to Acoustic Thresholds for High Resolution Geophysical Sources
Version 1.0 12
Equipment Frequency
(kHz) Source Level
(dB re 1 μPa m) Peak Source Level
(dB re 1 μPa m)
Energy source level
(dB re 1 μPa2s m2) Beam Width (°) Pulse Duration (ms)
Repetition Rate (Hz)
Knudson Pinger SBP
Manufacturer specification
sheet or manual (Appendix A.3)
Considered EdgeTech Chirp 424 as a proxy for
source levels as the Chirp 424 has similar operation settings as the Knudsen Pinger SBP (Appendix A.3). See Table 16 in
Crocker and Fratantonio (2016) for 100% power.
Considered EdgeTech Chirp 424 as a proxy for source levels as the Chirp 424 has similar operation settings as the
Knudsen Pinger SBP (Appendix A.3). See Table 16 in Crocker
and Fratantonio (2016) for 100% power.
Considered EdgeTech Chirp
424 as a proxy for source levels as the
Chirp 424 has similar operation settings as the
Knudsen Pinger SBP (Appendix
A.3). See Table 16 in Crocker and
Fratantonio (2016) for 100% power.
Considered EdgeTech Chirp 424 as a proxy for
source levels as the Chirp 424 has similar
operation settings as the Knudsen Pinger SBP
(Appendix A.3). Conservative estimate
for Knudsen Pinger based on the lower
frequency 424 measurements in
Crocker and Fratantonio (2016), Table 17.
Considered EdgeTech Chirp 424 as a proxy for source levels as the Chirp 424 has similar operation settings as the
Knudsen Pinger SBP (Appendix A.3). See Table 16 in Crocker
and Fratantonio (2016) for 100% power
Provided by Mayflower Wind as an operating
parameter.
* Teledyne Benthos Chirp III – towfish was selected by Mayflower. The source level for towfish is lower than hull mounted variant. In this study, the surrogate for towfish was using lower power setting (power setting = 1) for towfish relative to hull mounted (power setting = 4).

JASCO APPLIED SCIENCES Distances to Acoustic Thresholds for High Resolution Geophysical Sources
Version 1.0 13
3. Distances
The following tables list the geophysical survey sources and the horizontal impact distances to the Level A and Level B thresholds that were obtained by applying the methods from Section 1 with the source parameters in Section 2. The Innomar sub-bottom profiler was assessed based on the intermittent SEL thresholds because of the relatively high repetition rate (40 Hz); all other sources were assessed with the impulsive SEL and peak thresholds.
3.1. Sparker
Table 8 lists the sparkers that are planned for Mayflower Wind HRG surveys, their associated Level A and Level B horizontal impact distances.
Table 8. Level A and Level B horizontal impact distances for sparkers.
Equipment
Level A horizontal impact distance (m) to PK threshold
Level A horizontal impact distance (m) to SEL threshold
Level B Horizontal
Impact Distance
(m) LFC MFC HFC PPW OPW LFC MFC HFC PPW OPW
Geomarine Geo-Spark 400 tip operating at 800 J
— — 4 — — 1 <1 <1 <1 <1 141
Applied Acoustics Dura-Spark UHD 400 tips, up to 800 J
— — 4 — — 1 <1 <1 <1 <1 141
— Source level is less than threshold level.
3.2. Boomer
Table 9 lists the boomers that are planned for Mayflower Wind HRG surveys, their associated Level A and Level B horizontal impact distances.
Table 9. Level A and Level B horizontal impact distances for boomers.
Equipment
Level A horizontal impact distance (m) to PK threshold
Level A horizontal impact distance (m) to SEL threshold
Level B Horizontal
Impact Distance
(m) LFC MFC HFC PPW OPW LFC MFC HFC PPW OPW
Applied Acoustics S-Boom Triple Plate
— — 1 — — <1 <1 <1 <1 <1 90
Applied Acoustics S-Boom
— — 1 — — <1 <1 <1 <1 <1 56
— Source level is less than threshold level.

JASCO APPLIED SCIENCES Distances to Acoustic Thresholds for High Resolution Geophysical Sources
Version 1.0 14
3.3. Sub-bottom Profiler
Table 10 lists the sub-bottom profilers that are planned for Mayflower Wind HRG surveys, their associated Level A and Level B horizontal impact distances.
Table 10. Level A and Level B horizontal impact distances for sub-bottom profilers.
Equipment
Level A horizontal impact distance (m) to PK threshold
Level A horizontal impact distance (m) to SEL threshold
Level B Horizontal
Impact Distance
(m) LFC MFC HFC PPW OPW LFC MFC HFC PPW OPW
Edgetech 3100 with SB-216 towfish
— — — — — <1 <1 2 <1 <1 4
Innomar SES-2000 Medium-100 parametric
NA NA NA NA NA <1 <1 58 <1 <1 116
Edgetech DW-106 — — — — — <1 <1 <1 <1 <1 3
Teledyne Benthos Chirp III – towfish
— — — — — 2 <1 57 1 <1 66
Knudson Pinger SBP — — — — — <1 <1 <1 <1 <1 6
— Source level is less than threshold level. NA - Distances to the PK thresholds are not shown for the Innomar because it was assessed based on the intermittent source criteria which does not include PK thresholds (Table 1).
4. Summary
The table below lists the equipment that was associated with the largest horizontal impact distance for each equipment type.
Table 11. Summary of Level A and Level B horizontal impact distances.
Equipment System
Level A horizontal impact distance (m)
Level B Horizontal
Impact Distance
(m) LFC MFC HFC PPW OPW
Sparker Geomarine Geo-Spark 400 tip operating at 800 J 1 <1 4 <1 <1 141
Boomer Applied Acoustics S-Boom Triple Plate <1 <1 1 <1 <1 90
Sub-bottom Profiler Innomar SES-2000 Medium-100 parametric <1 <1 58 <1 <1 116
The methods used here are approximate and likely conservative. A rigorous propagation loss model coupled with a full beam pattern and spectral source model would result in more accurate results. Assessing the accuracy of either method requires sound field measurements.

JASCO APPLIED SCIENCES Distances to Acoustic Thresholds for High Resolution Geophysical Sources
Version 1.0 15
Literature Cited
[BOEM] Bureau of Ocean Energy Management. 2014. Atlantic OCS Proposed Geological and Geophysical Activities Mid-Atlantic and South Atlantic Planning Area Final Programmatic Environmental Impact Statement (webpage). http://www.boem.gov/BOEM-2014-001-v1/.
[COL] Consortium for Ocean Leadership. 2018. Report of the Workshop on Recommendations Related to Passive Ocean Acoustic Data Standards. Washington, D.C. 11 p.
[NMFS] National Marine Fisheries Service (US) and [NOAA] National Oceanic and Atmospheric Administration (US). 2005. Endangered fish and wildlife: Notice of intent to prepare an environmental impact statement. Federal Register 70(7): 1871-1875. http://www.nmfs.noaa.gov/pr/pdfs/fr/fr70-1871.pdf.
[NMFS] National Marine Fisheries Service (US). 2018. 2018 Revision to: Technical Guidance for Assessing the Effects of Anthropogenic Sound on Marine Mammal Hearing (Version 2.0): Underwater Thresholds for Onset of Permanent and Temporary Threshold Shifts. US Department of Commerce, NOAA. NOAA Technical Memorandum NMFS-OPR-59. 167 p. https://www.fisheries.noaa.gov/webdam/download/75962998.
[NOAA] National Oceanic and Atmospheric Administration (US). 2019. Interim Recommendation for Sound Source Level and Propagation Analysis for High Resolution Geophysical Sources. Revision 3. 19 Sep 2019.
Ainslie, M.A. 2010. Principles of Sonar Performance Modeling. Praxis Books. Springer, Berlin.
https://doi.org/10.1007/978-3-540-87662-5.
ANSI/ASA S12.7-1986. R1986. Methods of Measurement for Impulse Noise 3. American National Standards Institute and Acoustical Society of America, NY, USA.
Crocker, S.E. and F.D. Fratantonio. 2016. Characteristics of Sounds Emitted During High-Resolution Marine Geophysical Surveys., NUWC-NPT Technical Report 12,203. 266 p.
Guan, S. 2020. INTERIM RECOMMENDATION FOR SOUND SOURCE LEVEL AND PROPAGATION ANALYSIS FOR HIGH RESOLUTION GEOPHYSICAL (HRG) SOURCES. Revision 4. 2 April 2020.
https://www.researchgate.net/publication/341822965.
Kastelein, R.A., L. Hoek, C.A.F.d. Jong, and P.J. Wensveen. 2010. The effect of signal duration on the underwater detection thresholds of a harbor porpoise (Phocoena phocoena) for single frequency-modulated tonal signals between 0.25 and 160 kHz. The Journal of the Acoustical Society of America 128(5): 3211-3222. https://asa.scitation.org/doi/abs/10.1121/1.3493435.
Southall, B.L., A.E. Bowles, W.T. Ellison, J.J. Finneran, R.L. Gentry, C.R. Greene, Jr., D. Kastak, D.R. Ketten, J.H. Miller, et al. 2007. Marine Mammal Noise Exposure Criteria: Initial Scientific Recommendations. Aquatic Mammals 33(4): 411-521.

JASCO APPLIED SCIENCES Distances to Acoustic Thresholds for High Resolution Geophysical Sources
Version 1.0 A-1
Appendix A. Equipment Specification Reference Sheets
A.1. Innomar Sub-bottom Profiler

JASCO APPLIED SCIENCES Distances to Acoustic Thresholds for High Resolution Geophysical Sources
Version 1.0 A-2
A.2. Edgetech Sub-bottom Profilers

JASCO APPLIED SCIENCES Distances to Acoustic Thresholds for High Resolution Geophysical Sources
Version 1.0 A-3

JASCO APPLIED SCIENCES Distances to Acoustic Thresholds for High Resolution Geophysical Sources
Version 1.0 A-4

JASCO APPLIED SCIENCES Distances to Acoustic Thresholds for High Resolution Geophysical Sources
Version 1.0 A-5
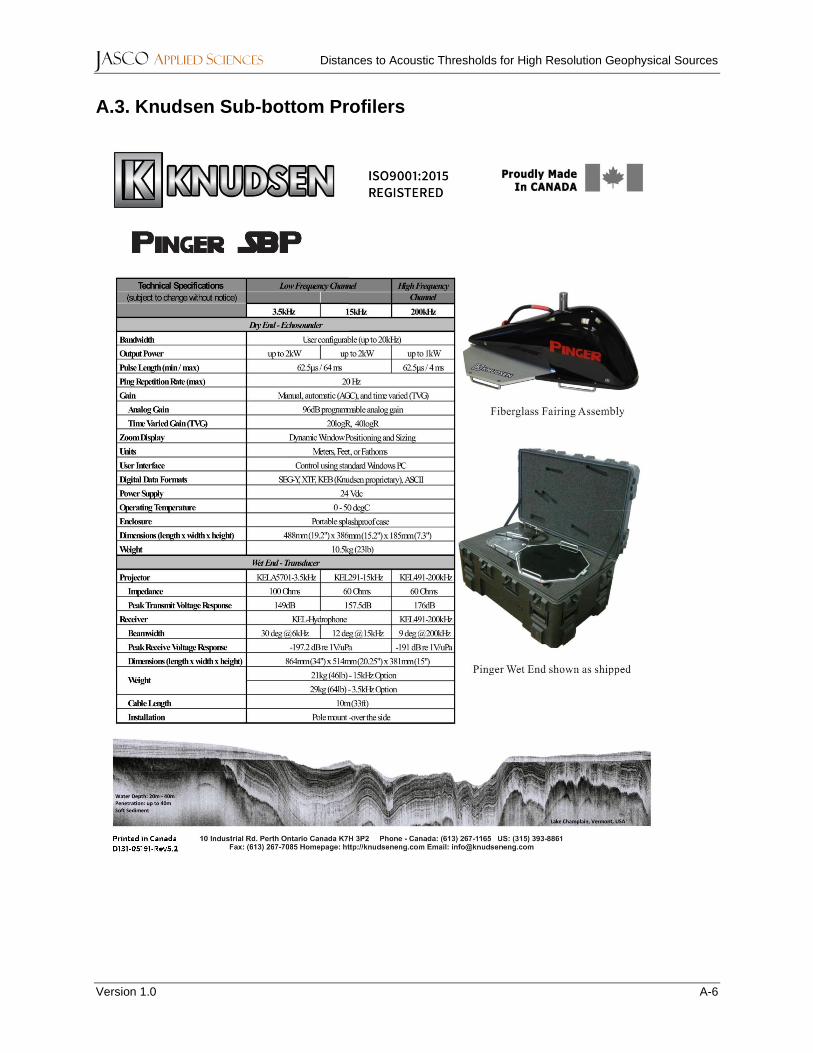
JASCO APPLIED SCIENCES Distances to Acoustic Thresholds for High Resolution Geophysical Sources
Version 1.0 A-6
A.3. Knudsen Sub-bottom Profilers

JASCO APPLIED SCIENCES Distances to Acoustic Thresholds for High Resolution Geophysical Sources
Version 1.0 A-7
A.4. Teledyne Sub-bottom Profiler

JASCO APPLIED SCIENCES Distances to Acoustic Thresholds for High Resolution Geophysical Sources
Version 1.0 A-8