Embed Size (px)
Citation preview
Project #07275 Hayward High-Speed Fiber Optic Network Installation Project Design Services RFP
Page 1 of 9
REQUEST FOR PROPOSAL (RFP)
HAYWARD HIGH-SPEED FIBER OPTIC NETWORK INSTALLATION PROJECT
DESIGN SERVICES
The City of Hayward (City) is seeking proposals from qualified consultants for final design services
for the Hayward High-Speed Fiber Optic Network Installation Project in the City of Hayward.
Award resulting from this RFP will be a fixed fee contract.
SECTION I – INTRODUCTION
A. PROJECT DESCRIPTION
The City’s Industrial Corridor is home to more than 5,100 businesses that employ nearly 47,500
workers. This corridor is expected to grow as an economic and employment center and evolve to
achieve a healthy balance of traditional manufacturing and information- and technology-based uses.
Given the importance of the Industrial Corridor, the City has made it a priority to enable greater
fiber-based connectivity for its numerous businesses located in the corridor. To achieve this, the
City intends to deploy a municipally owned FTTP network to serve the businesses within the
corridor.
This project is federally funded from a grant by the U.S. Department of Commerce’s Economic
Development Administration (EDA) and proposes to install eleven (11) miles of fiber optic conduit
and cabling with supporting pull boxes to expand the City of Hayward’s existing fiber optic
network. See Attachment A. EDA’s mission is to lead the Federal economic development agenda
by promoting innovation and competitiveness, preparing American regions for growth and success
in the worldwide economy. EDA investments are results driven, embracing the principles of
technological innovation, entrepreneurship and regional development.
The City has looked at various public–private partnership models for the network but has
determined that a dark fiber model best achieves its goals. With the dark fiber model, the City
directly deploys the FTTP network and is responsible for all design, construction, and maintenance
of the fiber, but would not manage network electronics, customer premises equipment (CPEs), or
any customer contracts. Instead, the City would provide one or more private partners with a license
or lease to use the network; the partner(s) “lights” the fiber, and offer services to end users.
The City will work with the consultant to identify City owned properties within the corridor for
placement of a network hub facility and a connection from the FTTP network’s hub location to an
Internet POP location at 21350 Cabot Boulevard. The connection to the POP location will provide
the means for the City’s private partners to access the network and provide services to the Industrial
Corridor businesses.
The scope shall be for final design plans, specifications and estimates (PS&E). This project will
request CEQA exemption 15303(d).
Project #07275 Hayward High-Speed Fiber Optic Network Installation Project Design Services RFP
Page 2 of 9
B. INFORMATION TO BE PROVIDED TO CONSULTANT
The following documents and material are available for use by the design consultant:
1. City of Hayward Fiber Optic Master Plan – Prepared February 2017
2. City of Hayward High-Speed Fiber Optic Network Installation Project Map
3. Street base maps in AUTOCAD 2010 format.
4. City utilities location maps, showing known existing utilities for water, storm drain and
sewer.
5. Access to existing aerial photos of the City.
SECTION II - SCOPE OF SERVICES
The scope of work shall include undertaking all necessary engineering data collection, geometric
survey, analysis and design covering the issues identified below. The consultant is expected to
expand on the scope in this proposal, as necessary, by incorporating their expertise and proposing a
method or approach that will help the City achieve the objectives of this project. The Consultant
shall be familiar with and be responsible for providing and performing the tasks and activities listed
below. The Consultant is encouraged to identify additional tasks, as necessary.
C. DESIGN ISSUES
The design shall use English units and be prepared with AutoCAD 2010 format or later release. The
design shall be sufficiently advanced to address all design issues, and identify all potential
environmental issues. Although fee title right of way acquisition is not expected to be needed for this
project, there will be a need for temporary construction easements; and the design may require the
need for public utility easements (PUEs). Some of the basic design features that should be addressed
shall include, but not limited to, the following:
1. Coordination and approval from Caltrans, Union Pacific Railroad Company, National Historic Preservation and Tribal contacts, US Fish and Wildlife, State Water Resources Control Board, etc.
2. POP location connection design at 21350 Cabot Boulevard 3. Fiber path diversity to the POP location in order to maintain continuous service during
disruptions 4. Network Hub Facility location and design 5. Network capable of supporting a range of standards-based FTTP access technologies 6. Network should be expandable in a manner as effectively and efficiently as possible to
increase data capacity, expand service area and to accommodate advances in technology over the life of the network (at least 20 years)
7. Network should allow for leasing dark fiber to multiple service providers (open access). 8. Design shall provide controlled physical access to all equipment and facilities. 9. Design does not include network electronics but must take into account current and emerging
FTTP network technologies
Project #07275 Hayward High-Speed Fiber Optic Network Installation Project Design Services RFP
Page 3 of 9
10. Construction Phasing 11. Fiber optic cabling strand size(s) that anticipates future deployment 12. Fiber optic cabling mode type(s) 13. Fiber optic cabling protection 14. Fiber optic cabling splicing compatibility 15. Fiber optic cabling that meets applicable physical layer specifications defined by the ITU
G.984 standards or propose alternative standards and reasoning 16. Minimum number of conduits 17. Minimum conduit diameter 18. Conduit material type 19. Conduit flexible innerducts 20. Pull box spacing and preferred location (600 feet max. spacing preferred) 21. Pull box sizing, material and protection 22. Fiber termination points 23. Construction QA/QC program in specifications 24. Primarily underground construction with directional boring as main method 25. Minimal use of micro-trenching and rock sawing, which is not preferred 26. Design at UPRR crossings per UPRR standards (See Attachment A for locations) 27. Design at Caltrans crossings per Caltrans standards (See Attachment A for locations) 28. Required permits, including Caltrans /UPRR/ RWQCB Permits
D. CONSTRUCTION & BID ISSUES
The design consultant shall include in the scope of services the coordination of the fiber optic plan
with Caltrans, UPRR, PG&E, AT&T, Comcast and other utility agencies for potential underground
conflicts and alternative design solutions. Consultant shall also take into consideration the length of
time that will be taken by these utility agencies during coordination. The design consultant shall
undertake actual field investigations of the feasibility of all proposed underground conduit crossings
and connections to existing network and come up with realistic designs for underground utilities at
the design stage rather than making unverified assumptions and placing the responsibility for
verification on the contractor. Consultant shall develop a traffic management plan for the project
during project construction, which shall mitigate safety and minimize public inconvenience.
Analysis of construction issues shall include, but not be limited to, the following:
1. Preliminary design and cost estimate for project construction, including modifications to the
proposed fiber optic network route. See Attachment A for project proposed network route.
2. Traffic control
3. Noise abatement.
4. Construction schedule.
5. Public notification process. 6. Notification to all relevant utility agencies, including PG&E, AT&T, Comcast, Oro Lomo
Sanitary Sewer District, Alameda County Flood Control District (ACFCD), EBMUD,
Verizon, Level 3, MCI, AboveNet and potentially other utility companies not listed with
infrastructure in the roadway to work to determine potential utility conflicts.
7. Coordination of proposed City of Hayward public works projects in the project area (note
the City’s annual pavement rehabilitation project schedules need to be coordinated with
possible moratorium requirements)
8. Construction permit documents including design plats, legal description, sketches, reports,
etc., required for approval from crossing Caltrans and Union Pacific Railroad Company
Project #07275 Hayward High-Speed Fiber Optic Network Installation Project Design Services RFP
Page 4 of 9
property. See Attachment A with location and number of crossings.
9. Notification and approvals from the Office of Historic Preservation, U.S. Fish and Wildlife
Service, State Water Resources Control Board and any other required public agencies
10. Construction specifications shall include a WBE goal of 6.9% and DBE goal of 25.6% (for
Alameda County) requirement set by federal standards, along with reporting and monitoring
requirements. E. ENVIRONMENTAL ISSUES
This project will request CEQA exemption 15303(d).
F. TYPICAL DESIGN TASKS
The consultant shall develop tasks that shall comprehensively cover all issues identified above, and
necessary for meeting the objectives of this RFP. The tasks listed below are intended as typical tasks
that are expected to be included in the proposal. However, the tasks listed are not intended as the
complete set of tasks that are necessary for completing the scope of work. The consultant may add to
or modify the listed tasks, as deemed necessary for meeting the objectives for this RFP.
Task 1.00 Reconnaissance
1.01 Evaluation Meeting: Review scope, schedule and construction budget with City staff. Define
project goals.
1.02 Review existing proposed fiber network route and update, as necessary.
1.03 Document Review: Review City/Caltrans documents. Obtain and review other information that
may pertain to the project. Identify available and required City/Caltrans documents including
latest as-built maps and or tests results of existing fiber optic network.
1.04 Field Review: Conduct site reconnaissance. Visually review existing connection points, fiber
optic pull boxes, cabling and conduits, road geometry, existing utilities and other existing
elements. Crossing Caltrans or Union Pacific Railroad property, any ACFCD box culverts or
other shallow facilities that may conflict with the proposed fiber conduit installation shall be
evaluated in detail for the most efficient crossing design.
1.05 Utility Evaluation: Electrical, gas, communication, sanitary, storm and water.
1.06 Identify and obtain necessary data from City, Caltrans, etc. as necessary and applicable
Task 2.00 Preliminary Design 2.01 Meet with City staff: Review all relevant documents, including existing studies, and existing
fiber optic network locations in a work session with City staff to develop consensus for
proceeding.
2.02 Prepare preliminary design and meet with staff. Revise preliminary design based upon direction
from staff.
Task 3.00 Design Development 3.01 Considering the comments received from City staff, continue to refine the design and
incorporate comments.
3.02 Sufficient survey of existing field conditions that may impact the design/construction.
3.03 Provide a cost estimate and bill of materials (BOM) of the design at this stage and perform a
value engineering analysis.
3.04 Make the necessary design modifications.
Project #07275 Hayward High-Speed Fiber Optic Network Installation Project Design Services RFP
Page 5 of 9
3.05 Final Design
Task 4.00 Construction Documentation
4.01 Prepare final construction documents.
4.02 Submittals: Submit above items to City for review and return comments at 35%, 65%, 95% and
100% PS&E. Assume a maximum of four submittals before final submittal.
4.03 Response to Submittals: Complete responses to review set and return to City for public
bidding.
4.04 Update cost estimate and bill of materials and make changes if necessary to stay within the
budget.
4.05 Provide request for information support during bidding of construction documents and
construction of project. Task 5.00 Meetings and Reporting
Up to four public meetings and two City Council meetings shall be assumed. The consultant
shall prepare the meeting materials, including exhibits, for public meetings. It is anticipated
that cross sections or other visual representations of the various roadway crossing segments
and typical location of fiber optic conduits and accessories will be required. All exhibits
should be prepared in a manner such that “lay people” will understand what is being
proposed. All materials for public meetings, especially any materials for public presentations
such as PowerPoint, exhibits and cross sections, will be reviewed and approved by City staff
prior to their use in the public meetings.
Monthly project progress meetings and reporting, including reporting and reviews at the
various stages of development, including field visits during construction to monitor general
work deficiencies shall be considered as part of the scope of work.
Task 6.00 Minimum Final Deliverables
A minimum of six (6) hard copies each of all preliminary work, and the following documents shall be submitted to staff during the review stage of the project. For final documents, one copy each shall be provided in electronic and hard copy formats for all project reports, studies, specifications, and drawings. Electronic copies for text documents and reports shall be provided in Microsoft Office 2010 or later version. Electronic copies for all drawings shall be in AutoCAD 2010 or later version. At a minimum, the following documents are anticipated with the project.
1 Public Agency approval documentation (i.e. Caltrans, Union Pacific Railroad (UPRR), Office of Historic Preservation, US Fish and Wildlife, State Water Resources Control Board, etc);
2 Project drawings and specifications; 3 Project cost estimate and budget; 4 Project schedules
Project #07275 Hayward High-Speed Fiber Optic Network Installation Project Design Services RFP
Page 6 of 9
SECTION III - PROPOSAL REQUIREMENTS
A. PROPOSAL CONTENT
Proposals shall be brief but complete. Consultants are advised to avoid submitting superfluous
materials that do not address the specific requirements of the RFP or are covered elsewhere in the
consultant’s proposal. Proposals submitted shall cover the following items. Additional material may
be included in appendices to the proposal. However, elaborate brochures or other presentation
material not specifically related to the scope of work are not desired.
The Proposal should be organized in the following sequence:
(1) Executive Summary Describe the Consultant team, the commitment of the team and its key staff to the project,
the team’s commitment to Quality Assurance/Quality Control (QA/QC) and, as it relates to
design and deployment of an underground fiber optic network, the team’s special or unique
qualifications or experience in project definition, project delivery, project budget monitoring
and/or adherence to project schedule.
(2) Project Understanding
Demonstrate the Consultant team’s understanding of the existing project conditions and
issues. Note any design or project development issues that were not either addressed with
this proposal or the Consultant team believes would impact the project schedule or project
cost. The Consultant team should provide techniques and specific cost saving measures to
reduce the construction cost, without compromising the integrity of the project purpose and
need.
(3) Details of Proposed Approach Provide a detailed explanation of the approach for completing the work, addressing each of
the tasks above and discussing the deliverables. Also, discuss the Consultant team’s Quality
Assurance/Quality Control program for this project.
(4) Proposed Staffing Plan Designate the Principal in Charge and Project Manager throughout the duration of the
contract. The Project Manager (the key contact) should be readily available for meetings, etc.
The proposal should describe the individuals and their roles on the team. The proposal
should include a brief resume describing similar projects on which they have been involved
and their role on that project, their availability over the duration of this project, and a
description of the benefits the person brings to the team. Indicate recent, relevant experience
and references on similar projects where a similar role was performed. Full resumes may be
included in an appendix. Proposals shall clearly establish principal team member firms and
subconsultants. An organization chart shall be included. Any substitution of key staff
during the project will require approval from the City.
It is the policy of the City of Hayward that Disadvantaged Business Enterprises (DBE) and
Women Owned Business Enterprises (WBE) should have a full and equitable opportunity to
participate in the performance of professional service contracts. Furthermore, since this
project is federally funded, the consultant shall make a good faith effort to obtain a WBE
Project #07275 Hayward High-Speed Fiber Optic Network Installation Project Design Services RFP
Page 7 of 9
goal of 6.9% and DBE goal of 25.6% (for Alameda County). WBE and DBE Commitment
Form and Good Faith Effort Form (if WBE or DBE goal not met) shall be submitted with the
proposal and is a requirement for award of contract to the selected consultant. See
Attachment D.
(5) Estimated Hours and Schedule
The Consultant must provide the hourly rate for each participating staff person and must
estimate the hours for all activities and tasks discussed above, with cost summaries by task
and the project overall. The hours should be further divided by the Prime Consultant’s staff
time and the staff time of sub-consultants. The Consultant may include additional tasks if
relevant. A total proposed “Fixed Fee” shall be provided. Compensation shall NOT be
based on the use of the cost-plus-a-percentage-of-cost or percentage of construction cost
form of compensation as required by the project grant.
The Consultant shall provide 100% Final PS&E by Friday July 27, 2018 and staff
accordingly to reach this goal. In addition, the required Caltrans and UPRR permits shall be
obtained before or by the start of construction scheduled for Monday November 5, 2018.
Estimated milestone and deliverable dates shall be provided. The Consultant shall confirm
the above required schedule with the City prior to entering into a contract agreement for this
RFP. The above dates are subject to change, at the sole discretion of the City but shall
discussed with the Consultant.
(6) Similar Experience of the Consultant Team Provide descriptions of a minimum of three (3) projects similar in size and complexity
completed in the last seven (7) years including: the client’s name and address; the name of
the client contact person to be used as a reference including a current telephone number; the
estimated value of the project; the number of amendments to project and the percentage
increase over the base contract; and a statement on the Consultant’s team adherence to the
budget and schedule.
(7) Comments on the City’s Sample Professional Services Agreement A sample City Professional Services Contract is shown in Attachment
B. Please provide a statement of your firm’s acceptance of the City’s insurance and
indemnification requirements, or any reservation that your firm has with the contract terms.
If the contract pricing exceeds $100,000, as required by the grant funding agency, the final
contract between the City and Consultant will include the following language: “The City of
Hayward, Economic Development Agency, the Comptroller General of the United States,
the Inspector General of the Department of Commerce, or any of their duly authorized
representatives, shall have access to any documents, books, papers, and records of the
Consultant (which are directly pertinent to the grant program for this project) for the purpose
of making an audit, examination, excerpts, and transcriptions. The Consultant shall maintain
all required records for at least three years after the City of Hayward makes final payment
and all pending matters are closed.” Also, as required by the grant funding agency, a
specific timetable agreed upon by both the City of Hayward and Consultant shall be included
in the agreement for 1). Completing of preliminary design and cost estimate; 2). Completing
final plans, specifications and cost estimate; 3). Securing required State and local approvals;
and 4). Completing proposed contract documents sufficient for soliciting construction bids.
If no objections are expressed then City staff will conclude that the terms of the agreement
Project #07275 Hayward High-Speed Fiber Optic Network Installation Project Design Services RFP
Page 8 of 9
are acceptable to the proposer.
B. SUBMITTAL PROCEDURES
The Consultants are encouraged to promptly notify the City of Hayward in writing, of any apparent
major inconsistencies, problems or ambiguities in the Scope of Services or this RFP. The request for
information deadline is January 5, 2018 by 4:00 p.m. Any questions and requests for
clarification/additional information shall be submitted to Alex Tat by e-mailing alex.tat@hayward-
ca.gov. If deemed necessary, the City will provide copies of the questions and answers to all
prospective consultants.
Submit three (3) sealed copies of the proposal to our office by 4:00 p.m. by January 19, 2018
to be considered for this project. Proposals shall be clearly marked: HAYWARD HIGH-
SPEED FIBER OPTIC NETWORK INSTALLATION PROJECT PROPOSAL, Project No.
07275. Responses to the RFP received after that time will be returned unopened. Postmarked
or emailed copies are not acceptable. Responses to the RFP should be submitted to:
City of Hayward, Engineering & Transportation Division
777 “B” Street – Second Floor
Hayward, CA 94541
Attention: Alex Tat
Proposals shall be signed by an officer authorized to execute a contract with the City and shall
contain a statement to the effect that the proposal constitutes a firm offer for at least six months
from the last day for receipt of proposals set forth in this RFP.
SECTION IV – ESTIMATED SCHEDULE
The following schedule represents the City's best estimate of the events to be followed. The City
reserves the right to adjust this schedule as it deems necessary with notification to Consultants:
Release RFP December 15, 2017
RFI Deadline January 5, 2018
RFP Deadline January 19, 2018
RFP City Evaluation Completed February 2, 2018
RFP Contract Agreement Executed March 30, 2018
100% PSE Due July 27, 2018
Construction Award October 23, 2018
Approved Caltrans, UPRR & Agency Permits Due November 5, 2018
SECTION V – EVALUATION OF PROPOSALS
Respondents should address each of the evaluation criteria, contain complete technical submittals,
references and data to verify qualifications and experience. Proposals without sufficient submittal
data to provide a complete evaluation shall be considered non-responsive.
Project #07275 Hayward High-Speed Fiber Optic Network Installation Project Design Services RFP
Page 9 of 9
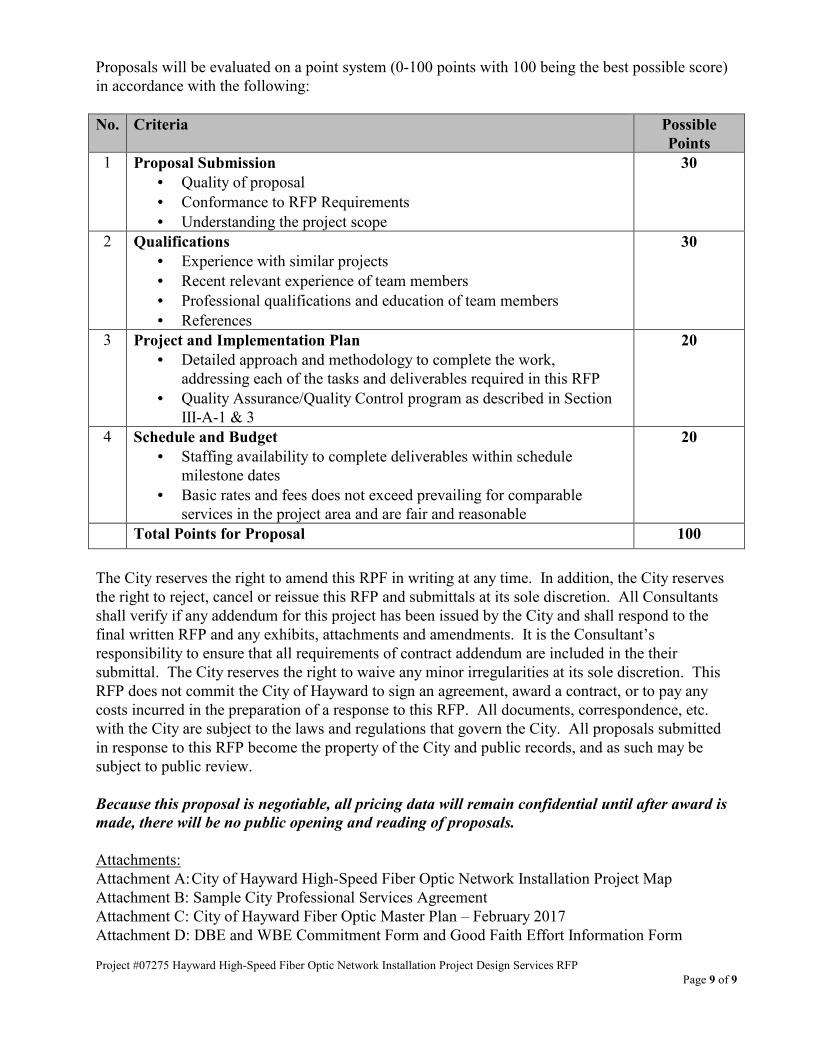
Proposals will be evaluated on a point system (0-100 points with 100 being the best possible score)
in accordance with the following:
No. Criteria Possible
Points
1 Proposal Submission
• Quality of proposal
• Conformance to RFP Requirements
• Understanding the project scope
30
2 Qualifications
• Experience with similar projects
• Recent relevant experience of team members
• Professional qualifications and education of team members
• References
30
3 Project and Implementation Plan
• Detailed approach and methodology to complete the work,
addressing each of the tasks and deliverables required in this RFP
• Quality Assurance/Quality Control program as described in Section
III-A-1 & 3
20
4 Schedule and Budget
• Staffing availability to complete deliverables within schedule
milestone dates
• Basic rates and fees does not exceed prevailing for comparable
services in the project area and are fair and reasonable
20
Total Points for Proposal 100
The City reserves the right to amend this RPF in writing at any time. In addition, the City reserves
the right to reject, cancel or reissue this RFP and submittals at its sole discretion. All Consultants
shall verify if any addendum for this project has been issued by the City and shall respond to the
final written RFP and any exhibits, attachments and amendments. It is the Consultant’s
responsibility to ensure that all requirements of contract addendum are included in the their
submittal. The City reserves the right to waive any minor irregularities at its sole discretion. This
RFP does not commit the City of Hayward to sign an agreement, award a contract, or to pay any
costs incurred in the preparation of a response to this RFP. All documents, correspondence, etc.
with the City are subject to the laws and regulations that govern the City. All proposals submitted
in response to this RFP become the property of the City and public records, and as such may be
subject to public review.
Because this proposal is negotiable, all pricing data will remain confidential until after award is
made, there will be no public opening and reading of proposals.
Attachments:
Attachment A: City of Hayward High-Speed Fiber Optic Network Installation Project Map
Attachment B: Sample City Professional Services Agreement
Attachment C: City of Hayward Fiber Optic Master Plan – February 2017
Attachment D: DBE and WBE Commitment Form and Good Faith Effort Information Form
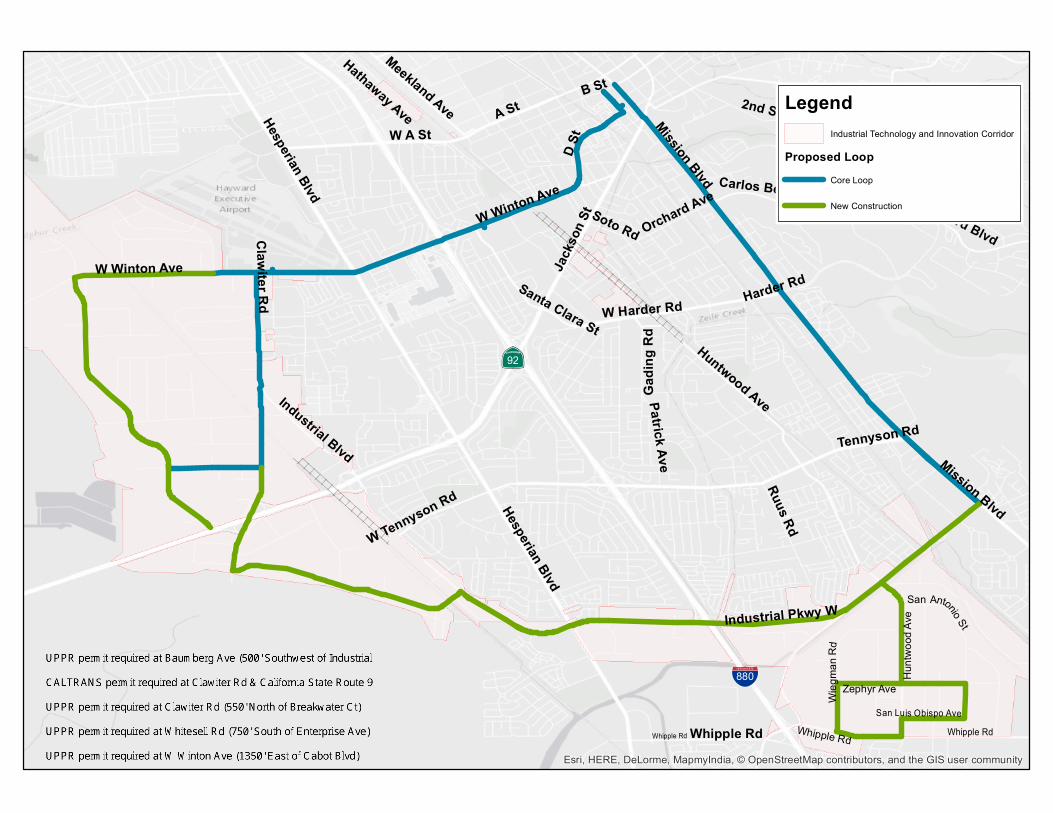
·|}þ92
%&'(880
2nd StA St
Ruus Rd
Tennyson Rd
Hesperian Blvd
D St
Hathaway Ave
Industrial Blvd
Patrick Ave
Orchard Ave Hayward BlvdClawiter Rd
W Winton Ave
Gadin
g Rd
Carlos Bee BlvdSoto Rd
W A St
B St
Harder Rd
Meekland Ave
Huntwood Ave
Campus Dr
W Tennyson Rd
Mission Blvd
W Harder Rd
Jack
son S
tW Winton Ave
Santa Clara St
Hesperian Blvd
Mission Blvd
Whipple Rd
Industrial Pkwy W
Whipple Rd
San Luis Obispo Ave
Zephyr Ave
Wieg
manR
d
Whipple Rd Whipple Rd
Huntw
ood A
ve
San Antonio St
Esri, HERE, DeLorme, MapmyIndia, © OpenStreetMap contributors, and the GIS user community
LegendIndustrial Technology and Innovation Corridor
Proposed LoopCore Loop
New Construction
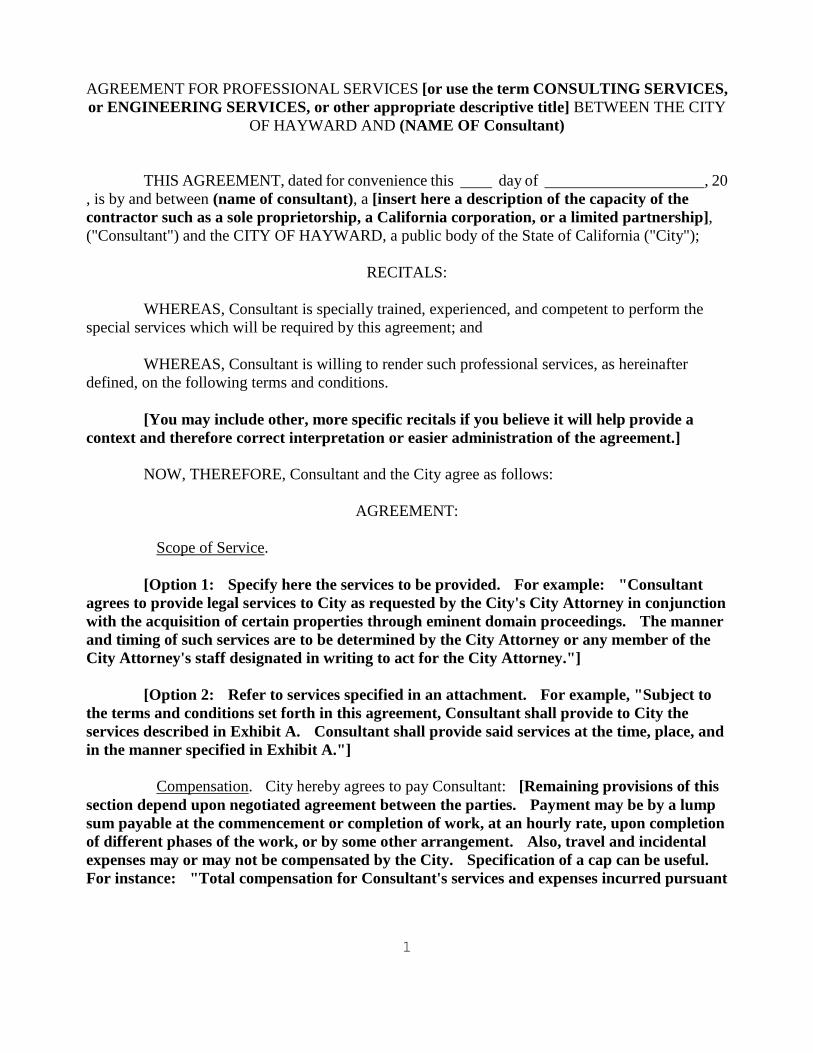
AGREEMENT FOR PROFESSIONAL SERVICES [or use the term CONSULTING SERVICES, or ENGINEERING SERVICES, or other appropriate descriptive title] BETWEEN THE CITY
OF HAYWARD AND (NAME OF Consultant)
THIS AGREEMENT, dated for convenience this day of , 20 , is by and between (name of consultant), a [insert here a description of the capacity of the contractor such as a sole proprietorship, a California corporation, or a limited partnership], ("Consultant") and the CITY OF HAYWARD, a public body of the State of California ("City");
RECITALS:
WHEREAS, Consultant is specially trained, experienced, and competent to perform the special services which will be required by this agreement; and
WHEREAS, Consultant is willing to render such professional services, as hereinafter defined, on the following terms and conditions.
[You may include other, more specific recitals if you believe it will help provide a context and therefore correct interpretation or easier administration of the agreement.]
NOW, THEREFORE, Consultant and the City agree as follows:
AGREEMENT:
Scope of Service.
[Option 1: Specify here the services to be provided. For example: "Consultant agrees to provide legal services to City as requested by the City's City Attorney in conjunction with the acquisition of certain properties through eminent domain proceedings. The manner and timing of such services are to be determined by the City Attorney or any member of the City Attorney's staff designated in writing to act for the City Attorney."]
[Option 2: Refer to services specified in an attachment. For example, "Subject to
the terms and conditions set forth in this agreement, Consultant shall provide to City the services described in Exhibit A. Consultant shall provide said services at the time, place, and in the manner specified in Exhibit A."]
Compensation. City hereby agrees to pay Consultant: [Remaining provisions of this
section depend upon negotiated agreement between the parties. Payment may be by a lump sum payable at the commencement or completion of work, at an hourly rate, upon completion of different phases of the work, or by some other arrangement. Also, travel and incidental expenses may or may not be compensated by the City. Specification of a cap can be useful. For instance: "Total compensation for Consultant's services and expenses incurred pursuant
1
2
to this agreement shall not exceed the sum of _______________." Last, you may or may not wish to require submission of logs or time sheets to verify costs and expenses. Copies of contracts with different approaches to compensation provisions are available in the City Attorney's Office.]
Effective Date and Term. The effective date of this agreement is __________________
[Except in very unusual circumstances and with specific written approval of the City Attorney and City Manager, the effective date inserted should not precede the date the agreement is fully executed] and it shall terminate no later than _________________. [If the termination date is later than the end of the fiscal year, the agreement must provide that continuation of the agreement beyond that date will be contingent upon lawful encumbrance or appropriation of new funds.]
Independent Contractor Status. It is expressly understood and agreed by both parties
that Consultant, while engaged in carrying out and complying with any of the terms and conditions of this agreement, is an independent contractor and not an employee of the City. Consultant expressly warrants not to represent, at any time or in any manner, that Consultant is an employee of the City.
Billings. [Language in this section depends upon means of compensation specified
in section (2) above. For example, where compensation is on an hourly basis, and on-going, the following language may be used: "Consultant shall submit monthly bills to the City describing its services and costs provided during the previous month. Except as specifically authorized by City, Consultant shall not bill City for duplicate services performed by more than one person. Consultant's monthly bills shall include the following information to which such services or costs pertain: a brief description of services performed, the date the services were performed, the number of hours spent and by whom, and a brief description of any costs incurred, and the Consultant's signature." The following may also be appropriate if there is a maximum payment (a "not to exceed" amount) in (2): "In no event shall Consultant submit any billing for an amount in excess of the maximum amount of compensation provided in section (2)( ){insert in the second set of parentheses the subsection designation, typically it is (c), in which the payment limitation is provided in section (2)}."]
Advice and Status Reporting. Consultant shall provide the City with timely advice of all
significant developments arising during performance of its services hereunder orally or in writing.
Designation of Primary Provider of Services. This agreement contemplates the services of Consultant firm, [Name, Name, and Name]. The primary provider of the services called for by this agreement shall be [insert here the name of the individual who will provide the services to the City], who shall not be replaced without the written consent of City's [insert here the appropriate title such as City Manager, Director of Public Works, etc.]. [This section of the standard form of agreement should only be used when you want to designate a specific person to perform or supervise the services called for in the agreement. If you use the standard form
3
of agreement in disk form, note that the automatic numbering feature of WordPerfect has been used so that if you delete this section the following sections will automatically be renumbered for you.]
Assignment of Personnel. Consultant shall assign only competent personnel to perform
services pursuant to this agreement. In the event that City, in its sole discretion, at any time during the term of this agreement, desires the removal of any such persons, Consultant shall, immediately upon receiving notice from City of such desire of City, cause the removal of such person or persons.
Assignment and Subcontracting. It is recognized by the parties hereto that a substantial
inducement to City for entering into this agreement was, and is, the [professional] reputation and competence of Consultant. Neither this agreement nor any interest therein may be assigned by Consultant without the prior written approval of City's [insert here the title of the appropriate City official to make this determination]. [If the consultant will not be using a subcontractor that you have already approved, go directly to the sentence in regular type face that follows. If you have approved the use of one or more subcontractors, insert the following prefatory clause without using the quotation marks: "Except for the subcontract with (Name) for (type of service provided by subcontractor) as specified in section () {fill in the appropriate number} of this agreement {or use a paragraph # in Exhibit A, if that is the more appropriate reference for the specific contract you are drafting},"] Consultant shall not subcontract any portion of the performance contemplated and provided for herein without prior written approval of the City's [insert here the title of the appropriate City official to make this determination].
Insurance. On or before beginning any of the services or work called for by any term of
this agreement, Consultant, at its own cost and expense, shall carry, maintain for the duration of the agreement, and provide proof thereof that is acceptable to the City the insurance specified in subsections (a) through (c) below with insurers and under forms of insurance satisfactory in all respects to the City. Consultant shall not allow any subcontractor to commence work on any subcontract until all insurance required of the Consultant has also been obtained for the subcontractor.
(a) Workers' Compensation. Statutory Workers' Compensation Insurance and
Employer's Liability insurance for any and all persons employed directly or indirectly by Consultant shall be provided with limits not less than one million dollars. In the alternative, Consultant may rely on a self-insurance program to meet these requirements so long as the program of self-insurance complies fully with the provisions of the California Labor Code. The insurer, if insurance is provided, or the Consultant, if a program of self-insurance is provided, shall waive all rights of subrogation against the City for loss arising from work performed under this agreement.
(b) Commercial General and Automobile Liability. Consultant, at Consultant's own cost and expense, shall maintain commercial general and automobile liability insurance for the period covered by this agreement in an amount not less than one million dollars per occurrence, combined single limit coverage for risks associated with the work contemplated by this agreement. If a
4
Commercial General Liability Insurance or an Automobile Liability form or other form with a general aggregate limit is used, either the general aggregate limit shall apply separately to the work to be performed under this agreement or the general aggregate limit shall be at least twice the required occurrence limit. Such coverage shall include but shall not be limited to, protection against claims arising from bodily and personal injury, including death resulting therefrom, and damage to property resulting from activities contemplated under this agreement, including the use of owned and non-owned automobiles.
Coverage shall be at least as broad as Insurance Services Office Commercial General Liability occurrence form CG 0001 and Insurance Services Office Automobile Liability form CA 0001 Code 1 (any auto).
Each of the following shall be included in the insurance coverage or added as an endorsement to the policy:
(I) City, its officers, employees, agents, and volunteers are to be covered
as insureds as respects each of the following: liability arising out of activities performed by or on behalf of Consultant, including the insured's general supervision of Consultant; products and completed operations of Consultant; premises owned, occupied or used by Consultant; or automobiles owned, leased, hired, or borrowed by Consultant. The coverage shall contain no special limitations on the scope of protection afforded to City, its officers, employees, agents, or volunteers.
(ii) The insurance shall cover on an occurrence basis, and not on the basis
of an accident or claims made.
(iii) The insurance must cover personal injuries as well as bodily injuries. Any exclusion of contractual liability in personal injury provisions of the policy or any endorsement to it must be eliminated.
(iv) The insurance must cover complete contractual liability. This may be provided by amending the definition of "incidental contract" to include any written agreement.
(v) Any explosion, collapse, and underground property damage exclusion
must be deleted.
(vi) An endorsement must state that coverage is primary insurance and that no other insurance affected by the City will be called upon to contribute to a loss under the coverage.
5
(vii) The policy must contain a cross liability or severability of interests clause.
(viii) Any failure of Consultant to comply with reporting provisions of the
policy shall not affect coverage provided to City and its officers, employees, agents, and volunteers.
(ix) Broad form property damage liability must be afforded. A deductible
that does not exceed $25,000 may be provided.
(x) Insurance is to be placed with California- admitted insurers with a Best's rating of no less than B:XI.
(xi) Notice of cancellation or non-renewal must be received by City at least
thirty days prior to such change.
(c) Professional Liability. Consultant, at Consultant's own cost and expense, shall maintain for the period covered by this agreement professional liability insurance for licensed professionals performing work pursuant to this agreement in an amount not less than one million dollars covering the licensed professionals' errors and omissions, as follows:
(i) Any deductible shall not exceed $100,000 per claim.
(ii) Notice of cancellation or non-renewal must be received by the City at least thirty days prior to such change.
(iii) If the professional liability coverages are written on an occurrence
form, the policy must contain a cross liability or severability of interest clause.
(iv) The following provisions shall apply if the professional liability
coverages are written on a claims made form:
1. The retroactive date of the policy must be shown and must be before the date of the agreement.
2. Insurance must be maintained and evidence of insurance must be provided for at least five years after completion of the agreement or the work.
3. If coverage is canceled or not renewed and it is not replaced with another claims made policy form with a retroactive date that precedes
6
the date of this agreement, Consultant must provide extended reporting coverage for a minimum of five years after completion of the agreement or the work.
4. A copy of the claim reporting requirements must be submitted to the City prior to the commencement of any work under this agreement.
(d) Deductibles and Self-Insured Retentions. During the period covered by this
agreement, upon express written authorization of City's City Attorney, Consultant may increase such deductibles or self-insured retentions with respect to City, its officers, employees, agents, and volunteers. The City Consultant may condition approval of an increase in deductible or self-insured retention levels upon a requirement that Consultant procure a bond guaranteeing payment of losses and related investigations, claim administration, and defense expenses that is satisfactory in all respects to each of them.
(e) Notice of Reduction in Coverage. In the event that any coverage required under subsections (a), (b), or (c) of this section of the agreement is reduced, limited, or materially affected in any other manner, Consultant shall provide written notice to City at Consultant's earliest possible opportunity and in no case later than five days after Consultant is notified of the change in coverage.
(f) In addition to any other remedies City may have if Consultant fails to provide or maintain any insurance policies or policy endorsements to the extent and within the time herein required, City may, at its sole option:
(i) Obtain such insurance and deduct and retain the amount of the premiums
for such insurance from any sums due under the agreement;
(ii) Order Consultant to stop work under this agreement or withhold any payment which becomes due to Consultant hereunder, or both stop work and withhold any payment, until Consultant demonstrates compliance with the requirements hereof;
(iii) Terminate this agreement.
Exercise of any of the above remedies, however, is an alternative to other remedies City may have and is not the exclusive remedy for Consultant's failure to maintain insurance or secure appropriate endorsements.
Indemnification - Consultant's Responsibility. It is understood and agreed that
Consultant has the [professional] skills [experience, knowledge] necessary to perform the work agreed to be performed under this agreement, that City relies upon the [professional] skills of

7
Consultant to do and perform Consultant's work in a skillful [and professional] manner, and Consultant thus agrees to so perform the work.
Acceptance by City of the work performed under this agreement does not operate as a
release of said Consultant from [such professional] responsibility for the work performed. It is further understood and agreed that Consultant is apprised of the scope of the work to be performed under this agreement and Consultant agrees that said work can and shall be performed in a fully competent manner.
Consultant shall indemnify, defend, and hold City, its officers, employees, agents, and
volunteers harmless from and against any and all liability, claims, suits, actions, damages, and causes of action arising out of any personal injury, bodily injury, loss of life, or damage to property, or any violation of any federal, state, or municipal law or ordinance, or other cause in connection with the negligent or intentional acts or omissions of Consultant, its employees, subcontractors, or agents, or on account of the performance or character of this work, except for any such claim arising solely out of the active negligence, sole negligence, or willful misconduct of the City, its officers, employees, agents, or volunteers. It is understood that the duty of Consultant to indemnify and hold harmless includes the duty to defend as set forth in section 2778 of the California Civil Code. Acceptance of insurance certificates and endorsements required under this agreement does not relieve Consultant from liability under this indemnification and hold harmless clause. This indemnification and hold harmless clause shall apply whether or not such insurance policies shall have been determined to be applicable to any of such damages or claims for damages.
Licenses. If a license of any kind, which term is intended to include evidence of
registration, is required of Consultant, its employees, agents, or subcontractors by federal or state law, Consultant warrants that such license has been obtained, is valid and in good standing, and shall keep in effect at all times during the term of this agreement, and that any applicable bond has been posted in accordance with all applicable laws and regulations.
Nondiscrimination. Consultant shall comply with all applicable federal, state, and local
laws, rules, and regulations in regard to nondiscrimination in employment because of race, color, ancestry, national origin, religion, sex, marital status, age, medical condition, pregnancy, disability, sexual orientation, or other prohibited basis. All nondiscrimination rules or regulation required by law to be included in the Agreement are incorporated by this reference.
Termination. [Specify here the termination provisions appropriate for the agreement.
One example is: "This agreement may be terminated by the City immediately for cause or upon fifteen days written notice without cause." Another example is: "This agreement may be cancelled at any time by City for its convenience upon written notification to Consultant." Next, insert a clause concerning payment for services rendered prior to termination. Language of this provision will depend upon how compensation is provided by section (2) above. For example, where hourly compensation is contemplated, the following language may
8
be applicable: "In the event of termination, the Consultant shall be entitled to compensation for services performed to the effective date of termination; provided, however, that the City may condition payment of such compensation upon Consultant's delivery to the City of any or all documents, photographs, computer software, video and audio tapes, and other materials provided to Consultant or prepared by or for Consultant or the City in connection with this agreement."]
Notices. Notices required by this agreement shall be personally delivered or mailed,
postage prepaid, as follows:
To Consultant: (Consultant) (Address )
To the City: City Manager
777 B Street, 4th Floor Hayward, CA 94541-5007
[Note: The City Manager may authorize notice to a subordinate staff member at his or
her discretion. You should not revise the designation of the City Manager as the official to receive notice under an agreement without having the City Manager's explicit authorization to do so.]
Each party shall provide the other party with telephone and written notice of any change in
address as soon as practicable.
Notices given by personal delivery shall be effective immediately. Notices given by mail shall be deemed to have been delivered forty-eight hours after having been deposited in the United States mail.
Ownership of Materials. Any and all documents, including draft documents where
completed documents are unavailable, or materials prepared or caused to be prepared by Consultant pursuant to this agreement shall be the property of the City at the moment of their completed preparation. [In some agreements, particularly agreements for engineering design products, you may wish language such as: "All materials and records of a finished nature, such as final plans, specifications, reports, and maps, prepared or obtained in the performance of this agreement, shall be delivered to and become the property of City. All materials of a preliminary nature, such as survey notes, sketches, preliminary plans, computations and other data, prepared or obtained in the performance of this agreement, shall be made available, upon request, to City at no additional charge and without restriction or limitation on their use consistent with the intent of the original design."]

9
Amendments. This agreement may be modified or amended only by a written document executed by both Consultant and City's City Manager and approved as to form by the City Attorney. Such document shall expressly state that it is intended by the parties to amend the terms and conditions of this agreement.
Abandonment by Consultant. In the event the Consultant ceases performing services
under this agreement or otherwise abandons the project prior to completing all of the services described in this agreement, Consultant shall, without delay, deliver to City all materials and records prepared or obtained in the performance of this agreement, and shall be paid for the reasonable value of the services performed up to the time of cessation or abandonment, less a deduction for any damages or additional expenses which City incurs as a result of such cessation or abandonment.
Waiver. The waiver by either party of a breach by the other of any provision of this
agreement shall not constitute a continuing waiver or a waiver of any subsequent breach of either the same or a different provision of this agreement.
No Third-party Rights. The parties intend not to create rights in, or to grant remedies to,
any third party as a beneficiary of this agreement or of any duty, covenant, obligation, or undertaking established herein.
Severability. Should any part of this agreement be declared by a final decision by a court
or tribunal of competent jurisdiction to be unconstitutional, invalid, or beyond the authority of either party to enter into or carry out, such decision shall not affect the validity of the remainder of this agreement, which shall continue in full force and effect, provided that the remainder of this agreement, absent the unexcised portion, can be reasonably interpreted to give effect to the intentions of the parties.
Compliance with Laws. In the performance of this agreement, Consultant shall abide by
and conform to any and all applicable laws of the United States, the State of California, and the City Charter and Ordinances of City.
Consultant warrants that all work done under this agreement will be in compliance with all
applicable safety rules, laws, statutes and practices, including but not limited to Cal/OSHA regulations.
Controlling Law. This agreement and all matters relating to it shall be governed by the
laws of the State of California.
Conflict of Interest. Consultant warrants and covenants that the [principal] provider(s) of services presently has no interest in, nor shall any interest be hereinafter acquired in, any matter which will render the services required under the provisions of this agreement a violation of any applicable state, local, or federal law. If any [principal] provider of services is a "consultant" for the purposes
10
of the Fair Political Practices Act (Gov. Code ' 81000 et seq.), each such person shall comply with Form 721 Statement of Economic Interests filing requirements in accordance with the City=s local Conflict of Interest Code. In addition, if any other conflict of interest should nevertheless hereinafter arise, [principal] provider of services shall promptly notify City of the existence of such conflict of interest so that the City may determine whether to terminate this agreement.
Nuclear Free Hayward. Consultant agrees to comply with the requirements imposed by Ordinance No. 87-024 C.S., establishing a "Nuclear Free Hayward." An executed copy of the Affirmation of Non-Involvement in the Development or Production of Nuclear Weapons is attached hereto as Exhibit [insert here the designation of the exhibit] and made a part hereof.
Copyright. Upon City's request, Consultant shall execute appropriate documents to
assign to the City the copyright to work created pursuant to this agreement. The issuance of a patent or copyright to Consultant or any other person shall not affect City's rights to the materials and records prepared or obtained in the performance of this agreement. City reserves a license to use such materials and records without restriction or limitation consistent with the intent of the original design, and City shall not be required to pay any additional fee or royalty for such materials or records. The license reserved by City shall continue for a period of fifty years from the date of execution of this agreement unless extended by operation of law or otherwise.
Time is of the Essence. Consultant agrees to diligently prosecute the services to be
provided under this agreement to completion and in accordance with any schedules specified herein. In the performance of this agreement, time is of the essence.
Liquidated Damages. The parties to this agreement agree that, in the event that the
services described in this agreement are not completed on time, City will sustain damage and that it will be impracticable and extremely difficult to ascertain the actual damage which City will sustain. In the event that Consultant fails to complete all of the services described in this agreement on or before the completion dated listed in section ___ above, or within the period of any authorized extension, Consultant shall pay as and for liquidated damages, the sum listed in section ___ above for each calendar day that completion is delayed. [Whether or not to use this provision is determined on a case-by-case basis.]
Whole Agreement. This agreement has twelve [insert here the number of pages of the
agreement if different from 12] pages excluding the exhibits described on its signature page. This agreement constitutes the entire understanding and agreement of the parties. This agreement integrates all of the terms and conditions mentioned herein or incidental hereto and supersedes all negotiations or previous agreements between the parties with respect to all or any part of the subject matter hereof.
Multiple Copies of Agreement. Multiple copies of this agreement may be executed but
the parties agree that the agreement on file in the office of City's City Clerk is the version of the
11
agreement that shall take precedence should any differences exist among counterparts of the document.
IN WITNESS WHEREOF, Consultant has executed this agreement, and the City, by its City
Manager, who is authorized to do so, has executed this agreement.
CONSULTANT
Dated:__________________ By
Its
CITY OF HAYWARD
Dated:__________________ By City Manager
Attest: City Clerk
Approved as to Form and Procedure:
City Attorney
Attachments: Exhibit A [insert here the name of the first exhibit], consisting of [ ] pages. Exhibit B [continue with listing a description of each of the exhibits to the agreement, including the number of pages of each].
Fiber Optic Master Plan
Prepared for the City of Hayward, California January 2017
Fiber Optic Master Plan | January 2017
ii
Contents
1 Executive Summary ................................................................................................................. 1
1.1 Project Background and Objectives .................................................................... 1
1.1.1 Fiber Optic Master Plan Objectives ..................................................................... 2
1.2 Methodology ....................................................................................................... 3
1.3 The City of Hayward’s Industrial Corridor Is Unique ........................................... 3
1.4 The City’s U.S. Economic Development Administration Grant Decreases FTTP
Construction Costs ...................................................................................................................... 4
1.5 The City Can Consider Three Potential Business Models With Varying Degrees of
Risk 6
1.5.1 A Dark Fiber Model Will Enable the City to Partner with the Private Sector and
Balance Risk ............................................................................................................................ 7
1.5.2 A Wholesale Service Model Can Enable Multiple ISPs to Serve Customers ....... 8
1.5.3 A Retail Service Model Is High Risk ...................................................................... 9
1.6 Estimated Fiber Costs and Phased Deployment ................................................. 9
1.6.1 Industrial Technology and Innovation Corridor ................................................ 10
1.7 Recommendations and Next Steps ................................................................... 11
1.7.1 The City Can Take Small Steps with Potentially Big Rewards Toward Achieving Its
Goals 12
1.8 Expanding FTTP to Residential Customers Adds Considerable Cost ................. 17
2 Broadband Needs and Trends .............................................................................................. 20
2.1 The City Is Served Similarly to Other Markets, but There Are Still Gaps in Service
21
3 Needs Assessment ................................................................................................................ 23
3.1 Business Survey Results ..................................................................................... 23
3.2 Comparison of Services in Hayward to Gigabit Communities ........................... 23
4 Operational and Business Model Options ............................................................................ 26
4.1.1 Staffing Considerations for Various Business Models ....................................... 27
4.2 Fiber Management Requirements .................................................................... 28
4.3 Dig Once Considerations ................................................................................... 29
Fiber Optic Master Plan | January 2017
iii
4.3.1 The Case for Dig Once Policies .......................................................................... 29
4.3.2 Coordinating Conduit Construction with Other Utility Projects Reduces Costs 31
4.3.3 Standard Specification ....................................................................................... 31
5 Proposed Fiber Design .......................................................................................................... 34
5.1 Construction Methodology ............................................................................... 34
5.2 Overview of Existing Assets ............................................................................... 35
5.2.1 City Conduit and Fiber ....................................................................................... 35
5.3 Leverage Existing Assets .................................................................................... 38
5.4 Conceptual Design and Specifications – Industrial Technology & Innovation
Corridor 40
5.4.1 Network Design ................................................................................................. 43
5.4.2 Network Core and Hub Site ............................................................................... 44
5.4.3 Distribution and Access Network Design .......................................................... 45
6 Cost Estimate – Industrial Technology & Innovation Corridor ............................................. 49
6.1 FTTP Cost Estimate Summary ............................................................................ 49
6.1.1 FTTP Cost Estimate (Fiber and Electronics) – Wholesale and Retail Models .... 49
6.1.2 FTTP Only Cost Estimate (No Electronics, Drops, or CPEs) – Dark Fiber Model 51
6.2 Cost Estimate Breakdown.................................................................................. 52
6.2.1 Existing City Network Infrastructure Decreases FTTP Construction Costs ........ 53
6.3 Field Survey Methodology for Network Design and Cost Estimate .................. 54
6.4 FTTP Cost Estimate ............................................................................................ 55
6.4.1 OSP Cost Estimation Methodology ................................................................... 56
6.4.2 OSP ..................................................................................................................... 57
6.4.3 Central Network Electronics .............................................................................. 58
6.4.4 Customer Premises Equipment (CPE) and Service Drop Installation (Per‐
subscriber Costs) ................................................................................................................... 59
6.5 Operating Cost Considerations .......................................................................... 60
6.5.1 Technical Operational Expenditures ................................................................. 60
6.5.2 Technical Staffing Requirements ....................................................................... 62
Fiber Optic Master Plan | January 2017
iv
7 Business and Financial Model ............................................................................................... 64
7.1 Overview ............................................................................................................ 64
7.2 Retail Model Financial Projections .................................................................... 65
7.2.1 Financing Costs and Operating Expenses .......................................................... 66
7.2.2 Operating and Maintenance Expenses .............................................................. 72
7.2.3 Summary of Operating and Maintenance Assumptions ................................... 73
7.2.4 Take‐Rate Sensitivity ......................................................................................... 74
7.3 Wholesale Model Financial Projections ............................................................ 76
7.3.1 Financing Costs and Operating Expenses .......................................................... 78
7.3.2 Operating and Maintenance Expenses .............................................................. 83
7.3.3 Summary of Operating and Maintenance Expenses ......................................... 84
7.3.4 Take‐Rate Sensitivity ......................................................................................... 85
7.4 Dark Fiber Model Financial Analysis .................................................................. 87
7.4.1 Cost Implications of the Dark Fiber Model ........................................................ 89
7.4.2 Financing Costs and Operating Expenses .......................................................... 90
7.4.3 Operating and Maintenance Expenses .............................................................. 97
7.4.4 Revenue ............................................................................................................. 99
7.4.5 Dark Fiber Fee Sensitivity ................................................................................ 100
Appendix A: Glossary of Terms ................................................................................................... 102
Appendix B: Assessment of Local Broadband Market ................................................................ 104
Appendix C: Retail Financial Model (spreadsheet) ..................................................................... 105
Appendix D: Wholesale Financial Model (spreadsheet) ............................................................. 106
Appendix E: Dark Fiber Financial Model (spreadsheet).............................................................. 107
Appendix F: Online Business Survey Questions .......................................................................... 108
Appendix G: Online Business Survey Results .............................................................................. 109
Survey Methodology ............................................................................................................... 109
Online Survey Results ............................................................................................................. 110
The Majority of Responses Were from Small‐to‐Medium Size Businesses ........................ 110
Nearly Half of Respondents Are Satisfied with Current Internet Speeds ........................... 113
Fiber Optic Master Plan | January 2017
v
Pricing Sensitivity and Willingness to Switch Service Providers ......................................... 116
The City’s Role ......................................................................................................................... 119
Follow‐Up Interviews with Select Businesses ......................................................................... 120
Figures
Figure 1: Demarcation Between City and Partner Network Elements ........................................... 8
Figure 2: Comparison of Per‐Passing Costs in Various U.S. Markets ............................................ 19
Figure 3: Existing and Proposed City‐Constructed Infrastructure ................................................ 37
Figure 4: Existing and Proposed City‐Constructed Fiber by Strand Count ................................... 38
Figure 5: High‐Level FTTP Architecture ......................................................................................... 42
Figure 6: Detail Showing FTTP Access Layer Design ..................................................................... 44
Figure 7: Total Estimated Cost versus Take Rate .......................................................................... 50
Figure 8: Demarcation Between City and Partner Network Elements ......................................... 52
Figure 9: Map Showing Existing Conduit and Fiber Resources ..................................................... 54
Figure 10: High‐Level FTTP Sample Design Overview ................................................................... 56
Figure 11: Demarcation Between City and Partner Network Elements ....................................... 89
Figure 12: Respondents’ Number of Employees (Based on 255 Responses) ............................. 111
Figure 13: Respondents’ Annual Sales Volume (Based on 227 Responses) ............................... 112
Figure 14: Business Respondents’ Primary Internet Connection (Based on 201 Responses) .... 113
Figure 15: Importance of Price, Reliability, and Speed (Based on 191 Responses) ................... 114
Figure 16: Respondents’ Satisfaction With Current Internet Speeds (Based on 197 Responses)
..................................................................................................................................................... 115
Figure 17: Satisfaction with Current Internet Service Attributes (Based on 192 Responses) .... 116
Figure 18: Monthly Cost for Internet Services (Based on 183 Responses) ................................ 117
Figure 19: Respondents’ Willingness to Switch to 100 Mbps Service at Various Price Points (Based
on 142 Responses) ...................................................................................................................... 118
Figure 20: Respondents’ Willingness to Switch to 1 Gbps Service at Various Price Points (Based
on 137 Responses) ...................................................................................................................... 119
Figure 21: Main Role for the City With Respect to Broadband Access (Based on 160 Responses)
..................................................................................................................................................... 120
Tables
Table 1: Three Potential Business Models ...................................................................................... 7
Table 2: Breakdown of Estimated Dark FTTP Cost ........................................................................ 10
Table 3: Staffing for Dark Fiber Business Model ........................................................................... 27
Fiber Optic Master Plan | January 2017
vi
Table 4: Staffing for Wholesale Service Model ............................................................................. 28
Table 5: Staffing for Retail Service Model..................................................................................... 28
Table 6: Breakdown of Estimated Total Cost ................................................................................ 50
Table 7: Breakdown of Estimated Dark Fiber Model Cost ............................................................ 51
Table 8: Breakdown of Estimated Total Capital Cost – Retail and Wholesale Model .................. 55
Table 9: Estimated OSP Costs for FTTP ......................................................................................... 57
Table 10: Estimated Central Network Electronics Costs............................................................... 58
Table 11: Per‐subscriber Cost Estimates ...................................................................................... 60
Table 12: Responsibility Matrix for Potential Business Models ................................................... 64
Table 13: Base Case Retail Model Financial Analysis with 60 Percent Take Rate ........................ 66
Table 14: Operating Expenses in Years 1, 5, 10, 15, and 20 – Retail Model ................................. 68
Table 15: Income Statement – Retail Model ................................................................................ 69
Table 16: Cash Flow Statement – Retail Model ............................................................................ 70
Table 17: Capital Additions – Retail Model ................................................................................... 72
Table 18: Labor Expenses – Retail Model ..................................................................................... 73
Table 19: Take Rate Reduced to 50 Percent – Retail Model ........................................................ 75
Table 20: Take Rate Reduced to 40 Percent – Retail Model ........................................................ 76
Table 21: Take Rate Reduced to 30 Percent – Retail Model ........................................................ 76
Table 22: Wholesale Model Financial Analysis with 60 Percent Take Rate (Base Case) .............. 77
Table 23: Operating Expenses in Years 1, 5, 10, 15, and 20 – Wholesale Model ......................... 79
Table 24: Income Statement – Wholesale Model ........................................................................ 80
Table 25: Cash Flow Statement – Wholesale Model .................................................................... 81
Table 26: Capital Additions – Wholesale Model ........................................................................... 83
Table 27: Labor Expenses – Wholesale Model ............................................................................. 84
Table 28: Take Rate Reduced to 50 Percent – Wholesale Model ................................................. 86
Table 29: Take Rate Reduced to 40 Percent – Wholesale Model ................................................. 86
Table 30: Take Rate Reduced to 30 Percent – Wholesale Model ................................................. 87
Table 31: Base Case Financial Analysis – Dark Fiber Model ......................................................... 88
Table 32: Breakdown of Estimated Dark Fiber Model Cost (aerial and underground construction)
....................................................................................................................................................... 89
Table 33: Income Statement – Dark Fiber Model ......................................................................... 92
Table 34: Cash Flow Statement – Dark Fiber Model .................................................................... 94
Table 35 – Capital Additions – Dark Fiber Model ......................................................................... 97
Table 36: Operating Expenses Dark Fiber Model ......................................................................... 99
Table 37: Dark Fiber Model Financial Analysis ‐ $35 Per Month Passing Fee ............................ 100
Table 38: Dark Fiber Model Financial Analysis ‐ $30 Per Month Passing Fee ............................ 101
Table 39: Dark Fiber Model Financial Analysis ‐ $25 Per Month Passing Fee ............................ 101
Fiber Optic Master Plan | DRAFT | January 2017
1
1 ExecutiveSummary
There is a growing desire for robust, fiber‐based broadband throughout the U.S., particularly
among businesses of all sizes as their needs evolve, and connectivity becomes increasingly
integral to business operations. Given this, localities are eager to find ways to fill gaps in available
service to help their communities attract and retain businesses. Cities that want to advance
economic development and attract a talented workforce are seeking ways to deploy fiber‐to‐the‐
premises (FTTP) in their communities, or to partner with private providers that are willing and
able to help meet connectivity needs.
The City of Hayward is committed to enabling greater fiber‐based connectivity for its numerous
businesses, and to eventually expanding services to its residential neighborhoods. The City is
focused on a phased municipal broadband deployment, and exploring a potential public–private
partnership to achieve these goals.
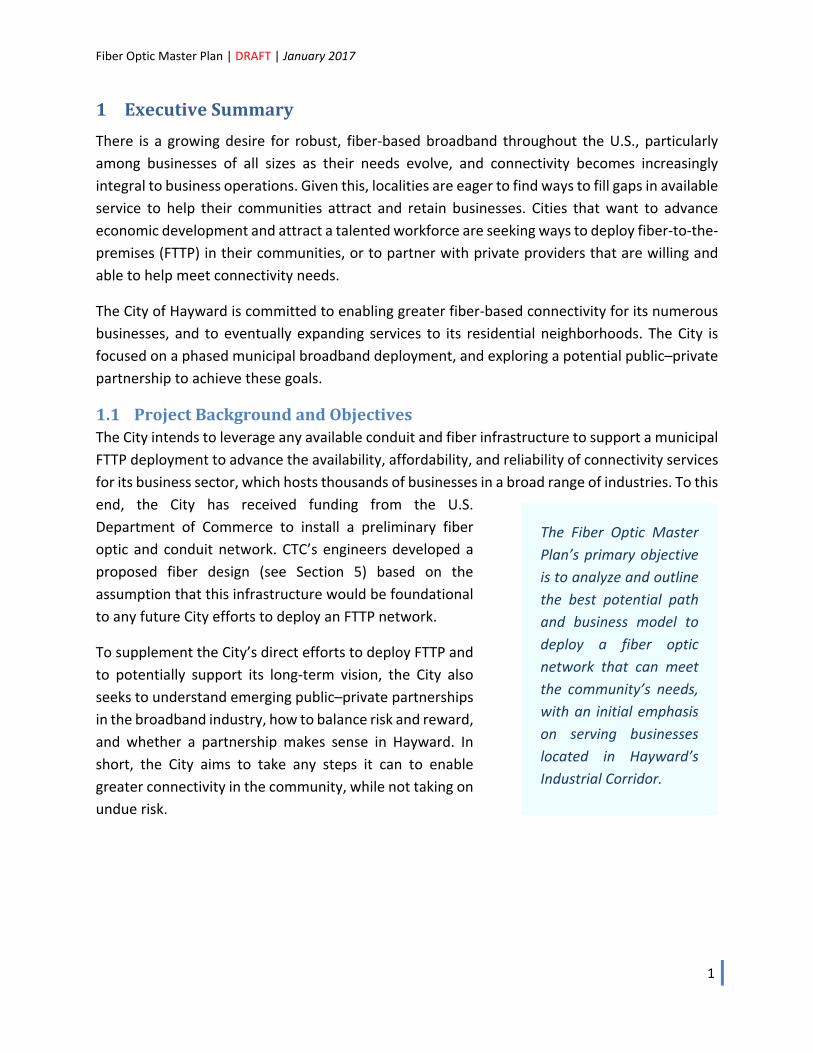
1.1 ProjectBackgroundandObjectivesThe City intends to leverage any available conduit and fiber infrastructure to support a municipal
FTTP deployment to advance the availability, affordability, and reliability of connectivity services
for its business sector, which hosts thousands of businesses in a broad range of industries. To this
end, the City has received funding from the U.S.
Department of Commerce to install a preliminary fiber
optic and conduit network. CTC’s engineers developed a
proposed fiber design (see Section 5) based on the
assumption that this infrastructure would be foundational
to any future City efforts to deploy an FTTP network.
To supplement the City’s direct efforts to deploy FTTP and
to potentially support its long‐term vision, the City also
seeks to understand emerging public–private partnerships
in the broadband industry, how to balance risk and reward,
and whether a partnership makes sense in Hayward. In
short, the City aims to take any steps it can to enable
greater connectivity in the community, while not taking on
undue risk.
The Fiber Optic Master
Plan’s primary objective
is to analyze and outline
the best potential path
and business model to
deploy a fiber optic
network that can meet
the community’s needs,
with an initial emphasis
on serving businesses
located in Hayward’s
Industrial Corridor.
Fiber Optic Master Plan | January 2017
2
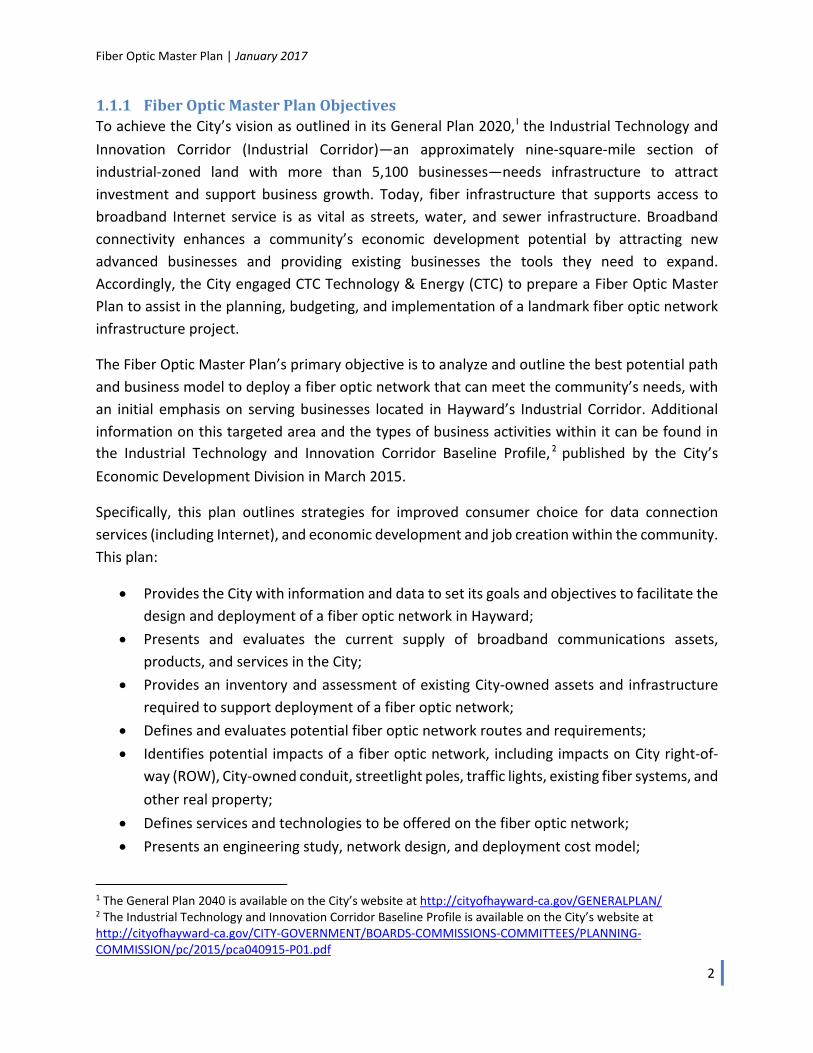
1.1.1 FiberOpticMasterPlanObjectivesTo achieve the City’s vision as outlined in its General Plan 2020,1 the Industrial Technology and
Innovation Corridor (Industrial Corridor)—an approximately nine‐square‐mile section of
industrial‐zoned land with more than 5,100 businesses—needs infrastructure to attract
investment and support business growth. Today, fiber infrastructure that supports access to
broadband Internet service is as vital as streets, water, and sewer infrastructure. Broadband
connectivity enhances a community’s economic development potential by attracting new
advanced businesses and providing existing businesses the tools they need to expand.
Accordingly, the City engaged CTC Technology & Energy (CTC) to prepare a Fiber Optic Master
Plan to assist in the planning, budgeting, and implementation of a landmark fiber optic network
infrastructure project.
The Fiber Optic Master Plan’s primary objective is to analyze and outline the best potential path
and business model to deploy a fiber optic network that can meet the community’s needs, with
an initial emphasis on serving businesses located in Hayward’s Industrial Corridor. Additional
information on this targeted area and the types of business activities within it can be found in
the Industrial Technology and Innovation Corridor Baseline Profile, 2 published by the City’s
Economic Development Division in March 2015.
Specifically, this plan outlines strategies for improved consumer choice for data connection
services (including Internet), and economic development and job creation within the community.
This plan:
Provides the City with information and data to set its goals and objectives to facilitate the
design and deployment of a fiber optic network in Hayward;
Presents and evaluates the current supply of broadband communications assets,
products, and services in the City;
Provides an inventory and assessment of existing City‐owned assets and infrastructure
required to support deployment of a fiber optic network;
Defines and evaluates potential fiber optic network routes and requirements;
Identifies potential impacts of a fiber optic network, including impacts on City right‐of‐
way (ROW), City‐owned conduit, streetlight poles, traffic lights, existing fiber systems, and
other real property;
Defines services and technologies to be offered on the fiber optic network;
Presents an engineering study, network design, and deployment cost model;
1 The General Plan 2040 is available on the City’s website at http://cityofhayward‐ca.gov/GENERALPLAN/ 2 The Industrial Technology and Innovation Corridor Baseline Profile is available on the City’s website at http://cityofhayward‐ca.gov/CITY‐GOVERNMENT/BOARDS‐COMMISSIONS‐COMMITTEES/PLANNING‐COMMISSION/pc/2015/pca040915‐P01.pdf
Fiber Optic Master Plan | January 2017
3
Outlines a potential phased approach to deliver the network; and
Evaluates potential business models to build, operate, and make “last‐mile” connections
to a fiber optic network.
1.2 MethodologyThis report was researched and prepared in the summer and autumn of 2016 by CTC, with
ongoing input from City staff. In addition to drawing on our extensive industry experience, our
analysis is guided by our conversations and interviews with City staff about the City’s objectives
and desired outcomes.
Over the course of the engagement, CTC performed the following general tasks:
1. Reviewed the City’s key physical infrastructure;
2. Developed and administered an online survey of Hayward businesses;
3. Conducted follow‐up interviews with a select group of Hayward businesses to further gauge interest in City FTTP efforts;
4. Researched the region’s available broadband services and costs;
5. Conducted onsite and desk surveys of City infrastructure;
6. Evaluated potential public–private partnership business models based on current developments in the broadband industry; and
7. Developed pro forma financial statements for the City, including a governance model for a fiber enterprise.
In addition to those tasks, CTC prepared a proposed fiber design (Section 5), which provides data
relevant to assessing the financial viability of network deployment, and offers guidance to
develop business models for a potential City construction effort (including the full range of
models for public–private partnerships). This estimate also provides key inputs to financial
modeling (see Section 7) to determine the approximate revenue levels necessary for the City to
service any debt incurred in building the network.
1.3 TheCityofHayward’sIndustrialCorridorIsUniqueHayward is an economically and ethnically diverse city of approximately 150,000 residents within
45.32 square miles on the eastern edge of the San Francisco Bay. As a regional center of retail,
industrial, and public activities, Hayward combines a hometown atmosphere, ideal climate,
cultural attractions, parks, and recreational facilities with easy access to suppliers and customers
throughout the Bay Area and beyond.
Fiber Optic Master Plan | January 2017
4
The City is known as the “Heart of the Bay” because of its central location in Alameda County—
25 miles southeast of San Francisco, 14 miles south of Oakland, 26 miles north of San Jose, and
10 miles west of Pleasanton and surrounding valley communities. Hayward has two Bay Area
Rapid Transit (BART) stations, an Amtrak station, its own executive airport, and an extensive
network of freeways and bus lines that provide easy access to the San Francisco, Oakland, and
San Jose international airports. The City also boasts easy access to the Port of Oakland, the fourth‐
busiest container port in the U.S.
The City leveraged its strategic location and natural assets to become a regional hub for
commerce and trade. Today, Hayward is home to more than 7,000 businesses, ranging from
family‐owned retail shops and restaurants, to globally recognized manufacturers, distributors,
and retailers. The City’s key industries include:
Advanced and specialized manufacturing;
Clean and green technology;
Food and beverage manufacturing;
Life science and biotechnology; and
Transportation and logistics.
The City’s Industrial Corridor is a large crescent‐shaped area of industrial‐zoned land located
along the City’s western and southwestern boundaries. This roughly nine square miles of land is
home to more than 5,100 businesses that employ nearly 47,500 workers. According to the City’s
General Plan, this corridor is expected to grow as an economic and employment center and
evolve to achieve a healthy balance of traditional manufacturing and information‐ and
technology‐based uses.
Given the importance of the Industrial Corridor, we recommend focusing on providing service to
businesses there as part of a phased implementation approach to deploying FTTP in Hayward.
Rather than a pilot project, we believe that finding a way to serve the Industrial Corridor—or a
subset of businesses there—and maintain service long term will serve the City’s interests. This
may be possible through a public–private partnership under one of the business plans outlined
in Section 1.5. Specifically, the City can target infrastructure deployment to lower barriers for one
or more private providers that aim to serve these locations, and it can enable a mid‐range FTTP‐
based retail product.
1.4 TheCity’sU.S.EconomicDevelopmentAdministrationGrantDecreasesFTTPConstructionCosts
The U.S. Department of Commerce’s Economic Development Administration (EDA) announced in
2016 that it had awarded just over $2.74 million in grant funds to the City to support fiber optic
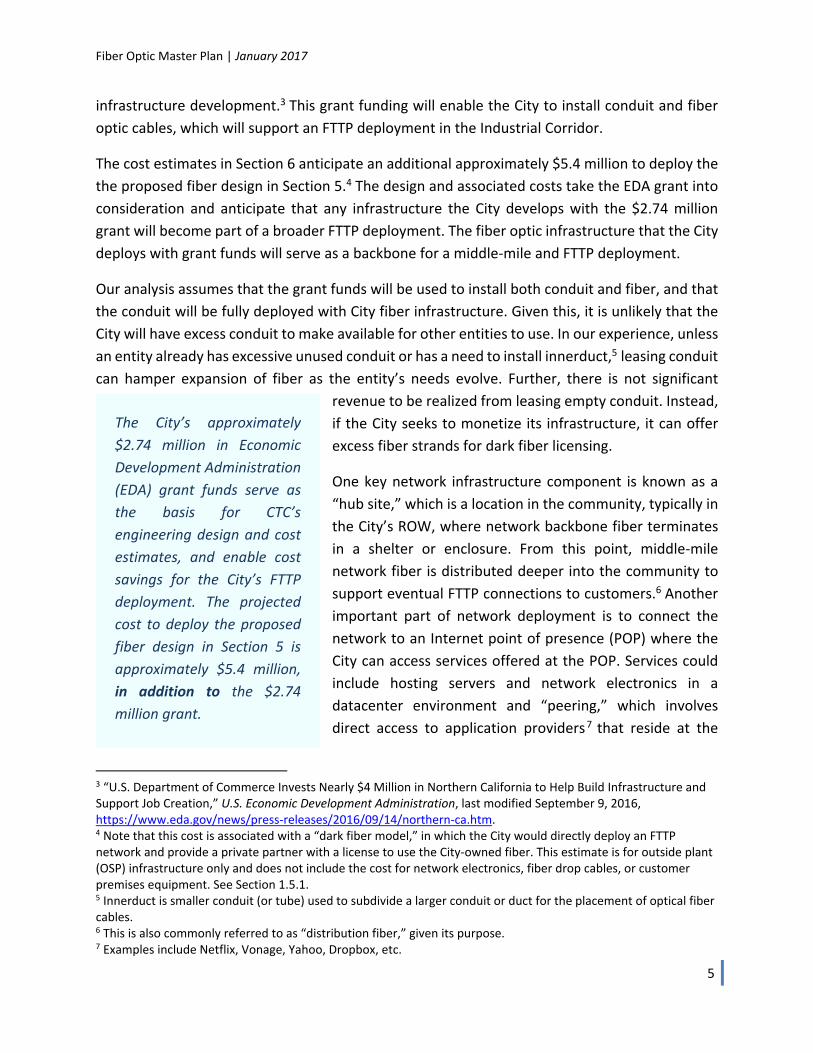
Fiber Optic Master Plan | January 2017
5
infrastructure development.3 This grant funding will enable the City to install conduit and fiber
optic cables, which will support an FTTP deployment in the Industrial Corridor.
The cost estimates in Section 6 anticipate an additional approximately $5.4 million to deploy the
the proposed fiber design in Section 5.4 The design and associated costs take the EDA grant into
consideration and anticipate that any infrastructure the City develops with the $2.74 million
grant will become part of a broader FTTP deployment. The fiber optic infrastructure that the City
deploys with grant funds will serve as a backbone for a middle‐mile and FTTP deployment.
Our analysis assumes that the grant funds will be used to install both conduit and fiber, and that
the conduit will be fully deployed with City fiber infrastructure. Given this, it is unlikely that the
City will have excess conduit to make available for other entities to use. In our experience, unless
an entity already has excessive unused conduit or has a need to install innerduct,5 leasing conduit
can hamper expansion of fiber as the entity’s needs evolve. Further, there is not significant
revenue to be realized from leasing empty conduit. Instead,
if the City seeks to monetize its infrastructure, it can offer
excess fiber strands for dark fiber licensing.
One key network infrastructure component is known as a
“hub site,” which is a location in the community, typically in
the City’s ROW, where network backbone fiber terminates
in a shelter or enclosure. From this point, middle‐mile
network fiber is distributed deeper into the community to
support eventual FTTP connections to customers.6 Another
important part of network deployment is to connect the
network to an Internet point of presence (POP) where the
City can access services offered at the POP. Services could
include hosting servers and network electronics in a
datacenter environment and “peering,” which involves
direct access to application providers7 that reside at the
3 “U.S. Department of Commerce Invests Nearly $4 Million in Northern California to Help Build Infrastructure and Support Job Creation,” U.S. Economic Development Administration, last modified September 9, 2016, https://www.eda.gov/news/press‐releases/2016/09/14/northern‐ca.htm. 4 Note that this cost is associated with a “dark fiber model,” in which the City would directly deploy an FTTP network and provide a private partner with a license to use the City‐owned fiber. This estimate is for outside plant (OSP) infrastructure only and does not include the cost for network electronics, fiber drop cables, or customer premises equipment. See Section 1.5.1. 5 Innerduct is smaller conduit (or tube) used to subdivide a larger conduit or duct for the placement of optical fiber cables. 6 This is also commonly referred to as “distribution fiber,” given its purpose. 7 Examples include Netflix, Vonage, Yahoo, Dropbox, etc.
The City’s approximately
$2.74 million in Economic
Development Administration
(EDA) grant funds serve as
the basis for CTC’s
engineering design and cost
estimates, and enable cost
savings for the City’s FTTP
deployment. The projected
cost to deploy the proposed
fiber design in Section 5 is
approximately $5.4 million,
in addition to the $2.74
million grant.
Fiber Optic Master Plan | January 2017
6
POP. In addition to serving as a backbone, the City’s grant‐funded infrastructure will help connect
the network hub to the POP, which can help the City gain access to Internet service providers
(ISPs) that may be interested in procuring dark fiber from the City to serve businesses in the
Industrial Corridor or along the fiber routes.
Perhaps the simplest benefit the EDA grant offers is approximately $2.74 million in avoided costs
to the City. While this does not cover the entire cost to serve the City’s target area, it gives the
City a notable head start toward achieving its connectivity goals.
1.5 TheCityCanConsiderThreePotentialBusinessModelsWithVaryingDegreesofRisk
We evaluated three core business models for the City
to consider, two of which assume the City will seek a
private partner. Each model assumes the City will
invest in FTTP and take some financial and operating
risk, even if the City pursues a public–private
partnership based on one of these models. While a
private company could come into the City and invest
directly without requiring the City to take financial risk
of its own, this private investment approach is not a
true partnership, and the private sector has not
signaled to the City a willingness to take this approach.
In a dark fiber model, the City directly deploys an FTTP network, and provides a private partner
with a license to use the City‐owned fiber; the partner “lights” the fiber, and offers services to
end users. In this model, the partner would pay a per‐passing cost to the City to help offset the
public‐sector costs for fiber deployment. In this model, the City is responsible for all construction
and maintenance of the fiber, but does not manage network electronics, customer premises
equipment (CPEs), or any customer contracts.
In a wholesale service model, the City deploys an FTTP network and “lights” the fiber, and then
offers lit services to one or more private providers to offer service to end users. The City is
responsible for fiber construction and maintenance as well as all network electronics, including
replenishments and vendor contracts.
In a retail service model, the City deploys an FTTP network, “lights” the network, and directly
offers services to end users. In this model, the City will construct and maintain an FTTP network,
“light” the fiber and maintain all network electronics, and market and sell services to retail
customers. The City is responsible for customer service at every level in this model, and enters
the local market as a direct competitor to existing providers.
We recommend considering
a dark fiber model in which
the City deploys, owns, and
operates an FTTP network
and seeks a private partner
to invest in electronics to
“light” the network, and
offers services to end users.
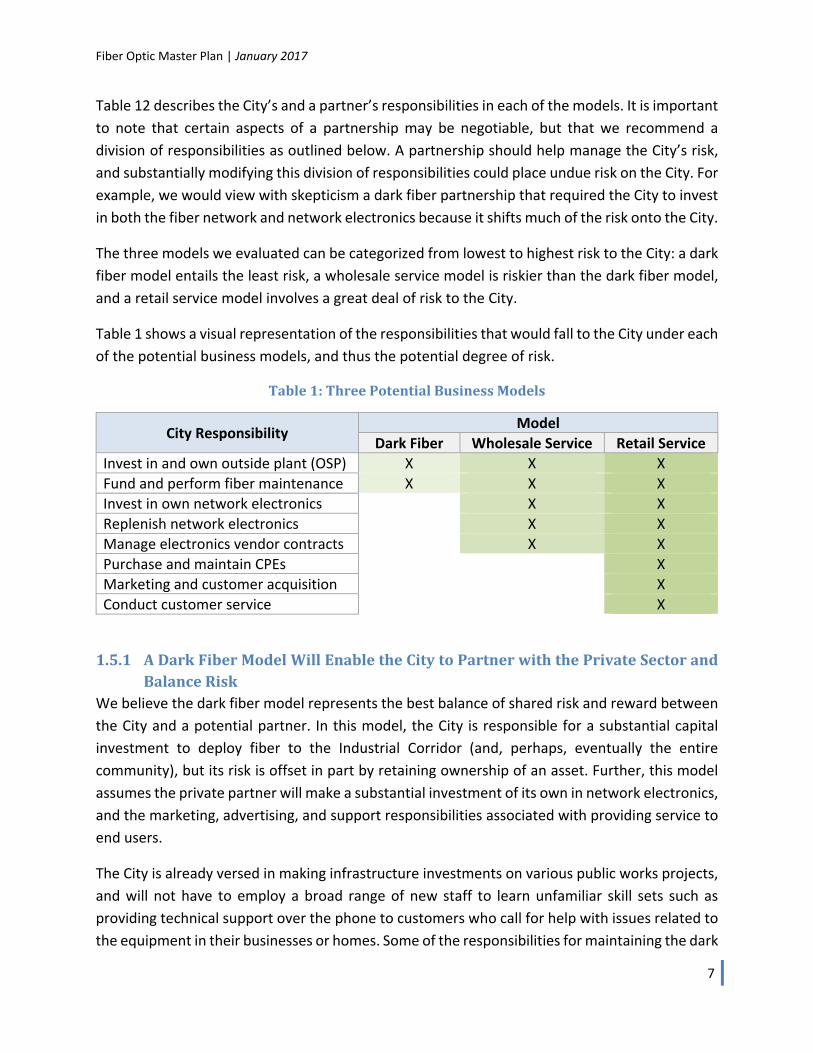
Fiber Optic Master Plan | January 2017
7
Table 12 describes the City’s and a partner’s responsibilities in each of the models. It is important
to note that certain aspects of a partnership may be negotiable, but that we recommend a
division of responsibilities as outlined below. A partnership should help manage the City’s risk,
and substantially modifying this division of responsibilities could place undue risk on the City. For
example, we would view with skepticism a dark fiber partnership that required the City to invest
in both the fiber network and network electronics because it shifts much of the risk onto the City.
The three models we evaluated can be categorized from lowest to highest risk to the City: a dark
fiber model entails the least risk, a wholesale service model is riskier than the dark fiber model,
and a retail service model involves a great deal of risk to the City.
Table 1 shows a visual representation of the responsibilities that would fall to the City under each
of the potential business models, and thus the potential degree of risk.
Table1:ThreePotentialBusinessModels
City Responsibility Model
Dark Fiber Wholesale Service Retail Service
Invest in and own outside plant (OSP) X X X
Fund and perform fiber maintenance X X X
Invest in own network electronics X X
Replenish network electronics X X
Manage electronics vendor contracts X X
Purchase and maintain CPEs X
Marketing and customer acquisition X
Conduct customer service X
1.5.1 ADarkFiberModelWillEnabletheCitytoPartnerwiththePrivateSectorandBalanceRisk
We believe the dark fiber model represents the best balance of shared risk and reward between
the City and a potential partner. In this model, the City is responsible for a substantial capital
investment to deploy fiber to the Industrial Corridor (and, perhaps, eventually the entire
community), but its risk is offset in part by retaining ownership of an asset. Further, this model
assumes the private partner will make a substantial investment of its own in network electronics,
and the marketing, advertising, and support responsibilities associated with providing service to
end users.
The City is already versed in making infrastructure investments on various public works projects,
and will not have to employ a broad range of new staff to learn unfamiliar skill sets such as
providing technical support over the phone to customers who call for help with issues related to
the equipment in their businesses or homes. Some of the responsibilities for maintaining the dark
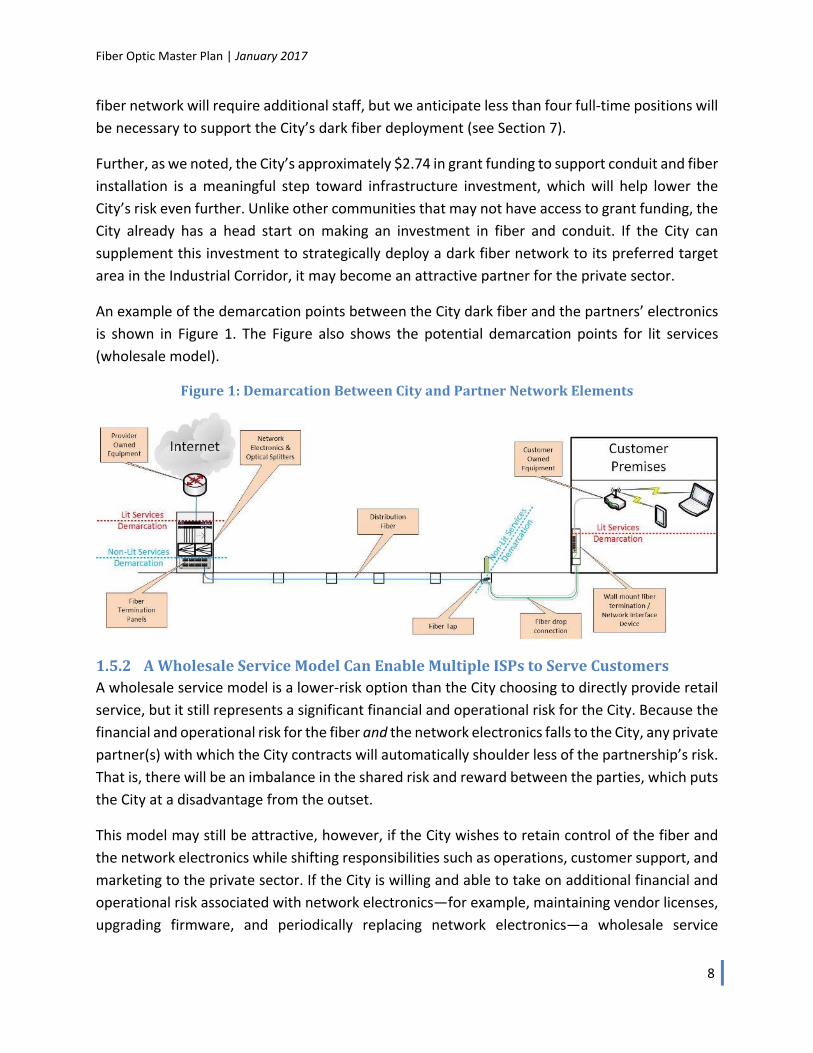
Fiber Optic Master Plan | January 2017
8
fiber network will require additional staff, but we anticipate less than four full‐time positions will
be necessary to support the City’s dark fiber deployment (see Section 7).
Further, as we noted, the City’s approximately $2.74 in grant funding to support conduit and fiber
installation is a meaningful step toward infrastructure investment, which will help lower the
City’s risk even further. Unlike other communities that may not have access to grant funding, the
City already has a head start on making an investment in fiber and conduit. If the City can
supplement this investment to strategically deploy a dark fiber network to its preferred target
area in the Industrial Corridor, it may become an attractive partner for the private sector.
An example of the demarcation points between the City dark fiber and the partners’ electronics
is shown in Figure 1. The Figure also shows the potential demarcation points for lit services
(wholesale model).
Figure1:DemarcationBetweenCityandPartnerNetworkElements
1.5.2 AWholesaleServiceModelCanEnableMultipleISPstoServeCustomersA wholesale service model is a lower‐risk option than the City choosing to directly provide retail
service, but it still represents a significant financial and operational risk for the City. Because the
financial and operational risk for the fiber and the network electronics falls to the City, any private
partner(s) with which the City contracts will automatically shoulder less of the partnership’s risk.
That is, there will be an imbalance in the shared risk and reward between the parties, which puts
the City at a disadvantage from the outset.
This model may still be attractive, however, if the City wishes to retain control of the fiber and
the network electronics while shifting responsibilities such as operations, customer support, and
marketing to the private sector. If the City is willing and able to take on additional financial and
operational risk associated with network electronics—for example, maintaining vendor licenses,
upgrading firmware, and periodically replacing network electronics—a wholesale service
Fiber Optic Master Plan | January 2017
9
approach may be a viable option. This model can enable multiple ISPs to use the City’s network
to offer services by lowering costly barriers to entry.
1.5.3 ARetailServiceModelIsHighRiskThe only model that does not anticipate some level of partnership is the retail service model,
where the City would construct, own, and operate a fiber network over which it would directly
provide services to end users. While this model gives the City complete control, it also represents
the greatest possible risk to the City. In this model, the City would be responsible for all aspects
of network construction and administration, as well as marketing and advertising services to
potential customers, providing services, and offering customer support. This is a high‐risk model,
because all financial and operational responsibility for every aspect of the network and service
falls to the City; the City must compete with existing providers that have an established presence
in the market and can make use of economies of scale; and the City would be entering the market
as a new provider.
There are numerous steps the City must take to implement a retail service model that provides
service to end users. Even then, there is no guarantee that the City can successfully manage an
inherently unpredictable for‐choice business that requires an ability to compete in the
marketplace against established providers. If the City opts
to pursue this model, it will likely need to create new
positions for additional staff; determine whether the fiber
optic enterprise will be housed in an existing City
department or will be a separate entity; develop a range
of policies related to use, including compliance with digital
millennium copyright act (DMCA) requirements and other
state and federal regulations; and launch a marketing
campaign. These are merely the steps necessary to get
started. While these considerations are substantial, the
complexities associated with ongoing operations are
especially significant.
1.6 EstimatedFiberCostsandPhasedDeploymentTo ensure our design cost estimates reflected City goals and the reality of the infrastructure and
market in Hayward, our engineers conducted extensive desk surveys and an onsite field survey,
and engaged City staff in discussions throughout the course of this project. Our analysis examined
potential costs associated with bringing FTTP to the Industrial Corridor, and a possible phased
deployment.
Our analysis indicates that it
would cost approximately $5.4
million for the City to deploy a
dark fiber network to the
Industrial Corridor. This cost is
in addition to the $2.74 million
the U.S. Economic
Development Administration
awarded the City in 2016.
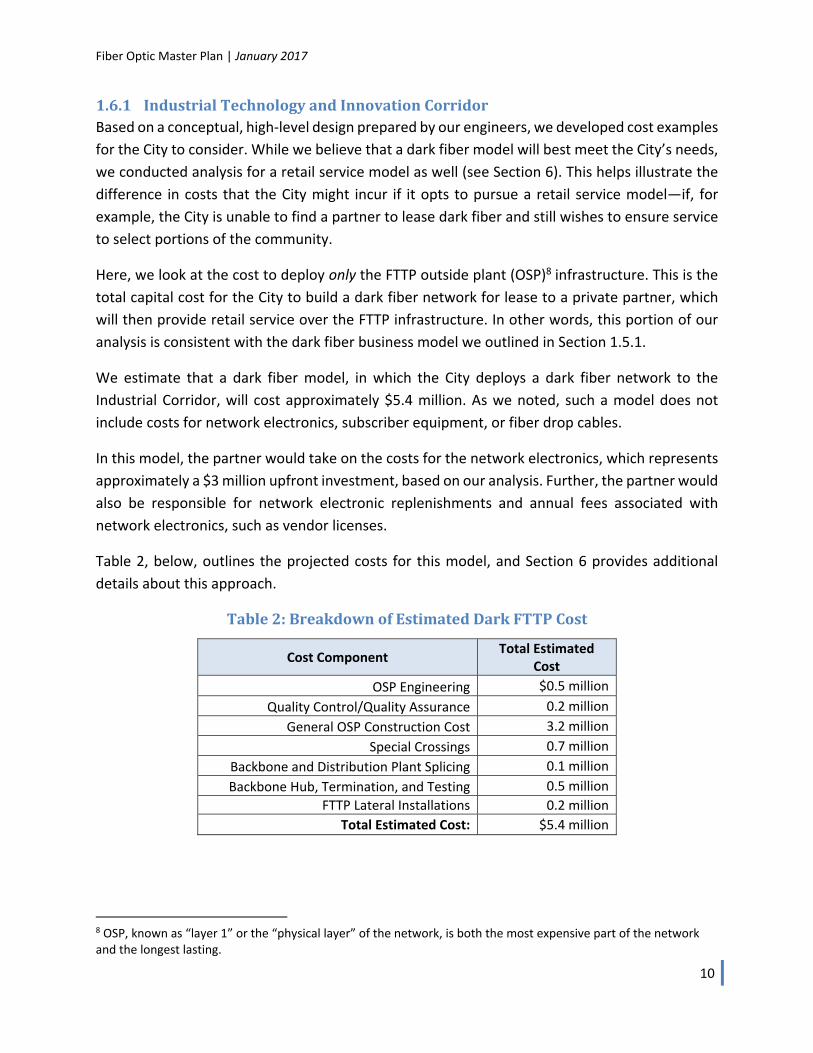
Fiber Optic Master Plan | January 2017
10
1.6.1 IndustrialTechnologyandInnovationCorridorBased on a conceptual, high‐level design prepared by our engineers, we developed cost examples
for the City to consider. While we believe that a dark fiber model will best meet the City’s needs,
we conducted analysis for a retail service model as well (see Section 6). This helps illustrate the
difference in costs that the City might incur if it opts to pursue a retail service model—if, for
example, the City is unable to find a partner to lease dark fiber and still wishes to ensure service
to select portions of the community.
Here, we look at the cost to deploy only the FTTP outside plant (OSP)8 infrastructure. This is the
total capital cost for the City to build a dark fiber network for lease to a private partner, which
will then provide retail service over the FTTP infrastructure. In other words, this portion of our
analysis is consistent with the dark fiber business model we outlined in Section 1.5.1.
We estimate that a dark fiber model, in which the City deploys a dark fiber network to the
Industrial Corridor, will cost approximately $5.4 million. As we noted, such a model does not
include costs for network electronics, subscriber equipment, or fiber drop cables.
In this model, the partner would take on the costs for the network electronics, which represents
approximately a $3 million upfront investment, based on our analysis. Further, the partner would
also be responsible for network electronic replenishments and annual fees associated with
network electronics, such as vendor licenses.
Table 2, below, outlines the projected costs for this model, and Section 6 provides additional
details about this approach.
Table2:BreakdownofEstimatedDarkFTTPCost
Cost Component Total Estimated
Cost
OSP Engineering $0.5 million
Quality Control/Quality Assurance 0.2 million
General OSP Construction Cost 3.2 million
Special Crossings 0.7 million
Backbone and Distribution Plant Splicing 0.1 million
Backbone Hub, Termination, and Testing 0.5 million
FTTP Lateral Installations 0.2 million
Total Estimated Cost: $5.4 million
8 OSP, known as “layer 1” or the “physical layer” of the network, is both the most expensive part of the network and the longest lasting.
Fiber Optic Master Plan | January 2017
11
1.7 RecommendationsandNextStepsSection 2.1 indicates that the City is served similarly to comparable markets. While there are
some gaps in available service, many of the City’s businesses currently have access to fiber‐based
connectivity or alternative technologies that offer sufficient speeds for their business needs. We
note that, based on our experience and analysis, Hayward is ahead of similar cities—even by
simply commissioning this Master Plan, the City has set itself apart from many of its peers.
Although there is not great urgency for the City to fill gaps, this section describes potential steps
the City can take increase broadband availability—especially to businesses—and thereby
potentially advance its standing in a global economy.
One of the most important decisions the City must make, which will inform next steps, is which
business model to pursue. We believe the City will achieve the most favorable outcome by
pursuing a dark fiber model, in which it expands its existing dark fiber and conduit, and grants
access to its network to private entities that will offer services. We believe this approach
represents shared investment and risk for the public and private sector, and may help offset the
City’s financial obligations.
In this approach, the City constructs and owns the
fiber network and the private partner “lights” the
fiber with electronics and directly serves end
users. This model is currently underway on a large
scale in the City of Westminster, Maryland, with
its private partner Ting Internet,9 and in the City
of Huntsville, Alabama, with its private partner,
Google Fiber.10
Retaining ownership of the fiber OSP assets is
important to mitigate risk; owning assets is a way
for the City to retain some control of the network,
and to have some say in when, where, and how it
is built. This approach includes a scenario in
which a community pursues a partnership with a
private provider; a good way to balance risk and
reward is for the City to maintain ownership and control of the assets while it assigns operational
responsibilities, including the capital investment for network and consumer electronics, to a
9 Wiley Hayes, “Westminster, Md. Partners with Private Sector to Broaden Fiber‐Optic Network,” GovTech, last modified October 26, 2015, http://www.govtech.com/dc/articles/Westminster‐Md‐Partners‐with‐Private‐Sector‐to‐Broaden‐Fiber‐Optic‐Network.html. 10 Frederic Lardinois, “Google Fiber Is Coming To Huntsville, Alabama,” Tech Crunch, last modified February 22, 2016, http://techcrunch.com/2016/02/22/google‐fiber‐is‐coming‐to‐huntsville‐alabama/.
We recommend that the City:
Consider a dark fiber model
Adopt a dig‐once policy
Audit its infrastructure and records
Implement a records management
system
Construct a fiber segment to
connect an Internet POP
Expand FTTP to select Industrial
Corridor areas
Signal to the private sector through
a procurement process
Lease dark fiber strands to select
Industrial Corridor customers
Fiber Optic Master Plan | January 2017
12
private partner. This enables both parties to perform functions that highlight their strengths
while not having to expend resources and energy attempting to carry out tasks for which they
are ill‐equipped.
There is risk to the City in this model because it requires a substantial capital investment to build
(or expand) and maintain the fiber network, but it also gives the City a degree of control because
the City owns the network. In the event the partnership fails for any reason the City owns its
assets and can take over control of the network directly or engage a different partner. This
partnership model where the City retains ownership of the fiber assets will likely enable the City
to make use of its existing fiber assets, and retain more control than simply relying on the private
sector, while tempering risk in a way that a retail model cannot.
We note that recent developments with Google Fiber—particularly its apparent scaling back of
infrastructure deployment—do not change any of CTC’s recommendations in this report.11 The
City is focused on finding ways to serve business customers, while Google Fiber has historically
focused on providing residential service.
1.7.1 TheCityCanTakeSmallStepswithPotentiallyBigRewardsTowardAchievingItsGoals
There are opportunities for the City to improve telecommunications services in the community
with minimal capital investment. A phased fiber construction approach would allow the City to
invest in infrastructure over time that facilitates the goal of eventually providing FTTP to all
residents and businesses in the City.
At a high level, we believe the City can take on the following projects to help advance toward its
goals without requiring a multi‐million‐dollar investment in the near term:
We recommend that, in the coming months, the City consider modifying its ROW
ordinance to provide the City with the option of obtaining conduit on routes where
utilities are performing excavation. This type of “Dig Once” policy would require any
excavation plans fitting specified criteria to include municipal use conduit or fiber, unless
the City opts out of the excavation project.
Conduct an in‐depth audit of existing fiber infrastructure and corresponding records, and
implement a thorough records management program. This will support the City’s current
efforts, and will enable a stronger enterprise going forward.
Spend approximately $60,000 to construct a roughly 0.3‐mile segment of fiber to the
Internet POP at 25070 O’Neil Avenue. If the City expands fiber and conduit through the
11 Jon Brodkin, “Google fiber division cuts staff by 9%, “pauses” fiber plans in 11 cities,” Ars Technica, last modified October 25, 2016, http://arstechnica.com/information‐technology/2016/10/google‐fiber‐laying‐off‐9‐of‐staff‐will‐pause‐plans‐for‐10‐cities/.
Fiber Optic Master Plan | January 2017
13
Industrial Corridor as planned, and begins offering dark fiber services to high‐end
customers, this will add value to that offering.
Begin expanding FTTP to select portions of the Industrial Corridor, and signal to the
private sector through a procurement process that the City seeks one or more partners
to offer services over a City‐owned fiber network.
Offer dark fiber services to some locations to support key customers in the Industrial
Corridor.
1.7.1.1 ConsiderModifyingtheCity’sROWOrdinancetoIncludeaDig‐OncePolicyFuture public works projects should also be leveraged to expand the City’s conduit and fiber
network. Projects such as utility replacements, road widenings, and other major capital
improvement efforts may provide the opportunity to install conduit and fiber optics without the
need for surface restoration. A coordinated Dig Once ordinance, which typically requires the
installation of City‐owned communications infrastructure in excavation projects where the City
has determined that it is both financially feasible and consistent with the City’s long‐term goals,
is recommended to leverage these types of public and private excavation projects. Section 4.3
further discusses our Dig Once recommendations.
Similar to Dig Once is a concept called “One‐Touch Make‐Ready,” which applies to infrastructure
that will be placed on electric or communication poles. Enacting a One‐Touch Make‐Ready
ordinance is similar to implementing a Dig Once policy in that both aim to simplify the process of
deploying infrastructure through coordinated efforts among entities and agencies. The goal is to
streamline the process of deploying future‐generation communications infrastructure
throughout as much of a locality as possible, while minimizing cost and disruption to the ROW.
This analysis does not include a recommendation that the City enact a One‐Touch Make‐Ready
ordinance at this time because our design anticipates a fully underground network. If the City
expects to deploy additional infrastructure on poles in the future, or partner with a private entity
that may deploy an aerial network, it may be prudent to explore a One‐Touch Make‐Ready policy.
It is important to note that Dig Once policies typically govern ROW spaces that a locality owns
and over which it has control, whereas a One‐Touch Make‐Ready ordinance generally applies to
poles that the locality may not own, or to which it may not have rights. While these poles are
often located in the locality’s public ROW, it is unclear to what degree a locality can direct pole
owners to provide access to their poles. While CTC cannot provide legal guidance, we note that
Fiber Optic Master Plan | January 2017
14
Louisville Metro Government in Kentucky12 and Metro Government of Nashville and Davidson
County in Tennessee13 are currently involved in litigation over One‐Touch Make‐Ready policies.
1.7.1.2 ConductAssetAuditandCarefullyManageanyExistingandExpandedFiberandConduitAssets
One of the most important steps the City can take is to ensure that it is carefully managing its
assets, including conduit and fiber. Whether the City opts to expand its assets or maintain the
status quo, fiber strand management on the front end can have enormous benefits over the life
of the fiber network, and can save potential confusion and cost in the long run.
One initial step toward this end is to conduct a thorough evaluation of any and all fiber
management documentation the City currently has in place. There may exist documentation in
the form of spreadsheets, correspondence, or simple text documents. A full fiber management
system may be a necessary long‐term investment, but the City cannot evaluate its needs until it
understands what it already has available. An audit of existing documentation will enable to City
to identify gaps in its fiber strand management—and if any documentation already exists, this
can be used to develop an initial fiber map, which can then be built onto as the City expands its
network.
We encourage the City to maintain detailed records of all its fiber strands and their locations. The
importance of keeping meticulous records does not cease once the network is fully constructed.
On the contrary, it is critically important for all ongoing and additional connections made on the
network to be documented. Updates should be made to “as‐built” and strand management
documentation in real time to avoid making mistakes later, misremembering strand allocations,
or simply forgetting important items altogether.
Documenting the network’s fibers and strand usage is crucial, and making sure that City staff has
unrestricted access to its strand management tools is equally important. Even if the City works
with an outside firm to manage this process, we believe that it is a worthwhile investment to
appoint a staff person who will become knowledgeable about and maintain documentation
regarding the location of strands on the City’s network. Further, using an intuitive and
straightforward system and/or software is also key; this will help guard against such critical
knowledge being inaccessible to future iterations of City staff and leadership.
12 Brodkin, Jon, "Charter, like AT&T, sues Louisville to stall Google Fiber," ArsTechnica, last modified October 5, 2016, accessed January 5, 2017, http://arstechnica.com/tech‐policy/2016/10/charter‐like‐att‐sues‐louisville‐to‐stall‐google‐fiber/. 13 Fingas, Jon, “Comcast sues Nashville over law that helps Google Fiber,” Engadget, last modified October 26, 2016, accessed January 5, 2017, https://www.engadget.com/2016/10/26/comcast‐sues‐nashville‐over‐google‐fiber‐law/.
Fiber Optic Master Plan | January 2017
15
Another key aspect of taking care of its infrastructure is to ensure that the City has access to an
on‐call fiber maintenance contractor that can perform network repairs on an emergency basis.
This contractor should be empowered and required to access the City’s fiber management
system—even if it is simply a shared spreadsheet—to record any network changes as close to
real time as possible. The City will benefit tremendously from taking an inventory of its records
and ensuring that anyone involved with the network going forward is accountable for this as well.
As we note in Section 7.4.3, the City can choose to hire new staff, engage existing staff, or
contract out for various responsibilities related to managing the network. Generally, the degree
to which a locality elects to maintain certain responsibilities internally or contract them out is
specific to the unique needs of the locality. That is, each locality has its own structure, hierarchy,
and collection of staff with various skill sets, and only the locality can determine which functions
it may be capable of managing internally versus which responsibilities are best delegated to
highly skilled contracted vendors. However, although the City may end up contracting out most
responsibilities, we encourage keeping documentation creation and management as an internal
function for either existing or new City staff. While there are many competent firms that can
perform GIS and other network documentation functions for the City, we believe that because
the City has a vested interest in the documentation’s integrity, fiber documentation and records
management is best performed internally.
1.7.1.3 Construct0.3MilesofFiberToConnectToInternetPointofPresenceWe recommend the City construct fiber to the Internet POP at 25070 O’Neil Avenue. This requires
approximately 0.3 miles of fiber construction at a cost of approximately $60,000. Establishing a
presence at the Internet POP allows dark fiber customers to access the services offered at the
POP. Services could include hosting servers and network electronics in a datacenter
environment, accessing multiple ISPs at rates lower than can be achieved at the customer’s
premises, and direct access to applications providers that may reside at the POP (such as voice
over Internet protocol, or VoIP, services providers).
With the connection to the Internet POP, ISPs may be interested in procuring dark fiber from the
City to serve businesses in the Industrial Corridor or along the fiber routes. The dark fiber services
may also be used by wireless ISPs to provide connectivity to telecommunications towers and
distributed antenna systems to provide backhaul for wireless service. Expanded wireless service
may be a way to meet some of the network services needs for businesses in the Industrial
Corridor.
1.7.1.4 DeployFTTPInaConcentratedAreaintheIndustrialCorridorThe City may want to deploy dark fiber to select areas of the Industrial Corridor. The City should
select a targeted area for deployment where it can reach the maximum number of customers
Fiber Optic Master Plan | January 2017
16
with the least amount of fiber construction. The City should take into consideration the following
factors when choosing such an area:
Density of businesses along specific routes;
Types of businesses within the area (i.e. technology firms typically require more
network services than manufacturers);
Feedback from businesses in the area on their existing needs;
Presence of multi‐tenant office buildings; and
Feasibility of fiber construction (i.e. minimal railway and interstate crossings, minimal
environmental impact, and presence of existing conduit and fiber).
Once the City has selected a target area, the FTTP network should be constructed to support a
full FTTP deployment in the future, which may require additional conduit and larger handholes
than currently necessary. To complete an FTTP network that will serve approximately 15 percent
of businesses, we estimate a cost of approximately $2.3 million.
Note that because our projection in Section 1.6.1 shows that it would cost approximately $5.4
million to deploy FTTP to the entire Industrial Corridor, the projected cost to serve only 15
percent of businesses may seem high. However, whether the City deploys FTTP to 15 percent or
100 percent of businesses in the Industrial Corridor, the backbone must be built out and fiber
routed to an aggregation point to support network core development.
It is also important to note that this targeted FTTP network will require the City to establish many
of the policies and procedures required to support a larger scale FTTP deployment. This approach
can help the City capture the cost to build and operate the network, and helps project the
potential cost to expand the network to the full Industrial Corridor and other areas.
1.7.1.5 Initiate a Procurement Process toCommunicate the City’s Plans to the PrivateSector
If the City pursues a dark fiber or a wholesale service model,
it may be prudent to issue a request for information (RFI) or
request for proposal (RFP) to signal to the private sector that
the City is willing to invest in infrastructure and is seeking a
partner. The process can also provide feedback on price point
a potential partner might consider (see Section 7.4).
An RFI process allows the City to cast a wide net and ask the
private sector for input on potential business models and partnership configurations. An RFP is
not as broad as an RFI, but allows the City to set the parameters of the business model it hopes
to pursue in a partnership, and define specific requirements it will have of its partner(s). If the
Our analysis indicates
that it would cost
approximately $2.3
million to serve
approximately 15
percent of businesses
in the Industrial
Corridor.
Fiber Optic Master Plan | January 2017
17
City can identify its preferred business model and can develop a framework of what it hopes to
accomplish through a partnership, the terms defined in an RFP and a potential partner’s response
can serve as the foundation for an eventual partnership contract.
If the City opts to pursue a dark fiber model, the procurement process can describe the type of
investment the City is seeking from a private provider, the exact service area the City’s dark fiber
deployment will target, and thoroughly describe the City’s vision. This can lay out very clearly the
City’s expectations of a partner, and enable potential partners to evaluate the feasibility of
partnering with the City.
For a wholesale service model approach, the City may want to start with a brief questionnaire
aimed at known ISPs in the region before it moves forward with a full procurement process. This
may identify providers that would be willing to purchase wholesale service from the City, and
give the City a sense of what type of potential revenue it may be able to expect from a
partnership.
1.7.1.6 OfferDarkFiberStrandsforLeasetoSelectHigh‐EndCustomersOne of our key recommendations is that the City continue to expand its fiber and conduit network
as planned, specifically through the Industrial Corridor. The expanded fiber and conduit system
will allow the City to begin offering dark fiber services to high‐end customers. As customers
purchase dark fiber services, the City will construct additional fiber and conduit to the
customers—thus expanding the footprint of the existing network.
Dark fiber services include the City offering fiber optic strands between locations without active
electronics. The customer would be responsible for the electronics to activate, or “light,” the
fiber. In this scenario, the City would only be responsible for maintaining and repairing the fiber.
This approach minimizes the City staffing required, as the City would be responsible only for the
network electronics for the City network. Fiber maintenance and repair can be contracted to a
third party, and most of the costs associated with maintaining and repairing the fiber would
already be required to run the City’s network.
1.8 ExpandingFTTPtoResidentialCustomersAddsConsiderableCostThe City aims to eventually consider deploying residential FTTP in addition to serving the
Industrial Corridor, and potentially other business customer locations in Hayward. Considering
this desire to serve residential users, it is important to understand the potential costs associated
with FTTP deployment, and particularly with providing retail service to residential users.
We conducted a high‐level analysis of the cost per passing in various states in the U.S., including
California, Colorado, Indiana, Kentucky, Michigan, Washington, and Wisconsin. The “per passing
cost” is the approximate cost to pass a premises with fiber optics. This cost does not include the
cost of the drop cable or the CPEs; it is simply the cost to run fiber in front of a location. Our
Fiber Optic Master Plan | January 2017
18
analysis showed an average per‐passing cost of just under $1,400, based on the per‐passing costs
in the several communities we evaluated.
It is important to note the per‐passing costs ranged from $1,100 to over $1,600; as such, we
encourage localities to use caution when examining costs estimates from other communities. It
is important to note the per‐passing costs ranged from $1,100 to over $1,600; as such, we
encourage localities to use caution when examining cost estimates from other communities.
Using this cost range and assuming there are 46,000 residential passings in Hayward results in a
fiber per‐passing cost estimate of $50.6 million to $73.6 million. Actual costs will depend on
housing densities, construction types, traffic control requirements, make‐ready, and other
factors.
Still, even with this caveat, the City can begin to understand through other communities’
experience the kinds of costs it may incur in an FTTP deployment that includes residential
customers. Figure 2, below, shows the range of costs that we considered from various markets
throughout the U.S. Note that these examples point to a scenario that considers only the FTTP
outside plant (OSP), or the fiber and conduit associated with the network. These costs do not
consider the cost of network electronics necessary to “light” the network. Additionally, these do
not include the cost for installing the customer drop cable, which is the fiber extension that
connects a customer’s premises to the fiber network.
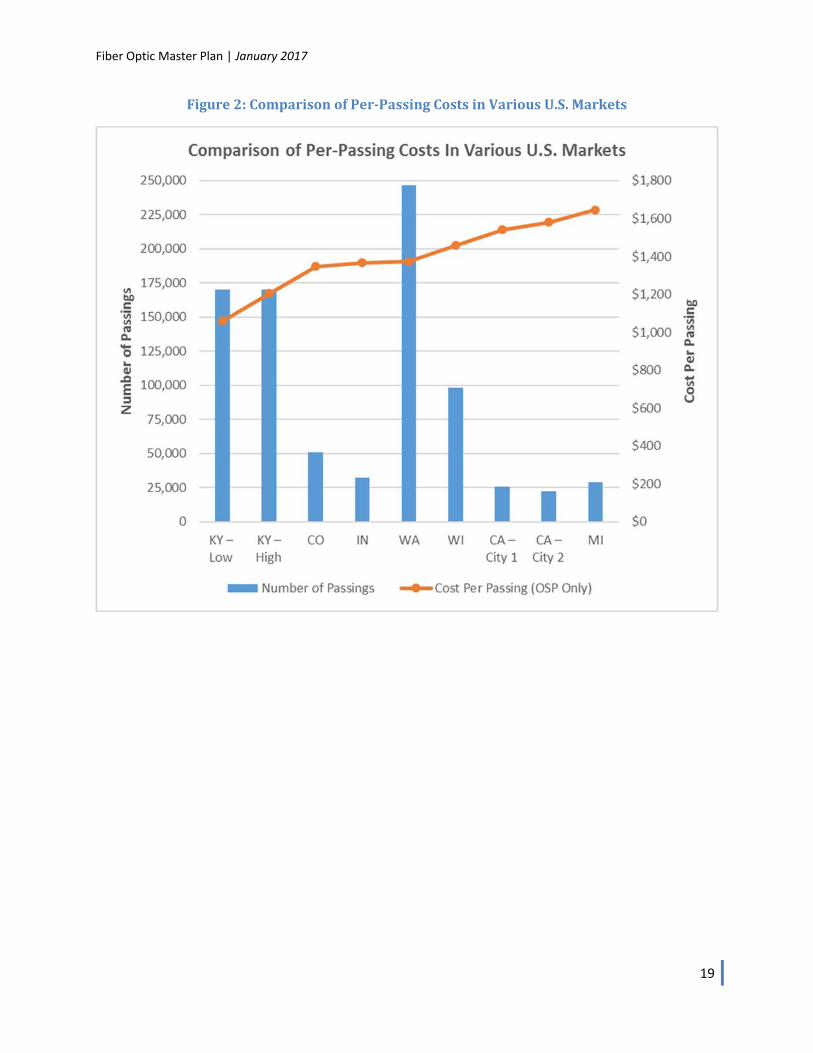
Fiber Optic Master Plan | January 2017
19
Figure2:ComparisonofPer‐PassingCostsinVariousU.S.Markets
Fiber Optic Master Plan | January 2017
20
2 BroadbandNeedsandTrendsThe need for high‐speed broadband is increasingly evident as consumers become more educated
on the merits of ultra‐fast connectivity. Businesses of all sizes in every industry are finding that
their ability to compete successfully depends more than ever on their access to a broadband
connection. From manufacturing organizations that rely on high‐speed connectivity for
automation,14 to small business owners that need broadband to complete customer transactions
and provide WiFi to patrons, businesses’ demand is steadily growing.
Further, the workforce is becoming increasingly mobile, and businesses that wish to effectively
compete must be aware and accommodating of this reality. Cloud computing and reliable
wireless broadband services are two potential areas of significant need for business customers,
and examples of accommodating a mobile workforce. Having employees who are mobile and can
work from anywhere potentially reduces overhead costs and enables companies to be nimble.
As reliable wireless service becomes an integral component of effectively doing business,
companies find this is an area where they need significant improvement in dependable
connectivity.
Cloud computing—which refers to information technology services, such as software, virtualized
computing environments, and storage, available “in the cloud” over a user’s Internet
connection—is also changing the way businesses operate. The business drivers behind cloud
computing are ease of use and, in theory, lower operating costs. For example, business owners
understand that adding a new employee to their growing business requires ample resources. This
includes purchasing a computer, installing necessary software, and ongoing software license
management. Also, local server and application administration requires either dedicated staff or
contracted support.
As an alternative, cloud services eliminate the need to maintain local server infrastructure and
software, and instead allow the user to log into a subscription‐based cloud service through a web‐
browser or software client. The cloud is essentially a shift of workload from local computers in
the network to servers managed by a provider that make up the cloud. This, in turn, decreases
the end user’s administrative burden for information technology (IT) services.
Even where businesses’ needs may be mostly met, many communities have areas that lack
reasonably priced, high‐speed options for residential customers. Because of this, a pervasive
challenge that impacts local businesses is the area's ability to attract and recruit top professional
talent. The availability of broadband service varies widely throughout the U.S., and the small‐ to
14 Chopra, Aneesh, “Insourcing American Jobs: The Importance of “Smart” Manufacturing, Broadband, and IT,” The White House, last modified January 14, 2012, accessed September 15, 2016, https://www.whitehouse.gov/blog/2012/01/14/insourcing‐american‐jobs‐importance‐smart‐manufacturing‐broadband‐and‐it.
Fiber Optic Master Plan | January 2017
21
medium‐size business market tends to lack a range of options to meet these users’ needs. Cable
and digital subscriber line (DSL) service is typically available to businesses, and options for higher‐
end services like Metro Ethernet are often available in urban areas. But many communities lack
a mid‐level service that offers more capacity and reliability than residential‐grade cable or DSL,
but is less costly than Metro Ethernet and similar dedicated services targeted at large
organizations.
This gap represents a market niche that we believe the City may be able to fill by deploying FTTP
that can support fiber‐based business connectivity. Even if the City does not directly offer
services, it can fill broadband availability gaps by enabling one or more private providers to offer
services over a robust fiber optic network.
2.1 TheCityIsServedSimilarlytoOtherMarkets,butThereAreStillGapsinService
Many of the City’s services—especially the lowest‐priced offerings—provide download speeds
far below the Federal Communications Commission (FCC)’s updated definition of broadband of
at least 25 Mbps download speed.15 Further, these tiers may even be “up to,” services, which
means that the actual speed a customer experiences is less than the advertised amount. For
example, if a customer subscribes to an “up to” 5 Mbps service, they may experience speeds as
low as 1 Mbps or even less. Given the FCC’s updated definition, these services cannot technically
be classified as broadband.
In some cases, the available service tiers that would meet the minimum definition of broadband
are priced much higher than many of the City’s consumers may be able to afford. Unfortunately,
this is not unique to the City. On the contrary, our analysis shows that the available speed tiers
and price points in the City are comparable to other markets throughout the U.S. In fact, some
of the City’s existing available service offerings are priced lower for higher service tiers than in
other markets. Further, some businesses in the Industrial Corridor are limited to only DSL service.
As the City considers how to pursue a fiber deployment, it may want to focus on gaps in
affordable mid‐range service offerings. Some subscribers may opt to purchase low‐tier service
because it meets their needs, but the current market does not adequately meet the needs of
subscribers that desire affordable mid‐range service. This often applies to small‐ and medium‐
sized businesses that have limited funds to allocate to telecommunications spending, but that
require fast, reliable service to conduct their day‐to‐day business.
15 “2015 Broadband Progress Report,” Federal Communications Commission, last modified February 4, 2015, accessed September 1, 2016, https://www.fcc.gov/reports‐research/reports/broadband‐progress‐reports/2015‐broadband‐progress‐report.
Fiber Optic Master Plan | January 2017
22
These users, and potentially others, likely desire more robust and affordable service, as well as
better upload speeds. The upload speeds available in the City today are either minimal (as low as
1.5 Mbps in some cases), or are priced very high ($249.95 per month for 20 Mbps upload for
Comcast’s small business service). Though upload speeds may not be as important in some
markets, the need for improved upload speeds in a city like Hayward is especially prominent,
given its location and large business sector.
If the City can directly or in a partnership focus on filling the gap for mid‐range services, it may
find that this eases the process of introducing a new broadband offering into the market.
Competing directly with existing providers to offer roughly the same service that is available
today will not set the City or its partner(s) apart in any way. Our analysis shows that the City and
the other markets we evaluated seem “well‐served,” in that there are several providers offering
service in the existing market. However, a new offering that is sensitive to availability and supply
challenges can address service gaps.
Fiber Optic Master Plan | January 2017
23
3 NeedsAssessmentThe City has a range of broadband user groups and stakeholders, and is especially interested in
understanding local businesses’ connectivity needs. An important part of understanding the
potential success of a municipal FTTP deployment is to determine the perceived need for better
connectivity options within the community, and willingness to switch to a different service.
To assist in understanding the demand for fiber connectivity and related services, CTC conducted
an online survey of Hayward businesses on behalf of the City. Additionally, we compared
available services in Hayward to those in select communities, particularly those that identify as
“Gigabit Cities.” The analysis in this section helps illustrate with broad strokes the potential desire
for fiber‐based connectivity in the City.
3.1 BusinessSurveyResultsThe business survey was designed to collect a range of data to understand current use of Internet and data services, satisfaction with current service providers, and interest in higher-speed Internet and data service offerings. While the survey should not be considered a truly representative
sample of all Hayward businesses, it offers some insight into a potential customer base and
market in the City, and provides the City with a starting point to understand the service attributes
where it may need to focus its efforts.
In general, the survey shows that:
Most of the respondents represent small‐ to medium‐size businesses;
Most respondents are not significantly unhappy with most attributes of their current
service;
More than 40 percent of respondents believe the City should have some role in enhancing
broadband connectivity options for businesses in Hayward; and
Approximately 75 percent of respondents would be very or somewhat willing to switch
to a 1 Gbps service for $75 per month, and the willingness steadily drops as the service
prices increases.
The full survey results are described in Appendix G: Online Business Survey Results, attached to
this Report.
3.2 ComparisonofServicesinHaywardtoGigabitCommunitiesAs is typical of most cities of similar size in the U.S., the City of Hayward has more than a dozen
carriers offering residential, small business, enterprise‐grade, and carrier services.
We identified 13 service providers in the Hayward area that offer fiber‐based enterprise services,
from dark fiber connectivity to data transport services, with speeds that range from 1 Megabits
Fiber Optic Master Plan | January 2017
24
per second (Mbps) to 100 Gigabits per second (Gbps). The carriers that provide enterprise‐grade
lit services in the Hayward area are:
Access One
AT&T
Comcast
EarthLink
Integra
Level 3
Line Systems
MegaPath
Sonic
TelePacific
Windstream
XO Communications
Zayo
Four service providers in the City have dark fiber availability:
Integra
Level 3
Line Systems
Zayo
With respect to the availability and pricing of enterprise‐grade services, we have seen that the
offerings in Hayward are on par with services in regions of similar size and urbanity. The City has
a good mix of facilities‐based and non‐facilities‐based providers, with all the major carriers having
an established presence in the City. Prices for services are dependent on bandwidth, location,
and network configuration; whether the service is protected or unprotected; whether the service
is managed; and whether the customer has a service‐level agreement (SLA).16 The pricing for
enterprise grade services have continued to drop over the last several years across the country
and we expect that trend to continue in Hayward.
Residential and small business customers in the Hayward area have access to a range of services,
though individual service options are dependent on location. The main ISPs in Hayward are AT&T,
Comcast, and Sonic. Of these providers, Comcast offers fiber‐based internet services up to 2
Gbps. There are also wireless ISPs (WISPs), such as Etheric Networks and Cruzio, and satellite‐
based services available in the City.
16 An agreement between a provider and a customer that outlines certain parameters about the service an end user can expect; for example, an SLA may indicate that, in the event of an outage, the provider has a limited amount of time to restore service.
Fiber Optic Master Plan | January 2017
25
The key difference that we see between the residential and small business services in the City in
comparison to other communities that have municipal broadband or fiber‐to‐the‐home (FTTH)
by a provider like Google Fiber is the ubiquity of service. Though Comcast offers gigabit services
in Hayward, the availability of the service would vary based on location and most likely only if
there was a strong business case to warrant an expansion of service to a particular location.
With regard to pricing, we have seen communities with a municipality backed service offering
price gigabit services from $50 (in Longmont, Colorado), to $100 (in Westminster, Maryland) per
month, with low installation costs.17 Google Fiber offers its residential 1 Gbps services at $70 per
month with waived installation costs with a 1‐year contract (typically $100).18 In comparison, the
service provided by Comcast in Hayward is for the 2 Gbps speed at $299.95 per month and
requires a two‐year contract, plus $1,000 in upfront installation and activation fees.
We have provided an assessment of the broadband service available in the City in Appendix B.
17 In such cases, the municipality has made a substantial capital and/or operating investment in the network, which potentially enables lower service prices than scenarios of purely private investment. 18 https://fiber.google.com/cities/kansascity/plans/, accessed June 2016
Fiber Optic Master Plan | January 2017
26
4 OperationalandBusinessModelOptionsThere are several business models that the City can consider for its fiber deployment. Overall, we
believe that the City’s key focus should be to deploy fiber in at least select areas of the
community, such as the Industrial Corridor. We believe that the City is most likely to be successful
if it focuses on infrastructure, and works to lower barriers to market entry for the private sector.
By doing this, the City can encourage competition and increase the range of service options
available to consumers, but it does not have to take the enormous risk of becoming a service
provider and competing with established providers.
The dark fiber model will have the least risk for the City because it does not entail operational
unknowns like a retail service model. Managing agreements with and providing service to end
users is generally expensive and unpredictable, and—unlike the dark fiber model—is not an
approach for which the City is already at least partially equipped. Even a wholesale service model
carries more risk than a dark fiber model because there are additional costs and uncertainties
associated with maintaining network electronics.
A dark fiber model is essentially a public works model, in that fiber is simply infrastructure, which
the City is already accustomed to managing. This approach allows the City to play to its strengths,
and carefully navigate around its potential vulnerabilities (e.g., not having the expertise to
successfully market retail service).
If the City determines that a dark fiber model does not appropriately achieve its goals in the short
term, it can opt to pursue a retail service model, where the City becomes the provider and offers
services directly to end users. This model carries greater risk for the City because of the
marketing, advertising, competition, and customer service components. While it is challenging
for a municipality to become a retail service provider, it is not impossible, and the City can choose
this path. We recommend this model only if the City finds that it is for some reason unable to
pursue a dark fiber model, or if it is unable to attract a partner to offer services over a City‐owned
network.
A wholesale service offering is a “middle ground” between a dark fiber approach and the City
becoming a retail service provider. In a wholesale service offering, the City would deploy the FTTP
network, and would add network electronics to “light” the fiber. It would then offer “lit services”
over the network to one or more ISPs. This model is attractive in that it potentially enables
numerous ISPs to offer services. In a dark fiber model, on the other hand, one provider may
control the strands to a location and may or may not offer lit services to a competing provider.
The wholesale service offering could potentially help the City achieve open access goals it may
have.
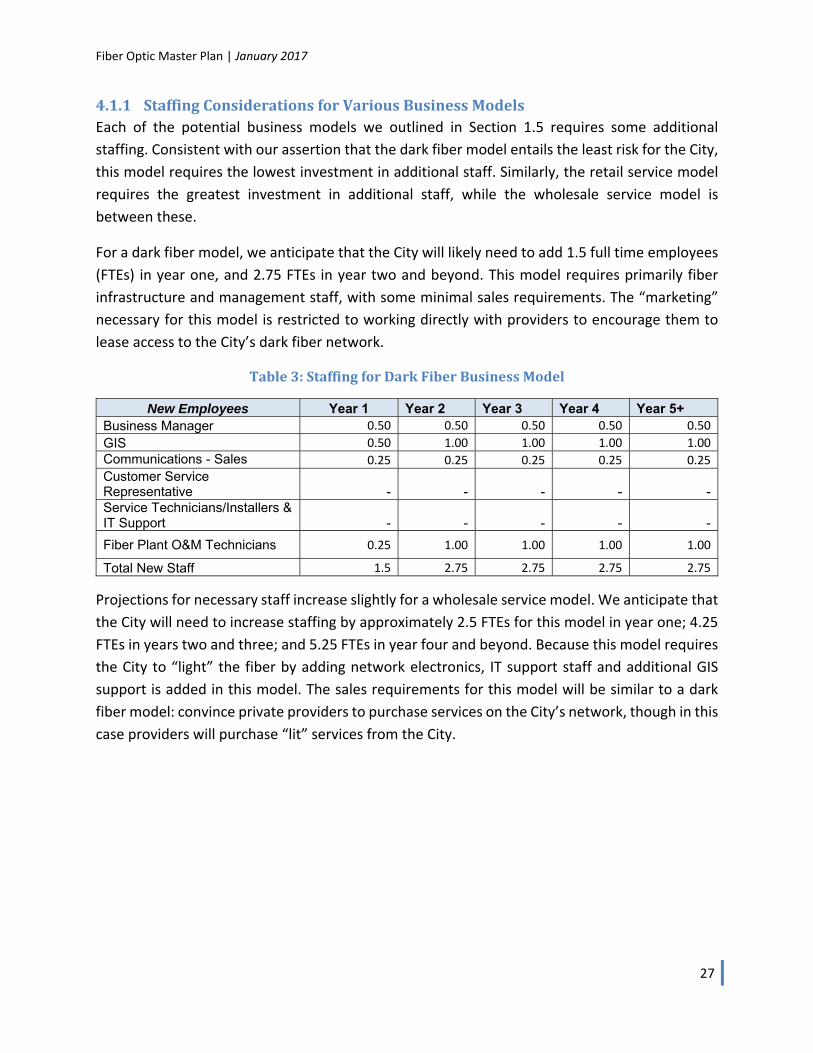
Fiber Optic Master Plan | January 2017
27
4.1.1 StaffingConsiderationsforVariousBusinessModelsEach of the potential business models we outlined in Section 1.5 requires some additional
staffing. Consistent with our assertion that the dark fiber model entails the least risk for the City,
this model requires the lowest investment in additional staff. Similarly, the retail service model
requires the greatest investment in additional staff, while the wholesale service model is
between these.
For a dark fiber model, we anticipate that the City will likely need to add 1.5 full time employees
(FTEs) in year one, and 2.75 FTEs in year two and beyond. This model requires primarily fiber
infrastructure and management staff, with some minimal sales requirements. The “marketing”
necessary for this model is restricted to working directly with providers to encourage them to
lease access to the City’s dark fiber network.
Table3:StaffingforDarkFiberBusinessModel
New Employees Year 1 Year 2 Year 3 Year 4 Year 5+Business Manager 0.50 0.50 0.50 0.50 0.50
GIS 0.50 1.00 1.00 1.00 1.00 Communications - Sales 0.25 0.25 0.25 0.25 0.25 Customer Service Representative - - - - -Service Technicians/Installers & IT Support - - - - -
Fiber Plant O&M Technicians 0.25 1.00 1.00 1.00 1.00
Total New Staff 1.5 2.75 2.75 2.75 2.75
Projections for necessary staff increase slightly for a wholesale service model. We anticipate that
the City will need to increase staffing by approximately 2.5 FTEs for this model in year one; 4.25
FTEs in years two and three; and 5.25 FTEs in year four and beyond. Because this model requires
the City to “light” the fiber by adding network electronics, IT support staff and additional GIS
support is added in this model. The sales requirements for this model will be similar to a dark
fiber model: convince private providers to purchase services on the City’s network, though in this
case providers will purchase “lit” services from the City.
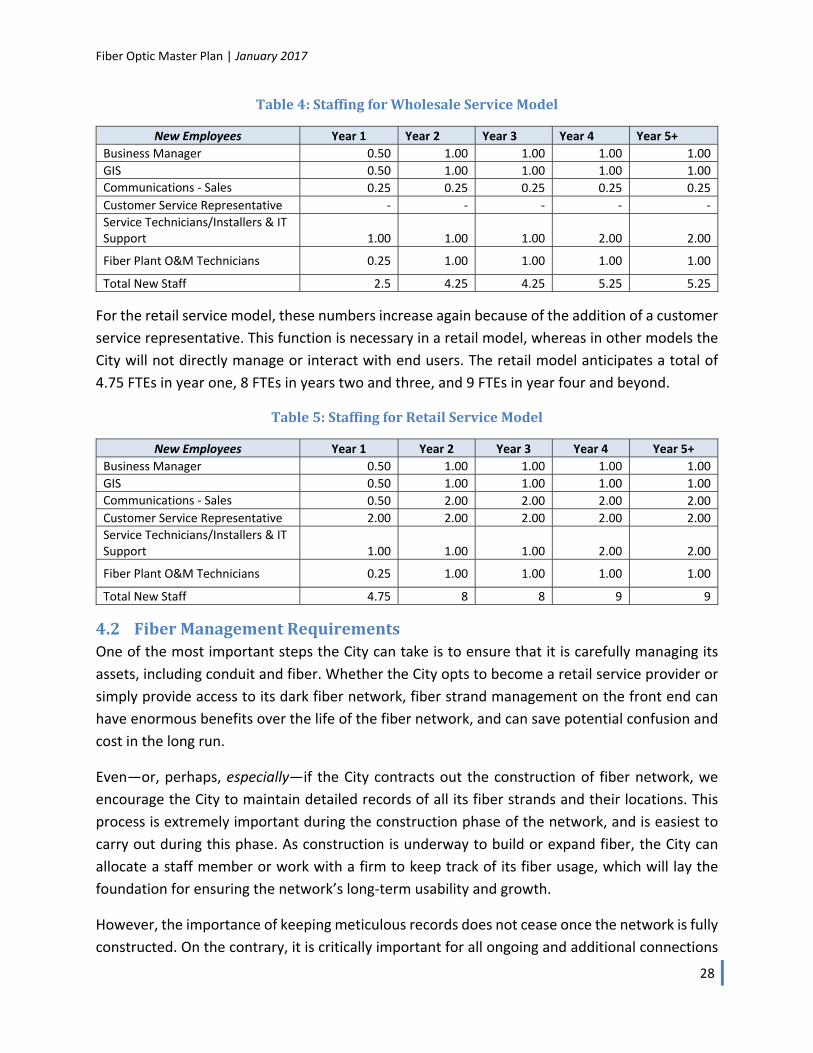
Fiber Optic Master Plan | January 2017
28
Table4:StaffingforWholesaleServiceModel
New Employees Year 1 Year 2 Year 3 Year 4 Year 5+
Business Manager 0.50 1.00 1.00 1.00 1.00
GIS 0.50 1.00 1.00 1.00 1.00
Communications ‐ Sales 0.25 0.25 0.25 0.25 0.25
Customer Service Representative ‐ ‐ ‐ ‐ ‐
Service Technicians/Installers & IT Support 1.00 1.00 1.00 2.00 2.00
Fiber Plant O&M Technicians 0.25 1.00 1.00 1.00 1.00
Total New Staff 2.5 4.25 4.25 5.25 5.25
For the retail service model, these numbers increase again because of the addition of a customer
service representative. This function is necessary in a retail model, whereas in other models the
City will not directly manage or interact with end users. The retail model anticipates a total of
4.75 FTEs in year one, 8 FTEs in years two and three, and 9 FTEs in year four and beyond.
Table5:StaffingforRetailServiceModel
New Employees Year 1 Year 2 Year 3 Year 4 Year 5+
Business Manager 0.50 1.00 1.00 1.00 1.00
GIS 0.50 1.00 1.00 1.00 1.00
Communications ‐ Sales 0.50 2.00 2.00 2.00 2.00
Customer Service Representative 2.00 2.00 2.00 2.00 2.00
Service Technicians/Installers & IT Support 1.00 1.00 1.00 2.00 2.00
Fiber Plant O&M Technicians 0.25 1.00 1.00 1.00 1.00
Total New Staff 4.75 8 8 9 9
4.2 FiberManagementRequirementsOne of the most important steps the City can take is to ensure that it is carefully managing its
assets, including conduit and fiber. Whether the City opts to become a retail service provider or
simply provide access to its dark fiber network, fiber strand management on the front end can
have enormous benefits over the life of the fiber network, and can save potential confusion and
cost in the long run.
Even—or, perhaps, especially—if the City contracts out the construction of fiber network, we
encourage the City to maintain detailed records of all its fiber strands and their locations. This
process is extremely important during the construction phase of the network, and is easiest to
carry out during this phase. As construction is underway to build or expand fiber, the City can
allocate a staff member or work with a firm to keep track of its fiber usage, which will lay the
foundation for ensuring the network’s long‐term usability and growth.
However, the importance of keeping meticulous records does not cease once the network is fully
constructed. On the contrary, it is critically important for all ongoing and additional connections
Fiber Optic Master Plan | January 2017
29
made on the network to be documented. Updates should be made to “as‐built” and strand
management documentation in real time to avoid making mistakes later, misremembering
strand allocations, or simply forgetting important items altogether.
Documenting the network’s fibers and strand usage is crucial, and making sure that City staff has
unrestricted access to its strand management tools is equally important. Even if the City works
with an outside firm to manage this process, we believe that it is a worthwhile investment to
appoint at least one staff person who will become knowledgeable about the location of strands
on the City’s network. Further, using an intuitive and straightforward system and/or software is
also key; this will help guard against such critical knowledge being inaccessible to future iterations
of City staff and leadership.
4.3 DigOnceConsiderationsWe recommend that in the coming months, the City consider modifying its ROW ordinance to
provide the City with the option of obtaining conduit on routes where utilities are performing
excavation. This type of “Dig Once” policy would require any excavation plans fitting specified
criteria to include municipal use conduit or fiber, unless the City opts out of the excavation
project. This would require the installation of City communications infrastructure in excavation
projects where the City determines that it is both financially feasible and consistent with the
municipality’s long‐term goals to develop the communications infrastructure.
Such a policy can reduce the cost of the conduit to the City by 25 percent to 75 percent relative
to the cost of a standalone construction project if it installs or has conduit installed in
coordination with other excavation. A Dig Once approach can also reduce the impact on ROW
and inconvenience to the public.
4.3.1 TheCaseforDigOncePoliciesThe construction of fiber optic communications cables is a costly, complex, and time‐consuming
process. The high cost of construction is a barrier to entry for potential broadband
communications providers. In addition, available space is diminishing in the public ROW.
Moreover, cutting roads and sidewalks substantially reduces the lifetime and performance of
those surfaces.
Fiber Optic Master Plan | January 2017
30
Accordingly, encouraging or requiring simultaneous construction and co‐location of facilities
in the public ROW will reduce the long‐term cost of building communications facilities. This is
because there are significant economies of scale through:
1. Coordination of construction with road construction and other disruptive activities in
the public ROW.
2. Construction of spare conduit capacity where multiple service providers or entities
may require infrastructure.
The reason that these economies are available is primarily because fiber optic cables and
installation materials alone are relatively inexpensive, often contributing to less than one‐quarter
of the total cost of new construction. While material costs typically fall well below $40,000 per
mile (even for large cables containing hundreds of fiber strands), labor, permitting, and
engineering costs commonly drive the total price toward $200,000 per mile if conducted as a
stand‐alone project.
Moreover, as the ROW becomes more crowded with communications infrastructure and other
utilities, the cost of new construction can grow rapidly. In general, however, it is in the best
interests of both public and private entities for the public sector to identify construction
collaboration opportunities that share the burden of expensive and duplicative labor‐related
costs and efficiently use physical space in the ROW.
If fiber construction is coordinated with a major road or utility project that is already disrupting
the ROW in a rural area, the cost of constructing the fiber, communications conduit, and other
materials can range from $10,000 per mile up. However, if fiber construction is completed as part
of a separate stand‐alone project, the cost of constructing fiber and communications conduit can
range from $95,000 to $200,000 per mile and even higher in complex urban environments.
There are numerous methods for constructing fiber optic infrastructure. Underground
construction using protective conduits generally provides the most scalable, flexible, and durable
method for developing long‐term communications infrastructure, but is also typically more
expensive than aerial construction methods requiring attachments to utility poles. Underground
construction can be preferable despite the cost because of the limit in the quantity of cables and
attachments that can be placed on existing utility poles in more crowded areas, and because
aerial construction is more exposed and vulnerable to outside conditions.
Banks of conduits constructed simultaneously or large conduits segmented with innerduct,
provide multiple pathways for the installation of multiple fiber optic cables located in close
proximity, with the ability to remove, add, or replace fiber optic cables without disturbing
neighboring cables.
Fiber Optic Master Plan | January 2017
31
Conversely, multiple conduits installed at different times must be physically spaced, often by
several feet, to prevent damage to one while installing the next. Once the ROW becomes
crowded, often the choices of construction methods are reduced, leaving only less desirable
methods and more costly locations for construction of additional infrastructure.
Some of the key savings achieved through coordinated construction efforts include:
Incremental labor and material costs, through reduced crew mobilization expenses and
larger bulk material purchases
Trenching or boring costs, particularly when coordination enables lower‐cost methods
(e.g., trenching as opposed to boring) or allows multiple entities to share a common
trench or bore for their independent purposes
Traffic control and safety personnel costs, particularly when constructing along roadways
requiring lane closures
Engineering and survey costs associated with locating existing utilities and specifying the
placement of new facilities
Engineering and survey costs associated with environmental impact studies and approvals
Lease fees for access to private easements, such as those owned by electric utilities
Railroad crossing permit fees and engineering
Restoration to the ROW or roadway, particularly in conjunction with roadway
improvements
Bridge crossing permit fees and engineering
4.3.2 CoordinatingConduitConstructionwithOtherUtilityProjectsReducesCostsWhere other types of construction are occurring within or along the ROW, such as road
construction or resurfacing, roadway widening, sidewalk repairs, bridge construction, and water
or gas main installation, there is an opportunity to place telecommunications infrastructure at an
overall reduced cost and with reduced disruption to public ROW.
4.3.3 StandardSpecificationThe challenge in developing a standard specification for a Dig Once project is to incorporate the
requirements of known and unknown users, and to provide sufficient capacity and capability
without excessive costs.
We considered the following factors in developing a conduit specification:
1. Capacity—sufficient conduit needs to be installed, and that conduit needs to have
sufficient internal diameter, to accommodate future users’ cables and to be segmented
to enable conduit to be shared or cables added at a future date
Fiber Optic Master Plan | January 2017
32
2. Segmentation—users need to have the appropriate level of separation from each other
for commercial, security, or operational reasons
3. Access—vaults and handholes need to be placed to provide access to conduit and the
ability to pull fiber. Vaults need to be spaced to minimize the cost of extending conduit to
buildings and other facilities that may be served by fiber
4. Costs—materials beyond those that are likely to be needed will add cost, as will the
incremental labor to construct them. Beyond a certain point, trenches need to be
widened or deepened to accommodate conduit
5. Robustness—the materials, construction standards, and placement need to reasonably
protect the users’ fiber, and not unduly complicate maintenance and repairs
6. Architecture—sweeps, bend radius, and vault sizes need to be appropriate for all
potential sizes of fiber
We recommend further discussions with private carriers to better develop a specification. It may
be appropriate to have a different specification for different projects. Based on our knowledge
of similar efforts in other cities, and our analysis, we believe the following standardized approach
is suitable for major corridors and can be modified as discussions continue with excavators in the
rights‐of‐way:
Four two‐inch conduit, minimum SDR 11 High‐density polyethylene (HDPE), each of a
separate color or unique striping to simplify identification of conduits within vaults and
between vaults, in the event conduit must be accessed or repaired at intermediate
points. Conduit count can be reduced if the Industrial Corridor is assessed not to justify
the capacity.
Composite anti‐theft vaults having dimensions of 30” x 48” x 36” (W x L x D), placed in the
sidewalk or available green space within the city or municipality ROW, as close to the curb
or gutter as possible.
Vaults spaced at intervals of 600 feet or less, typically at the intersection of a city or
municipality block.
Sweeping conduit bends with a minimum radius of 36 inches to allow cable to be pulled
without exceeding pull‐tension thresholds when placing high‐count fiber cables (e.g., 864‐
count).
Conduit placed in the same trench directly above the excavator’s infrastructure or, where
this is not possible, placed with minimum horizontal offset, to minimize cost.
It is important to note that the proposed approach is designed to create consistency and
predictability in costs and deployment and is a necessary compromise among the potential users.
If an excavation project has a long‐time horizon and sufficient budget, it is possible to customize
Fiber Optic Master Plan | January 2017
33
the Dig Once build, potentially adding conduit or adding vaults at particular locations. This plan
provides a baseline approach.
The approach is a compromise among different types of users of conduit constructed under dig
once. Some users might prefer larger conduit for consistency with earlier builds. Others sought a
larger count of smaller conduit, to provide more flexibility and the capability for more providers
to participate with smaller cable counts.
Two‐inch conduit has become a standard size for a wide range of construction projects, and can
support the widest range of use cases. A single two‐inch conduit can accommodate a range of
multi‐cable configurations, while retaining recommended fill ratios, allowing a single user to
serve its backbone and “lateral”/access cable requirements with a single, dedicated conduit. A
few example cable configurations supported by a single two‐inch conduit, which are not
supported by smaller conduit, include:
Two medium backbone cables (e.g., 144‐strand to 288‐strand cables) and one smaller
“feeder” cable (e.g., 24‐strand cable);
Large backbone cable (e.g., 864‐strand) and two or more smaller feeder cables; or
Three medium backbone cables.
Compared to placing fewer, larger conduits segmented with innerduct, this approach provides
greater opportunity for individual conduit to be intercepted and routed for future vault
installation by a particular user. Additionally, two‐inch conduit is substantially cheaper to install
and physically more flexible than larger varieties, offering more options to route around existing
utilities and other obstructions. Placing four conduit will provide a standard allotment of one or
two conduit for State or municipality use and provide capacity for other use and for spares.
We recommend SDR 11 HDPE in all cases except where conduit is exposed to the elements (for
example, as a riser to building entry), or under extreme levels of pressure (such as under a train
or trolley track). SDR 11 HDPE designs will generally support standard highway and railway loads
with less than 1 percent deflection when buried with two feet of cover.
Fiber Optic Master Plan | January 2017
34
5 ProposedFiberDesign
5.1 ConstructionMethodologyOur analysis assumes underground construction will consist primarily of horizontal, directional
drilling to minimize ROW impact and to provide greater flexibility to navigate around other
utilities. There are a variety of methods for underground construction, including plowing,
trenching, directional boring, and microtrenching.
Plowing is generally the cheapest construction method, and is performed in unpaved areas where
little subsurface rock is present, and the fiber route maintains a straight path (e.g., along a
highway). The plowing machine pushes away dirt, inserts conduit and covers the conduit with
the backfill.
Trenching is similar to plowing in that a narrow hole is dug and conduit is laid and the bottom of the trench, and is then covered with backfill. Unlike plowing, trenching can be performed in most situations but may not be cost‐effective when expensive restoration is required to return the streets or rights‐of‐way to their original (i.e., pre‐installation) condition. Directional Boring is a process in which conduit is placed by drilling horizontally underground without disturbing the surface. The boring machine pushes a long drill that displaces the dirt underground so that a conduit can be installed. The direction and depth of the directional bore can be altered to navigate around other existing utilities. Directional boring is ideal in situations where trenching is not feasible, such as stream and railroad crossings. Microtrenching uses a specialized saw blade to cut a small trench about a foot deep into the road or sidewalk subsurface. Very tiny conduit is inserted and covered with backfill, and the cut or “microtrench” is then sealed. Specialized fiber is then blown through the conduit system. Microtrenching is best suited for areas where the cost to perform surface restoration is high and roadway construction is not anticipated. Underground construction costs are subject to uncertainty related to utilities congestion in the
public rights‐of‐way, and the prevalence of subsurface hard rock—neither of which can be fully
mitigated without physical excavation and/or testing. Surface restoration requirements can also
greatly impact the cost of underground construction. For, example unpaved land is far less
expensive to restore than cobblestone streets.
This analysis estimated costs for underground infrastructure placement using available unit‐cost
data for materials and estimates on the labor costs for placing, pulling, and boring fiber based on
construction in comparable markets.
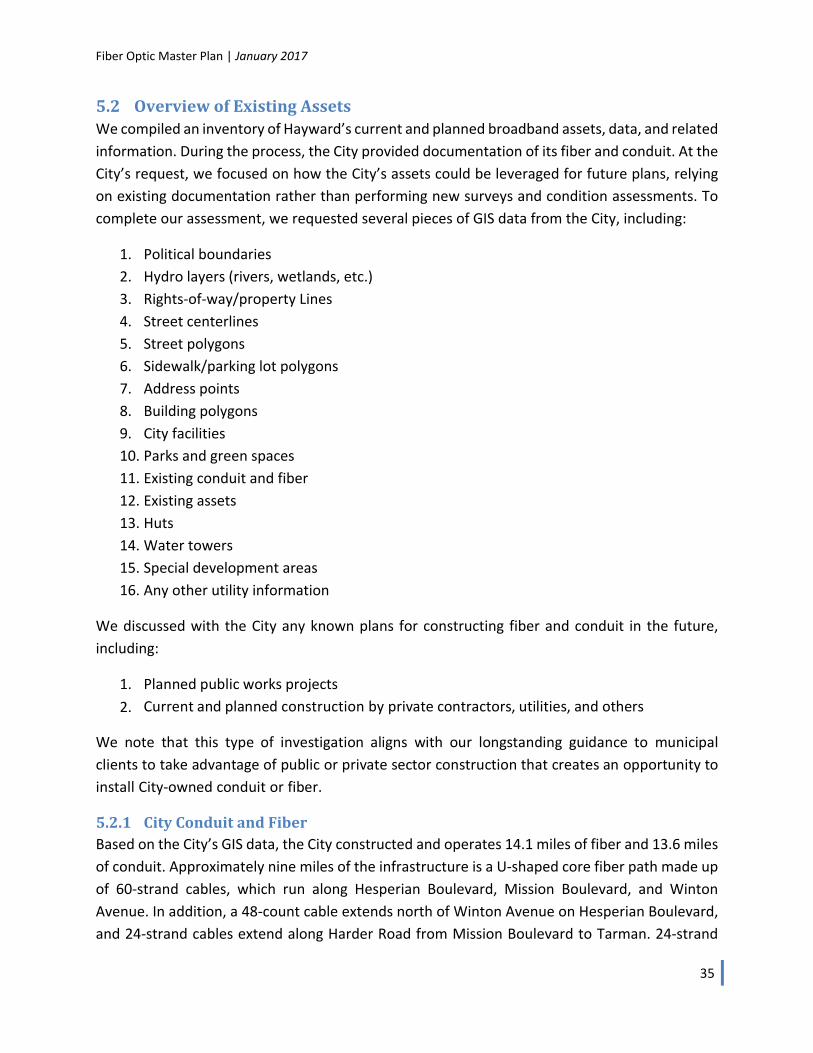
Fiber Optic Master Plan | January 2017
35
5.2 OverviewofExistingAssetsWe compiled an inventory of Hayward’s current and planned broadband assets, data, and related
information. During the process, the City provided documentation of its fiber and conduit. At the
City’s request, we focused on how the City’s assets could be leveraged for future plans, relying
on existing documentation rather than performing new surveys and condition assessments. To
complete our assessment, we requested several pieces of GIS data from the City, including:
1. Political boundaries
2. Hydro layers (rivers, wetlands, etc.)
3. Rights‐of‐way/property Lines
4. Street centerlines
5. Street polygons
6. Sidewalk/parking lot polygons
7. Address points
8. Building polygons
9. City facilities
10. Parks and green spaces
11. Existing conduit and fiber
12. Existing assets
13. Huts
14. Water towers
15. Special development areas
16. Any other utility information
We discussed with the City any known plans for constructing fiber and conduit in the future,
including:
1. Planned public works projects
2. Current and planned construction by private contractors, utilities, and others
We note that this type of investigation aligns with our longstanding guidance to municipal
clients to take advantage of public or private sector construction that creates an opportunity to
install City‐owned conduit or fiber.
5.2.1 CityConduitandFiberBased on the City’s GIS data, the City constructed and operates 14.1 miles of fiber and 13.6 miles
of conduit. Approximately nine miles of the infrastructure is a U‐shaped core fiber path made up
of 60‐strand cables, which run along Hesperian Boulevard, Mission Boulevard, and Winton
Avenue. In addition, a 48‐count cable extends north of Winton Avenue on Hesperian Boulevard,
and 24‐strand cables extend along Harder Road from Mission Boulevard to Tarman. 24‐strand
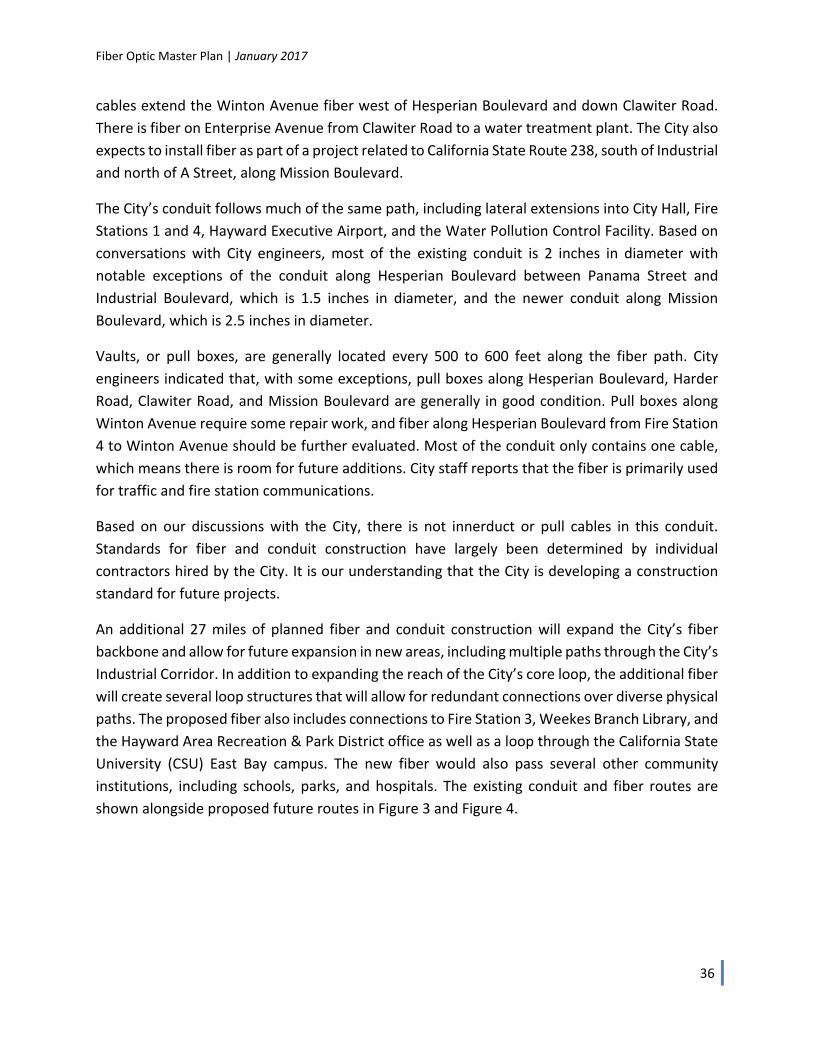
Fiber Optic Master Plan | January 2017
36
cables extend the Winton Avenue fiber west of Hesperian Boulevard and down Clawiter Road.
There is fiber on Enterprise Avenue from Clawiter Road to a water treatment plant. The City also
expects to install fiber as part of a project related to California State Route 238, south of Industrial
and north of A Street, along Mission Boulevard.
The City’s conduit follows much of the same path, including lateral extensions into City Hall, Fire
Stations 1 and 4, Hayward Executive Airport, and the Water Pollution Control Facility. Based on
conversations with City engineers, most of the existing conduit is 2 inches in diameter with
notable exceptions of the conduit along Hesperian Boulevard between Panama Street and
Industrial Boulevard, which is 1.5 inches in diameter, and the newer conduit along Mission
Boulevard, which is 2.5 inches in diameter.
Vaults, or pull boxes, are generally located every 500 to 600 feet along the fiber path. City
engineers indicated that, with some exceptions, pull boxes along Hesperian Boulevard, Harder
Road, Clawiter Road, and Mission Boulevard are generally in good condition. Pull boxes along
Winton Avenue require some repair work, and fiber along Hesperian Boulevard from Fire Station
4 to Winton Avenue should be further evaluated. Most of the conduit only contains one cable,
which means there is room for future additions. City staff reports that the fiber is primarily used
for traffic and fire station communications.
Based on our discussions with the City, there is not innerduct or pull cables in this conduit.
Standards for fiber and conduit construction have largely been determined by individual
contractors hired by the City. It is our understanding that the City is developing a construction
standard for future projects.
An additional 27 miles of planned fiber and conduit construction will expand the City’s fiber
backbone and allow for future expansion in new areas, including multiple paths through the City’s
Industrial Corridor. In addition to expanding the reach of the City’s core loop, the additional fiber
will create several loop structures that will allow for redundant connections over diverse physical
paths. The proposed fiber also includes connections to Fire Station 3, Weekes Branch Library, and
the Hayward Area Recreation & Park District office as well as a loop through the California State
University (CSU) East Bay campus. The new fiber would also pass several other community
institutions, including schools, parks, and hospitals. The existing conduit and fiber routes are
shown alongside proposed future routes in Figure 3 and Figure 4.
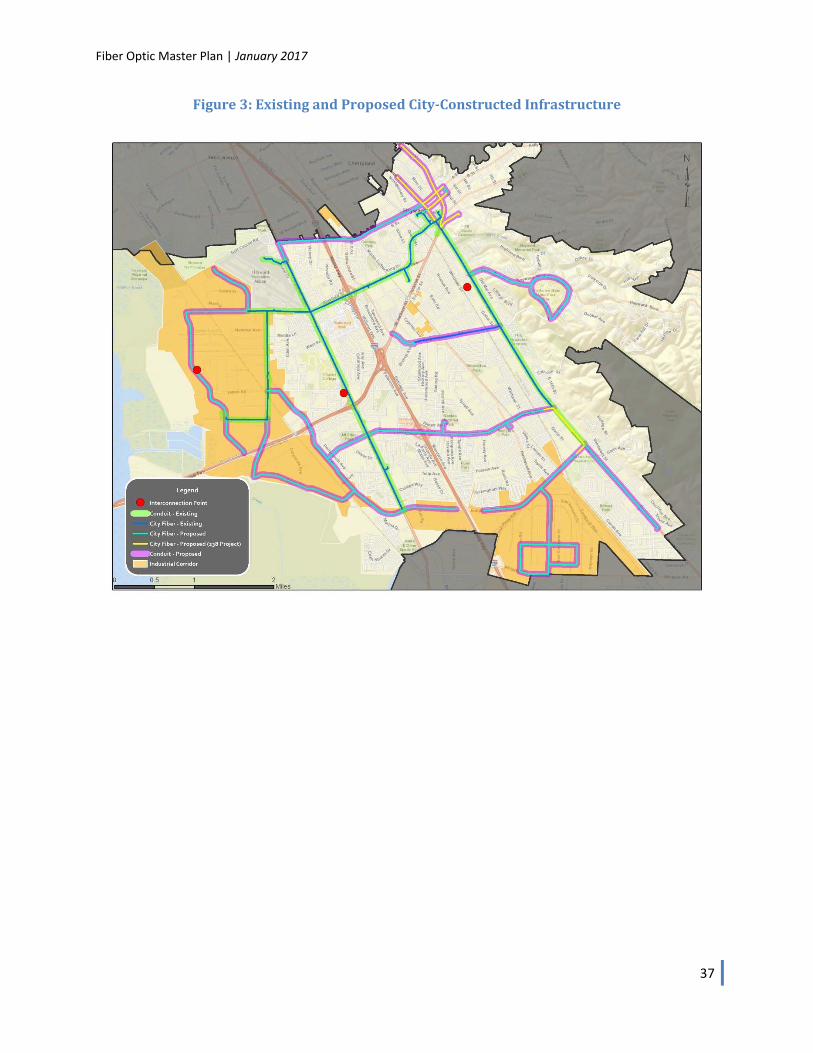
Fiber Optic Master Plan | January 2017
37
Figure3:ExistingandProposedCity‐ConstructedInfrastructure
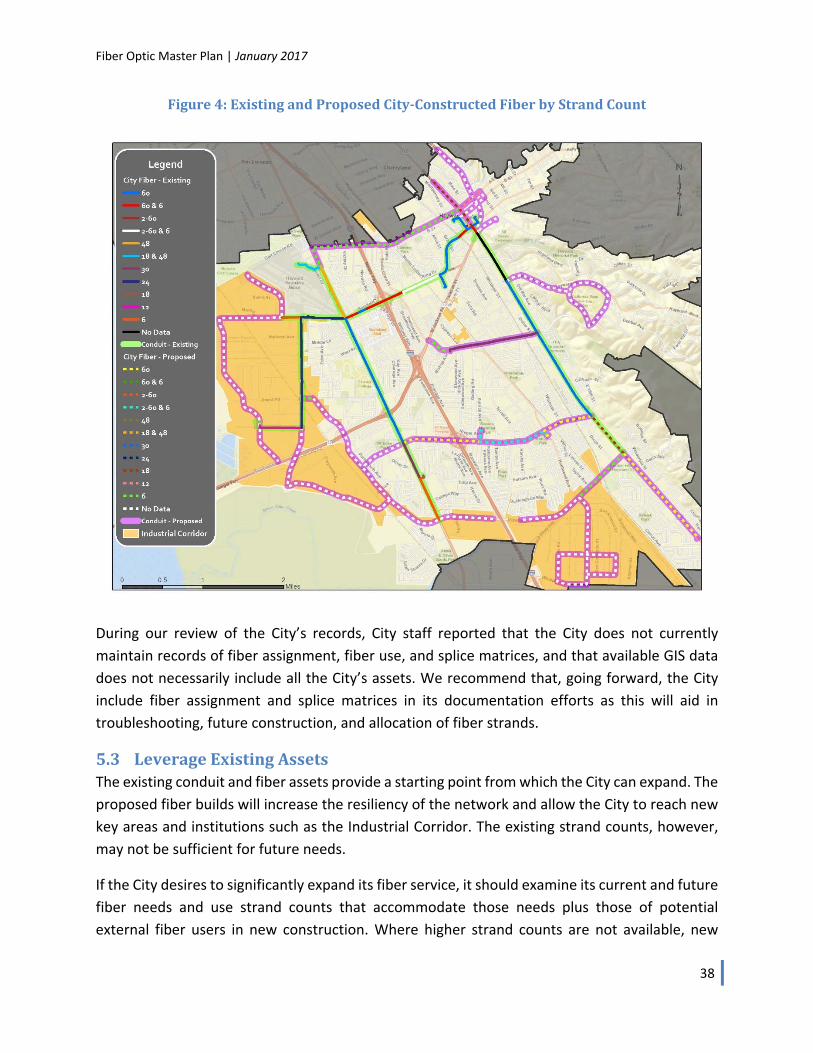
Fiber Optic Master Plan | January 2017
38
Figure4:ExistingandProposedCity‐ConstructedFiberbyStrandCount
During our review of the City’s records, City staff reported that the City does not currently
maintain records of fiber assignment, fiber use, and splice matrices, and that available GIS data
does not necessarily include all the City’s assets. We recommend that, going forward, the City
include fiber assignment and splice matrices in its documentation efforts as this will aid in
troubleshooting, future construction, and allocation of fiber strands.
5.3 LeverageExistingAssetsThe existing conduit and fiber assets provide a starting point from which the City can expand. The
proposed fiber builds will increase the resiliency of the network and allow the City to reach new
key areas and institutions such as the Industrial Corridor. The existing strand counts, however,
may not be sufficient for future needs.
If the City desires to significantly expand its fiber service, it should examine its current and future
fiber needs and use strand counts that accommodate those needs plus those of potential
external fiber users in new construction. Where higher strand counts are not available, new
Fiber Optic Master Plan | January 2017
39
cables can be pulled into the existing conduit if sufficient space is available. Where space is not
available, new cables can replace the smaller cable to provide enhanced fiber counts along
routes.
Future public works projects should also be leveraged to expand the City’s conduit and fiber
network. Projects such as utility replacements, road widenings, and other major capital
improvements may provide the opportunity to install conduit and fiber optics without the need
for surface restoration. A coordinated Dig Once ordinance, which typically requires the
installation of City‐owned communications infrastructure in excavation projects where the City
has determined that it is both financially feasible and consistent with the City’s long‐term goals,
is recommended to leverage these types of public and private excavation projects.
There may also be opportunities for the City to engage further with private partners to serve the
Industrial Corridor. The City could, for example, provide transport for service providers that need
to reach existing and potential customers as well as strategic peering points such as Internet POPs
or data centers in another part of the City. The City may offer conduit to reduce construction
costs to the Industrial Corridor—however, as we noted above, we do not recommend this
approach.
We have identified three potential connection points within the City:
1. 25070 O’Neil Avenue
2. 21350 Cabot Boulevard19
3. 1880 Depot Road
The O’Neil Avenue location is an Internet POP where the City may be able to interconnect with
other national and regional networks including Zayo. This POP is close to Route 238 where the
City is planning to construct new fiber. The City may be able to arrange for connectivity at this
site and include it in the Route 238 project construction so that it may offer transport or use the
connectivity for its own purposes.
The Cabot Boulevard location is a Verizon data center approximately 1 mile west of the City’s
conduit along Clawiter Road.
The Depot Road location is an incumbent local exchange carrier (ILEC) central office, located next
to the City’s fiber and conduit along Hesperian Boulevard. If it is determined that interconnection
services are available at this location, the City may want to take advantage of its proximity to
existing fiber.
19 https://fiberlocator.com, accessed June 2016.
Fiber Optic Master Plan | January 2017
40
5.4 ConceptualDesignandSpecifications–IndustrialTechnology&InnovationCorridor
OSP (layer 1, also referred to as the physical layer) is both the most expensive part of the network
and the longest lasting. The architecture of the physical plant determines the network’s
scalability for future uses and how the plant will need to be operated and maintained; the
architecture is also the main determinant of the total cost of the deployment.
Figure 5 (below) shows a logical representation of the high‐level FTTP network architecture we
recommend for deployment to the Industrial Corridor. This design is open to a variety of
architecture options. The figure illustrates the primary functional components in the FTTP
network, their relative position to one another, and the flexibility of the architecture to support
multiple subscriber models and classes of service.
The recommended architecture is a hierarchical data network that provides critical scalability and
flexibility, both in terms of initial network deployment and its ability to accommodate the
increased demands of future applications and technologies. The characteristics of this
hierarchical FTTP data network are:
Capacity – ability to provide efficient transport for subscriber data, even at peak levels
Availability – high levels of redundancy, reliability, and resiliency; ability to quickly detect
faults and re‐route traffic
Diversity – physical path diversity to minimize operational impact resulting from fiber or
equipment failure
Efficiency – no traffic bottlenecks; efficient use of resources
Scalability – ability to grow in terms of physical service area and increased data capacity,
and to integrate newer technologies
Manageability – simplified provisioning and management of subscribers and services
Flexibility – ability to provide different levels and classes of service to different customer
environments; can support an open access network or a single‐provider network; can
provide separation between service providers on the physical layer (separate fibers) or
logical layer (separate virtual local area network (VLAN or VPN)
Security – controlled physical access to all equipment and facilities, plus network access
control to devices
Fiber Optic Master Plan | January 2017
41
This architecture offers scalability to meet long‐term needs. It is consistent with best practices
for an open access network model that might potentially be required to support multiple network
operators, or at least multiple retail service providers requiring dedicated connections to certain
customers. This design would support a combination of Gigabit passive optical network (GPON)
and direct Active Ethernet (AE) services (with the addition of electronics at the Fiber Distribution
Cabinets (FDCs)), which would enable the network to scale by migrating to direct connections to
each customer, or reducing splitter ratios, on an as‐needed basis.
The design assumes placement of manufacturer‐terminated fiber tap enclosures within the ROW
or easements, providing water‐tight fiber connectors for customer service drop cables and
eliminating the need for service installers to perform splices in the field. This is an industry‐
standard approach to reducing both customer activation times and the potential for damage to
distribution cables and splices. The model also assumes the termination of standard lateral fiber
connections within larger multi‐tenant business locations.
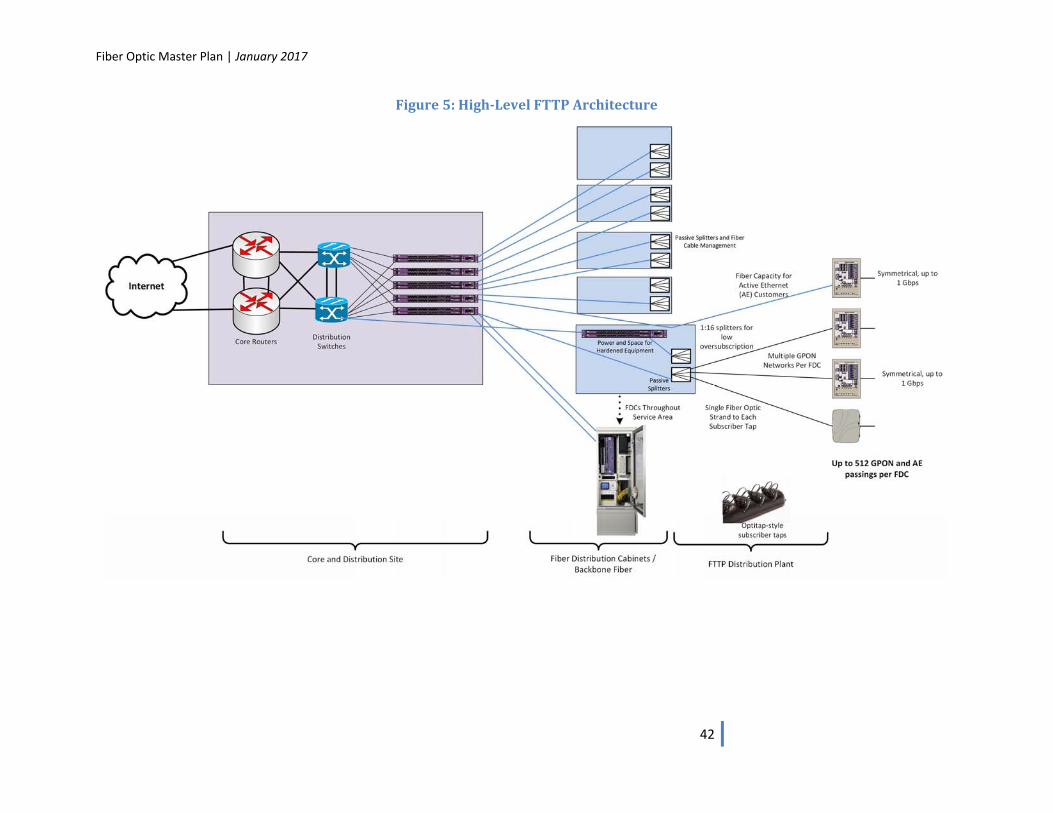
Fiber Optic Master Plan | January 2017
42
Figure5:High‐LevelFTTPArchitecture
Fiber Optic Master Plan | January 2017
43
5.4.1 NetworkDesignThe network design and cost estimates assume the City will:
Use existing fiber and conduit to connect to an Internet POP in the City;
Procure space at the POP to host network electronics and provide backhaul to the
Internet;
Use existing City land or ROW space in the Industrial Corridor to locate the core and
distribution hub facility with adequate environmental and backup power systems to
house network electronics;
Construct fiber to connect the hub to the FDCs;
Construct fiber optics from the FDCs to each business (i.e., from termination panels in
the FDC to tap locations in the ROW or on City easements); and
Construct fiber laterals into large, multi‐tenant business facilities.
Leveraging the City’s existing conduit and fiber resources could decrease the costs associated
with both constructing a backbone and identifying locations to house electronics that are near
the City’s existing resources.
The FTTP network and service areas were defined based on the following criteria:
Targeting 512 passings per FDC;
FDCs suitable to support hardened network electronics, providing backup power and an
active heat exchange;20 and
Avoiding the need for distribution plant to cross major roadways and railways.
Coupled with an appropriate network electronics configuration, this fiber design serves to greatly
increase the reliability of services provided to customers as compared to that of more traditional
cable and telephone networks.
The access layer of the network, which encompasses the fiber plant from the FDCs to the
customers, dedicates a single fiber strand from the FDC to each passing (i.e., potential customer
20 These hardened FDCs reflect an assumption that the City’s operational and business model will require the installation of provider electronics in the FDCs that can support open access among multiple providers. We note that the overall FTTP cost estimate would decrease if the hardened FDCs were replaced with passive FDCs (which would house only optical splitters) and the providers’ electronics were housed only at hub locations.
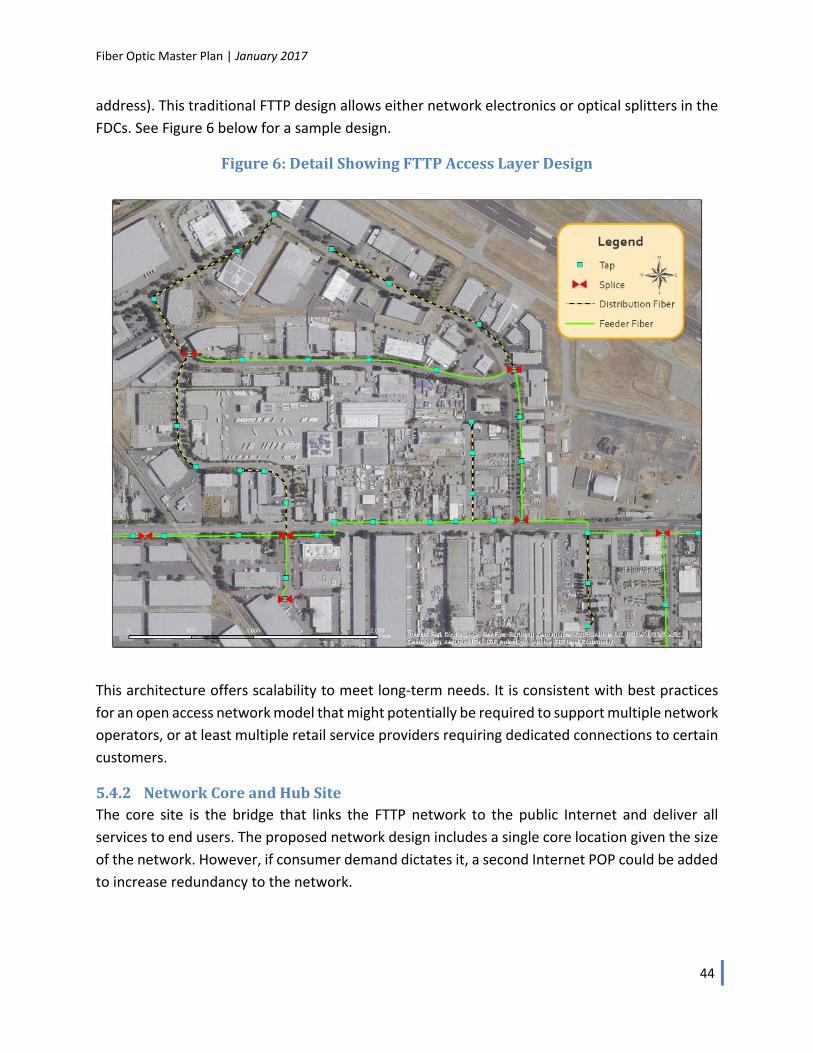
Fiber Optic Master Plan | January 2017
44
address). This traditional FTTP design allows either network electronics or optical splitters in the
FDCs. See Figure 6 below for a sample design.
Figure6:DetailShowingFTTPAccessLayerDesign
This architecture offers scalability to meet long‐term needs. It is consistent with best practices
for an open access network model that might potentially be required to support multiple network
operators, or at least multiple retail service providers requiring dedicated connections to certain
customers.
5.4.2 NetworkCoreandHubSiteThe core site is the bridge that links the FTTP network to the public Internet and deliver all
services to end users. The proposed network design includes a single core location given the size
of the network. However, if consumer demand dictates it, a second Internet POP could be added
to increase redundancy to the network.
Fiber Optic Master Plan | January 2017
45
For the cost estimate, we assumed that the core site electronics would be collocated with the
distribution electronics in the Industrial Corridor hub with connectivity to the Internet POP at
25070 O’Neil Avenue.
The core will also house the providers’ Operational Support Systems (OSS) such as provisioning
platforms, fault and performance management systems, remote access, and other operational
support systems for FTTP operations. The core location is also where any business partner or
content / service providers will gain access to the subscriber network with their own POP. This
may be via remote connection, but collocation is recommended.
The core network electronics run in a High Availability (HA) configuration, with fully meshed and
redundant uplinks to the public Internet and/or all other content and service providers. It is
imperative that core network locations are physically secure and allow unencumbered access
24x7x365 to authorized engineering and operational staff.
The operational environment of the network core and hub locations is similar to that of a data
center. This includes clean power sources, UPS batteries, and diesel power generation for survival
through sustained commercial outages. The facility must provide strong physical security,
limited/controlled access, and environmental controls for humidity and temperature. Fire
suppression is highly recommended.
Equipment is to be mounted securely in racks and cabinets, in compliance with national, state,
and local codes. Equipment power requirements and specification may include ‐48 volt DC and/or
120/240 volts AC. All equipment is to be connected to conditioned / protected clean power with
uninterrupted cutover to battery and generation.
For the cost estimate, we assumed that the core and distribution hub will be located on existing
City land within the Industrial Corridor.
5.4.3 DistributionandAccessNetworkDesignThe distribution network is the layer between the hub and the FDCs, which provide the access
links to the taps. The distribution network aggregates traffic from the FDCs to the core. Fiber cuts
and equipment failures have progressively greater operational impact as they happen closer to
the network core, so it is critical to build in redundancies and physical path diversities in the
distribution network, and to seamlessly re‐route traffic when necessary.
Fiber Optic Master Plan | January 2017
46
The distribution and access network design proposed in this report is flexible and scalable enough
to support two different architectures:
1. Housing both the distribution and access network electronics at the hub, and using only
passive devices (optical splitters and patches) at the FDCs; or
2. Housing the distribution network electronics at the hub and pushing the access network
electronics further into the network by housing them at the FDCs.
By housing all electronics at the hub, the network will not require power at the FDCs. Choosing a
network design that only supports this architecture may reduce costs by allowing smaller, passive
FDCs in the field. However, this architecture will limit the redundancy capability from the FDCs
to the hub.
By pushing the network electronics further into the field, the network gains added redundancy
by allowing the access electronics to connect to two distribution switches. In the event one
distribution switch has an outage the subscribers connected to the FDC would still have network
access via the other distribution switch. Choosing a network design that only supports this
architecture may reduce costs by reducing the size of the hub.
Selecting a design that supports both models would allow the City to accommodate many
different service operators and their network designs. This design would also allow service
providers to start with a small deployment (i.e., placing electronics only at the hub site) and grow
by pushing electronics closer to their subscribers.
5.4.3.1 AccessNetworkTechnologiesFDCs can sit on a curb, be mounted on a pole, or reside in a building. Our model recommends
installing sufficient FDCs to support higher than anticipated levels of subscriber penetration. This
approach will accommodate future subscriber growth with minimal re‐engineering. Passive
optical splitters are modular and can be added to an existing FDC as required to support
subscriber growth, or to accommodate unanticipated changes to the fiber distribution network
with potential future technologies.
Our FTTP design also includes the placement of indoor FDCs and splitters to support large‐tenant
businesses. This would require obtaining the right to access the equipment for repairs and
installation in whatever timeframe is required by the service agreements with the customers.
Lack of access would potentially limit the ability to perform repairs after normal business hours,
which could be problematic for commercial services.
In this model, we assume the use of GPON electronics for most subscribers and Active Ethernet
for a small percentage of subscribers (typically large business customers) that request a premium
Fiber Optic Master Plan | January 2017
47
service or require greater bandwidth. GPON is the most commonly provisioned FTTP service—
used, for example, by Verizon (in its FiOS systems), Google Fiber, and Chattanooga EPB.
Furthermore, providers of gigabit services typically provide these services on GPON platforms.
Even though the GPON platform is limited to 1.2 Gbps upstream and 2.4 Gbps downstream for
the subscribers connected to a single PON, operators have found that the variations in actual
subscriber usage generally means that all subscribers can obtain 1 Gbps on demand (without
provisioned rate‐limiting), even if the capacity is aggregated at the PON. Furthermore, many
GPON manufacturers have a development roadmap to 10 Gbps and faster speeds as user demand
increases.
GPON supports high‐speed broadband data, and is easily leveraged by triple‐play carriers for
voice, video, and data services. The GPON OLT uses single‐fiber (bi‐directional) SFP modules to
support multiple (most commonly less than 32) subscribers.
GPON uses passive optical splitting, which is performed inside FDC, to connect fiber from the
OLTs to the customer premises. The FDCs house multiple optical splitters, each of which splits
the fiber link to the OLT between 16 to 32 customers (in the case of GPON service).
AE provides a symmetrical (up/down) service that is commonly referred to as Symmetrical
Gigabit Ethernet. AE can be provisioned to run at sub‐gigabit speeds, and like GPON easily
supports legacy voice, voice over IP, and video. AE is typically deployed for customers who
require specific service level agreements that are easier to manage and maintain on a dedicated
service.
For subscribers receiving Active Ethernet service, a single dedicated fiber goes directly to the
subscriber premises with no splitting. Because AE requires dedicated fiber (home run) from the
OLT to the CPE, and because each subscriber uses a dedicated SFP on the OLT, there is significant
cost differential in provisioning an AE subscriber versus a GPON subscriber.
Our fiber plant is designed to provide Active Ethernet service or PON service to all passings. The
network operator selects electronics based on the mix of services it plans to offer and can modify
or upgrade electronics to change the mix of services.
5.4.3.2 ExpandingtheAccessNetworkBandwidthGPON is currently the most commonly provisioned FTTP technology, due to inherent economies
when compared with technologies delivered over home‐run fiber21 such as Active Ethernet. The
cost differential between constructing an entire network using GPON and Active Ethernet is 40
21 Home run fiber is a fiber optic architecture where individual fiber strands are extended from the distribution sites to the premises. Home run fiber does not use any intermediary aggregation points in the field.
Fiber Optic Master Plan | January 2017
48
percent to 50 percent.22 GPON is used to provide services up to 1 Gbps per subscriber and is part
of an evolution path to higher‐speed technologies that use higher‐speed optics and wave‐division
multiplexing.
This model provides many options for scaling capacity, which can be done separately or in
parallel:
1. Reducing the number of premises in a PON segment by modifying the splitter assignment
and adding optics. For example, by reducing the split from 16:1 to 4:1, the per‐user
capacity in the access portion of the network is quadrupled.
2. Adding higher speed PON protocols can be accomplished by adding electronics at the FDC
or hub locations. Since these use different frequencies than the GPON electronics, none
of the other CPE would need to be replaced.
3. Adding WDM‐PON electronics as they become widely available. This will enable each user
to have the same capacity as an entire PON. Again, these use different frequencies than
GPON and are not expected to require replacement of legacy CPE equipment.
4. Option 1 could be taken to the maximum, and PON replaced by a 1:1 connection to
electronics—an Active Ethernet configuration.
These upgrades would all require complementary upgrades in the backbone and distribution
Ethernet electronics, as well as in the upstream Internet connections and peering—but they
would not require increased fiber construction.
5.4.3.3 CustomerPremisesEquipment(CPE)andSubscriberServicesIn the final segment of the FTTP network, fiber runs from the FDC to customers’ buildings, where
it terminates at the subscriber tap—a fiber optic housing located in the ROW closest to the
premises. The service installer uses a pre‐connectorized drop cable to connect the tap to the
subscriber premises without the need for fiber optic splicing.
The drop cable extends from the subscriber tap (in a handhole underground) to the building,
enters the building, and connects to CPEs.
22 “Enhanced Communications in San Francisco: Phase II Feasibility Study,” CTC report, October 2009, at p. 205.
Fiber Optic Master Plan | January 2017
49
6 CostEstimate–IndustrialTechnology&InnovationCorridorThe City recognizes the importance of deploying a robust, scalable FTTP network infrastructure
that can support a wide range of applications and services. At the City’s request, CTC prepared a
high‐level network design and cost estimate for deploying a gigabit FTTP network in the City’s
Industrial Corridor. The FTTP network will promote economic development in the Industrial
Corridor where businesses traditionally have limited options for telecommunication services.
The CTC cost estimate provides data relevant to assessing the financial viability of network
deployment, and to developing a business model for a potential City construction effort
(including the full range of models for public–private partnerships). This estimate will also enable
financial modeling to determine the approximate revenue levels necessary for the City to service
any debt incurred in building the network.
The CTC design and cost estimate are underpinned by data and insight gathered by CTC engineers
through several related steps, including discussions with City stakeholders and an extensive field
and desk survey of candidate fiber routes.
The descriptions in this document are highly technical and make use of acronyms. We have
included a glossary as Appendix A.
6.1 FTTPCostEstimateSummaryBased on these inputs and other guidance from the City, we developed a conceptual, high‐level
FTTP design that reflects the City’s goals and is open to a variety of architecture options. From
this design, we present two cost examples.
The first is the cost to deploy FTTP infrastructure, all electronics, service drops to the consumer,
and CPEs. This estimate shows the total capital costs—which would be incurred by the City, or
the City and its partner(s)—to build an FTTP network to support a ubiquitous 1 Gbps data‐only
service. This is the capital cost the City would occur if it pursued a wholesale or retail model.
The second cost estimate example is the cost to deploy only the FTTP OSP infrastructure—
consistent with the dark fiber model, as described in Section 1.5.1. This is the total capital cost
for the City to build a dark fiber network for lease to a private partner.
6.1.1 FTTPCostEstimate(FiberandElectronics)–WholesaleandRetailModelsThis Industrial Corridor FTTP network deployment will cost approximately $8.5 million, inclusive
of OSP construction labor, materials, engineering, permitting, network electronics, drop
installation, CPEs, and testing.23
23 The estimated total cost breakdown assumes a percentage of businesses that subscribe to the service, otherwise known as the penetration rate or the “take rate,” of 35 percent.
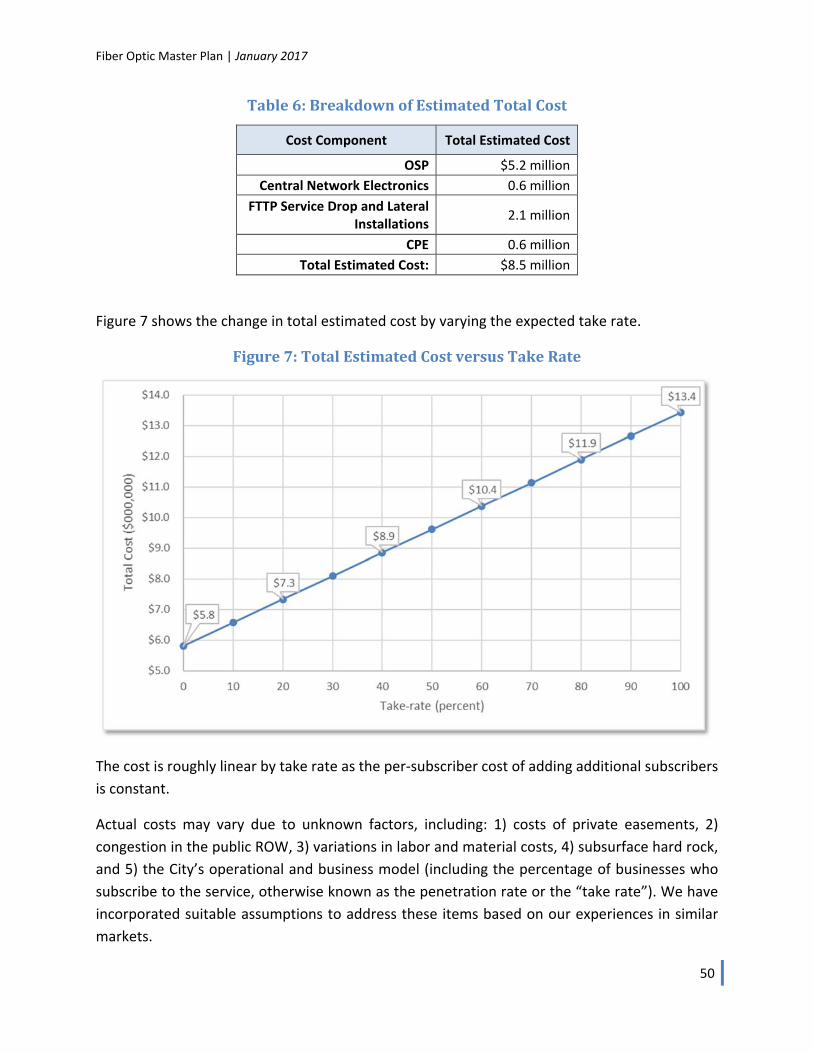
Fiber Optic Master Plan | January 2017
50
Table6:BreakdownofEstimatedTotalCost
Cost Component Total Estimated Cost
OSP $5.2 million
Central Network Electronics 0.6 million
FTTP Service Drop and Lateral Installations
2.1 million
CPE 0.6 million
Total Estimated Cost: $8.5 million
Figure 7 shows the change in total estimated cost by varying the expected take rate.
Figure7:TotalEstimatedCostversusTakeRate
The cost is roughly linear by take rate as the per‐subscriber cost of adding additional subscribers
is constant.
Actual costs may vary due to unknown factors, including: 1) costs of private easements, 2)
congestion in the public ROW, 3) variations in labor and material costs, 4) subsurface hard rock,
and 5) the City’s operational and business model (including the percentage of businesses who
subscribe to the service, otherwise known as the penetration rate or the “take rate”). We have
incorporated suitable assumptions to address these items based on our experiences in similar
markets.
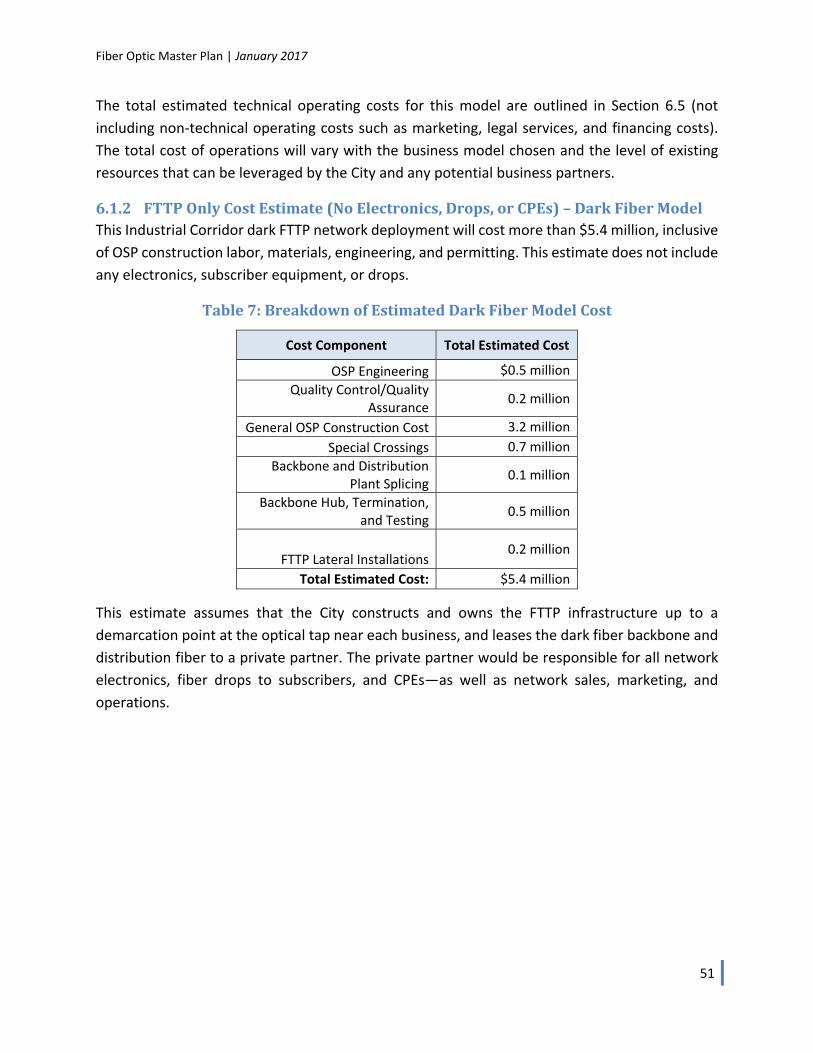
Fiber Optic Master Plan | January 2017
51
The total estimated technical operating costs for this model are outlined in Section 6.5 (not
including non‐technical operating costs such as marketing, legal services, and financing costs).
The total cost of operations will vary with the business model chosen and the level of existing
resources that can be leveraged by the City and any potential business partners.
6.1.2 FTTPOnlyCostEstimate(NoElectronics,Drops,orCPEs)–DarkFiberModelThis Industrial Corridor dark FTTP network deployment will cost more than $5.4 million, inclusive
of OSP construction labor, materials, engineering, and permitting. This estimate does not include
any electronics, subscriber equipment, or drops.
Table7:BreakdownofEstimatedDarkFiberModelCost
Cost Component Total Estimated Cost
OSP Engineering $0.5 million
Quality Control/Quality Assurance
0.2 million
General OSP Construction Cost 3.2 million
Special Crossings 0.7 million
Backbone and Distribution Plant Splicing
0.1 million
Backbone Hub, Termination, and Testing
0.5 million
FTTP Lateral Installations 0.2 million
Total Estimated Cost: $5.4 million
This estimate assumes that the City constructs and owns the FTTP infrastructure up to a
demarcation point at the optical tap near each business, and leases the dark fiber backbone and
distribution fiber to a private partner. The private partner would be responsible for all network
electronics, fiber drops to subscribers, and CPEs—as well as network sales, marketing, and
operations.
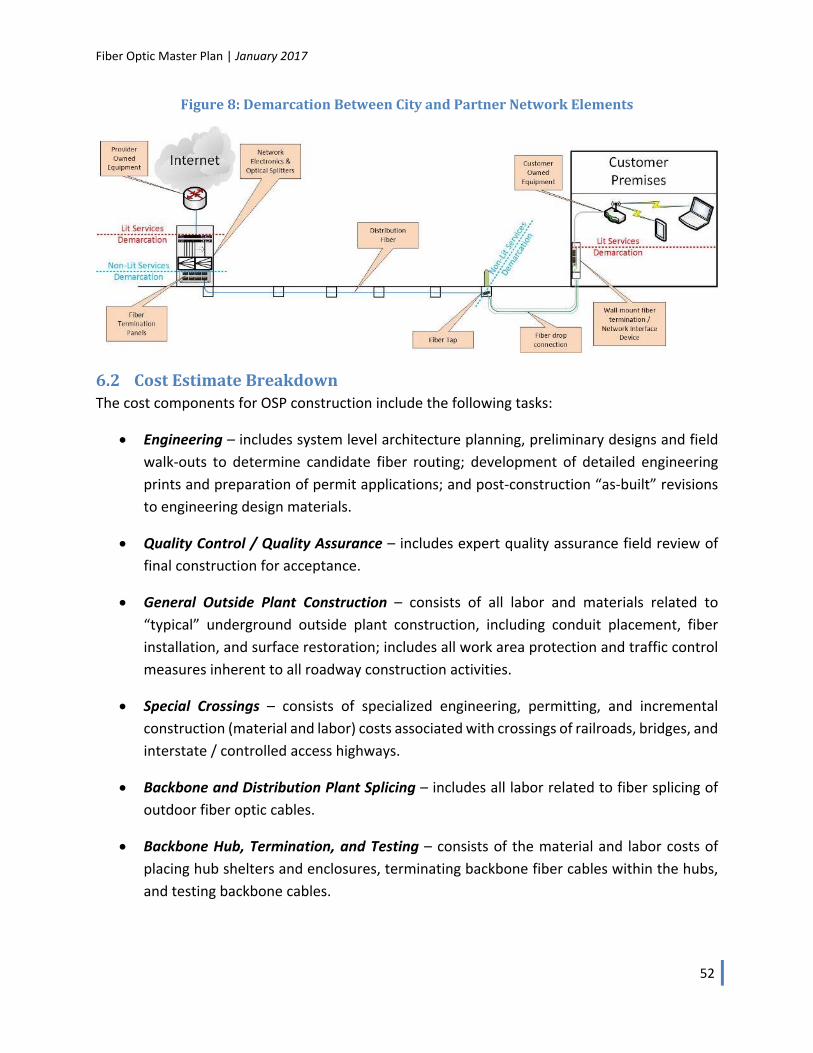
Fiber Optic Master Plan | January 2017
52
Figure8:DemarcationBetweenCityandPartnerNetworkElements
6.2 CostEstimateBreakdownThe cost components for OSP construction include the following tasks:
Engineering – includes system level architecture planning, preliminary designs and field
walk‐outs to determine candidate fiber routing; development of detailed engineering
prints and preparation of permit applications; and post‐construction “as‐built” revisions
to engineering design materials.
Quality Control / Quality Assurance – includes expert quality assurance field review of
final construction for acceptance.
General Outside Plant Construction – consists of all labor and materials related to
“typical” underground outside plant construction, including conduit placement, fiber
installation, and surface restoration; includes all work area protection and traffic control
measures inherent to all roadway construction activities.
Special Crossings – consists of specialized engineering, permitting, and incremental
construction (material and labor) costs associated with crossings of railroads, bridges, and
interstate / controlled access highways.
Backbone and Distribution Plant Splicing – includes all labor related to fiber splicing of
outdoor fiber optic cables.
Backbone Hub, Termination, and Testing – consists of the material and labor costs of
placing hub shelters and enclosures, terminating backbone fiber cables within the hubs,
and testing backbone cables.
Fiber Optic Master Plan | January 2017
53
FTTP Service Drop and Lateral Installations – consists of all costs related to fiber service
drop installation, including outside plant construction on private property, building
penetration, and inside plant construction to a typical backbone network service
“demarcation” point; also includes all materials and labor related to the termination of
fiber cables at the demarcation point. A take‐rate of 35 percent was assumed for standard
fiber service drops.
6.2.1 ExistingCityNetworkInfrastructureDecreasesFTTPConstructionCostsThe cost estimate assumes the use of the City’s conduit and fiber optic network to provide fiber
optic connectivity along most the route between the Industrial Corridor and Internet POPs for
network connectivity.
The use of the City’s conduit and fiber optic resources as a backbone could reduce the cost and
complexity of deploying an FTTP network because the network can reduce the amount of
construction needed to provide backbone connectivity in the City (Figure 9).
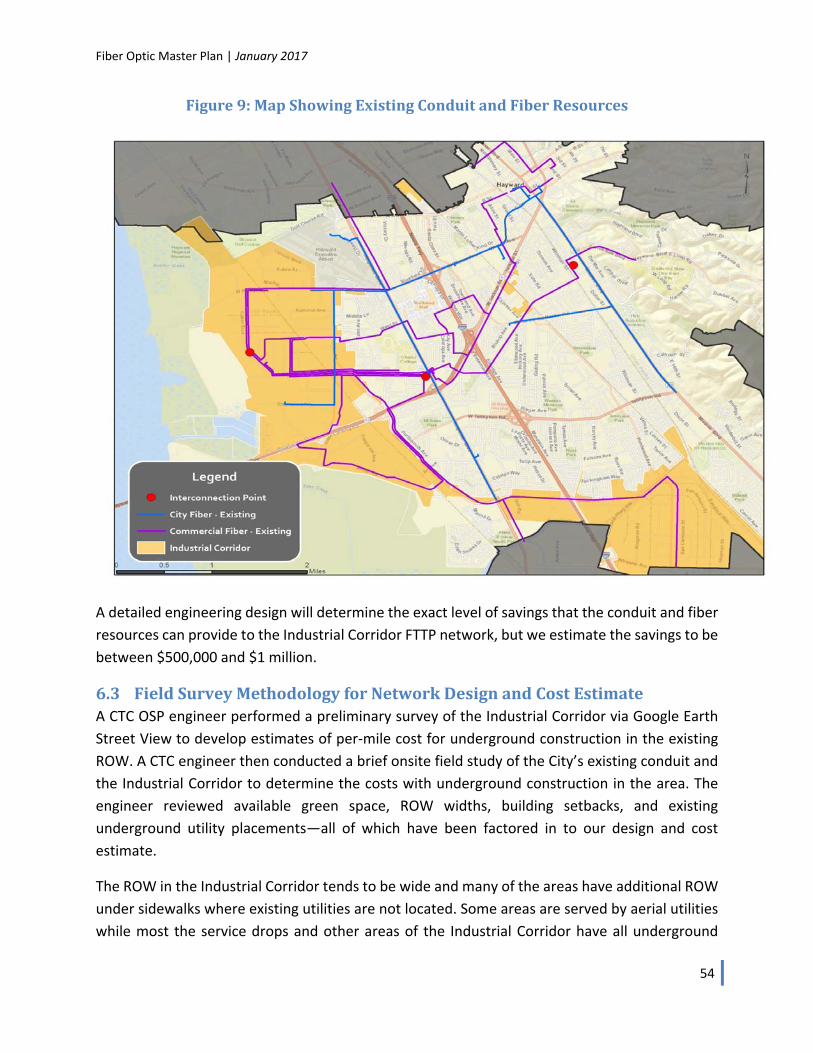
Fiber Optic Master Plan | January 2017
54
Figure9:MapShowingExistingConduitandFiberResources
A detailed engineering design will determine the exact level of savings that the conduit and fiber
resources can provide to the Industrial Corridor FTTP network, but we estimate the savings to be
between $500,000 and $1 million.
6.3 FieldSurveyMethodologyforNetworkDesignandCostEstimateA CTC OSP engineer performed a preliminary survey of the Industrial Corridor via Google Earth
Street View to develop estimates of per‐mile cost for underground construction in the existing
ROW. A CTC engineer then conducted a brief onsite field study of the City’s existing conduit and
the Industrial Corridor to determine the costs with underground construction in the area. The
engineer reviewed available green space, ROW widths, building setbacks, and existing
underground utility placements—all of which have been factored in to our design and cost
estimate.
The ROW in the Industrial Corridor tends to be wide and many of the areas have additional ROW
under sidewalks where existing utilities are not located. Some areas are served by aerial utilities
while most the service drops and other areas of the Industrial Corridor have all underground
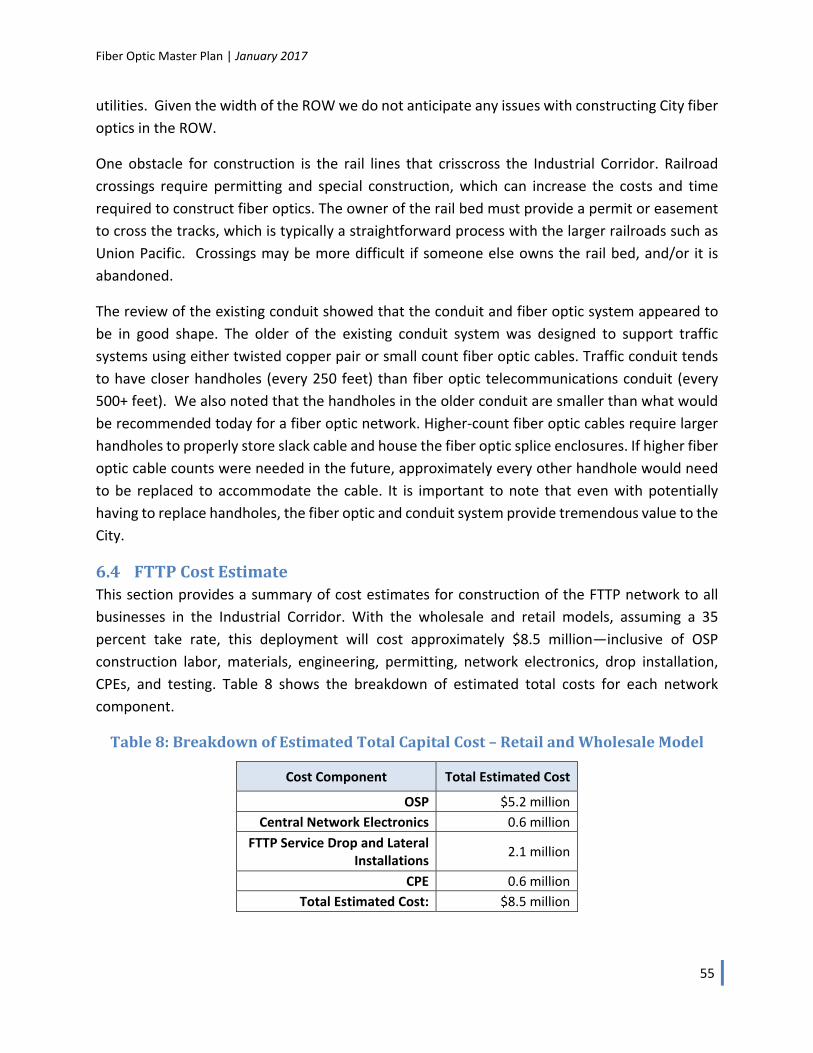
Fiber Optic Master Plan | January 2017
55
utilities. Given the width of the ROW we do not anticipate any issues with constructing City fiber
optics in the ROW.
One obstacle for construction is the rail lines that crisscross the Industrial Corridor. Railroad
crossings require permitting and special construction, which can increase the costs and time
required to construct fiber optics. The owner of the rail bed must provide a permit or easement
to cross the tracks, which is typically a straightforward process with the larger railroads such as
Union Pacific. Crossings may be more difficult if someone else owns the rail bed, and/or it is
abandoned.
The review of the existing conduit showed that the conduit and fiber optic system appeared to
be in good shape. The older of the existing conduit system was designed to support traffic
systems using either twisted copper pair or small count fiber optic cables. Traffic conduit tends
to have closer handholes (every 250 feet) than fiber optic telecommunications conduit (every
500+ feet). We also noted that the handholes in the older conduit are smaller than what would
be recommended today for a fiber optic network. Higher‐count fiber optic cables require larger
handholes to properly store slack cable and house the fiber optic splice enclosures. If higher fiber
optic cable counts were needed in the future, approximately every other handhole would need
to be replaced to accommodate the cable. It is important to note that even with potentially
having to replace handholes, the fiber optic and conduit system provide tremendous value to the
City.
6.4 FTTPCostEstimateThis section provides a summary of cost estimates for construction of the FTTP network to all
businesses in the Industrial Corridor. With the wholesale and retail models, assuming a 35
percent take rate, this deployment will cost approximately $8.5 million—inclusive of OSP
construction labor, materials, engineering, permitting, network electronics, drop installation,
CPEs, and testing. Table 8 shows the breakdown of estimated total costs for each network
component.
Table8:BreakdownofEstimatedTotalCapitalCost–RetailandWholesaleModel
Cost Component Total Estimated Cost
OSP $5.2 million
Central Network Electronics 0.6 million
FTTP Service Drop and Lateral Installations
2.1 million
CPE 0.6 million
Total Estimated Cost: $8.5 million
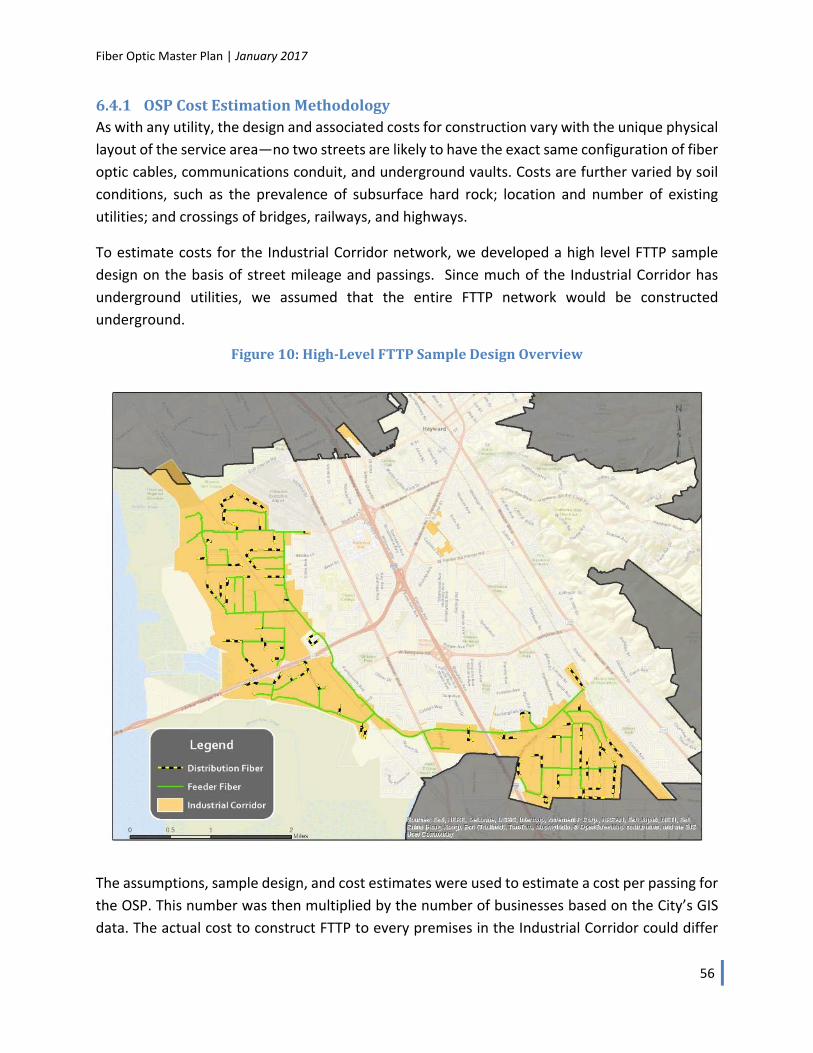
Fiber Optic Master Plan | January 2017
56
6.4.1 OSPCostEstimationMethodologyAs with any utility, the design and associated costs for construction vary with the unique physical
layout of the service area—no two streets are likely to have the exact same configuration of fiber
optic cables, communications conduit, and underground vaults. Costs are further varied by soil
conditions, such as the prevalence of subsurface hard rock; location and number of existing
utilities; and crossings of bridges, railways, and highways.
To estimate costs for the Industrial Corridor network, we developed a high level FTTP sample
design on the basis of street mileage and passings. Since much of the Industrial Corridor has
underground utilities, we assumed that the entire FTTP network would be constructed
underground.
Figure10:High‐LevelFTTPSampleDesignOverview
The assumptions, sample design, and cost estimates were used to estimate a cost per passing for
the OSP. This number was then multiplied by the number of businesses based on the City’s GIS
data. The actual cost to construct FTTP to every premises in the Industrial Corridor could differ
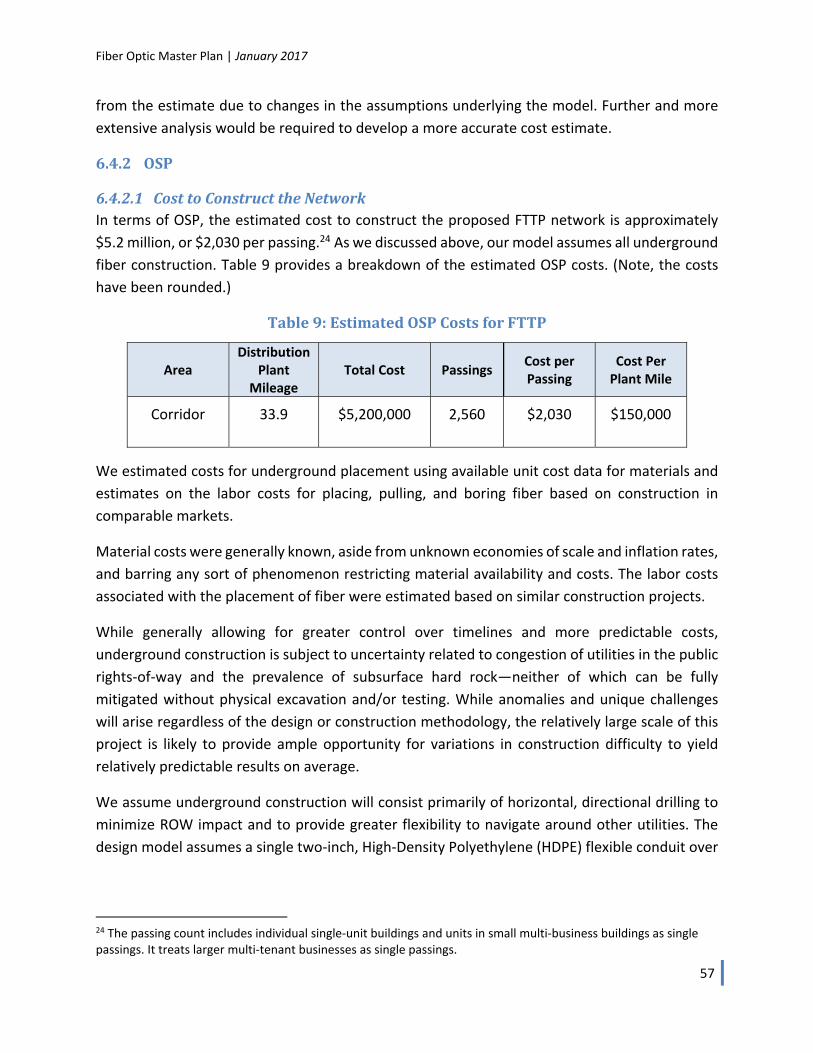
Fiber Optic Master Plan | January 2017
57
from the estimate due to changes in the assumptions underlying the model. Further and more
extensive analysis would be required to develop a more accurate cost estimate.
6.4.2 OSP
6.4.2.1 CosttoConstructtheNetworkIn terms of OSP, the estimated cost to construct the proposed FTTP network is approximately
$5.2 million, or $2,030 per passing.24 As we discussed above, our model assumes all underground
fiber construction. Table 9 provides a breakdown of the estimated OSP costs. (Note, the costs
have been rounded.)
Table9:EstimatedOSPCostsforFTTP
Area Distribution
Plant Mileage
Total Cost Passings Cost per Passing
Cost Per Plant Mile
Corridor 33.9 $5,200,000 2,560 $2,030 $150,000
We estimated costs for underground placement using available unit cost data for materials and
estimates on the labor costs for placing, pulling, and boring fiber based on construction in
comparable markets.
Material costs were generally known, aside from unknown economies of scale and inflation rates,
and barring any sort of phenomenon restricting material availability and costs. The labor costs
associated with the placement of fiber were estimated based on similar construction projects.
While generally allowing for greater control over timelines and more predictable costs,
underground construction is subject to uncertainty related to congestion of utilities in the public
rights‐of‐way and the prevalence of subsurface hard rock—neither of which can be fully
mitigated without physical excavation and/or testing. While anomalies and unique challenges
will arise regardless of the design or construction methodology, the relatively large scale of this
project is likely to provide ample opportunity for variations in construction difficulty to yield
relatively predictable results on average.
We assume underground construction will consist primarily of horizontal, directional drilling to
minimize ROW impact and to provide greater flexibility to navigate around other utilities. The
design model assumes a single two‐inch, High‐Density Polyethylene (HDPE) flexible conduit over
24 The passing count includes individual single‐unit buildings and units in small multi‐business buildings as single passings. It treats larger multi‐tenant businesses as single passings.
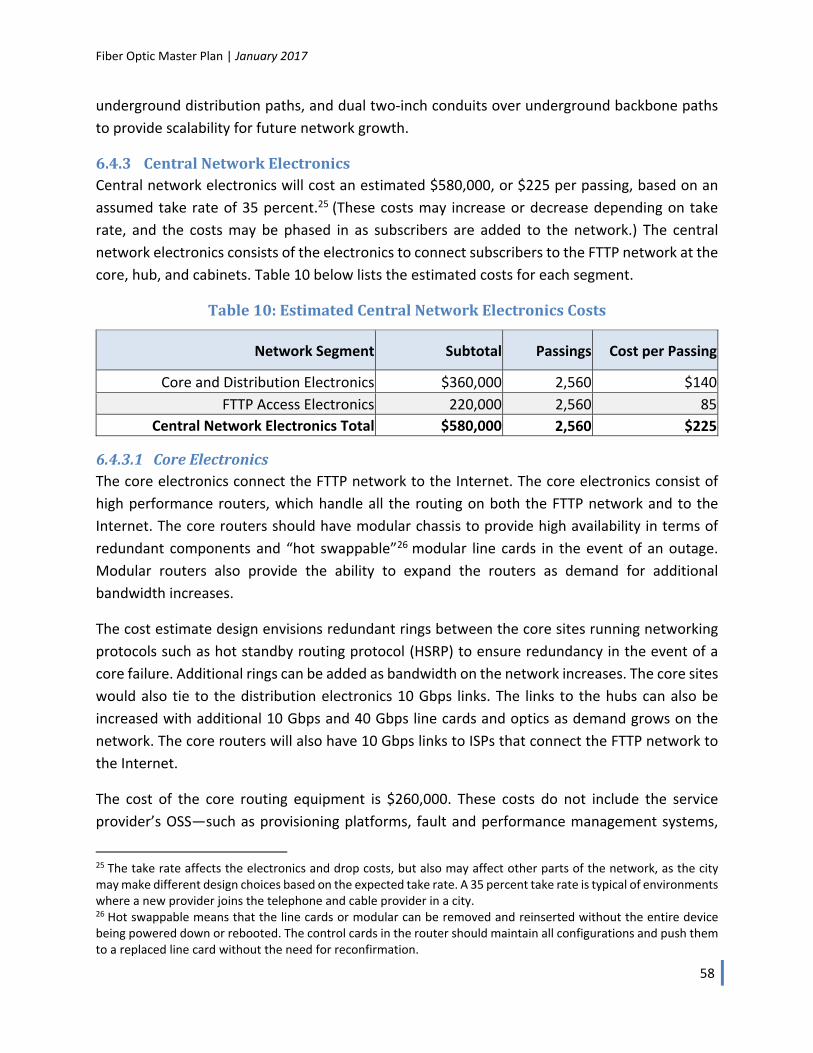
Fiber Optic Master Plan | January 2017
58
underground distribution paths, and dual two‐inch conduits over underground backbone paths
to provide scalability for future network growth.
6.4.3 CentralNetworkElectronicsCentral network electronics will cost an estimated $580,000, or $225 per passing, based on an
assumed take rate of 35 percent.25 (These costs may increase or decrease depending on take
rate, and the costs may be phased in as subscribers are added to the network.) The central
network electronics consists of the electronics to connect subscribers to the FTTP network at the
core, hub, and cabinets. Table 10 below lists the estimated costs for each segment.
Table10:EstimatedCentralNetworkElectronicsCosts
Network Segment Subtotal Passings Cost per Passing
Core and Distribution Electronics $360,000 2,560 $140
FTTP Access Electronics 220,000 2,560 85
Central Network Electronics Total $580,000 2,560 $225
6.4.3.1 CoreElectronicsThe core electronics connect the FTTP network to the Internet. The core electronics consist of
high performance routers, which handle all the routing on both the FTTP network and to the
Internet. The core routers should have modular chassis to provide high availability in terms of
redundant components and “hot swappable”26 modular line cards in the event of an outage.
Modular routers also provide the ability to expand the routers as demand for additional
bandwidth increases.
The cost estimate design envisions redundant rings between the core sites running networking
protocols such as hot standby routing protocol (HSRP) to ensure redundancy in the event of a
core failure. Additional rings can be added as bandwidth on the network increases. The core sites
would also tie to the distribution electronics 10 Gbps links. The links to the hubs can also be
increased with additional 10 Gbps and 40 Gbps line cards and optics as demand grows on the
network. The core routers will also have 10 Gbps links to ISPs that connect the FTTP network to
the Internet.
The cost of the core routing equipment is $260,000. These costs do not include the service
provider’s OSS—such as provisioning platforms, fault and performance management systems,
25 The take rate affects the electronics and drop costs, but also may affect other parts of the network, as the city may make different design choices based on the expected take rate. A 35 percent take rate is typical of environments where a new provider joins the telephone and cable provider in a city. 26 Hot swappable means that the line cards or modular can be removed and reinserted without the entire device being powered down or rebooted. The control cards in the router should maintain all configurations and push them to a replaced line card without the need for reconfirmation.
Fiber Optic Master Plan | January 2017
59
remote access, and other OSS for FTTP operations. The service providers and/or their content
providers may already have these systems in place.
6.4.3.2 DistributionElectronicsThe distribution network electronics aggregate the traffic from the FDCs and send it to the core
to access the Internet. The distribution electronics consist of high performance aggregation
switches, which consolidate the traffic from the many access electronics and send it to the core
for route processing. The distribution switches typically are modular switch chassis that can
accommodate many line cards for aggregation. The switches should also be modular to provide
redundancy in the same manner as the core switches.
The cost estimate assumes that the aggregation switches connect to the access network
electronics with 10 Gbps links to each distribution switch. The aggregation switches would then
connect to the core switches over single or multiple 10 Gbps links as needed to meet the demand
of the FTTP users in each service area.
The cost of the distribution switching equipment is $100,000. These costs do not include any of
the service provider’s OSS or other management equipment.
6.4.3.3 AccessElectronicsThe access network electronics at the FDCs connect the subscribers’ CPEs to the FTTP network.
We recommend deploying access network electronics that can support both GPON and Active
Ethernet subscribers to provide flexibility within the FDC service area. We also recommend
deploying modular access network electronics for reliability and the ability at add line cards as
more subscribers join in the service area. Modularity also helps reduce initial capital costs while
the network is under construction or during the roll out of the network.
The cost of the access network electronics for the network is $220,000. These costs are based on
a take rate of 35 percent and include optical splitters at the FDCs for that take rate.
6.4.4 Customer Premises Equipment (CPE) and Service Drop Installation (Per‐subscriberCosts)
CPEs are the subscriber’s interface to the FTTP network. For this cost estimate, we selected CPEs
that provide only Ethernet data services (however, there are a wide variety of CPEs offering other
data, voice, and video services). Using the estimated take rate of 35 percent, we estimated the
CPE for business customers will be $630,000.
Each activated subscriber would also require a fiber drop installation and related electronics,
which would cost roughly $2,860 per subscriber, or $2.7 million total (assuming a 35 percent take
rate).
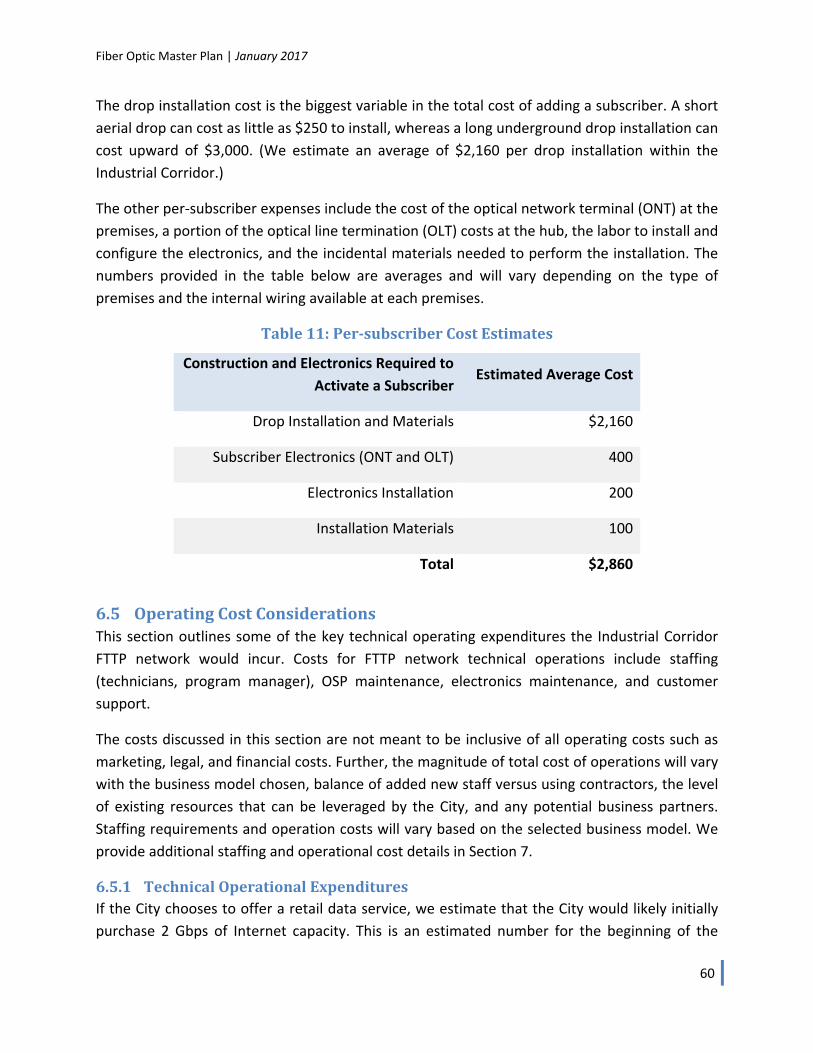
Fiber Optic Master Plan | January 2017
60
The drop installation cost is the biggest variable in the total cost of adding a subscriber. A short
aerial drop can cost as little as $250 to install, whereas a long underground drop installation can
cost upward of $3,000. (We estimate an average of $2,160 per drop installation within the
Industrial Corridor.)
The other per‐subscriber expenses include the cost of the optical network terminal (ONT) at the
premises, a portion of the optical line termination (OLT) costs at the hub, the labor to install and
configure the electronics, and the incidental materials needed to perform the installation. The
numbers provided in the table below are averages and will vary depending on the type of
premises and the internal wiring available at each premises.
Table11:Per‐subscriberCostEstimates
Construction and Electronics Required to
Activate a SubscriberEstimated Average Cost
Drop Installation and Materials $2,160
Subscriber Electronics (ONT and OLT) 400
Electronics Installation 200
Installation Materials 100
Total $2,860
6.5 OperatingCostConsiderationsThis section outlines some of the key technical operating expenditures the Industrial Corridor
FTTP network would incur. Costs for FTTP network technical operations include staffing
(technicians, program manager), OSP maintenance, electronics maintenance, and customer
support.
The costs discussed in this section are not meant to be inclusive of all operating costs such as
marketing, legal, and financial costs. Further, the magnitude of total cost of operations will vary
with the business model chosen, balance of added new staff versus using contractors, the level
of existing resources that can be leveraged by the City, and any potential business partners.
Staffing requirements and operation costs will vary based on the selected business model. We
provide additional staffing and operational cost details in Section 7.
6.5.1 TechnicalOperationalExpendituresIf the City chooses to offer a retail data service, we estimate that the City would likely initially
purchase 2 Gbps of Internet capacity. This is an estimated number for the beginning of the
Fiber Optic Master Plan | January 2017
61
network deployment and can be expected to grow as video streaming and other cloud
applications grow in importance. Depending upon the contract terms Internet bandwidth we
would estimate costs in the $0.75 per Mbps per month to $1.50 per Mbps per month range in
Hayward. We recommend that the Internet access be purchased from multiple Internet providers
and be load balanced to ensure continuity during an outage.
The operating costs also include maintenance contracts on the core network electronics. These
contracts ensure that the City has access to software support and replacement of critical network
electronics that would be cost‐prohibitive to store as spares. Where cost effective such as the
distribution aggregation switches and the FTTP electronics, we recommend storing spares to
reduce the total costs of maintenance contracts. We estimate hardware maintenance contracts
and sparing at 15 percent of the total electronics cost.
In addition, we recommend planning for an annual payment into a depreciation operating
reserve account based on the equipment replacement cost to help limit risk. This reserve fund
should never go negative; the balance that accrues in this account will fund the capital needs for
ongoing capital replenishments.
6.5.1.1 FiberMaintenanceCostsThe City would need to augment its current fiber staff or contractors with the necessary expertise
and equipment available to maintain the fiber optic cable in an Industrial Corridor FTTP network.
Typical maintenance costs can exceed 1 percent of the total fiber OSP construction cost per year
and includes a mix of contracted services.
Fiber optic cable is resilient compared to copper telephone lines and cable TV coaxial cable. The
fiber itself does not corrode, and fiber cable installed over 20 years ago is still in good condition.
However, fiber can be vulnerable to accidental cuts by other construction, traffic accidents, and
severe weather. In other networks of this size, we have seen approximately 80 outages per 1,000
miles of plant per year.
The fiber optic redundancy from the hubs to the FDCs in the backbone network will facilitate
restoring network outages while repair of the fiber optic plant is taking place.
Depending on the operational and business models established between the City and service
providers, the City may be responsible for adds, moves, and changes associated with the network
as well as standard plant maintenance. These items may include:
Adding and/or changing patching and optical splitter configurations at FDCs and hubs;
Extending optical taps and laterals to new buildings or developments;
Extending access to the FTTP network to other service providers; and
Fiber Optic Master Plan | January 2017
62
Relocating fiber paths due to changes such as the widening of roadways.
The City would need to obtain contracts with fiber optic contractors that have the necessary
expertise and equipment available to maintain an Industrial Corridor FTTP network. These
contracts should specify the service level agreements the City needs from the fiber optic
contractors to ensure that the City can meet the service level agreements it has with the network
service providers. The City should also ensure that it has access to multiple fiber optic contractors
if one contractor is unable to meet the City’s needs. The fiber optic contractors should be
available 24x7 and have a process in place for activating emergency service requests.
6.5.1.2 FiberLocatingThe City will be responsible for locating and marking all underground conduit for excavation
projects per California’s DigAlert System statutes. Locating involves receiving and reviewing
excavation tickets to determine whether the area of excavation may impact the City’s
underground FTTP infrastructure. If the system is impacted, the City must mark its utilities in the
manner and within the allotted timeframe provided by the statute.
Locating is either done in‐house or by contractors who specialize in utility locating. The City may
be able to leverage its existing utility locating personnel, processes, or contractors to reduce the
cost of utility locating for the FTTP network.
6.5.2 TechnicalStaffingRequirementsAdditional staffing will be required to perform the maintenance and operation responsibilities of
an Industrial Corridor FTTP network. The staffing levels and the responsibility for that staffing will
vary greatly with the various potential business models. The following sections outline the
technical groups that will be required to maintain and operate the network.
6.5.2.1 OutsidePlantThe OSP group will be responsible for the maintenance, operations, and expansion of the City’s
telecommunications infrastructure including conduit, fiber, and splice enclosures. During
construction, the OSP group will be responsible for tracking and overseeing the construction of
new infrastructure. Once the network is constructed, the OSP group will oversee any future adds,
moves, or changes to the network.
The OSP group may use contractors to perform activities such as construction, repair, and
locating. Management of contractors will be a responsibility of an OSP manager with OSP
technicians assisting with project oversight and quality assurance and quality control. The OSP
manager will also assist with engineering and design of any adds, moves, and changes that occur
on the network.
Fiber Optic Master Plan | January 2017
63
The OSP group will have responsibility for general field operations. This group will include OSP
technicians to perform locates, and contracted support to provide repair services. Tasks will
include management of the One Call process, fiber locates, response and troubleshooting of
Layer 1 troubleshooting, and fleet management. Additionally, it is critical that while many of OSP
jobs may be outsourced, that the OSP group be equipped with the proper locate and testing
equipment.
6.5.2.2 NetworkEngineeringThe network engineering group develops and maintains the network architecture, responds to
high‐level troubleshooting requests, manages network electronics and makes sure the network
delivers to the end user a reliable service.
The network engineering group is responsible for making architecture decisions that will
determine how the network can deliver services to users. The network engineering group will
also be responsible for change management and architectural review to ensure that network
continuity is ensured after changes.
The network engineering group will also be responsible for vendor selections when new
hardware, technologies, or contractor support is needed to support the network. The network
engineering team will perform regular maintenance of the network as well as provision, deploy,
test, and accept any electronics to support new sites or services.
Network technicians will be responsible for troubleshooting issues with network electronics and
responding to customer complaints.
To operate network electronics (if required by the business model) we estimate a staffing
requirement of one network manager, up to one network engineer, and up to two network
technicians that could be a combination of personnel as well as contracted support. Network
staffing levels may vary depending on the take rate of the FTTP network.
6.5.2.3 NetworkOperationsCenterandCustomerServiceThe network will require individuals to perform monitoring and oversight of the network
electronics. The group will be responsible for handling technical calls from users, actively
monitoring the health of the network, and escalating issues to the proper operations groups. The
group is also required to develop and monitor network performance parameters to ensure that
the network is meeting its obligations to its users as defined in the network service level
agreements (SLAs).
Often network operations require a 24x7 customer service helpdesk and tools for network
monitoring, alerting, and provisioning.
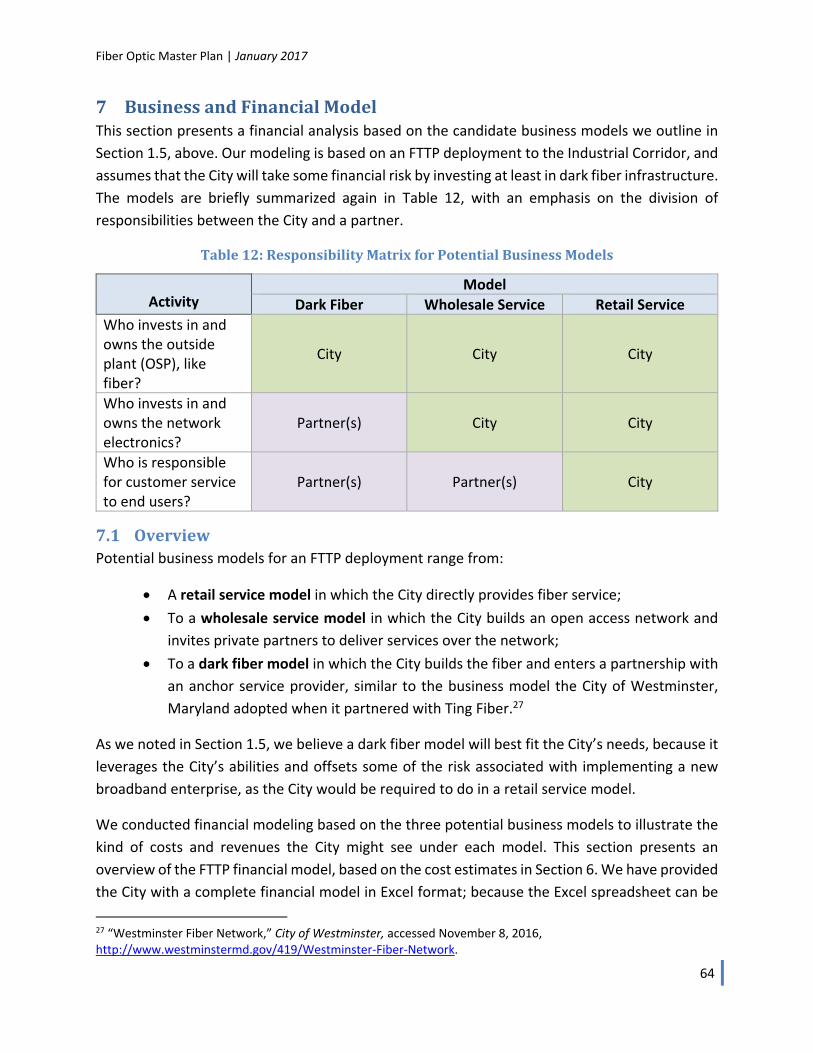
Fiber Optic Master Plan | January 2017
64
7 BusinessandFinancialModelThis section presents a financial analysis based on the candidate business models we outline in
Section 1.5, above. Our modeling is based on an FTTP deployment to the Industrial Corridor, and
assumes that the City will take some financial risk by investing at least in dark fiber infrastructure.
The models are briefly summarized again in Table 12, with an emphasis on the division of
responsibilities between the City and a partner.
Table12:ResponsibilityMatrixforPotentialBusinessModels
Activity Model
Dark Fiber Wholesale Service Retail Service
Who invests in and owns the outside plant (OSP), like fiber?
City City City
Who invests in and owns the network electronics?
Partner(s) City City
Who is responsible for customer service to end users?
Partner(s) Partner(s) City
7.1 OverviewPotential business models for an FTTP deployment range from:
A retail service model in which the City directly provides fiber service;
To a wholesale service model in which the City builds an open access network and
invites private partners to deliver services over the network;
To a dark fiber model in which the City builds the fiber and enters a partnership with
an anchor service provider, similar to the business model the City of Westminster,
Maryland adopted when it partnered with Ting Fiber.27
As we noted in Section 1.5, we believe a dark fiber model will best fit the City’s needs, because it
leverages the City’s abilities and offsets some of the risk associated with implementing a new
broadband enterprise, as the City would be required to do in a retail service model.
We conducted financial modeling based on the three potential business models to illustrate the
kind of costs and revenues the City might see under each model. This section presents an
overview of the FTTP financial model, based on the cost estimates in Section 6. We have provided
the City with a complete financial model in Excel format; because the Excel spreadsheet can be
27 “Westminster Fiber Network,” City of Westminster, accessed November 8, 2016, http://www.westminstermd.gov/419/Westminster‐Fiber‐Network.
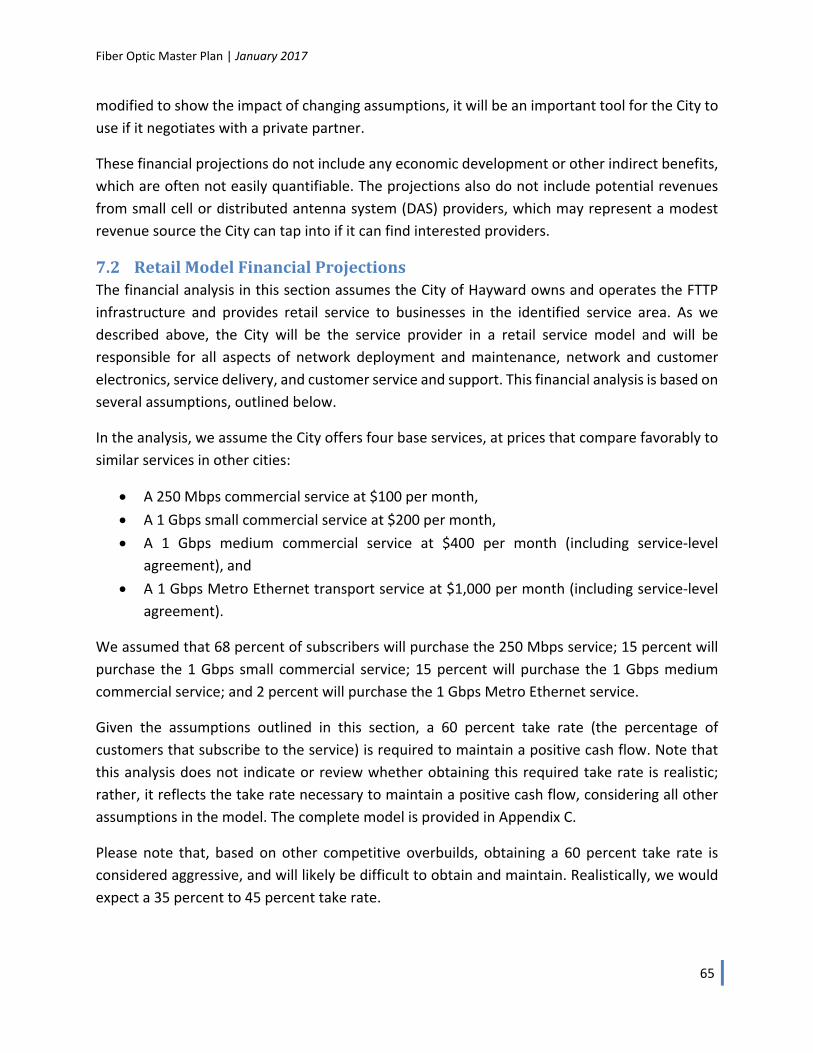
Fiber Optic Master Plan | January 2017
65
modified to show the impact of changing assumptions, it will be an important tool for the City to
use if it negotiates with a private partner.
These financial projections do not include any economic development or other indirect benefits,
which are often not easily quantifiable. The projections also do not include potential revenues
from small cell or distributed antenna system (DAS) providers, which may represent a modest
revenue source the City can tap into if it can find interested providers.
7.2 RetailModelFinancialProjectionsThe financial analysis in this section assumes the City of Hayward owns and operates the FTTP
infrastructure and provides retail service to businesses in the identified service area. As we
described above, the City will be the service provider in a retail service model and will be
responsible for all aspects of network deployment and maintenance, network and customer
electronics, service delivery, and customer service and support. This financial analysis is based on
several assumptions, outlined below.
In the analysis, we assume the City offers four base services, at prices that compare favorably to
similar services in other cities:
A 250 Mbps commercial service at $100 per month,
A 1 Gbps small commercial service at $200 per month,
A 1 Gbps medium commercial service at $400 per month (including service‐level
agreement), and
A 1 Gbps Metro Ethernet transport service at $1,000 per month (including service‐level
agreement).
We assumed that 68 percent of subscribers will purchase the 250 Mbps service; 15 percent will
purchase the 1 Gbps small commercial service; 15 percent will purchase the 1 Gbps medium
commercial service; and 2 percent will purchase the 1 Gbps Metro Ethernet service.
Given the assumptions outlined in this section, a 60 percent take rate (the percentage of
customers that subscribe to the service) is required to maintain a positive cash flow. Note that
this analysis does not indicate or review whether obtaining this required take rate is realistic;
rather, it reflects the take rate necessary to maintain a positive cash flow, considering all other
assumptions in the model. The complete model is provided in Appendix C.
Please note that, based on other competitive overbuilds, obtaining a 60 percent take rate is
considered aggressive, and will likely be difficult to obtain and maintain. Realistically, we would
expect a 35 percent to 45 percent take rate.
Fiber Optic Master Plan | January 2017
66
The financial analysis for this base case scenario is as follows:
Table13:BaseCaseRetailModelFinancialAnalysiswith60PercentTakeRate
Income Statement Year 1 Year 5 Year 10 Year 15 Year 20
Total Revenues $341,000 $3,280,000 $3,280,000 $3,280,000 $3,280,000
Total Cash Expenses (911,000) (1,419,000) (1,419,000) (1,419,000) (1,419,000) Depreciation (234,000) (1,254,000) (625,000) (617,000) (617,000)
Interest Expense (185,000) (617,000) (485,000) (321,000) (111,000)
Taxes ‐ ‐ ‐ ‐ ‐Net Income $(989,000) $(10,000) $751,000 $923,000 $1,133,000
Cash Flow Statement Year 1 Year 5 Year 10 Year 15 Year 20
Unrestricted Cash Balance $(50,000) $491,000 $2,770,000 $5,548,000 $8,319,000 Depreciation Reserve ‐ 1,132,000 1,150,000 354,000 (138,000) Interest Reserve 185,000 ‐ ‐ ‐ ‐ Debt Service Reserve 185,000 660,000 660,000 660,000 660,000 Total Cash Balance $320,000 $2,283,000 $4,580,000 $6,562,000 $8,841,000
The income statement demonstrates an overall health of the enterprise on a year‐by‐year basis.
The above cash flow statement shows the cumulative cash balance of the enterprise. It shows
unrestricted and restricted (depreciation, interest, and debt service reserves) cumulative cash
balances. The cash flow statement is the most important measure for a public entity. It is
important for the enterprise to maintain a positive unrestricted cash balance at the end of each
year.
Please note that we used a “flat model” in the analysis. With a “flat model,” inflation and salary
cost increases are not used in the analysis because it is assumed that operating cost increases
will be offset and passed on to subscribers in the form of increased prices. Models that add an
inflation factor to both revenues and expenses can greatly overstate net revenues in the out‐
years since net revenues would then also increase by the same inflation factor.
7.2.1 FinancingCostsandOperatingExpensesThis financial analysis assumes a combination of bonds and loans will be necessary to deploy the
FTTP network. We expect that the City will seek 20‐year bonds with principal repayments starting
the year after the bond issuance.
We project that the bond issuance costs will be equal to 1.0 percent of the principal borrowed.
For the bond, a debt service reserve account is maintained at 5.0 percent of the total issuance
amount. An interest reserve account equal to years one and two interest expense is maintained
for the first two years.
Fiber Optic Master Plan | January 2017
67
Our analysis estimates total bonding requirements to be $13.2 million, and we assume that bonds
are issued at a 5 percent interest rate.
The model assumes a straight‐line depreciation of assets, and that the OSP and materials will
have a 20‐year life span while network equipment will need to be replaced after 10 years. Last
mile fiber and CPEs, as well as other miscellaneous implementation costs, will need to be
accounted for after five years. Network equipment will be replaced or upgraded at 80 percent of
its original cost, miscellaneous implementation costs will be at 100 percent, and last mile and
CPEs will be at 100 percent. The model plans for a depreciation reserve account starting in year
three—these monies are set aside to fund future electronics replacements and upgrades.
Table 14 shows operating expenses for years one, five, 10, 15, and 20. As the table indicates,
some expenses will remain constant while others will increase as the network matures and the
customer base increases.
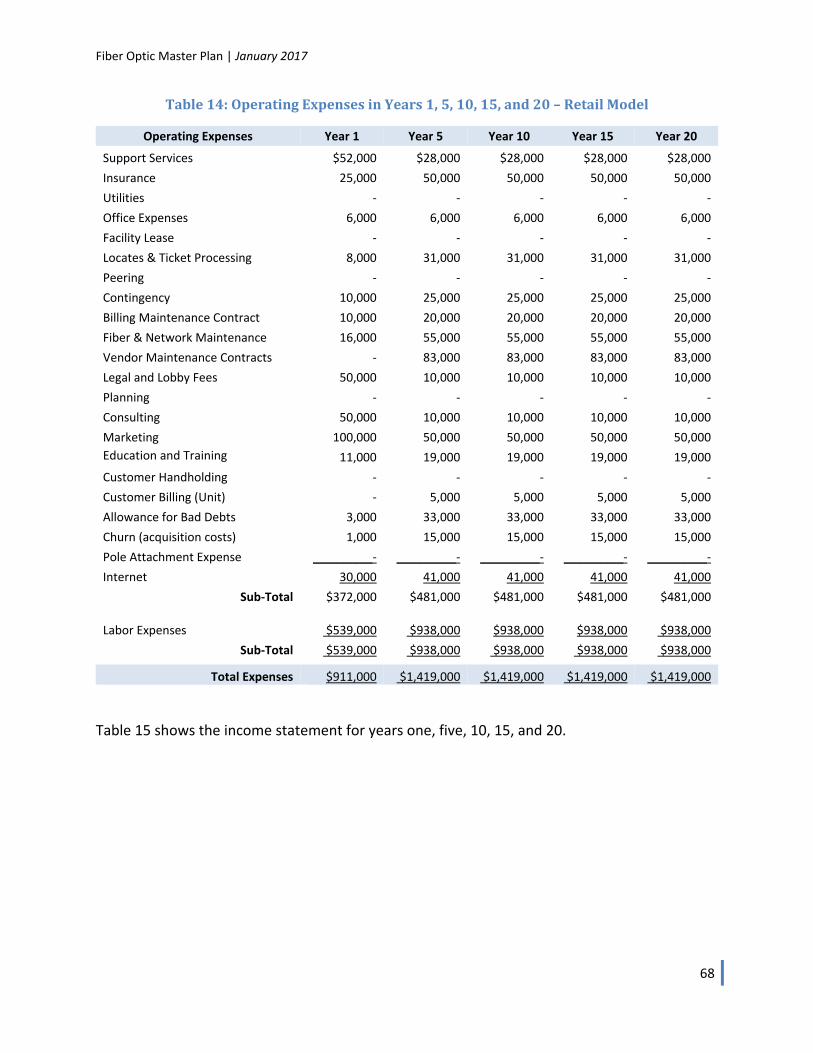
Fiber Optic Master Plan | January 2017
68
Table14:OperatingExpensesinYears1,5,10,15,and20–RetailModel
Operating Expenses Year 1 Year 5 Year 10 Year 15 Year 20
Support Services $52,000 $28,000 $28,000 $28,000 $28,000
Insurance 25,000 50,000 50,000 50,000 50,000
Utilities ‐ ‐ ‐ ‐ ‐
Office Expenses 6,000 6,000 6,000 6,000 6,000
Facility Lease ‐ ‐ ‐ ‐ ‐
Locates & Ticket Processing 8,000 31,000 31,000 31,000 31,000
Peering ‐ ‐ ‐ ‐ ‐
Contingency 10,000 25,000 25,000 25,000 25,000
Billing Maintenance Contract 10,000 20,000 20,000 20,000 20,000
Fiber & Network Maintenance 16,000 55,000 55,000 55,000 55,000
Vendor Maintenance Contracts ‐ 83,000 83,000 83,000 83,000
Legal and Lobby Fees 50,000 10,000 10,000 10,000 10,000
Planning ‐ ‐ ‐ ‐ ‐
Consulting 50,000 10,000 10,000 10,000 10,000
Marketing 100,000 50,000 50,000 50,000 50,000
Education and Training 11,000 19,000 19,000 19,000 19,000
Customer Handholding ‐ ‐ ‐ ‐ ‐
Customer Billing (Unit) ‐ 5,000 5,000 5,000 5,000
Allowance for Bad Debts 3,000 33,000 33,000 33,000 33,000
Churn (acquisition costs) 1,000 15,000 15,000 15,000 15,000
Pole Attachment Expense _________‐ _________‐ _________‐ _________‐ _________‐
Internet 30,000 41,000 41,000 41,000 41,000
Sub‐Total $372,000 $481,000 $481,000 $481,000 $481,000 Labor Expenses $539,000 $938,000 $938,000 $938,000 $938,000
Sub‐Total $539,000 $938,000 $938,000 $938,000 $938,000
Total Expenses $911,000 $1,419,000 $1,419,000 $1,419,000 $1,419,000
Table 15 shows the income statement for years one, five, 10, 15, and 20.
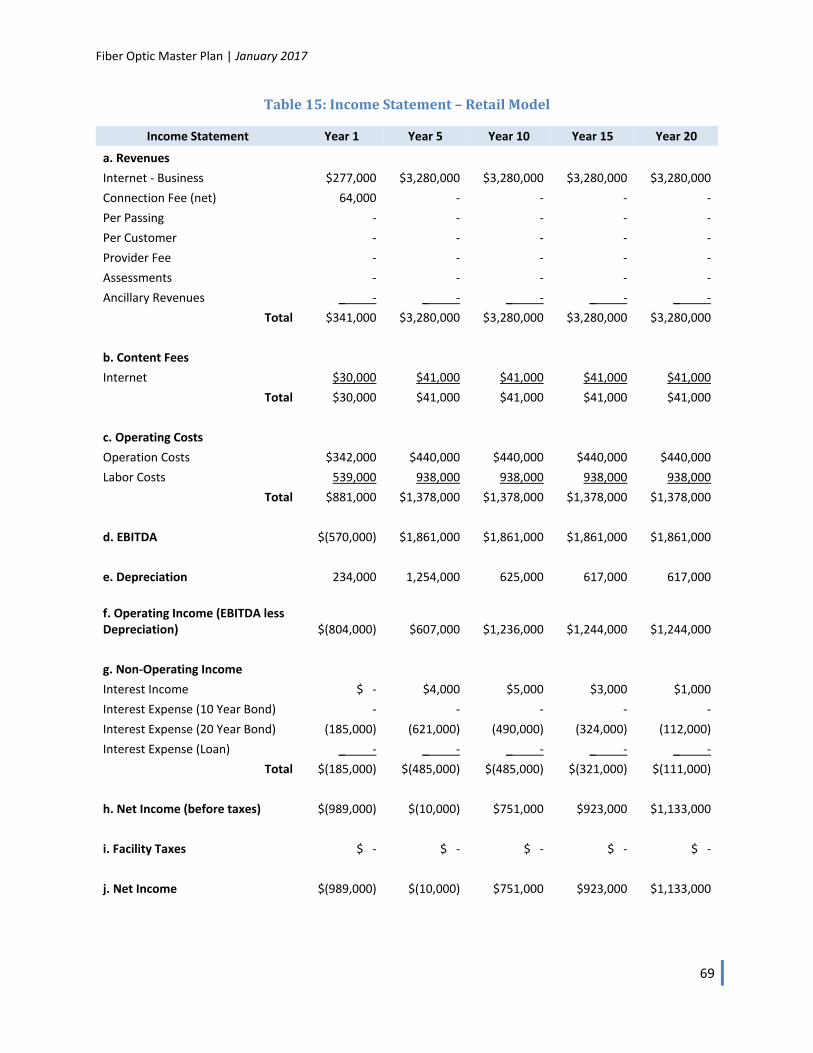
Fiber Optic Master Plan | January 2017
69
Table15:IncomeStatement–RetailModel
Income Statement Year 1 Year 5 Year 10 Year 15 Year 20
a. Revenues Internet ‐ Business $277,000 $3,280,000 $3,280,000 $3,280,000 $3,280,000
Connection Fee (net) 64,000 ‐ ‐ ‐ ‐
Per Passing ‐ ‐ ‐ ‐ ‐
Per Customer ‐ ‐ ‐ ‐ ‐
Provider Fee ‐ ‐ ‐ ‐ ‐
Assessments ‐ ‐ ‐ ‐ ‐
Ancillary Revenues _ ‐ _ ‐ _ ‐ _ ‐ _ ‐
Total $341,000 $3,280,000 $3,280,000 $3,280,000 $3,280,000
b. Content Fees Internet $30,000 $41,000 $41,000 $41,000 $41,000
Total $30,000 $41,000 $41,000 $41,000 $41,000
c. Operating Costs Operation Costs $342,000 $440,000 $440,000 $440,000 $440,000
Labor Costs 539,000 938,000 938,000 938,000 938,000
Total $881,000 $1,378,000 $1,378,000 $1,378,000 $1,378,000
d. EBITDA $(570,000) $1,861,000 $1,861,000 $1,861,000 $1,861,000
e. Depreciation 234,000 1,254,000 625,000 617,000 617,000
f. Operating Income (EBITDA less Depreciation) $(804,000) $607,000 $1,236,000 $1,244,000 $1,244,000
g. Non‐Operating Income Interest Income $ ‐ $4,000 $5,000 $3,000 $1,000
Interest Expense (10 Year Bond) ‐ ‐ ‐ ‐ ‐
Interest Expense (20 Year Bond) (185,000) (621,000) (490,000) (324,000) (112,000)
Interest Expense (Loan) _ ‐ _ ‐ _ ‐ _ ‐ _ ‐
Total $(185,000) $(485,000) $(485,000) $(321,000) $(111,000)
h. Net Income (before taxes) $(989,000) $(10,000) $751,000 $923,000 $1,133,000
i. Facility Taxes $ ‐ $ ‐ $ ‐ $ ‐ $ ‐
j. Net Income $(989,000) $(10,000) $751,000 $923,000 $1,133,000
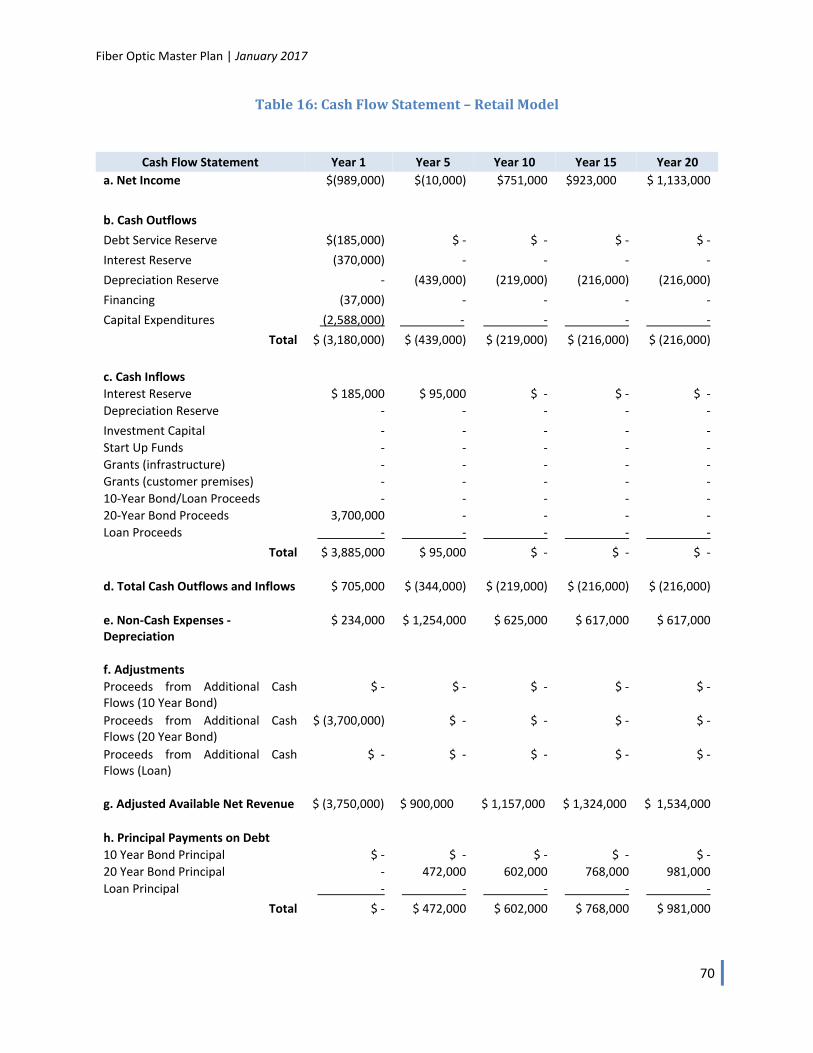
Fiber Optic Master Plan | January 2017
70
Table16:CashFlowStatement–RetailModel
Cash Flow Statement Year 1 Year 5 Year 10 Year 15 Year 20
a. Net Income $(989,000) $(10,000) $751,000 $923,000 $ 1,133,000
b. Cash Outflows
Debt Service Reserve $(185,000) $ ‐ $ ‐ $ ‐ $ ‐
Interest Reserve (370,000) ‐ ‐ ‐ ‐
Depreciation Reserve ‐ (439,000) (219,000) (216,000) (216,000)
Financing (37,000) ‐ ‐ ‐ ‐
Capital Expenditures (2,588,000) ‐ ‐ ‐ ‐
Total $ (3,180,000) $ (439,000) $ (219,000) $ (216,000) $ (216,000)
c. Cash Inflows
Interest Reserve $ 185,000 $ 95,000 $ ‐ $ ‐ $ ‐
Depreciation Reserve ‐ ‐ ‐ ‐ ‐
Investment Capital ‐ ‐ ‐ ‐ ‐
Start Up Funds ‐ ‐ ‐ ‐ ‐
Grants (infrastructure) ‐ ‐ ‐ ‐ ‐
Grants (customer premises) ‐ ‐ ‐ ‐ ‐
10‐Year Bond/Loan Proceeds ‐ ‐ ‐ ‐ ‐
20‐Year Bond Proceeds 3,700,000 ‐ ‐ ‐ ‐
Loan Proceeds ‐ ‐ ‐ ‐ ‐
Total $ 3,885,000 $ 95,000 $ ‐ $ ‐ $ ‐
d. Total Cash Outflows and Inflows $ 705,000 $ (344,000) $ (219,000) $ (216,000) $ (216,000)
e. Non‐Cash Expenses ‐ Depreciation
$ 234,000 $ 1,254,000 $ 625,000 $ 617,000 $ 617,000
f. Adjustments
Proceeds from Additional Cash Flows (10 Year Bond)
$ ‐ $ ‐ $ ‐ $ ‐ $ ‐
Proceeds from Additional Cash Flows (20 Year Bond)
$ (3,700,000) $ ‐ $ ‐ $ ‐ $ ‐
Proceeds from Additional Cash Flows (Loan)
$ ‐ $ ‐ $ ‐ $ ‐ $ ‐
g. Adjusted Available Net Revenue $ (3,750,000) $ 900,000 $ 1,157,000 $ 1,324,000 $ 1,534,000
h. Principal Payments on Debt
10 Year Bond Principal $ ‐ $ ‐ $ ‐ $ ‐ $ ‐
20 Year Bond Principal ‐ 472,000 602,000 768,000 981,000
Loan Principal ‐ ‐ ‐ ‐ ‐
Total $ ‐ $ 472,000 $ 602,000 $ 768,000 $ 981,000
Fiber Optic Master Plan | January 2017
71
Significant network expenses—known as “capital additions”—are incurred in the first few years
during the construction phase of the network. These represent the equipment and labor
expenses associated with building, implementing, and lighting a fiber network. Table 17 shows
the capital additions costs in years one, two, and three, and the total for years one through three.
This analysis projects that the capital additions in year one will total approximately $2.6 million.
These costs will total approximately $3.5 million in year two, $1.8 million in year three, and $2.6
million in year four. This totals just over $10.5 million for total capital additions costs for years
one through four.
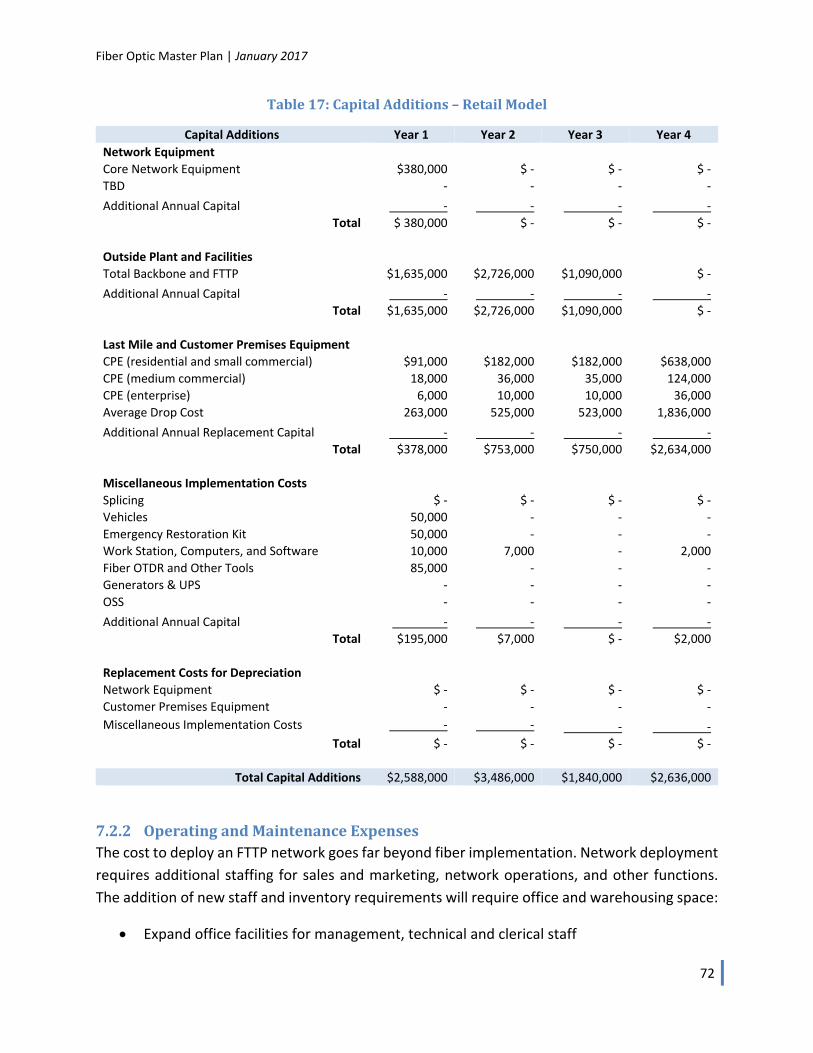
Fiber Optic Master Plan | January 2017
72
Table17:CapitalAdditions–RetailModel
Capital Additions Year 1 Year 2 Year 3 Year 4
Network Equipment Core Network Equipment $380,000 $ ‐ $ ‐ $ ‐
TBD ‐ ‐ ‐ ‐
Additional Annual Capital ‐ ‐ ‐ ‐
Total $ 380,000 $ ‐ $ ‐ $ ‐
Outside Plant and Facilities Total Backbone and FTTP $1,635,000 $2,726,000 $1,090,000 $ ‐
Additional Annual Capital ‐ ‐ ‐ ‐
Total $1,635,000 $2,726,000 $1,090,000 $ ‐
Last Mile and Customer Premises Equipment CPE (residential and small commercial) $91,000 $182,000 $182,000 $638,000
CPE (medium commercial) 18,000 36,000 35,000 124,000
CPE (enterprise) 6,000 10,000 10,000 36,000
Average Drop Cost 263,000 525,000 523,000 1,836,000
Additional Annual Replacement Capital ‐ ‐ ‐ ‐
Total $378,000 $753,000 $750,000 $2,634,000
Miscellaneous Implementation Costs Splicing $ ‐ $ ‐ $ ‐ $ ‐
Vehicles 50,000 ‐ ‐ ‐
Emergency Restoration Kit 50,000 ‐ ‐ ‐
Work Station, Computers, and Software 10,000 7,000 ‐ 2,000
Fiber OTDR and Other Tools 85,000 ‐ ‐ ‐
Generators & UPS ‐ ‐ ‐ ‐
OSS ‐ ‐ ‐ ‐
Additional Annual Capital ‐ ‐ ‐ ‐
Total $195,000 $7,000 $ ‐ $2,000
Replacement Costs for Depreciation Network Equipment $ ‐ $ ‐ $ ‐ $ ‐
Customer Premises Equipment ‐ ‐ ‐ ‐
Miscellaneous Implementation Costs ‐ ‐ ‐ ‐
Total $ ‐ $ ‐ $ ‐ $ ‐
Total Capital Additions $2,588,000 $3,486,000 $1,840,000 $2,636,000
7.2.2 OperatingandMaintenanceExpensesThe cost to deploy an FTTP network goes far beyond fiber implementation. Network deployment
requires additional staffing for sales and marketing, network operations, and other functions.
The addition of new staff and inventory requirements will require office and warehousing space:
Expand office facilities for management, technical and clerical staff
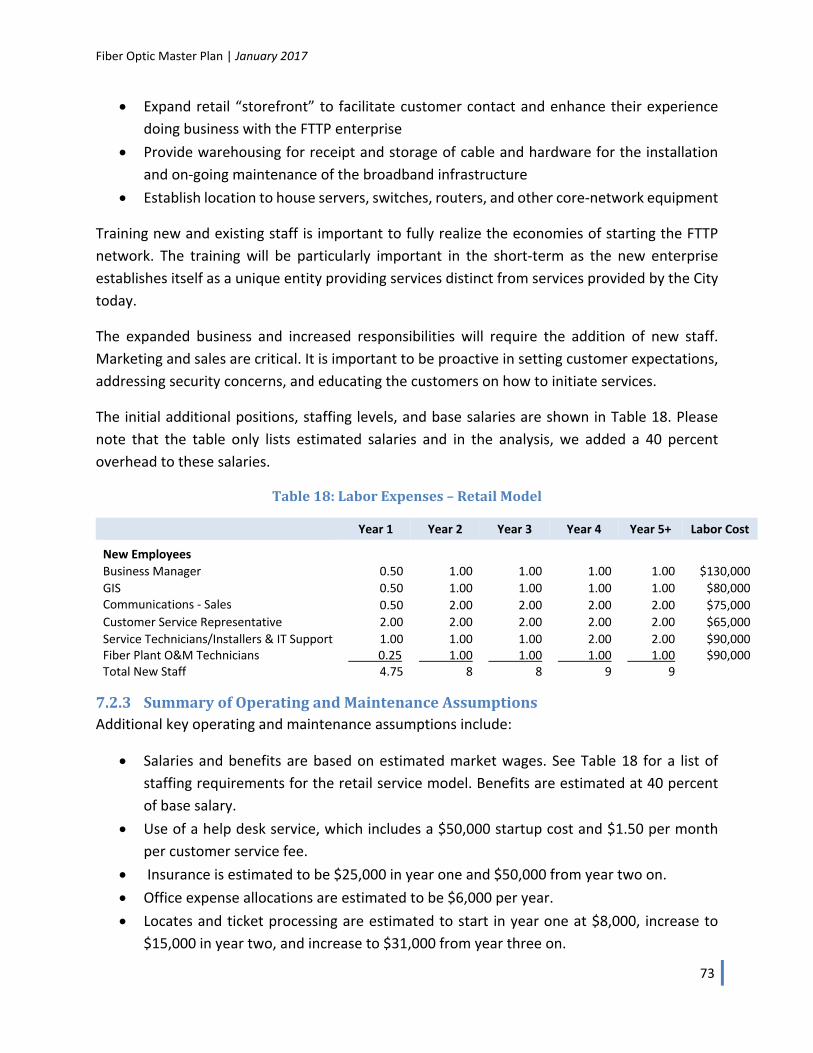
Fiber Optic Master Plan | January 2017
73
Expand retail “storefront” to facilitate customer contact and enhance their experience
doing business with the FTTP enterprise
Provide warehousing for receipt and storage of cable and hardware for the installation
and on‐going maintenance of the broadband infrastructure
Establish location to house servers, switches, routers, and other core‐network equipment
Training new and existing staff is important to fully realize the economies of starting the FTTP
network. The training will be particularly important in the short‐term as the new enterprise
establishes itself as a unique entity providing services distinct from services provided by the City
today.
The expanded business and increased responsibilities will require the addition of new staff.
Marketing and sales are critical. It is important to be proactive in setting customer expectations,
addressing security concerns, and educating the customers on how to initiate services.
The initial additional positions, staffing levels, and base salaries are shown in Table 18. Please
note that the table only lists estimated salaries and in the analysis, we added a 40 percent
overhead to these salaries.
Table18:LaborExpenses–RetailModel
Year 1 Year 2 Year 3 Year 4 Year 5+ Labor Cost
New Employees
Business Manager 0.50 1.00 1.00 1.00 1.00 $130,000
GIS 0.50 1.00 1.00 1.00 1.00 $80,000 Communications ‐ Sales 0.50 2.00 2.00 2.00 2.00 $75,000
Customer Service Representative 2.00 2.00 2.00 2.00 2.00 $65,000
Service Technicians/Installers & IT Support 1.00 1.00 1.00 2.00 2.00 $90,000 Fiber Plant O&M Technicians 0.25 1.00 1.00 1.00 1.00 $90,000Total New Staff 4.75 8 8 9 9
7.2.3 SummaryofOperatingandMaintenanceAssumptionsAdditional key operating and maintenance assumptions include:
Salaries and benefits are based on estimated market wages. See Table 18 for a list of
staffing requirements for the retail service model. Benefits are estimated at 40 percent
of base salary.
Use of a help desk service, which includes a $50,000 startup cost and $1.50 per month
per customer service fee.
Insurance is estimated to be $25,000 in year one and $50,000 from year two on.
Office expense allocations are estimated to be $6,000 per year.
Locates and ticket processing are estimated to start in year one at $8,000, increase to
$15,000 in year two, and increase to $31,000 from year three on.
Fiber Optic Master Plan | January 2017
74
Contingency is estimated to be $10,000 in year one and $25,000 from year two on.
Billing and maintenance contract fees are estimated at $10,000 in year one, and $20,000
from year two on.
Legal fees are estimated to be $50,000 in year one, and $10,000 from year two on.
Consulting fees are estimated at $50,000 in year one, and $10,000 from year three on.
Marketing and promotional expenses are estimated to be $100,000 in year one, and
$50,000 from year two on.
Vendor maintenance contract fees are expected to start at $43,000 in year two, increase to
$52,000 in year three, and increase again to $83,000 in year four; these fees are expected to
remain steady at $83,000 per year beyond year four. Annual variable and operating expenses not
including direct Internet access include:
Education and training are calculated as 2 percent of direct payroll expense.
Customer billing is estimated to be $0.25 per bill per month.
Allowance for bad debts is computed as 1 percent of revenues.
Churn is anticipated to be 5 percent annually.
Fiber network maintenance costs are calculated at 1 percent of the total construction cost, per
year. This is estimated based on a typical rate of occurrence in an urban environment, and the
cost of individual repairs. This is in addition to staffing costs to maintain fiber.
Internet and peering is estimated at $1.25 per Mbps per month for the first 2 Gbps, and $1.00
per Mbps per month thereafter.
7.2.4 Take‐RateSensitivityThis section shows the large impact that fluctuations in take rate can have on financial modeling.
In the following tables, we show the financial projections for take rates of 50 percent, 40 percent,
and 30 percent.
Please note that, based on other competitive overbuilds, obtaining a 60 percent take rate is
considered aggressive, and will likely be difficult to obtain and maintain. Realistically, we would
expect a 35 percent to 45 percent take rate.
Note that the total unrestricted cash balance in year one with a 50 percent take rate is projected
as a loss of $50,000, as shown in Table 19, below. This number is the same as the projections for
a 60 percent take rate (see Table 13, above), but by the time we reach year five, the numbers
diverge significantly.
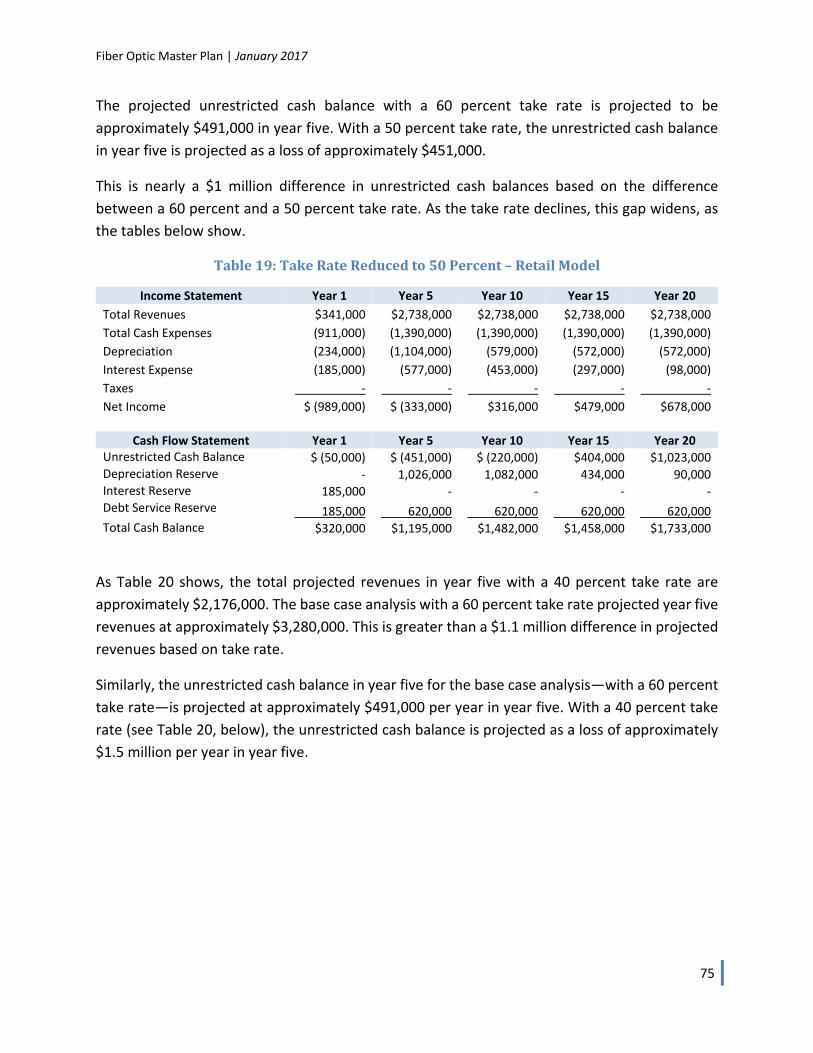
Fiber Optic Master Plan | January 2017
75
The projected unrestricted cash balance with a 60 percent take rate is projected to be
approximately $491,000 in year five. With a 50 percent take rate, the unrestricted cash balance
in year five is projected as a loss of approximately $451,000.
This is nearly a $1 million difference in unrestricted cash balances based on the difference
between a 60 percent and a 50 percent take rate. As the take rate declines, this gap widens, as
the tables below show.
Table19:TakeRateReducedto50Percent–RetailModel
Income Statement Year 1 Year 5 Year 10 Year 15 Year 20
Total Revenues $341,000 $2,738,000 $2,738,000 $2,738,000 $2,738,000
Total Cash Expenses (911,000) (1,390,000) (1,390,000) (1,390,000) (1,390,000)
Depreciation (234,000) (1,104,000) (579,000) (572,000) (572,000)
Interest Expense (185,000) (577,000) (453,000) (297,000) (98,000)
Taxes ‐ ‐ ‐ ‐ ‐
Net Income $ (989,000) $ (333,000) $316,000 $479,000 $678,000
Cash Flow Statement Year 1 Year 5 Year 10 Year 15 Year 20
Unrestricted Cash Balance $ (50,000) $ (451,000) $ (220,000) $404,000 $1,023,000 Depreciation Reserve ‐ 1,026,000 1,082,000 434,000 90,000 Interest Reserve 185,000 ‐ ‐ ‐ ‐ Debt Service Reserve 185,000 620,000 620,000 620,000 620,000 Total Cash Balance $320,000 $1,195,000 $1,482,000 $1,458,000 $1,733,000
As Table 20 shows, the total projected revenues in year five with a 40 percent take rate are
approximately $2,176,000. The base case analysis with a 60 percent take rate projected year five
revenues at approximately $3,280,000. This is greater than a $1.1 million difference in projected
revenues based on take rate.
Similarly, the unrestricted cash balance in year five for the base case analysis—with a 60 percent
take rate—is projected at approximately $491,000 per year in year five. With a 40 percent take
rate (see Table 20, below), the unrestricted cash balance is projected as a loss of approximately
$1.5 million per year in year five.
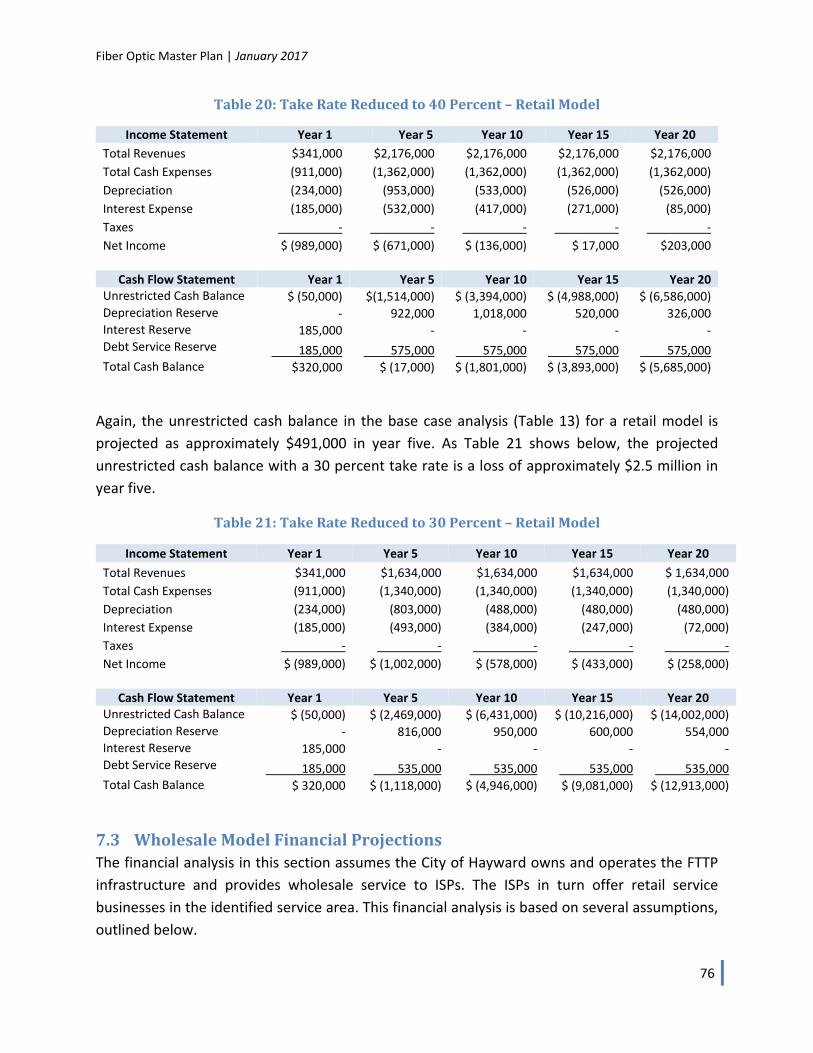
Fiber Optic Master Plan | January 2017
76
Table20:TakeRateReducedto40Percent–RetailModel
Income Statement Year 1 Year 5 Year 10 Year 15 Year 20
Total Revenues $341,000 $2,176,000 $2,176,000 $2,176,000 $2,176,000
Total Cash Expenses (911,000) (1,362,000) (1,362,000) (1,362,000) (1,362,000)
Depreciation (234,000) (953,000) (533,000) (526,000) (526,000)
Interest Expense (185,000) (532,000) (417,000) (271,000) (85,000)
Taxes ‐ ‐ ‐ ‐ ‐
Net Income $ (989,000) $ (671,000) $ (136,000) $ 17,000 $203,000
Cash Flow Statement Year 1 Year 5 Year 10 Year 15 Year 20
Unrestricted Cash Balance $ (50,000) $(1,514,000) $ (3,394,000) $ (4,988,000) $ (6,586,000) Depreciation Reserve ‐ 922,000 1,018,000 520,000 326,000 Interest Reserve 185,000 ‐ ‐ ‐ ‐ Debt Service Reserve 185,000 575,000 575,000 575,000 575,000 Total Cash Balance $320,000 $ (17,000) $ (1,801,000) $ (3,893,000) $ (5,685,000)
Again, the unrestricted cash balance in the base case analysis (Table 13) for a retail model is
projected as approximately $491,000 in year five. As Table 21 shows below, the projected
unrestricted cash balance with a 30 percent take rate is a loss of approximately $2.5 million in
year five.
Table21:TakeRateReducedto30Percent–RetailModel
Income Statement Year 1 Year 5 Year 10 Year 15 Year 20
Total Revenues $341,000 $1,634,000 $1,634,000 $1,634,000 $ 1,634,000
Total Cash Expenses (911,000) (1,340,000) (1,340,000) (1,340,000) (1,340,000)
Depreciation (234,000) (803,000) (488,000) (480,000) (480,000)
Interest Expense (185,000) (493,000) (384,000) (247,000) (72,000)
Taxes ‐ ‐ ‐ ‐ ‐
Net Income $ (989,000) $ (1,002,000) $ (578,000) $ (433,000) $ (258,000)
Cash Flow Statement Year 1 Year 5 Year 10 Year 15 Year 20
Unrestricted Cash Balance $ (50,000) $ (2,469,000) $ (6,431,000) $ (10,216,000) $ (14,002,000) Depreciation Reserve ‐ 816,000 950,000 600,000 554,000 Interest Reserve 185,000 ‐ ‐ ‐ ‐ Debt Service Reserve 185,000 535,000 535,000 535,000 535,000 Total Cash Balance $ 320,000 $ (1,118,000) $ (4,946,000) $ (9,081,000) $ (12,913,000)
7.3 WholesaleModelFinancialProjectionsThe financial analysis in this section assumes the City of Hayward owns and operates the FTTP
infrastructure and provides wholesale service to ISPs. The ISPs in turn offer retail service
businesses in the identified service area. This financial analysis is based on several assumptions,
outlined below.
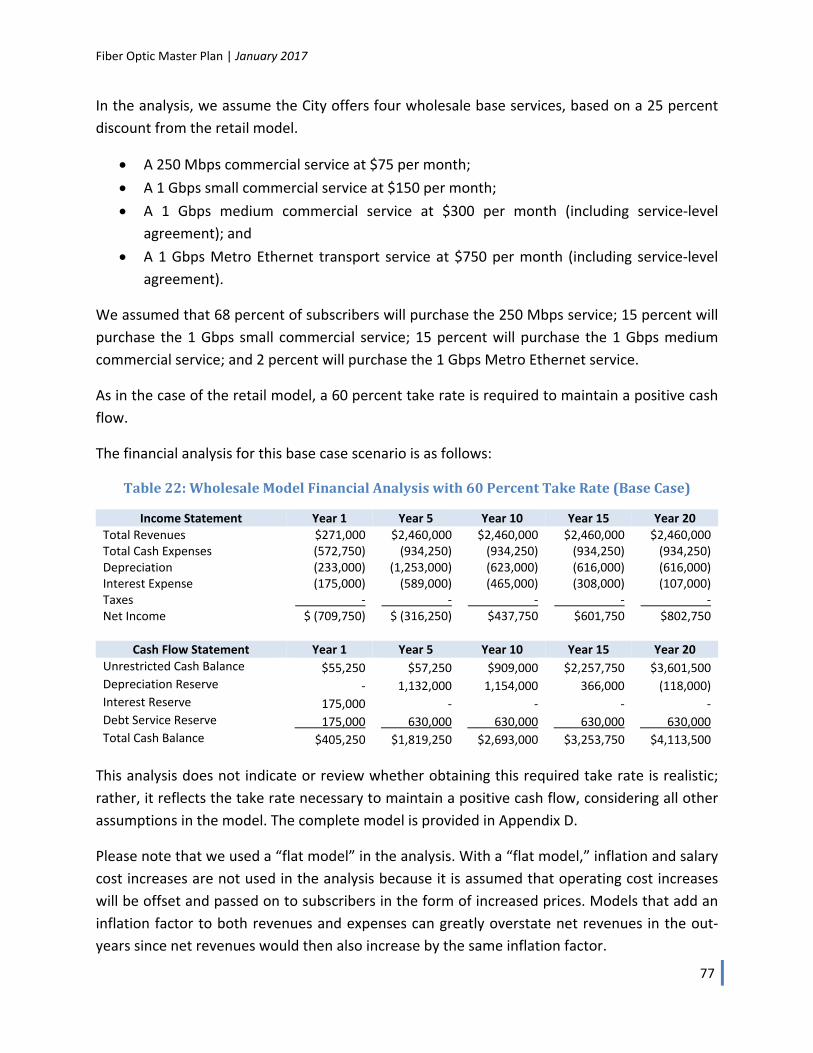
Fiber Optic Master Plan | January 2017
77
In the analysis, we assume the City offers four wholesale base services, based on a 25 percent
discount from the retail model.
A 250 Mbps commercial service at $75 per month;
A 1 Gbps small commercial service at $150 per month;
A 1 Gbps medium commercial service at $300 per month (including service‐level
agreement); and
A 1 Gbps Metro Ethernet transport service at $750 per month (including service‐level
agreement).
We assumed that 68 percent of subscribers will purchase the 250 Mbps service; 15 percent will
purchase the 1 Gbps small commercial service; 15 percent will purchase the 1 Gbps medium
commercial service; and 2 percent will purchase the 1 Gbps Metro Ethernet service.
As in the case of the retail model, a 60 percent take rate is required to maintain a positive cash
flow.
The financial analysis for this base case scenario is as follows:
Table22:WholesaleModelFinancialAnalysiswith60PercentTakeRate(BaseCase)
Income Statement Year 1 Year 5 Year 10 Year 15 Year 20 Total Revenues $271,000 $2,460,000 $2,460,000 $2,460,000 $2,460,000 Total Cash Expenses (572,750) (934,250) (934,250) (934,250) (934,250)Depreciation (233,000) (1,253,000) (623,000) (616,000) (616,000)Interest Expense (175,000) (589,000) (465,000) (308,000) (107,000)Taxes ‐ ‐ ‐ ‐ ‐Net Income $ (709,750) $ (316,250) $437,750 $601,750 $802,750
Cash Flow Statement Year 1 Year 5 Year 10 Year 15 Year 20
Unrestricted Cash Balance $55,250 $57,250 $909,000 $2,257,750 $3,601,500 Depreciation Reserve ‐ 1,132,000 1,154,000 366,000 (118,000) Interest Reserve 175,000 ‐ ‐ ‐ ‐ Debt Service Reserve 175,000 630,000 630,000 630,000 630,000 Total Cash Balance $405,250 $1,819,250 $2,693,000 $3,253,750 $4,113,500
This analysis does not indicate or review whether obtaining this required take rate is realistic;
rather, it reflects the take rate necessary to maintain a positive cash flow, considering all other
assumptions in the model. The complete model is provided in Appendix D.
Please note that we used a “flat model” in the analysis. With a “flat model,” inflation and salary
cost increases are not used in the analysis because it is assumed that operating cost increases
will be offset and passed on to subscribers in the form of increased prices. Models that add an
inflation factor to both revenues and expenses can greatly overstate net revenues in the out‐
years since net revenues would then also increase by the same inflation factor.
Fiber Optic Master Plan | January 2017
78
7.3.1 FinancingCostsandOperatingExpensesThis financial analysis assumes a combination of bonds and loans will be necessary. We expect
that the City will seek 20‐year bonds with principal repayments starting the year after issuance.
We project that the bond issuance costs will be equal to 1.0 percent of the principal borrowed.
For the bond, a debt service reserve account is maintained at 5.0 percent of the total issuance
amount. An interest reserve account equal to years one and two interest expense is maintained
for the first two years.
Our analysis estimates total bonding requirements to be $12.6 million and are issued at a 5
percent interest rate.
The model assumes a straight‐line depreciation of assets, and that the OSP and materials will
have a 20‐year life span while network equipment will need to be replaced after 10 years. Last
mile and CPEs as well as other miscellaneous implementation costs will need to be accounted for
after five years. Network equipment will be replaced or upgraded at 80 percent of its original
cost, miscellaneous implementation costs will be at 100 percent, and last mile and CPEs will be
at 100 percent. The model plans for a depreciation reserve account starting in year three ‐ this
funds future electronics replacements and upgrades.
Table 23 shows operating expenses for years one, five, 10, 15, and 20. As seen, some expenses
will remain constant while others will increase as the network matures and the customer base
increases.
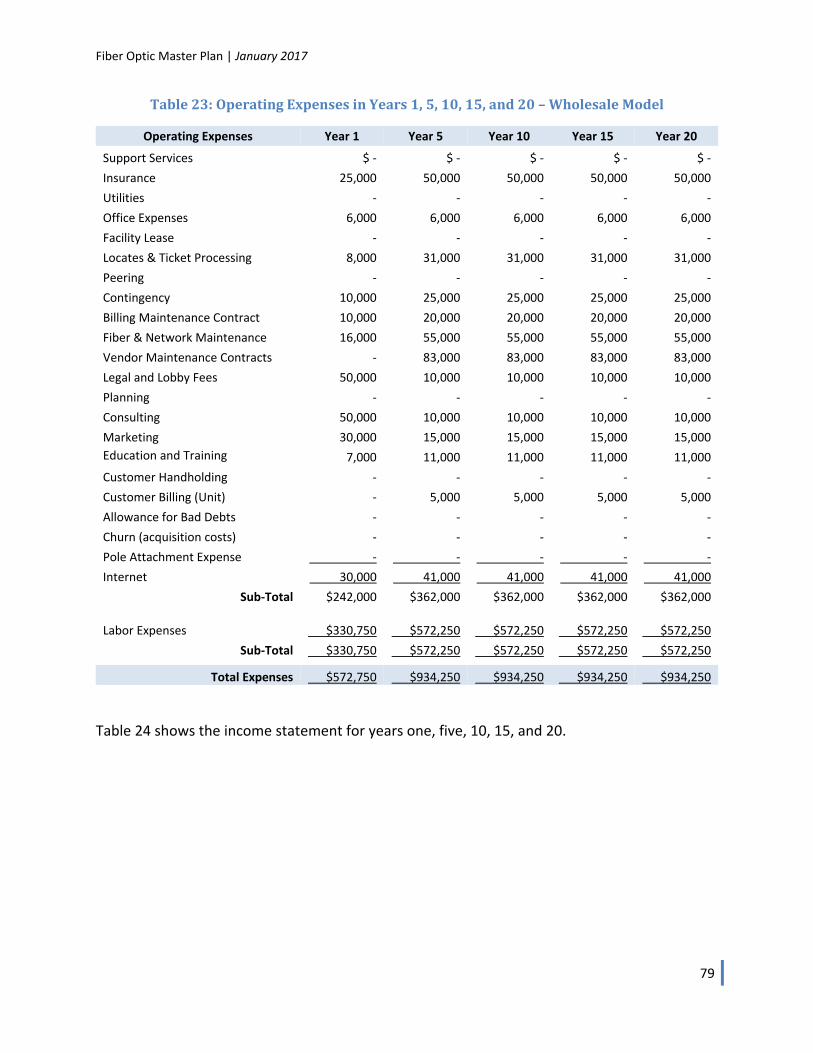
Fiber Optic Master Plan | January 2017
79
Table23:OperatingExpensesinYears1,5,10,15,and20–WholesaleModel
Operating Expenses Year 1 Year 5 Year 10 Year 15 Year 20
Support Services $ ‐ $ ‐ $ ‐ $ ‐ $ ‐
Insurance 25,000 50,000 50,000 50,000 50,000
Utilities ‐ ‐ ‐ ‐ ‐
Office Expenses 6,000 6,000 6,000 6,000 6,000
Facility Lease ‐ ‐ ‐ ‐ ‐
Locates & Ticket Processing 8,000 31,000 31,000 31,000 31,000
Peering ‐ ‐ ‐ ‐ ‐
Contingency 10,000 25,000 25,000 25,000 25,000
Billing Maintenance Contract 10,000 20,000 20,000 20,000 20,000
Fiber & Network Maintenance 16,000 55,000 55,000 55,000 55,000
Vendor Maintenance Contracts ‐ 83,000 83,000 83,000 83,000
Legal and Lobby Fees 50,000 10,000 10,000 10,000 10,000
Planning ‐ ‐ ‐ ‐ ‐
Consulting 50,000 10,000 10,000 10,000 10,000
Marketing 30,000 15,000 15,000 15,000 15,000
Education and Training 7,000 11,000 11,000 11,000 11,000
Customer Handholding ‐ ‐ ‐ ‐ ‐
Customer Billing (Unit) ‐ 5,000 5,000 5,000 5,000
Allowance for Bad Debts ‐ ‐ ‐ ‐ ‐
Churn (acquisition costs) ‐ ‐ ‐ ‐ ‐
Pole Attachment Expense ‐ ‐ ‐ ‐ ‐
Internet 30,000 41,000 41,000 41,000 41,000
Sub‐Total $242,000 $362,000 $362,000 $362,000 $362,000 Labor Expenses $330,750 $572,250 $572,250 $572,250 $572,250
Sub‐Total $330,750 $572,250 $572,250 $572,250 $572,250
Total Expenses $572,750 $934,250 $934,250 $934,250 $934,250
Table 24 shows the income statement for years one, five, 10, 15, and 20.
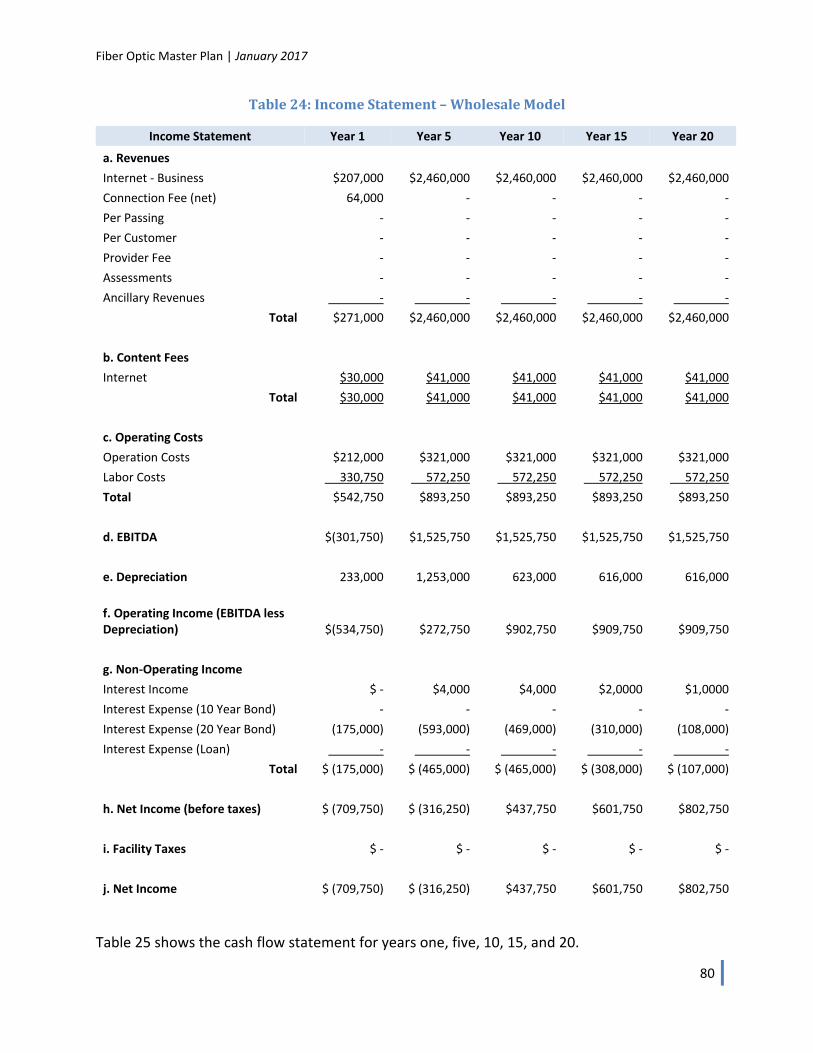
Fiber Optic Master Plan | January 2017
80
Table24:IncomeStatement–WholesaleModel
Income Statement Year 1 Year 5 Year 10 Year 15 Year 20
a. Revenues Internet ‐ Business $207,000 $2,460,000 $2,460,000 $2,460,000 $2,460,000
Connection Fee (net) 64,000 ‐ ‐ ‐ ‐
Per Passing ‐ ‐ ‐ ‐ ‐
Per Customer ‐ ‐ ‐ ‐ ‐
Provider Fee ‐ ‐ ‐ ‐ ‐
Assessments ‐ ‐ ‐ ‐ ‐
Ancillary Revenues ‐ ‐ ‐ ‐ ‐
Total $271,000 $2,460,000 $2,460,000 $2,460,000 $2,460,000
b. Content Fees Internet $30,000 $41,000 $41,000 $41,000 $41,000
Total $30,000 $41,000 $41,000 $41,000 $41,000
c. Operating Costs Operation Costs $212,000 $321,000 $321,000 $321,000 $321,000
Labor Costs 330,750 572,250 572,250 572,250 572,250
Total $542,750 $893,250 $893,250 $893,250 $893,250
d. EBITDA $(301,750) $1,525,750 $1,525,750 $1,525,750 $1,525,750
e. Depreciation 233,000 1,253,000 623,000 616,000 616,000
f. Operating Income (EBITDA less Depreciation) $(534,750) $272,750 $902,750 $909,750 $909,750
g. Non‐Operating Income Interest Income $ ‐ $4,000 $4,000 $2,0000 $1,0000
Interest Expense (10 Year Bond) ‐ ‐ ‐ ‐ ‐
Interest Expense (20 Year Bond) (175,000) (593,000) (469,000) (310,000) (108,000)
Interest Expense (Loan) ‐ ‐ ‐ ‐ ‐
Total $ (175,000) $ (465,000) $ (465,000) $ (308,000) $ (107,000)
h. Net Income (before taxes) $ (709,750) $ (316,250) $437,750 $601,750 $802,750
i. Facility Taxes $ ‐ $ ‐ $ ‐ $ ‐ $ ‐
j. Net Income $ (709,750) $ (316,250) $437,750 $601,750 $802,750
Table 25 shows the cash flow statement for years one, five, 10, 15, and 20.
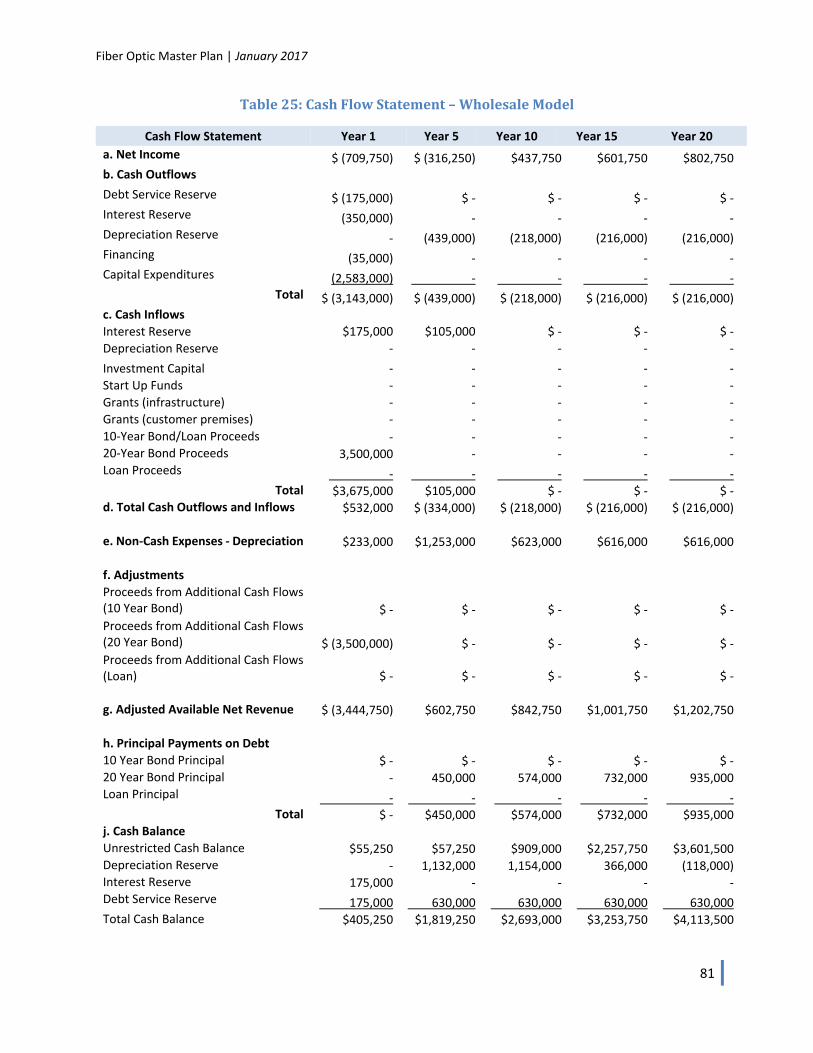
Fiber Optic Master Plan | January 2017
81
Table25:CashFlowStatement–WholesaleModel
Cash Flow Statement Year 1 Year 5 Year 10 Year 15 Year 20
a. Net Income $ (709,750) $ (316,250) $437,750 $601,750 $802,750 b. Cash Outflows
Debt Service Reserve $ (175,000) $ ‐ $ ‐ $ ‐ $ ‐ Interest Reserve (350,000) ‐ ‐ ‐ ‐ Depreciation Reserve ‐ (439,000) (218,000) (216,000) (216,000) Financing (35,000) ‐ ‐ ‐ ‐ Capital Expenditures (2,583,000) ‐ ‐ ‐ ‐
Total $ (3,143,000) $ (439,000) $ (218,000) $ (216,000) $ (216,000) c. Cash Inflows
Interest Reserve $175,000 $105,000 $ ‐ $ ‐ $ ‐
Depreciation Reserve ‐ ‐ ‐ ‐ ‐
Investment Capital ‐ ‐ ‐ ‐ ‐
Start Up Funds ‐ ‐ ‐ ‐ ‐
Grants (infrastructure) ‐ ‐ ‐ ‐ ‐
Grants (customer premises) ‐ ‐ ‐ ‐ ‐
10‐Year Bond/Loan Proceeds ‐ ‐ ‐ ‐ ‐ 20‐Year Bond Proceeds 3,500,000 ‐ ‐ ‐ ‐ Loan Proceeds ‐ ‐ ‐ ‐ ‐
Total $3,675,000 $105,000 $ ‐ $ ‐ $ ‐ d. Total Cash Outflows and Inflows $532,000 $ (334,000) $ (218,000) $ (216,000) $ (216,000)
e. Non‐Cash Expenses ‐ Depreciation $233,000 $1,253,000 $623,000 $616,000 $616,000
f. Adjustments Proceeds from Additional Cash Flows (10 Year Bond) $ ‐ $ ‐ $ ‐ $ ‐ $ ‐ Proceeds from Additional Cash Flows (20 Year Bond) $ (3,500,000) $ ‐ $ ‐ $ ‐ $ ‐ Proceeds from Additional Cash Flows (Loan) $ ‐ $ ‐ $ ‐ $ ‐ $ ‐
g. Adjusted Available Net Revenue $ (3,444,750) $602,750 $842,750 $1,001,750 $1,202,750
h. Principal Payments on Debt
10 Year Bond Principal $ ‐ $ ‐ $ ‐ $ ‐ $ ‐ 20 Year Bond Principal ‐ 450,000 574,000 732,000 935,000 Loan Principal ‐ ‐ ‐ ‐ ‐
Total $ ‐ $450,000 $574,000 $732,000 $935,000 j. Cash Balance
Unrestricted Cash Balance $55,250 $57,250 $909,000 $2,257,750 $3,601,500 Depreciation Reserve ‐ 1,132,000 1,154,000 366,000 (118,000) Interest Reserve 175,000 ‐ ‐ ‐ ‐ Debt Service Reserve 175,000 630,000 630,000 630,000 630,000 Total Cash Balance $405,250 $1,819,250 $2,693,000 $3,253,750 $4,113,500

Fiber Optic Master Plan | January 2017
82
Significant network expenses—known as “capital additions”—are incurred in the first few years
during the construction phase of the network. These represent the equipment and labor
expenses associated with building, implementing, and lighting a fiber network. Table 26 shows
the capital additions costs in years one, two, and three, and the total for years one through three.
This analysis projects that the capital additions in year one will total approximately $2.6 million.
These costs will total approximately $3.5 million in year two, $1.8 million in year three, and $2.6
million in year four. This totals just over $10.5 million for total capital additions costs for years
one through four.

Fiber Optic Master Plan | January 2017
83
Table26:CapitalAdditions–WholesaleModel
Capital Additions Year 1 Year 2 Year 3 Year 4
Network Equipment Core Network Equipment $380,000 $ ‐ $ ‐ $ ‐
TBD ‐ ‐ ‐ ‐
Additional Annual Capital ‐ ‐ ‐ ‐
Total $380,000 $ ‐ $ ‐ $ ‐
Outside Plant and Facilities Total Backbone and FTTP $1,635,000 $2,726,000 $1,090,000 $ ‐
Additional Annual Capital ‐ ‐ ‐ ‐
Total $1,635,000 $2,726,000 $1,090,000 $ ‐
Last Mile and Customer Premises Equipment CPE (residential and small commercial) $91,000 $182,000 $182,000 $638,000
CPE (medium commercial) 18,000 36,000 35,000 124,000
CPE (enterprise) 6,000 10,000 10,000 36,000
Average Drop Cost 263,000 525,000 523,000 1,836,000
Additional Annual Replacement Capital ‐ ‐ ‐ ‐
Total $378,000 $753,000 $750,000 $2,634,000
Miscellaneous Implementation Costs Splicing $ ‐ $ ‐ $ ‐ $ ‐
Vehicles 50,000 ‐ ‐ ‐
Emergency Restoration Kit 50,000 ‐ ‐ ‐
Work Station, Computers, and Software 5,000 4,000 ‐ 2,000
Fiber OTDR and Other Tools 85,000 ‐ ‐ ‐
Generators & UPS ‐ ‐ ‐ ‐
OSS ‐ ‐ ‐ ‐
Additional Annual Capital ‐ ‐ ‐ ‐
Total $190,000 $4,000 $ ‐ $2,000
Replacement Costs for Depreciation Network Equipment $ ‐ $ ‐ $ ‐ $ ‐
Customer Premises Equipment ‐ ‐ ‐ ‐
Miscellaneous Implementation Costs ‐ ‐ ‐ ‐
Total $ ‐ $ ‐ $ ‐ $ ‐
Total Capital Additions $2,583,000 $3,483,000 $1,840,000 $2,636,000
7.3.2 OperatingandMaintenanceExpensesThe cost to deploy an FTTP network goes far beyond fiber implementation. Network deployment
requires additional staffing for sales and marketing, network operations, and other functions.
The addition of new staff and inventory requirements will require office and warehousing space:
Expand office facilities for management, technical and clerical staff
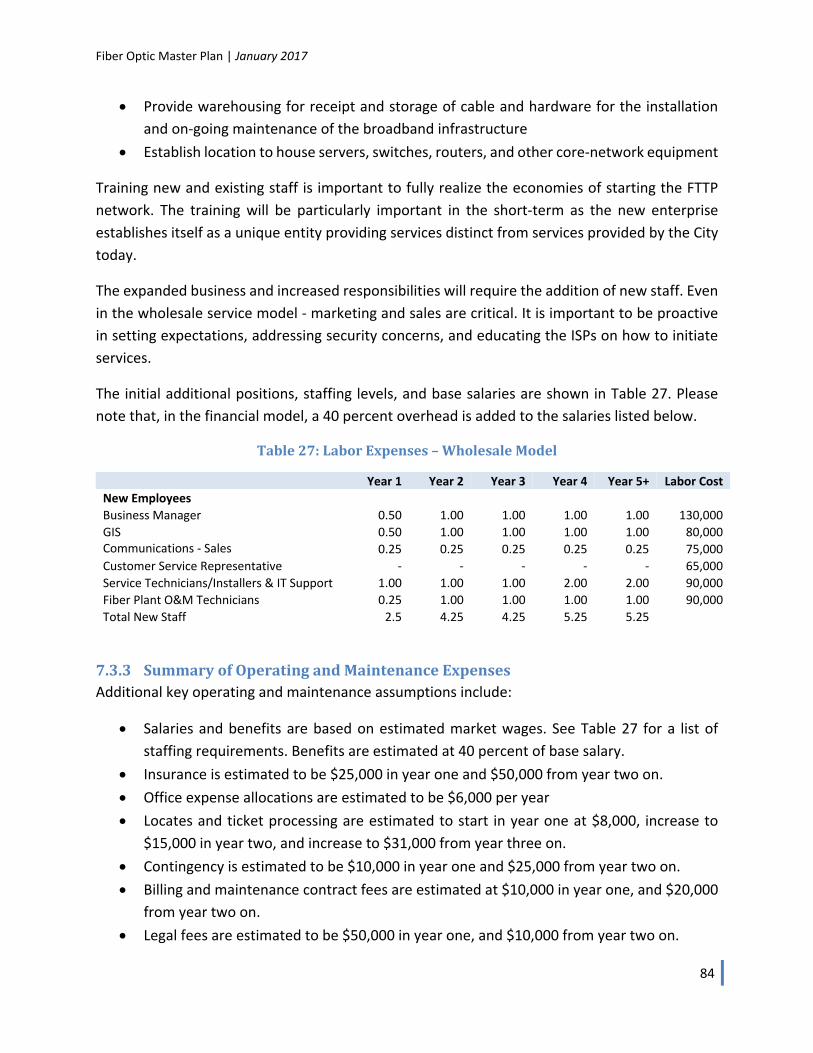
Fiber Optic Master Plan | January 2017
84
Provide warehousing for receipt and storage of cable and hardware for the installation
and on‐going maintenance of the broadband infrastructure
Establish location to house servers, switches, routers, and other core‐network equipment
Training new and existing staff is important to fully realize the economies of starting the FTTP
network. The training will be particularly important in the short‐term as the new enterprise
establishes itself as a unique entity providing services distinct from services provided by the City
today.
The expanded business and increased responsibilities will require the addition of new staff. Even
in the wholesale service model ‐ marketing and sales are critical. It is important to be proactive
in setting expectations, addressing security concerns, and educating the ISPs on how to initiate
services.
The initial additional positions, staffing levels, and base salaries are shown in Table 27. Please
note that, in the financial model, a 40 percent overhead is added to the salaries listed below.
Table27:LaborExpenses–WholesaleModel
Year 1 Year 2 Year 3 Year 4 Year 5+ Labor Cost
New Employees Business Manager 0.50 1.00 1.00 1.00 1.00 130,000
GIS 0.50 1.00 1.00 1.00 1.00 80,000 Communications ‐ Sales 0.25 0.25 0.25 0.25 0.25 75,000
Customer Service Representative ‐ ‐ ‐ ‐ ‐ 65,000
Service Technicians/Installers & IT Support 1.00 1.00 1.00 2.00 2.00 90,000
Fiber Plant O&M Technicians 0.25 1.00 1.00 1.00 1.00 90,000
Total New Staff 2.5 4.25 4.25 5.25 5.25
7.3.3 SummaryofOperatingandMaintenanceExpensesAdditional key operating and maintenance assumptions include:
Salaries and benefits are based on estimated market wages. See Table 27 for a list of
staffing requirements. Benefits are estimated at 40 percent of base salary.
Insurance is estimated to be $25,000 in year one and $50,000 from year two on.
Office expense allocations are estimated to be $6,000 per year
Locates and ticket processing are estimated to start in year one at $8,000, increase to
$15,000 in year two, and increase to $31,000 from year three on.
Contingency is estimated to be $10,000 in year one and $25,000 from year two on.
Billing and maintenance contract fees are estimated at $10,000 in year one, and $20,000
from year two on.
Legal fees are estimated to be $50,000 in year one, and $10,000 from year two on.
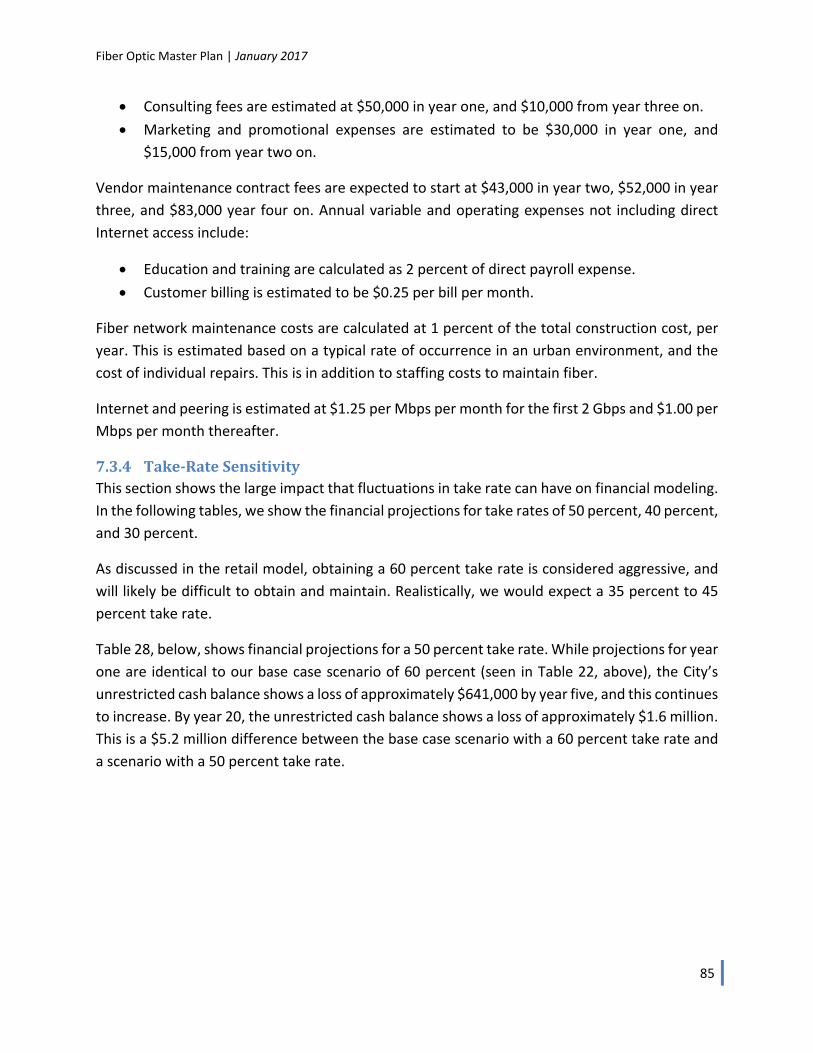
Fiber Optic Master Plan | January 2017
85
Consulting fees are estimated at $50,000 in year one, and $10,000 from year three on.
Marketing and promotional expenses are estimated to be $30,000 in year one, and
$15,000 from year two on.
Vendor maintenance contract fees are expected to start at $43,000 in year two, $52,000 in year
three, and $83,000 year four on. Annual variable and operating expenses not including direct
Internet access include:
Education and training are calculated as 2 percent of direct payroll expense.
Customer billing is estimated to be $0.25 per bill per month.
Fiber network maintenance costs are calculated at 1 percent of the total construction cost, per
year. This is estimated based on a typical rate of occurrence in an urban environment, and the
cost of individual repairs. This is in addition to staffing costs to maintain fiber.
Internet and peering is estimated at $1.25 per Mbps per month for the first 2 Gbps and $1.00 per
Mbps per month thereafter.
7.3.4 Take‐RateSensitivityThis section shows the large impact that fluctuations in take rate can have on financial modeling.
In the following tables, we show the financial projections for take rates of 50 percent, 40 percent,
and 30 percent.
As discussed in the retail model, obtaining a 60 percent take rate is considered aggressive, and
will likely be difficult to obtain and maintain. Realistically, we would expect a 35 percent to 45
percent take rate.
Table 28, below, shows financial projections for a 50 percent take rate. While projections for year
one are identical to our base case scenario of 60 percent (seen in Table 22, above), the City’s
unrestricted cash balance shows a loss of approximately $641,000 by year five, and this continues
to increase. By year 20, the unrestricted cash balance shows a loss of approximately $1.6 million.
This is a $5.2 million difference between the base case scenario with a 60 percent take rate and
a scenario with a 50 percent take rate.
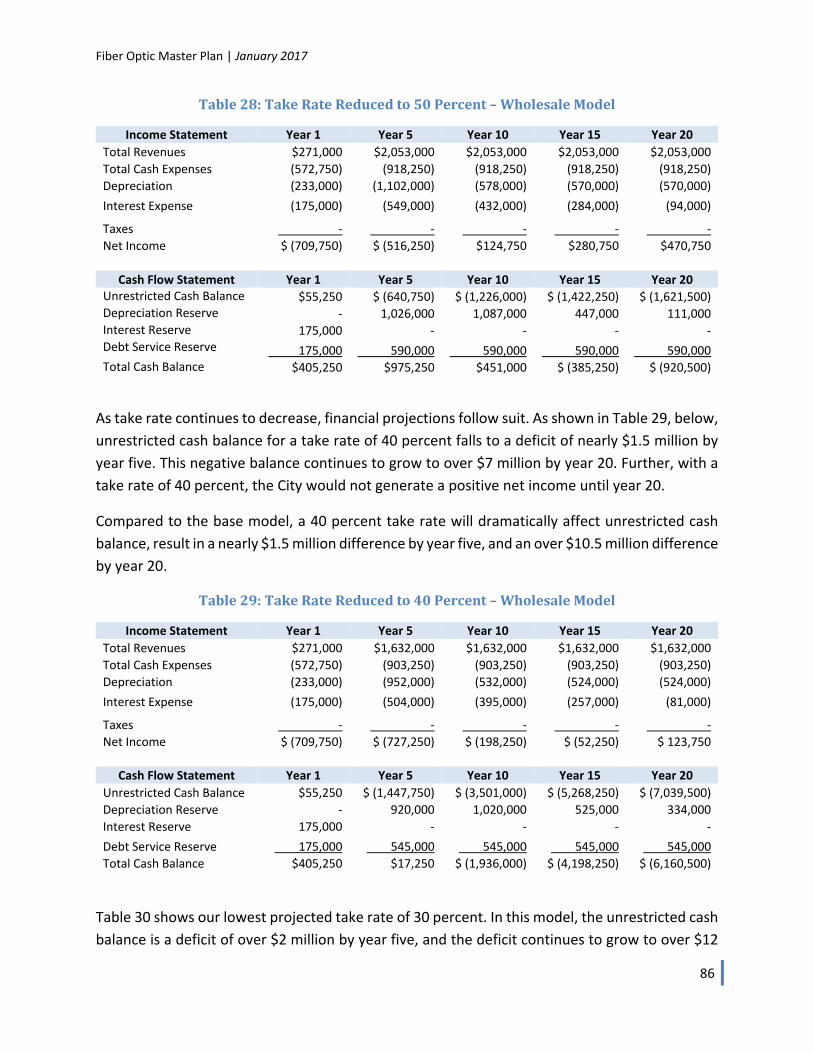
Fiber Optic Master Plan | January 2017
86
Table28:TakeRateReducedto50Percent–WholesaleModel
Income Statement Year 1 Year 5 Year 10 Year 15 Year 20
Total Revenues $271,000 $2,053,000 $2,053,000 $2,053,000 $2,053,000
Total Cash Expenses (572,750) (918,250) (918,250) (918,250) (918,250)
Depreciation (233,000) (1,102,000) (578,000) (570,000) (570,000)
Interest Expense (175,000) (549,000) (432,000) (284,000) (94,000)
Taxes ‐ ‐ ‐ ‐ ‐
Net Income $ (709,750) $ (516,250) $124,750 $280,750 $470,750
Cash Flow Statement Year 1 Year 5 Year 10 Year 15 Year 20
Unrestricted Cash Balance $55,250 $ (640,750) $ (1,226,000) $ (1,422,250) $ (1,621,500) Depreciation Reserve ‐ 1,026,000 1,087,000 447,000 111,000 Interest Reserve 175,000 ‐ ‐ ‐ ‐ Debt Service Reserve 175,000 590,000 590,000 590,000 590,000 Total Cash Balance $405,250 $975,250 $451,000 $ (385,250) $ (920,500)
As take rate continues to decrease, financial projections follow suit. As shown in Table 29, below,
unrestricted cash balance for a take rate of 40 percent falls to a deficit of nearly $1.5 million by
year five. This negative balance continues to grow to over $7 million by year 20. Further, with a
take rate of 40 percent, the City would not generate a positive net income until year 20.
Compared to the base model, a 40 percent take rate will dramatically affect unrestricted cash
balance, result in a nearly $1.5 million difference by year five, and an over $10.5 million difference
by year 20.
Table29:TakeRateReducedto40Percent–WholesaleModel
Income Statement Year 1 Year 5 Year 10 Year 15 Year 20
Total Revenues $271,000 $1,632,000 $1,632,000 $1,632,000 $1,632,000
Total Cash Expenses (572,750) (903,250) (903,250) (903,250) (903,250)
Depreciation (233,000) (952,000) (532,000) (524,000) (524,000)
Interest Expense (175,000) (504,000) (395,000) (257,000) (81,000)
Taxes ‐ ‐ ‐ ‐ ‐
Net Income $ (709,750) $ (727,250) $ (198,250) $ (52,250) $ 123,750
Cash Flow Statement Year 1 Year 5 Year 10 Year 15 Year 20
Unrestricted Cash Balance $55,250 $ (1,447,750) $ (3,501,000) $ (5,268,250) $ (7,039,500)
Depreciation Reserve ‐ 920,000 1,020,000 525,000 334,000
Interest Reserve 175,000 ‐ ‐ ‐ ‐
Debt Service Reserve 175,000 545,000 545,000 545,000 545,000
Total Cash Balance $405,250 $17,250 $ (1,936,000) $ (4,198,250) $ (6,160,500)
Table 30 shows our lowest projected take rate of 30 percent. In this model, the unrestricted cash
balance is a deficit of over $2 million by year five, and the deficit continues to grow to over $12
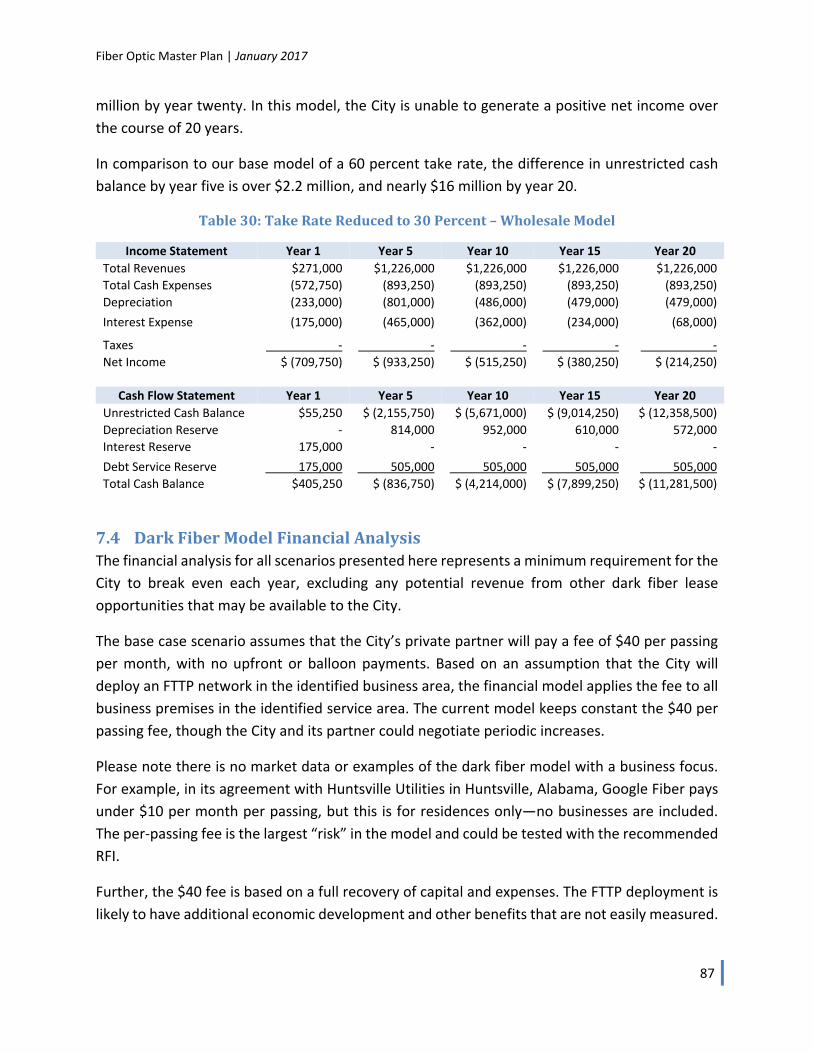
Fiber Optic Master Plan | January 2017
87
million by year twenty. In this model, the City is unable to generate a positive net income over
the course of 20 years.
In comparison to our base model of a 60 percent take rate, the difference in unrestricted cash
balance by year five is over $2.2 million, and nearly $16 million by year 20.
Table30:TakeRateReducedto30Percent–WholesaleModel
Income Statement Year 1 Year 5 Year 10 Year 15 Year 20
Total Revenues $271,000 $1,226,000 $1,226,000 $1,226,000 $1,226,000
Total Cash Expenses (572,750) (893,250) (893,250) (893,250) (893,250)
Depreciation (233,000) (801,000) (486,000) (479,000) (479,000)
Interest Expense (175,000) (465,000) (362,000) (234,000) (68,000)
Taxes ‐ ‐ ‐ ‐ ‐
Net Income $ (709,750) $ (933,250) $ (515,250) $ (380,250) $ (214,250)
Cash Flow Statement Year 1 Year 5 Year 10 Year 15 Year 20
Unrestricted Cash Balance $55,250 $ (2,155,750) $ (5,671,000) $ (9,014,250) $ (12,358,500)
Depreciation Reserve ‐ 814,000 952,000 610,000 572,000
Interest Reserve 175,000 ‐ ‐ ‐ ‐
Debt Service Reserve 175,000 505,000 505,000 505,000 505,000
Total Cash Balance $405,250 $ (836,750) $ (4,214,000) $ (7,899,250) $ (11,281,500)
7.4 DarkFiberModelFinancialAnalysisThe financial analysis for all scenarios presented here represents a minimum requirement for the
City to break even each year, excluding any potential revenue from other dark fiber lease
opportunities that may be available to the City.
The base case scenario assumes that the City’s private partner will pay a fee of $40 per passing
per month, with no upfront or balloon payments. Based on an assumption that the City will
deploy an FTTP network in the identified business area, the financial model applies the fee to all
business premises in the identified service area. The current model keeps constant the $40 per
passing fee, though the City and its partner could negotiate periodic increases.
Please note there is no market data or examples of the dark fiber model with a business focus.
For example, in its agreement with Huntsville Utilities in Huntsville, Alabama, Google Fiber pays
under $10 per month per passing, but this is for residences only—no businesses are included.
The per‐passing fee is the largest “risk” in the model and could be tested with the recommended
RFI.
Further, the $40 fee is based on a full recovery of capital and expenses. The FTTP deployment is
likely to have additional economic development and other benefits that are not easily measured.
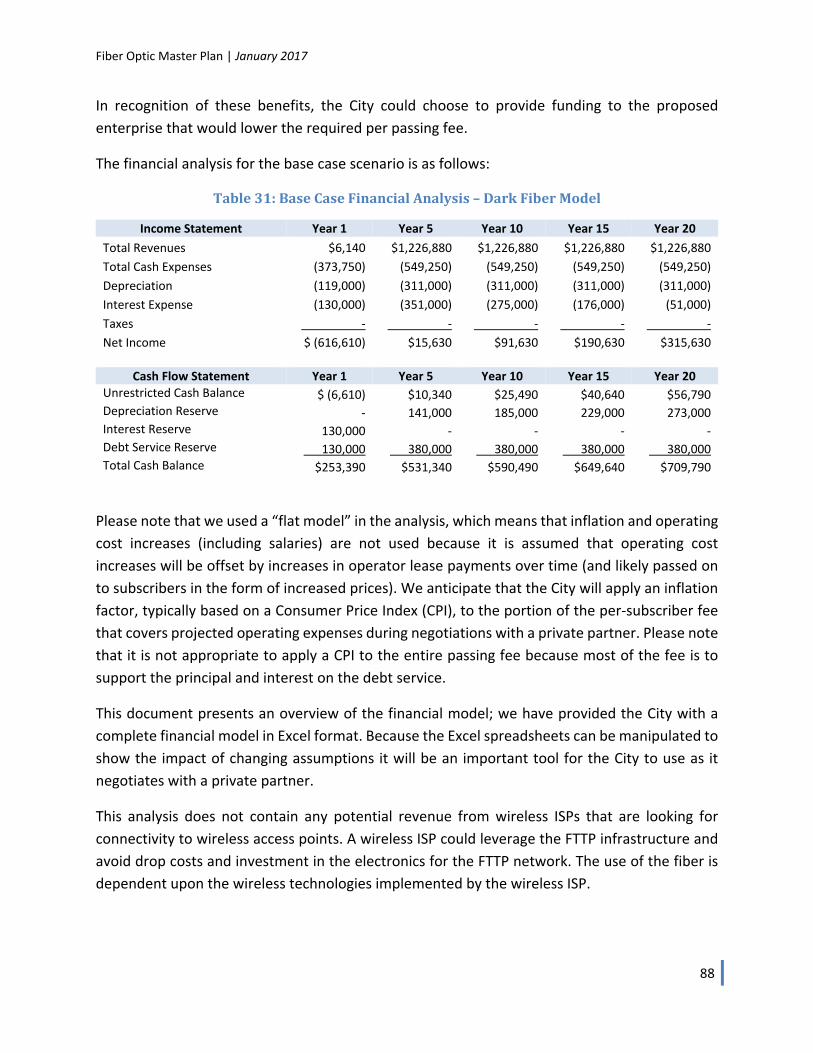
Fiber Optic Master Plan | January 2017
88
In recognition of these benefits, the City could choose to provide funding to the proposed
enterprise that would lower the required per passing fee.
The financial analysis for the base case scenario is as follows:
Table31:BaseCaseFinancialAnalysis–DarkFiberModel
Income Statement Year 1 Year 5 Year 10 Year 15 Year 20
Total Revenues $6,140 $1,226,880 $1,226,880 $1,226,880 $1,226,880
Total Cash Expenses (373,750) (549,250) (549,250) (549,250) (549,250)
Depreciation (119,000) (311,000) (311,000) (311,000) (311,000)
Interest Expense (130,000) (351,000) (275,000) (176,000) (51,000)
Taxes ‐ ‐ ‐ ‐ ‐
Net Income $ (616,610) $15,630 $91,630 $190,630 $315,630
Cash Flow Statement Year 1 Year 5 Year 10 Year 15 Year 20
Unrestricted Cash Balance $ (6,610) $10,340 $25,490 $40,640 $56,790 Depreciation Reserve ‐ 141,000 185,000 229,000 273,000 Interest Reserve 130,000 ‐ ‐ ‐ ‐ Debt Service Reserve 130,000 380,000 380,000 380,000 380,000 Total Cash Balance $253,390 $531,340 $590,490 $649,640 $709,790
Please note that we used a “flat model” in the analysis, which means that inflation and operating
cost increases (including salaries) are not used because it is assumed that operating cost
increases will be offset by increases in operator lease payments over time (and likely passed on
to subscribers in the form of increased prices). We anticipate that the City will apply an inflation
factor, typically based on a Consumer Price Index (CPI), to the portion of the per‐subscriber fee
that covers projected operating expenses during negotiations with a private partner. Please note
that it is not appropriate to apply a CPI to the entire passing fee because most of the fee is to
support the principal and interest on the debt service.
This document presents an overview of the financial model; we have provided the City with a
complete financial model in Excel format. Because the Excel spreadsheets can be manipulated to
show the impact of changing assumptions it will be an important tool for the City to use as it
negotiates with a private partner.
This analysis does not contain any potential revenue from wireless ISPs that are looking for
connectivity to wireless access points. A wireless ISP could leverage the FTTP infrastructure and
avoid drop costs and investment in the electronics for the FTTP network. The use of the fiber is
dependent upon the wireless technologies implemented by the wireless ISP.
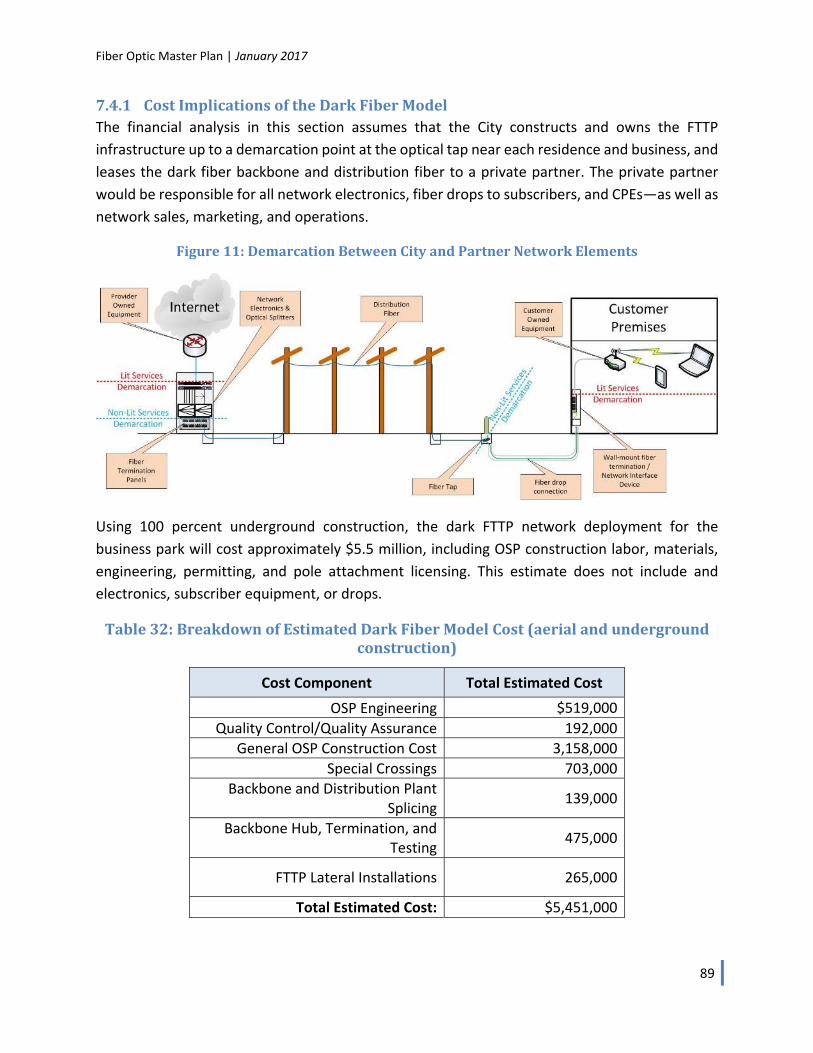
Fiber Optic Master Plan | January 2017
89
7.4.1 CostImplicationsoftheDarkFiberModelThe financial analysis in this section assumes that the City constructs and owns the FTTP
infrastructure up to a demarcation point at the optical tap near each residence and business, and
leases the dark fiber backbone and distribution fiber to a private partner. The private partner
would be responsible for all network electronics, fiber drops to subscribers, and CPEs—as well as
network sales, marketing, and operations.
Figure11:DemarcationBetweenCityandPartnerNetworkElements
Using 100 percent underground construction, the dark FTTP network deployment for the
business park will cost approximately $5.5 million, including OSP construction labor, materials,
engineering, permitting, and pole attachment licensing. This estimate does not include and
electronics, subscriber equipment, or drops.
Table32:BreakdownofEstimatedDarkFiberModelCost(aerialandundergroundconstruction)
Cost Component Total Estimated Cost
OSP Engineering $519,000
Quality Control/Quality Assurance 192,000
General OSP Construction Cost 3,158,000
Special Crossings 703,000
Backbone and Distribution Plant Splicing
139,000
Backbone Hub, Termination, and Testing
475,000
FTTP Lateral Installations 265,000
Total Estimated Cost: $5,451,000
Fiber Optic Master Plan | January 2017
90
The above estimates assume that the City constructs and owns the FTTP infrastructure up to a
demarcation point at the optical tap near each business, and leases the dark fiber backbone and
distribution fiber to a private partner. The private partner would be responsible for all network
electronics, fiber drops to subscribers, and CPEs—as well as network sales, marketing, and
operations.
The ownership of the drops is an assumption that could be changed through negotiation with a
private partner—as, indeed, could many of the assumptions underpinning this analysis. We have
chosen this key parameter for the base case scenario because we believe this approach presents
a reasonable balance of costs, control, and risk for the City. (City ownership of the drops, for
example, would increase the City’s control, but also significantly increase the City’s costs.)
In a related vein, we note that some network operators suggest that the network’s optical
splitters should be a part of the Layer 1 or dark fiber assets. We caution against this approach.
The network operator (i.e., the City’s partner) should maintain the splitters because, as operator
of the electronics, it must determine and control the GPON network split ratio to meet the
network’s performance standards. This may involve moving power users to GPON ports with
lower split ratios, or moving users to different splitters to manage the capacity of the GPON ports.
The City should not be involved in this level of network management. Also, the City should not
have to inventory various sized splitters or swap them as the network operator makes changes.
Even if the City were to decide to purchase some of the optical splitters for the network, we
believe it should be the network operator’s responsibility to manage and maintain the splitters.
7.4.2 FinancingCostsandOperatingExpensesFor the base financial analysis, we used the OSP costs for a combination aerial and underground
construction. In the scenarios, we show the impact of the increased costs for an all‐underground
deployment.
This financial analysis assumes that the City will cover all its capital requirements with general
obligation (GO) bonds. We assumed that the City’s bond rate would be 5 percent.
We expect that the City will take three 20‐year bonds—one each in years one, two, and three—
for a total of $7.6 million in financing. (The difference between the financed amount and the total
capital costs represents the amount needed to maintain positive cash flow in the early years of
network deployment.) The resulting principal and interest (P&I) payments will be the major
factor in determining the City’s long‐term financial requirements; P&I accounts for about 53
percent of the City’s annual costs in our base case model after the construction period.
We project that the bond issuance costs will be equal to 1.0 percent of the principal borrowed.
For the bond, a debt service reserve account is maintained at 5.0 percent of the total issuance
Fiber Optic Master Plan | January 2017
91
amount. An interest reserve account will be maintained for the first two years. Principal
repayment on the bonds will start in year two.
The model assumes a straight‐line depreciation of assets, and that the OSP and materials will
have a 20‐year life span. Because we assume the City’s partner will be responsible for network
electronics and CPE, we have not included depreciation or replacement costs for that equipment
(although we note that, typically, network equipment would be replaced after 10 years, while
CPE and last‐mile infrastructure would be depreciated over five years). The model plans for a
depreciation reserve account starting in year three to fund future replacements and upgrades.
Table 33 shows the income statement for years one, five, 10, 15, and 20.
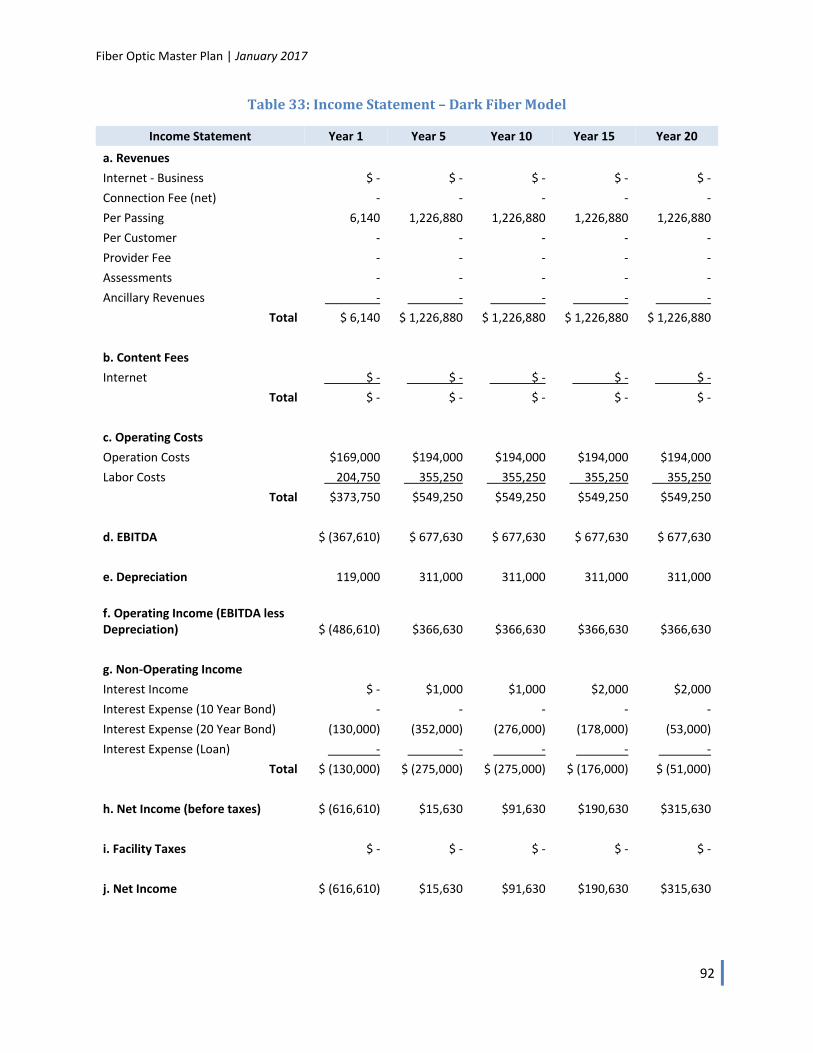
Fiber Optic Master Plan | January 2017
92
Table33:IncomeStatement–DarkFiberModel
Income Statement Year 1 Year 5 Year 10 Year 15 Year 20
a. Revenues Internet ‐ Business $ ‐ $ ‐ $ ‐ $ ‐ $ ‐
Connection Fee (net) ‐ ‐ ‐ ‐ ‐
Per Passing 6,140 1,226,880 1,226,880 1,226,880 1,226,880
Per Customer ‐ ‐ ‐ ‐ ‐
Provider Fee ‐ ‐ ‐ ‐ ‐
Assessments ‐ ‐ ‐ ‐ ‐
Ancillary Revenues ‐ ‐ ‐ ‐ ‐
Total $ 6,140 $ 1,226,880 $ 1,226,880 $ 1,226,880 $ 1,226,880
b. Content Fees Internet $ ‐ $ ‐ $ ‐ $ ‐ $ ‐
Total $ ‐ $ ‐ $ ‐ $ ‐ $ ‐
c. Operating Costs Operation Costs $169,000 $194,000 $194,000 $194,000 $194,000
Labor Costs 204,750 355,250 355,250 355,250 355,250
Total $373,750 $549,250 $549,250 $549,250 $549,250
d. EBITDA $ (367,610) $ 677,630 $ 677,630 $ 677,630 $ 677,630
e. Depreciation 119,000 311,000 311,000 311,000 311,000
f. Operating Income (EBITDA less Depreciation) $ (486,610) $366,630 $366,630 $366,630 $366,630
g. Non‐Operating Income Interest Income $ ‐ $1,000 $1,000 $2,000 $2,000
Interest Expense (10 Year Bond) ‐ ‐ ‐ ‐ ‐
Interest Expense (20 Year Bond) (130,000) (352,000) (276,000) (178,000) (53,000)
Interest Expense (Loan) ‐ ‐ ‐ ‐ ‐
Total $ (130,000) $ (275,000) $ (275,000) $ (176,000) $ (51,000)
h. Net Income (before taxes) $ (616,610) $15,630 $91,630 $190,630 $315,630
i. Facility Taxes $ ‐ $ ‐ $ ‐ $ ‐ $ ‐
j. Net Income $ (616,610) $15,630 $91,630 $190,630 $315,630

Fiber Optic Master Plan | January 2017
93
Table 34 shows the cash flow statement for years one, five, 10, 15, and 20.

Fiber Optic Master Plan | January 2017
94
Table34:CashFlowStatement–DarkFiberModel
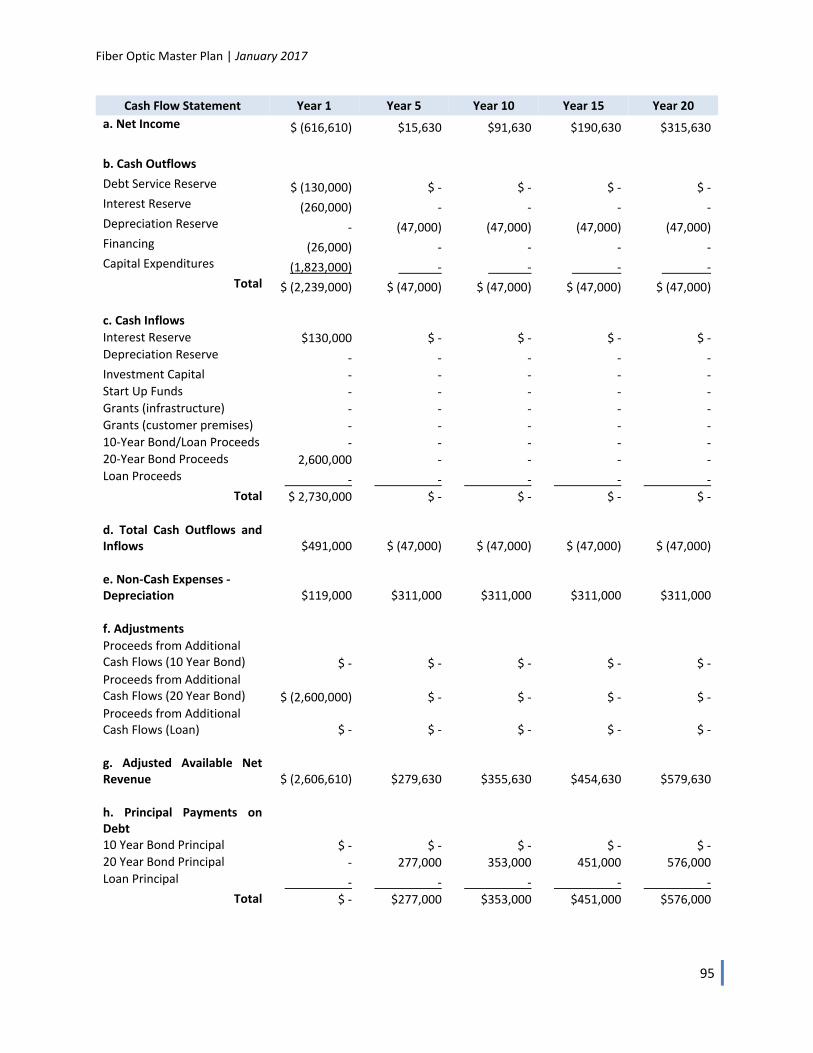
Fiber Optic Master Plan | January 2017
95
Cash Flow Statement Year 1 Year 5 Year 10 Year 15 Year 20
a. Net Income $ (616,610) $15,630 $91,630 $190,630 $315,630
b. Cash Outflows
Debt Service Reserve $ (130,000) $ ‐ $ ‐ $ ‐ $ ‐ Interest Reserve (260,000) ‐ ‐ ‐ ‐ Depreciation Reserve ‐ (47,000) (47,000) (47,000) (47,000) Financing (26,000) ‐ ‐ ‐ ‐ Capital Expenditures (1,823,000) ‐ ‐ ‐ ‐
Total $ (2,239,000) $ (47,000) $ (47,000) $ (47,000) $ (47,000)
c. Cash Inflows Interest Reserve $130,000 $ ‐ $ ‐ $ ‐ $ ‐ Depreciation Reserve ‐ ‐ ‐ ‐ ‐ Investment Capital ‐ ‐ ‐ ‐ ‐ Start Up Funds ‐ ‐ ‐ ‐ ‐ Grants (infrastructure) ‐ ‐ ‐ ‐ ‐ Grants (customer premises) ‐ ‐ ‐ ‐ ‐ 10‐Year Bond/Loan Proceeds ‐ ‐ ‐ ‐ ‐ 20‐Year Bond Proceeds 2,600,000 ‐ ‐ ‐ ‐ Loan Proceeds ‐ ‐ ‐ ‐ ‐
Total $ 2,730,000 $ ‐ $ ‐ $ ‐ $ ‐
d. Total Cash Outflows and Inflows $491,000 $ (47,000) $ (47,000) $ (47,000) $ (47,000)
e. Non‐Cash Expenses ‐ Depreciation $119,000 $311,000 $311,000 $311,000 $311,000
f. Adjustments Proceeds from Additional Cash Flows (10 Year Bond) $ ‐ $ ‐ $ ‐ $ ‐ $ ‐ Proceeds from Additional Cash Flows (20 Year Bond) $ (2,600,000) $ ‐ $ ‐ $ ‐ $ ‐ Proceeds from Additional Cash Flows (Loan) $ ‐ $ ‐ $ ‐ $ ‐ $ ‐
g. Adjusted Available Net Revenue $ (2,606,610) $279,630 $355,630 $454,630 $579,630
h. Principal Payments on Debt 10 Year Bond Principal $ ‐ $ ‐ $ ‐ $ ‐ $ ‐ 20 Year Bond Principal ‐ 277,000 353,000 451,000 576,000 Loan Principal ‐ ‐ ‐ ‐ ‐
Total $ ‐ $277,000 $353,000 $451,000 $576,000
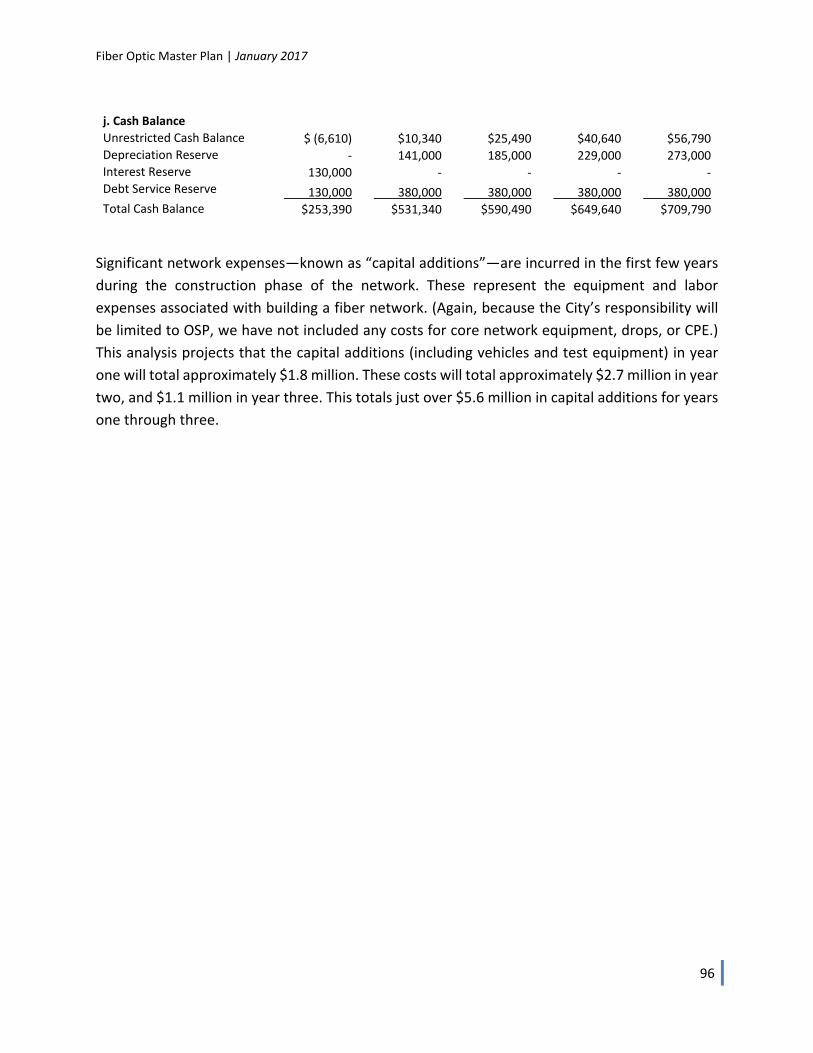
Fiber Optic Master Plan | January 2017
96
j. Cash Balance Unrestricted Cash Balance $ (6,610) $10,340 $25,490 $40,640 $56,790 Depreciation Reserve ‐ 141,000 185,000 229,000 273,000 Interest Reserve 130,000 ‐ ‐ ‐ ‐ Debt Service Reserve 130,000 380,000 380,000 380,000 380,000 Total Cash Balance $253,390 $531,340 $590,490 $649,640 $709,790
Significant network expenses—known as “capital additions”—are incurred in the first few years
during the construction phase of the network. These represent the equipment and labor
expenses associated with building a fiber network. (Again, because the City’s responsibility will
be limited to OSP, we have not included any costs for core network equipment, drops, or CPE.)
This analysis projects that the capital additions (including vehicles and test equipment) in year
one will total approximately $1.8 million. These costs will total approximately $2.7 million in year
two, and $1.1 million in year three. This totals just over $5.6 million in capital additions for years
one through three.
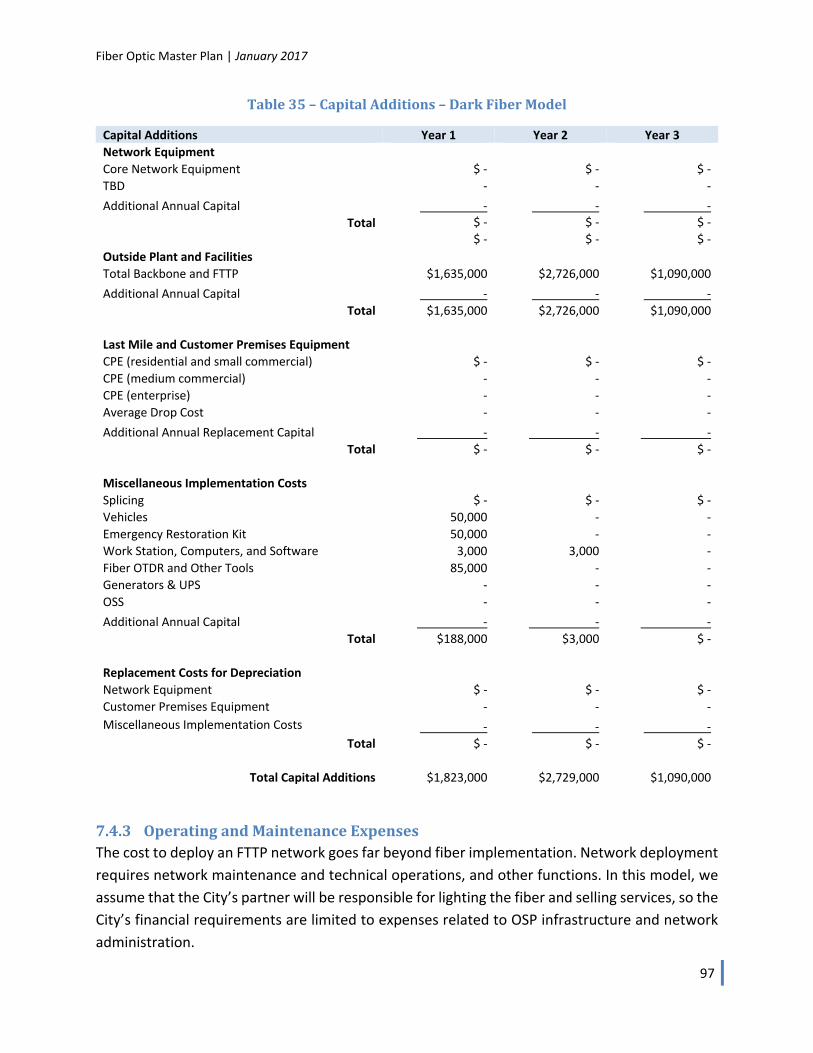
Fiber Optic Master Plan | January 2017
97
Table35–CapitalAdditions–DarkFiberModel
Capital Additions Year 1 Year 2 Year 3
Network Equipment Core Network Equipment $ ‐ $ ‐ $ ‐
TBD ‐ ‐ ‐
Additional Annual Capital ‐ ‐ ‐
Total $ ‐ $ ‐ $ ‐
$ ‐ $ ‐ $ ‐
Outside Plant and Facilities Total Backbone and FTTP $1,635,000 $2,726,000 $1,090,000
Additional Annual Capital ‐ ‐ ‐
Total $1,635,000 $2,726,000 $1,090,000
Last Mile and Customer Premises Equipment CPE (residential and small commercial) $ ‐ $ ‐ $ ‐
CPE (medium commercial) ‐ ‐ ‐
CPE (enterprise) ‐ ‐ ‐
Average Drop Cost ‐ ‐ ‐
Additional Annual Replacement Capital ‐ ‐ ‐
Total $ ‐ $ ‐ $ ‐
Miscellaneous Implementation Costs Splicing $ ‐ $ ‐ $ ‐
Vehicles 50,000 ‐ ‐
Emergency Restoration Kit 50,000 ‐ ‐
Work Station, Computers, and Software 3,000 3,000 ‐
Fiber OTDR and Other Tools 85,000 ‐ ‐
Generators & UPS ‐ ‐ ‐
OSS ‐ ‐ ‐
Additional Annual Capital ‐ ‐ ‐
Total $188,000 $3,000 $ ‐
Replacement Costs for Depreciation Network Equipment $ ‐ $ ‐ $ ‐
Customer Premises Equipment ‐ ‐ ‐
Miscellaneous Implementation Costs ‐ ‐ ‐
Total $ ‐ $ ‐ $ ‐
Total Capital Additions $1,823,000 $2,729,000 $1,090,000
7.4.3 OperatingandMaintenanceExpensesThe cost to deploy an FTTP network goes far beyond fiber implementation. Network deployment
requires network maintenance and technical operations, and other functions. In this model, we
assume that the City’s partner will be responsible for lighting the fiber and selling services, so the
City’s financial requirements are limited to expenses related to OSP infrastructure and network
administration.
Fiber Optic Master Plan | January 2017
98
These expanded responsibilities will require the addition of new staff. We assume the City will
add a total of three and three‐quarters full‐time‐equivalent (FTE) positions within the first three
years, and will then maintain that level of staffing. Our assumptions include one‐half FTE for
management, one FTE for GIS, one‐quarter FTE for communication support, and one FTE for fiber
plant maintenance and operations. Salaries and benefits are based on estimated market wages,
and benefits are estimated at 40 percent of base salary.
Some of these responsibilities can be contracted out, while some can be absorbed into existing
positions within the City. Each City’s circumstances is unique, and the skill sets that exist within
an organization will inform to what degree responsibilities must be contracted out. We
encourage the City to train internal staff for all record‐keeping responsibilities—particularly
network details such as fiber strand usage and locations. We cannot overstate the importance of
keeping meticulous records on the fiber to maintain the long‐term integrity of the network, and
keeping this function in‐house gives the City the greatest degree of control over these records’
accuracy.
Locates and ticket processing will be significant ongoing operational expenses for the City. Based
on our experience in other cities, we estimate that a contract for locates will cost $8,000 in year
one, increase to $15,000 in year two, and increase to $31,000 from year three on. (If the City
decides to perform this work in‐house, the contract expense would be eliminated—but staffing
expenses would increase.)
Additional key operating and maintenance assumptions include the following:
Insurance is estimated to be $25,000 in year one and $50,000 from year two on.
Office expenses are estimated to be $2,400 annually.
Contingency expenses are estimated at $10,000 in year one and $25,000 in subsequent
years.
Legal fees are estimated to be $50,000 in year one and $10,000 from year two on.
Consulting fees are estimated at $50,000 in year one and $10,000 from year two on.
Fiber network maintenance costs are calculated at one percent of the total construction cost, per
year. This is estimated based on a typical rate of occurrence in an urban environment, and the
cost of individual repairs. This is in addition to staffing costs to maintain the fiber.
Table 36 lists the City’s projected operating expenses for years one, five, 10, 15, and 20.
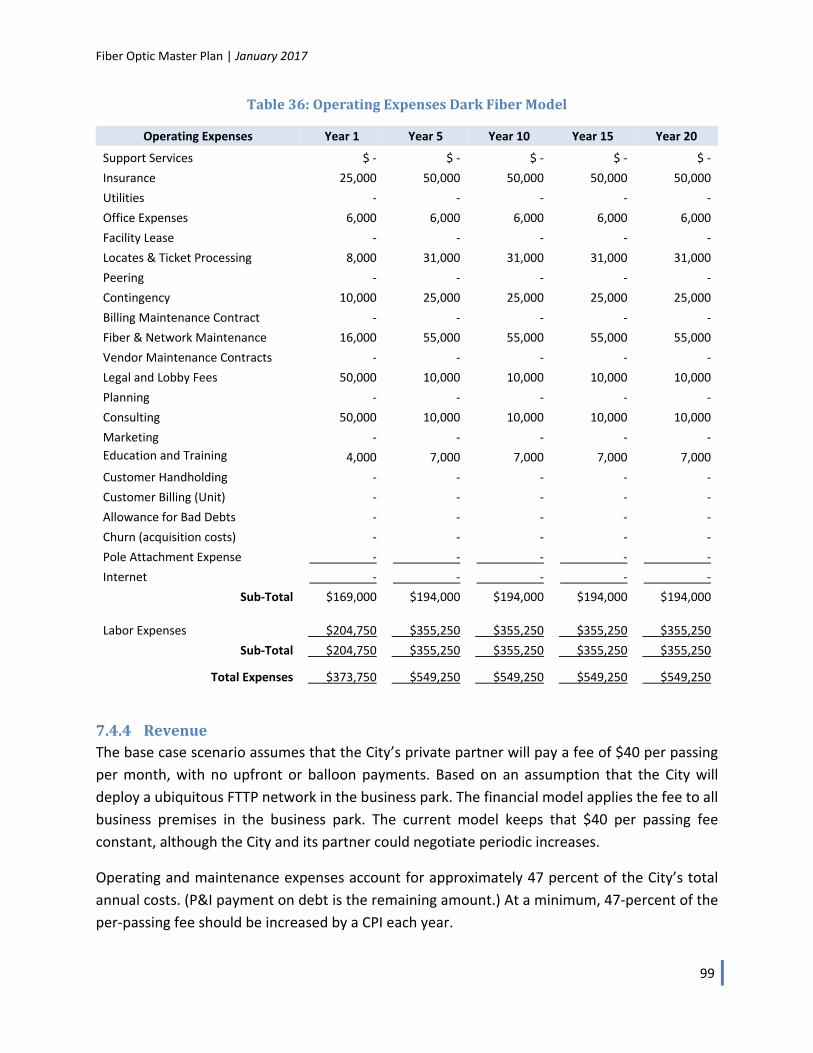
Fiber Optic Master Plan | January 2017
99
Table36:OperatingExpensesDarkFiberModel
Operating Expenses Year 1 Year 5 Year 10 Year 15 Year 20
Support Services $ ‐ $ ‐ $ ‐ $ ‐ $ ‐
Insurance 25,000 50,000 50,000 50,000 50,000
Utilities ‐ ‐ ‐ ‐ ‐
Office Expenses 6,000 6,000 6,000 6,000 6,000
Facility Lease ‐ ‐ ‐ ‐ ‐
Locates & Ticket Processing 8,000 31,000 31,000 31,000 31,000
Peering ‐ ‐ ‐ ‐ ‐
Contingency 10,000 25,000 25,000 25,000 25,000
Billing Maintenance Contract ‐ ‐ ‐ ‐ ‐
Fiber & Network Maintenance 16,000 55,000 55,000 55,000 55,000
Vendor Maintenance Contracts ‐ ‐ ‐ ‐ ‐
Legal and Lobby Fees 50,000 10,000 10,000 10,000 10,000
Planning ‐ ‐ ‐ ‐ ‐
Consulting 50,000 10,000 10,000 10,000 10,000
Marketing ‐ ‐ ‐ ‐ ‐
Education and Training 4,000 7,000 7,000 7,000 7,000
Customer Handholding ‐ ‐ ‐ ‐ ‐
Customer Billing (Unit) ‐ ‐ ‐ ‐ ‐
Allowance for Bad Debts ‐ ‐ ‐ ‐ ‐
Churn (acquisition costs) ‐ ‐ ‐ ‐ ‐
Pole Attachment Expense ‐ ‐ ‐ ‐ ‐
Internet ‐ ‐ ‐ ‐ ‐
Sub‐Total $169,000 $194,000 $194,000 $194,000 $194,000 Labor Expenses $204,750 $355,250 $355,250 $355,250 $355,250
Sub‐Total $204,750 $355,250 $355,250 $355,250 $355,250
Total Expenses $373,750 $549,250 $549,250 $549,250 $549,250
7.4.4 RevenueThe base case scenario assumes that the City’s private partner will pay a fee of $40 per passing
per month, with no upfront or balloon payments. Based on an assumption that the City will
deploy a ubiquitous FTTP network in the business park. The financial model applies the fee to all
business premises in the business park. The current model keeps that $40 per passing fee
constant, although the City and its partner could negotiate periodic increases.
Operating and maintenance expenses account for approximately 47 percent of the City’s total
annual costs. (P&I payment on debt is the remaining amount.) At a minimum, 47‐percent of the
per‐passing fee should be increased by a CPI each year.
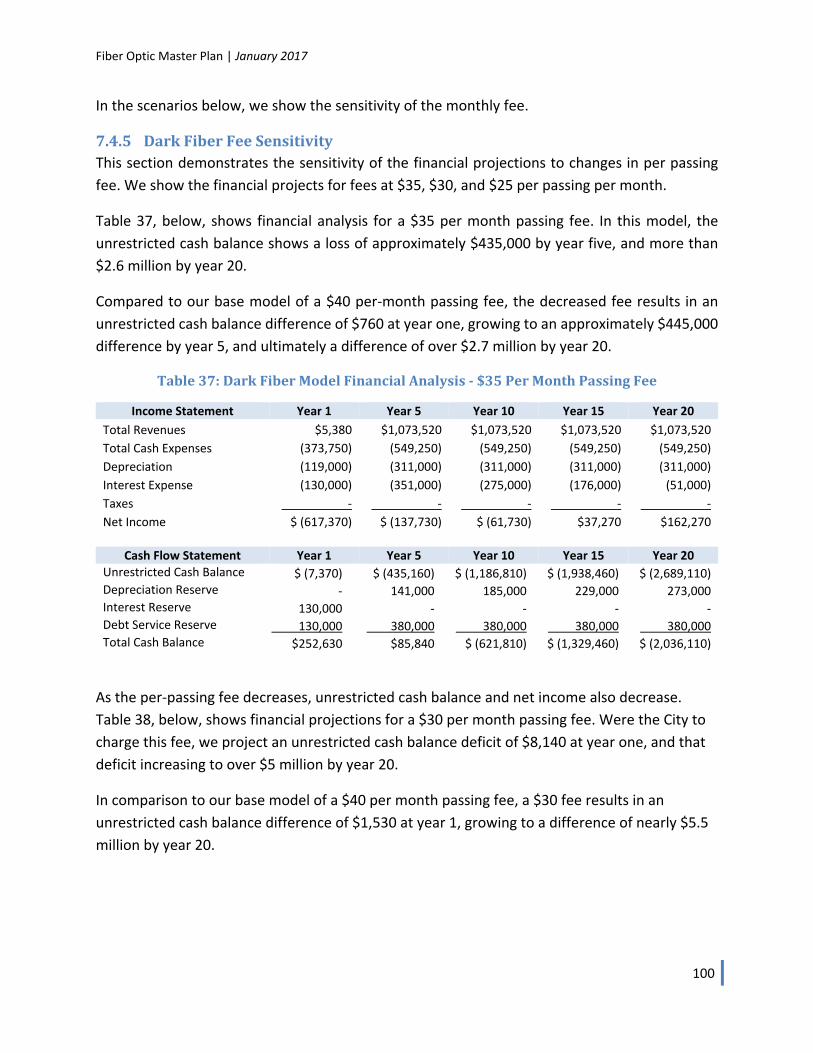
Fiber Optic Master Plan | January 2017
100
In the scenarios below, we show the sensitivity of the monthly fee.
7.4.5 DarkFiberFeeSensitivityThis section demonstrates the sensitivity of the financial projections to changes in per passing
fee. We show the financial projects for fees at $35, $30, and $25 per passing per month.
Table 37, below, shows financial analysis for a $35 per month passing fee. In this model, the
unrestricted cash balance shows a loss of approximately $435,000 by year five, and more than
$2.6 million by year 20.
Compared to our base model of a $40 per‐month passing fee, the decreased fee results in an
unrestricted cash balance difference of $760 at year one, growing to an approximately $445,000
difference by year 5, and ultimately a difference of over $2.7 million by year 20.
Table37:DarkFiberModelFinancialAnalysis‐$35PerMonthPassingFee
Income Statement Year 1 Year 5 Year 10 Year 15 Year 20
Total Revenues $5,380 $1,073,520 $1,073,520 $1,073,520 $1,073,520
Total Cash Expenses (373,750) (549,250) (549,250) (549,250) (549,250)
Depreciation (119,000) (311,000) (311,000) (311,000) (311,000)
Interest Expense (130,000) (351,000) (275,000) (176,000) (51,000)
Taxes ‐ ‐ ‐ ‐ ‐
Net Income $ (617,370) $ (137,730) $ (61,730) $37,270 $162,270
Cash Flow Statement Year 1 Year 5 Year 10 Year 15 Year 20
Unrestricted Cash Balance $ (7,370) $ (435,160) $ (1,186,810) $ (1,938,460) $ (2,689,110) Depreciation Reserve ‐ 141,000 185,000 229,000 273,000 Interest Reserve 130,000 ‐ ‐ ‐ ‐ Debt Service Reserve 130,000 380,000 380,000 380,000 380,000 Total Cash Balance $252,630 $85,840 $ (621,810) $ (1,329,460) $ (2,036,110)
As the per‐passing fee decreases, unrestricted cash balance and net income also decrease.
Table 38, below, shows financial projections for a $30 per month passing fee. Were the City to
charge this fee, we project an unrestricted cash balance deficit of $8,140 at year one, and that
deficit increasing to over $5 million by year 20.
In comparison to our base model of a $40 per month passing fee, a $30 fee results in an
unrestricted cash balance difference of $1,530 at year 1, growing to a difference of nearly $5.5
million by year 20.
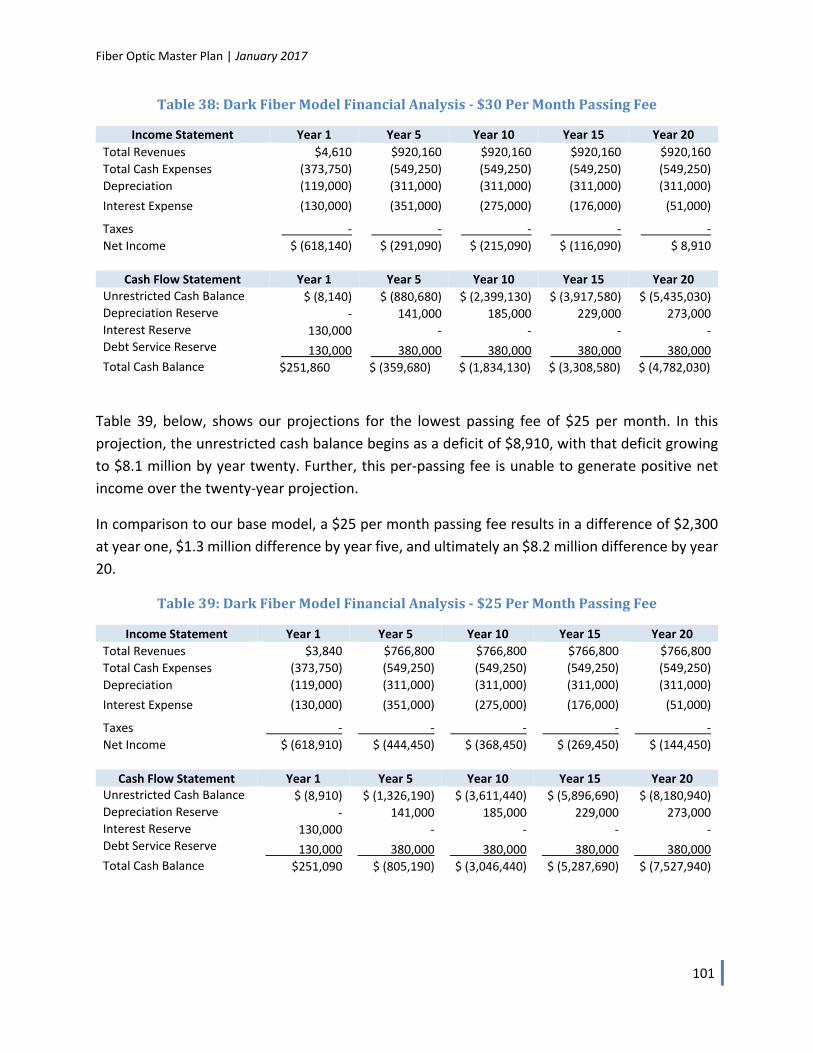
Fiber Optic Master Plan | January 2017
101
Table38:DarkFiberModelFinancialAnalysis‐$30PerMonthPassingFee
Income Statement Year 1 Year 5 Year 10 Year 15 Year 20
Total Revenues $4,610 $920,160 $920,160 $920,160 $920,160
Total Cash Expenses (373,750) (549,250) (549,250) (549,250) (549,250)
Depreciation (119,000) (311,000) (311,000) (311,000) (311,000)
Interest Expense (130,000) (351,000) (275,000) (176,000) (51,000)
Taxes ‐ ‐ ‐ ‐ ‐
Net Income $ (618,140) $ (291,090) $ (215,090) $ (116,090) $ 8,910
Cash Flow Statement Year 1 Year 5 Year 10 Year 15 Year 20
Unrestricted Cash Balance $ (8,140) $ (880,680) $ (2,399,130) $ (3,917,580) $ (5,435,030) Depreciation Reserve ‐ 141,000 185,000 229,000 273,000 Interest Reserve 130,000 ‐ ‐ ‐ ‐ Debt Service Reserve 130,000 380,000 380,000 380,000 380,000 Total Cash Balance $251,860 $ (359,680) $ (1,834,130) $ (3,308,580) $ (4,782,030)
Table 39, below, shows our projections for the lowest passing fee of $25 per month. In this
projection, the unrestricted cash balance begins as a deficit of $8,910, with that deficit growing
to $8.1 million by year twenty. Further, this per‐passing fee is unable to generate positive net
income over the twenty‐year projection.
In comparison to our base model, a $25 per month passing fee results in a difference of $2,300
at year one, $1.3 million difference by year five, and ultimately an $8.2 million difference by year
20.
Table39:DarkFiberModelFinancialAnalysis‐$25PerMonthPassingFee
Income Statement Year 1 Year 5 Year 10 Year 15 Year 20
Total Revenues $3,840 $766,800 $766,800 $766,800 $766,800
Total Cash Expenses (373,750) (549,250) (549,250) (549,250) (549,250)
Depreciation (119,000) (311,000) (311,000) (311,000) (311,000)
Interest Expense (130,000) (351,000) (275,000) (176,000) (51,000)
Taxes ‐ ‐ ‐ ‐ ‐
Net Income $ (618,910) $ (444,450) $ (368,450) $ (269,450) $ (144,450)
Cash Flow Statement Year 1 Year 5 Year 10 Year 15 Year 20
Unrestricted Cash Balance $ (8,910) $ (1,326,190) $ (3,611,440) $ (5,896,690) $ (8,180,940) Depreciation Reserve ‐ 141,000 185,000 229,000 273,000 Interest Reserve 130,000 ‐ ‐ ‐ ‐ Debt Service Reserve 130,000 380,000 380,000 380,000 380,000 Total Cash Balance $251,090 $ (805,190) $ (3,046,440) $ (5,287,690) $ (7,527,940)
Fiber Optic Master Plan | January 2017
102
AppendixA:GlossaryofTermsThe descriptions in our FTTP design and cost estimate analysis are highly technical and make use
of several acronyms that can be confusing, especially to a non‐technical audience. While we try
to define each acronym the first time it appears in the text, we also believe that a glossary can
be a useful tool to navigate this document. This section outlines most of the acronyms that
appear in this analysis.
AE – Active Ethernet; a technology that provides a symmetrical (upload/download) Ethernet
service and does not share optical wavelengths with other users. For subscribers that receive
Active Ethernet service—typically business customers that request a premium service or require
greater bandwidth—a single dedicated fiber goes directly to the subscriber premises with no
optical splitting.
CPE – Customer premises equipment; the electronic equipment installed at a subscriber’s home
or business.
Distribution Fiber – The fiber in an FTTP network that connects the hub sites to the fiber
distribution cabinets (see below).
Drop – The fiber connection from an optical tap in the ROW to the customer premises.
FDC – Fiber distribution cabinet; houses the fiber connections between the distribution fiber and
the access fiber. FDCs, which can also house network electronics and optical splitters, can sit on
a curb, be mounted on a pole, or reside in a building.
Access Fiber – The fiber in an FTTP network that goes from the FDCs to the optical taps that are
located outside of homes and businesses in the rights‐of‐way.
FTTP – Fiber‐to‐the‐premises; a network architecture in which fiber optics are used to provide
broadband services all the way to each subscriber’s premises.
GPON – Gigabit passive optical network; the most commonly provisioned FTTP service—used,
for example, by Verizon (in its FiOS systems), Google Fiber, and Chattanooga Electric Power Board
(EPB). GPON uses passive optical splitting, which is performed inside FDCs, to connect fiber from
the Optical Line Terminals (OLTs) to multiple customer premises over a single GPON port.
Hub – At the hub, optical splitting is used to distribute network services deeper into the
community, enabling eventual FTTP connections.
IP – Internet Protocol; the method by which computers share data on the Internet.
LEC – Local Exchange Carrier; a public telephone company that provides service to a local or
regional area.
MDU – Multi‐dwelling unit (i.e., an apartment or office building).
Fiber Optic Master Plan | January 2017
103
OLT – Optical Line Terminal; the upstream connection point (to the provider core network) for
subscribers. The choice of an optical interface installed in the OLT determines whether the
network provisions shared access (one fiber split among multiple subscribers in a GPON
architecture) or dedicated Active Ethernet access (one port for one subscriber).
OSP – Outside plant; the physical portion of a network (also called “layer 1”) that is constructed
on utility poles (aerial) or in conduit (underground).
OSS – Operational Support Systems (OSS); includes a provider’s provisioning platforms, fault and
performance management systems, remote access, and other operational support systems for
FTTP operations. OSS is housed in a network’s core locations.
OTT – Over‐the‐top; content, such as voice or video service, that is delivered over a data
connection.
Passing – A potential customer address (e.g., an individual home or business).
Peering – An interconnection between two service providers, or a service provider and an
application provider (Netflix, Dropbox, etc.) to facilitate faster, less‐expensive connections.
PON – Passive optical network; uses passive optical splitting, which is performed inside FDCs, to
connect fiber from the OLTs to multiple customer premises over a single PON port.
POP – Point of presence; a physical location where network switches, routers, and servers are
housed. POPs frequently offer appropriate power, cooling, and security resources for network
equipment, peering (see above) and at times enable connections to multiple ISPs.
POTS – “Plain old telephone service;” delivered over the PSTN.
PSTN – Public switched telephone network; the copper‐wire telephone networks that connect
landline phones.
QoS – Quality of service; a network’s performance as measured on a number of attributes.
ROW – Right‐of‐way; land reserved for the public good such as utility construction. ROW typically
abuts public roadways.
VoIP – Voice over Internet Protocol; telephone service that is delivered over a data connection.

Fiber Optic Master Plan | January 2017
104
AppendixB:AssessmentofLocalBroadbandMarketThis Appendix is attached as a separate PDF file.

Fiber Optic Master Plan | January 2017
105
AppendixC:RetailFinancialModel(spreadsheet)This Appendix is attached as a separate Microsoft Excel file.

Fiber Optic Master Plan | January 2017
106
AppendixD:WholesaleFinancialModel(spreadsheet)This Appendix is attached as a separate Microsoft Excel file.

Fiber Optic Master Plan | January 2017
107
AppendixE:DarkFiberFinancialModel(spreadsheet)This Appendix is attached as a separate Microsoft Excel file.

Fiber Optic Master Plan | January 2017
108
AppendixF:OnlineBusinessSurveyQuestionsThis appendix is attached as a separate PDF file.
Fiber Optic Master Plan | January 2017
109
AppendixG:OnlineBusinessSurveyResultsTo understand the potential market demand for fiber connectivity and related services among
Hayward businesses, CTC conducted an online survey in summer 2016. At a high level, the survey
showed that the respondents that completed the questionnaire are not overwhelmingly unhappy
with their current speeds, and that there is a modest willingness to switch to a higher‐speed
service—but only if the price point is $75 per month or less.
Most of the businesses indicated that price, reliability, and speed are important factors for them
to consider as their connectivity needs evolve and they become increasingly dependent on cloud‐
based business solutions to support their operations.
SurveyMethodologyThe survey was sent out via e‐email on behalf of the City to approximately 2,600 businesses in
July 2016. An online survey mechanism enabled completion of the survey questionnaires over
the Internet. The survey was designed to collect a range of data to understand businesses’
current use of data and Internet services; satisfaction with current service providers; and interest
in new, higher‐speed data and Internet service offerings.
The survey’s e‐mail distribution list was culled from data purchased from InfoUSA on
approximately 900 businesses located in Hayward, in conjunction with email lists provided by the
City and Chamber of Commerce. CTC worked with City staff to develop a set of questions for
Hayward businesses, which were then entered into a survey instrument on SurveyMonkey, an
online tool that allows for customization, and provides granular output of responses in various
formats for analysis. The survey questionnaire is attached to this report as Appendix C.
50 recipients opted out of the survey; 18 emails were returned as undeliverable; and 1,545 emails
were unopened. Of the 1,006 potential respondents that opened the email, 183 clicked through.
There were 156 total responses through the email collector, which included the original email we
sent through SurveyMonkey.
In the weeks following the initial SurveyMonkey email notification, the City sent a follow‐up email
outside the SurveyMonkey system, which contained a web link for potential respondents to
access the survey. There were 103 responses collected through the web link, for a total of 259
responses all together. Of the approximately 2,600 email recipients, there were 259 respondents
that filled out at least some portion of the survey.
While there were 259 responses to the survey, not every respondent completed the full survey,
as respondents were able to skip questions and answer questions only partially. We designed the
survey in this way to encourage respondents to answer questions for which they had a response,
while not forcing them to attempt to answer questions they do not believe are applicable to their
Fiber Optic Master Plan | January 2017
110
business. Although this does not produce statistically valid results, it can provide insight into the
business community’s connectivity needs, their willingness to switch to a new provider, and what
role they believe the City should play in an FTTP deployment.
Further, a secondary purpose of the survey was to identify potential businesses that would be
willing to further discuss their connectivity needs, and their potential willingness to purchase
services from the City. The final questions in the survey prompted willing respondents to provide
specific information about their contact information and their willingness to speak in greater
detail with City representatives about their connectivity needs. While 77 respondents listed their
business’ specific address, only 41 respondents indicated a willingness to be contacted further.
CTC was able to reach 24 businesses for follow‐up discussions.
OnlineSurveyResultsAs we noted, the survey had some inherent limitations, and the respondents are not truly
representative of a random selection of the population. Still, the City can potentially glean some
valuable information from the businesses that chose to respond, caveats aside.
TheMajorityofResponsesWerefromSmall‐to‐MediumSizeBusinesses91 percent of the responses were from businesses with only one location. Nearly half the
respondents to the business survey represented businesses with 1 to 4 employees, and more
than three‐quarters (approximately 77.25 percent) came from businesses with less than 20
employees. About 14.5 percent of responses were from businesses with 20 to 99 employees, and
about 6.7 percent of responses were from businesses with 100 to 499 employees. Only about 1.5
percent of responses were from business with 500 or more employees. There were no responses
from businesses with more than 5,000 employees. See Figure 12, below.
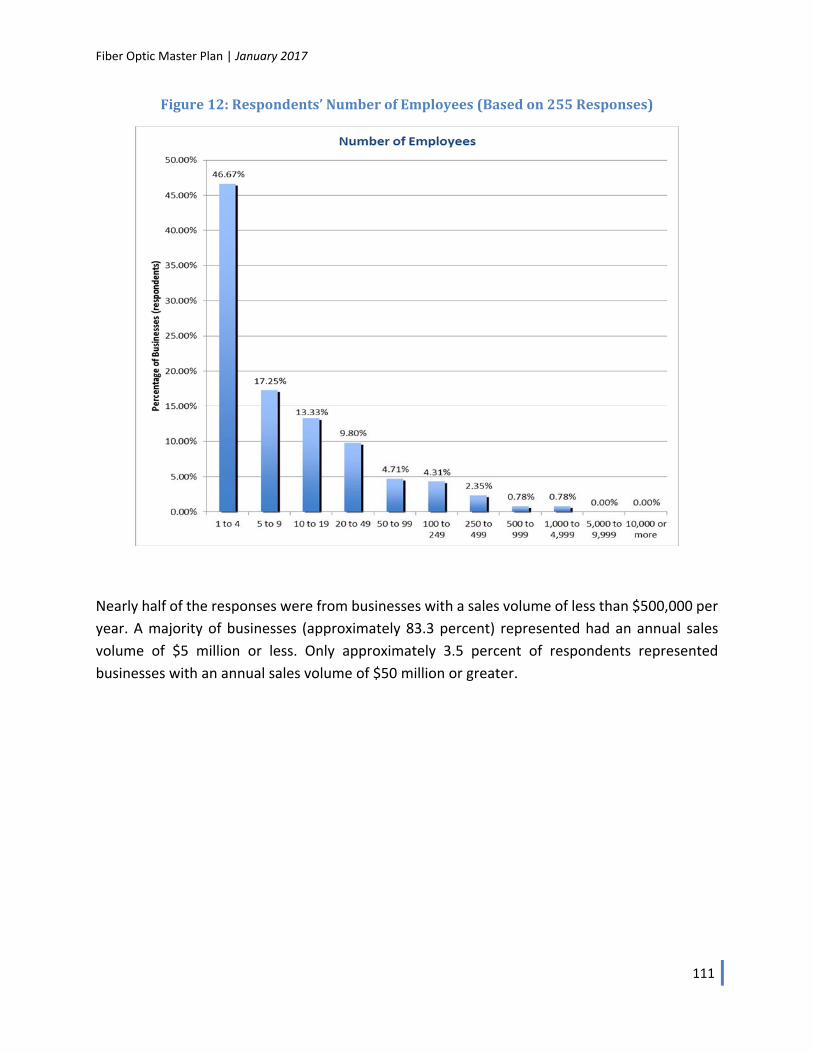
Fiber Optic Master Plan | January 2017
111
Figure12:Respondents’NumberofEmployees(Basedon255Responses)
Nearly half of the responses were from businesses with a sales volume of less than $500,000 per
year. A majority of businesses (approximately 83.3 percent) represented had an annual sales
volume of $5 million or less. Only approximately 3.5 percent of respondents represented
businesses with an annual sales volume of $50 million or greater.
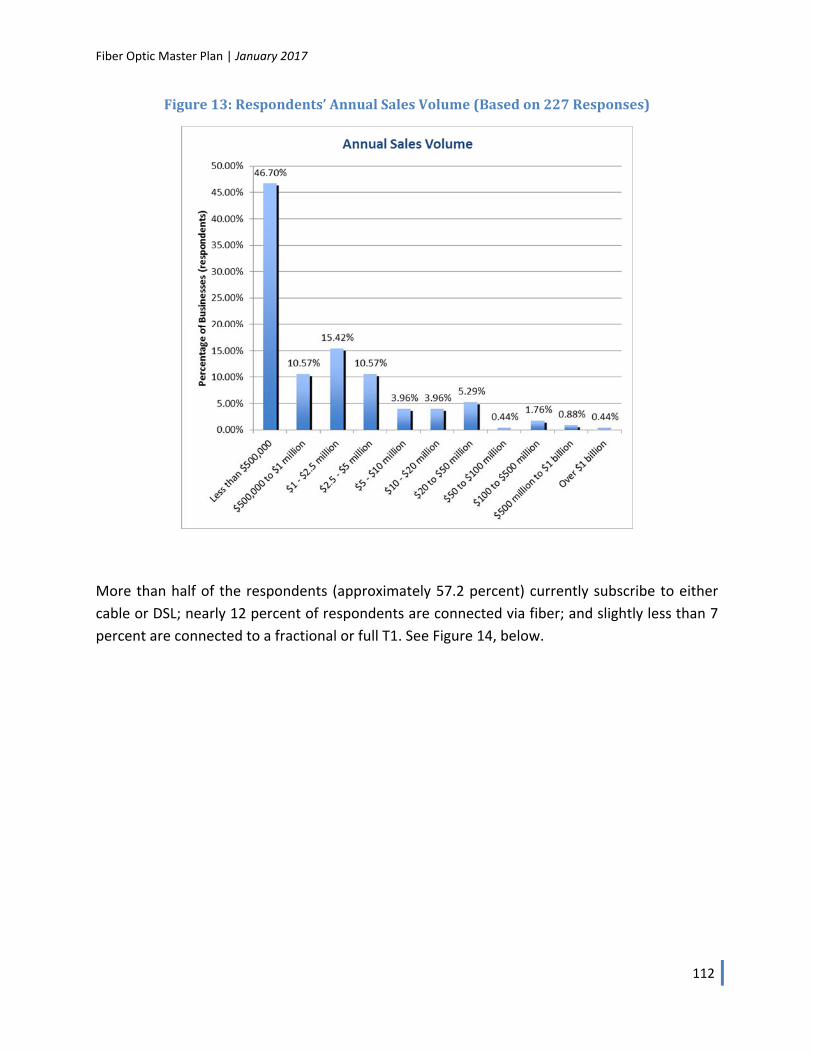
Fiber Optic Master Plan | January 2017
112
Figure13:Respondents’AnnualSalesVolume(Basedon227Responses)
More than half of the respondents (approximately 57.2 percent) currently subscribe to either
cable or DSL; nearly 12 percent of respondents are connected via fiber; and slightly less than 7
percent are connected to a fractional or full T1. See Figure 14, below.
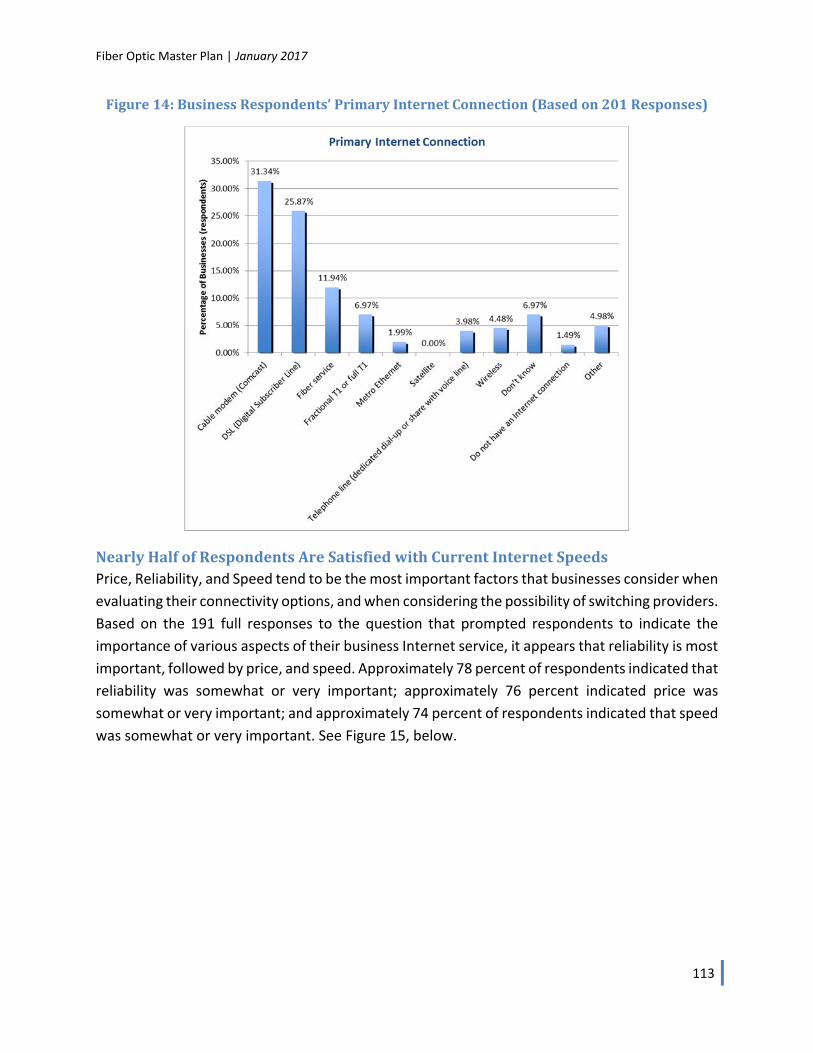
Fiber Optic Master Plan | January 2017
113
Figure14:BusinessRespondents’PrimaryInternetConnection(Basedon201Responses)
NearlyHalfofRespondentsAreSatisfiedwithCurrentInternetSpeedsPrice, Reliability, and Speed tend to be the most important factors that businesses consider when
evaluating their connectivity options, and when considering the possibility of switching providers.
Based on the 191 full responses to the question that prompted respondents to indicate the
importance of various aspects of their business Internet service, it appears that reliability is most
important, followed by price, and speed. Approximately 78 percent of respondents indicated that
reliability was somewhat or very important; approximately 76 percent indicated price was
somewhat or very important; and approximately 74 percent of respondents indicated that speed
was somewhat or very important. See Figure 15, below.
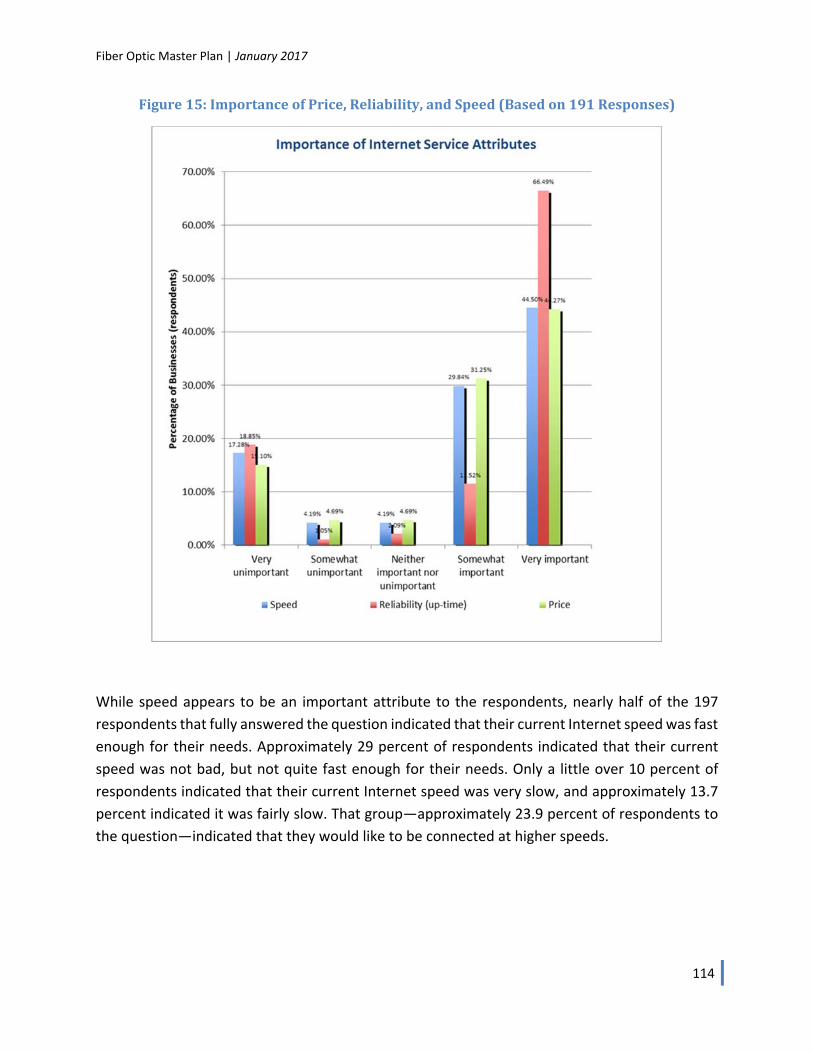
Fiber Optic Master Plan | January 2017
114
Figure15:ImportanceofPrice,Reliability,andSpeed(Basedon191Responses)
While speed appears to be an important attribute to the respondents, nearly half of the 197
respondents that fully answered the question indicated that their current Internet speed was fast
enough for their needs. Approximately 29 percent of respondents indicated that their current
speed was not bad, but not quite fast enough for their needs. Only a little over 10 percent of
respondents indicated that their current Internet speed was very slow, and approximately 13.7
percent indicated it was fairly slow. That group—approximately 23.9 percent of respondents to
the question—indicated that they would like to be connected at higher speeds.
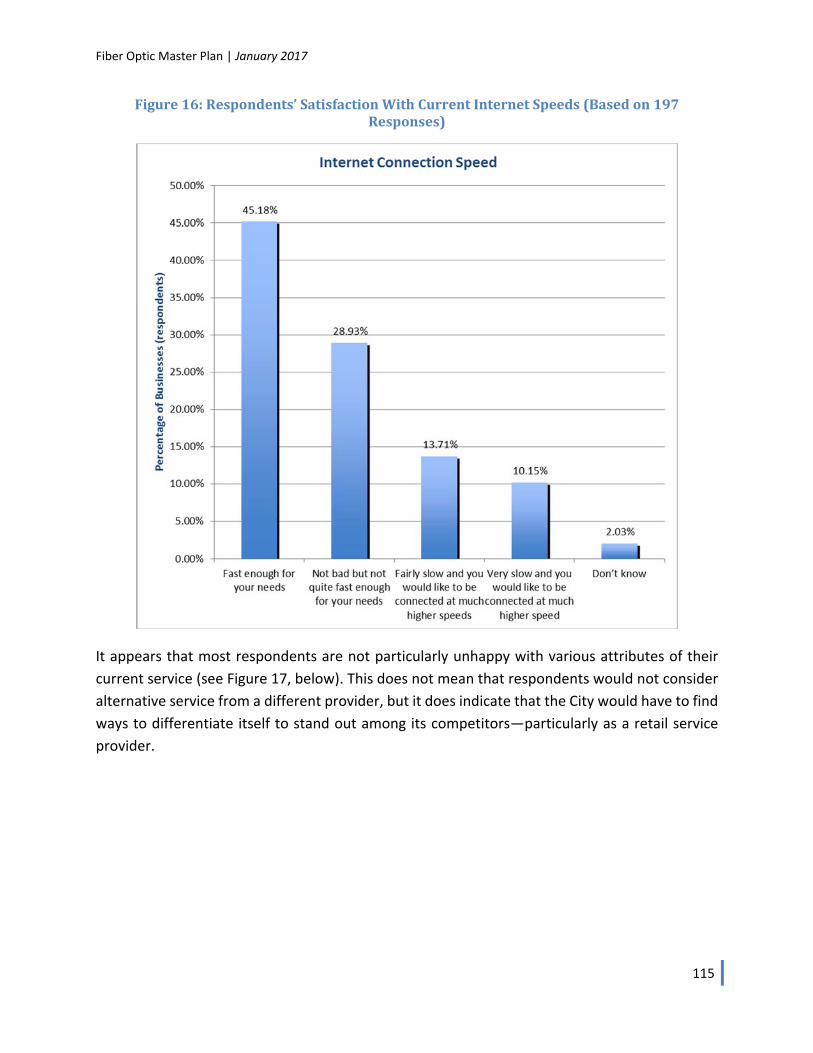
Fiber Optic Master Plan | January 2017
115
Figure16:Respondents’SatisfactionWithCurrentInternetSpeeds(Basedon197Responses)
It appears that most respondents are not particularly unhappy with various attributes of their
current service (see Figure 17, below). This does not mean that respondents would not consider
alternative service from a different provider, but it does indicate that the City would have to find
ways to differentiate itself to stand out among its competitors—particularly as a retail service
provider.
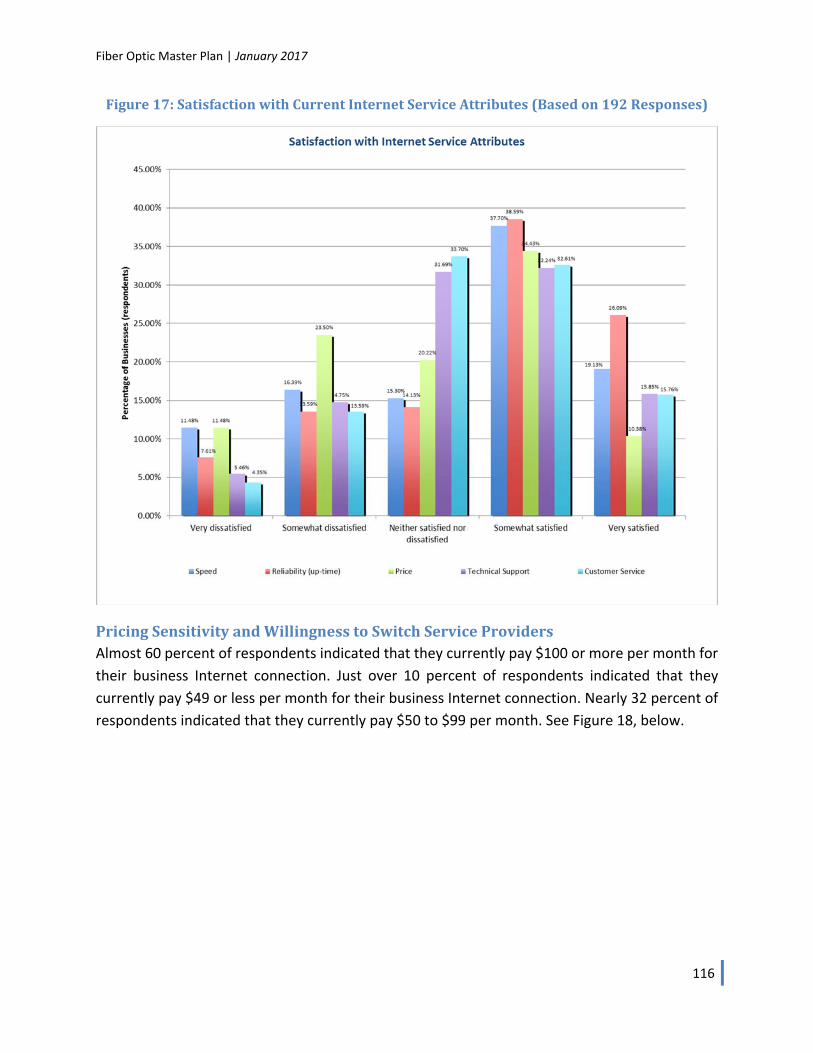
Fiber Optic Master Plan | January 2017
116
Figure17:SatisfactionwithCurrentInternetServiceAttributes(Basedon192Responses)
PricingSensitivityandWillingnesstoSwitchServiceProvidersAlmost 60 percent of respondents indicated that they currently pay $100 or more per month for
their business Internet connection. Just over 10 percent of respondents indicated that they
currently pay $49 or less per month for their business Internet connection. Nearly 32 percent of
respondents indicated that they currently pay $50 to $99 per month. See Figure 18, below.
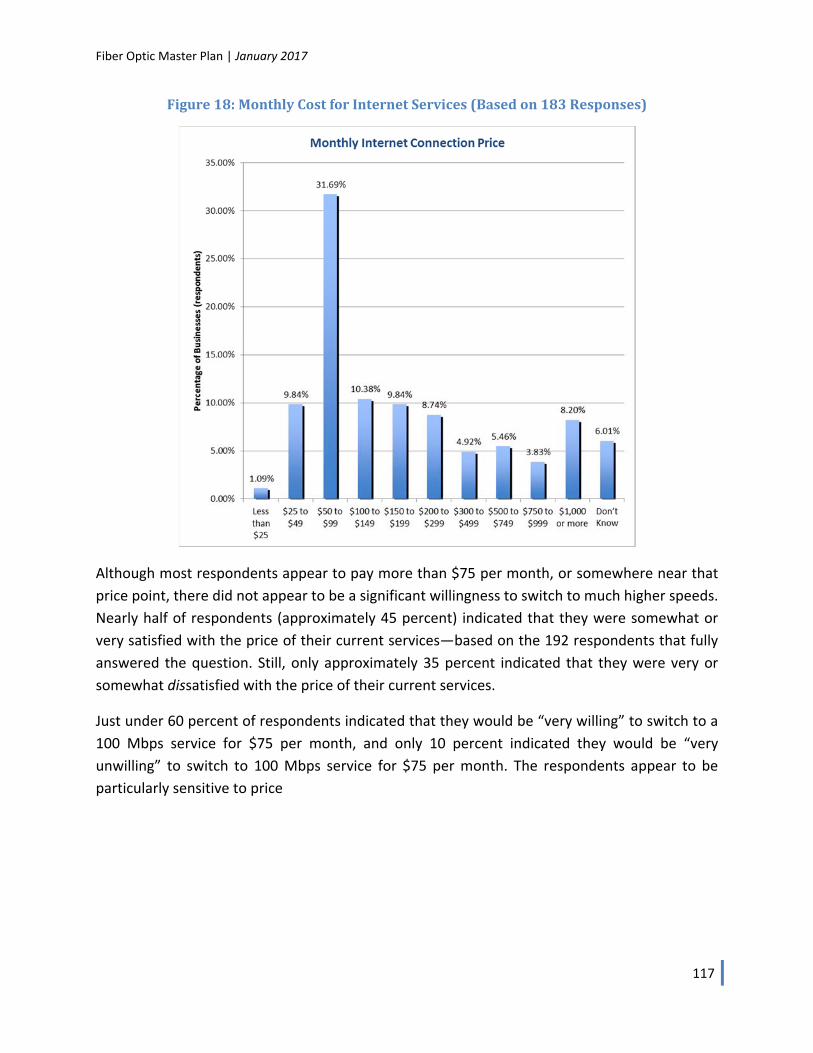
Fiber Optic Master Plan | January 2017
117
Figure18:MonthlyCostforInternetServices(Basedon183Responses)
Although most respondents appear to pay more than $75 per month, or somewhere near that
price point, there did not appear to be a significant willingness to switch to much higher speeds.
Nearly half of respondents (approximately 45 percent) indicated that they were somewhat or
very satisfied with the price of their current services—based on the 192 respondents that fully
answered the question. Still, only approximately 35 percent indicated that they were very or
somewhat dissatisfied with the price of their current services.
Just under 60 percent of respondents indicated that they would be “very willing” to switch to a
100 Mbps service for $75 per month, and only 10 percent indicated they would be “very
unwilling” to switch to 100 Mbps service for $75 per month. The respondents appear to be
particularly sensitive to price
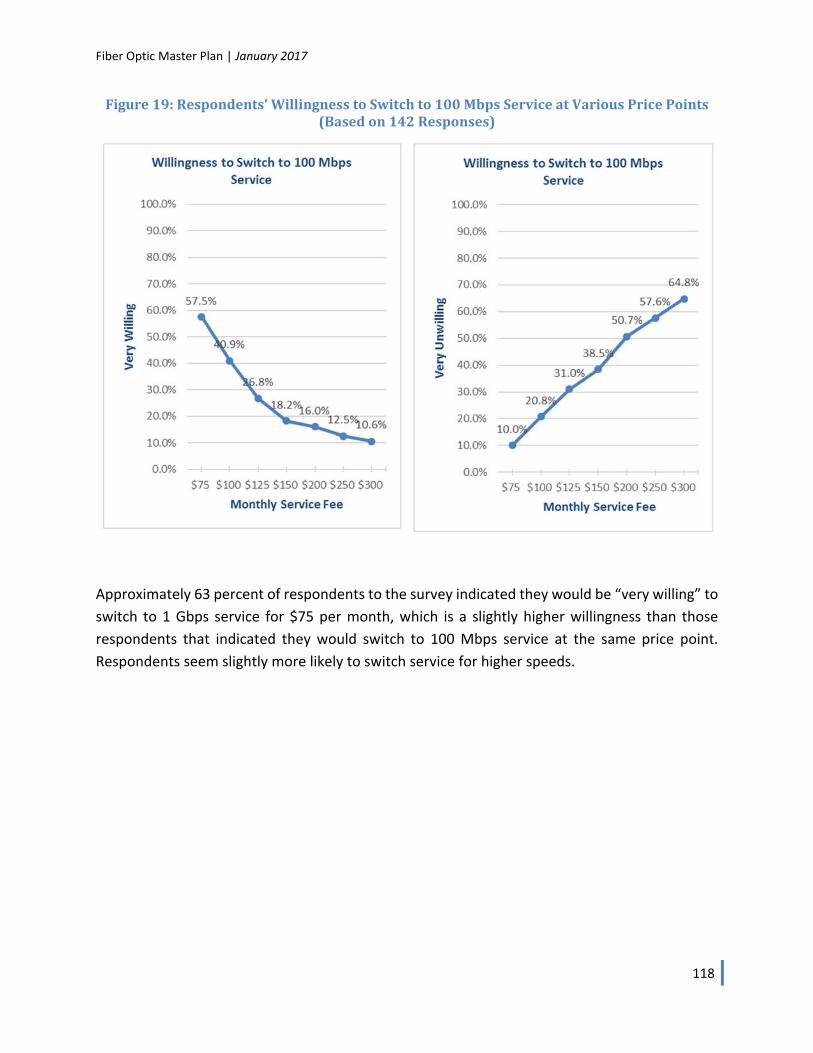
Fiber Optic Master Plan | January 2017
118
Figure19:Respondents’WillingnesstoSwitchto100MbpsServiceatVariousPricePoints(Basedon142Responses)
Approximately 63 percent of respondents to the survey indicated they would be “very willing” to
switch to 1 Gbps service for $75 per month, which is a slightly higher willingness than those
respondents that indicated they would switch to 100 Mbps service at the same price point.
Respondents seem slightly more likely to switch service for higher speeds.
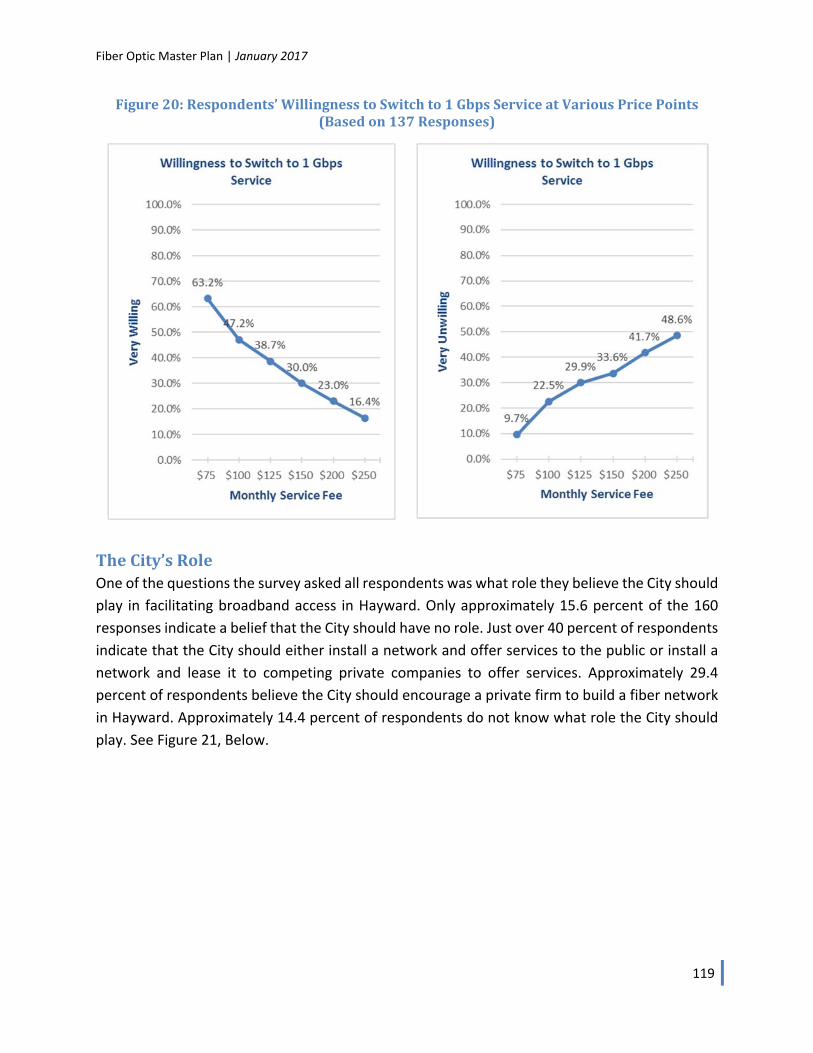
Fiber Optic Master Plan | January 2017
119
Figure20:Respondents’WillingnesstoSwitchto1GbpsServiceatVariousPricePoints(Basedon137Responses)
TheCity’sRoleOne of the questions the survey asked all respondents was what role they believe the City should
play in facilitating broadband access in Hayward. Only approximately 15.6 percent of the 160
responses indicate a belief that the City should have no role. Just over 40 percent of respondents
indicate that the City should either install a network and offer services to the public or install a
network and lease it to competing private companies to offer services. Approximately 29.4
percent of respondents believe the City should encourage a private firm to build a fiber network
in Hayward. Approximately 14.4 percent of respondents do not know what role the City should
play. See Figure 21, Below.
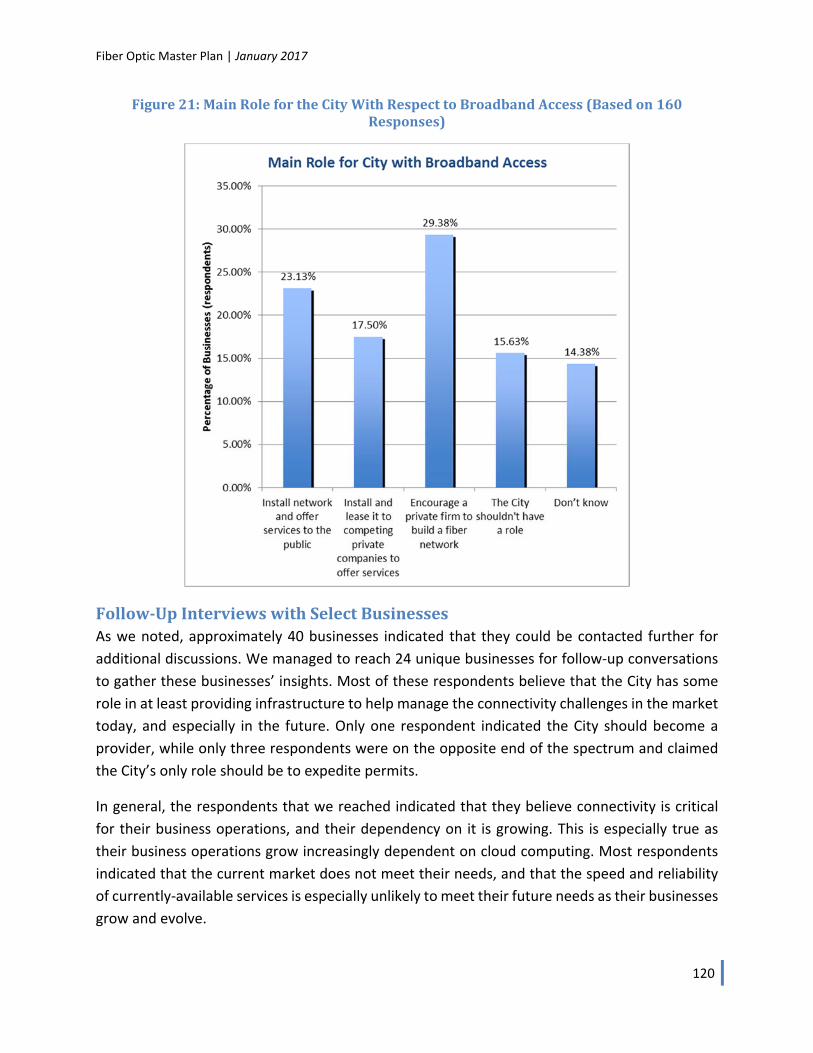
Fiber Optic Master Plan | January 2017
120
Figure21:MainRolefortheCityWithRespecttoBroadbandAccess(Basedon160Responses)
Follow‐UpInterviewswithSelectBusinessesAs we noted, approximately 40 businesses indicated that they could be contacted further for
additional discussions. We managed to reach 24 unique businesses for follow‐up conversations
to gather these businesses’ insights. Most of these respondents believe that the City has some
role in at least providing infrastructure to help manage the connectivity challenges in the market
today, and especially in the future. Only one respondent indicated the City should become a
provider, while only three respondents were on the opposite end of the spectrum and claimed
the City’s only role should be to expedite permits.
In general, the respondents that we reached indicated that they believe connectivity is critical
for their business operations, and their dependency on it is growing. This is especially true as
their business operations grow increasingly dependent on cloud computing. Most respondents
indicated that the current market does not meet their needs, and that the speed and reliability
of currently‐available services is especially unlikely to meet their future needs as their businesses
grow and evolve.

Fiber Optic Master Plan | January 2017
121
As is the case with many small‐ to medium‐size businesses in other markets, connectivity options
are limited to only DSL or cable for many of the respondents to the business survey. There is a
shared perception that competition is lacking in the Hayward business market, and that it must
be increased in order to drive better choice for businesses. Further, choices are limited for
alternative services, or for back‐up options to help offset the speed and reliability challenges
these businesses face with their primary providers.
While some of the respondents could purchase cable modem service through Comcast, it tends
to be much more expensive than AT&T’s DSL service, and the speeds and reliability do not
necessarily justify the increased cost. Still, satisfaction related to reliability and speed seems to
be marginally higher with Comcast than with AT&T. Most of these respondents claimed that the
customer service they receive from their current providers is not good, and they would prefer
more positive experiences when seeking support.
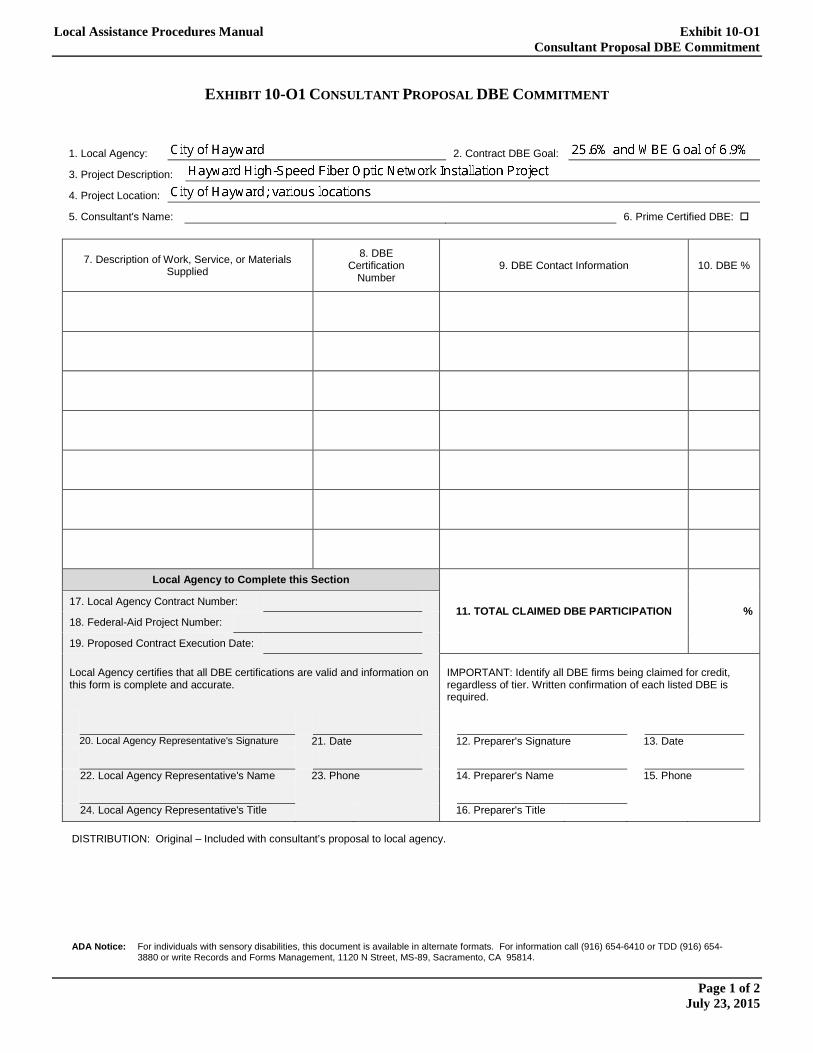
Local Assistance Procedures Manual Exhibit 10-O1 Consultant Proposal DBE Commitment
Page 1 of 2 July 23, 2015
EXHIBIT 10-O1 CONSULTANT PROPOSAL DBE COMMITMENT
1. Local Agency: 2. Contract DBE Goal:
3. Project Description:
4. Project Location:
5. Consultant's Name: 6. Prime Certified DBE:
7. Description of Work, Service, or Materials Supplied
8. DBE Certification
Number 9. DBE Contact Information 10. DBE %
Local Agency to Complete this Section
11. TOTAL CLAIMED DBE PARTICIPATION % 17. Local Agency Contract Number:
18. Federal-Aid Project Number:
19. Proposed Contract Execution Date:
Local Agency certifies that all DBE certifications are valid and information on this form is complete and accurate.
IMPORTANT: Identify all DBE firms being claimed for credit, regardless of tier. Written confirmation of each listed DBE is required.
20. Local Agency Representative's Signature 21. Date
12. Preparer's Signature 13. Date
22. Local Agency Representative's Name 23. Phone
14. Preparer's Name 15. Phone
24. Local Agency Representative's Title 16. Preparer's Title
DISTRIBUTION: Original – Included with consultant’s proposal to local agency. ADA Notice: For individuals with sensory disabilities, this document is available in alternate formats. For information call (916) 654-6410 or TDD (916) 654-
3880 or write Records and Forms Management, 1120 N Street, MS-89, Sacramento, CA 95814.
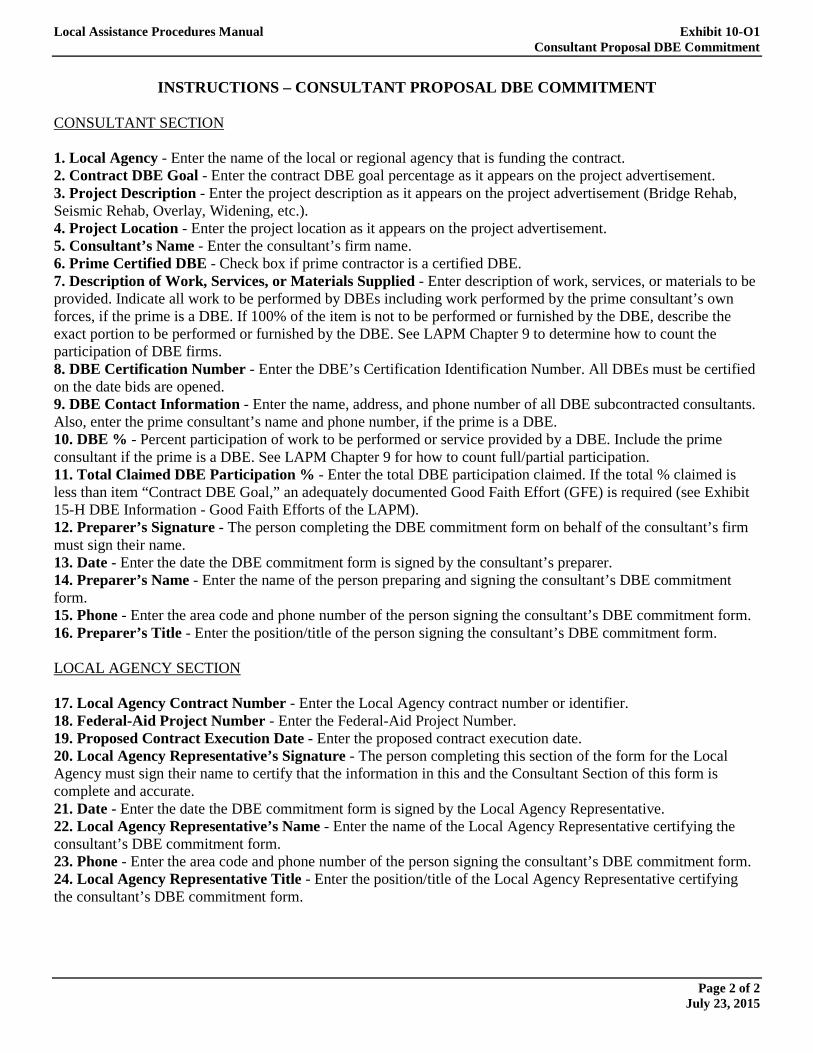
Local Assistance Procedures Manual Exhibit 10-O1 Consultant Proposal DBE Commitment
Page 2 of 2 July 23, 2015
INSTRUCTIONS – CONSULTANT PROPOSAL DBE COMMITMENT
CONSULTANT SECTION 1. Local Agency - Enter the name of the local or regional agency that is funding the contract. 2. Contract DBE Goal - Enter the contract DBE goal percentage as it appears on the project advertisement. 3. Project Description - Enter the project description as it appears on the project advertisement (Bridge Rehab, Seismic Rehab, Overlay, Widening, etc.). 4. Project Location - Enter the project location as it appears on the project advertisement. 5. Consultant’s Name - Enter the consultant’s firm name. 6. Prime Certified DBE - Check box if prime contractor is a certified DBE. 7. Description of Work, Services, or Materials Supplied - Enter description of work, services, or materials to be provided. Indicate all work to be performed by DBEs including work performed by the prime consultant’s own forces, if the prime is a DBE. If 100% of the item is not to be performed or furnished by the DBE, describe the exact portion to be performed or furnished by the DBE. See LAPM Chapter 9 to determine how to count the participation of DBE firms. 8. DBE Certification Number - Enter the DBE’s Certification Identification Number. All DBEs must be certified on the date bids are opened. 9. DBE Contact Information - Enter the name, address, and phone number of all DBE subcontracted consultants. Also, enter the prime consultant’s name and phone number, if the prime is a DBE. 10. DBE % - Percent participation of work to be performed or service provided by a DBE. Include the prime consultant if the prime is a DBE. See LAPM Chapter 9 for how to count full/partial participation. 11. Total Claimed DBE Participation % - Enter the total DBE participation claimed. If the total % claimed is less than item “Contract DBE Goal,” an adequately documented Good Faith Effort (GFE) is required (see Exhibit 15-H DBE Information - Good Faith Efforts of the LAPM). 12. Preparer’s Signature - The person completing the DBE commitment form on behalf of the consultant’s firm must sign their name. 13. Date - Enter the date the DBE commitment form is signed by the consultant’s preparer. 14. Preparer’s Name - Enter the name of the person preparing and signing the consultant’s DBE commitment form. 15. Phone - Enter the area code and phone number of the person signing the consultant’s DBE commitment form. 16. Preparer’s Title - Enter the position/title of the person signing the consultant’s DBE commitment form. LOCAL AGENCY SECTION 17. Local Agency Contract Number - Enter the Local Agency contract number or identifier. 18. Federal-Aid Project Number - Enter the Federal-Aid Project Number. 19. Proposed Contract Execution Date - Enter the proposed contract execution date. 20. Local Agency Representative’s Signature - The person completing this section of the form for the Local Agency must sign their name to certify that the information in this and the Consultant Section of this form is complete and accurate. 21. Date - Enter the date the DBE commitment form is signed by the Local Agency Representative. 22. Local Agency Representative’s Name - Enter the name of the Local Agency Representative certifying the consultant’s DBE commitment form. 23. Phone - Enter the area code and phone number of the person signing the consultant’s DBE commitment form. 24. Local Agency Representative Title - Enter the position/title of the Local Agency Representative certifying the consultant’s DBE commitment form.
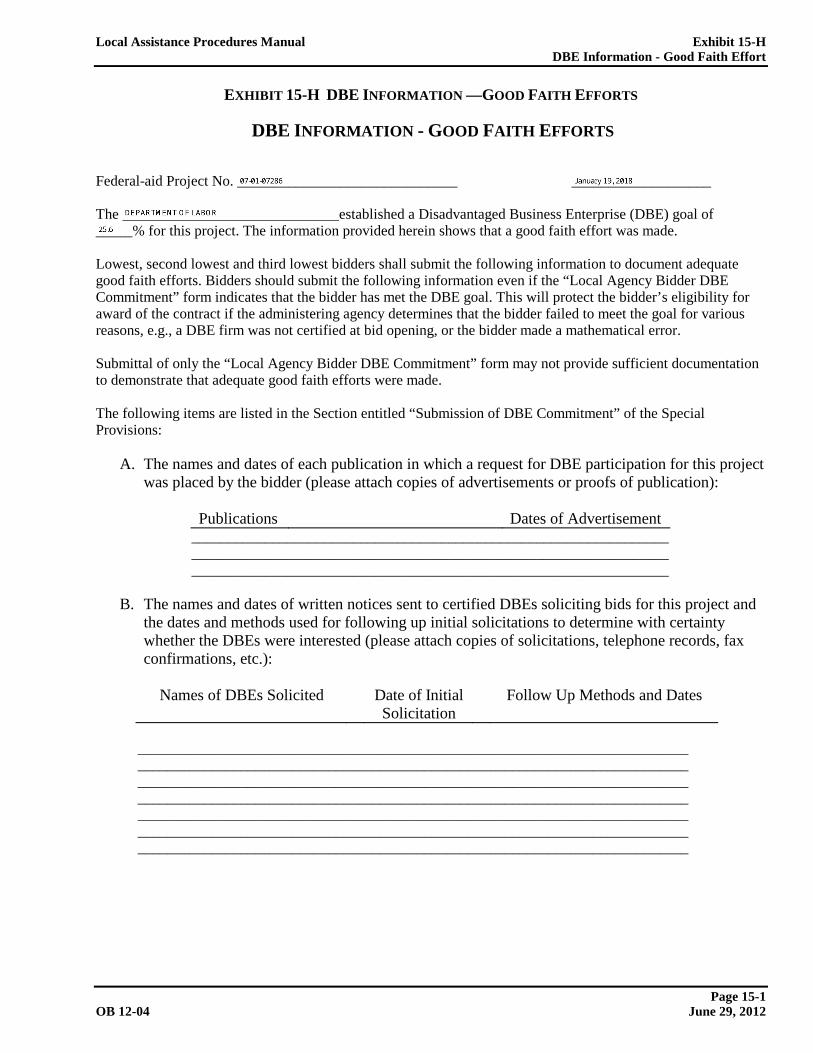
Local Assistance Procedures Manual Exhibit 15-H DBE Information - Good Faith Effort
Page 15-1 OB 12-04 June 29, 2012
EXHIBIT 15-H DBE INFORMATION —GOOD FAITH EFFORTS
DBE INFORMATION - GOOD FAITH EFFORTS Federal-aid Project No. ______________________________ ___________________ The established a Disadvantaged Business Enterprise (DBE) goal of _____% for this project. The information provided herein shows that a good faith effort was made. Lowest, second lowest and third lowest bidders shall submit the following information to document adequate good faith efforts. Bidders should submit the following information even if the “Local Agency Bidder DBE Commitment” form indicates that the bidder has met the DBE goal. This will protect the bidder’s eligibility for award of the contract if the administering agency determines that the bidder failed to meet the goal for various reasons, e.g., a DBE firm was not certified at bid opening, or the bidder made a mathematical error. Submittal of only the “Local Agency Bidder DBE Commitment” form may not provide sufficient documentation to demonstrate that adequate good faith efforts were made. The following items are listed in the Section entitled “Submission of DBE Commitment” of the Special Provisions:
A. The names and dates of each publication in which a request for DBE participation for this project was placed by the bidder (please attach copies of advertisements or proofs of publication):
Publications Dates of Advertisement
_________________________________________________________________ _________________________________________________________________ _________________________________________________________________
B. The names and dates of written notices sent to certified DBEs soliciting bids for this project and
the dates and methods used for following up initial solicitations to determine with certainty whether the DBEs were interested (please attach copies of solicitations, telephone records, fax confirmations, etc.):
Names of DBEs Solicited Date of Initial
Solicitation Follow Up Methods and Dates
___________________________________________________________________________ ___________________________________________________________________________ ___________________________________________________________________________ ___________________________________________________________________________ ___________________________________________________________________________ ___________________________________________________________________________ ___________________________________________________________________________
Exhibit 15-H Local Assistance Procedures Manual DBE Information -Good Faith Effort
Page 15-2 June 29, 2012 OB 12-04
C. The items of work which the bidder made available to DBE firms including, where appropriate,
any breaking down of the contract work items (including those items normally performed by the bidder with its own forces) into economically feasible units to facilitate DBE participation. It is the bidder's responsibility to demonstrate that sufficient work to facilitate DBE participation was made available to DBE firms.
Items of Work Bidder Normally
Performs Item (Y/N)
Breakdown of Items
Amount ($)
Percentage Of
Contract
______________________________________________________________________________________ ______________________________________________________________________________________ ______________________________________________________________________________________
D. The names, addresses and phone numbers of rejected DBE firms, the reasons for the bidder's
rejection of the DBEs, the firms selected for that work (please attach copies of quotes from the firms involved), and the price difference for each DBE if the selected firm is not a DBE:
Names, addresses and phone numbers of rejected DBEs and the reasons for the bidder's rejection
of the DBEs: _______________________________________________________________ _______________________________________________________________ _______________________________________________________________ _______________________________________________________________
Names, addresses and phone numbers of firms selected for the work above: _______________________________________________________________ _______________________________________________________________ _______________________________________________________________ _______________________________________________________________
E. Efforts made to assist interested DBEs in obtaining bonding, lines of credit or insurance, and any
technical assistance or information related to the plans, specifications and requirements for the work which was provided to DBEs:
_______________________________________________________________ _______________________________________________________________ _______________________________________________________________ _______________________________________________________________

Local Assistance Procedures Manual Exhibit 15-H DBE Information - Good Faith Effort
Page 15-3 OB 12-04 June 29, 2012
F. Efforts made to assist interested DBEs in obtaining necessary equipment, supplies, materials or
related assistance or services, excluding supplies and equipment the DBE subcontractor purchases or leases from the prime contractor or its affiliate: ______________________________________________________________________________ ______________________________________________________________________________ ______________________________________________________________________________ ______________________________________________________________________________
G. The names of agencies, organizations or groups contacted to provide assistance in contacting,
recruiting and using DBE firms (please attach copies of requests to agencies and any responses received, i.e., lists, Internet page download, etc.):
Name of Agency/Organization Method/Date of Contact Results
____________________________________________________________________________________ ____________________________________________________________________________________
H. Any additional data to support a demonstration of good faith efforts (use additional sheets if
necessary): ______________________________________________________________________________ ______________________________________________________________________________
NOTE: USE ADDITIONAL SHEETS OF PAPER IF NECESSARY.