Embed Size (px)
Citation preview

1
A UNITÎO SIMS OEPAHTMENI OE
COMMERCE Pltm (CATION
il Report ERL 131-ITS 92 —\ y \
^T|* O*
iiim
Required Signal-to-Noise Ratios for HF Communication Systems
HIROSHI AKIMA GENE G. AX WESLEY M. BEERY
BOULDER, COLORADO
August 1969
Reproduced by the CLEARINGHOUSE
for Federal Scientific & Technical Information Springfield Va. 22151
DEC 5 1969
B

U. S. DEPARTMENT OF COMMERCE
Maurice H. Stans, Secretary
ENVIRONMENTAL SCIENCE SERVICES ADMINISTRATION Robert M. White, Administrator
RESEARCH LABORATORIES
Wilmot N. Hess, Director
ESSA TECHNICAL REPORT ERL 131-ITS 92
Required Signal-to-Nciss Ratios for HF Communication Systems
HIROSHI AKIMA GENE G. AX WESLEY M. BEERY
INSTITUTE FOR TELECOMMUNICATION SCIENCES BOULDER, COLORADO August 1969
For sale by the Superintendent of Documents, U.S. Government Printing Office, Washington, D.C. 20402
Price 60 cents.

ESSA RESEARCH LABORATORIES The mission of the Research Laboratories is to study the oceans, inland waters the
lower and upper atmosphere, the space environment, and the earth in search of the nnHer. standmg needed to provide more useful services in improving man’s prospects for survival as influenced by the physical environment. Laboratories contributing^ these studies are:
Earth Sciences Laboratories: Geomagnetism, seismology, geodesy, and related earth
SSoÂêtarf rZ?' Ínternal StrUCtU,'e a"d “CCUrate ^ °f the Enrth' “d
TaW«S1L.0CAanOgraphICv and Meteorological Laboratories rad Pacific Oceanographic Laboratories. Oceanography, with emphasis on ocean basins and borders, and oceanic processes; sea-air interactions: and land-sea interactions. (Miami, Florida)
Atmospheric Physics and Chemistry Laboratory: Cloud physics and precipitation- chemical composition and nucleating substances in the lower atmosphere; and laboratory and field experiments toward developing feasible methods of weather modification. Y
Air Resources Laboratories: Diffusion, transport, and dissipation of atmospheric con-
tlo” Ts3ver Spring,PiSa^)m<ith0d8 *“ pr<!dictlon a"d co"trol “f atmospheric polio-
Geophysical Fluid dynamics Laboratory: Dynamics and physics of geophysical fluid sbntonHn deve|opment of a theoretical basis, through mathematical modeling and computer New Jersey)°r ^ behavior and pr°Perties of the atmosphere and the oceans. (Princeton,
National Severe Storms Laboratory: Tornadoes, squall lines, thunderstorms, and other toerint Í h conveçtlve phenomena toward achieving improved methods of forecasting, de¬ tecting, and providing advance warnings. (Norman, Oklahoma) B
Space Disturbances Laboratory: Nature, behavior, and mechanisms of space disturb¬ ances, development and use of techniques for continuous momtoring and early detection and reporting of important disturbances. y n
Aeronomy Laboratory: Theoretical, laboratory, rocket, and satellite studies of the phvs-
a^icl o^her planetsa processes controllinfï the ionosphere and exosphere of the earth
Wave Propagation Laboratory: Development of new methods for remote sensing of the geophysical environment; special emphasis on propagation of sound waves, and electromag¬ netic waves at millimeter, infrared, and optical frequencies. g
Institute for Telecommunication Sciences: Central federal agency for research and serv mes in propagation of radio waves, radio properties of the earth and its atmosphere, natuTe to/mnlriff'Sefand lnt®r*rencf’ information transmission and antennas, and methods for the more effective use of the radio spectrum for telecommunications.
Research Flight Facility : Outfits and operates aircraft specially instrumented for re-
atocraftan(Miaml Ftoridï) ^ ^ gr°UPS ^ fcnvironmental measurements for
a. s> £j a
-! I 5 3 s » F-. 2j
£• I
VI £
5 ï r I g1 * s s
n!RP!<MÍfTAL SC,ENCE SERVICES ADMINISTRATION a S ! □ ru» BOULDER, COLORADO 80302

FOREWORD
The study described in this report was performed by the Institute for Telecommunica¬ tion Sciences of the Environmental Science Services Administration, U.S. Department of Commerce, for and with the support of the U.S. Army Strategic Communications Command, Fort Huachuca, Arizona. The work was per¬ formed under Environmental Science Services Administration Project D51131145.


TABLE OF CONTENTS
FOREWORD
ABSTRACT
1. INTRODUCTION
1. 1 Background
1. 2 Objective and Scope
2.. VOICE COMMUNICATION SYSTEMS
2. 1 Modulation Techniques
2. 2 Expression of Voice Quality
2. 3 Articulation Test Results
2. 4 Articulation Index
2. 5 Required Signal-to-Noise-Density Ratio for Just Usable Quality Voice Transmission Under Stable Conditions
2. 6 Fading Allowances for Just Usable Quality Voice Transmission
2. 7 Required Signal-to-Noise-Density Ratio for Good Commercial Quality Voice Transmission
2. 8 Multiplexing
2. 9 Summary for Voice Communication Systems
3. DIGITAL COMMUNICATION SYSTEMS
3. 1 Modulation Techniques
3.2 Teletypewriter Systems
3. 3 Basic Performance of a Single-Channel NCFSK System Under Stable Conditions
3.4 Basic Performance of a Single-Channel NCFSK System Under Fading Conditions
3. 5 Required Signal-to-Noise Ratios for Single-Channel NCFSK Systems
Page
ii
1
1
1
2
4
4
6
9
14
16
20
24
24
25
27
27
29
32
35
39
iii

TABLE OF CONTENTS (continued)
3. 6 Required Signal-to-Noise-Density Ratios for Some Typical NCFSK Systems 43
3. 7 Summary for Digital Communication Systems 45
4. OTHER COMMUNICATION SYSTEMS 49
4. 1 Composite Voice and Teletypewriter Systems 49
4. 2 Aural-Reception Radiotelegraphy 52
4. 3 Phototelegraphy (Facsimile) 52
5. SUMMARY AND CONCLUSIONS 53
6. ACKNOWLEDGMENTS 55
7. REFERENCES c.
IV

REQUIRED SIGNAL-TO-NOISE RATIOS FOR
HF COMMUNICATION SYSTEMS
Hiroshi Akima, Gene G„ Ax, and Wesley M. Beery
Values of required signal-to-noise ratios are estimated for the following HF communication systems: amplitude-modulation (AM) voice communication sys¬ tems, noncoherent frequency-shift-keying (NCFSK) radioteletypewriter systems, composite voice and teletypewriter systems, aural-reception radiotele- graphy, and phototelegraphy (facsimile). Except for NCFSK systems, for which certain aspects of the basic performance had to be evaluated in the course of this study, values of required signal-to-noise ratios are estimated from published data in the open literature. .
Key Words: Amplitude modulation, diversity recep¬ tion, fading, frequency-shift-keying- HF communication system, radiotele¬ typewriter, required signal-to-noise ratio, voice communication.
1. INTRODUCTION
1.1 Background
For monthly predictions of the lowest useful frequency (LUF), the
Institute for Telecommunication Sciences (ITS) of the Environmental
Science Services Administration (ESSA) currently uses the values of re¬
quired signal-to-noise ratios given in Technical Report No. 4 issued by
the U.S. Army Radio Propagation Agency (ARPA) (Silva, 1964), The
International Radio Consultative Committee (CCIR) also has recommen¬
dations and reports (CCIR, 1964; 1967b, c, d) on similar subjects and
gives values of required signal-to-noise ratios and fading allowances.

However, because there are some discrepancies between the ARPA and
CCIR documents, we reevaluated and updated the values of required
signal-to-noise ratios for various HF communication systems.
1.2 Objective and Scope
The objective of this study is to derive required signal-to-noise
ratios for desired grades of service for various HF communication
systems. The intention here is not to advance the state of the art for
communications in an HF channel, but rather to derive best estimates
of required signal-to-noise ratios for various existing systems and
establish a documented source for reference purposes.
The required signal-to-noise ratio for any particular HF com¬
munication system is a function of many variables that cannot be pre¬
dicted exactly, and we will therefore treat the required signal-to-noise
ratio as a random variable and will obtain, whenever possible, estimates
of its mean value and dispersion. The term "required signal-to-noise
ratio" should be interpreted in this report as an estimate of the "mean
value" of the required signal-to-noise ratios. An estimate of the dis¬
persion, in terms of standard deviation, of the actual required signal-
to-noise ratios about the mean value will be given.
Considered are;
(1) Radiotelephone (double-sideband and single-sideband ampli¬
tude modulation), radioteletypewriter (single channel, time-
division multiplex, and frequency-division multiplex; nonco¬
herent frequency-shift-keying), combined systems of voice
and multiplexed teletypewriters, radiotelegraphy (Morse code,
on-off keying, aural reception), and phototelegraphy or facsim¬
ile (frequency modulation of subcarrier).
2

(2) Stable (nonfading) conditions, fading conditions without diver¬
sity, and fading conditions with dual diversity. Three diver¬
sity combining methods (selection switching, equal gain, and
maximal ratio) whenever applicable.
(3) Both white Gaussian noise and atmospheric noise. The
amplitude probability distribution of atmospheric noise as
described by CCIR (1964) is taken into account.
(4) For radiotelephony, required signal-to-noise ratios for both
good commercial quality and just usable quality, sometimes
called order-wire quality or operator-to-operator quality.
(5) For radioteletypewriter, required signal-to-noise ratios for
probabilities of character error of 1 percent, 0. 1 percent, and
0. 01 percent. Both synchronous and start-stop systems. The
maximum signalling rate in multiplexed teletypewriter
channels is 1200 bit/sec in a 3-kHz bandwidth. Error control
coding not considered.
For convenience of application of the results, required signal-
to-noise ratio will be given in the form of signal-to-noise-densxty
ratio in dB. This is defined as the ratio of unmodulated carrier power
to average noise power in a 1-Hz radio-frequency (RF) bandwidth for
double-sideband amplitude-modulation (DSB-AM) systems, and as the
ratio of peak envelope power of the signal to average noise power in a
1-Hz RF bandwidth for other modulation systems. The terms carrier-
to-noise ratio and carrier-to-noise-density ratio will sometimes be
used in lieu of signal-to-noise ratio and signal-to-noise-density ratio,
respectively, when we discuss a DSB-AM system. For a fading signal
required signal-to-noise (or noise-density) ratio will be expressed in
terms of median signal-to-noise (or noise-density) ratio defined as a
ratio of median signal power to average noise power (or noise power
density).
3

2. VOICE COMMUNICATION SYSTEMS
2. 1 Modulation Techniques
Modulation techniques considered for voice communication over
an HE channel are limited to double-sideband amplitude-modulation
(DSB-AM), single-sideband amplitude-modulation (SSB-AM), and
independent-sideband amplitude-modulation (ISB-AM). The nominal
baseband bandwidth of a voice signal is 3 kHz. The RF bandwidth of an
SSB-AM signal is also 3 kHz. A DSB-AM signal occupies an RF band¬
width of 6 kHz. An ISB-AM system accomodates up to four independent
sidebands, each of v'hich has a bandwidth of 3 kHz and can be either a
voice, a facsimile, or a multiplexed digital signal.
A DSB-AM system has a threshold in its characteristic of signal-
to-noise ratios, below which the signal-to-noise ratio at the demodulator
output is not proportional to the carrier-to-noise ratio at the demodulator
input. However, as will be shown later, the value of signal-to-noise
ratio in which we are interested lies above the thresho'd, where, for a
100 percent modulated DSB-AM signal, the peak envelope power of the
modulating signal at the demodulator output is equal to the carrier power
at the demodulator input. On the other hand, the power spectral density
of the noise at the demodulator output is twice the noise power spectral
density at the demodulator input. Thus, the speech-to-noise-density
ratio, defined as the ratio of the peak envelope power of the audio¬
frequency (AF) voice signal to the noise power spectral density in the
baseband, is 3 dB lower than the carrier-to-noise-density ratio.
For an SSB-AM signal, the speech-to-noise-density ratio is
equal to the RF signal-to-noise-density ratio. Therefore, the RF
signal-to-noise-density ratio for an SSB-AM signal can be 3 dB lower
4

than the carrier-to-noise-density ratio for a 100 percent modulated
DSB-AM signal above the threshold to give an equal speech-to-noise-
density ratio.
Considering noise power instead of noise power density, the
carrier-to-noise ratio for a 100 percent modulated DSB-AM signal
above threshold must be equal to the signal-to-noise ratio for an SSB-AM
signal to give an equal speech-to-noise ratio; where the carrier-to-noise
ratio for a DSB-AM signal is the ratio of carrier power to average noise
power in a 6_-kHz RF bandwidth, the signal-to-noise ratio for an SSB-AM
signal is the ratio of peak envelope power of the signal to average noise
power in a 3-kHz RF bandwidth, and the speech-to-noise ratio is the
ratio of peak envelope power of the AF voice signal to average noise
power in a 3-kHz AF bandwidth.
The above relation provides us with a means for estimating the
required signal-to-noise ratio for an SSB-AM system from test results
made on a DSB-AM system, and vice versa.
In the preceding paragraphs, complete carrier suppression has
been assumed for SSB-AM signals. From the engineering standpoint,
CCIR (1967a) defines two types of SSB-AM signals: one with a reduced
carrier and the other with a suppressed carrier. The reduced carrier
is defined as a "carrier emitted at a power level between 6 dB and 32 dB
below the peak envelope power and preferably between 16 dB and 26 dB
below the peak envelope power. " The suppressed carrier is defined as a
"carrier restricted to a power level more than 32 dB below the peak
envelope power and preferably 40 dB or more below the peak envelope
power. The RF signal-to-noise-density ratio for an actual SSB-AM
signal must be higher than that for a conceptual SSB-AM signal without
carrier by a correction factor that depends on the carrier reduction.
For SSB-AM signals with carriers emitted at power levels of 6 dB, 16 dB,
20 dB, 26 dB, 32 dB, and 40 dB below the peak envelope power, the
5

correction factors are equal to 6. 0 dB, 1. 5 dB, 0, 9 dB, 0. 4 dB, 0. 2 dB,
and 0. 1 dB, respectively. For practical purposes, the correction factor
for an SSB-AM signal with a suppressed carrier as defined by the CCIR
is negligible. Therefore, for simplicity the term "SSB -AM signal" will
be used in this report to indicate an SSB-AM signal with a suppressed
carrier, unless otherwise noted.
Another important point is that the channel, which here is taken
to include the RF equipment, is peak-limited as far as transmission of
speech is concerned. No matter what modulation t ^chnique is used, the
instantaneous peak voltage, not the average power, of the voice signal is
limited by the channel. On the other hand, as will be shown later, the
intelligibility of a voice signal is essentially insensitive to peak clipping
of the signal in a certain range of clipping levels. In this range the
intelligibility of a voice signal primarily depends on the ratio of average
power, not peak power, of the voice signal to average noise power.
These facts create a difficult technical problem in setting the level for
voice signals, which may be one of the most important reasons for the
strongly divergent intelligibility test results.
2. 2 Expression of Voice Quality
It is not difficult for most listeners to subjectively classify voice
quality into the following five grades: excellent, good, fair, poor, and
bad (hopeless). But because the criterion for this assessment depends
on the listeners, only a statistically processed grade derived from the
assessed grades by a number of listeners has a useful meaning.
Voice quality can also be scored by various hearing tests, such
as nonsense syllable articulation tests (French and Steinberg, 1947),
phonetically balanced (PB) word articulation tests (Egan, 1944), rhyme
tests (Fairbanks, 1958), modified rhyme test (House et al., 1965),
6

and sentence intelligibility tests (Fletcher, 1953). Each of these tests
has its own advantages and disadvantages.
Relation between PB word articulation and sentence intelligibility
is shown in figure 1. Of the two curves, one is taken from Licklider and
Goffard (1947), the other is derived from the relations between articu¬
lation index and various measures of speech intelligibility (see fig. 5) given
by Kryter (1962a). That the two curves are significantly different can
be appreciated if we recognize that, as we shall see, a difference of
20 percent in PB word articulation corresponds approximately to a 5-dB
difference in required signal-to-noise ratio. The difference in these
two curves is only an example of the wide divergence of existing data on
required signal-to-noise ratios for voice communication.
Hirsh et al. (1954) obtained articulation scores for nonsense
syllables and for monosyllabic, disyllabic, and polysyllabic words as
a function of the cutoff frequency of low-pass and high-pass filters, and
also as a function of signal-to-noise ratio at different noise levels.
The results indicate that the relation between the intelligibility of each
word type and of nonsense syllables is not the same when the system is
impaired by filtering as when it is impaired by noise.
In an attempt to eliminate speech-intelligibility testing, which is
expensive and time-consuming, a procedure was developed for calculating
from physical and acoustical measurements made on a communication
system a measure that is indicative of the intelligibility scores that
would be obtained for that system under actual test conditions (Kryter,
1962a, b). This measure is called the "articulation index" and is de¬
scribed in section 2.4.
7

Sen
tenc
e In
telli
gib
ility
(%)
PB-Word Articulation (%)
Figure 1. Relation between PB word articulation and sentence intelligibility. (After Licklider and Goffard, 1947; Kryter, 1962a.)
8

2. 3 Articulation Test Results
Many tests conducted to determine the relation between signal-to-
noise ratio and word articulation have been reported. Because these
tests were not necessarily based on a 3-kHz bandwidth, we need a con¬
version relationship between baseband bandwidth and articulation to
make use of the test results. Figure 2 shows the relation between
carrier-to-noise-density ratio and PB word articulation for DSB-AM
signals determined with various RF bandwidths by Cunningham et al.
(1947). It indicates that, for the range of articulation of 40 to 60 percent,
required signal-to-noise-density ratio does not change very much with
the RF bandwidth. For example, required carrier-to-noise-density
ratio for 60 perce'nt articulation with a 9- 6-kHz bandwidth differs by
less than 1 dB from the required carrier-to-noise-density ratio for the
same articulation with a 5. 2-kHz bandwidth.
Figure 2 also indicates that the wider the RF bandwidth the more
rapidly the articulation decreases with a decrease of the carrier-to-
noise-density ratio. This can be interpreted as the effect of the threshold
in the characteristics of signal-to-noise-density ratio of DSB-AM systems.
For example, at a carrier-to-noise-density ratio of 45 dB, the RF
carrier-to-noise ratios at the demodulator input are 8, 5, 2, and -2 dB,
respectively, for RF bandwidths of 5.2, 9-6, 21, and 52 kHz. The first,
8 dB, is about at the threshold value, i. e. , the lower end of the linear
range of the characteristic; the others are below the threshold. There¬
fore, we may expect that, if the same test were made on SSB-AM signals,
the effect of bandwidth would be less than that shown in this figure. The
articulation also seems to depend primarily on the speech-to-noise-
density ratio, and not on the speech-to-noise ratio. This conclusion is
in agreement with the concept of the articulation index, to be discussed
in the next section.
9

PB
-Wo
rd
Art
icuia
tion
(%)
Carrier-to-Noise-Density Ratio (dB)
Figure 2. Relation between carrier-to-noise-density ratio and PB
word articulation for DSB-AM signals and white Gaussian noise for different values of the IF bandwidth B. (Carrier- to-noise-density ratio is the ratio of carrier power to average noise power contained in a 1-Hz bandwidth. ) (After Cunningham et al. , 1947. )

Many investigators (Licklider, 1946; Kryter et al., 1947; Licklider
and Pollack, 1948; Pollack and Pickett, 1959; Ewing and Huddy, 1966)
have reported that peak clipping of a voice signal does not seriously
degrade the signal1 s intelligibility. Since our communication channel is
peak-limited, peak clipping and amplification improve the intelligibility
with equal speech-to-noise ratio (the ratio between the peak AF signal
power and the noise power). As an example, from the test results in
figure 3 (taken from Ewing and Huddy, 1966), we see that the curve for
12-dB RF clipping lies about 12 dB left of the curve for no clipping.
This means that a difference of 12 dB in the level setting appears directly
as a difference of the same amount in the required signal-to-noise ratio.
Figure 3 also indicates that AF clipping results in less improvement
than RF clipping; because more harmonic distortion terms due to peak
clipping fall in the baseband, the voice quality is degraded more severely
in AF than in RF clipping.
Relations between carrier-to-noise-density ratio and PB word
articulation for DSB-AM systems taken from four sources (Cunningham
et al., 1947; Licklider and Goffard, 1947; Craiglow et al., 1961; Ewing
and Huddy, 1966) are shown in figure 4. In their tests, Cunningham
et al. (1947) and Licklider and Goffard (1947) adjusted the speech
amplifier to provide 100-percent modulation on the average instantaneous
peaiks of the speech wave, monitoring the speech wave on an oscilloscope.
For the other two tests cited, the criteria of level setting are not known.
As figure 4 shows, the articulation test results diverge widely, and the
values of required carrier-to-noise-density ratio for a particular value
of articulation taken from the data are distributed in a range as wide as
12 dB.
There are several possible reasons for the wide divergence among
the articulation test results. Skill of talkers and listeners is one factor,
but, if a well-trained team of listeners is used, the articulation score
11

PB
-Word
Art
icula
tion
(%)
100
80
60
40
20
35
24 dB RF Clipping
12 dB RF Clipping
24 dB ^ AF Clipping
12dB AF Clipping
No Clipping
55 60
Speech-to-Noise-Density Ratio (dB)
Figure 3. Relation between speech-to-noise-density ratio and PB word articulation with RF peak clipping, with AF peak clipping, and without peak clipping. (Speech-to-noise- denfiity ratio is the ratio of the peak envelope power of the voice signal to average noise power contained in a 1-Hz bandwidth. ) (After Ewing and Huddy, 1966. )
12

Figure 4. Relation between carrier-to-noise-density ratio and PB
word articulation for DSB-AM signals and white Gaussian noise by different investigacors. (Carrier-to-noise-density ratio is the ratio of carrier power to average noise power contained in a 1 -Hz bandwidth. ) (After Cunningham et al. , 1947; Licklider and Goffard, 1947; Craiglow et al., 1961- Ewing and Huddy, 1966.)

will be very precise and reliable (Stuckey, 1963). Environmental
conditions can also have an effect, but are very difficult to specify.
Another factor, very important but given little attention, is the problem
of level, setting of the voice signal, which is discussed in conjunction
with figure 3. There are several criteria or instructions to be given to
an operator of the test equipment in articulation tests or communication
equipment at the transmitting site in actual communications. They are
not necessarily the same, and even with the same instruction level
setting still depends on personal judgement. In actual communication,
talkers tend to talk louder when they have difficulty in their conversation.
No data are available on personal differences in level setting for a given
instruction or under adverse conversation conditions.
2. 4 Articulation Index
French and Steinberg (1947) found that the audio band can be
divided into a number of subbands, each of which contributes an equal
amount to a measure of articulation, called the articulation index. This
contribution decreases if the ratio of the power density of the voice
signal to that of the noise in that subband decreases, and it is linearly
additive, while the contribution to an intelligibility score, such as PB
word articulation or sentence intelligibility, is not. The concept of
articulation index introduced by French and Steinberg (1947) was
developed by Beranek (1947) and Kryter (1962a), and its validity was
demonstrated by Kryter (1962b).
Approximate relations between the articulation index and various
measures of speech intelligibility are given in figure 5. These relations
are approximate in the sense that they depend upon type of material and
skill of talkers and listeners.

Sylla
ble
s,
Word
s,
or
Sente
nce
s U
nd
ers
too
d
(%)
Figure 5. Approximate relations between articulation index and various measures of speech intelligibility. (After Kryter, 1962a; Griffiths, 1968.)
15
Relation between speech-to-noise-density ratio and articulation
index is computed according to the method suggested by Kryter (1962a)
and is shown in figure 6. According to Kryter, if the rms values of the
speech levels are determined for successive 1/8-sec intervals, 1 per¬
cent of the values so obtained exceed the long-term rms value of the
speech by 12 dB or more. The value of long-term rms plus 12 dB is
used in computations of the articulation index to represent the peak
amplitudes of speech that contribute to speech intelligibility. The two
curves given in figure 6 correspond to two different speech spectra given
by Beranek (1947) and Kryter (1962a). A difference of 4 to 5 dB results
from the different spectra assumed.
Using figures 5 and 6, we can obtain the value of required speech-
to-noise-density ratio tor a specified intelligibility by reading the
required articulation index from figure 5 and then the required speech-
to-noise-density ratio from figure 6.
2. 5 Required Signal-to-Noise-Density Ratio for Just Usable
Quality Voice Transmission Under Stable Conditions
There are several criteria for a voice signal of just usable
quality:
Sixty percent PB word articulation.
Fifty percent PB word articulation.
Ninety percent sentence intelligibility.
An articulation index of 0. 3.
No one criterion has been proved superior to the others. Differences of
several dB in required signal-to-noise ratio result: from the adoption of
different criteria. Even if a criterion could be fixed, several values of
the required signal-to noise ratio for each given criterion have been
reported by different investigators.
16

Art
icula
tion
Ind
ex
t*
Speech-to-Noise-Density Ratio (dB)
Figure 6, Relation between speech-to-noise-density ratio and articulation index, based on voice spectra given by Beranek (1947) and Kryter (1962a). (Speech-to-noise- density ratio is the ratio of the peak envelope power of the voice signal to average noise power contained in a 1-Hz bandwidth. )
17
.

In view of the above, we can only try to arrive at a reasonable
estimate of the required signal-to-noise ratio for a voice signal of just
usable quality, and to do so we have adopted the criterion of 90-percent
sentence intelligibility, because it appears to give the highest measure
of agreement. Values of required signal-to-noise ratio and signal-to-
noise-density ratio for this criterion have been taken from various
sources and are shown, in table 1. Results of four tests of PB word
articulation versus carrier-to-noise~density ratio were used in pre¬
paring this table: Cunningham et al. (1947), Licklider and Goffard (1947),
Craiglow et al. (1961), ana Ewing and Buddy (1966). (See fig. 4.) For
the relation between PB word articulation and sentence intelligibility,
two relations given by Licklider and Goffard (1947) and Kryter (1962a)
were used (see fig. 1), and Griffiths' (1968) result has been included as an
example of rhyme tests. In addition to these test results, values of
articulation index were computed as a function of speech-to-noise-density
ratio with voice spectra given by Beranek (1947) and Kryter (1962a),
shown in figure 6, and values of signal-to-noise ratio required for 90-per¬
cent intelligibility were determined from the relation between articulation
index and sentence intelligibility given by Kryter (1962a), shown in figure 5.
Table 1 indicates that the vailles of required signal-to-noise ratio
are widely distributed in a range as wide as 16 dB. Since we have found
no evidence for assigning more weight to one value than another, the
best we can do is to calculate the simple mean and the standard deviation
for each column of the table. The results are given at the bottom of the
table. We suggest that the values of 50 dB and 47 dB be used as the values
of required signal-to-noise-density ratio for voice signal of just usable
quality for DSB-AM and SSB-AM systems, respectively. If the uncertainty
associated with the adoption of the criterion for just usable voice quality
is also taken into account, the estimated dispersion associated with these
values of required signal-to-noise-density ratio is approximately 5 dB in
terms of standard deviation.
18

Table 1. Values oí Required Signal-to-Noise Ratio for Voice Communication of 90-Percent Sentence Intelligibility Taken From Various Sources
Required Signal-to-Noise Ratio in dB Data Source References
DSB-AM SSB-AM Articulation test by
Conver¬ sion from word ar¬ ticulation to sen¬ tence intel¬
ligibility by
Articulation index based on voice spectrum given by
Carrier- to-noise (6 kHz) ratio
Carrier- to-noise- density ratio
PEP- to-noise (3 kHz) ratio
PEP- to-noise- density ratio
11
17
9
20
49
55
47
58
11
17
11
20
46
52
46
55
Cunningham et al. (1947)
Licklider & Goffard (1947)
Craiglow et al. (1961)
Ewing & Huddy (1966)
Licklider & Goffard (1947)
---
6
11
4
14
44
49
42
52
6
11
6
14
41
46
41
49
Cunningham et al. (1947)
Licklider & Goffard (1947)
Craiglow et al. (1961)
Ev/ing and Huddy (1966)
Kryter (1962a)
—
10 48 10 45 Griffiths (1968)
Griffiths (1968)
—
12
16
50
54
12
16
47
51 • - -
Beranek (1947)
Kryter (1962a)
11.8
4. 5
49.8
4.5
12.0
4.4
47.0
4.4
Mean value
Standard deviation
PEP stands for peak envelope power.
19

The preceding discussion has dealt with the effects of Gaussian noise.
On HF channels, however, the noise is mostly atmospheric, impulsive in its
waveform. Tests were carried out by Licklider and Goffard (1947) with im¬
pulsive noise consisting of irregularly spaced pulses and by Daspit and Hen¬
derson (1968) with one sample of recorded atmospheric noise. These tests,
with DSB-AM signals, indicate that, if no noise limiter is used, the re¬
quired carrier-to-„oise ratio can be 5 to 10 dB lower than that required for
Gaussian noise. The results also indicate that the required carrier-to-noise
ratio can be reduced markedly if a noise limiter is used. The resulting im¬
provement factor is a function of average pulse-repetition frequency, irreg¬
ularity of pulse spacing, receiver IF bandwidth, limiting level of the noise
limiter, required PB word articulation, and other parameters. Since in¬
sufficient data are Available that relate the improvement factor to the ampli¬
tude probability distribution of atmospheric noise described by CCIR (1964),
it is recommended that the values of required signal-to-noise-density ratios
for Gaussian noise suggested in the preceding paragraph be used until such
data become available.
The values of required signal-to-noise-density ratios determined in
this section are pessimistic, because neither possible improvement that
may result from use of a noise limiter against impulsive noise nor possible
improvement by peak clipping in the transmitter, described in section 2. 3,
is taken into account. Note that the values correspond to a level setting
of the voice signal at the transmitter whereby no significant peak clipping
occurs.
2.6 Fading Allowances for Just Usable Quality Voice Transmission
The fading allowance is defined here as the difference, in dB. be¬
tween the median signal-to-noise ratio for a fading signal during a short
time in which the statistics of the signal-to-noise ratio may be considered
stationary, and the signal-to-noise ratio for a steady signal, when equal
quality of transmission is obtained in both cases. It is not the same as the
20

f
fading allowance defined by CCIR (1967c). It is convenient to define system
performance statistically in terms of three parameters: grade of service,
time availability, and service probability (Barsis et al. , 1961; CCIR, 1964).
The fading allowance in CCIR (1967c), however, is the sum of two factors:
the fading safety factor, which is related to the grade of service, and the
intensity fluctuation factor, which is the protection factor for a time avail¬
ability of 90 percent. Thus, the CCIR recommendation and concepts are
not consistent, and since the concepts (CCIR, 1964) are more generally ac¬
cepted, we do not use the definition of fading allowance given by CCIR (1967c).
When a radio wave modulated by a voice signal is fading at a very high
rate, on the order of several hertz or higher, or when the fading is frequency
selective, i. e. , when different portions of the spectrum of the signal are
fading differently, the voice signal suffers severe degradation that cannot be
compensated for by increasing the signal-to-noise ratio. Fading allowance
cannot be defined in such cases.
When, on the other hand, the fading is slow and flat (not frequency-
selective) its effect is merely the intermittent attenuation of the voice sig¬
nal. Therefore, the relation between median signal-to-noise ratio and word
articulation for a fading signal can be determined from that for a steady sig¬
nal by computing weighted means, with the probability density function of the
fading signal used as a weighting function. As an example, we selected the
relation between carrier-to-noise-density ratio and PB word articulation
for the IF bandwidth of 5. 2 kHz by Cunningham et al. (1947) as typ al for
the steady signal and, assuming Rayleigh fading computed the relation for
no diversity and dual diversity with three types of combining techniques.
The results are shown in figure 7, where the probability density functions of
diversity combiner output signals given by Altman and Sichak (1956) are
used. This figure indicates that, in the case of no diversity, the fading al¬
lowance for a Rayleigh fading voice signal is about 1 dB for just usable qual¬
ity, i. e. , PB word articulation of 30 to 60 percent.
21

Median Carrier-to-Noise-Density Ratio (dB)
Figure 7. Relations between median carrier-to-noise-density ratio and average PB word articulation with and without dual diversity under slow Rayleigh fading conditions, and comparison with the same relation for a steady signal. The curve for a steady signal is after Cunning¬ ham et al. (1947). (Median carrier-to-noise-density ratio is the ratio of median carrier power to average noise power contained in a 1-Hz bandwidth.)
22

There are some questions concerning the applicability of certain
diversity combining techniques to voice communications. Although the
effects of three types of combining techniques are shown in figure 7,
only selection diversity combining is practical in simple diversity
systems because of distortion problems that may arise with equal-gain
and maximal-ratio diversity combining. This figure indicates that the
fading allowance for the case of Rayleigh fading is -2 dB when dual
diversity with selection switching is usedj which means that the median
carrier-to-noise-density ratio for Rayleigh fading signals can be 2 dB
lower than for nonfading signals, for an equal articulation score.
Our results for log-normal-fading signals having fading ranges
(ratio of upper and lower deciles) of 10 to 15 dB for nondiversity and
dual selection-switching diversity indicate that these curves lie within
1 dB of their respective curves for Rayleigh-fading signals.
For voice communications, diversity reception is effective only
for flat fading signals, but, for flat fading received signals from the an¬
tennas separated by, say, 5 to 10 wavelengths, are generally still
highly correlated. CCIR (I967f) describes the improvement achieved
by widely spaced diversity receiving antennas in which the two receivers
are located about 135 km apart, but makes no mention of efforts to
determine the minimum distance at which the correlation between the
fading signals received at the two antennas decreases sufficiently to
permit effective diversity operation.
A different diversity technique based on audio frequency band¬
splitting and combining methods exists that is designed to be effective for
selective fading of the signals (CCIR, I967f), but no data are available
on the amount of improvement achieved by this technique over the non¬
diversity case.
23

2. 7 Required Signal-to-Noise-Density Ratio for Good Commercial Quality Voice Transmission
Our study has not revealed any evidence suggesting the need for re¬
vising the values of required signal-to-noise ratios for voice communication
of good commercial quality recommended by CCIR (1967b) and adopted by
ARPA (Silva, 1964). On the assumption of a 10-dB improvement achieved
with noise reducers, CCIR gives values of 35 dB and 26 dB as the required
ratios of peak envelope power of the signal to average power of the noise
in a 6-kHz RF band for DSB-AM and SSB-AM systems,respectively. These
values correspond to 67 dB and 64 dB,respectively>for the required signal-
to-noise-density ratios for DSB-AM and SSB-AM systems. Note that, for
DSB-AM systems, the CCIR recommendation is based on the peak envelope
power of the signal, while in this report signal power is defined as the un¬
modulated carrier power of the signal when determining signal-to-noi.e-
density ratios.
For slow, flat fading of the signal, good commercial quality may be
defined as meaning that the actual signal-to-noise ratio exceeds the required
signal-to-noise ratio for a steady signal for a specified percentage of the
time. The value of 90 percent of the time is commonly used for voice com¬
munication of good commercial quality (CCIR, 1967c; Silva, 1964) and re¬
tention of this value is recommended. In this case, the fading allowance is
merely the difference, in dB, between the median level and the lower decile
level of the fading signal. For slow, flat, Rayleigh fading, the fading al¬
lowances are 8. 2 dB and 2. 6 dB, for no diversity and dual selection diver¬
sity, respectively (Altman and Sichak, 1956).
2. 8 Multiplexing
When two, three, and four voice signals are multiplexed and trans
mitted together as a composite ISB-AM transmission, the peak envelope
power is higher than that of a single-channel SSB-AM transmission by 1. 5
dB, 2. 3 dB, and 3.2 dB, respectively (Morrow et al. , 1Q56). Therefore,
24
the required signal-to-noise-density ratios for multiple-channel ISB-AM
transmissions are higher than that for a single-channel SSB-AM tiansmis-
sion by the same amounts.
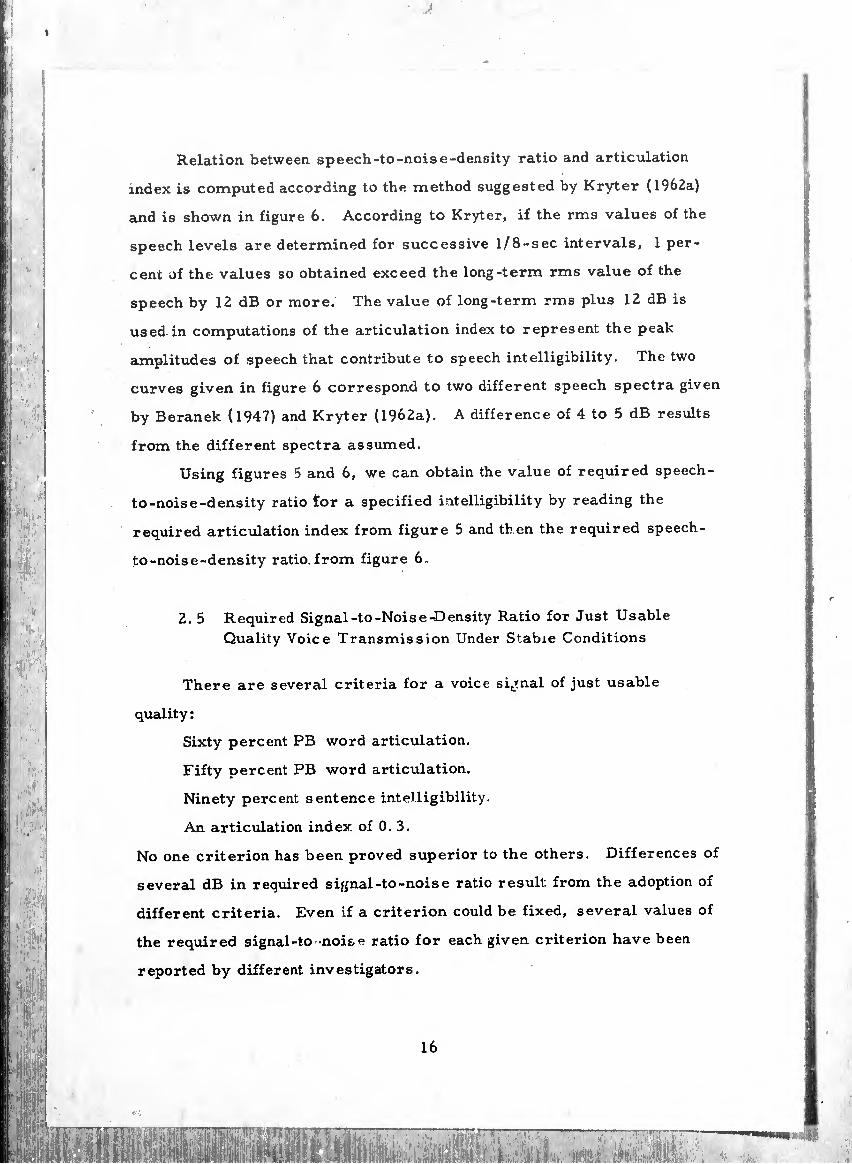
2. 9 Summary for Voice Communication Systems
Our findings for voice communication systems are as follows:
(1) Under stable conditions the required signal-to-noise-density
ratios for voice communication of just usable quality for DSB-
AM and SSB-AM systems are estimated to be 50 dB and 47 dB,
respectively. The estimated standard deviation of the required
signal-to-noise-density ratio around these values is 5 dB.
(2) Allowances for slow Rayleigh fading for voice communication
of just usable quality are estimated to be 1 dB and -2 dB for no
diversity and dual diversity (selection-switching), respectively.
(3) Under stable conditions, the required signal-to-noise-density
ratios for voice communication of good commercial quality
are 67 dB and 64 dB for DSB-AM and SSB-AM systems,
respectively.
(4) Allowances for slow Rayleigh fading for voice communication
of good commercial quality are 8. 2 dB and 2. 6 dB for no
diversity and dual diversity (selection-switching), respectively.
(5) The required signal-to-noise-density ratios for two-, three-,
and four-channel ISB-AM signals should be higher than for a
single-channel SSB-AM signal of equal quality by 1.5 dB,
2.3 dB, and 3.2 dB, respectively.
(6) Recommended values of required signal-to-noise-density
ratios for voice communication systems under various
conditions are summarized in table 2.
25

Table 2. Required Signal-to-Noise-Density Ratios for
Various Voice Communication Systems
Type of Service
Emission desig¬
nation Description
j Just L isable quality
--wjr \ VA X.) J
Good commercial .. quality
j Stable con¬ dition
Fading con¬ dition
Stable con-
Fading con¬ dition
No diver¬ sity
j Dual j diver - sity
anion No diver¬ sity
Dual diver¬ sity
6A3 DSB - AM ! 50 51 48 67 75 70
3A3A SSB-AM reduced carrier*
48 49 46 65 73
'
I 68
3A3J SSB-AM suppressed carrier I
47 48 45 64 72 67
6A3B ISB-AM Í two voice channels |
49 50 I 47 66 J 74 69
9A3B ISB-AM Í three voice channels j
49 50 47 66 74 69
12A3B ISB - AM j four voice ¡ channels j
50 5! 48 67 75 70
powerto averase aoi signal peak envelope pow« ,o notee „owe^H ît° other types of emissions. For fadig conitio^ ^ndwidth f,
envelope powers should he interpret a"d P6ak
‘Carrier emitted at a level 20 dB below the peak envelope power.
26

1
I
.
3. DIGITAL COMMUNICATION SYSTEMS
3. 1 Modulation Techniques
Modulation techniques to be considered for digital communications
are limited to noncoherent frequency-shift-keying (NCFSK) systems.
This type of system is characterized by its modulation rate and the fre¬
quency shift used. The modulation rate is defined as the reciprocal of
the signalling unit interval measured in seconds and is expressed in
bauds (CCITT,1966). The frequency shift is the difference between the
frequencies corresponding to the "mark” and '’-pace" elements. The
ratio of the frequency shift to the modulation rate is often called the
modulation index.
An NCFSK signal can be demodulated by either a limiter-
discriminator demodulator or a dual-filter demodulator. The former
is more commonly used in practice, and its performance in the presence
of atmospheric noise can be readily analyzed. Although matched-filter
demodulators, of which the dual-filter demodulator is a close approxi¬
mation, have been studied theoretically, the performance of this type
of demodulator in the presence of atmospheric noise can only be approxi¬
mately analyzed.
In many theoretical studies the ratio of energy per bit (element)
to noise power density is used as the expression of signal-to-noise
ratio—a convenient concept to work with when we compare or describe
optimally designed modulation systems in the presence of Gaussian
noise. In our study, however, where the systems are limited to NCFSK,
nonoptimally designed systems should be considered, and the perfor¬
mance of systems in the presence of atmospheric noise should be ana¬
lyzed. In this case, it is more convenient to start with the signal-to-
noise ratio at the demodulator input, instead of the ratio of energy per
bit to noise power density.
27

When several teletypewriter signals are to be transmitted simulta¬
neously, either a time-division-multiplexing (TDM) or a frequency-
division-multiplexing (FDM) technique is used. In a TDM-NCFSK system,
a number of teletypewriter signals are time-division-multiplexed first,
and che multiplexed signal is used to frequency-shift-key the RF carrier.
The modulation rate in this system equals the number of teletypewriter
signals times the modulation rate of a single-channel system. The type
of emission is the same as that of a single-channel system, the modu¬
lated RF wave has a constant amplitude, and its performance can be ana¬
lyzed in exactly the same manner as that of a single-channel system.
In an FDM-NCFSK system, on the other hand, a number of sub-
carriers or tones uniformly spaced in frequency, usually in a 3-kHz
baseband, is used. Each subcarrier is frequency-shift-keyed by one
teletypewriter signal, and the composite baseband signal of all the tones
is transmitted as a sideband signal of an SSB-AM or an ISB-AM system.
The modulation rate in each subchannel of an FDM-NCFSK system is the
same as that of a single-channel system. The type of emission for this
system is different from that of a single-channel or a TDM system, and
the amplitude of the modulated RF wave is not constant. The perfor¬
mance of a single subchannel in an FDM-NCFSK system is analyzed in
the same way as a single-channel NCFSK system. To obtain the required
signal-to-noise ratio for an FDM-NCFSK system we have to multiply the
required ratio for a single-channel system not only by the number of
subchannels, but also by a factor corresponding to the ratio of the peak
envelope power to the average power of the RF signal.
Radio waves propagated via the ionosphere suffer a number of
unique perturbations, such as multipath, fast fading, frequency fluctuations,
orphase fluctuations. Because of multipath distortion, the maximum modu¬
lation rate in a digital system is generally limited to the order of 100 to
200bauds, and for this reason multiplexing in a TDM-NCFSK system is
28

limited to, at most, four channels, Multipath distortion is the most im¬
portant reason that FDM systems were developed for multichannel
teletypewriter transmission over HF ionospheric channels.
Frequency fluctuations caused by propagation determine the
minimum frequency spacing between two adjacent subcarriers and,
therefore, the number of subcarriers that can be used in a given band¬
width. For this reason, the minimum modulation rate is limited by
these frequency fluctuations if the total data signalling rate is to be
kept constant.
Under adverse propagation conditions, an irreducible error
probability exists beyond which increasing the signal-to-noise ratio has
no effect. This problem has been analyzed in detail by Bello and Nelin
(1962, 1963, 1964) and comprehensively surveyed by Akima (1967). We
exclude it here and assume that no element errors are caused by dis¬
tortion of the signal due to ionospheric propagation.
3. 2 Teletypewriter Systems
Basically there are two teletypewriter systems: start-stop and
synchronous systems. The two systems are significantly different in
(1) the relation between teletypewriter speed and modulation rate, and
(2) the relation between character error probability and binary element
error probability.
The speed of a teletypewriter system is usually expressed in terms
of words per minute. From the standpoint of modulation techniques,
however, modulation rate is a factor of primary importance as the
measure of transmission speed. The relation between teletypewriter
speed expressed in words per minute (w/m) and modulation rate ex¬
pressed in bauds can be obtained from the following observations:

(1) An average word is generally assumed to consist of six charac¬
ters including one character corresponding to the space be¬
tween words.
(2) In a start-stop system, one character consists of approximately
7. 5 unit intervals, i. e. , five information elements of unit
interval plus a start element of unit interval and a stop element
of approximately one and a half unit intervals.
(3) In a synchronous system, one character consists of six unit
intervals, i. e., five information elements and a synchronizing
element, all of unit interval.
Table 3 shows the modulation rates corresponding to some typical tele¬
typewriter speeds; it does not cover all possible combinations of multi¬
plexing techniques and teletypewriter systems, only those used in common
practice.
The quality of teletypewriter transmissions is usually specified in
terms of character error probability, while the basic quantity that is
theoretically calculated is element error probability. When binary element
errors occur independently of each other, the character error probability
given as a function of the element error probability P by
P = 1-(1-P )17¾ 17 P c e e
for a start-stop system, and by
P = 1-(1-P )5 ~ 5 P c e e
for a synchronous system (Wcitt et al. , 1958). Table 4 shows the values
of element error probability corresponding to some typical values of
specified character error probability. When element errors are dependent,
as is generally true for ionospheric HP channels, the element error
probabilities can be greater for the given character error probabilities.
30

t
Table 3. Relation Between Teletypewriter Speed and Modulation Rate in 5-Unit Teletypewriter Systems
Channel Multiplexing
Teletypewriter System
Teletypewriter Speed
(w/ m/ ch)
Modulation Rate (bauds)
Single-channel
Start-Stop
60 45
100 75
Synchronous
60 36
100 60
F requency- division- multiplexing
Start-Stop
60 45
100
l
75
Two-channel time-division¬ multiplexing
Synchronous ' 60 72
100 120
Four-channel time-division- multiplexing
Svnrhmnniic 60 144
100 240
31

Table 4. Values of Element Error Probability Pe Corresponding to Some Typical Values of Character Error Probability Pc in 5-Unit Teletypewriter Systems
Teletypewriter System
P (%) c p (%) e
Start-Stop
1 0. 059
0. 1 0. 0059
0. 01 0.00059
Synchronous
1 0. 2
0. 1 0. 02
0.01 0. 002
Since we use the values of element error probabilities in table 4, we
obtain slightly pessimistic values of required signal-to-noise ratios for
teletypewriter systems.
3. 3 Basic Performance of a Single-Channel NCFSK System Under Stable Conditions
We shall first discuss the relation between signal-to-noise ratio
and element error probability in a single-channel NCFSK system with a
limiter-discriminator demodulator. When the modulation index is equal
to or greater than one, but not so large that a low-pass filter between the
discriminator and the decision-making circuit would have a significant
effect on the performance, the element error probability Pe is equal to
one-half the probability that the instantaneous noise amplitude will exceed
32

the instantaneoas signal amplitude (Montgomery, 1954a). Under stable
conditions, therefore, the element error probability is one-half the am¬
plitude probability distribution (APD) of the noise corresponding to the
level of the signal; the APD of noise gives the percentage of time for
which a specified level is exceeded by the noise envelope (CCIR, 1964).
In HF channels, the noise is mostly atmospheric. The APD of
atmospheric noise can be represented sufficiently accurately for most
applications by an appropriate curve chocen out of a family of idealized
curves. In practice, the ratio of rms to average of the envelope voltage,
denoted by Vd (in dB), is used to specify the curve that can be used to
represent the distribution (Crichlow et al. , I960; Spaulding et al. , 1962;
CCIR, 1964). The family of idealized APD curves, with the values of
as a parameter, is given in CCIR (1964, fig» 27 ). For atmospheric
noise, the value of Vd is greater than 1. 049 dB, a value that applies to
Gaussian noise.
Figure 8 shows the relation between the signal-to-noise ratio
and the element error probability in a single-channel NCFSK system with a
limiter-discriminator demodulator under stable conditions. To apply
this figure,values of both the signal-to-noise ratio and the noise param¬
eter V , measured at the input to the limiter, should be used. The d
relationship of the element error probability Pe being equal to one-half the
probability that the instantaneous noise amplitude exceeds the instantaneous
signal amplitude (Montgomery, 1954a) that is valid for an NCFSK system
with a limiter-discriminator demodulator applies as well to an NCFSK
system with a dual-filter demodulator (White, 1966), if the average
power and the APD of the composite noise (the sum of the two noise
outputs from the two bandpass filters) are known. When the passbands
of the two bandpass filters are not widely separated in frequency, but
not overlapping, the APD of the composite noise can be closely approxi¬
mated by the noise that would be present in a bandwidth equivalent to the
33

Pro
babili
ty
of
Ele
men
t E
rro
r
Figure 8.
NCFSK -stem signal power to average nif/e p™“ ^ °f
to average of the noise envelopeToeitá£endbIdhÍS °f rms input to the limiter in a limiter dUr ■ b h measured at the
measured in a bandwidth equivalent to d^modulat0r. and Of the two filters in a dual-filter demodufatoT “Z/1? bandwid'hs is assumed to be not less than unit j * ^■odula.tion index
used before the decision-making circuH )“° l0W‘Pass iilter
34

sum of the bandwidths of the two filters. Therefore, figure 8 also
applies to a single-channel NCFSK system with a dual-filter demodulator
under stable conditions, if both the noise power and the noise parameter
V, are measured in a bandwidth equal to the sum of the bandwidths of d
the two filters.
3.4 Basic Performance of a Single-Channel
NCFSK System Under Fading Conditions
Although many studies have been reported on the performance of
NCFSK systems under fading conditions and Gaussian noise, no pertinent
data are available in the literature that deal with the APD of atmospher¬
ic noise along the lines described by CCIR (1964). According to
Montgomery (1954a), the element error probability under slow, flat fading
conditions should be a weighted mean of the stable-condition element error
probability with the probability density function of the signal as a
weighting function. The weighted mean can be computed analytically
only for certain signal and noise distributions, such as Rayleigh-fading
signal and Gaussian noise; in most cases, computations have to be done
by numerical integration techniques. Some typical results of such
computations are shown in figures 9 and 10.
These figures show the relation between the median signal-to-noise
ratio and the element error probability in a single-channel NCFSK system
under Rayleigh-fading and log-normal-fading conditions, respectively,
with no diversity and dual diversity of the selection-switching type.
In figure 10, the fading range, defined as the difference in dB between
the signal levels exceeded for 10 percent and 90 percent of the time, is
assumed to be 13. 4 dB, based on the fact that actually observed fading
ranges over long-distance HF paths are of the same order as the value
of 13.4 dB expected for the Rayleigh distribution (CCIR, 1967e).
35

Pro
ba
bili
ty
of
Eie
me
nt
Err
or
Figure 9. Element error probabilities in a single-channel NCFSK system under Rayleigh-fading conditions with no diversity and dual selection-switching diversity. (Median signal-to-noise ratio is the ratio of median signal power to average noise power, and Vçj is the ratio of rms to average of the noise envelope voltage, both measured at the input to the limiter in a limiter- discriminator demodulator and measured in a bandwidth equivalent to the sum of the bandwidths of the two filters in a dual-filter demodulator. Modulation index is assumed to be not less than unity, and no low-pass filter is used before the decision-making circuit. )
36

Pro
babili
ty
of
Ele
men
t E
rro
r
Median Signal-to-Noise Ratio (dB)
Figure 10. Element error probabilities in a single-channel NCFSK system under log-normal-fading conditions with no diversity and dual selection-switching diversity. (The fading range is assumed to be 13. 4 dB, which is the same as that expected for Rayleigh-fading. Median signal-to-noise ratio is the ratio of median signal power to average noise power, and Vd is the ratio of rms to average of the noise envelope voltage, both measured at the input to the limiter in a limiter- discriminator demodulator, and measured in a bandwidth equivalent to the sum of the bandwidths of the two filters in a dual-filter demodulator. Modulation index is assumed to be not less than unity, and no low-pass filter is used be ore
the decision-making circuit.)
37

The abscissa in figures 9 and 10 is the median signal-to-noise
ratio, not the average signal-to-noise ratio. The median signal-to-
noise ratio is defined as the ratio of the median value of the signal power
to the average value of the noise power, while the average signal-to¬
no? se ratio is the ratio of the average signal power to the average noise
power. Although the average signal-to-noise ratio is used in most
theoretical papers in the literature, the median signal-to-noise ratio is
more convenient in practice.
Since the curves in figures 9 and IQ are based on the work by
Montgomery (1954a), they are directly applicable to an NCFSK system
with a limiter -discriminator demodulator. For the same reasons as
given in the preceding section, they also apply to an NCFSK system with
a dual-filter demodulator, if both the noise power and the noise param¬
eter Y. are measured in a bandwidth equal to the sum of the band- d
widths of the two bandpass filters.
The curves for dual diversity in these figures are based on the
assumption that the receiver with the larger signal output can be selected.
However, unless the fading can always be expected to be very slow, so
that a very narrow filter can be used in the diversity selector, selection
will be on the basis of the larger signal -plus -nois e output. The perfor¬
mance of actual systems based on signal-plus-noise selection is worse
than shown in figures 9 and 10. The estimated degradation is approxi¬
mately 1 dB for element error probabilities of practical interest (Montgomery,
1954b). The curves for dual diversity in these figures are applicable to
NCFSK systems with dual selection-switching diversity, no matter where
the switching takes place, as long as the selection is based on the com¬
parison of the signals at the RF or IF stages of the receivers.
Selection-switching combining is not the only diversity combining
technique. Others are maximal-ratio combining (Kahn, 1954; Brennan,
1955) and equal-gain combining (Altman and Sichak, 1956). There are

also a number of variants of diversity systems, corresponding to possible
combinations of combining techniques,, demodulator types, and location of
combining. Performance is independent of demodulator type, if the
combining is made before the demodulator (in the RF or IF stages of the
receivers), but is dependent on the actual demodulators used if com¬
bining is effected after demodulation.
Maximal-ratio combining diversity is optimum if the combining
can be done before the demodulator. Equal-gain and selection-switching
combining are 0. 6 dB and 1. 5 dB, respectively, worse than optimum
maximal-ratio combining for Rayleigh-fading signal and Gaussian noise
(Altman and Sichak, 1956). A series of studies might suggest that the
performance of predetection equal-gain combining is actually better than
postdetection maximal-ratio combining (Adams and Mindes, 1958;
Brennan, 1959; Locke, I960).
The curves for dual diversity in figures 9 and 10 are based on
the assumption of complete statistical independence of the fading at the
two diversity antennas, which can rarely be achieved. For dual diver¬
sity, however, correlation of the fading does not result in a large loss
if the correlation coefficient is moderate. For example, losses due to
correlation coefficients of 0.4 and 0. 6 are approximately 1 dB and 2 dB,
respectively, for dual diversity maiximal-ratio predemodulation combining
in the presence of Rayleigh-fading and Gaussian noise (Pierce, 1958).
3. 5 Required Signal-to-Noise Ratios for Single-Channel NCFSK Systems
As shown in figures 8 through 10, the required signal-to-noise
ratio for a specific element error probability depends largely on the
noise parameter Vd, except for Rayleigh-fading without diversity at error
probabilities of less than 10 3. The parameter Vd in turn depends large¬
ly on the season, the local time of day, the operating frequency, and the

receiver bandwidth (CCIR, 1964). Signal-to-noise ratio is of primary
importance in determining the lowest useful frequency (LUF). i. e. , in
the lower region of the HF band, where the value of Vd is almost inde¬
pendent of the season and the local time. It is estimated to be around
6 dB for a receiver bandwidth of 200 Hz.
With element error probabilities corresponding to character
error probabilities of 1 percent, 0.1 percent, and 0.01 percent given in
table 4, the values of the required signal-to-noise ratios for a single¬
channel NCFSK system for corresponding character error probabilities
can be read from figures 8 through 10. Table 5 shows the required
signal-to-noise ratios thus obtained for Vd = 6 dB. We suggest that the
values in this table be used for single-channel NCFSK systems over HF
ionospheric paths in the lower region of the HF band.
The value of and thus the required signal-to-noise ratio, is
dependent on the bandwidth. However, a relatively small difference in
the bandwidth results in only a small difference in the required signal-
to-noise ratio. For example, changing the bandwidth from 200 Kz to
170 Hz results in a change in the value of Vd from 6 dB to 5. 5 dB, based
on the conversion diagram for \’d given in CCIR (1964). We can see from
figures 8 through 10 that the difference in required signal-to-noise ratio
caused by this difference does not exceed 1 dB.
When the IF bandwidth is much wider than 200 Hz, the noise
parameter Vd is greater than 6 dB, and, if no low-pass filter is used
between the discriminator and the decision-making circuit, the required
signal-to-noise ratios are also greater than tbu.-e given in table 5. When
a low-pass filter is used, as it generally is in a wideband system, the
required signal-to-noise ratios are expected to be improved to such an
extent that the degradation produced by the greater Vd will be compensated
for, although no analysis has been made of the effectiveness of using a
low-pass filter. Therefore, the use of table 5 is suggested for wideband
systems as well.
\
40

Table 5. Required Signal-to-Noise Ratios for a Single-Channel NCFSK System Over HF Ionospheric Paths in the Lower Region of the HF Band
Teletype¬ writer System
Character Required Signal-to-Noise Ratio (dB)
Error Probability
P (%) c
Stable con- dition
Rayleigh fading Log -normal -fading fading range 13.4 dB
No diversity
Dual diversity
No diversity
Dual diversity
Start-Stop
1 19. 6 27. 5 19.8 23. 2 19. 1
0. 1 25.4 37. 7 26. 7 30. 2 25. 8
0. 01 29. 9 47. 7 32. 6 36. 1 31. 0
Synchronous
1 15. 7 21.7 15.3 18. 7 14. 8
0. 1 22. 5 32.3 23. 2 26. 8 22. 5
0.01 27. ó 42. 3 29. 5 33. 2 28.4
Signal-to-noise ratio is the ratio of signal power to average noise power and is the ratio of median signal power to average noise power for fad¬ ing signals. Average noise power is measured at the input to the limiter in a limiter-discriminator demodulator, in a bandwidth equivalent to the sum of the bandwidths of the two filters in a dual-filter demodulator. The noise parameter , measured in the same bandwidth as in the measurement of noise power, is assumed to be ó dB. Modulation index is assumed to be not less than unity.
41

The uncertainty associated with the value of 6 dB on which
table 5 is based is estimated to be on the order of 1.5 dB, and the un¬
certainty in the required signal-to-noise ratio resulting from the uncer¬
tainty in estimating Vd is estimated not to exceed 2 dB, both in terms
of standard deviation.
The curves in figures 8 through 10, and therefore the values in
table 5, are based on the idealized APD of atmospheric noise. But the
shape of the APD of atmospheric noise is not necessarily the same as
the idealized APD. The uncertainty in the level exceeded by the noise
envelope for a specified percentage of time of interest here, introduced
by possible variations in the shape of the APD, is estimated to be approxi¬
mately 2 dB in terms of standard deviation for = 6 dB. The uncertainty
in the required signal-to-noise ratios resulting from the variations in
the shape of the APD is estimated to be the same, i. e. , 2 dB in terms
of standard deviation.
The values of required signal-to-noise ratios for dual diversity
are based on the analysis for selection-switching combining. As describ¬
ed in the preceding section, possible gain obtainable by using different
diversity techniques is relatively small. Loss of diversity improvement
because of correlated fading is anticipated, but this is also small. There¬
fore, we suggest the use of the values in table 5 for any type of diversity
technique. Uncertainty from this simplification of diversity techniques is
estimated to be 1 dB in terms of standard deviation.
We are concerned with the hourly median values of the signal-to-
noise ratios. Because the log-normal-fading model is better suited
than the Rayleigh-fading model to hourly statistics (CCIR, 1967e), we
propose to adopt as the required signal-to-noise ratios for fading signals
the values corresponding to log-normal fading in the last two columns in
table 5. We can see that the differences in required signal-to-noise ratios
in the different fading models are very small for V = 6 dB when dual d
diversity techniques are used.
42

The values for log-normal fading in table 5 are based on a fading
range of 13.4dB. Dispersion of several dB around this value has been
observed (CCIR, I967e) and the uncertainty in required signal-to-noise
radio for log-normal fading resulting from this dispersion of the fading
range is estimated to be approximately Z dB from our computation results.
In summary, we suggest the use of the values given in the third
column in table 5 as the required signal-to-noise ratios under stable
conditions, and the use of the values given in the last two columns as the
required signal-to-noise ratios under fading conditions. The standard
deviation associated with these suggested values of required signal-to-
noise ratios are estimated to be 3 dB and 4 dB for stable conditions and
fading conditions, respectively.
3. 6 Required Signal-to-Noise-Density Ratios for Some Typical NCFSK Systems
In this section, we derive the required signal-to-noise-density
ratios for some typical NCFSK systems from the required signal-to-
noise ratios determined in the preceding section.
The procedure for deriving the required signal-to-noise-density
ratios, expressed in dB, is quite simple and straightforward for either
a single-channel or a time-division-multiplexed (TDM) NCFSK system.
All we have to do is to add B = 10 log^ b to the required signal-to-noise
ratio expressed in dB, where b is the receiver bandwidth in Hz. The
required signal-to-noise-density ratios for some typical single-channel
and TDM-NCFSK systems over HF ionospheric paths in the lower region
of the HF band thus obtained are given in table 6.
To derive the required signal-to-noise-density ratios for a fre¬
quency-division-multiplexed (FDM) NCFSK system from the required
signal-to-noise ratios is somewhat more complicated. The procedure
consists of: (1) adding B = 10 log1() b, where b is the bandwidth of a
43
«mmiHini

Table 6. Required Signal-to-Noise-Densitv Raf r 0 ., , _ tensity Ratios for Some Typitul Single-Channel and TDM-NCFSK Sv«!. o me Typk' Spheric Paths in the ^
noise power contained in^T-^z bandwiíth^ t0 avera8e
be interpreted as median signal power for ^TctXtnT" Sh°Uld
■pp ■'[¡¿■"f;, ■ JÍ'' : »Ki"j
44

teletypewriter channel; (2) adding N = 10 log^ n, where n is the number
of teletypewriter channels; and (3) adding an appropriate crest factor
{or loading factor), which is related to the ratio of the peak-envelope
power to the average power of the multiplexed signal. Addition of the
crest factor is necessary since we want to express the required signal-
to-noise ratio in terms of the ratio of signal peak envelope power (not
average power) to noise power.
When n tones of equal amplitude are frequency-division-multiplexed,
the average power of the resultant FDM signal is n times that of one
tone, while the peak envelope power is n2 times that of one tone. Since
the peak envelope power is equal to the average power in a tone, the
crest factor is equal to 10 log (na /n) = 10 log n dB in an FDM signal.
When n is relatively small, say 5 or less, this relation should be used.
For greater n, however, the crest factor will be lower than 10
log n dB. As n increases, the APD of the FDM signal approaches that
of Gaussian noise, and the probability that the signal envelope exceeds a
certain level, lower than its theoretical maxirmim, becomes very small.
For example, the levels of rms plus 6. 1 dB and 6. 5 dB are exceeded
1 percent of the time by the envelope of FDM signals of n = 6 and n = 9,
respectively (Slack, 1946), while the level exceeded by the envelope of
Gaussian noise for the same time period is the rms plus 6. 6 dB. The
FDM signal can be peak-clipped at such a level without causing serious
distortion of the waveform or element errors. Styers (1961) analyzed
the effects of multiple tone clipping and showed that, for a 20-tone signal,
no appreciable increase in the binary error probability will be noted for
peak clipping of 6 dB (at the level of 6 dB below the theoretical maximum).
This indicates that the crest factor can be as low as 7 (=10 log 20 - 6) dB
for n = 20. Although Styers' analysis was made for a phase-shift-keyed
(PSK) system, the results are applicable to FSK systems as well.
45

Based on these observations, we shall use the value of 7 dB in the rest
of this report as an estimate of the crest factor of FDM signals for
n = 6 or greater.
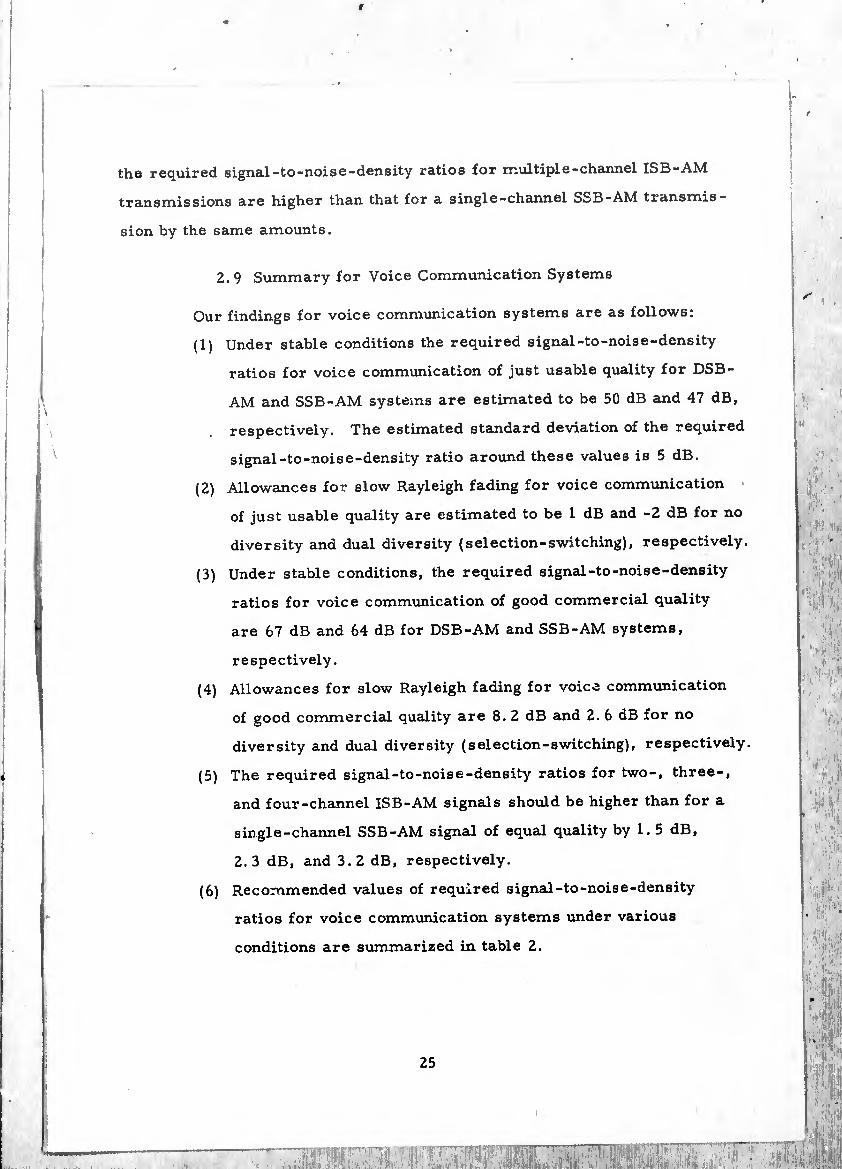
The required signal-to-noise-density ratios for some typical
FDM-NCFSK systems over HF ionospheric paths in the lower region of
the HF band thus obtained are given in table 7. Standard deviations
associated with the values in both tables u and 7 are estimated to be 3 dB
and 4 dB for stable conditions and fading conditions, respectively.
3. 7 Summary for Digital Communication Systems
The results of our study for digital communication systems are
as follows:
(1) The relation between teletypewriter speed and modulation
rate is given in table 3 (sec. 3. 2).
(2) The relation between element error probability and character
error probability is given in table 4 (sec. 3. 2).
(3) Based on Montgomery's (1954a) analysis and the atmospheric-
noise waveform data (CCIR, 1964), the relation between
signal-to-noise ratio and element error probability is calculated
for a steady (nonfading) signal and is shown in figure 8 (sec. 3. 3).
(4) Based on the same analysis and data as above, the same
relations are calculated for a Rayleigh-fading signal and a
log-normal-fading signal, with or without dual diversity, and
are shown in figures 9 and 10, respectively (sec. 3.4).
(5) A value of 6 dB is estimated as typical of the noise parameter
V applicable to the lower portion of the HF band. Based on d
this value, the required signal-to-noise ratios for a single¬
channel NCFSK system are estimated and are given in
table 5 (sec. 3. 5).
46
Table 7. Required Signal-to-Noise-Density Ratios for Some Typical FDM-NCFSK Systems Over HF Ionospheric Paths in the Lower Region of the HF Band
Type of Service Charactei Error
Required Signal-to-Noise- Density Ratio (dB)
Emission desig¬ nation
Description
Proba¬ bility
Pc (%)
Stable
:ondition
Fading condition
No diversity
Dual diversity
3A7J
16-channel FDM-NCFSK 100 w/m/ch; start-stop teletype; limiter-dis- criminator demodulator; 110-Hz bandpass filter in each channel.
1 59 63 59
0. 1 65 70 65
0. 01 69 76 70
3A7J
16-channel FDM-NCFSK 100 w/m/ch; synchro- nous teletype; limiter- discriminator demodu¬ lator; 110-Hz bandpass filter in each channel.
1 55 58 54
0. 1 62 66 62
0. 01 67 73 68
3A7J
12-channel FDM-NCFSK 60 w/m/ch; start-stop teletype; dual-filter de¬ modulator; two 8 5-Hz bandpass filters in each channel.
1 60 63 59
0. 1 66 70 66
0. 01 70 76 71
3A7J
6-channel FDM-NCFSK; dual inband diversity; 60 w/m/ch; start-stop teletype; dual-filter de- modulator; two 85-Hz bandpass filters in each channel.
1 — — 59
0. 1 — --- 66
0. 01 — — 71
Signal-to-noise-density ratio is the ratio of peak envelope power of the siga?« to average noise power contained in a 1-Hz bandwidth where the peak envelope power of the signal should be interpreted as its median value for fading conditions.
■■ - WPIPPUHIP 1,1
47

(6) The use of the values for stable conditions in the third
column in table 5 is recommended, with an estimated
standard deviation of 3 dB.
(7) For fading conditions, the use of the values for log-normal
fading in the last two columns in table 5 is recommended,
with an estimated standard deviation of 4 dB.
(8) The required signal-to-noise-density ratios for some
typical NCFSK systems are given in tables 6 and 7
(sec. 3.6), Standard deviations of 3 dB and 4 dB apply
to these values for stable and fading conditions, respec¬
tively.
48

4. OTHER COMMUNICATION SYSTEMS
4. 1 Composite Voice and Teletypewriter Systems
As typical composite systems, we consider independent-sideband
amplitude-modulation (ISB-AM) systems, transmitting 16 teletypewriter
signals plus one, two, or three voice signals. We assume that the tele¬
typewriter signals are multiplexed co form a 16-channel FDM-NCFSK
signal identical to either the one listed at the top or the one listed
second from the top in table 7 (sec. 3.6).
In these systems, the teletypewriter channels are generally the
essential services, and the quality is assessed or specified in terms of
character error probability in teletypewriter messages. We assume that
the transmitter is loaded in such a way that the values of the peak envelope
power of the multiplexed teletypewriter signals are 80 percent, 60 per¬
cent, and 50 percent of the rated peak envelope power of the transmitter,
and the values of the voice signals are 20 percent, 40 percent, and 50
percent of the rated peak envelope power of the transmitter, when one,
two, and three voice signals, respectively, are transmitted together
with the teletypewriter signals. There is a probability that the values of
the peak envelope power of the composite signals may exceed the rated
values of the peak envelope power of the transmitters, but we assume that
this probability is very small and that the effect of peak limiters on the
error probabilities, which prevent overloading of the transmitters, is neg"
ligible. Then, the required signal-to-noise-density ratios for the com¬
posite systems can be obtained by adding 1. 0 dB, 2. 2 dB, and 5. 0 dB to
those for the 16-channel FDM-NCFSK systems listed first and second in
table 7. The results are given in table 8. Note that, under the as-
* sumption of such transmitter loading, the required signal-to-noise-
density ratio for just usable quality voice transmission is always ex¬
ceeded if a character error probability of 1 percent or less is achieved
in teletypewriter transmission.
49

Table 8. Required Signal-to-Noise-Density Ratios for Some Typical Composite Voice and Teletypewriter Systems Over HF lonospneric Paths in the Lower Region of the HF Band
nr X ype of Service Character
Error Required Signal-to-Noise
Density Ratio (dB)
Emissior desig¬ nation
i
Description
Probability in
T eletype Message pc(%)
Stable
condition
Fading condition
No diversity
Dual diversity
6A9B
16-channel FDM- NCFSK (as listed at the top of table 7)and one voice signal.
1 60 64 60
0. 1 66 71 66
0. 01 70 77 71
9A9B
16-channel FDM- NCFSK (as listed at the top of table 7) and two voice signals.
1 61 65 6l
0. 1 67 72 67
0. 01 71 78 72
12A9B
16-channel FDM- NCFSK (as listed 1 62 66 62
7)and three voice signals. 0. 1 68 73 68
0. 01 72 79 73
50

Table 8. (continued)
6A9B
16-channel FDM- NCFSK (as listed at the second from the top of table 7) and one voice signal.
1 56 59 55
0. 1 63 67 63
0. 01 68 74 69
9A9B
16-channel FDM- NCFSK (as listed at the second from the top of table 7) and two voice signals.
1 57 60 56
0. 1 64 68 64
0. 01 69 75 70
12A9B
16-channel FDM- NCFSK (as listed at the second from the top of table 7) and three voice signals.
1 58 61 57
0. 1 65 69 65
0. 01 70 76 71
Transmitter loadings of 80 #, 60 and 50 # of the rated peak envelope power of the transmitter by teletypewriter signals are assumed for ÒA9B, 9A9B, and 12A9B emissions, respectively. Signal-to-noise- density ratio is the ratio of peak envelope power of the signal to average noise power contained in a 1-Hz bandwidth where the peak envelope pow¬ er of the signal should be interpreted as its median value for fading conditions.

J
The same standard deviations as in the NCFSK systems apply to
these composite systems, i. e. , 3 dB and 4 dB for stable conditions and
fading conditions, respectively.
4. 2 Aural-Reception Radiotelegraphy
Our study has not revealed any evidence suggesting the necessity
of revising the values of required signal-to-noise ratios given by ARPA
(Silva, 1964) for radiotelegraphy with on-off keying (A1 emission) and
aural reception. Based on several test results, ARPA gives values of
-2 dB and 6 dB as the required ratios of signal power to noise power in
a 6-kHz bandwidth for stable conditions and fading conditions^respectively.
These values correspond to values of 36 dB and 44 dB in terms of re¬
quired signal-to-noise-density ratios.
4.3 Phototelegraphy (Facsimile)
No evidence has been found that might suggest the necessity of
revising the values of required signal-to-noise ratios for A4 phototele¬
graphy (facsimile) given by CCIR (1967b, c) and adopted by ARPA (Silva,
1964), which gives values of 12 dB and 21 dB as the required ratios of
signal power to noise power in a 6-kHz bandwidth for stable conditions
and fading conditions^respectively. These values correspond to values
of 50 dB and 59 dB in terms of required signal-to-noise-density ratios.
52

5. SUMMARY AND CONCLUSIONS
Required signal-to-noise ratios for various HF communication
systems have been estimated. The study was begun with emphasis on
an extensive literature search, rather than original work in analyzing
system performances.
A main difficulty encountered in the study of voice communication
systems was created by the wide disparity among published data. The
results given in this report represent an averaging of these data, with
an indication given of the estimated standard deviation.
Another difficulty was encountered in the study of digital com¬
munication systems. Despite the tremendous number of published
analyses of the performance of various digital communication systems,
very little useful information applicable to the present study could be
found. Surprisingly, certain aspects of the performance of an NCFSK
system in the presence of atmospheric noise had to be evaluated in the
course of the study.
For convenience of application, the results are given in terms of
signal-to-noise-density ratios rather than signal-to-noise ratios.
They are as follows:
(1) Required signal-to-noise-density ratios for voice communi¬
cation of just usable quality are estimated by averaging the
data from various sources. They are given in table 2,
section 2. 9. The standard deviation associated with those
values is estimated to be 5 dB.
(2) Retention of the values of required signal-to-noise ratios,
given by CCIR (1967 b, c) and adopted by ARPA (Silva, 1964),
is recommended for voice communication of good commercial
quality. The values, converted to required signal-to-noise-
density ratios, are given in table 2, section 2. 9.
53

(3) Required signed-to-noise-density ratios for NCFSK systems
transmitting teletypewriter signals are estimated on the
basis of the CCIR noise data (CCIR, 1964) and of the log¬
normal-fading model for fading conditions (CCIR, 1967e).
The results are given in table 6 for single-channel and
TDM-NCFSK systems and in table 7 for FDM-NCFSK sys¬
tems, section 3.6. The standard deviations associated
with those values are estimated to be 3 dB and 4 dB for
stable conditions and fading conditions, respectively,
(4) Estimated required signal-to-noise-density ratios for com¬
posite voice and teletypewriter systems are given in table 8,
section 4.1. The estimated standard deviations associated
with these values are 3 dB and 4 dB for stable and fading
conditions, respectively.
(5) Retention of the values of required signal-to-noise ratios,
given by ARPA (Silva, 1964), is recommended for Al~
emission, aural-reception radiotelegraphy. Required
signal-to-noise-density ratios are 36 dB and 44 dB
under stable and fading conditions, respectively.
(6) Retention of the values of required signal-to-noise ratios,
given by CCIR (1967b, c) and adopted by ARPA (Silva, 1964),
is recommended for A4 phototelegraphy (facsimile). Re¬
quired signal-to-noise-density ratios are 50 dB and 59 dB
under stable conditions and fading conditions, respectively.
54

6. ACKNOWLEDGMENTS
We are indebted to G. G. Gilbert, L. C. Kelly, A. A. Silva,
and M. G. Stiles of the U. S. Army Strategic Communications Command
(STRATCOM) for their cooperation in supplying information on the
practical telecommunication procedures, and A. F. Barghausen,
T. de Haas, M. Nesenbergs, L. D. Schultz, and A. D. Spaulding of the
Institute for Telecommunication Sciences, ESSA Research Laboratories,
for their helpful discussions. We are also grateful to A. F. Barghausen
for his coordination of the project and his encouragement during the study.
55

7. REFERENCES
Adams, R. T. , and B. M. Mindes (1958), Evaluation of IF and baseband diversity combining receivers, IRE Trans. Commun. Systems CS-o, 8-13.
Akima, Hiroshi (1967), Speeding-up of HE radiotransmissions and broad¬ casts (World Weather Watch Study T. 21), ESSA Tech. Rept. 1ER 34-ITSA 34 (available from Clearinghouse for Federal Scientific and Technical Information, Springfield, Va. 22151).
Altman, Frederick!., and William Sichak (1956), A simplified diversity communication system for beyond-the-horizon links, IRE Trans. Commun. Systems CS-4, 50-55.
Barsis, A. P. , K. A. Norton, P. L. Rice, and P. H. Elder (1961), Performance predictions for single tropospheric communication links and several links in tandem, NBS Tech. Note 102 (U. S. G.wernment Printing Office, Washington, D. C.).
Bello, P. A., and B. D. Nelin (1962), The influence of fading spectrum on the binary error probabilities of incoherent and differentially coherent matched filter receivers, IRE Trans. Commun. Systems CS-10, 160-168.
Bello, P. A. , and B. D. Nelin (1963), The effect of frequency selective fading on the binary error probabilities of incoherent and differ¬ entially coherent matched filter receivers, IEEE Trans. Commun. Systems CS-11, 170-186.
Bello, P. A., and B. D. Nelin (1964), Optimization of subchannel data rate in FDM-SSB transmission over selectively fading media, IEEE Trans. Commun. Systems CS-12, 46-53.
Beranek, Leo L, (1947), The design of speech communication systems, Proc. IRE 35, 880-890.
Brennan, D. G. (1955), On the maximum signal-to-noise ratio realizable from several noisy signals, Proc. IRE (Correspondence) 43, 1530.
Brennan, D. G. (1959), Linear diversity combining techniques, Proc. IRE 47, 1075-1102.

CCIR (International Radio Consultative Committee) (1964/, \\ orld distr_ bution and characteristics of atmospheric radio noise, Report 322, CCIR Green Book, published as a separate volume, International Telecommunication Union (ITU),Geneva, Switzerland.
CCIR (1967a), Power of radio transmitters, Recommendation 326-1, CCIR Green Book I_, 14-2^, ITU.
CCIR (1967b), Bandwidths and signal-to-noise ratios in complete systems, Recommendation 339-1, CCIR Green Book III, 28-30, ITU.
CCIR (1967c), Fading allowances for the various classes of emission, Recommendation 340, CCIR Green Book III, 31-33, ITU.
CCIR (I967d), Bandwidths and signal-to-noise ratios in complete systems---Prediction of the performance of telegraph systems in terms of bandwidth and signal-to-noise ratio, Report 195,
CCIR Green Book III, 86-93, ITU.
CCIR (I967e), Fading of signals propagated by the ionospnere, Report 266-1, CCIR Green Book H, 325-336, ITU.
CCIR (1967Í), Use of diversity on international HF radiotelephone circuits, Report 355, CCIR Green Book III, 14^>-145, ITU.
CCITT (International Telegraph and Telephone Consultative Committee) (1966), Definitions for data transmission, CCITT Blue Book VIH,
7-29, ITU.
Craiglow, R. L, , N. R. Getzin, and R. A. Swanson ( 1961), Power requirements for speech communication systems, IRE Trans.
Audio AU-9, 186-190.
Crichlow, W. Q. , C„ J. Roubique, A. D. Spaulding, and W. M. Beery (I960), Determination of the amplitude-probability distribution of atmospheric radio noise from statistical moments, J. Res.
MBS 64D, 49-56.
Cunningham, W. J. , S. J. Goffard, and J. C. R. Ucklider ( 1947), The influence of amplitude limiting and frequency selectivity upon the performance of radio receivers in noise, Proc. IRE 35, 1021-1025.
57

Daspit, J. I., and R. L. Henderson (1968), DIDS intelligibility study: Effects of atmospheric noise, SDC Tech, Memo. TM-L-2550/ 025/00, Systems Development Corporation, Santa Monica,
Calif.
Egan, J. P. (1944), Articulation testing methods II, Kept. 3802, Office of Scientific Research and Development (available from the Clearinghouse for Federal Scientific and Technical Information, Springfield, Va. 22151, Rept. PB 22848).
Ewing, G. D., andN. W. Huddy, Jr. (1966), RF clipping and filtering to improve the intelligibility of speech in noise, IEEE Trans. Audio Electroacoustics AU-14 , 184-186.
Fairbanks, Grant (1958), Test of phonemic differentiation: The rhyme test, J. Acoust. Soc. Am. 30, 596-600.
Fletcher, H. (1953), Speech and Hearing in Communication, ch. 1 5 in particular^D. van Nostrand Co. , New York, N.Y.).
French, N. R. , and J. C. Steinberg (1947), Factors governing the in¬ telligibility of speech sounds, J. Acoust. Soc. Am. 1_9, 90-119.
Griffiths, John D. (1968), Optimum linear filter for speech transmission,
J. Acoust. Soc. Am. 43, 81-86.
Hirsh, I. J., Elizabeth G. Reynolds, and Maurice Joseph (1954), Intelligibility of different speech materials, J. Acoust. Soc.
Am. 26^, 530-538.
House, Arthurs., Carl E. Williams, Michael H. L. Hecker, and K. D. Kryter (1965), Articulation-testing methods: Consonantal differentiation with a closed-response set, J. Acoust. Soc. Am.
37 , 158-166.
Kahn, Leonard R. (1954), Ratio squarer, Proc. IRE (Correspondence)
42, 1704.
Kryter, Karl D. (1962a), Methods for the calculation and use of the articulation index, J. Acoust. Soc. Am. 3_4, 1689-1697.
Kryter, Karl D. (1962b), Validation of the articulation index, J. Acoust.
Soc. Am. 34, 1698-1702.
58

Kryter, K. D., J. C. R. Licklider, and S. S. Stevens (1947), Premodulätion clipping in AM voice communication, J. Acoust,
Soc, Am. 19, 125-131.
Licklider, J. C. R. (1946), Effects of amplitude distortion upon the intelligibility of speech, J. Acoust. Soc. Am. JL8, 429-434.
Licklider, J. C. R., and S. J. Goffard (1947), Effects of impulsive interference upon A-M voice communication, J. Acoust. Soc.
Am. ^9, 653-663.
Licklider, J. C. R. , and Irwin Pollack (1948), Effects of differentiation, integration, and infinite peak clipping upon the intelligibility of speech, J. Acoust. Soc. Am. 20, 42-51.
Locke, Richard V. , Jr. (I960), Experimental comparison of equal-gain and maximal-ratio diversity combiners, Proc. IRE (Correspon¬ dence) 48, 1488-1489.
Montgomery, G. Franklin (1954a), A comparison of amplitude and angle modulation for narrow-band communication of binary-coded messages in fluctuation noise, Proc. IRE 42, 447-454.
Montgomery, G. Franklin (1954b), Message error in diversity frequency shift reception, Proc. IRE 42, 1184-1187.
Morrow, Jr., W. E., C. L. Mack, Jr., B. E. Nichols, and J. Leonhard (1956), Single-sideband techniques in UHF long- range communications, Proc. IRE 44, 1854-1873.
Pierce, John N. (1958), Theoretical diversity improvement in frequency
shift keying, Proc. IRE 46, 903-910.
Pollack, Irwin, and J. M. Pickett (1959), Intelligibility of peak-clipped speech at high noise levels, J. Acoust. Soc. Am. 31_, 14-J6.
Silva, Alvaro A. (1964), Type of service gains (relative signal-to-noise requirements) for radio communication services in the HF band, Tech. Rept. No. 4, U. S. Army Radio Propagation Agency
Fort Monmouth, N. J. 07703.
Slack, Margaret (1946), The probability distributions of sinusoidal oscillations combined in random phase, J. Inst. Elec. Engrs.
(London) 93, pt. Ill, 76-86.
59

Spaulding, A. D., C, J, Roubique, and W. Q. Crichlow (1962b Conversion of the amplitude-probability distribution function
for atmospheric radio noise from one bandwidth to another, J. Res. NBS 66D, 713-720.
Stuckey, Charles W. (1963), Investigation of the precision of an
articulation-testing program, J. Acoust. Soc. Am. 35, 1782-1787.
Styers, C. James (1961), Analysis of multiple tone clipping, 1961 IRE International Conv. Record, part 8, 134-149.
Watt, A. D. , R. M. Coon, E. L. Maxwell, and R. W. Plush (1958), Performance of some radio systems in the presence of thermal and atmospheric noise, Proc. IRE 46, 1914-1923.
White, H. E. (1966), Atmospheric-noise FSK error probabilities for an envelope-detection receiver, IEEE Trans. Commun. Technol. COM-14, 188-189.
60 G PO 854 • 540