Embed Size (px)
Citation preview
Technology Transfer E PA162514-89lO22
Seminar Publication
Requirements for Hazardous Waste Landfill Design, Construction, and Closure
August 1989
Center for Environmental Research Information Office of Research and Development U.S. Environmental Protectin Agency Cincinnati, OH 45268
NOTICE
The information in this document has been funded wholly or in part by the United States Environmental Protection Agency under Contract 68-C8-0011 to Eastern Research Group, Inc. It has been subject to the Agency's peer and administrative review, and it has been approved for publication as a n EPA document. Mention of t r ade names or commercial products does not constitute endorsement or recommendation for use.
CONTENTS
Page
Preface . . . . . . . . . . . . . . . . . . . . . . . . . . . . . . . . . . . . . . . . . . . . . . . . . . . . . . . . vi
Regulations for Hazardous Waste Landfills . . . . . . . . . . . . . . . . . . . . . . 1
Leak Detection Systems . . . . . . . . . . . . . . . . . . . . . . . . . . . . . . . . . . . . . 6
Construction Quality Assurance . . . . . . . . . . . . . . . . . . . . . . . . . . . . . . . . . 9 Summary of Minimum Technology Requirements . . . . . . . . . . . . . . . . . . . . . . 10
1. Overview of Minimum Technology Guidance and
. . . . . . . . . . . . . . . . . . . . . . . . . . . . . . . . . . . . . . . Double Liners and Leachate Collection an
Removal Systems . . . . . . . . . . . . . . . . . . . . . . . . . . . . . . . . . . .
Closure and Final Cover . . . . . . . . . . . . . . . . . . . . . . . . . . . . . . 9
. . . . . . . . . . . . 10 References . . . . . . . . . . . . . . . . . . . . . . . . . . . .
2. Liner Design: Clay Liners . . . . . . . . . . . . . . . . . . . . . . . . . . . . . . . . . . . . . . 11 Introduction . . . . . . . . . . . . . . . . . . . . . . . . . . . . . . . . . . . . . . . . . Materials . . . . . . . . . . . . . . . . . . . . . . . . . . . .
Attack by Waste Leachate . . . . . . . . . . . . . . . . . . . . . . . . . . . . . . . . . . . . . 24 References . . . . . . . . . . . . . . . . . . . . . . . . . . . . . . . . . . . . . . . . . . . . . 26
3. Flexible Membrane Liners . . . . . . . . . . . . . . . . . . . . . . . . . . . . . . . 27 . . . . . . . . . . . . . . . . . . . . . . . . . . . . . . . . . . . . . . . . . 27
. . . . . . . . . . . . . . . . . . . . . .
. . . . . . . . . . . . . . . . . . .
Gas Collector and Removal Systems . . . . . . . . . . . . . . . . . . . . . . . . . . . . . . . . . . . . . . . . . . . . . . . . 70
. . . . . . . . . . . . . . . . . . 75 . . . . . . . . . . . . . . . . . . . . . . . . . . . . . . . . . . . . . . . . . . . . e Caps . . . . . . . . . . . . . . . . . . . . . . . . . . . . . . . . . . . 75
. . . . . . . . . 75 . . . . . . . . . . . . . . . . . . . . . . 76
. . . . . . . . . . . . . . . . . . . . . . . 78 . . . . . . . . . . . . . . . . . . . . . . . .
... 111
6 . Construction. Quality Assurance. and Control: Construction of Clay Liners . . . . . . . . . . . . . . . . . . . . . . . . . . . . . . . . . . . . . . . . . . . . 89
Introduction . . . . . . . . . . . . . . . . . . . . . . . . . . . . . . . . . . . . . . . . . . . . . . . . . . . . . . . . 89 CompactionVariables . . . . . . . . . . . . . . . . . . . . . . . . . . . . . . . . . . . . . . . . . . . . . . . 89 The Construction Process . . . . . . . . . . . . . . . . . . . . . . . . . . . . . . . . . . . . . . . . . . . . 94 Construction Quality Assurance (CQA) Testing . . . . . . . . . . . . . . . . . . . . . . . . 95 Test Fills . . . . . . . . . . . . . . . . . . . . . . . . . . . . . . . . . . . . . . . . . . . . . . . . . . . . . . . . . . . 96
7 . Construction of Flexible Membrane Liners . . . . . . . . . . . . . . . . . . . . . . . . . . . . . . 99 Introduction . . . . . . . . . . . . . . . . . . . . . . . . . . . . . . . . . . . . . . . . . . . . . . . . . . . . . 99 Responsibility and Aut rity . . . . . . . . . . . . . . . . . . . . . . . . . . . . . . . . . . . . . . . . 99 CQA Personnel Qualifications . . . . . . . . . . . . . . . . . . . . . . . . . . . . . . . . . . . . . . 100 Inspection Activities . . . . . . . . . . . . . . . . . . . . . . . . . . . . . . . . . . . . . . . . . . . . . . . 100 Sampling Strategies . . . . . . . . . . . . . . . . . . . . . . . . . . . . . . . . . . . . . . . . . . . . . . . 101 Documentation . . . . . . . . . . . . . . . . . . . . . . . . . . . . . . . . . . . . . . . . . . . . . . . . . . . . 103
8 . Liner Compatibility with Wastes . . . . . . . . . . . . . . . . . . . . . . . . . . . . . . . . . . . . . . 109 Introduction . . . . . . . . . . . . . . . . . . . . . . . . . . . . . . . . . . . . . . . 109 Exposure Chamber . . . . . . . . . . . . . . . . . . . . . . . . . . . . . . . . . . . . . . . . . . . . . 109 Representative Leachate . . . . . . . . . . . . . . . . . . . . . . . . . . . . . . . . . . . . . . . . . . . 110 Compatibility Testing of Components . . . . . . . . . . . . . . . . . . . . . . . . . . . . . . . . 110 Blanket Approvals . . . . . . . . . . . . . . . . . . . . . . . . . . . . . . . . . . . . . . . . . . . . . . . . . 111 Interpreting Data . . . . . . . . . . . . . . . . . . . . . . . . . . . . . . . . . . . . . . . . . . . . . . . . . . 111
9 . Long-Term Con ns: Problem Areas and Unknowns . . . . . . . . . . . . . . 113 Introduction . . . . . . . . . . . . . . . . . . . . . . . . . . . . . . . . . . . . . . . . . . . . . . . 113 Flexible Membrane Liners . . . . . . . . . . . . . . . . . . . . . . . . . . . . . . . . . . . . . . . . . . 113 Clay Liners . . . . . . . . . . . . . . . . . . . . . . . . . . . . . . . . . . . . . . . . . . . . . . . . . . . . . . . 118 Leachate Collection and Removal Systems . . . . . . . . . . . . . . . . . . . . . . . . . . . 118 Cap/Closure Systems . . . . . . . . . . . . . . . . . . . . . . . . . . . . . . . . . . . . . . . . . . . . . . . 119
Action Leakage Rate (ALR) . . . . . . . . . . . . . . . . . . . . . . . . . . . . . . . . . . . . . . . . . 121 Rapid and Large Leakage (RLL) Response Action Plans (RAPS) . . . . . . . . . . . . . . . . . . . . . . . . . . . . . . . . . . . . . . 124 Preparing and Submitting the RAP . . . . . . . . . . . . . . . . . . . . . . . . . . . . . . . . . . 124 Summary . . . . . . . . . . . . . . . . . . . . . . . . . . . . . . . . . . . . . . . . . . . . . . . . . . . . . . . . . 125
List of Abbreviations . . . . . . . . . . . . . . . . . . . . . . . . . . . . . . . . . . . . . . . . . . . . . . . . . 127
. . . . . . . . . . . .
. . . . . . . . . . . . . . . . . . . . . . . . . . . . . . . . . . . . . . . . . . . 10 Leak Response Action Plans 121 Background . . . . . . . . . . . . . . . . . . . . . . . . . . . . . . . . . . . . . . . . . . . . . . . . . . . . . . . 121
122 . . . . . . . . . . . . . . . . . . . . . . . . . . . . . . . . . . . . .
iv
ACKNOWLEDGEMENTS
This semina r publication is based wholly on presentations made a t the U.S. Environmental Protect ion Agency (EPA) Technology T r a n s f e r s e m i n a r s on Requirements for Hazardous Waste Landfill Design, Construction, and Closure. These seminars were held from June 20 to September 16, 1988 in San Francisco, California; Seattle, Washington; Dallas, Texas; Chicago, Illinois; Denver, Colorado; Kansas City, Missouri; Philadelphia, Pennsylvania; Atlanta, Georgia; New York, New York; and Boston, Massachusetts. The presenters were:
Sarah A. Hokanson, the Earth Technology Corporation, Alexandria, Virginia (Chapters 1 and 10)
Dr. David Daniel, University of Texas, Austin, Texas (Chapters 2 and 6)
Dr. Gregory N. Richardson, Soil & Materials Engineers, Inc., Raleigh, North Carolina (Chapters 3,5, and 7).
Dr. Robert M. Koerner, Drexel University, Geosynthetic Research Institute, Philadelphia, Pennsylvania (Chapters 4 and 9).
Robert Landreth, U.S. Environmental Protection Agency, Risk Reduction Engineering Laboratory, Cincinnati, Ohio (Chapter 8)
Susan Edwards, Linda Saunders, and Heidi Schultz of Eastern Research Group, Inc., Arlington, Massachusetts, prepared the text of this document based on the speakers' transcripts and slides. Orville Macomber (EPA Center for Environmental Research Information, Cincinnati, Ohio) provided substantive guidance and review.
V
PREFACE
The U.S. Environmental Protection Agency's (EPA's) minimum technological require- ments for hazardous waste landfill design were set forth by Congress in the 1984 Hazard- ous and Solid Waste Amendments (HSWA). HSWA covered requirements for landfill lin- ers and leachate collection and removal systems, as well as leak detection systems for landfills, surface impoundments, and waste piles. In response to HSWA and other Con- gressional mandates, EPA has issued proposed regulations and guidance on the design of these systems, and on construction quality assurance, final cover, and response action plans for responding to landfill leaks.
This seminar publication outlines in detail the provisions of the minimum technology guidance and proposed regulations, and offers practical and detailed information on the construction of hazardous waste facilities that comply with these requirements. Chapter One presents a broad overview of the minimum technology guidance and regulations. Chapter Two describes the use of clay liners in hazardous waste landfills, including the selection and testing of materials for the clay component of double liner systems. Chap- ter Three discusses material and design considerations for flexible membrane liners, and the impact of the proposed regulations on these considerations. Chapter Four presents an overview of the three parts of a liquid management system, including the leachate collec- tion and removal system; the secondary leak detection, collection, and removal system; and the surface water collection system. Chapter Five describes the elements of a closure system for a completed landfill, including flexible membrane caps, surface water collec- tion and removal systems, gas control layers, biotic barriers, and vegetative top covers. Chapters Six and Seven discuss the construction, quality assurance, and control criteria for clay liners and flexible membrane liners, respectively. Chapter Eight discusses the chemical compatibility of geosynthetic and natural liner materials with waste leachates. Chapter Nine presents an overview of long-term considerations regarding hazardous waste landfills, surface impoundments, and waste piles, including flexible membrane and clay liner durability, potential problems in liquid management systems, and aesthet- ic concerns. Chapter Ten reviews proposed requirements for response action plans for leaks in hazardous waste landfills.
This publication is not a design manual nor does it include all of the latest knowledge concerning hazardous waste landfill design and construction; additional sources should ,be consulted for more detailed information. Some of these useful sources can be located in the reference sections at the end of several chapters. In addition, State and local authori- ties should be contacted for regulations and good management practices applicable to lo- cal areas.
vi
1. OVERVIEW OF MINIMUM TECHNOLOGY GUIDANCE AND REGULATIONS FOR HAZARDOUS WASTE LANDFILLS
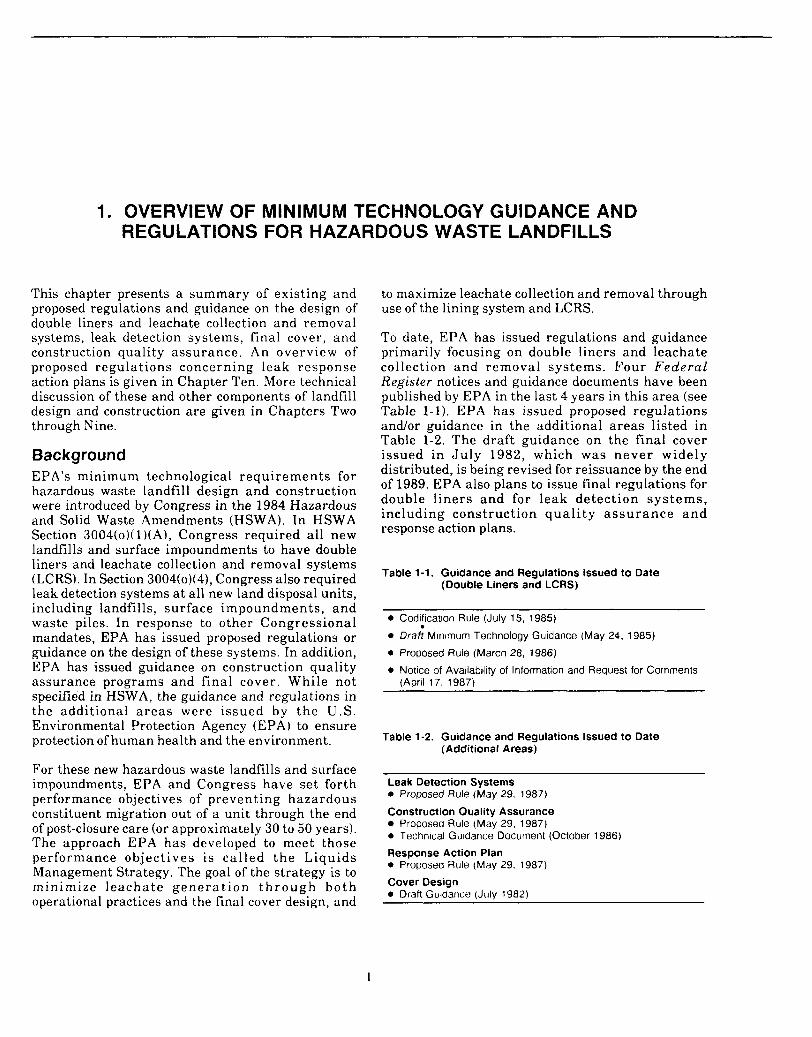
This chapter presents a summary of existing and proposed regulations and guidance on the design of double liners and leachate collection and removal systems, leak detection systems, final cover, and construction quality assurance. An overview of proposed regulat ions concerning leak response action plans is given in Chapter Ten. More technical discussion of these and other components of landfill design and construction are given in Chapters Two through Y' L me.
Background EPA's minimum technological requi rements for hazardous waste landfill design and construction were introduced by Congress in the 1984 Hazardous and Solid Waste Amendments (HSWA). In HSWA Section 3004(0)( 1 )(A), Congress required al l new landfills and surface impoundments to have double liners and leachate collection and removal systems (LCRS). In Section 3004(0)(4), Congress also required leak detection systems at all new land disposal units, including landfills, surface impoundments, a n d waste piles. In response to other Congressional mandates, EPA has issued proposed regulations or guidance on the design of these systems. In addition, EPA has issued guidance on construction quali ty assurance programs and final cover. While not specified in HSWA, the guidance and regulations in the additional a r e a s were issued bv t h e U.S.
to maximize leachate collection and removal through use of the lining system and LCRS.
To date, EPA has issued regulations and guidance primarily focusing on double liners and leachate collection and removal systems. Four Federal Register notices and guidance documents have been published by EPA in the last 4 years in this area (see Table 1-1). EPA has issued proposed regulations and/or guidance in the additional areas listed in Table 1-2. The draft guidance on the final cover issued in J u l y 1982, which was neve r widely distributed, is being revised for reissuance by the end of 1989. EPA also plans to issue final regulations for double l iners and for leak detect ion sys t ems , including construct ion q u a l i t y a s s u r a n c e a n d response action plans.
Table 1-1. Guidance and Regulations Issued to Date (Double Liners and LCRS)
0 Codification Rule (July 15, 1985)
0 Draft Minimum Technology Guidance (May 24, 1985)
0 Proposed Rule (March 28, 1986)
0 Notice of Availability of Information and Request for Comments (April 17, 1987)
Environmental Protection Agency (EPA) to ensure protection of human health and the environment. Table 1-2. Guidance and Regulations Issued to Date
(Additional Areas)
For these new hazardous waste landfills and surface impoundments, EPA and Congress have set forth performance objectives of preventing hazardous constituent migration out of a unit through the end of post-closure care (or approximately 30 to 50 years). The approach EPA has developed to meet those performance object ives is cal led t h e Liquids Management Strategy. The goal of the strategy is to minimize l eacha te g e n e r a t i o n t h r o u g h both operational practices and the final cover design, and
Leak Detection Systems 0 Proposed Rule (May 29, 1987)
Construction Quality Assurance Proposed Rule (May 29. 1987)
0 Technical Guidance Document (October 1986)
Response Action Plan 0 Proposed Rule (May 29. 1987)
Cover Design 0 Draft Guidance (July 1982)
I
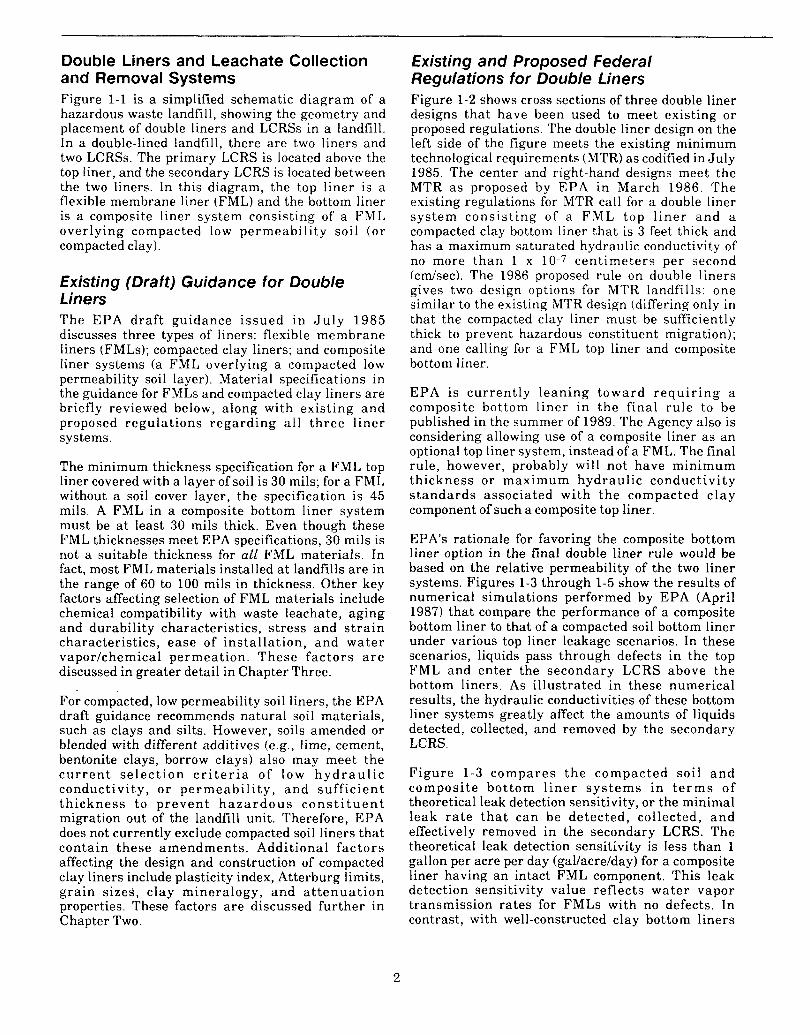
Double Liners and Leachate Collection and Removal Systems Figure 1-1 is a simplified schematic diagram of a hazardous waste landfill, showing the geometry and placement of double liners and LCRSs in a landfill. In a double-lined landfill, there are two liners and two LCRSs. The primary LCRS is located above the top liner, and the secondary LCRS is located between the two liners. In this diagram, the top liner is a flexible membrane liner (FML) and the bottom liner is a composite liner system consisting of a FML overlying compacted low permeabi l i ty soil (or compacted clay).
Existing (Draft) Guidance for Double Liners The EPA draf t guidance i ssued in J u l y 1985 discusses three types of liners: flexible membrane liners (FMLs); compacted clay liners; and composite liner systems (a FML overlying a compacted low permeability soil layer). Material specifications in the guidance for FMLs and compacted clay liners are briefly reviewed below, along with existing and proposed regulat ions regard ing a l l t h ree l iner systems.
The minimum thickness specification for a FML top liner covered with a layer of soil is 30 mils; for a FML without a soil cover layer, the specification is 45 mils. A FML in a composite bottom liner system must be at least 30 mils thick. Even though these FML thicknesses meet EPA specifications, 30 mils is not a suitable thickness for all FML materials. In fact, most FML materials installed at landfills are in the range of 60 to 100 mils in thickness. Other key factors affecting selection of FML materials include chemical compatibility with waste leachate, aging and durability characteristics, stress and s t r a in characteristics, ease of instal la t ion, and water vaporlchemical permeat ion. These f ac to r s a r e discussed in greater detail in Chapter Three.
For compacted, low permeability soil liners, the EPA draft guidance recommends natural soil materials, such as clays and silts. However, soils amended or blended with different additives (e.g., lime, cement, bentonite clays, borrow clays) also may meet the c u r r e n t s e l ec t ion c r i t e r i a of low h y d r a u l i c conduct ivi ty , o r pe rmeab i l i t y , and suff ic ient th ickness to p reven t h a z a r d o u s c o n s t i t u e n t migration out of the landfill unit. Therefore, EPA does not currently exclude compacted soil liners that contain these amendments , Additional fac tors affecting the design and construction of compacted clay liners include plasticity index, Atterburg limits, grain sizes, clay mineralogy, and a t t enua t ion properties. These factors a re discussed fur ther in Chapter Two.
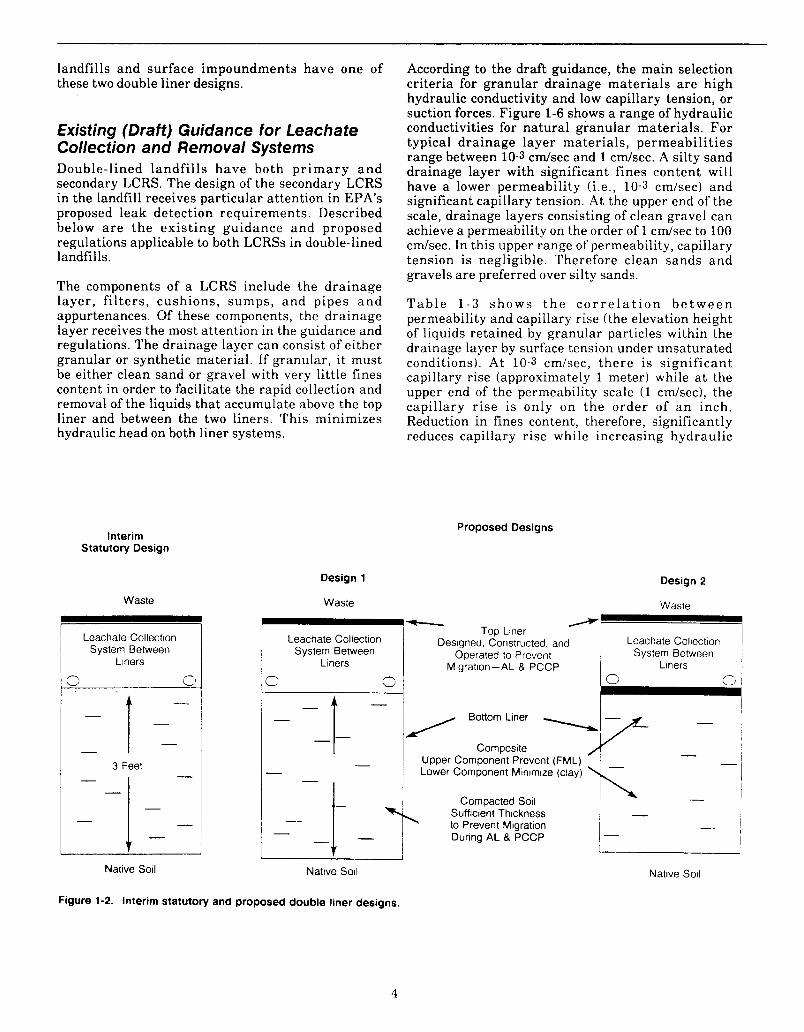
Existing and Proposed Federal Regulations for Double Liners Figure 1-2 shows cross sections of three double liner designs tha t have been used to meet existing or proposed regulations. The double liner design on the left side of the figure meets the existing minimum technological requirements (MTR) as codified in July 1985. The center and right-hand designs meet the MTR as proposed by EPA in March 1986. The existing regulations for MTR call for a double liner system cons is t ing of a FML top l i ne r and a compacted clay bottom liner that is 3 feet thick and has a maximum saturated hydraulic conductivity of no more t h a n 1 x 10⁻⁷ cent imeters per second (cdsec) . The 1986 proposed rule on double liners gives two design options for MTR landfills: one similar to the existing MTR design (differing only in that the compacted clay liner must be sufficiently thick to prevent hazardous constituent migration); and one calling for a FML top liner and composite bottom liner.
EPA is cur ren t ly lean ing toward r e q u i r i n g a composite bottom l iner in the f inal ru le to be published in the summer of 1989. The Agency also is considering allowing use of a composite liner as a n optional top liner system, instead of a FML. The final rule, however, probably will not have minimum thickness o r maximum hydraul ic conduct ivi ty s t anda rds associated with the compacted c lay component of such a composite top liner.
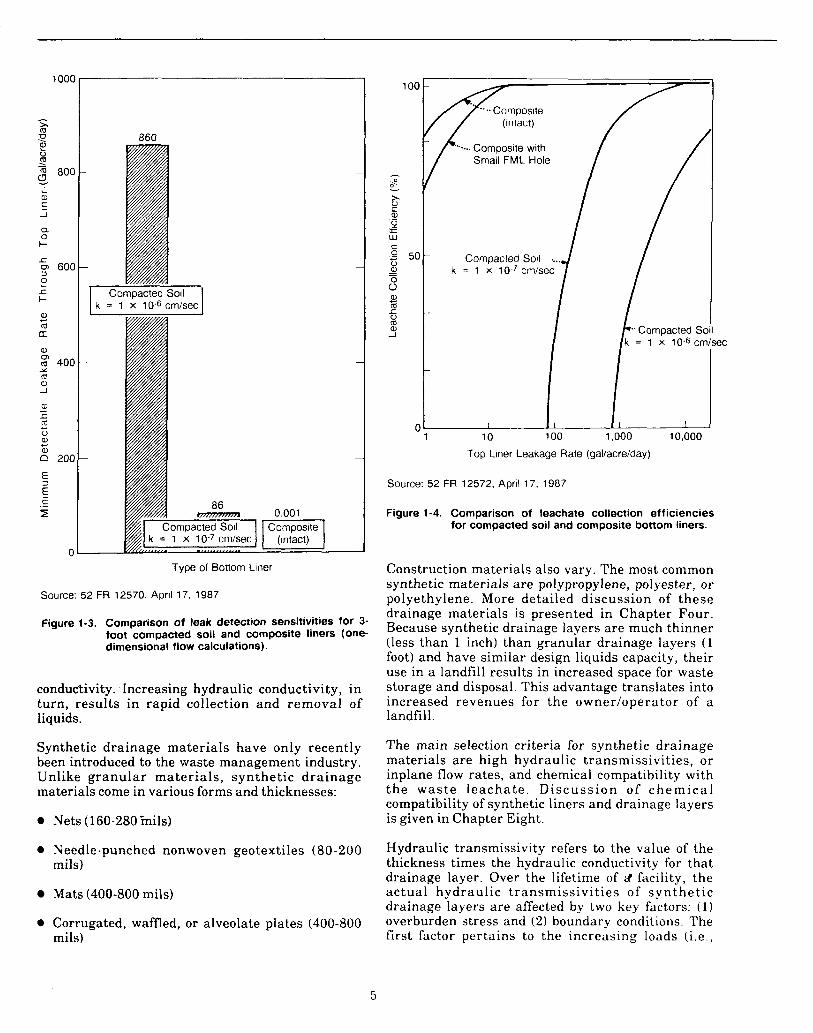
EPA’s rationale for favoring the composite bottom liner option in the final double liner rule would be based on the relative permeability of the two liner systems. Figures 1-3 through 1-5 show the results of numerical simulations performed by EPA (April 1987) that compare the performance of a composite bottom liner to that of a compacted soil bottom liner under various top liner leakage scenarios. In these scenarios, liquids pass through defects in the top FML and enter the secondary LCRS above the bottom liners. As i l lustrated in these numerical results, the hydraulic conductivities of these bottom liner systems greatly affect the amounts of liquids detected, collected, and removed by the secondary LCRS.
F igure 1-3 compares t h e compacted soi l a n d composi te bot tom l ine r s y s t e m s in t e r m s of theoretical leak detection sensitivity, or the minimal leak r a t e t h a t can be detected, collected, a n d effectively removed in the secondary LCRS. The theoretical leak detection sensitivity is less than 1 gallon per acre per day (gallacrelday) for a composite liner having an intact FML component. This leak detection sensitivity value reflects water vapor transmission rates for FMLs with no defects. In contrast, with well-constructed clay bottom liners
2
Double Liners and Leachate Collection System
Components
Protective Soil or Cover (Optional) r Top Liner (FML)
Drainage Material 0 0 Drainaqe Bottom
Composite Liner
Upper Component Leachate Detection, ( F W Collection, and Lower Component Removal System (LDCRS (compacted soil)
Leachate Collectiori and Removal System
Native Soil Foundation
Source: EMCON, 1988
Figure 1-1. Schematic of a double liner and leachate collection system for a landfill.
(10-7 cmlsec permeability), l iquids en ter ing the secondary LCRS may go undetected and migrate into the bottom liner until the leak rates approach 100 gallacrelday. With a s l ight ly more permeable compacted clay bottom l iner with 10-6 cmlsec permeability, the secondary LCRS may not detect, collect, or remove the liquid flowing from a leak in the top liner until leak rates are very serious (on the order of 1,000 gallacrelday).
Figure 1-4 compares theoretical leachate collection efficiencies for landfil ls having compacted soil bottom liners with those having composite bottom liners. Leachate collection efficiency is the amount of liquid collected and removed in the secondary leachate collection system divided by the total amount entering into the secondary LCRS through a breach in the top liner. For low leakage rates, the leachate collection efficiency of a landfill with a composite bottom liner system, even a composite system with tears or small defects in the FML, is very high (above 95 percent for leak rates in the range of 1 to 10 gallacrelday). In comparison, landfills with compacted clay bottom liners have 0 percent leachate collection efficiency for low leak rates, and only 50 percent efficiency for leak rates of approximately 100 gallacrelday. These resu l t s demonstrate that leachate collection eficiency of the secondary LCRS improves significantly simply by
\
Leachate Collection System Sump (Monitoring Compliance Point)
installing a FML over the compacted clay bottom liner.
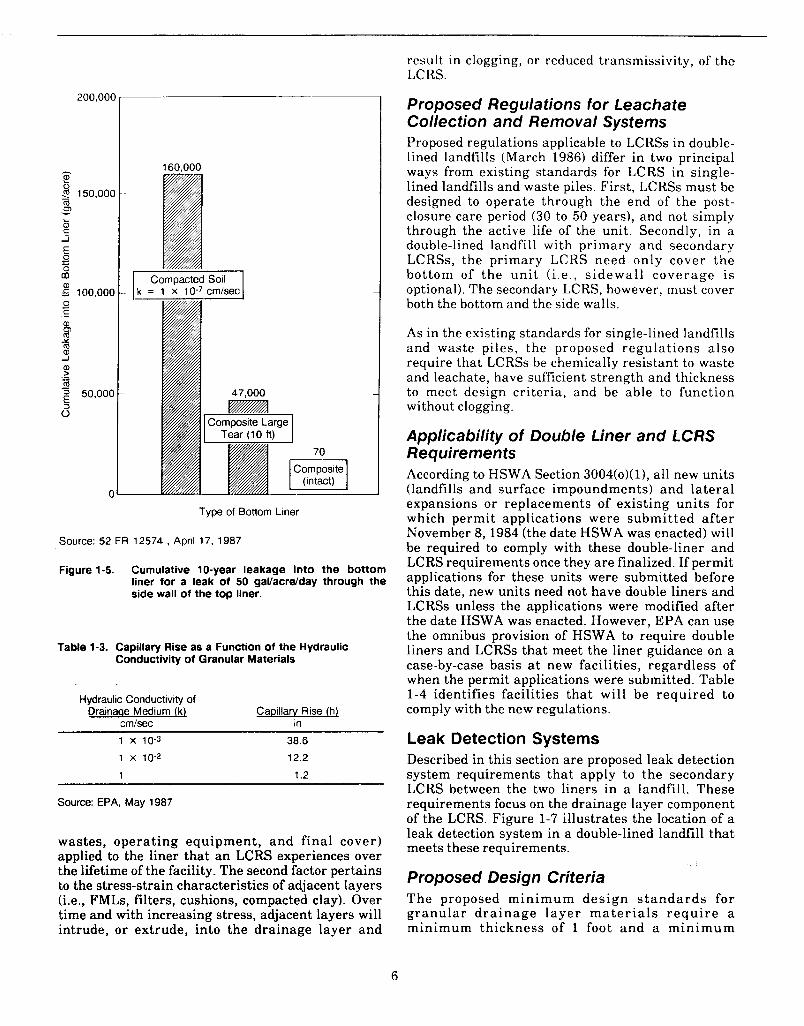
Figure 1-5 shows the total quant i ty of l iquids entering the two bottom liner systems over a 10-year time span with a constant top liner leak rate of 50 gallacrelday. A composite bottom liner with a n intact FML accumulates around 70 gallacre, primarily through water vapor transmission. Even with a 10- foot tear , which would const i tute a worst-case leakage scenario, a composite liner system will allow 47,000 to 50,000 gallacre to enter that bottom liner over a 10-year time span. Compacted soil l iners meeting the 10-7 c d s e c permeability standard will allow significant quantities of liquids into the bottom liner, and potentially out of the unit over time, on the order of hundreds of thousands of gallons per acre.
The numerical results indicate superior performance of composite liner systems over compacted clay liners in preventing hazardous constituent migration out of the unit and maximizing leachate collection and removal. Consequently, many owners of new units subject to the double liner requirement of HSWA are proposing and installing composite bottom liners or double composite liner systems, even though they are not required currently. A survey conducted in February of 1987 and revised in November of that year has indicated that over 97 percent of these MTR
3
landfills and surface impoundments have one of these two double liner designs.
Existing (Draft) Guidance for Leachate Collection and Removal Systems Double-lined landfil ls have both p r i m a r y a n d secondary LCRS. The design of the secondary LCRS in the landfill receives particular attention in EPA's proposed leak detection requirements. Described below a r e the exis t ing guidance and proposed regulations applicable to both LCRSs in double-lined landfills.
The components of a LCRS include the drainage layer , f i l ters , cushions, sumps, and pipes a n d appurtenances. Of these components, the drainage layer receives the most attention in the guidance and regulations. The drainage layer can consist of either granular or synthetic material. If granular, it must be either clean sand or gravel with very little fines content in order to facilitate the rapid collection and removal of the liquids that accumulate above the top liner and between the two liners. This minimizes hydraulic head on both liner systems.
Interim Statutory Design
Waste
Leachate Collection System Between
Liners
3 0 -
-
- - 3 Feet -
- t -
- -
- -1 -
Native Soil
Design 1
Waste
Leachate Collection System Between
Liners
0 - v
Native Soil
According to the draft guidance, the main selection criteria for granular drainage materials a re high hydraulic conductivity and low capillary tension, or suction forces. Figure 1-6 shows a range of hydraulic conductivities for natural granular materials. For typical drainage layer materials, permeabili t ies range between 10-3 c d s e c and 1 cmfsec. A silty sand drainage layer with significant fines content will have a lower permeability (Le., 10-3 cm/sec) and significant capillary tension. At the upper end of the scale, drainage layers consisting of clean gravel can achieve a permeability on the order of 1 c d s e c to 100 c d s e c . In this upper range of permeability, capillary tension is negligible. Therefore clean sands and gravels are preferred over silty sands.
T a b l e 1 - 3 shows t h e c o r r e l a t i o n b e t w e e n permeability and capillary rise (the elevation height of liquids retained by granular particles within the drainage layer by surface tension under unsaturated conditions). At 10-3 cmlsec, there is significant capillary rise (approximately 1 meter) while a t the upper end of the permeability scale (1 c d s e c ) , the capillary rise is only on the order of a n inch. Reduction in fines content, therefore, significantly reduces capillary rise while increasing hydraulic
Proposed Designs
Design 2
Waste - Leachate Collection
System Between Liners
Top Liner Designed, Constructed, and
Operated to Prevent Migration-AL 8, PCCP
/ Bottom Liner \I-/ I
Composite - Upper Component Prevent (FML) - Lower Component Minimize (clay)
Compacted Soil Sufficient Thickness ' to Prevent Migration During AL & PCCP
I -
I - Native Soil
Figure 1-2. Interim statutory and proposed double liner designs.
4
I r l 0 m 860
0.001 Composite
Type of Bottom Liner
Source: 52 FR 12570, April 17, 1987
Figure 1-3. Comparison of leak detection sensitivities for 3- foot compacted soil and composite liners (one- dimensional flow calculations).
conductivity. -Increasing hydraulic conductivity, in turn, results in rapid collection and removal of liquids.
Synthetic drainage materials have only recently been introduced to the waste management industry. Unlike granular mater ia ls , synthet ic dra inage materials come in various forms and thicknesses:
0 Nets (1 60-280 mils)
0 Needle-punched nonwoven geotextiles (80-200 mils)
Mats (400-800 mils)
0 Corrugated, waffled, or alveolate plates (400-800 mils)
sec
Top Liner Leakage Rate (gal/acre/day)
Source: 52 FR 12572, April 17, 1987
Figure 1-4. Comparison of leachate collection efficiencies for compacted soil and composite bottom liners.
Construction materials also vary. The most common synthetic materials are polypropylene, polyester, or polyethylene. More detailed discussion of these drainage materials is presented in Chapter Four. Because synthetic drainage layers are much thinner (less than 1 inch) than granular drainage layers ( 1 foot) and have similar design liquids capacity, their use in a landfill results in increased space for waste storage and disposal. This advantage translates into increased revenues for the ownerloperator of a landfill.
The main selection criteria for synthetic drainage materials are high hydraulic transmissivities, or inplane flow rates, and chemical compatibility with t h e was te leacha te . Discuss ion o f c h e m i c a l compatibility of synthetic liners and drainage layers is given in Chapter Eight.
Hydraulic transmissivity refers to the value of the thickness times the hydraulic conductivity for that drainage layer. Over the lifetime of d facility, the ac tua l hydraulic t ransmissivi t ies of syn the t i c drainage layers a re affected by two key factors: ( 1 ) overburden stress and (2) boundary conditions. The first factor pertains to the increasing loads ( i .e . ,
5
result in clogging, or reduced transmissivity, of the LCRS.
200.000
: - 9 150,000
&
m 9) - E -I
E I= 0
a,
0 E a,
m r 100,000 c
B Y m a, -I P)
m .- ” -
50,000 5 0
0
160.000
Ik =- 1 x 10⁻⁷ cm/secl
Type of Bottom Liner
Source: 52 FR 12574 , April 17, 1987
Figure 1-5. Cumulative 10-year leakage into the bottom liner for a leak of 50 gal/acre/day through the side wall of the top liner.
Table 1-3. Capillary Rise as a Function of the Hydraulic Conductivity of Granular Materials
Hydraulic Conductivity of Drainaqe Medium (k) Capillary Rise (h)
cmlsec in _ _ _ _ ~ ~ ~ ~
1 x 10⁻³ 38.6 1 x 10⁻² 12.2
1 1.2
Source: EPA, May 1987
wastes, operating equipment, a n d final cover) applied to the liner that a n LCRS experiences over the lifetime of the facility. The second factor pertains to the stress-strain characteristics of adjacent layers (i.e., FMLs, filters, cushions, compacted clay). Over time and with increasing stress, adjacent layers will intrude, or extrude, into the drainage layer and
Proposed Regulations for Leachate Collection and Remo va I Systems Proposed regulations applicable to LCRSs in double- lined landfills (March 1986) differ in two principal ways from existing standards for LCRS in single- lined landfills and waste piles. First, LCRSs must be designed to operate through the end of the post- closure care period (30 to 50 years), and not simply through the active life of the unit. Secondly, in a double-lined landfill with primary and secondary LCRSs, the primary LCRS need only cover the bottom of the uni t ( i . e . , s idewall coverage i s optional). The secondary LCRS, however, must cover both the bottom and the side walls.
As in the existing standards for single-lined landfills and waste piles, the proposed regulat ions also require that LCRSs be chemically resistant to waste and leachate, have sufficient strength and thickness to meet design criteria, and be able to function without clogging.
Applicability of Double Liner and LCRS Requirements According to HSWA Section 3004(0)(1), all new units (landfills and surface impoundments) and lateral expansions or replacements of existing units for which permit applications were submitted a f te r November 8, 1984 (the date HSWA was enacted) will be required to comply with these double-liner and LCRS requirements once they are finalized. If permit applications for these units were submitted before this date, new units need not have double liners and LCRSs unless the applications were modified after the date HSWA was enacted. However, EPA can use the omnibus provision of HSWA to require double liners and LCRSs that meet the liner guidance on a case-by-case basis a t new facilities, regardless of when the permit applications were submitted. Table 1-4 identifies facilities that will be required to comply with the new regulations.
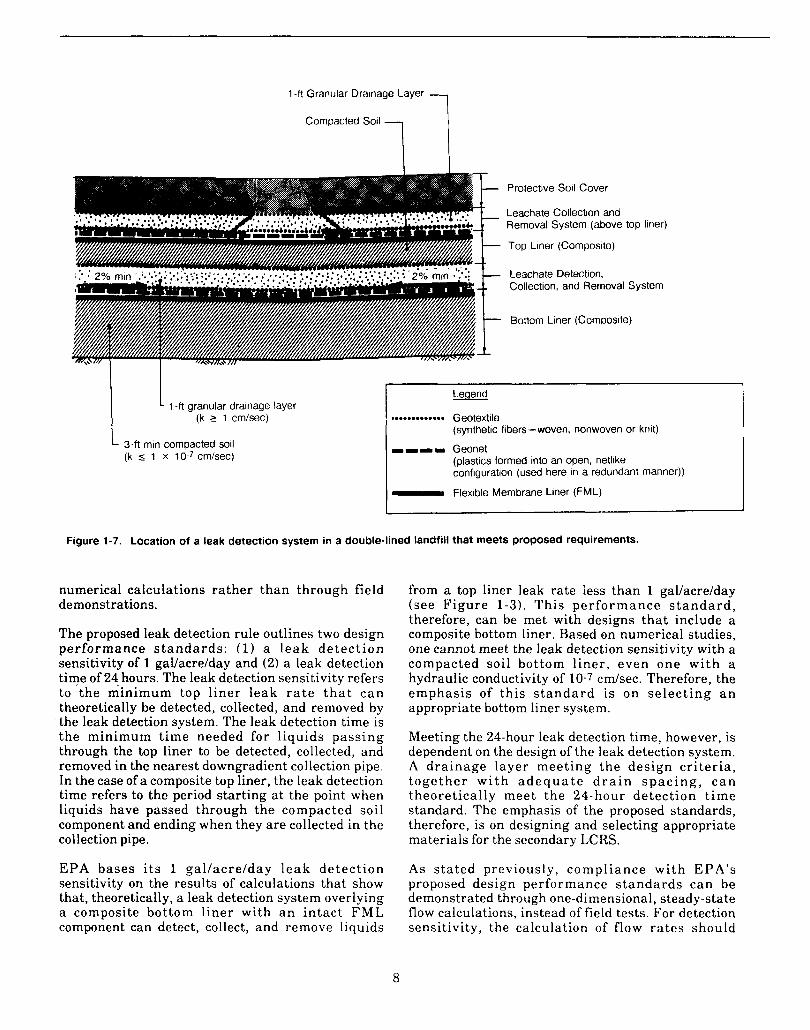
Leak Detection Systems Described in this section are proposed leak detection system requirements that apply to the secondary LCRS between the two liners in a landfill. These requirements focus on the drainage layer component of the LCRS. Figure 1-7 illustrates the location of a leak detection system in a double-lined landfill that meets these requirements.
Proposed Design Criteria The proposed min imum design s t a n d a r d s for g ranu la r d r a i n a g e layer m a t e r i a l s r e q u i r e a minimum thickness of 1 foot and a m i n i m u m
6
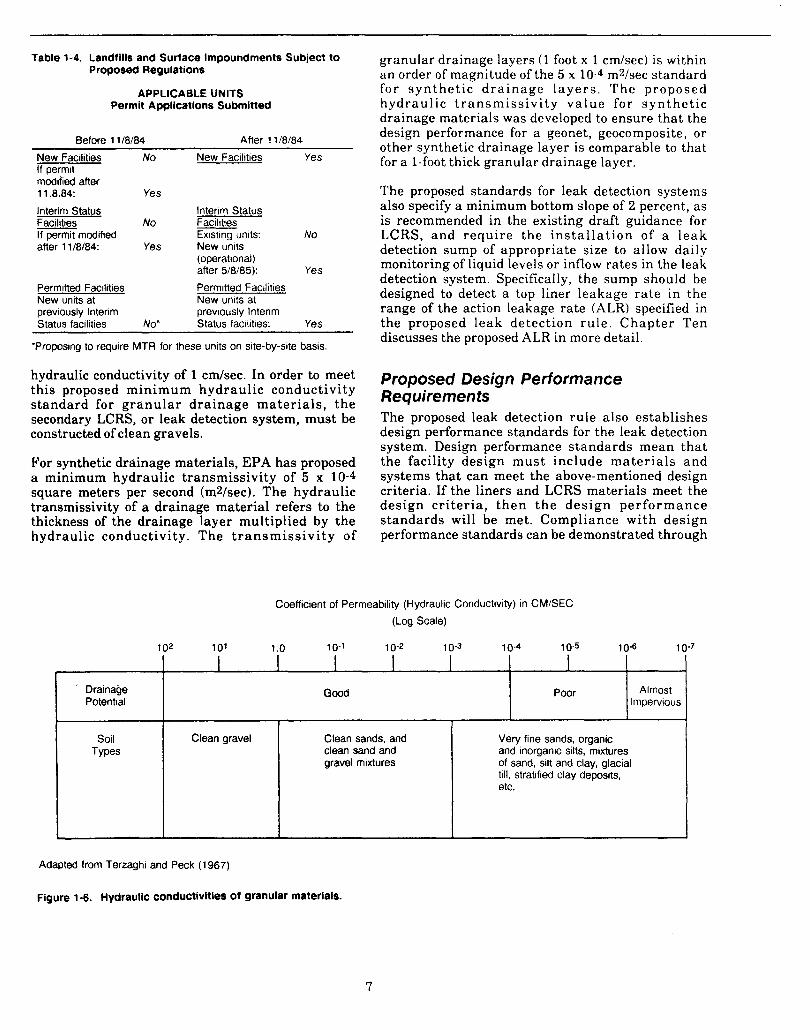
Table 1-4. Landfills and Surface Impoundments Subject to Proposed Regulations
APPLICABLE UNITS Permit Applications Submitted
I I I
Before 1 1/8/84 After 11/8/84
New Facilities No New Facilities Yes If permit modified after 1 1 .8.84: Yes
Interim Status Interim Status Facilities No Facilities If permit modified Existing units: No after 1 1/8/84: Yes New units
(operational) after 5/8/85): Yes
New units at Permitted Facilities Permitted Facilities New units at previously Interim previously Interim Status facilities No" Status facilities: Yes
'Proposing to require MTR for these units on site-by-site basis.
I I I
hydraulic conductivity of 1 c d s e c . In order to meet this proposed minimum hydraulic conductivity standard for g ranu la r drainage mater ia ls , t h e secondary LCRS, or leak detection system, must be constructed of clean gravels.
For synthetic drainage materials, EPA has proposed a minimum hydraulic transmissivity of 5 x 10⁻⁴ square meters per second (mVsec). The hydraulic transmissivity of a drainage material refers to the thickness of the drainage layer multiplied by the hydraulic conductivity. The t r a n s m i s s i v i t y of
Drainage Potential
soil Types
granular drainage layers (1 foot x 1 cm/sec) is within an order of magnitude of the 5 x 10⁻⁴ m%ec standard for s y n t h e t i c d r a i n a g e l a y e r s . T h e proposed hydraul ic t r ansmiss iv i ty va lue for synthe t ic drainage materials was developed to ensure that the design performance for a geonet, geocomposite, or other synthetic drainage layer is comparable to that for a 1-foot thick granular drainage layer.
The proposed standards for leak detection systems also specify a minimum bottom slope of 2 percent, as is recommended in the existing draft guidance for LCRS, and require the ins ta l la t ion of a leak detection sump of appropriate size to allow daily monitoring of liquid levels or inflow rates in the leak detection system. Specifically, the sump should be designed to detect a top liner leakage rate in the range of the action leakage rate (ALR) specified in the proposed leak detection ru le . Chapter Ten discusses the proposed ALR in more detail.
Proposed Design Performance Requirements The proposed leak detection rule also establishes design performance standards for the leak detection system. Design performance standards mean that the facility design must include mater ia ls and systems that can meet the above-mentioned design criteria. If the liners and LCRS materials meet the design c r i te r ia , t hen t h e design performance standards will be met. Compliance with design performance standards can be demonstrated through
Coefficient of Permeability (Hydraulic Conductivity) in CM/SEC
(Log Scale)
2 10' 1 .o lo-' 10-2 10-3 10.4 10-5 1 0 6 11
Good Almost Impervious I Poor
Clean gravel Clean sands, and clean sand and gravel mixtures
Very fine sands, organic and inorganic silts, mixtures of sand, silt and clay, glacial till, stratified clay deposits, etc.
-7
Adapted from Terzaghi and Peck (1967)
Figure 1-6. Hydraulic conductivities of granular materials.
7
1 -ft Granular Drainage Layer
Compacted Soil
Protective Soil Cover
Leachate Collection and Removal System (above top liner)
Top Liner (Composite)
Leachate Detection,
1 -ft granular drainage layer (k 5 1 cm/sec)
L 3-fl min compacted soil (k c 1 x cm/sec)
Collection, and Removal System
Bottom Liner (Composite)
LeQend
(synthetic fibers-woven, nonwoven or knit)
(plastics formed into an open, netlike configuration (used here in a redundant manner))
*.e.......... Geotextile
---- Geonet
- Flexible Membrane Liner (FML)
Figure 1-7. Location of a leak detection system in a double-lined landfill that meets proposed requirements.
numerical calculations rather than through field demonstrations.
The proposed leak detection rule outlines two design performance s t anda rds : ( 1 ) a l eak de tec t ion sensitivity of 1 gallacrelday and (2) a leak detection time of 24 hours. The leak detection sensitivity refers to the minimum top l iner leak r a t e t h a t c a n theoretically be detected, collected, and removed by the leak detection system. The leak detection time is the minimum t ime needed for l iquids passing through the top liner to be detected, collected, and removed in the nearest downgradient collection pipe. In the case of a composite top liner, the leak detection time refers to the period starting a t the point when liquids have passed through the compacted soil component and ending when they are collected in the collection pipe.
EPA bases i t s 1 gal lacrelday l eak de tec t ion sensitivity on the results of calculations that show that, theoretically, a leak detection system overlying a composite bottom l iner with a n in tac t F M L component can detect, collect, and remove liquids
from a top liner leak rate less than 1 gallacrelday (see F igure 1-3) . This per formance s t a n d a r d , therefore, can be met with designs tha t include a composite bottom liner. Based on numerical studies, one cannot meet the leak detection sensitivity with a compacted soil bottom l iner , even one wi th a hydraulic conductivity of 10-7 c d s e c . Therefore, the emphasis of this s t a n d a r d i s on se l ec t ing a n appropriate bottom liner system.
Meeting the 24-hour leak detection time, however, is dependent on the design of the leak detection system. A dra inage layer meet ing the design c r i te r ia , t oge the r w i t h a d e q u a t e d r a i n s p a c i n g , c a n theoretically meet the 24-hour detect ion t ime standard. The emphasis of the proposed standards, therefore, is on designing and selecting appropriate materials for the secondary LCRS.
A s s ta ted previously, compliance wi th EPA's proposed design performance s t anda rds can be demonstrated through one-dimensional, steady-state flow calculations, instead of field tests. For detection sensitivity, the calculation of flow ra tes should
a
assume uniform top liner leakage. For detection time, factors such as drain spacing, drainage media, bottom slope, and top and bottom liners should all be considered, and the worst-case leakage scenario calculated.
Applicability of Leak Detection System Requirements Owners a n d o p e r a t o r s of l a n d f i l l s , s u r f a c e i m p o u n d m e n t s , a n d w a s t e p i l e s o n w h i c h construction begins 6 months after the date the rule is finalized will be required to install double liners and leak detection systems.
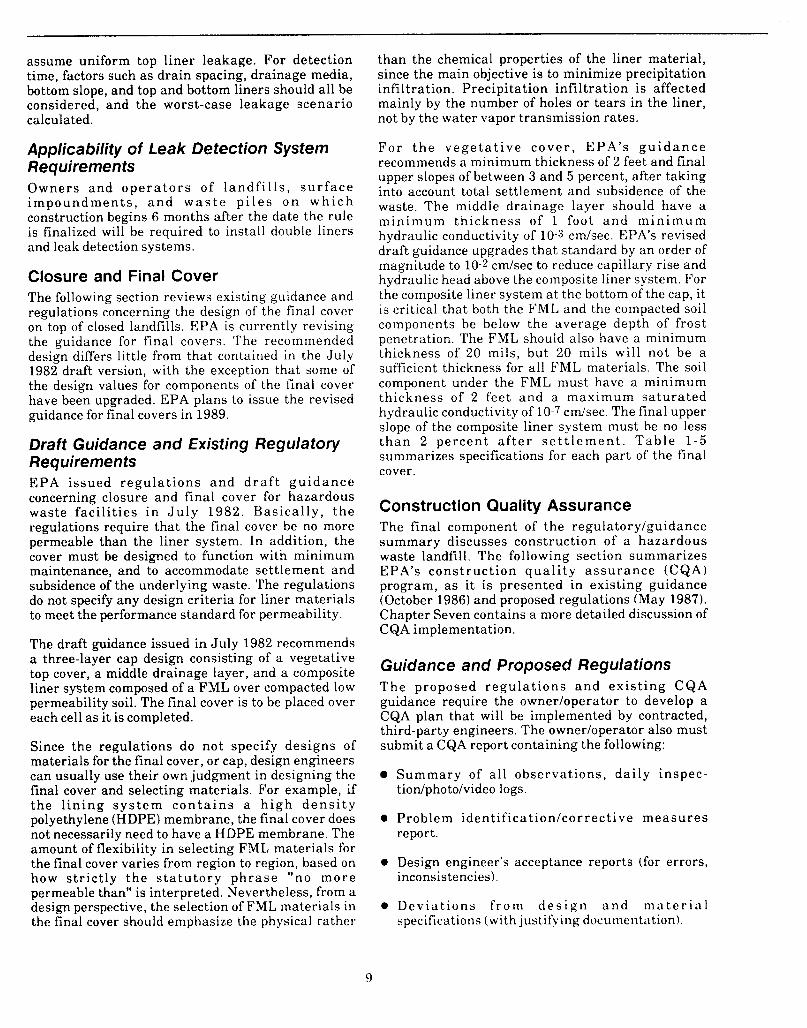
Closure and Final Cover The following section reviews existing guidance and regulations concerning the design of the final cover on top of closed landfills. EPA is currently revising the guidance for final covers. The recommended design differs little from that contained in the July 1982 draft version, with the exception that some of the design values for components of the final cover have been upgraded. EPA plans to issue the revised guidance for final covers in 1989.
Draft Guidance and Existing Regulatory Requirements EPA issued r egu la t ions a n d d r a f t g u i d a n c e concerning closure and final cover for hazardous waste fac i l i t i es i n J u l y 1982. Bas ica l ly , t h e regulations require that the final cover be no more permeable than the liner system. In addition, the cover must be designed to function with minimum maintenance, and to accommodate settlement and subsidence of the underlying waste. The regulations do not specify any design criteria for liner materials to meet the performance standard for permeability.
The draft guidance issued in July 1982 recommends a three-layer cap design consisting of a vegetative top cover, a middle drainage layer, and a composite liner system composed of a FML over compacted low permeability soil. The final cover is to be placed over each cell as it is completed.
Since the regulations do not specify designs of materials for the final cover, or cap, design engineers can usually use their own judgment in designing the final cover and selecting materials. For example, if t he l i n i n g s y s t e m c o n t a i n s a h i g h d e n s i t y polyethylene (HDPE) membrane, the final cover does not necessarily need to have a HDPE membrane. The amount of flexibility in selecting FML materials for the final cover varies from region to region, based on how s t r ic t ly t h e s t a t u t o r y p h r a s e “no m o r e permeable than“ is interpreted. Nevertheless, from a design perspective, the selection of FML materials in the final cover should emphasize the physical rather
than the chemical properties of the liner material, since the main objective is to minimize precipitation infiltration. Precipitation infiltration is affected mainly by the number of holes or tears in the liner, not by the water vapor transmission rates.
F o r t h e v e g e t a t i v e c o v e r , E P A ’ s g u i d a n c e recommends a minimum thickness of 2 feet and final upper slopes of between 3 and 5 percent, after taking into account total settlement and subsidence of the waste. The middle drainage layer should have a m i n i m u m th i ckness of 1 foot a n d m i n i m u m hydraulic conductivity of 10-3 c d s e c . EPA’s revised draft guidance upgrades that standard by an order of magnitude to 10-2 c d s e c to reduce capillary rise and hydraulic head above the composite liner system. For the composite liner system a t the bottom of the cap, it is critical that both the FML and the compacted soil components be below the average depth of frost penetration. The FML should also have a minimum thickness of 20 mils, but 20 mils will not be a sufficient thickness for all FML materials. The soil component under the FML must have a minimum thickness of 2 feet and a maximum sa tu ra t ed hydraulic conductivity of 10-7 c d s e c . The final upper slope of the composite liner system must be no less t h a n 2 pe rcen t a f t e r s e t t l e m e n t . T a b l e 1 - 5 summarizes specifications for each part of the final cover.
Construction Quality Assurance The final component of the regulatorylguidance summary discusses construction of a hazardous waste landfill. The following section summarizes EPA’s cons t ruc t ion q u a l i t y a s s u r a n c e (CQA) program, as i t is presented in existing guidance (October 1986) and proposed regulations (May 1987). Chapter Seven contains a more detailed discussion of CQA implementation.
Guidance and Proposed Regulations T h e proposed r egu la t ions a n d ex i s t ing CQA guidance require the ownerloperator to develop a CQA plan that will be implemented by contracted, third-party engineers. The ownerloperator also must submit a CQA report containing the following:
Summary of a l l observat ions, da i ly inspec- tiodphotolvideo logs.
0 Problem ident i f ica t ion lcor rec t ive m e a s u r e s rep0 r t .
0 Design engineer’s acceptance reports (for errors, inconsistencies).
0 Devia t ions f r o m d e s i g n a n d m n t e r i a l specifications (with justifying dociimentation).
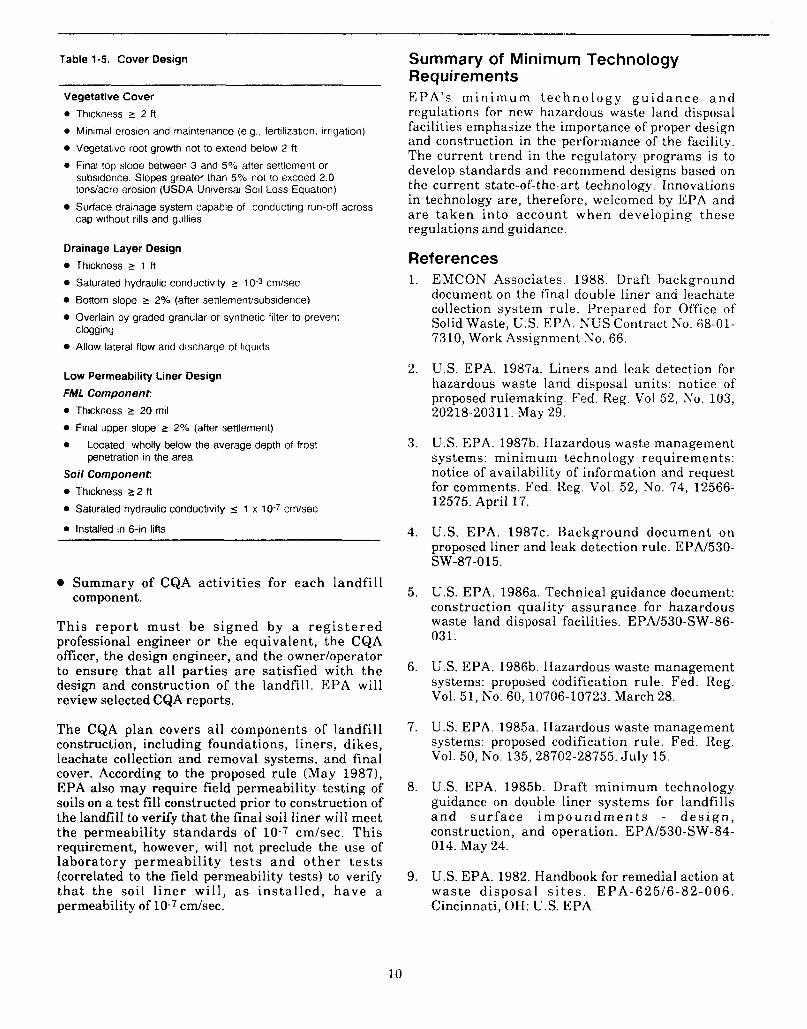
Table 1-5. Cover Design
Vegetative Cover 0 Thickness 2 2 ft
0 Minimal erosion and maintenance (e g , fertilization, irrigation)
Vegetative root growth not to extend below 2 ft
0 Final top slope belween 3 and 5% after settlement or subsidence. Slopes greater than 5% not to exceed 2 0 tondacre erosion (USDA Universal Soil Loss Equation)
cap without rills and gullies Surface drainage system capable of conducting run-off across
Drainage Layer Design Thickness s 1 ft
Saturated hydraulic conductivity s 10-3 cm/sec
Bottom slope s 2% (after settlementisubsidence)
Overlain by graded granular or synthetic filter to prevent
Allow lateral flow and discharge of liquids
clogging
Low Permeability Liner Design FML Component 0 Thickness s 20 mil
Final upper slope 2 2% (after settlement)
0 Located wholly below the average depth of frost
Soil Component Thickness 2 2 ft
0 Saturated hydraulic conductivity 5 1 x
0 Installed in 6-in lifts
penetration in the area
cm/sec
0 Summary of CQA activit ies for each landfil l component.
Th i s r epor t mus t be s igned by a r e g i s t e r e d professional engineer or the equivalent, the CQA officer, the design engineer, and the ownerloperator to ensure tha t all parties a re satisfied with the design and construction of the landfill. EPA will review selected CQA reports.
The CQA plan covers all components of landfill construction, including foundations, liners, dikes, leachate collection and removal systems, and final cover. According to the proposed rule (May 19871, EPA also may require field permeability testing of soils on a test fill constructed prior to construction of the landfill to verify that the final soil liner will meet the permeability s tandards of 10-7 cmlsec. This requirement, however, will not preclude the use of laboratory permeabili ty t e s t s a n d o t h e r t e s t s (correlated to the field permeability tests) to verify tha t the soil l iner wil l , as in s t a l l ed , have a permeability of 10-7 c d s e c .
Summary of Minimum Technology Requirements EPA’s m i n i m u m t e c h n o l o g y g u i d a n c e a n d regulations for new hazardous waste land disposal facilities emphasize the importance of proper design and construction in the performance of the facility. The current trend in the regulatory programs is to develop standards and recommend designs based on the current state-of-the-art technology. Innovations in technology are, therefore, welcomed by EPA and are t aken into account when developing these regulations and guidance.
References 1.
2.
3.
4.
5.
6.
7.
8.
9.
EMCON Associates. 1988. Draft background document on the final double liner and leachate collection system rule. Prepared for Office of Solid Waste, L.S. EPA. NCS Contract No. 68-01- 7310, Work Assignment No. 66.
U.S. EPA. 1987a. Liners and leak detection for hazardous waste land disposal units: notice of proposed rulemaking. Fed. Reg. Vol 52, No. 103, 20218-20311. May 29.
U.S. EPA. 1987b. Hazardous waste management systems: minimum technology requirements: notice of availability of information and request for comments. Fed. Reg. Vol. 52, No. 74, 12566- 12575. April 17.
U.S. EPA. 1987c. Background document on proposed liner and leak detection rule. EPN530- SW-87-0 15.
U.S. EPA. 1986a. Technical guidance document: construction quali ty assurance for hazardous waste land disposal facilities. EPAf530-SW-86- 031.
U.S. EPA. 198613. Hazardous waste management systems: proposed codification rule. Fed. Reg. Vol. 51, No. 60, 10706-10723. March 28.
U.S. EPA. 1985a. Hazardous waste management systems: proposed codification rule. Fed. Reg. Vol. 50, NO. 135,28702-28755. July 15.
U.S. EPA. 1985b. Draft minimum technology guidance on double liner systems for landfills a n d s u r f a c e i m p o u n d m e n t s - d e s i g n , construction, and operation. EPAl530-SW-84- 014. May 24.
U.S. EPA. 1982. Handbook for remedial action a t was te d isposa l s i t e s . EPA-62516-82-006. Cincinnati, OH: U.S. EPA.
10
2. LINER DESIGN: CLAY LINERS
Introduction This chapter discusses soil liners and their use in hazardous waste landfil ls . The chapter focuses primarily on hydraulic conductivity testing, both in the laboratory and in the field. I t also covers materials used to construct soil liners, mechanisms of contaminant transport through soil liners, and the effects of chemica l s a n d was te l eacha te s on compacted soil liners.
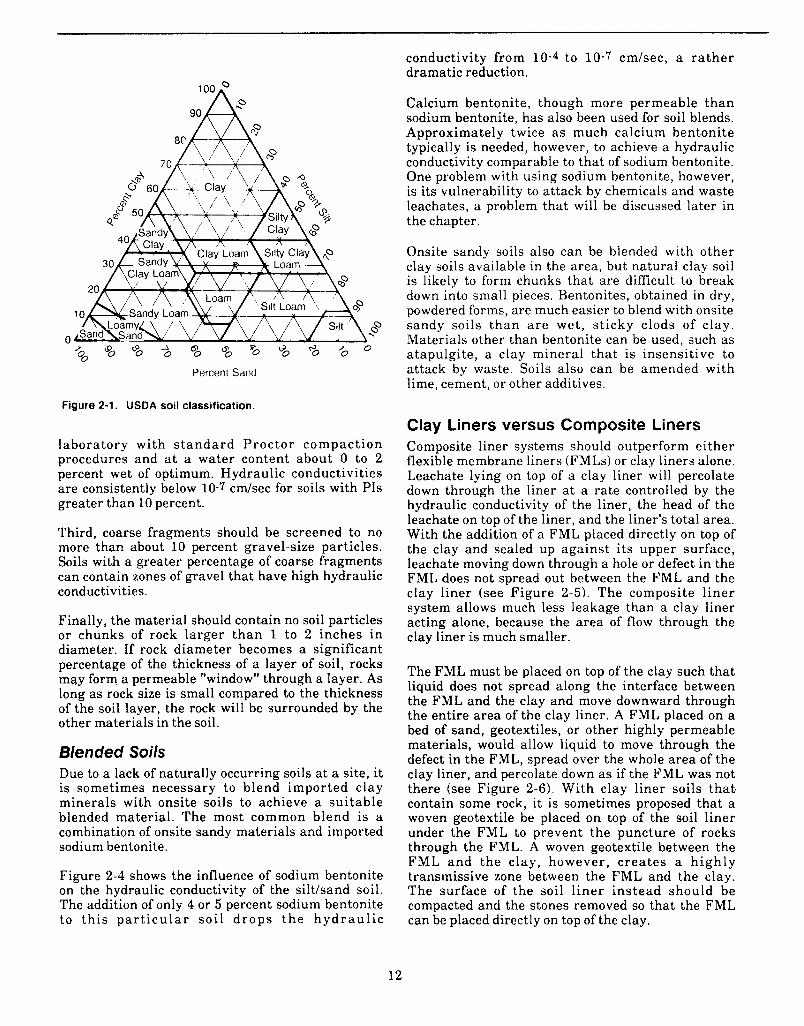
Materials Clay Clay is the most important component of soil liners because the clay fraction of the soil ensures low h y d r a u l i c c o n d u c t i v i t y . I n t h e U n i t e d States,however, there is some ambiguity in defining the term "clay" because two soil classification systems are widely used. One system, published by the American Society of Tes t ing and Mater ia l s (ASTM), is used predominantly by civil engineers. The other, the U.S. Department of Agriculture's (USDA's) soil classification system, is used primarily by soil scientists, agronomists, and soil physicists.
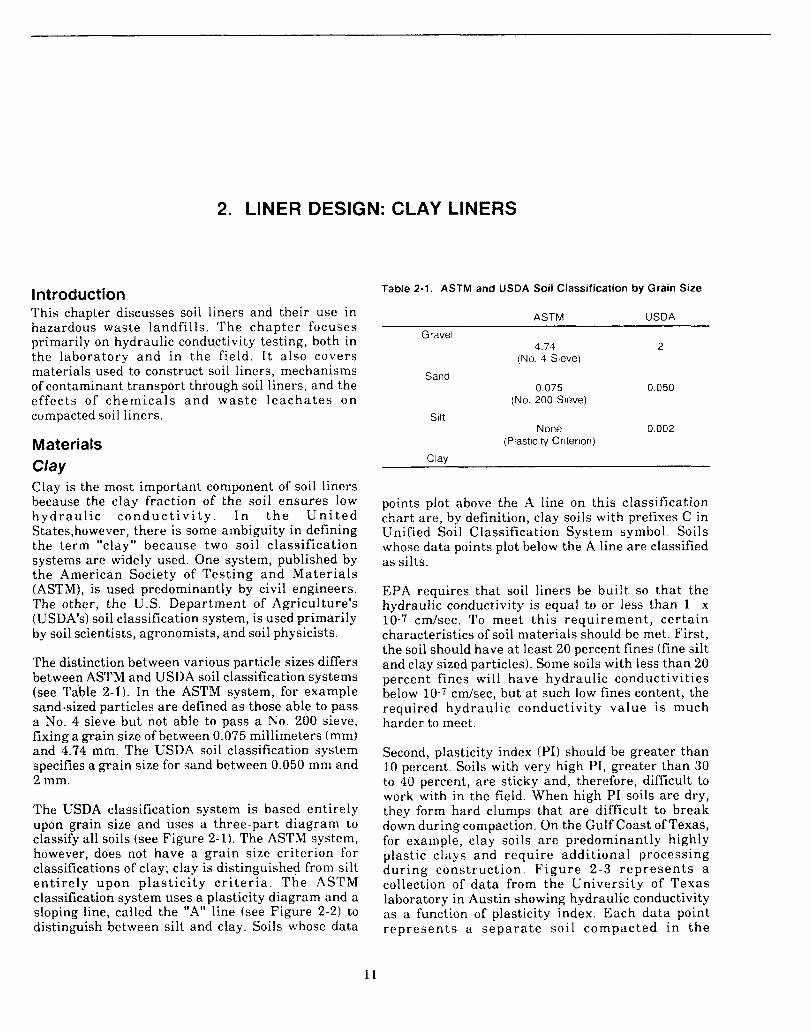
The distinction between various particle sizes differs between ASTM and USDA soil classification systems (see Table 2-11, In the ASTM system, for example sand-sized particles are defined as those able to pass a No. 4 sieve but not able to pass a No. 200 sieve, fixing a grain size of between 0.075 millimeters (mm) and 4.74 mm. The USDA soil classification system specifies a grain size for sand between 0.050 mm and 2 mm.
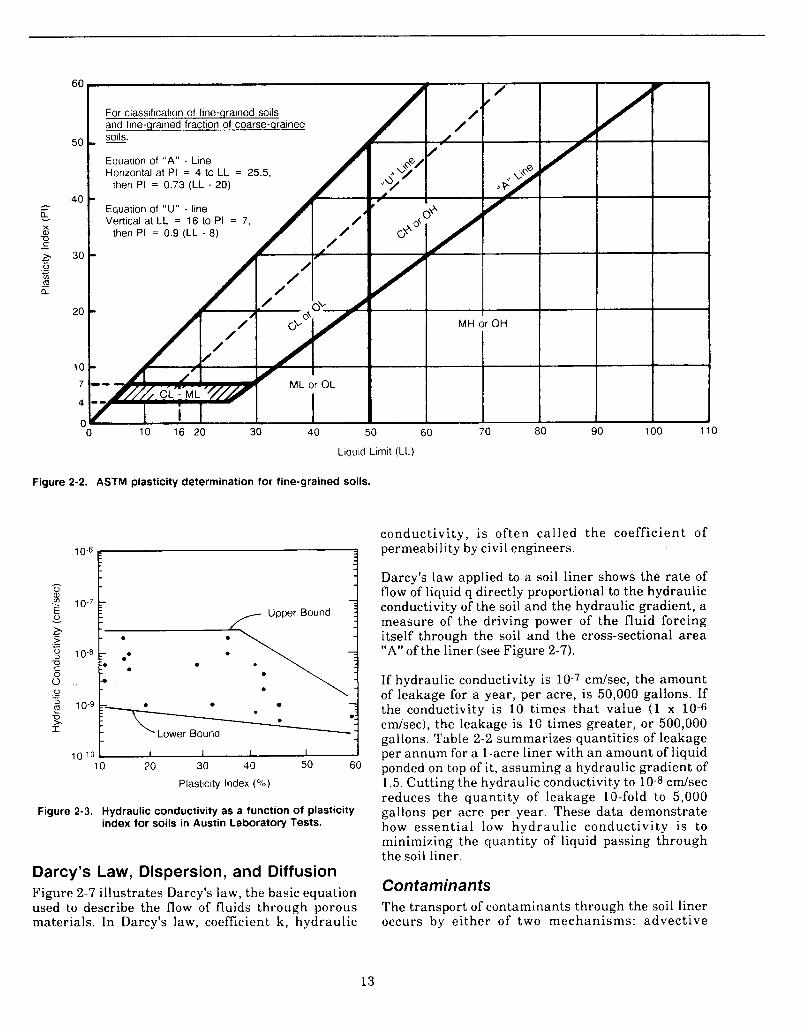
The USDA classification system is based entirely upon grain size and uses a three-part diagram to classify all soils (see Figure 2-1). The ASTM system, however, does not have a grain size criterion for classifications of clay; clay is distinguished from silt en t i re ly upon p la s t i c i ty c r i t e r i a . T h e ASTM classification system uses a plasticity diagram and a sloping line, called the "A" line (see Figure 2-21 to distinguish between silt and clay. Soils whose data
Table 2-1. ASTM and USDA Soil Classification by Grain Size
ASTM USDA
Gravel 4.74 2
(No. 4 Sieve)
Sand 0 075 0.050
(No. 200 Sieve)
Silt None 0.002
(Plasticity Criterion)
points plot above the A line on this classification chart are, by definition, clay soils with prefixes C in Unified Soil Classification System symbol. Soils whose data points plot below the A line are classified as silts.
EPA requires that soil liners be built so tha t the hydraulic conductivity is equal to or less than 1 x 10⁻⁷ cm/sec. To meet th i s requi rement , cer ta in characteristics of soil materials should be met. First, the soil should have at least 20 percent fines (fine silt and clay sized particles). Some soils with less than 20 percent fines will have hydraulic conductivit ies below 10-7 c d s e c , but at such low fines content, the required hydraul ic conductivity value is much harder to meet.
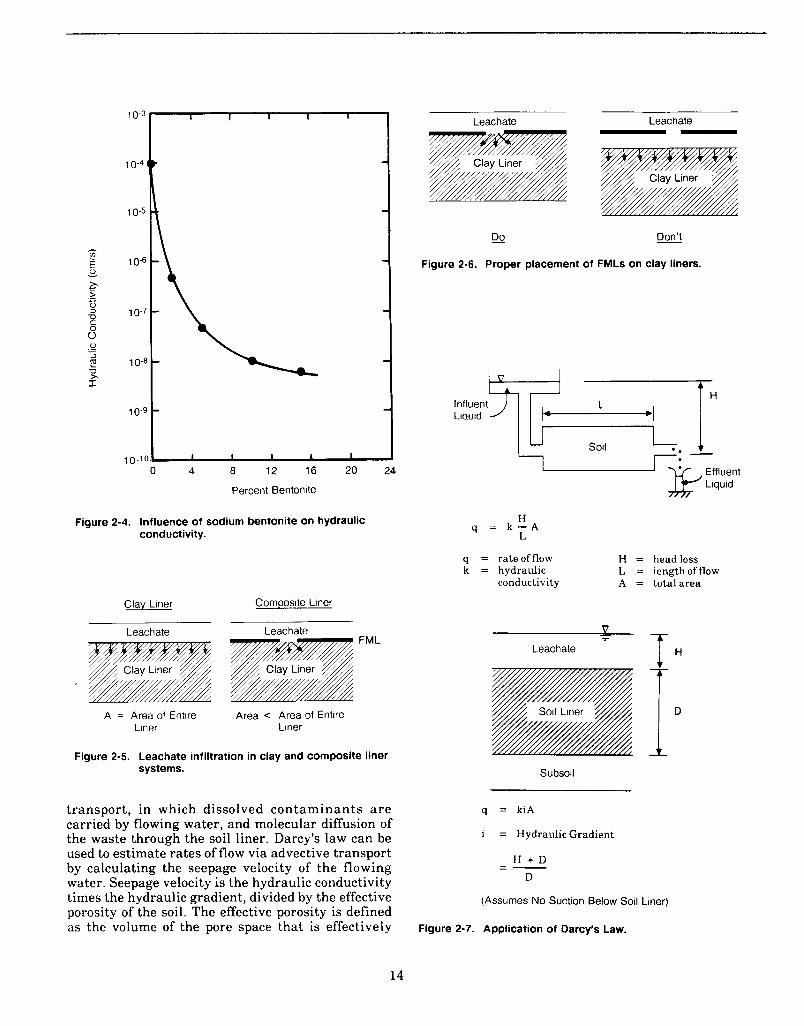
Second, plasticity index (PI) should be greater than 10 percent. Soils with very high PI, greater than 30 to 40 percent, are sticky and, therefore, difficult to work with in the field. When high PI soils are dry, they form hard clumps that are difficult to break down during compaction. On the Gulf Coast of Texas, for example, clay soils a re predominantly highly plastic clays and require addi t ional processing du r ing construct ion. F igu re 2-3 r ep resen t s a collection of da ta from the University of Texas laboratory in Austin showing hydraulic conductivity as a function of plasticity index. Each data point r ep resen t s a s e p a r a t e soi l compacted in t h e
11
conductivity from 10-4 to 10-7 cm/sec, a r a the r dramatic reduction.
Percent Sand
Figure 2-1. USDA soil classification.
laboratory with s t anda rd Proc tor compact ion procedures and a t a water content about 0 to 2 percent wet of optimum. Hydraulic conductivities are consistently below 10-7 c d s e c for soils with PIS greater than 10 percent.
Third, coarse fragments should be screened to no more than about 10 percent gravel-size particles. Soils with a greater percentage of coarse fragments can contain zones of gravel that have high hydraulic conductivities.
Finally, the material should contain no soil particles or chunks of rock larger t han 1 to 2 inches in diameter. if rock diameter becomes a significant percentage of the thickness of a layer of soil, rocks may form a permeable "window" through a layer. As long as rock size is small compared to the thickness of the soil layer, the rock will be surrounded by the other materials in the soil.
Blended Soils Due to a lack of naturally occurring soils a t a site, it is sometimes necessary to blend imported clay minerals with onsite soils to achieve a sui table blended material. The most common blend is a combination of onsite sandy materials and imported sodium bentonite.
Figure 2-4 shows the influence of sodium bentonite on the hydraulic conductivity of the silt/ sand soil. The addition of only 4 or 5 percent sodium bentonite to th i s p a r t i c u l a r soi l d r o p s t h e h y d r a u l i c
Calcium bentonite, though more permeable than sodium bentonite, has also been used for soil blends. Approximately twice a s much calcium bentonite typically is needed, however, to achieve a hydraulic conductivity comparable to that of sodium bentonite. One problem with using sodium bentonite, however, is its vulnerability to attack by chemicals and waste leachates, a problem that will be discussed later in the chapter.
Onsite sandy soils also can be blended with other clay soils available in the area, but natural clay soil is likely to form chunks that are difficult to break down into small pieces. Bentonites, obtained in dry, powdered forms, are much easier to blend with onsite sandy soils t han a r e wet, s t icky clods of c l a y . Materials other than bentonite can be used, such as atapulgite, a clay mineral tha t is insensitive to attack by waste. Soils also can be amended with lime, cement, or other additives.
Clay Liners versus Composite Liners Composite liner systems should outperform either flexible membrane liners (FMLs) or clay liners alone. Leachate lying on top of a clay liner will percolate down through the liner a t a rate controlled by the hydraulic conductivity of the liner, the head of the leachate on top of the liner, and the liner's total area. With the addition of a FML placed directly on top of the clay and sealed up against i ts upper surface, leachate moving down through a hole or defect in the FML does not spread out between the FML and the clay l iner (see Figure 2-5). The composite l iner system allows much less leakage than a clay liner acting alone, because the area of flow through the clay liner is much smaller.
The FML must be placed on top of the clay such that liquid does not spread along the interface between the FML and the clay and move downward through the entire area of the clay liner. A FML placed on a bed of sand, geotextiles, or other highly permeable materials, would allow liquid to move through the defect in the FML, spread over the whole area of the clay liner, and percolate down as if the FML was not there (see Figure 2-6). With clay liner soils t ha t contain some rock, it is sometimes proposed that a woven geotextile be placed on top of the soil liner under the FML to prevent the puncture of rocks through the FML. A woven geotextile between the FML and the clay, however, c rea tes a h ighly transmissive zone between the FML and the clay. The surface of the soil l iner instead should be compacted and the stones removed so that the FML can be placed directly on top of the clay.
12
60
50
40 - - a, %
2 30
U - 0 m a
c
-
20
1c
7
4
( 10 16 20 30 40 50 60 70 80 90 100 110
Llquid Limit (LL)
Figure 2-2. ASTM plasticity determination for fine-grained soils.
10.7
10.8
Lower Bound
10-10 1 I I 1
10 20 30 40 50 60
Plasticity Index ('70)
Figure 2-3. Hydraulic conductivity as a function of plasticity index for soils in Austin Laboratory Tests.
Darcy's Law, Dispersion, and Diffusion Figure 2-7 illustrates Darcy's law, the basic equation used to describe the flow of fluids through porous materials. In Darcy's law, coefficient k, hydraulic
conductivity, is often called the coefficient of permeability by civil engineers.
Darcyk law applied to a soil liner shows the rate of flow of liquid q directly proportional to the hydraulic conductivity of the soil and the hydraulic gradient, a measure of the driving power of the fluid forcing itself through the soil and the cross-sectional area "A" of the liner (see Figure 2-7).
If hydraulic conductivity is 10-7 c d s e c , the amount of leakage for a year, per acre, is 50,000 gallons. If the conductivity is 10 times tha t value (1 x 10⁻⁶ cdsec ) , the leakage is 10 times greater, or 500,000 gallons. Table 2-2 summarizes quantities of leakage per annum for a l-acre liner with a n amount of liquid ponded on top of it, assuming a hydraulic gradient of 1.5. Cutting the hydraulic conductivity to 10-8 c d s e c reduces the quantity of leakage 10-fold to 5,000 gallons per acre per year. These data demonstrate how essential low hydraulic conductivity is to minimizing the quantity of liquid passing through the soil liner.
Contaminants The transport of contaminants through the soil liner occurs by either of two mechanisms: advective
13
10.3
10-4
10-5
10-6
10-7
10-8
10-9
lo-"
1 I I I I
0 4 8 12 16 20 24
Percent Bentonite
Figure 2-4. Influence of sodium bentonite on hydraulic conductivity.
Clay Liner Composite Liner
Leachate Leachate
A = Area of Entire Area c Area of Entire Liner Liner
Figure 2-5. Leachate infiltration in clay and composite liner systems.
Leachate Leachate
- Do Don't
Figure 2-6. Proper placement of FMLs on clay liners.
I l H Influent Liquid
SOll LI e: - u
Liquid
H L
q = k - A
q = rateofflow H = headloss k = hydraulic L = lengthofflow
conductivity A = to ta la rea
9 - Leachate
Subsoil
transport, in which dissolved contaminants a r e q = kiA carried by flowing water, and molecular diffusion of the waste through the soil liner. Darcy's law can be used to estimate rates of flow via advective transport
water. Seepage velocity is the hydraulic conductivity times the hydraulic gradient, divided by the effective porosity of the soil. The effective porosity is defined as the volume of the pore space that is effectively
i = Hydraulic Gradient
H + D D
- by calculating the seepage velocity of the flowing - -
(Assumes No Suction Below Soil Liner)
Figure 2-7. Application of Darcy's Law.
14

Table 2-2. Effects of Leakage Quantity on Hydraulic Conductivity for a 1-Acre Liner
divided by the hydraulic conductivity t imes the hydraulic gradient (Figure 2-91.
Hydraulic Conductivitv (cmisec) Annual Lcakaoe (oallons)
1 x 10⁻⁶ 500,000
i x 10-7 50,000
1 x 10⁻⁸ 5,000 L Vs ki
TOT = - = - Note: Hydraulic Gradient Assumed to be 1.5
conducting the flow, divided by the total volume of the soil sample (Figure 2-81.
Figure 2-9. Time of Travel (TOT).
i = Hydraulic
H + T T
Gradient It is possible to confirm these calculations and measure some of the parameters needed to make them by performing labora tory permeabi l i ty experiments. In these experiments, clean soil is placed into columns in the laboratory, and the leachate or some other waste liquid is loaded on top of each soil column, forcing the liquid through the column over a period of time, while keeping the concentration of influent l iquid constant . The concentration of one or more chemicals in the effluent liquid is measured over time.
- - -
(No Suction)
Flux
v, = seepage velocity
ki n
= -
Subsoil ne = effective porosity
Figure 2-8. Advective transport.
If the liquid uniformly passes through all the pores in the soil, then the effective and total porosities are equal. However, if the flow takes place in only a small percentage of the total pore space, for example, through f rac tures or macropores, the effective porosity will be much lower than the total porosity. Judging the effective porosity is one of the problems of estimating seepage velocities.
If effective porosity and other parameters are known, the time of travel (TOT) for a molecule of waste transported by flowing water through the soil liner can be calculated. TOT equals the length of the particular flow path times the effective porosity,
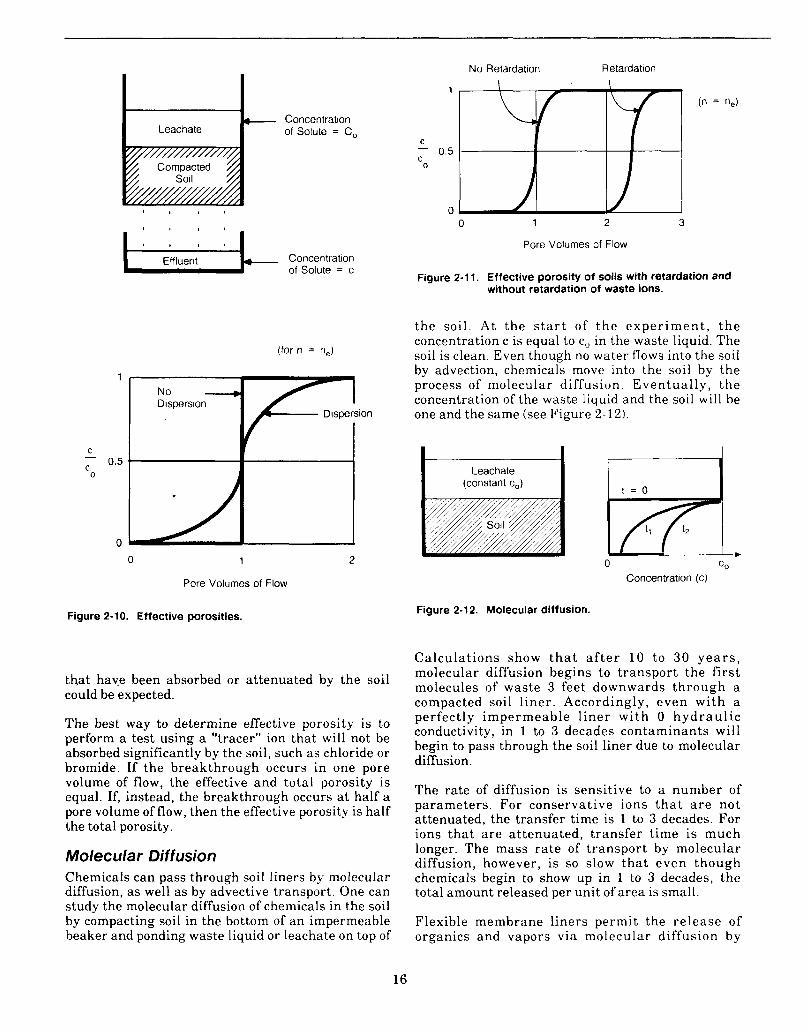
A plot called a breakthrough curve shows the effluent l iquid concentration c divided by the influent liquid concentration co as a function of pore volumes of flow (see Figure 2-10). One pore volume of flow is equal to the volume of the void space in the soil. The effective porosity of the soil is determined by measuring a breakthrough curve.
It can be expected that as the leachate invades the soil, none of the waste chemical will appear in the effluent liquid a t first, only remnant soil and water. Then a t some point, the invading leachate will make its way downstream through the soil column, and come ou t in more or l ess fu l l s t r e n g t h . An instantaneous breakthrough of the waste liquid never occurs, however. The breakthrough is always gradual because the invading leachate mixes with the remnant soil water through a process called mechanical dispersion.
Many of the waste constituents in the leachate are attenuated or retarded by the soil. For example, lead migrates very slowly through soil, while chloride and bromide ions mig ra t e very quick ly . Wi th no retardation or attenuation, breakthroughs would occur a t c/co of0.5 to 1 pore volume of flow and below (see Figure 2-1 11. With effective and total porosities equal, a much delayed breakthrough of chemicals
15
C
C
-
Leachate Concentration of Solute = C,
1
0.5
0
Concentration of Solute = c
Effluent
(for n = fie)
0 1 2
Pore Volumes of Flow
Figure 2-1 0. Effective porosities.
that have been absorbed or attenuated by the soil could be expected.
The best way to determine effective porosity is to perform a test using a ''tracer" ion that will not be absorbed significantly by the soil, such as chloride or bromide. If the breakthrough occurs in one pore volume of flow, the effective and total porosity is equal. If, instead, the breakthrough occurs at half a pore volume of flow, then the effective porosity is half the total porosity.
Molecular Diffusion Chemicals can pass through soil liners by molecular diffusion, a s well as by advective transport. One can study the molecular diffusion of chemicals in the soil by compacting soil in the bottom of an impermeable beaker and ponding waste liquid or leachate on top of
No Retardation Retardation
0 1 2 3
Pore Volumes of Flow
Figure 2-11. Effective porosity of soils with retardation and without retardation of waste ions.
the soil . At the s t a r t of t h e expe r imen t , t h e concentration c is equal to c, in the waste liquid. The soil is clean. Even though no water flows into the soil by advection, chemicals move into the soil by the process of molecular diffusion. Eventual ly , t he concentration of the waste liquid and the soil will be one and the same (see Figure 2-12).
0 CO
Concentration (c)
Figure 2-12. Molecular diffusion.
Calculat ions show t h a t a f t e r 10 to 30 y e a r s , molecular diffusion begins to transport the first molecules of waste 3 feet downwards through a compacted soil l iner . Accordingly, even with a perfectly impermeable l iner wi th 0 hydrau l i c conductivity, in 1 to 3 decades contaminants will begin to pass through the soil liner due to molecular diffusion.
The rate of diffusion is sensitive to a number of parameters. For conservative ions t h a t a r e not attenuated, the transfer time is 1 to 3 decades. For ions tha t a r e attenuated, transfer time is much longer. The mass rate of transport by molecular diffusion, however, is so slow tha t even though chemicals begin to show up in 1 to 3 decades, the total amount released per unit of area is small.
Flexible membrane liners permit the release of organics and vapors via molecular diffusion by
16

almost exactly the same process. Transport times for organic chemicals through FMLs typically range from a few hours to a few days.
Laboratory Tests for Hydraulic Conductivity The hydraulic conductivity of a soil liner is the key design parameter . The impor tan t var iables in hydraulic conductivity testing in the laboratory are:
Representativeness of the sample.
Degree of water saturation.
Stress conditions.
Confinement conditions.
0 Testing details.
Representativeness of Sample: Case Histories Representativeness of the soil sample being tested is the most crucial factor. Two case histories illustrate the importance and the difficulty of obtaining representative samples.
Klingerstown, PA A test pad constructed under EPA sponsorship in Klingerstown, Pennsylvania, consisted of a pad of clay soil 30 feet wide, 75 feet long, and 1 foot thick. The clay liner was built in three lifts, or layers, each lift being 4 inches thick. The liner was built up on a concrete pad so that researchers could crawl under and collect and measure the liquid coming out of the bottom. A shelter was built over the test pad and about 1 foot of water ponded over the surface.
The principal investigator, Dr. Andrew Rogowski, divided the collection uni t s in to a n u m b e r of subunits, each subunit measuring 3 feet by 3 feet. A total of 250 different collection units underneath the soil l i ne r were moni tored i n d e p e n d e n t l y to determine rate of flow. Dr. Rogowski's objective was to cor re la te t h e va r i ab i l i t y of t h e hydrau l i c conductivity of the liner with the molding water content of the soil and with the dry density of the compacted soil.
Dr. Rogowski also installed 60 1-foot diameter rings in the surface of the liner, so that he could measure independently 60 different infiltration rates on the surface of the liner. Each of the 3-square-foot (ft2) b locks was a s s i g n e d a n a v e r a g e h y d r a u l i c conductivity based on many months of testing and observation. Figure 2-13 shows the results. The zone a t the top of the diagram with a high hydraulic conductivity of 10-5 c d s e c probably resulted from
the way the liner was built. The sheepsfoot roller used to compact the liner probably bounced on the ramp causing lower compaction, which resulted in a relat ively h igh conduct iv i ty a t t h e e n d . T h e conductivity for the rest of the liner varies between 10-6 and 10-8 c d s e c , a 100-fold variation of hydraulic conductivity .
10-5 cm/s
10-6 cm/s
[IIII] 10-7 cmis
10-8 cm/s
7s n
30 ft
Figure 2-13. Hydraulic conductivity zones from Klingerstown, PA Tests.
For a laboratory test on this soil, the test specimen would need to measure about 3 inches in diameter and 3 inches in height. Finding a 3-inch diameter sample representative of this large mass of soil presents a challenge, since small samples from larger quantit ies of material inevitably vary in hydraulic conductivity.
D r . Rogowski's expe r imen t s r e su l t ed in two interesting sidelights. First, the average of all the hydraulic conductivities was 2 to 3 x 10⁻⁷ c d s e c . Dye was poured into the water inside some of the 1-foot diameter rings installed in the surface of the liner to determine if the dye came out directly beneath the ring or off to the side. In some cases i t came out directly beneath the ring and in some it wandered off to the side. It took only a few hours, however, for the dye to pass through the soil l iner, even with a n average conductivity only slightly greater than 1 x 10⁻⁷ c d s e c . A few preferential flow paths connected
17

to some of the rings allowed very rapid transit of the dye through the soil liner.
The second interesting sidelight was Dr. Rogowski’s conclusion that no relationship existed between in situ hydraulic conductivity and either molding water content of the soil or the dry density of the compacted soil.
The soil used in the experiment was a low plasticity sandy material with a PI of about 11 percent. The var ia t ions in hydraul ic conduct ivi ty probably reflected zones of material that contained more sand in some places and more clay in others. Tests have been performed on a couple of l iners in the field where liquid flowing into the soil l iners has been dyed and traced by cutting a cross section or trench through the liner. Typically, a pattern such as that shown in Figure 2-14 emerges, with the horizontal dots indicating lift interfaces. The results seem to indicate that dyed liquid finds a defect in the top lift, moves down and spreads along a more permeable zone between lifts; finds another defect, moves downward, spreads; finds another defect and so forth.
V
1 1 1 Figure 2-14. Liquid flow between lift interfaces in a soil liner.
The problem arises in determining from where a representative sample should be taken. Even if 25 samples were picked randomly in a grid pattern from that zone for 25 independent measures of hydraulic conductivity, it would be unclear how to arrive at a single representative measure. The flow through a 3- inch diameter specimen is much too small to mimic the patterns of fluid flow that occur in the field under similar conditions.
Houston, TX A second case his tory t h a t d e m o n s t r a t e s t h e difficulty of obtaining representat ive samples involves a trial pad constructed in Houston in 1986.
A 1-foot thick clay liner was compacted over a gravel underdrain with an area roughly 50 feet by 50 feet. The entire area of the liner was drained and the flow from an area roughly 16 feet by 16 feet was carefully collected and measured.
The liner was first built on top of the underdrain, the soil compacted with a padfoot roller, and water ponded on top of the liner. Infiltrometers measured the rate of inflow, and a lysimeter measured the rate of outflow. The soil used in the experiment w a s highly plastic with a PI of 41 percent.
The liner was compacted with two lifts, each 6 inches thick. A 1-ft3 block of soil was carved from the liner, and cylindrical test specimens were trimmed from upper and lower lifts and measured for hydraulic conductivity. A 3-inch diameter specimen also was cut, and hydraulic conductivity parallel to the lift interface was measured.
Table 2-3 summarizes the results of these various tests. The actual in situ hydraulic conductivity, a high 1 x 10⁻⁴ cmlsec, was verified both by the infil tration measurements and the underdrain measurements.
Table 2-3. Hydraulic Conductivities from Houston Liner Tests
Actual k: 1 x cmis
Lab K’s:
Location Sampler K (cm/s)
Lower Lift 3-in Tube 4 x 10⁻⁹
1 x 10⁻⁹
1 x 10⁻⁷
Lower Lift Block a x 10-5
Upper Lift Block 1 x 10⁻⁸
Upper Lift 3-in Tube
Lift Interface 3-in Tube
The tests were replicated under controlled conditions using soil collected from the liner in thin-walled 3- inch d i a m e t e r s ample tubes . T h e labora tory measures of hydraulic conductivity were consistently 1 x 10⁻⁹ c d s e c , five orders of magnitude lower than the field value of 1 x 10⁻⁴ c d s e c . The laboratory tests yielded a hydraulic conductivity 100,000 t imes different than that from the field test. Apparently the flow through the 3-inch specimens did not mimic flow on a larger scale through the entire soil liner. The sample trimmed horizontally at the lift interface was actually obtained by taking a %inch diameter sample from a sample collected with a 5-inch diameter tube. The hydraulic conductivity with flow parallel to the lift interface w a s two orders of magnitude higher.
Of all the values recorded from the lab tests, only the one obtained from the upper lift of the block sample was close to the field value of 1 x 10⁻⁴ cm/sec.
18
Apparently that one block sample happened to hit one of the more permeable zones and, more or less by accident, yielded a lab measurement tha t agreed with the field measurement.
Degree of Water Saturation The hydraulic conductivity obtained in a laboratory test also can be affected by the amount of gas present in the soil. Dry soils are less permeable than wet soils. A dry soil primarily is filled with air . Because invading water does not flow through air-filled voids, but only through water-filled voids, the dryness of a soil tends to lower permeability.
Some engineers believe that hydraulic conductivity tests on compacted clay soil should be performed on fully saturated soils in an attempt to measure the highest possible hydraulic conductivity. Most if not all of the gas can be eliminated from laboratory hydraul ic conductivity t e s t s by backpres su re saturation of the soil. This technique pressurizes the water inside the soil, compressing the gas and d i s so lv ing i t i n t h e w a t e r . I n c r e a s i n g t h e backpressure will increase the degree of water saturation and reduce the amount of a i r , thereby increasing hydraulic conductivity.
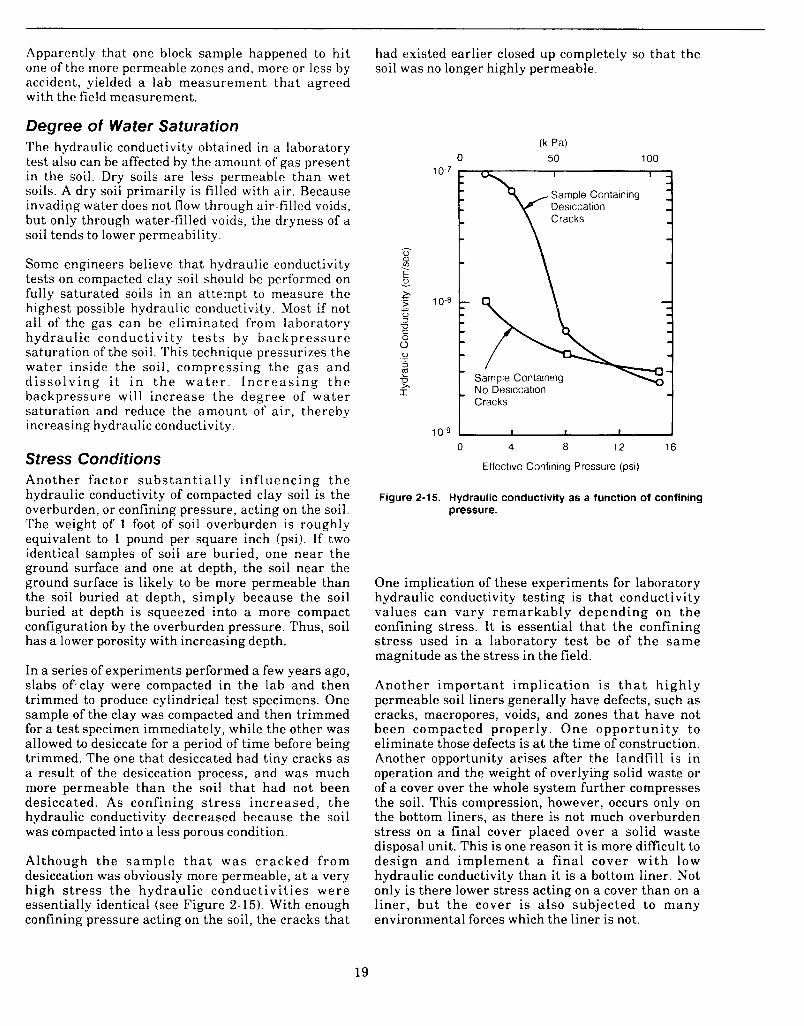
Stress Conditions Another factor subs t an t i a l ly inf luenc ing t h e hydraulic conductivity of compacted clay soil is the overburden, or confining pressure, acting on the soil. The weight of 1 foot of soil overburden is roughly equivalent to 1 pound per square inch (psi). If two identical samples of soil are buried, one near the ground surface and one at depth, the soil near the ground surface is likely to be more permeable than the soil buried a t depth, simply because the soil buried a t depth is squeezed into a more compact configuration by the overburden pressure. Thus, soil has a lower porosity with increasing depth.
In a series of experiments performed a few years ago, slabs of-clay were compacted in the lab and then trimmed to produce cylindrical test specimens. One sample of the clay was compacted and then trimmed for a test specimen immediately, while the other was allowed to desiccate for a period of time before being trimmed. The one that desiccated had tiny cracks as a result of the desiccation process, and was much more permeable than the soil tha t had not been desiccated. As confining s t r e s s increased , t h e hydraulic conductivity decreased because the soil was compacted into a less porous condition.
Although the sample t h a t w a s c racked f rom desiccation was obviously more permeable, at a very high s t ress the hydraul ic conduct ivi t ies were essentially identical (see Figure 2-15). With enough confining pressure acting on the soil, the cracks that
had existed earlier closed up completely so that the soil was no longer highly permeable.
10-7
10-8
(k Pa) 0 50 100
- Sample Containing - -
- - - - - - - -
No Desiccation Cracks
-
0 4 8 12 16
Effective Confining Pressure (psi)
Figure 2-15. Hydraulic conductivity as a function of confining pressure.
One implication of these experiments for laboratory hydraulic conductivity testing is that conductivity values can vary remarkably depending on the confining stress. I t is essential tha t the confining s t ress used in a laboratory test be of t he s a m e magnitude as the stress in the field.
Another impor tan t implication i s t h a t h ighly permeable soil liners generally have defects, such as cracks, macropores, voids, and zones that have not been compacted properly. One oppor tun i ty to eliminate those defects is at the time of construction. Another opportunity arises after the landfill is in operation and the weight of overlying solid waste or of a cover over the whole system further compresses the soil. This compression, however, occurs only on the bottom liners, as there is not much overburden stress on a final cover placed over a solid waste disposal unit. This is one reason it is more difficult to design and implement a f inal cover wi th low hydraulic conductivity than it is a bottom liner. Not only is there lower stress acting on a cover than on a l iner, bu t the cover is a lso subjected to many environmental forces which the liner is not.
19
Double-ring and Flexible Wall Permeameters
A double-ring permeameter separates flow t h a t occurs through the central part of the soil sample from flow t h a t occurs nea r the s ide wall . The permeameter is designed such that a ring sticks into the bottom of the soil sample, thereby detecting sidewall leakage that might invalidate the results of laboratory conductivity tests. Almost all of the rigid wall permeameters now being instal led in the University of Texas laboratories have double rings. Another kind of permeameter cell is a flexible-wall permeameter in which the soil specimen is confined by a thin, flexible membrane, usually made of latex. The latex membrane conforms to any irregularities in the sample, a n advantage when co l lec t ing irregularly shaped specimens from the field.
Termination Criteria
When conducting laboratory hydraulic conductivity tests, two criteria should be met before testing is terminated. First, the rate of inflow should be within 10 percent of the rate of outflow. Measuring both the rate of inflow and the rate of outflow is necessary to detect problems such as a leak in the system o r evaporation from one of the reservoirs. Second, a plot of hydraulic conductivity versus time or pore volume of flow should essentially level off, indicating tha t hydraulic conductivity is steady.
ASTM has no s tandards at the present time for testing low-hydraulic- conductivity soil, but is in the final stages of developing a standard for tests with flexible wall permeameters that should be available within the next 2 years.
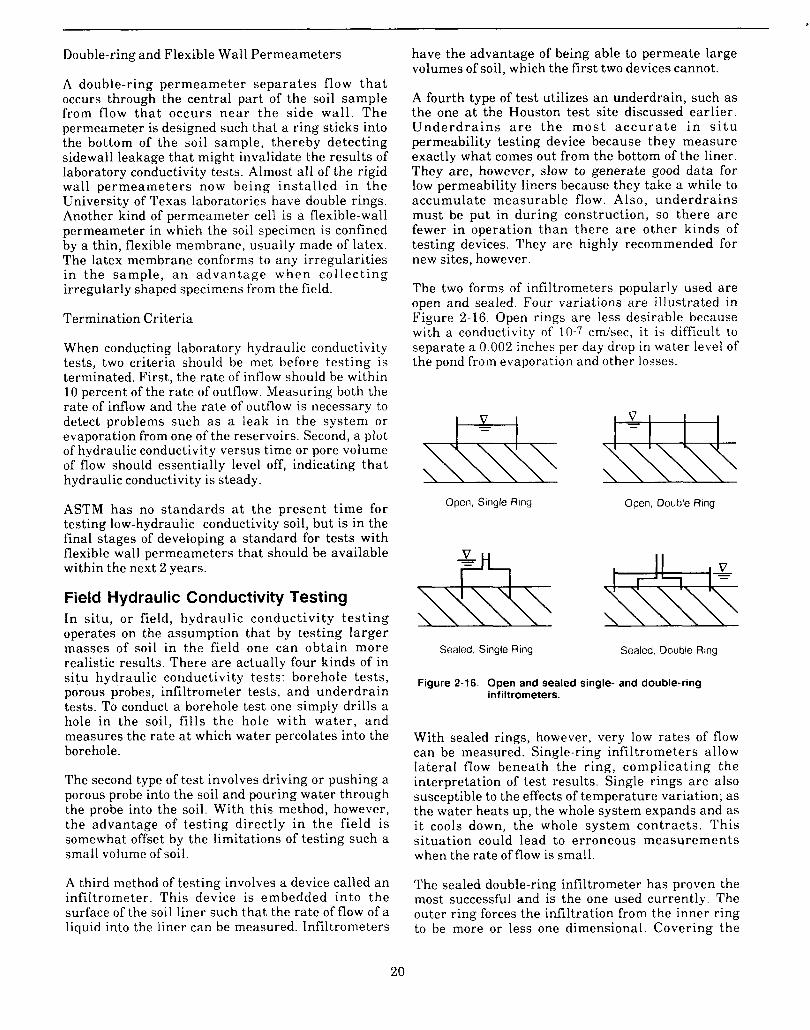
Field Hydraulic Conductivity Testing In si tu, or field, hydraulic conductivity tes t ing operates on the assumption that by testing larger masses of soil in the field one can obtain more realistic results. There are actually four kinds of in si tu hydraulic conductivity tests: borehole tests, porous probes, infiltrometer tests, and underdrain tests. To conduct a borehole test one simply drills a hole in the soil, fills the hole with water , and measures the rate a t which water percolates into the borehole.
The second type of test involves driving or pushing a porous probe into the soil and pouring water through the probe into the soil. With this method, however, the advantage of testing directly in the field is somewhat offset by the limitations of testing such a small volume of soil.
A third method of testing involves a device called an infiltrometer. This device is embedded into the surface of the soil liner such that the rate of flow of a liquid into the liner can be measured. lnfiltrometers
have the advantage of being able to permeate large volumes of soil, which the first two devices cannot.
A fourth type of test utilizes a n underdrain, such as the one at the Houston test site discussed earlier. U n d e r d r a i n s a r e t h e m o s t a c c u r a t e i n s i t u permeability testing device because they measure exactly what comes out from the bottom of the liner. They are, however, slow to generate good data for low permeability liners because they take a while to accumulate measurable flow. Also, underdra ins must be put in during construction, so there a re fewer in operation than there a re other kinds of testing devices. They are highly recommended for new sites, however.
The two forms of infiltrometers popularly used are open and sealed. Four variations are illustrated in Figure 2-16. Open rings are less desirable because with a conductivity of 10-7 cmlsec, it is difficult to separate a 0.002 inches per day drop in water level of the pond from evaporation and other losses.
Open, Single Ring Open, Double Ring
Sealed, Single Ring Sealed, Double Ring
Figure 2-16. Open and sealed single- and double-ring inf iltrometers.
With sealed rings, however, very low rates of flow can be measured. Single-ring infiltrometers allow lateral flow beneath the ring, complicating the interpretation of test results. Single rings are also susceptible to the effects of temperature variation; as the water heats up, the whole system expands and as i t cools down, the whole system contracts. This si tuation could lead to erroneous measurements when the rate of flow is small.
The sealed double-ring infiltrometer has proven the most successful and is the one used currently. The outer ring forces the infiltration from the inner ring to be more or less one dimensional. Covering the
20
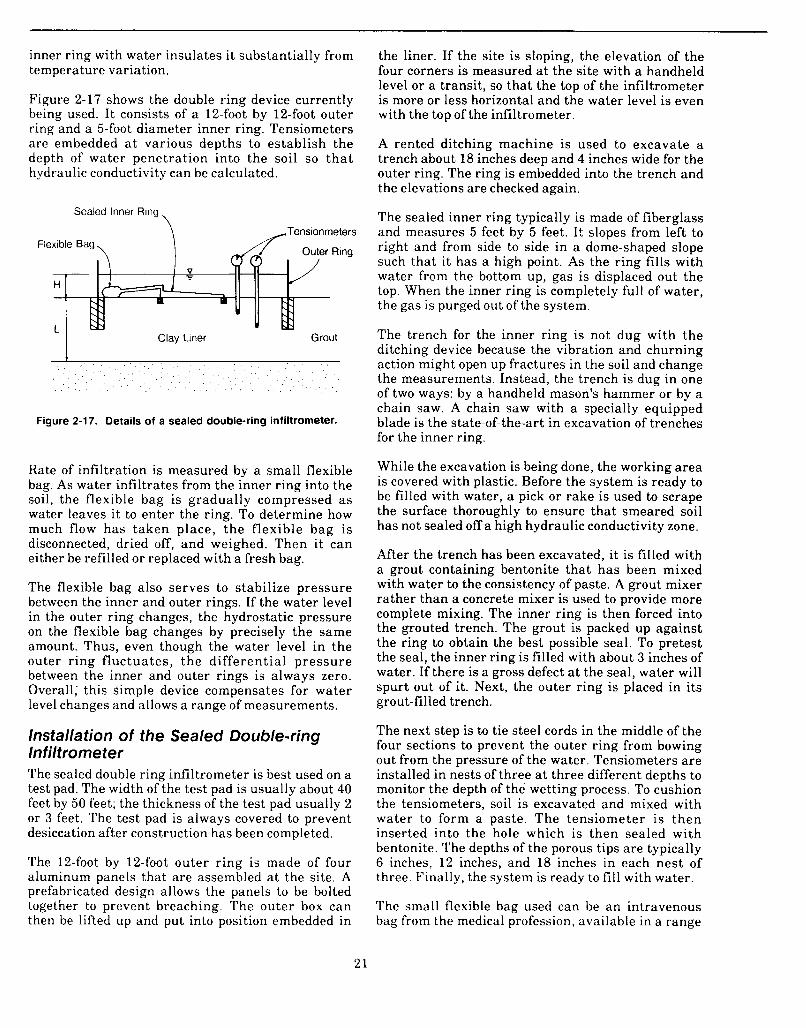
inner ring with water insulates i t substantially from temperature variation.
Figure 2-17 shows the double ring device currently being used. It consists of a 12-foot by 12-foot outer ring and a 5-foot diameter inner ring. Tensiometers are embedded at various depths to establish the depth of water penetration into the soil so tha t hydraulic conductivity can be calculated.
\ Sealed Inner Ring
\ ,Tensionmeters
Clay Liner Grout
Figure 2-1 7. Details of a sealed double-ring infiltrometer.
Rate of infiltration is measured by a small flexible bag. As water infiltrates from the inner ring into the soil, the flexible bag is gradually compressed as water leaves it to enter the ring. To determine how much flow has taken place, the flexible bag is disconnected, dried off, and weighed. Then it can either be refilled or replaced with a fresh bag.
The flexible bag also serves to stabilize pressure between the inner and outer rings. If the water level in the outer ring changes, the hydrostatic pressure on the flexible bag changes by precisely the same amount. Thus, even though the water level in the outer ring fluctuates, the differential pressure between the inner and outer rings is always zero. Overall; this simple device compensates for water level changes and allows a range of measurements.
lnstallation of the Sealed Double-ring lnfiltrometer The sealed double ring infiltrometer is best used on a test pad. The width of the test pad is usually about 40 feet by 50 feet; the thickness of the test pad usually 2 or 3 feet. The test pad is a lways covered to prevent desiccation after construction has been completed.
The 12-foot by 12-foot outer ring is made of four aluminum panels that are assembled a t the site. A prefabricated design allows the panels to be bolted together to prevent breaching. The outer box can then be lifted up and put into position embedded in
the liner. If the site is sloping, the elevation of the four corners is measured at the site with a handheld level or a transit, so that the top of the infiltrometer is more or less horizontal and the water level is even with the top of the infiltrometer.
A rented ditching machine is used to excavate a trench about 18 inches deep and 4 inches wide for the outer ring. The ring is embedded into the trench and the elevations are checked again.
The sealed inner ring typically is made of fiberglass and measures 5 feet by 5 feet. I t slopes from left to right and from side to side in a dome-shaped slope such that it has a high point. As the ring fills with water from the bottom up, gas is displaced out the top. When the inner ring is completely full of water, the gas is purged out of the system.
The trench for the inner ring is not dug with the ditching device because the vibration and churning action might open up fractures in the soil and change the measurements. Instead, the trench is dug in one of two ways: by a handheld mason's hammer or by a chain saw. A chain saw with a specially equipped blade is the state-of-the-art in excavation of trenches for the inner ring.
While the excavation is being done, the working area is covered with plastic. Before the system is ready to be filled with water, a pick or rake is used to scrape the surface thoroughly to ensure that smeared soil has not sealed off a high hydraulic conductivity zone.
After the trench has been excavated, it is filled with a grout containing bentonite that has been mixed with water to the consistency of paste. A grout mixer rather than a concrete mixer is used to provide more complete mixing. The inner ring is then forced into the grouted trench. The grout is packed up against the ring to obtain the best possible seal. To pretest the seal, the inner ring is filled with about 3 inches of water. If there is a gross defect a t the seal, water will spurt out of it. Next, the outer ring is placed in its grout-filled trench.
The next step is to tie steel cords in the middle of the four sections to prevent the outer ring from bowing out from the pressure of the water. Tensiometers are installed in nests of three a t three different depths to monitor the depth of the wetting process. To cushion the tensiometers, soil is excavated and mixed with water to form a paste. The tensiometer is then inserted into the hole which is then sealed with bentonite. The depths of the porous tips are typically 6 inches, 12 inches, and 18 inches in each nest of three. Finally, the system is ready to fill with water.
The small flexible bag used can be an intravenous bag from the medical profession, available in a range
21
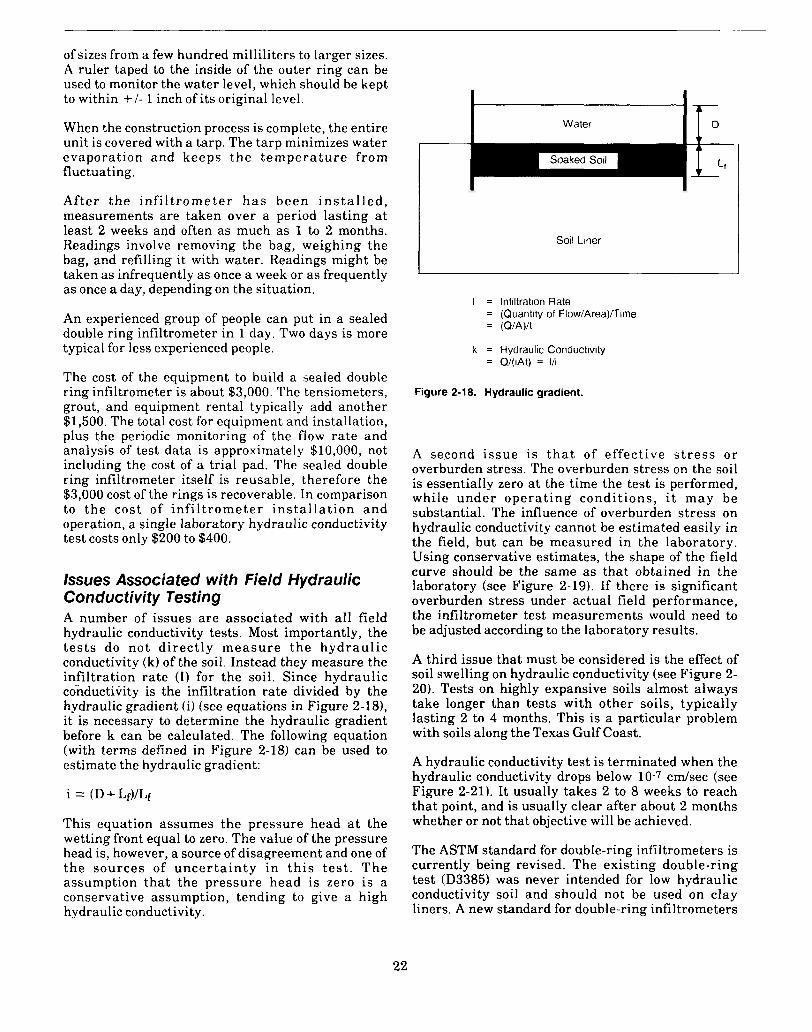
of sizes from a few hundred milliliters to larger sizes. A ruler taped to the inside of the outer ring can be used to monitor the water level, which should be kept to within +/- 1 inch of its original level.
When the construction process is complete, the entire unit is covered with a tarp. The tarp minimizes water evaporation and keeps t h e t e m p e r a t u r e f rom fluctuating.
After t h e in f i l t rome te r h a s been i n s t a l l e d , measurements are taken over a period lasting a t least 2 weeks and often as much as 1 to 2 months. Readings involve removing the bag, weighing the bag, and refilling it with water. Readings might be taken as infrequently as once a week or as frequently as once a day, depending on the situation.
An experienced group of people can put in a sealed double ring infiltrometer in 1 day. Two days is more typical for less experienced people.
The cost of the equipment to build a sealed double ring infiltrometer is about $3,000. The tensiometers, grout, and equipment rental typically add another $1,500. The total cost for equipment and installation, plus the periodic monitoring of the flow rate and analysis of test data is approximately $10,000, not including the cost of a trial pad. The sealed double ring infiltrometer itself is reusable, therefore the $3,000 cost of the rings is recoverable. In comparison to the cost of i n f i l t rome te r i n s t a l l a t ion and operation, a single laboratory hydraulic conductivity test costs only $200 to $400.
Issues Associated with Field Hydraulic Conductivity Testing A number of issues a re associated with all field hydraulic conductivity tests. Most importantly, the t e s t s do not d i rec t ly measu re the hydrau l i c conductivity (k) of the soil. Instead they measure the infiltration rate (I) for the soil. Since hydraulic conductivity is the infiltration rate divided by the hydraulic gradient (i) (see equations in Figure 2-18), it is necessary to determine the hydraulic gradient before k can be calculated. The following equation (with terms defined in Figure 2-18) can be used to estimate the hydraulic gradient:
i = (D+ Lf)/Lf
This equation assumes the pressure head at the wetting front equal to zero. The value of the pressure head is, however, a source of disagreement and one of t he sources of unce r t a in ty in th i s t e s t . The assumption tha t the pressure head is zero is a conservative assumption, tending to give a high hydraulic conductivity.
I
Soil Liner
I = infiltration Rate = (Quantity of Flow/Area)TTime = (QiA)/t
k = Hydraulic Conductivity = Q/(iAt) = iii
Figure 2-18. Hydraulic gradient.
A second i ssue is t h a t of effect ive s t r e s s o r overburden stress. The overburden stress on the soil is essentially zero a t the time the test is performed, while under opera t ing condi t ions, i t may be substantial. The influence of overburden stress on hydraulic conductivity cannot be estimated easily in the field, but can be measured in the laboratory. Using conservative estimates, the shape of the field curve should be the same as that obtained in the laboratory (see Figure 2-19). If there is significant overburden stress under actual field performance, the infiltrometer test measurements would need to be adjusted according to the laboratory results.
A third issue that must be considered is the effect of soil swelling on hydraulic conductivity (see Figure 2- 20). Tests on highly expansive soils almost always take longer than tests with other soils, typically lasting 2 to 4 months. This is a particular problem with soils along the Texas Gulf Coast.
A hydraulic conductivity test is terminated when the hydraulic conductivity drops below 10-7 c d s e c (see Figure 2-21). It usually takes 2 to 8 weeks to reach that point, and is usually clear after about 2 months whether or not that objective will be achieved.
The ASTM standard for double-ring infiltrometers is currently being revised. The existing double-ring test (D3385) was never intended for low hydraulic conductivity soil and should not be used on clay liners. A new standard for double-ring infiltrometers
22
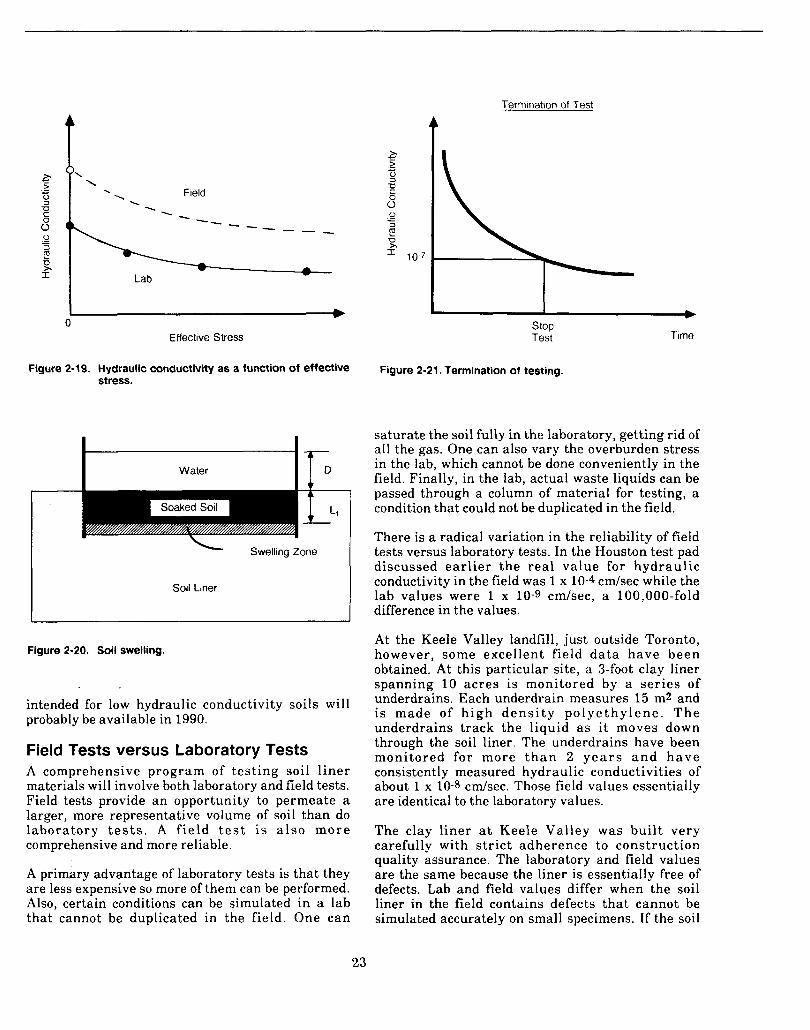
I w 0
Effective Stress
Figure 2-19. Hydraulic conductivity as a function of effective stress.
Swelling Zone
Soil Liner
Figure 2-20. Soil swelling.
intended for low hydraulic conductivity soils will probably be available in 1990.
Field Tests versus Laboratory Tests A comprehensive program of tes t ing soil l iner materials will involve both laboratory and field tests. Field tests provide a n opportunity to permeate a larger, more representative volume of soil than do laboratory tests. A f ie ld t e s t is a l s o m o r e comprehensive and more reliable.
A primary advantage of laboratory tests is that they are less expensive so more of them can be performed. Also, certain conditions can be simulated in a lab that cannot be duplicated in the field. One can
Termination of Test
stop Test Time
Figure 2-21. Termination of testing.
saturate the soil fully in the laboratory, getting rid of all the gas. One can also vary the overburden stress in the lab, which cannot be done conveniently in the field. Finally, in the lab, actual waste liquids can be passed through a column of material for testing, a condition that could not be duplicated in the field.
There is a radical variation in the reliability of field tests versus laboratory tests. In the Houston test pad discussed ear l ie r the real value for hydraul ic conductivity in the field was 1 x 10⁻⁴ c d s e c while the lab values were 1 x 10⁻⁹ cm/sec, a 100,000-fold difference in the values.
At the Keele Valley landfill, just outside Toronto, however, some excellent field d a t a have been obtained. At this particular site, a %foot clay liner spanning 10 acres is monitored by a ser ies of underdrains. Each underdrain measures 15 m2 and i s made of h igh d e n s i t y p o l y e t h y l e n e . T h e underdrains track the liquid a s it moves down through the soil liner. The underdrains have been monitored for more t h a n 2 y e a r s a n d h a v e consistently measured hydraulic conductivities of about 1 x 10⁻⁸ c d s e c . Those field values essentially are identical to the laboratory values.
The clay l iner at Keele Valley w a s bui l t very carefully with s t r ic t adherence to construction quality assurance. The laboratory and field values are the same because the liner is essentially free of defects. Lab and field values differ when the soil liner in the field contains defects that cannot be simulated accurately on small specimens. If the soil
23
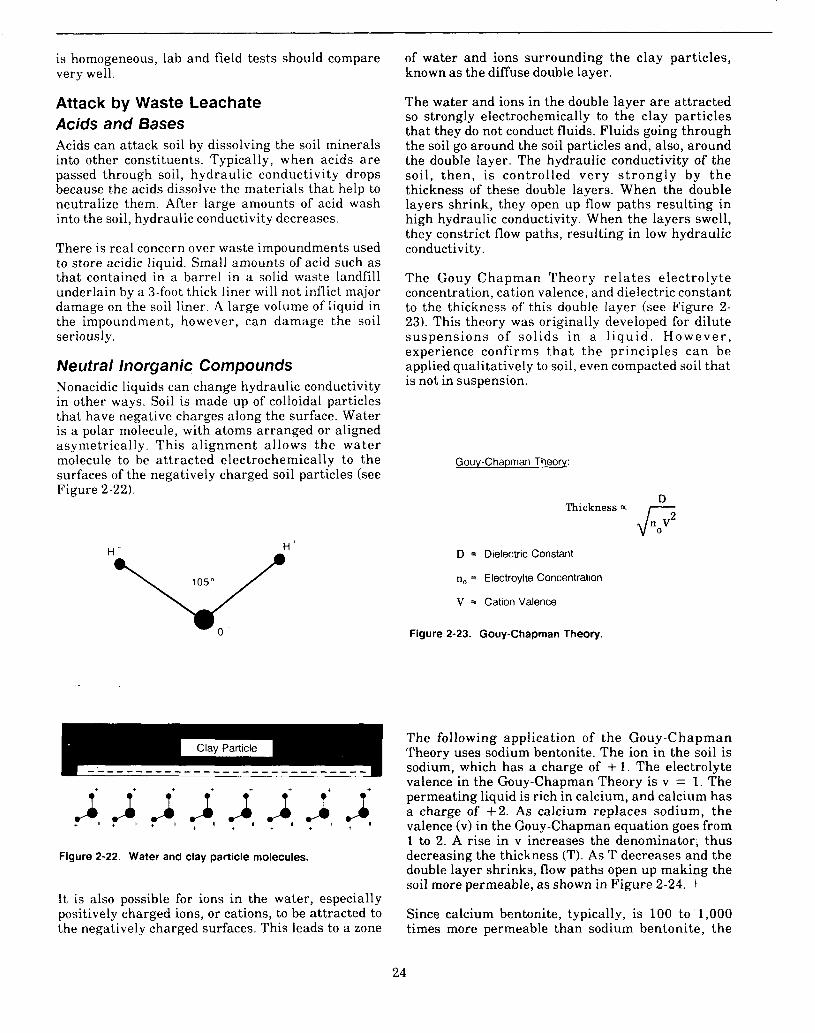
is homogeneous, lab and field tests should compare very well.
Attack by Waste Leachate Acids and Bases Acids can attack soil by dissolving the soil minerals into other constituents. Typically, when acids a re passed through soil, hydraulic conductivity drops because the acids dissolve the materials that help to neutralize them. After large amounts of acid wash into the soil, hydraulic conductivity decreases.
There is real concern over waste impoundments used to store acidic liquid. Small amounts of acid such as that contained in a barrel in a solid waste landfill underlain by a 3-foot thick liner will not inflict major damage on the soil liner. A large volume of liquid in the impoundment, however, can damage the soil seriously.
Neutral Inorganic Compounds Nonacidic liquids can change hydraulic conductivity in other ways. Soil is made up of colloidal particles that have negative charges along the surface. Water is a polar molecule, with atoms arranged or aligned asymetrically. This alignment allows the water molecule to be attracted electrochemically to the surfaces of the negatively charged soil particles (see Figure 2-22).
Figure 2-22. Water and clay particle molecules.
I t is also possible for ions in the water, especially positively charged ions, or cations, to be attracted to the negatively charged surfaces. This leads to a zone
of water and ions surrounding the clay particles, known as the diffuse double layer.
The water and ions in the double layer are attracted so strongly electrochemically to the clay particles that they do not conduct fluids. Fluids going through the soil go around the soil particles and, also, around the double layer. The hydraulic conductivity of the soil, then , is controlled very s t rong ly by t h e thickness of these double layers. When the double layers shrink, they open up flow paths resulting in high hydraulic conductivity. When the layers swell, they constrict flow paths, resulting in low hydraulic conductivity.
The Gouy-Chapman Theory relates electrolyte concentration, cation valence, and dielectric constant to the thickness of this double layer (see Figure 2- 23). This theory was originally developed for dilute suspens ions of sol ids in a l i qu id . However , experience confirms tha t the principles can be applied qualitatively to soil, even compacted soil that is not in suspension.
Gouv-Chapman:
gz Thickness Q
D = Dielectric Constant
no = Electroylte Concentration
V = Cation Valence
Figure 2-23. Gouy-Chapman Theory.
The following application of the Gouy-Chapman Theory uses sodium bentonite. The ion in the soil is sodium, which has a charge of + 1 . The electrolyte valence in the Gouy-Chapman Theory is v = 1. The permeating liquid is rich in calcium, and calcium has a charge of +2. As calcium replaces sodium, the valence (v) in the Gouy-Chapman equation goes from 1 to 2. A rise in v increases the denominator, thus decreasing the thickness (TI. As T decreases and the double layer shrinks, flow paths open up making the soil more permeable, as shown in Figure 2-24. !
Since calcium bentonite, typically, is 100 to 1,000 times more permeable than sodium bentonite, the
24
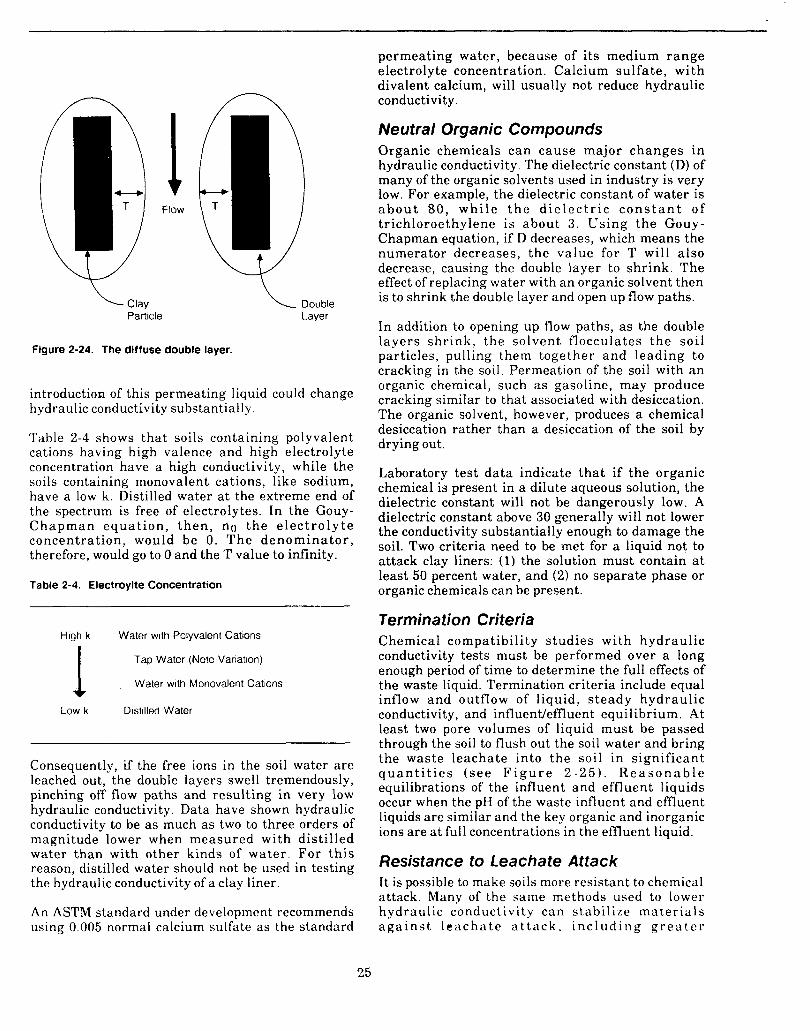
Clay Particle
\ Double Layer
Figure 2-24. The diffuse double layer.
introduction of this permeating liquid could change hydraulic conductivity substantially.
Table 2-4 shows tha t soils containing polyvalent cations having high valence and high electrolyte concentration have a high conductivity, while the soils containing monovalent cations, like sodium, have a low k. Distilled water at the extreme end of the spectrum is free of electrolytes. In the Gouy- C h a p m a n equa t ion , t h e n , no the e l ec t ro ly t e concentration, would be 0. T h e denomina to r , therefore, would go to 0 and the T value to infinity.
Table 2-4. Electroylte Concentration
High k Water with Polyvalent Cations
Tap Water (Note Variation)
Water with Monovalent Cations
Distilled Water
1 Low k
Consequently, if the free ions in the soil water are leached out, the double layers swell tremendously, pinching off flow paths and resulting in very low hydraulic Conductivity. Data have shown hydraulic conductivity to be as much as two to three orders of magnitude lower when measured with disti l led water than with other kinds of water . For th i s reason, distilled water should not be used in testing the hydraulic conductivity of a clay liner.
An ASTM standard under development recommends using 0.005 normal calcium sulfate as the standard
permeating water, because of its medium range electrolyte concentration. Calcium sulfate , with divalent calcium, will usually not reduce hydraulic conductivity.
Neutral Organic Compounds Organic chemicals can cause major changes in hydraulic conductivity. The dielectric constant (D) of many of the organic solvents used in industry is very low. For example, the dielectric constant of water is a b o u t 80, w h i l e t h e d i e l e c t r i c c o n s t a n t of trichloroethylene is about 3 . Using the Gouy- Chapman equation, if D decreases, which means the numerator decreases, t he value for T will also decrease, causing the double layer to shr ink. The effect of replacing water with an organic solvent then is to shrink the double layer and open up flow paths.
In addition to opening up flow paths, as the double layers shr ink , the solvent flocculates t h e soi l particles, pulling them together and leading to cracking in the soil. Permeation of the soil with an organic chemical, such as gasoline, may produce cracking similar to that associated with desiccation. The organic solvent, however, produces a chemical desiccation rather than a desiccation of the soil by drying out.
Laboratory test da ta indicate tha t if the organic chemical is present in a dilute aqueous solution, the dielectric constant will not be dangerously low. A dielectric constant above 30 generally will not lower the conductivity substantially enough to damage the soil. Two criteria need to be met for a liquid not to attack clay liners: (1) the solution must contain at least 50 percent water, and (2) no separate phase or organic chemicals can be present.
Termination Criteria Chemical compatibility s tudies with hydraul ic conductivity tests must be performed over a long enough period of time to determine the full effects of the waste liquid. Termination criteria include equal inflow and outflow of l iquid, s teady hydraul ic conductivity, and influentleffluent equilibrium. At least two pore volumes of liquid must be passed through the soil to flush out the soil water and bring the waste leachate into the soil in significant q u a n t i t i e s ( s e e F i g u r e 2 - 2 5 ) . R e a s o n a b l e equilibrations of the influent and effluent liquids occur when the pH of the waste influent and effluent liquids are similar and the key organic and inorganic ions are at full concentrations in the effluent liquid.
Resistance to Leachate Attack It is possible to make soils more resistant to chemical attack. Many of the same methods used to lower h y d rau 1 ic conduct i vi t y can s tab i 1 i ~e ma t e r i a 1 s a g a i n s t 1 e a c h a t e a t t a c k , i nc 1 lid i n g g r e a t c I'
25
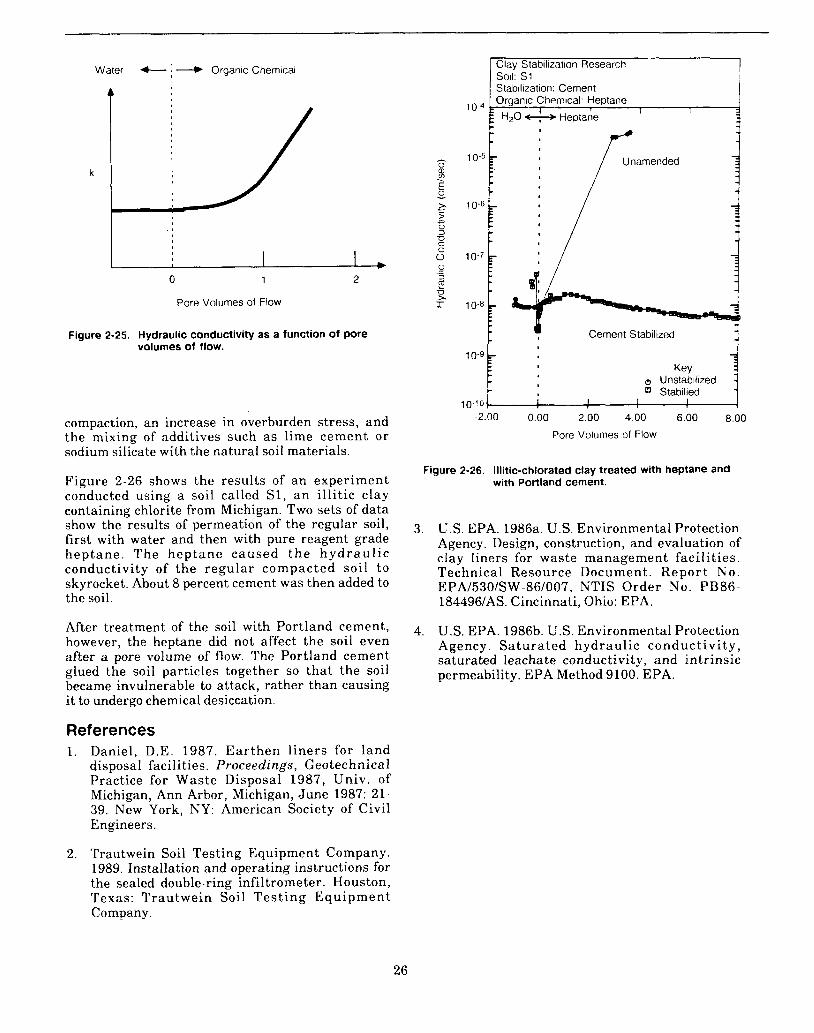
Water + .--) Organic Chemical
I I , 0 1 2
Pore Volumes of Flow
Figure 2-25. Hydraulic conductivity as a function of pore volumes of flow.
compaction, an increase in overburden stress, and the mixing of additives such a s lime cement or sodium silicate with the natural soil materials.
Figure 2-26 shows the results of a n experiment conducted using a soil called S1, a n i l l i t ic clay containing chlorite from Michigan. Two sets of data show the results of permeation of the regular soil, first with water and then with pure reagent grade hep tane . The hep tane caused t h e h y d r a u l i c conductivity of the regular compacted soi l to skyrocket. About 8 percent cement was then added to the soil.
After treatment of the soil with Portland cement, however, the heptane did not affect the soil even after a pore volume of flow. The Portland cement glued the soil particles together so tha t the soil became invulnerable to attack, rather than causing i t to undergo chemical desiccation.
References 1 . Daniel, D.E. 1987. Ea r then l iners for land
disposal facilities. Proceedings, Geotechnical Practice for Waste Disposal 1987, Univ. of Michigan, Ann Arbor, Michigan, June 1987: 21- 39. New York, NY: American Society of Civil Engineers.
Trautwein Soil Testing Equipment Company. 1989. Installation and operating instructions for the sealed double-ring infiltrometer. Houston, Texas: Trautwein Soil Tes t ing Equ ipmen t Company.
2.
t;
Clay Stabilization Research soil. s1 Stabilization: Cement Organic Chemical: Heptane I
10 4
H,O 4 Heptane I I
10-6
lo-\
t
r'
: /
Unamended
Cement Stabilized
-2.00 0.00 2.00 4.00 6.00 8.00 Pore Volumes of Flow
Figure 2-26. Illitic-chlorated clay treated with heptane and with Portland cement.
3. U.S. EPA. 1986a. U.S. Environmental Protection Agency. Design, construction, and evaluation of clay liners for waste management facil i t ies. Technical Resource Document. Repor t N o . EPA/530/SW-86/007, NTIS Order No. PB86- 184496/AS. Cincinnati, Ohio: EPA.
4. U.S. EPA. 298613. U.S. Environmental Protection Agency. Sa tu ra t ed hydraul ic conduct iv i ty , saturated leachate conductivity, and intrinsic permeability. EPA Method 9100. EPA.
26
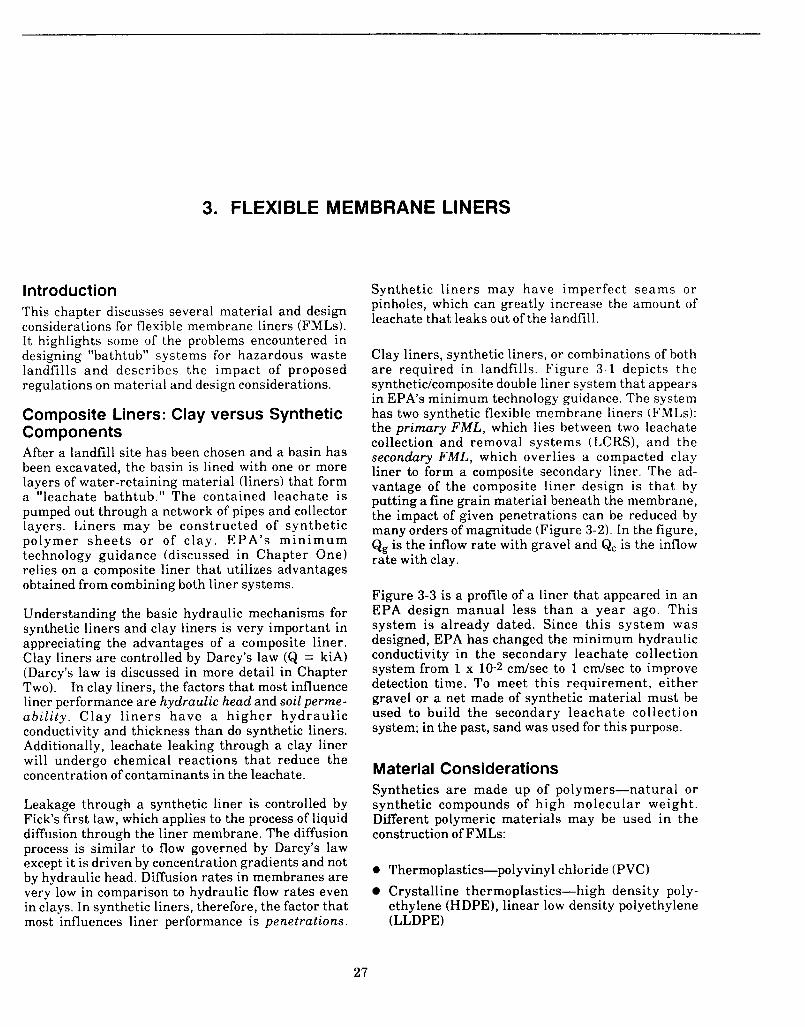
3. FLEXIBLE MEMBRANE LINERS
Introduction This chapter discusses several material and design considerations for flexible membrane liners (FMLs). I t highlights some of the problems encountered in designing "bathtub" systems for hazardous waste landfills and describes the impact of proposed regulations on material and design considerations.
Composite Liners: Clay versus Synthetic Components After a landfill site has been chosen and a basin has been excavated, the basin is lined with one or more layers of water-retaining material (liners) that form a "leachate bathtub." The contained leachate is pumped out through a network of pipes and collector layers. Liners may be constructed of synthet ic polymer s h e e t s or of c lay . EPA ' s m i n i m u m technology guidance (discussed in Chapter One) relies on a composite liner that utilizes advantages obtained from combining both liner systems.
Understanding the basic hydraulic mechanisms for synthetic liners and clay liners is very important in appreciating the advantages of a composite liner. Clay liners a re controlled by Darcy's law (Q = kiA) (Darcy's law is discussed in more detail in Chapter Two). In clay liners, the factors that most influence liner performance are hydraulic head and soil perme- a b i l i t y . Clay l i ne r s have a h igher hydraul ic conductivity and thickness than do synthetic liners. Additionally, leachate leaking through a clay liner will undergo chemical reactions tha t reduce the concentration of contaminants in the leachate.
Leakage through a synthetic liner is controlled by Fick's first law, which applies to the process of liquid diffusion through the liner membrane. The diffusion process is similar to flow governed by Darcy's law except it is driven by concentration gradients and not by hydraulic head. Diffusion rates in membranes are very low in comparison to hydraulic flow rates even in clays. In synthetic liners, therefore, the factor that most influences liner performance is penetrations.
Synthetic l iners may have imperfect seams o r pinholes, which can greatly increase the amount of leachate that leaks out of the landfill.
Clay liners, synthetic liners, or combinations of both a re required in landfills. Figure 3-1 depicts the syntheticlcomposite double liner system that appears in EPA's minimum technology guidance. The system has two synthetic flexible membrane liners (FMLs): the primary F M L , which lies between two leachate collection and removal systems (LCRS), and the secondary F M L , which overlies a compacted clay liner to form a composite secondary liner. The ad- vantage of the composite l iner design is tha t by putting a fine grain material beneath the membrane, the impact of given penetrations can be reduced by many orders of magnitude (Figure 3-2). In the figure, Qg is the inflow rate with gravel and Qc is the inflow rate with clay.
Figure 3-3 is a profile of a liner that appeared in an EPA design manual less than a year ago. This system is already dated. Since th i s system was designed, EPA has changed the minimum hydraulic conductivity in the secondary leachate collection system from 1 x 10⁻² c d s e c to 1 c d s e c to improve detection time. To meet this requirement, ei ther gravel or a net made of synthetic material must be used to build the secondary leachate collection system; in the past, sand was used for this purpose.
Material Considerations Synthetics a re made up of polymers-natural or synthetic compounds of high molecular weight. Different polymeric materials may be used in the construction of FMLs:
0 Thermoplastics-polyvinyl chloride (PVC) Crystalline thermoplastics-high density poly- ethylene (HDPE), linear low density polyethylene (LLDPE)
27
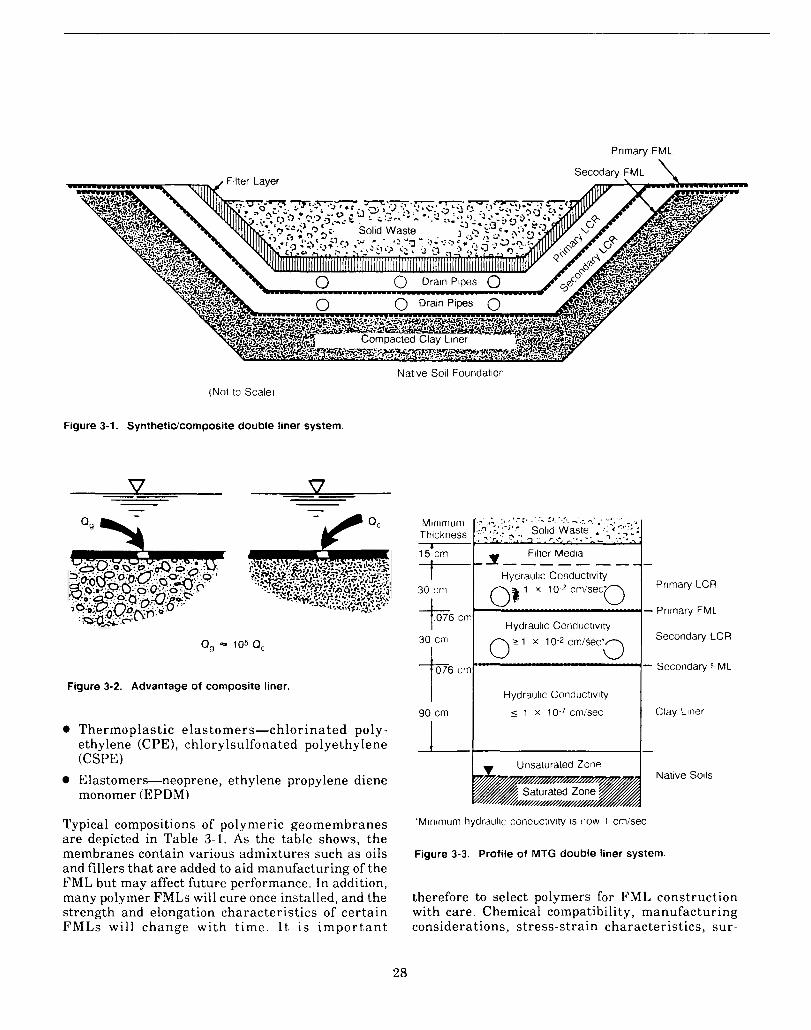
Native Soil Foundation
(Not to Scale)
Figure 3-1. Synthetidcomposite double liner system.
-rf Qc
Q, 105 Q,
Figure 3-2. Advantage of composite liner.
0 T her mop 1 as t ic e 1 as t o me r s-c hlo r i n a t ed PO 1 y- ethylene (CPE), chlorylsulfonated polyethylene (CSPE) Elastomers-neoprene, ethylene propylene diene monomer (EPDM)
Typical compositions of polymeric geomembranes are depicted in Table 3-1. A s the table shows, the membranes contain various admixtures such as oils and fillers that are added to aid manufacturing of the FML but may affect future performance. In addition, many polymer FMLs will cure once installed, and the strength and elongation characteristics of certain F M L s will change with t ime. I t is impor t an t
15 cm Filter Media
I I Hvdraulic Conductivity I
3~~ cml x 10-7 cmiseQ I Hydraulic Conductivib
Primary LCR
- Primary FML
Secondary LCR
'- Secondary FML
Hydraulic Conductivity 5 1 x 10.7 cmisec Clay Liner
.- Unsaturated Zone
Native Soils
'Minimum hydraulic conductivity is now 1 cmisec
Figure 3-3. Profile of MTG double liner system.
therefore to select polymers for FML construction with care. Chemical compatibility, manufacturing considerations, stress-strain characteristics, sur -
28
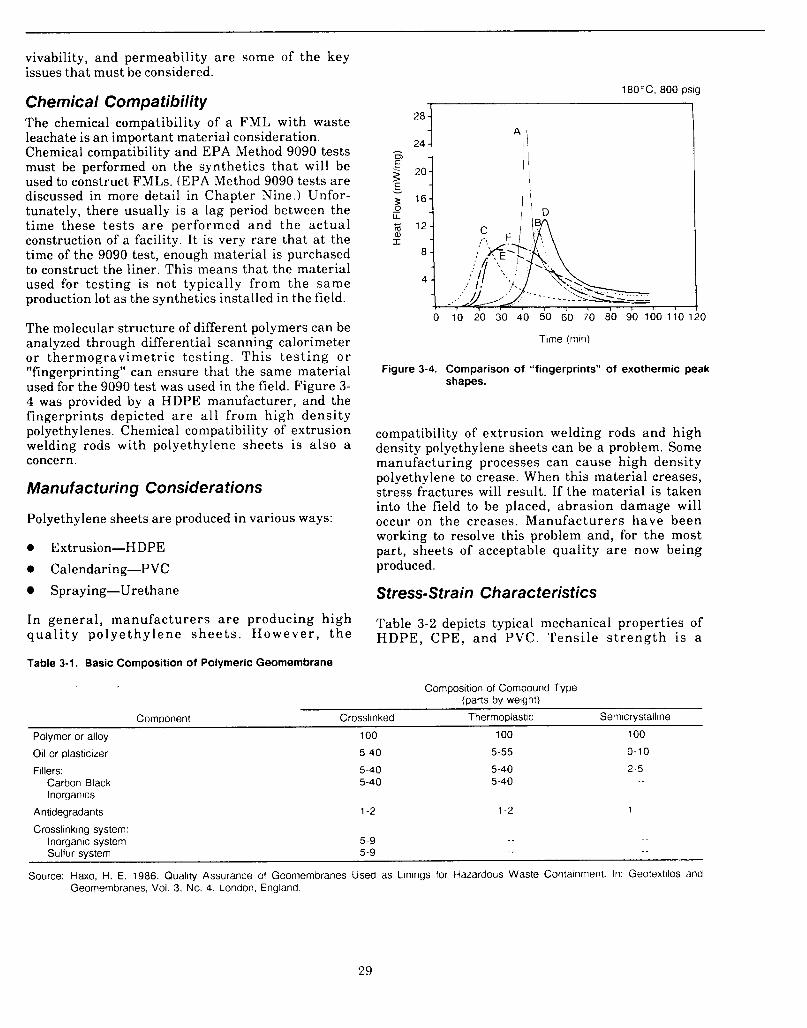
vivability, and permeability a r e some of the key issues that must be considered.
Chemical Compatibility The chemical compatibility of a FML with waste leachate is a n important material consideration. Chemical compatibility and EPA Method 9090 tests must be performed on the synthetics tha t will be used to construct FMLs. (EPA Method 9090 tests are discussed in more detail in Chapter Nine.) Unfor- tunately, there usually is a lag period between the time these tes t s a r e performed and the actual construction of a facility. It is very rare that a t the time of the 9090 test, enough material is purchased to construct the liner. This means that the material used for testing is not typically from the same production lot as the synthetics installed in the field.
The molecular structure of different polymers can be analyzed through differential scanning calorimeter o r thermogravimetr ic tes t ing. This t e s t ing o r "fingerprinting" can ensure that the same material used for the 9090 test was used in the field. Figure 3- 4 was provided by a HDPE manufacturer, and the fingerprints depicted a r e a l l from high densi ty polyethylenes. Chemical compatibility of extrusion welding rods with polyethylene sheets is a lso a concern.
Manufacturing Considerations
Polyethylene sheets are produced in various ways:
0 Extrusion-HDPE 0 Calendaring-PVC
Spraying-Urethane
In general , manufacturers a r e producing high q u a l i t y po lye thy lene s h e e t s . However , t h e
Table 3-1. Basic Composition of Polymeric Geomembrane
180"C, 800 psig - 28 -
Time (min)
Figure 3-4. Comparison of "fingerprints" of exothermic peak shapes.
compatibility of extrusion welding rods and high density polyethylene sheets can be a problem. Some manufacturing processes can cause high density polyethylene to crease. When this material creases, stress fractures will result. If the material is taken into the field to be placed, abrasion damage will occur on the creases. Manufacturers have been working to resolve this problem and, for the most part, sheets of acceptable quality a re now being produced.
Stress-Strain Characteristics
Table 3-2 depicts typical mechanical properties of HDPE, CPE, and PVC. Tensi le s t r e n g t h i s a
Composition of Compound Type (parts by weight)
Component Crosslinked Thermoplastic Semicrystalline
Polymer or alloy 100 100 100
Oil or plasticizer 5-40 5-55 0-10
Fillers: Carbon Black lnorganics
5-40 5-40
5-40 5-40
2-5
Antidegradants 1-2 1-2 1
Crosslinking system: .. _ _ Inorganic system 5-9
Sulfur system 5-9 _. .-
Source: Haxo, H. E. 1986. Quality Assurance of Geomembranes Used as Linings for Hazardous Waste Containment. In: Geotextiles and Geomembranes, Vol. 3, No. 4. London, England.
29
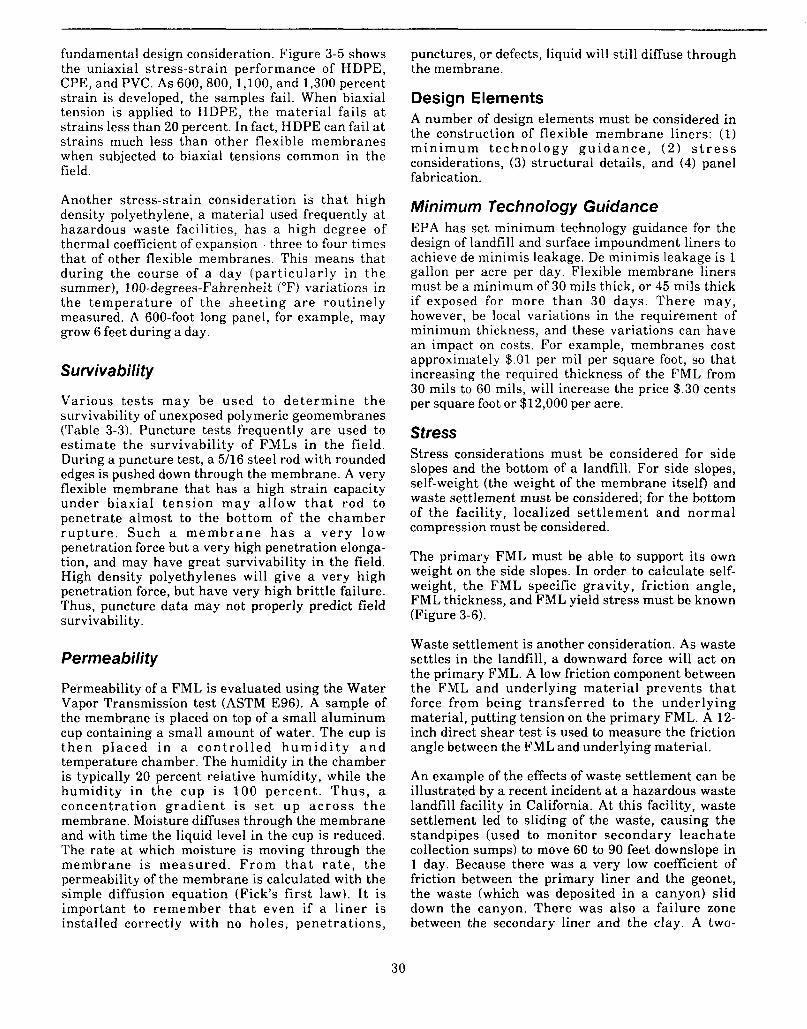
fundamental design consideration. Figure 3-5 shows the uniaxial stress-strain performance of HDPE, CPE, and PVC. As 600,800,1,100, and 1,300 percent strain is developed, the samples fail. When biaxial tension is applied to HDPE, the material fails a t strains less than 20 percent. In fact, HDPE can fail a t strains much less than other flexible membranes when subjected to biaxial tensions common in the field.
Another stress-strain consideration is t ha t high density polyethyl,ene, a material used frequently a t hazardous waste facilities, has a high degree of thermal coefficient of expansion - three to four times that of other flexible membranes. This means that during the course of a day (par t icular ly in the summer), 100-degrees-Fahrenheit ( O F ) variations in the tempera ture of the sheet ing a r e routinely measured. A 600-foot long panel, for example, may grow 6 feet during a day.
Survivability
Various tes t s may be used to de t e rmine the survivability of unexposed polymeric geomembranes (Table 3-3). Puncture tests frequently a re used to estimate the survivability of FMLs in the field. During a puncture test, a 5/16 steel rod with rounded edges is pushed down through the membrane. A very flexible membrane that has a high strain capacity under biaxial t ens ion may al low t h a t rod to penetrate almost to the bottom of the chamber r u p t u r e . Such a m e m b r a n e h a s a ve ry low penetration force but a very high penetration elonga- tion, and may have great survivability in the field. High density polyethylenes will give a very high penetration force, but have very high brittle failure. Thus, puncture data may not properly predict field survivability.
Permeability
Permeability of a FML is evaluated using the Water Vapor Transmission test (ASTM E96). A sample of the membrane is placed on top of a small aluminum cup containing a small amount of water. The cup is t h e n p laced i n a con t ro l l ed h u m i d i t y a n d temperature chamber. The humidity in the chamber is typically 20 percent relative humidity, while the humidity in the cup is 100 percent . T h u s , a concent ra t ion g rad ien t i s s e t u p a c r o s s t h e membrane. Moisture diffuses through the membrane and with time the liquid level in the cup is reduced. The rate a t which moisture is moving through the membrane i s measured . From t h a t r a t e , t h e permeability of the membrane is calculated with the simple diffusion equation (Fick’s first law). I t is important to remember t h a t even if a l iner is installed correctly with no holes, penetrat ions,
punctures, or defects, liquid will still diffuse through the membrane.
Design Elements A number of design elements must be considered in the construction of flexible membrane liners: (1) m i n i m u m techno logy g u i d a n c e , ( 2 ) s t r e s s considerations, (3) structural details, and (4) panel fabrication.
Minimum Technology Guidance EPA has set minimum technology guidance for the design of landfill and surface impoundment liners to achieve de minimis leakage. De minimis leakage is 1 gallon per acre per day. Flexible membrane liners must be a minimum of 30 mils thick, or 45 mils thick if exposed for more than 30 days. There may, however, be local variations in the requirement of minimum thickness, and these variations can have an impact on costs. For example, membranes cost approximately $.01 per mil per square foot, so that increasing the required thickness of the FML from 30 mils to 60 mils, will increase the price $.30 cents per square foot or $12,000 per acre.
Stress Stress considerations must be considered for side slopes and the bottom of a landfill. For side slopes, self-weight (the weight of the membrane itselfl and waste settlement must be considered; for the bottom of the facility, localized set t lement and normal compression must be considered.
The primary FML must be able to support its own weight on the side slopes. In order to calculate self- weight, the FML specific gravity, friction angle, FML thickness, and FML yield stress must be known (Figure 3-6).
Waste settlement is another consideration. As waste settles in the landfill, a downward force will act on the primary FML. A low friction component between the FML and underlying material prevents t ha t force from being t ransferred to the underlying material, putting tension on the primary FML. A 12- inch direct shear test is used to measure the friction angle between the FML and underlying material.
An example of the effects of waste settlement can be illustrated by a recent incident at a hazardous waste landfill facility in California. At this facility, waste settlement led to sliding of the waste, causing the standpipes (used to monitor secondary leachate collection sumps) to move 60 to 90 feet downslope in 1 day. Because there was a very low coefficient of friction between the primary liner and the geonet, the waste (which was deposited in a canyon) slid down the canyon. There was also a failure zone between the secondary liner and the clay. A two-
30
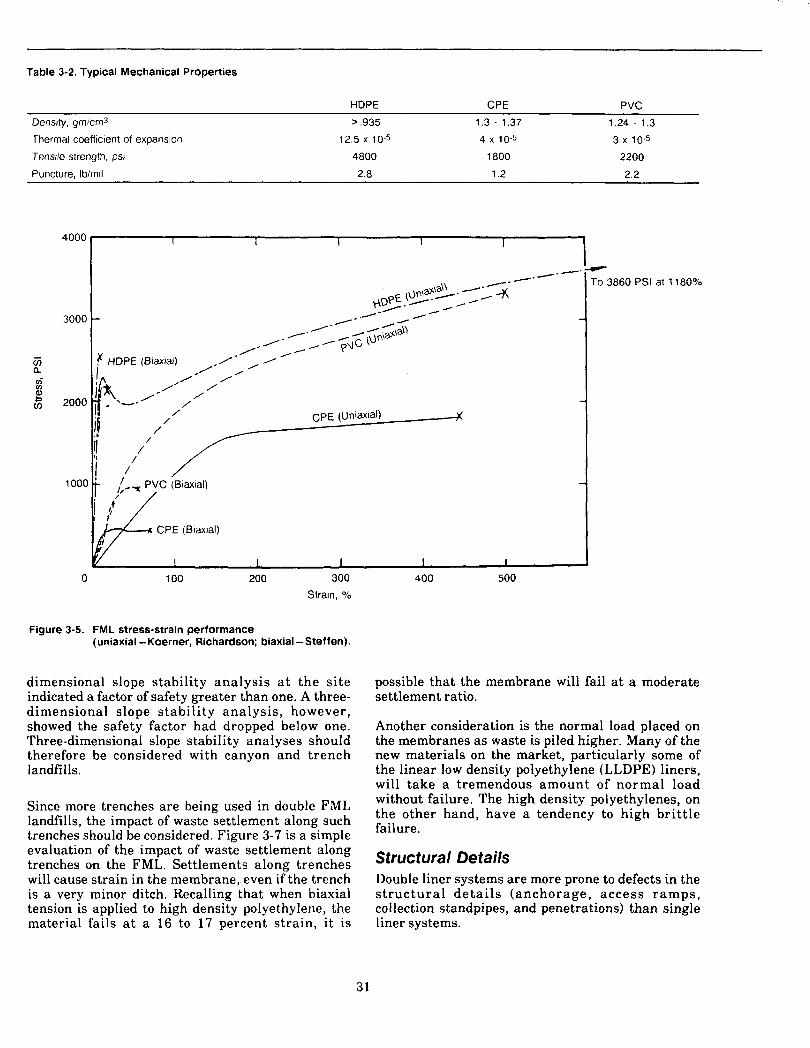
Table 3-2. Typical Mechanical Properties
HDPE CPE PVC Density, gm/cms > ,935 1.3 - 1.37 1 24 - 1.3 Thermal coefficient of expansion 12.5 x 10⁻⁵ 4 x 10⁻⁵ 3 x 10⁻⁵
Tensile strength, psi 4800 1800 2200
Puncture, Ib/mil 2.8 1.2 2.2
4000 I 1 I I I
. /
/ * /' -" / ' 2000 '-a ' /
/ ;t / CPE (Uniaxial) x
CPE (Biaxial) I
0 100 200 300
Strain, %
Figure 3-5. FML stress-strain performance (uniaxial - Koerner, Richardson; biaxial - Steffen).
dimensional slope stability analysis a t the si te indicated a factor of safety greater than one. A three- dimensional slope stability analysis, however, showed the safety factor had dropped below one. Three-dimensional slope stability analyses should therefore be considered with canyon and trench landfills.
Since more trenches are being used in double FML landfills, the impact of waste settlement along such trenches should be considered. Figure 3-7 is a simple evaluation of the impact of waste settlement along trenches on the FML. Settlements along trenches will cause strain in the membrane, even if the trench is a very minor ditch. Recalling that when biaxial tension is applied to high density polyethylene, the material fails a t a 16 to 17 percent strain, i t is
400 500
~~
PSI at 11 80%
possible that the membrane will fail at a moderate settlement ratio.
Another consideration is the normal load placed on the membranes as waste is piled higher. Many of the new materials on the market, particularly some of the linear low density polyethylene (LLDPE) liners, will take a tremendous amount of normal load without failure. The high density polyethylenes, on the other hand, have a tendency to high brit t le failure.
Structural Details Double liner systems are more prone to defects in the s t ruc tura l de ta i l s (anchorage, access ramps , collection standpipes, and penetrations) than single liner systems.
31

Table 3-3. Test Methods for Unexposed Polymeric Geomembranes
Membrane Liner Without Fabric Reinforcement
Property Thermoplastic Crosslinked Semicrystalline Fabric Reinforced
Analytical Properties
Volatiles MTM-la MTM-la MTM-la MTM-la (on selvage and reinforced sheeting)
(on selvage and reinforced sheeting)
ASTM D297, Section 34 (on selvage)
ASTM D792, Method A (on selvage)
MTM-2a MTM-2a MTM-2a MTM-2a Extractables
ASTM D297, Section 34 ASTM D297, Section 34 ASTM D297, Section 34 Ash
Specific gravity ASTM D792. Method A ASTM 0297, Section 15 ASTM 0792, Method A
Thermal analysis: Differential scanning
calorimetry (DSC) Thermogravimetry
(TGA)
NA
Yes
NA
Yes
Yes
Yes
NA
Yes
Physical Properties
Thickness - total
Coating Aver fabric
Tensile properties
ASTM 0638
NA
ASTM D638 (modified)
ASTM 0638
NA
ASTM D882, ASTM D638
ASTM 0412
NA
ASTM D412
ASTM 0751, Section 6
Optical method
ASTM D751, Method A and B (ASTM D638 on selvage)
ASTM D751, Tongue method (modified)
NA
ASTM D2240 Duro A or 0 (selvage only)
FTMS 101 B, Methods 2031 and 2065
ASTM D751, Method A
Tear resistance ASTM 01004 (modif ied)
NA
ASTM D2240 Duro A or D
FTMS 101 B, Method 2065
NA
ASTM 0624 ASTM D1004 Die C ASTM D882, Method A
ASTM 02240 Duro A or D
FTMS 1018, Method 2065
ASTM D751, Method A
Modulus of elasticity
Hardness
NA
ASTM D2240 Duro A or D
FTMS 1018, Method 2065
NA
Puncture resistance
Hydrostatic resistance
Seam strength:
In shear ASTM D882, Method A (modified)
ASTM D413, Mach Method Type 1 (modified)
NA
ASTM 0882, Method A (modified)
ASTM D413, Mach Method Type 1 (modified)
NA
ASTM D882, Method A (modified)
ASTM 0413, Mach Method Type 1 (modified)
NA
ASTM 0751, Method A (modified)
ASTM D413, Mach Method Type 1 (modified)
ASTM D413, Mach Method Type 1 ASTM D751, Sections 39-42
In peel
Ply adhesion
Environmental and Aqing Effects Ozone cracking
Environmental stress cracking
Low temperature testing
ASTM D1149
NA
ASTM D1790
ASTM D638 (modified)
ASTM D1204
ASTM D1149
NA
ASTM D746
ASTM 041 2 (modified)
ASTM D1204
NA
ASTM Dl693
ASTM D1790 ASTM 0746
ASTM D638 (modified)
ASTM D 1204
ASTM D1149
NA
ASTM D2136
Tensiie properties at
Dimensional stability
elevated temperature ASTM 0751 Method B (modified)
ASTM D1204
32
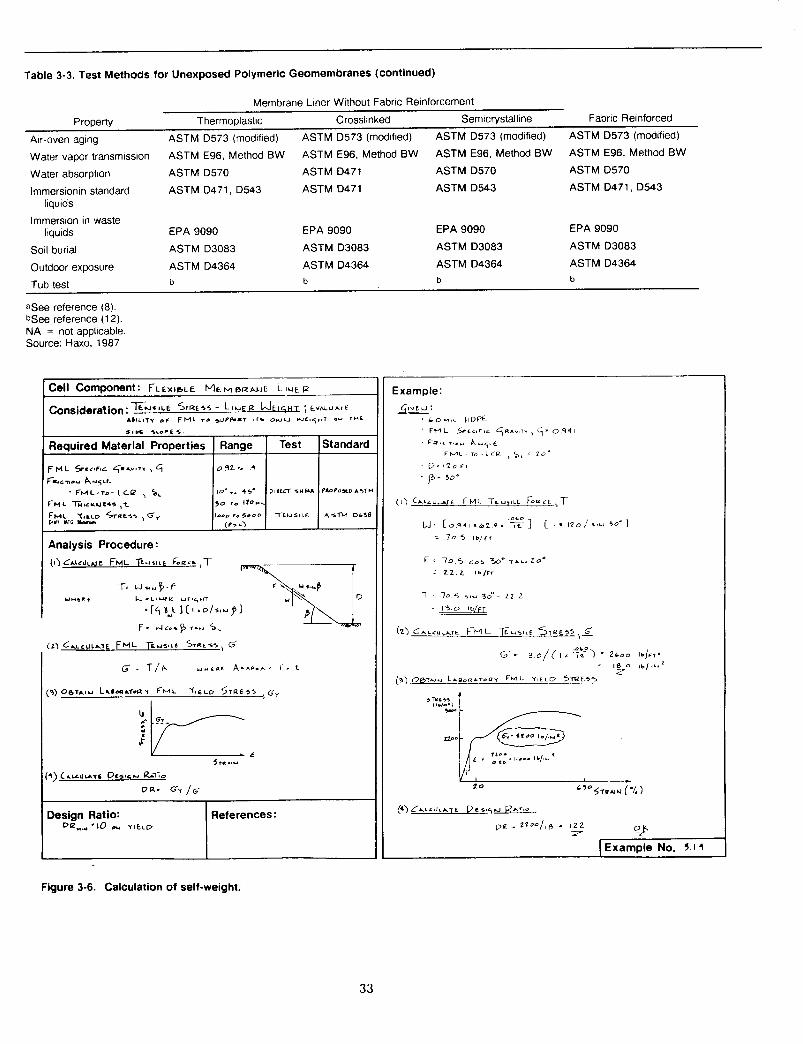
Table 3-3. Test Methods for Unexposed Polymeric Geomembranes (continued)
Design Ratio: '10 ou Y I E L D
Membrane Liner Without Fabric Reinforcement
References:
Property Thermoplastic Crosslinked Semicrystalline Fabric Reinforced
Air-oven aging ASTM D573 (modified) ASTM D573 (modified) ASTM D573 (modified) ASTM D573 (modified)
Water vapor transmission ASTM E96, Method 0W ASTM E96, Method BW ASTM E96, Method BW ASTM E96, Method BW
Water absorption Immersionin standard ASTM D471, D543 ASTM D471 ASTM D543
Immersion in waste
Soil burial
Outdoor exposure
ASTM D570 ASTM D471 ASTM D570 ASTM 0570
ASTM D471. D543 liquids
liquids EPA 9090 EPA 9090 EPA 9090 EPA 9090
ASTM D3083 ASTM D3083 ASTM D3083 ASTM D3083
ASTM D4364 ASTM D4364 ASTM D4364 ASTM 04364
aSee reference (8). B e e reference (1 2). NA = not applicable. Source: Haxo, 1987
Cell Component: FL ExlbLE M e M 0 R A U E L IUE P
Figure 3-6. Calculation of self-weight.
33
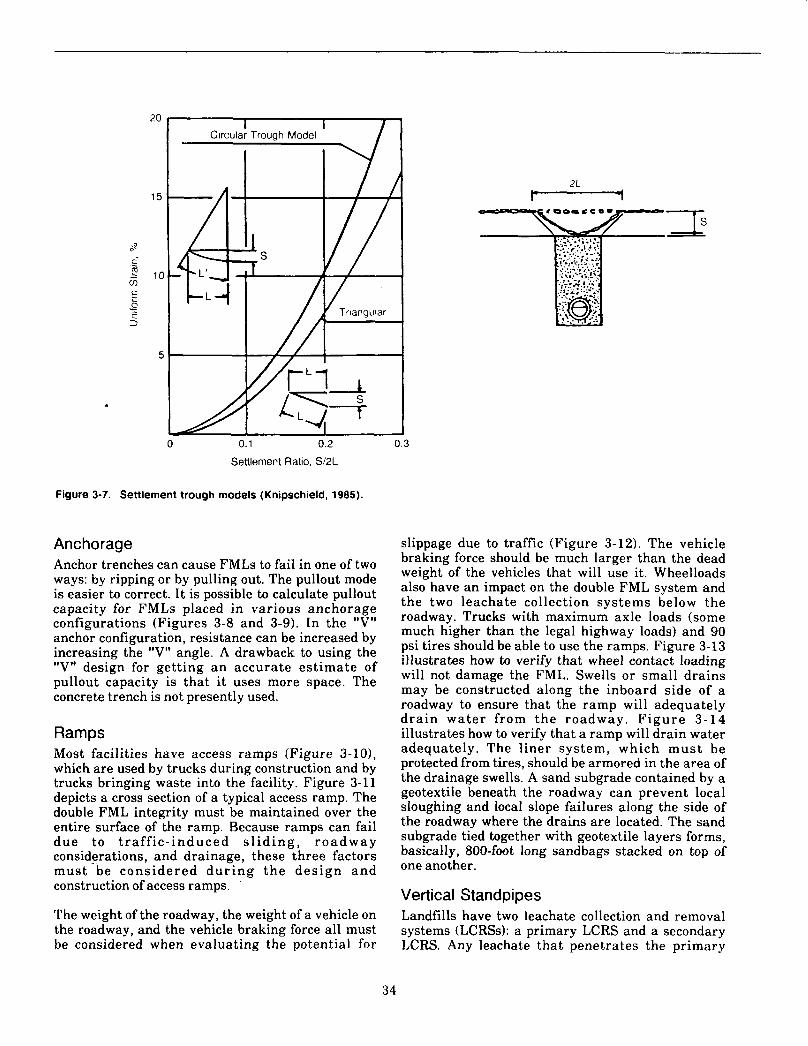
20
15
5
Circular Trough Model
0 0.1 0.2
Settlement Ratio, Si2L
Figure 3-7. Settlement trough models (Knipschield, 1985).
Anchorage Anchor trenches can cause FMLs to fail in one of two ways: by ripping or by pulling out. The pullout mode is easier to correct. It is possible to calculate pullout capacity for FMLs placed in various anchorage configurations (Figures 3-8 and 3-9). In the "V" anchor configuration, resistance can be increased by increasing the "V" angle. A drawback to using the "V" design for getting a n accurate estimate of pullout capacity is that i t uses more space. The concrete trench is not presently used.
Ramps Most facilities have access ramps (Figure 3-10), which are used by trucks during construction and by trucks bringing waste into the facility. Figure 3-11 depicts a cross section of a typical access ramp. The double FML integrity must be maintained over the entire surface of the ramp. Because ramps can fail d u e to t ra f f ic - induced s l i d i n g , r o a d w a y considerations, and drainage, these three factors m u s t - b e considered d u r i n g t h e des ign a n d construction of access ramps.
The weight of the roadway, the weight of a vehicle on the roadway, and the vehicle braking force all must be considered when evaluating the potential for
0.3
2L
slippage due to traffic (Figure 3-12). The vehicle braking force should be much larger than the dead weight of the vehicles that will use it. Wheelloads also have an impact on the double FML system and the two leachate collection systems below the roadway. Trucks with maximum axle loads (some much higher than the legal highway loads) and 90 psi tires should be able to use the ramps. Figure 3-13 illustrates how to verify that, wheel contact loading will not damage the FML. Swells or small drains may be constructed along the inboard side of a roadway to ensure that the ramp will adequately d r a i n water from the roadway. F i g u r e 3-14 illustrates how to verify that a ramp will drain water adequately. The l iner system, which must be protected from tires, should be armored in the area of the drainage swells. A sand subgrade contained by a geotextile beneath the roadway can prevent local sloughing and local slope failures along the side of the roadway where the drains are located. The sand subgrade tied together with geotextile layers forms, basically, 800-foot long sandbags stacked on top of one another.
Vertical Standpipes Landfills have two leachate collection and removal systems (LCRSs): a primary LCRS and a secondary LCRS. Any leachate that penetrates the primary
34
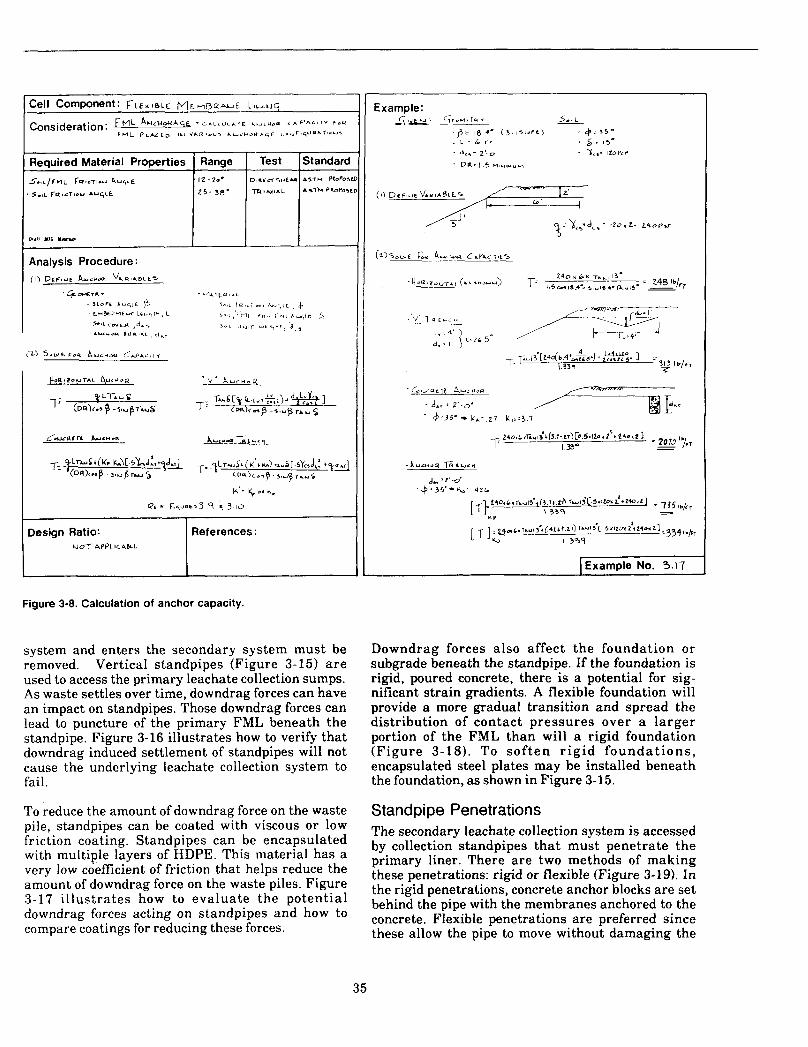
Required Material Properties Range S.,L/rnL fP*,=Ts.y h U $ L € 12-20'
5rnL f Q t c T 8 e U A U q L C 2 5 - 38" I
K ' . $ 0. H,
PC c F,+,ac,3 q e. 3 IO
Design Ratio: References: N O T At'PLlC4bLL
Figure 3-8. Calculation of anchor capacity.
system and enters the secondary system must be removed. Vertical standpipes (Figure 3-15) a r e used to access the primary leachate collection sumps. As waste settles over time, downdrag forces can have an impact on standpipes. Those downdrag forces can lead to puncture of the primary FML beneath the standpipe. Figure 3-16 illustrates how to verify that downdrag induced settlement of standpipes will not cause the underlying leachate collection system to fail.
To reduce the amount of downdrag force on the waste pile, standpipes can be coated with viscous or low friction coating. Standpipes can be encapsulated with multiple layers of HDPE. This material has a very low coefficient of friction that helps reduce the amount of downdrag force on the waste piles. Figure 3-17 i l lustrates how to evaluate the potential downdrag forces acting on standpipes and how to compare coatings for reducing these forces.
IExampie No. 3.17
Downdrag forces also affect the foundation or subgrade beneath the standpipe. If the foundation is rigid, poured concrete, there is a potential for sig- nificant strain gradients. A flexible foundation will provide a more gradual transition and spread the distribution of contact pressures over a larger portion of the FML than will a rigid foundation (Figure 3-18) . To sof ten r ig id f o u n d a t i o n s , encapsulated steel plates may be installed beneath the foundation, as shown in Figure 3-15.
Standpipe Penetrations The secondary leachate collection system is accessed by collection standpipes that must penetrate the primary liner. There are two methods of making these penetrations: rigid or flexible (Figure 3-19). In the rigid penetrations, concrete anchor blocks are set behind the pipe with the membranes anchored to the concrete. Flexible penetrations are preferred since these allow the pipe to move without damaging the
35
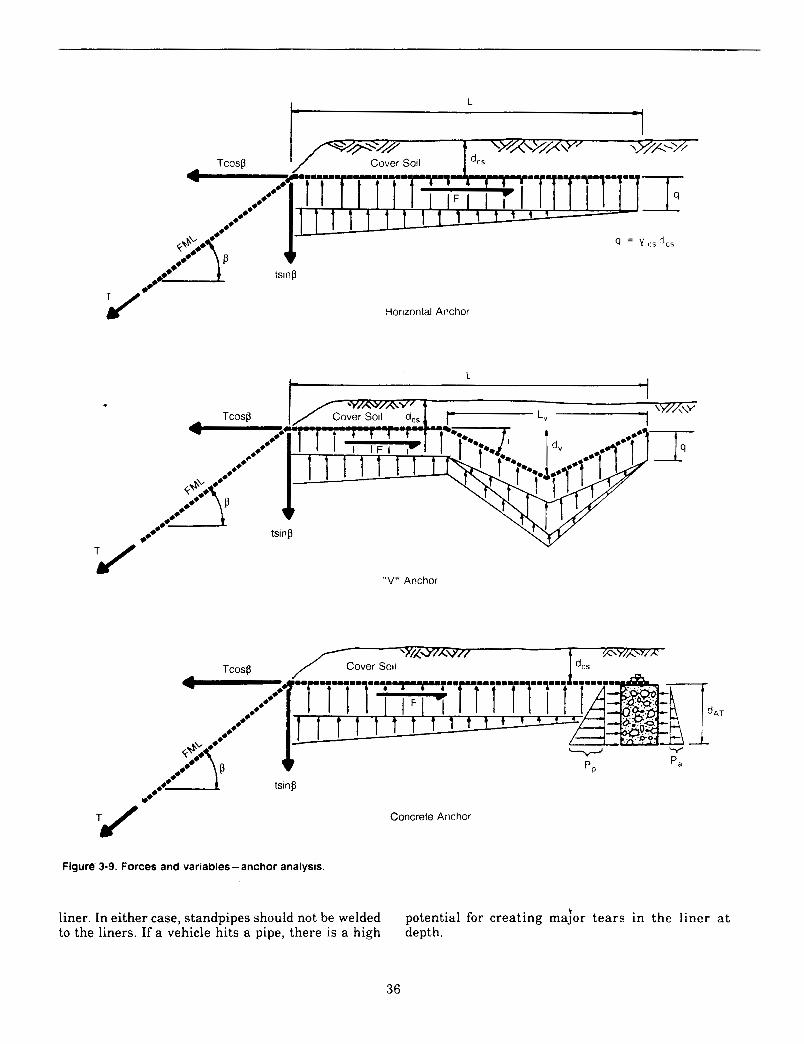
Horizontal Anchor
t L
" V " Anchor
AT
Concrete Anchor
Figuri 3-9. Forces and variables - anchor analysis. ~
liner. In either case, standpipes should not be welded to the liners. If a vehicle hits a pipe, there is a high
potential for creating major tears in the liner a t depth.
36
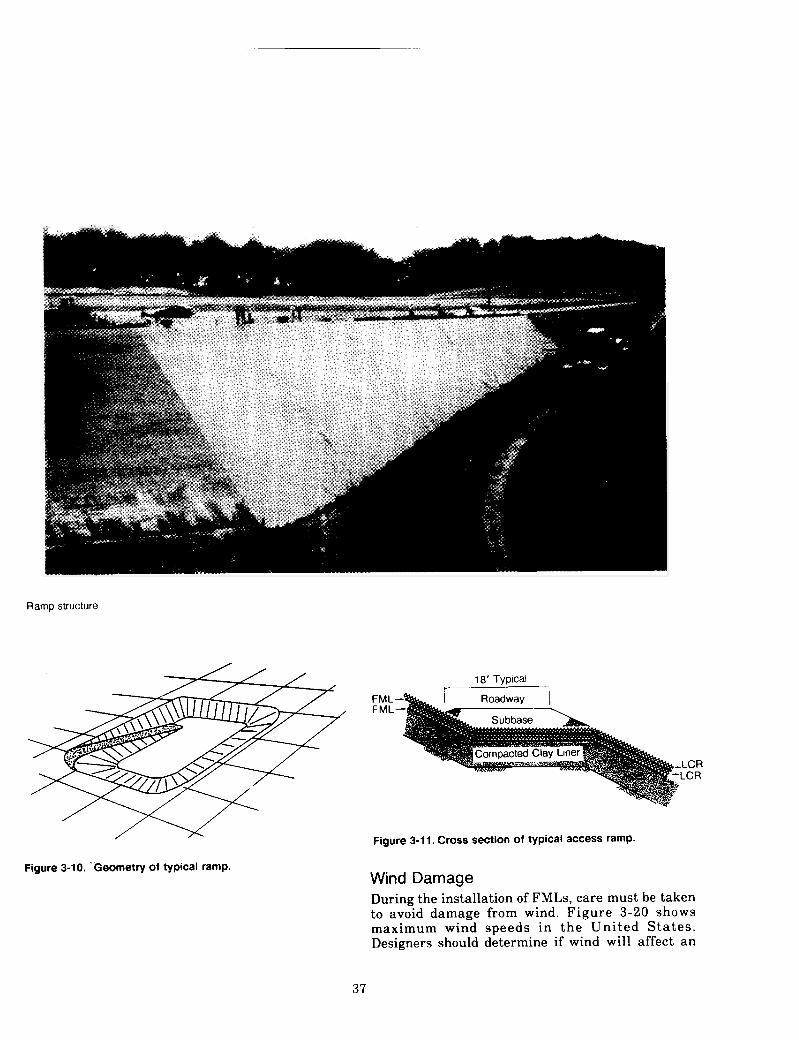
Ramp structure
Figure 3-10. -Geometry of typical ramp.
18' Typical t
Figure 3-1 1. Cross section of typical access ramp.
Wind Damage During the installation of FMLs, care must be taken to avoid damage from wind. Figure 3-20 shows maximum wind speeds in t h e United S ta tes . Designers should determine if wind will affect an
37
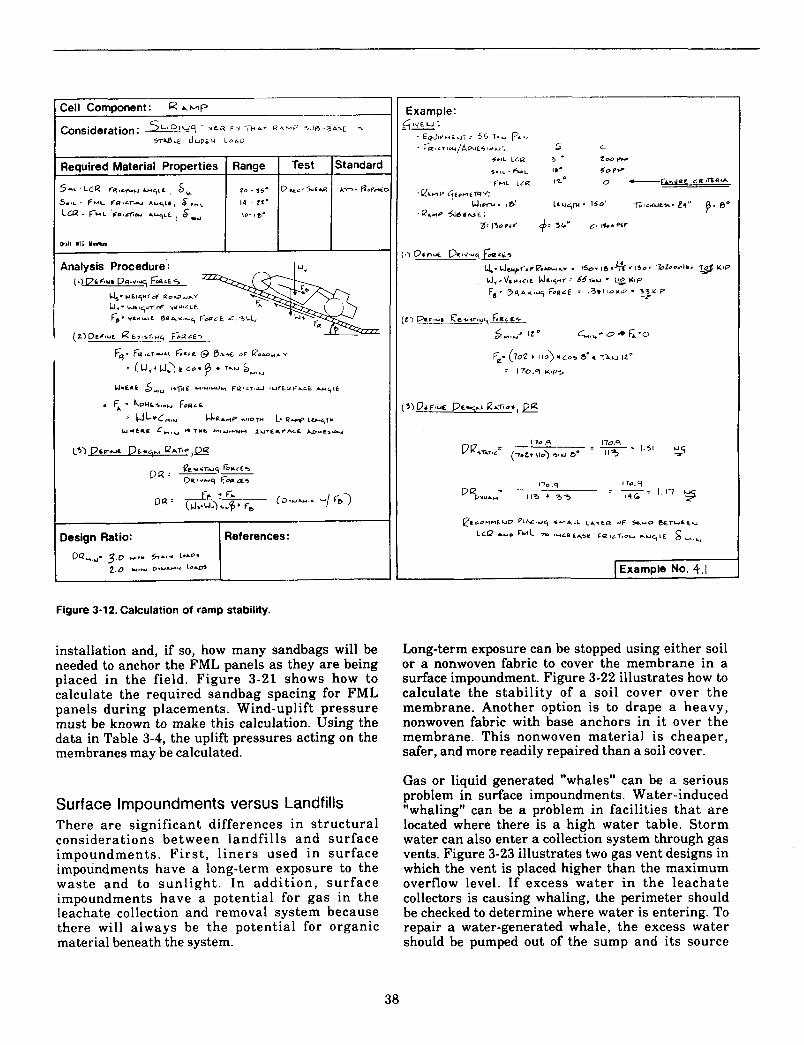
Reauired Material Properties I Range I Test I Standard - I 1
Figure 3-1 2. Calculation of ramp stability.
installation and, if so, how many sandbags will be needed to anchor the FML panels as they are being placed in the field. Figure 3-21 shows how to calculate the required sandbag spacing for FML panels during placements. Wind-uplift pressure must be known to make this calculation. Using the data in Table 3-4, the uplift pressures acting on the membranes may be calculated.
Surface Impoundments versus Landfills There are significant differences in s t ructural considerations between landfi l ls and surface impoundments. F i r s t , l iners used in surface impoundments have a long-term exposure to the waste and to sunl ight . In addi t ion , sur face impoundments have a potential for gas in the leachate collection and removal system because there will always be the potential for organic material beneath the system.
[Example No. 4.1
Long-term exposure can be stopped using either soil or a nonwoven fabric to cover the membrane in a surface impoundment. Figure 3-22 illustrates how to calculate the stabil i ty of a soil cover over the membrane. Another option is to drape a heavy, nonwoven fabric with base anchors in it over the membrane. This nonwoven material is cheaper, safer, and more readily repaired than a soil cover.
Gas or liquid generated "whales" can be a serious problem in surface impoundments. Water-induced "whaling" can be a problem in facilities that a re located where there is a high water table. Storm water can also enter a collection system through gas vents. Figure 3-23 illustrates two gas vent designs in which the vent is placed higher than the maximum overflow level. If excess water in the leachate collectors is causing whaling, the perimeter should be checked to determine where water is entering. To repair a water-generated whale, the excess water should be pumped out of the sump and i ts source
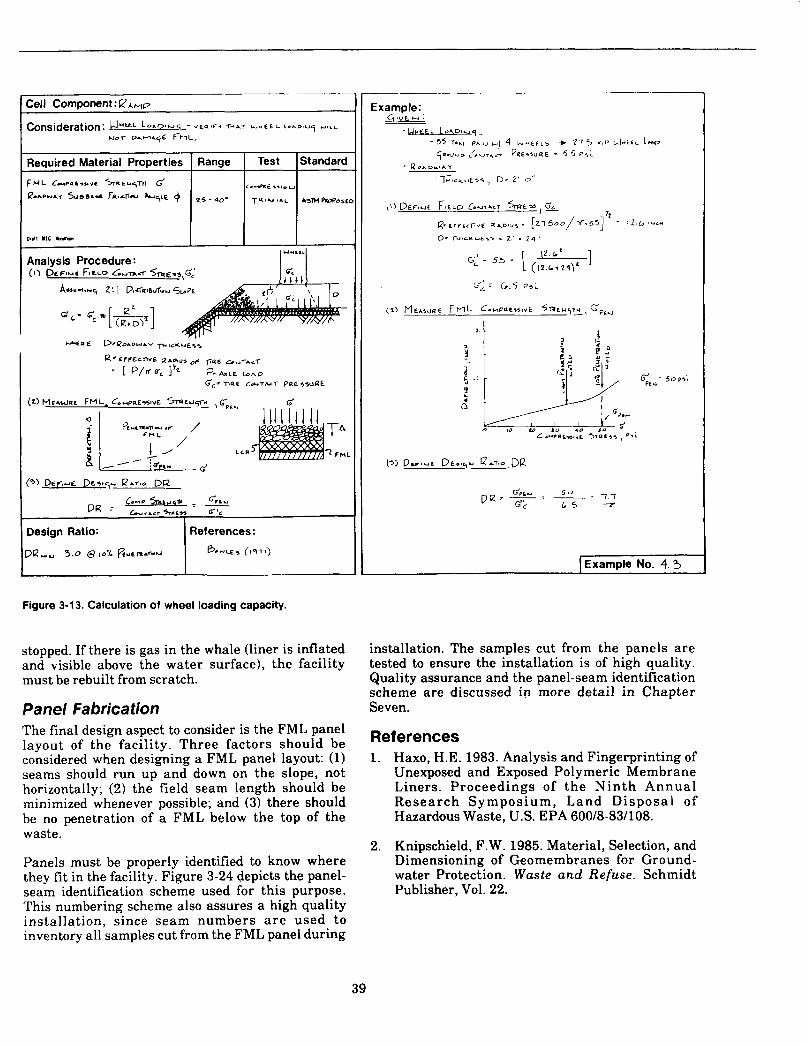
Dlrll I 1 C Imn
Analysis Procedure :
Figure 3-1 3. Calculation of wheel loading capacity.
stopped. If there is gas in the whale (liner is inflated and visible above the water surface), the facility must be rebuilt from scratch.
Panel Fabrication The final design aspect to consider is the FML panel layout of the facility. Three factors should be considered when designing a FML panel layout: (1) seams should run up and down on the slope, not horizontally; (2) the field seam length should be minimized whenever possible; and (3) there should be no penetration of a FML below the top of the waste.
Panels must be properly identified to know where they fit in the facility. Figure 3-24 depicts the panel- seam identification scheme used for this purpose. This numbering scheme also assures a high quality installation, since seam numbers a r e used to inventory all samples cut from the FML panel during
I
IExample No. 4.3
installation. The samples cut from the panels a re tested to ensure the installation is of high quality. Quality assurance and the panel-seam identification scheme are discussed in more detail in Chapter Seven.
References 1. Haxo, H.E. 1983. Analysis and Fingerprinting of
Unexposed and Exposed Polymeric Membrane Liners. Proceedings of t h e N i n t h Annual Research Symposium, L a n d Disposal of Hazardous Waste, U S . EPA 600/8-83/108.
Knipschield, F.W. 1985. Material, Selection, and Dimensioning of Geomembranes for Ground- water Protection. Waste and Refuse. Schmidt Publisher, Vol. 22.
2.
39
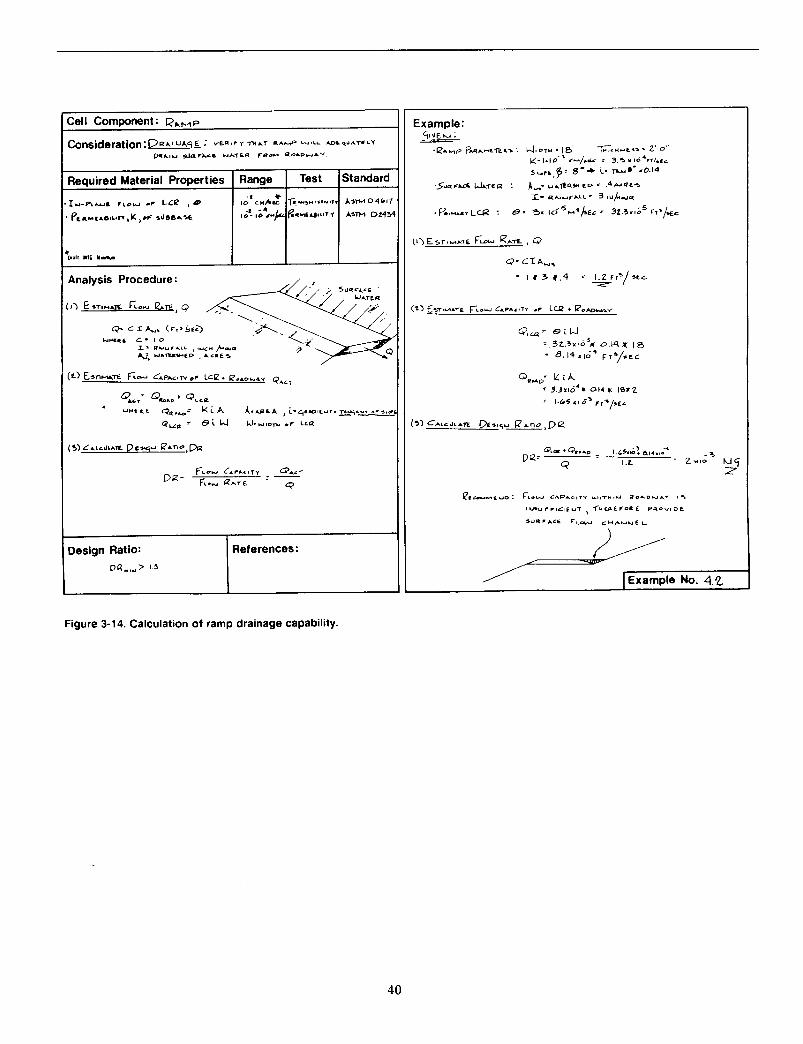
D R -
Design Ratio:
DR.,,> 1.5
QAGT
4
References: I
/ IExample No. 4.2
Figure 3-14. Calculation of ramp drainage capability.
40
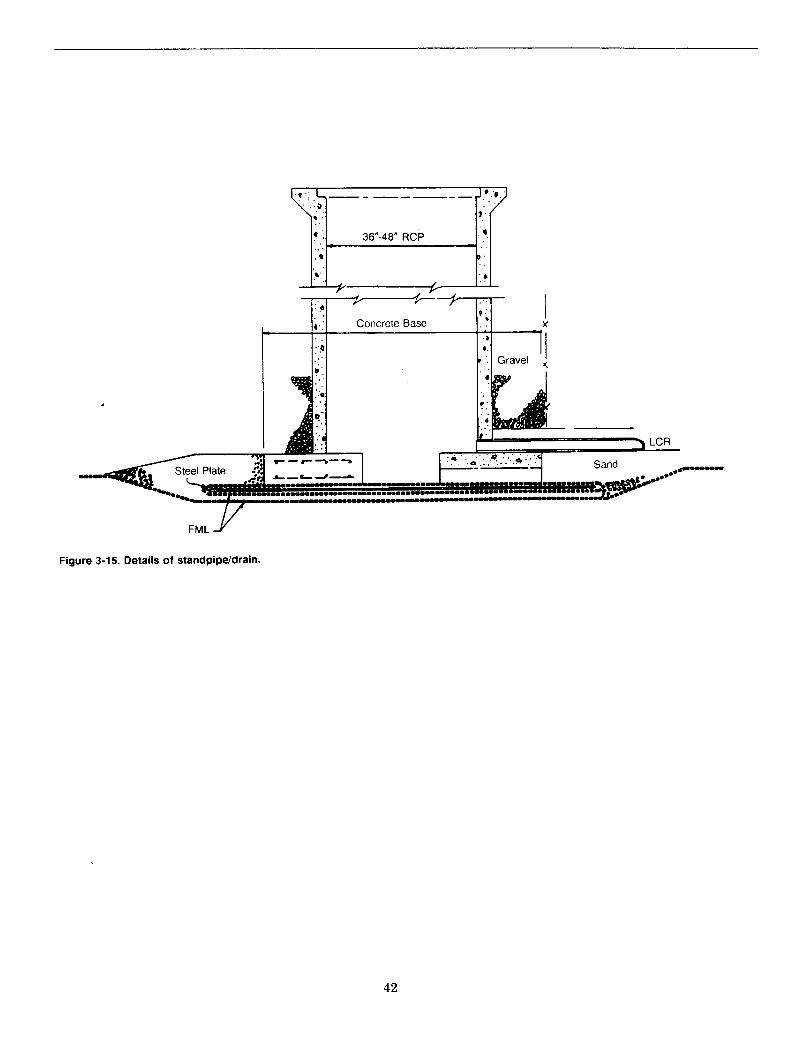
Figure 3-15. Details of standpipddrain.
42
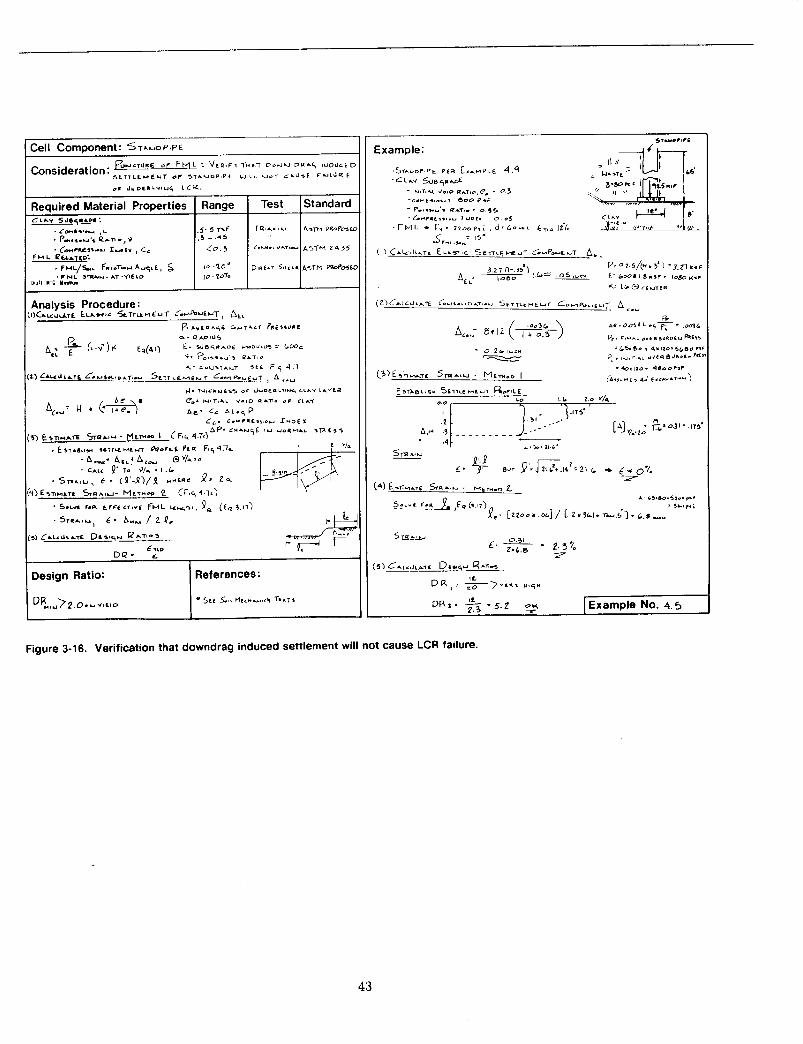
I2 [Example No. 4 .5 ou P R a - 5 - 5 . 2 -r
Figure 3-16. Verification that downdrag induced settlement will not cause LCR failure.
43

Design Ratio: I.J.~ APP UCAOLE
[Example No. 4.4
Figure 3-17. Evaluation of potential downdrag forces on standpipes with and without coating.
44
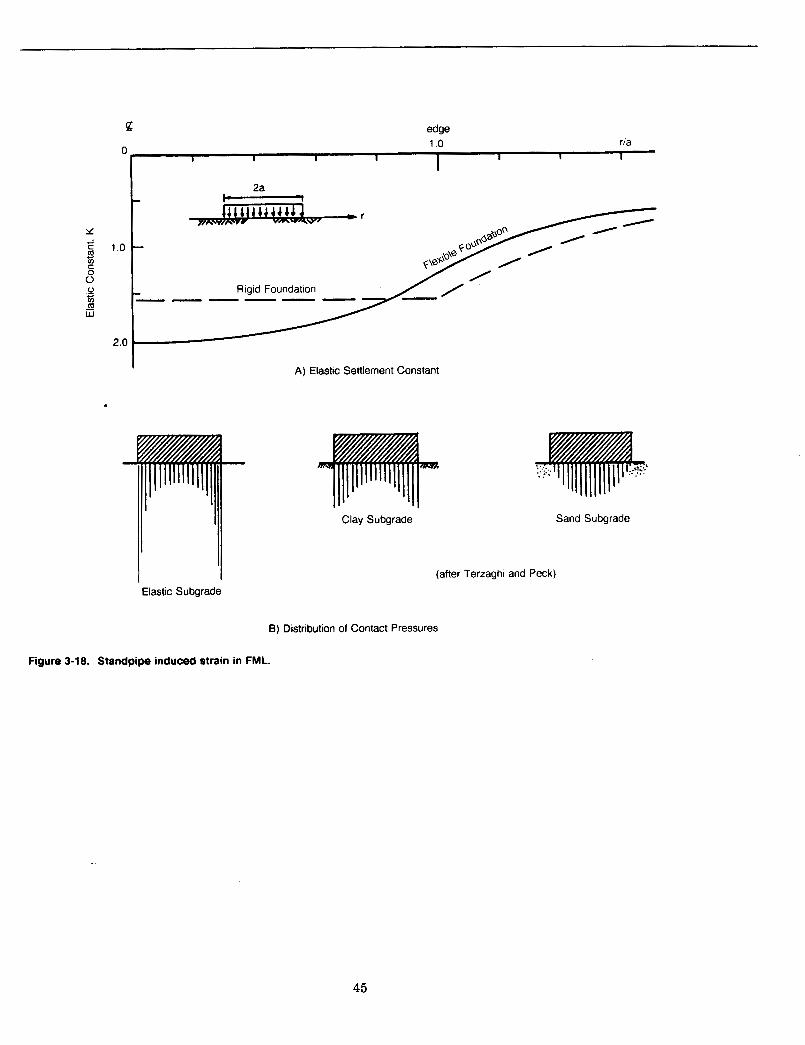
P edge
0. 1 0 rla
1 I I 1 I I 1 I
2a - 1.0 -
- Rigid Foundation ------
A) Elastic Settlement Constant
Clay Subgrade Sand Subgrade
‘I (after Terzaghi and Peck)
Elastic Subgrade I
B) Distribution of Contact Pressures
Figure 3-18. Standpipe induced strain in FML.
45
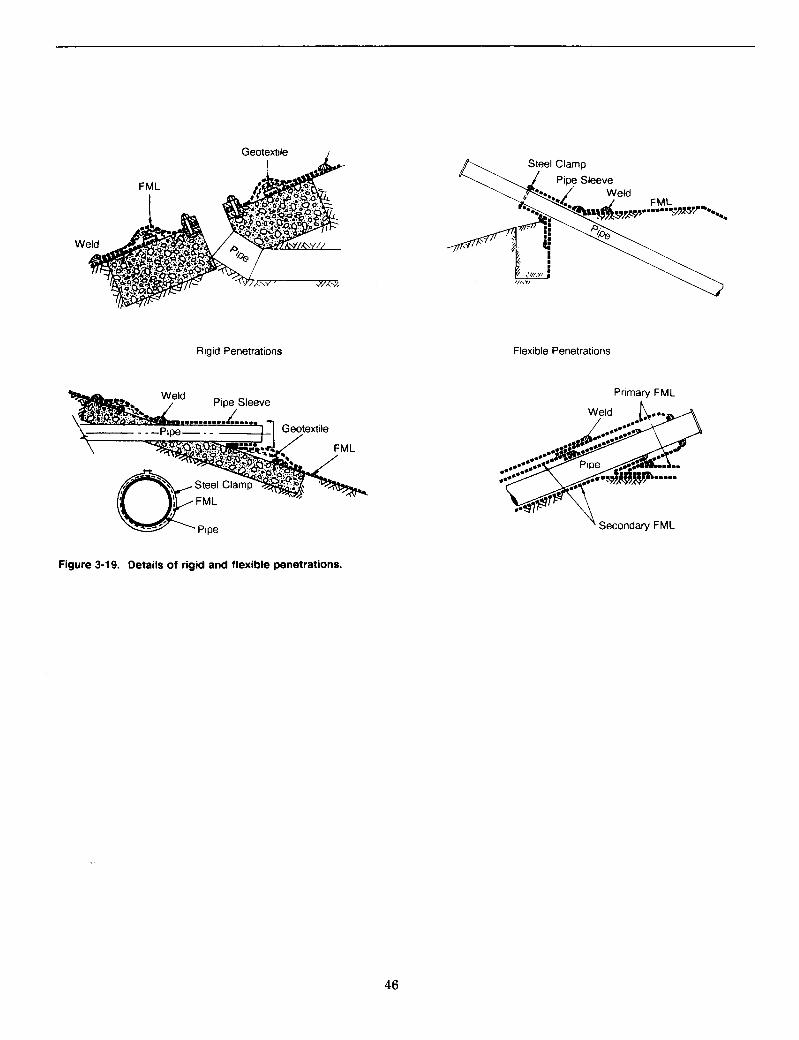
Geotextile J
w
Rigid Penetrations
Geqtextile
Flexible Penetrations
Primary FML
Secondary FML
Figure 3-19. Details of rigid and flexible penetrations.
46

Figure 3-20. Design maximum wind speeds.
47
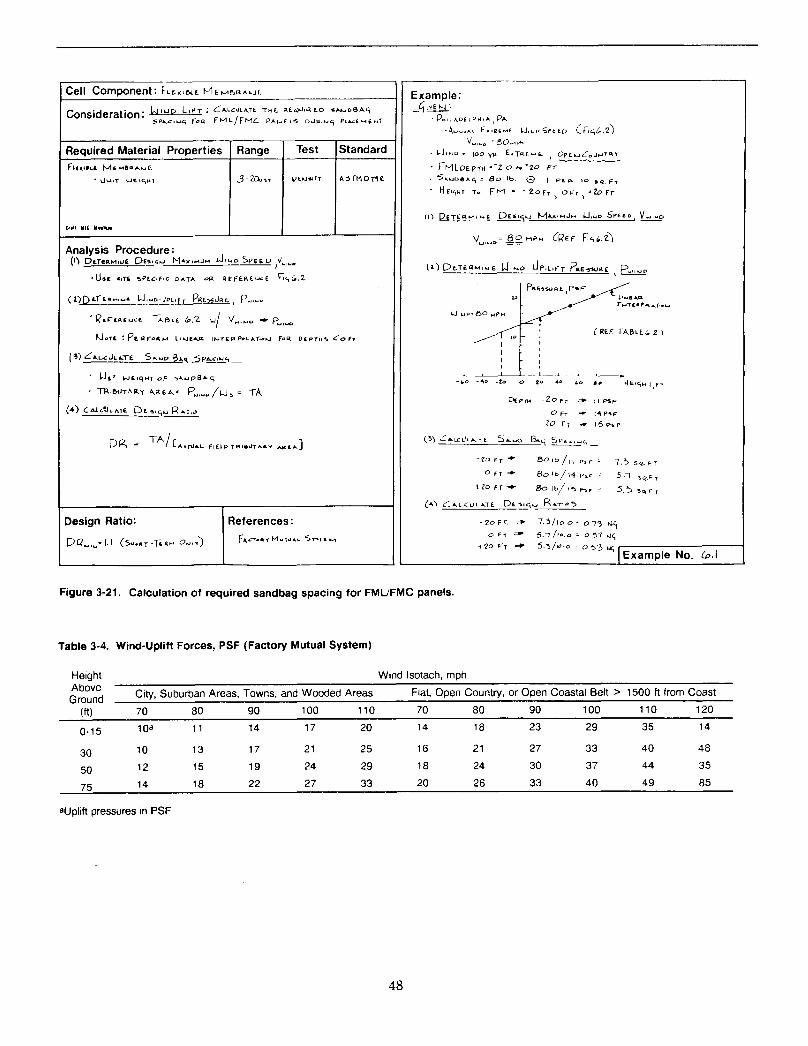
Cell Comwnent: F L L ~ , C + E MLMBUALJE
Required Material Properties Range
* du.r clc-iwr 3 - Z b , Y
F L ~ I ~ L L M'MB~LUB I Y F.
Example: -4 I*Eh(:
Figure 3-21. Calculation of required sandbag spacing for FMUFMC panels.
Table 3-4. Wind-Uplift Forces, PSF (Factory Mutual System)
Height Wind Isotach, mph Above Ground Flat, Open Country, or Open Coastal Belt > 1500 ft from Coast City, Suburban Areas, Towns, and Wooded Areas
(ft) 70 80 90 100 110 70 80 90 100 110 120
10 13 17 21 25 16 21 27 33 40 48
12 15 19 24 29 18 24 30 37 44 35
14 18 22 27 33 20 26 33 40 49 85
1 oa 11 14 17 20 14 18 23 29 35 14 0-1 5
30
50
75
aUplift pressures in PSF
48
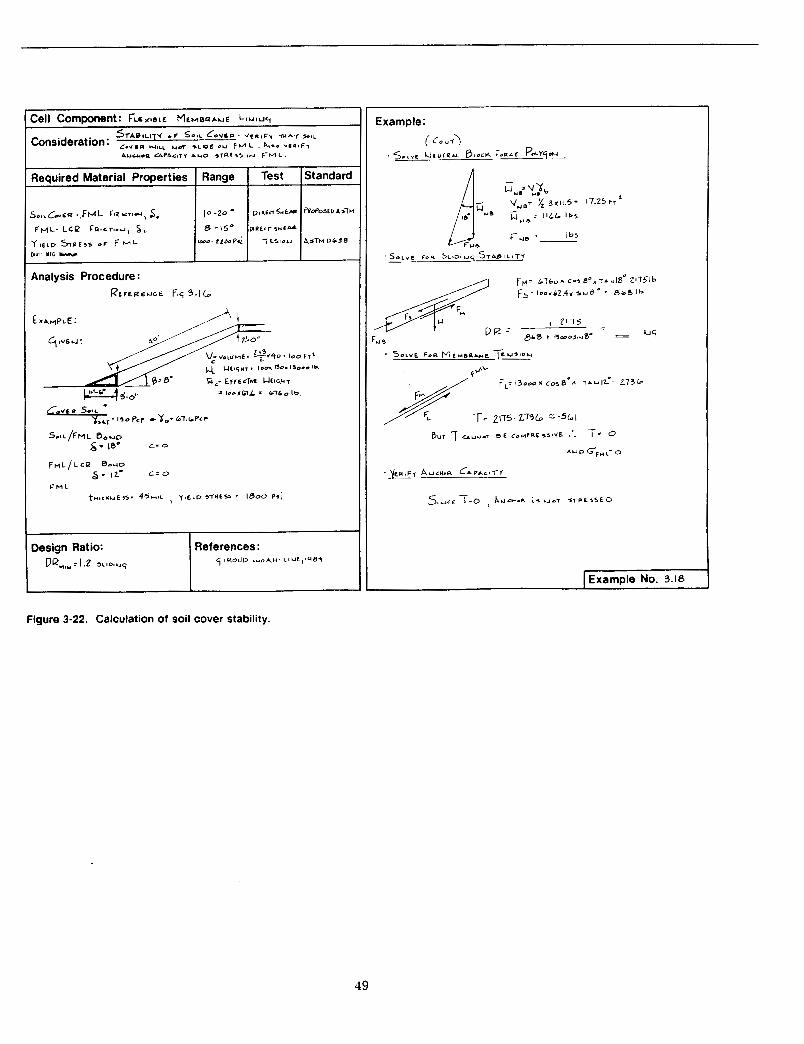
inalysis Procedure: REFEREUCE FIS 3.1L
IExample No. 3.18
Figure 3-22. Calculation of soil cover stability.
49
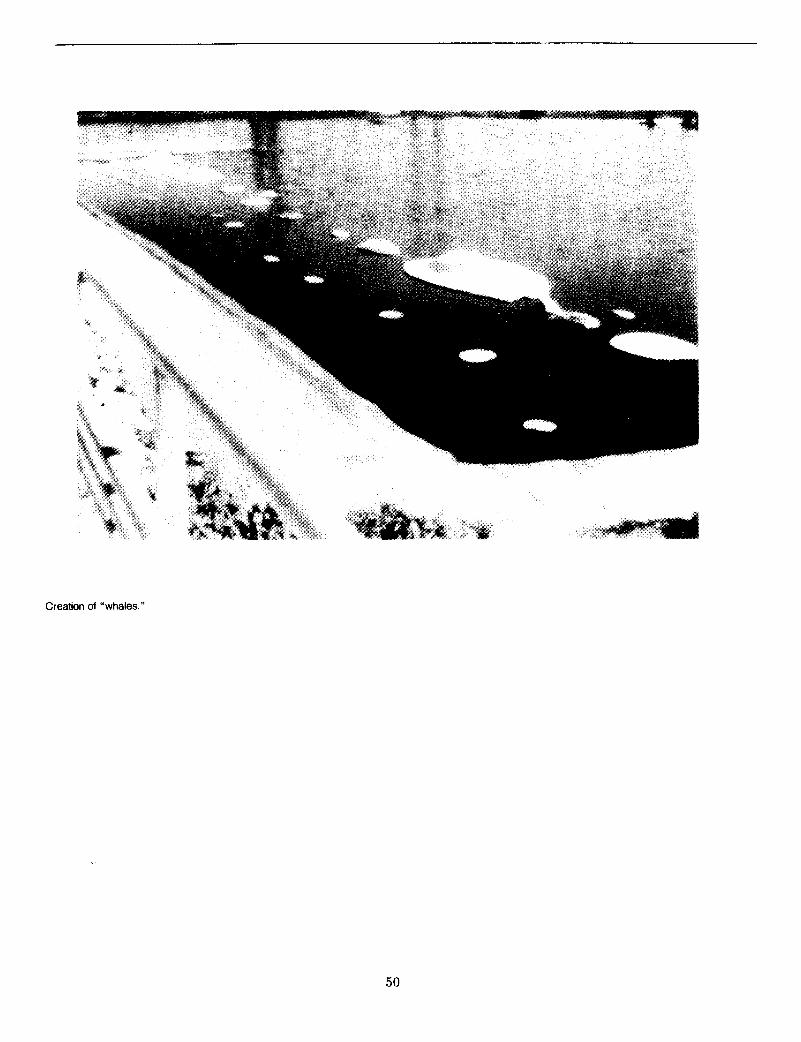
Creation of “whales.”
50
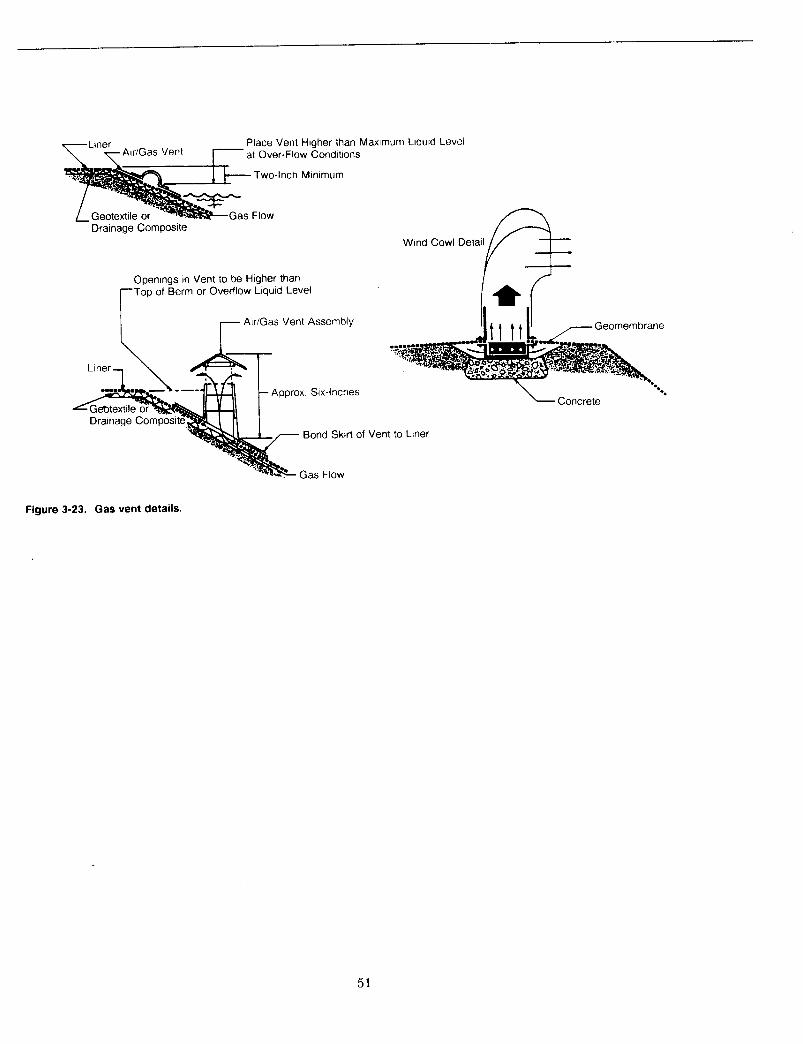
Place Vent Higher than Maximum Liquid Level at Over-Flow Conditions \'In";- AlrIGas Vent
Two-Inch Minimum
Drainage Composite
Openings in Vent to be Higher than Top of Berm or Overflow Liquid Level
AirIGas Vent Assembly r Liner 1 \ & Drainage Cor$&
Approx Six-Inches
Bond Skirt of
Gas Flow
Figure 3-23. Gas vent details.
51
Wind Cowl Detail e Geomem brane
'e. - Concrete
Vent to Liner
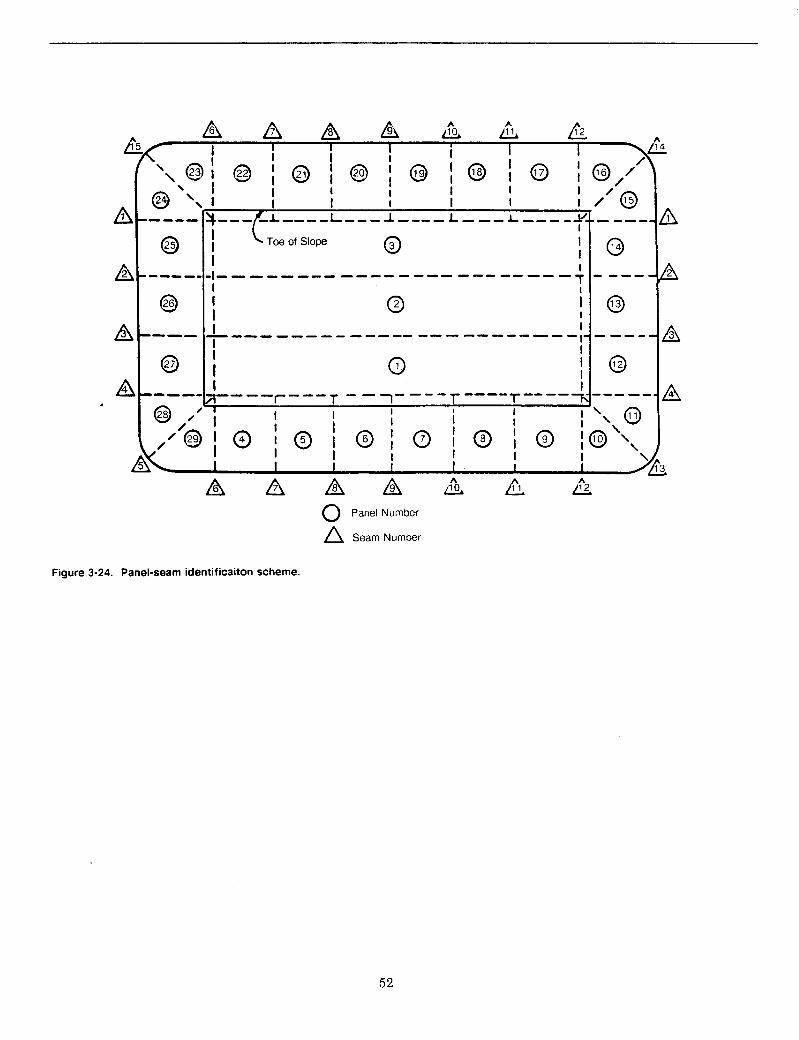
-
l- ---- -I----- 1 I
;1---- r--- T --l--" I I I I
I I I 1 I I I
A A A A A h i 0 Panel Number
A Seam Number
Figure 3-24. Panel-seam identificaiton scheme.
52
4. ELEMENTS OF LIQUID MANAGEMENT AT WASTE CONTAINMENT SITES
Introduction The drainage system for removing leachate or other aggressive liquids from landfills, surface impound- ments, and waste piles is critically important. Even if a liner has no leaks, the phenomenon of molecular diffusion will allow some of the organics from the liquids ponded on top of the liner system to leach through the flexible membrane liner and the clay. The timely collection and removal of that leachate is a t the heart of this chapter.
This chapter presents a n overview of collector design and materials, followed by a discussion of the three parts of a liquid management system: the leachate collection and removal system above the primary liner, the secondary leak detection collection and removal system between the primary and secondary liners, and the surface water collection system above the closure of the completed facility. The chapter concludes with a discussion of gas collector and removal systems. The following topics will be examined:
0 Overview Drainage Materials Filtration Materials Geosynthetics Design-by-function Concepts
Pr imary Leacha te Col lect ion a n d Removal (PLCR) Systems
Granular Soil (Gravel) Drainage Design Perforated Collector Pipe Design Geonet Drainage Design Granular Soil (Sand) Filter Design Geotextile Filter Design Leachate Removal Systems
0 Leak Detection, Collection, and Removal (LDCR) Systems
Granular Soil (Gravel) Drainage Design Geonet Drainage Design
Response Time Leak Detection Removal Systems
Surface Water Collection and Removal (SWCR) Systems Gas Collector and Removal Systems
Overview Leachate refers to rainfall and snowmelt t h a t combines w i t h l i q u i d i n t h e w a s t e a n d gravitationally moves to the bottom of a landfill facility. During the course of its migration, the liquid takes on the pollutant characteristics of the waste itself. As such, leachate is both si te specific and waste specific with regard to both its quantity and quality. The first par t of the collector system to intercept the leachate is the pr imary leachate collection and removal (PLCR) system located directly below the waste and above the primary liner. This system must be designed and constructed on a site-specific basis to remove the leachate for proper treatment and disposal.
The second part of a leachate collection system is between the primary and secondary liners. Varying with State or region, i t is called by a number of names including the secondary leachate collection and removal (SLCR) system, the leak detection network, or the leak questioning system. It will be referred to here as the leak detection, collection, and removal (LDCR) system. The main purpose of this system is to determine the degree of leakage, if any, of leachate through the primary liner. Ideally, this system would collect only negligible quantit ies of leachate; however, it must be designed on the basis of a worst-case scenario.
The third part, called the surface water collection and removal (SWCR) system, lies above the waste system in a cap or closure above the closed facility. Its purpose is to redirect surface water coming through the cover soil from off of the flexible membrane in the cap to the outside perimeter of the
5 3
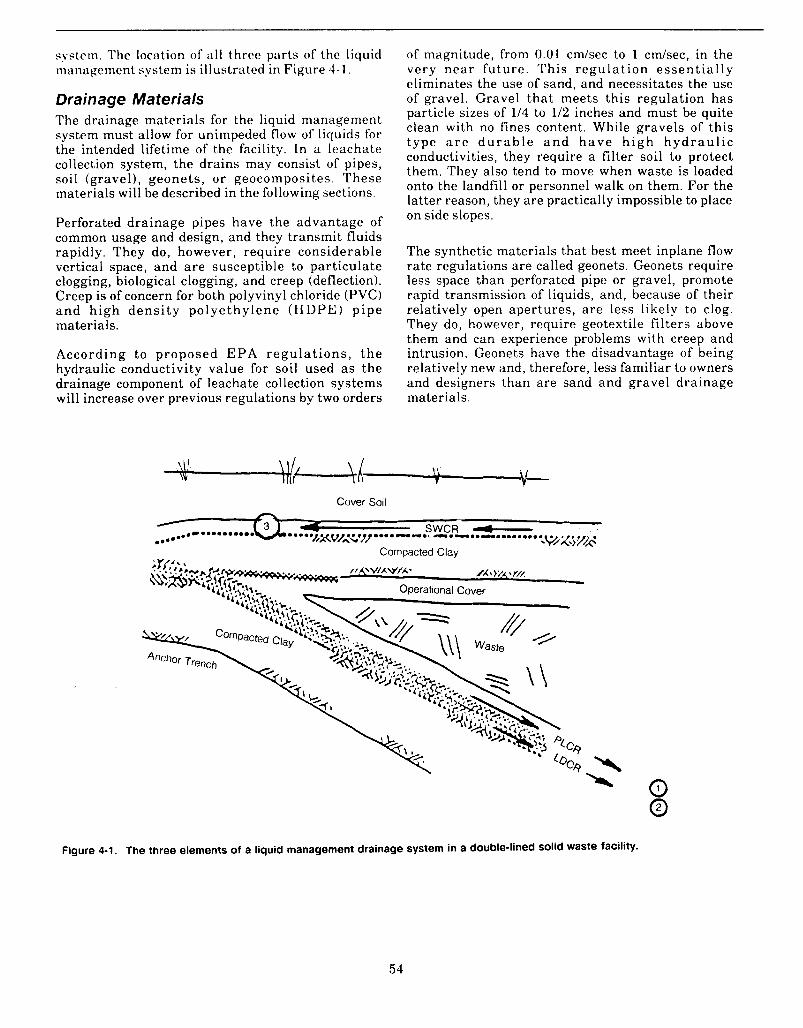
system. The location of all thrre parts of the liquid manapcment system is illustrated in Figure 4 1 .
Drain age Ma te rials The drainage materials for the liquid management system must allow for unimpeded flow of liquids for the intended lifetime of the facility. In a leachate collection system, the drains may consist of pipes, soil (gravel) , geonets, o r geocomposites. These materials will be described in the following sections.
Perforated drainage pipes have the advantage of common usage and design, and they transmit fluids rapidly. They do, however, require considerable vertical space, and are susceptible to particulate clogging, biological clogging, and creep (deflection). Creep is of concern for both polyvinyl chloride (PVC) a n d h igh dens i ty polye thylene ( H D P E ) p ipe materials.
According to proposed E P A regu la t ions , t h e hydraulic conductivity value for soil used as the drainage component of leachate collection systems will increase over previous regulations by two orders
of magnitude, from 0.01 cmlsec to 1 c d s e c , in the very near future . This regula t ion e s sen t i a l ly eliminates the use of sand, and necessitates the use of gravel. Gravel tha t meets this regulation has particle sizes of 114 to 112 inches and must be quite clean with no fines content. While gravels of this type a r e d u r a b l e a n d h a v e h i g h h y d r a u l i c conductivities, they require a filter soil to protect them. They also tend to move when waste is loaded onto the landfill or personnel walk on them. For the latter reason, they are practically impossible to place on side slopes.
The synthetic materials that best meet inplane flow rate regulations are called geonets. Geonets require less space than perforated pipe or gravel, promote rapid transmission of liquids, and, because of their relatively open apertures, a re less likely to clog. They do, however, require geotextile filters above them and can experience problems with creep and intrusion. Geonets have the disadvantage of being relatively new and, therefore, less familiar to owners and designers than are sand and gravel drainage materials.
---..- Operational Cover
Figure 4-1. The three elements of a liquid management drainage system in a double-lined solid waste facility.
54
Another new synthetic material is called a drainage geocomposite, many types of which a re available. Geocomposites have most of the same advantages and disadvantages of geonets. They generally are not used for primary or secondary leachate collection systems, however, because of their relatively low crush s t rength. The c rush s t rength , or normal strength perpendicular to the plane, of currently available products is not sufficient to carry the weight of a large landfill. Geocomposites are useful, however, for surface water collector systems, where the applied normal stresses are quite low.
Filtration Materials The openings in drainage materials, whether holes in pipes, voids in gravel, or apertures in geonets, must be protected against invading fine particle- sized materials. An intermediate material, having smaller openings t h a n those of the d r a i n a g e material, must be used as a filter. Commonly in a pipe or gravel drain, a medium-coarse to fine sandy soil is used as a filter. Sand, however, has the disadvantages of t ak ing up vertical space and moving under various loading conditions.
Geotextiles used as filters avoid these problems. The open spaces in the fabric allow liquid flow while simultaneously preventing upstream fine particles from fouling the drain. Geotextiles save vertical space, a r e easy to ins ta l l , and have the added advantage of remaining stationary under load. As with sand filters, clogging can occur, and because geotextiles a re a new technology much about them is not known. Geotextiles a r e being used more and more not only for filters, but also as cushioning materials above and/or below FMLs.
Geosynthetics Geosynthetic materials play a key role in liquid management systems. The five major categories of geosynthetics are:
0 Geotextiles 0 Geogrids 0 Geonets 0 Geomembranes 0 Geocomposites
A brief discussion of each type follows.
Geotextiles a re either woven or nonwoven fabrics made from polymeric fibers. Woven geotextiles are fabrics made up of webbed fibers t h a t r u n i n perpendicular directions. For filtration, the spaces between the fibers are the most important element. These spaces or voids must be large enough to allow unimpeded liquid flow but be small enough to keep
out invading particulates. The geotextiles also must be sufficiently strong to cover and reinforce the apertures, or openings, of the drainage materials they are meant to protect.
In nonwoven geotextiles the fibers are much thinner but far more numerous. The various types a r e needle-punched, resin-bond, and melt-bond. All contain a labyrinth of randomly oriented fibers that cross one another so that there is no direct line of flow. The fabric must have enough open space to allow liquid to pass through, while simultaneously retaining any upstream movement of particles. The needle-punched nonwoven type is very commonly used as a filter material.
Geogrids a r e very s t r o n g in t r ansve r se a n d longitudinal directions, making them useful as reinforcing materials for either soil or solid waste. Generally, they are used to steepen the side slopes of interior cells or exterior containment slopes of a facility. Recently they also have been used in the construction of ''piggyback'' landfills, i.e., landfills built on top of existing landfills, to reinforce the upper landfill against differential settlements within the lower landfill.
Geonets are formed with intersecting ribs made from a counter-rotating extruder. A typical geonet is about 1M-inch thick from the top of the upper rib to the bottom of the lower rib, yet the flow capability is approximately equivalent to that of 12 inches of sand having a 0.01 c d s e c permeability. (The proposed regulation will increase this value to 1 cm/sec, as mentioned earlier.) The rapid transmission rate is due to clear flow paths in the geonets, as opposed to particle obstructions in a granular soil material. There are two main concerns with geonets. First, the crush s t rength a t the rib's intersection must be capable of main ta in ing i t s s t ruc tura l s tabi l i ty without excessive deformation or creep. Second, adjacent materials must be prevented from intruding into the rib apertures, cutting off or reducing flow rates.
Foamed geonets are relatively new products made with a foaming agent that produces a thick geonet structure (up to 1/2-inch) with very high flow rates. These improved flow rates result from the thicker product, but eventually the nitrogen gas in the rib voids diffuses through the polymer structure, leaving behind a s t ructure with reduced thickness. The result over the long t e r m is a solid r ib geonet thickness equivalent to other nonfoamed geonets.
The fourth type of geosynthetic is a geomembrane, or FML. It is the primary defense against escaping leachate and of crucial importance. FMLs are the focus of Chapter Three.
55
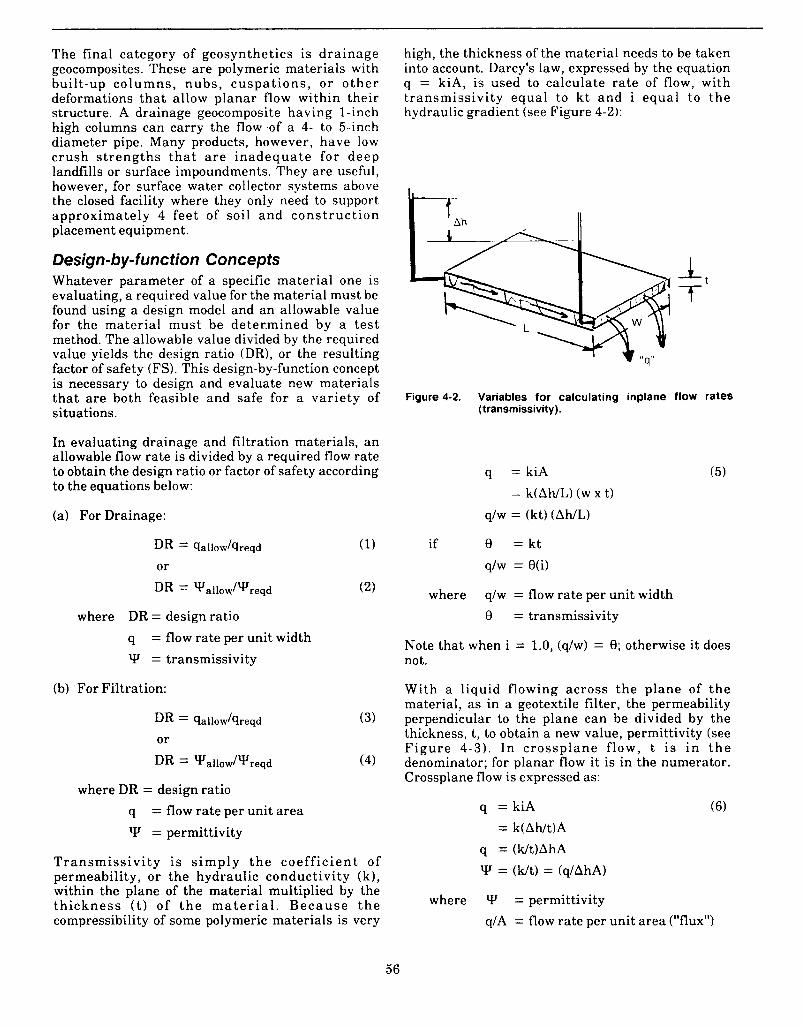
The final category of geosynthetics is dra inage geocomposites. These are polymeric materials with built-up co lumns , nubs , cuspa t ions , or o t h e r deformations tha t allow planar flow within their structure. A drainage geocomposite having 1-inch high columns can carry the flow .of a 4- to 5-inch diameter pipe. Many products, however, have low crush s t r eng ths t h a t a r e inadequa te for deep landfills or surface impoundments. They are useful, however, for surface water collector systems above the closed facility where they only need to support approximately 4 feet of soil and cons t ruc t ion placement equipment.
Design- by- function Concepts Whatever parameter of a specific material one is evaluating, a required value for the material must be found using a design model and a n allowable value for the mater ia l mus t be deter.mined by a tes t method. The allowable value divided by the required value yields the design ratio (DR), or the resulting factor of safety (FS). This design-by-function concept is necessary to design and evaluate new materials tha t are both feasible and safe for a var ie ty of situations.
In evaluating drainage and filtration materials, an allowable flow rate is divided by a required flow rate to obtain the design ratio or factor of safety according to the equations below:
(a) For Drainage:
where DR = design ratio
q Y = transmissivity
= flow rate per unit width
(b) for Fcltration:
DR = qallow/qreqd (3)
DR = Yallow/Yreqd (4) or
where DR = design ratio
q Y = permittivity
= flow rate per unit area
Transmiss iv i ty is s i m p l y t h e coef f ic ien t of permeability, or the hydraulic conductivity (k) , within the plane of the material multiplied by the t h i c k n e s s ( t ) of t h e m a t e r i a l . B e c a u s e t h e compressibility of some polymeric materials is very
high, the thickness of the material needs to be taken into account. Darcy's law, expressed by the equation q = kiA, is used to calculate rate of flow, with t ransmiss iv i ty equal to k t a n d i equal to t h e hydraulic gradient (see Figure 4-2):
Figure 4-2. Variables for calculating inplane flow rates (transmissivity).
q = kiA = k(Ah/L) (w x t)
qlw = (kt) (Ah/L)
if 8 = kt q/w = e(;)
where qlw = flow rate per unit width 8 = transmissivity
Note that when i = 1.0, (q/w) = 8; otherwise it does not.
Wi th a l iquid flowing across the plane of t h e material, as in a geotextile filter, the permeability perpendicular to the plane can be divided by the thickness, t, to obtain a new value, permittivity (see F igure 4 - 3 ) . I n c ros sp lane f low, t is i n t h e denominator; for planar flow it is in the numerator. Crossplane flow is expressed as:
q = kiA (6) = k(Ah/t)A
q =(Wt)AhA Y = (Ut) = (q/AhA)
where Y = permittivity q/A = flow rate per unit area (''flux'')
56
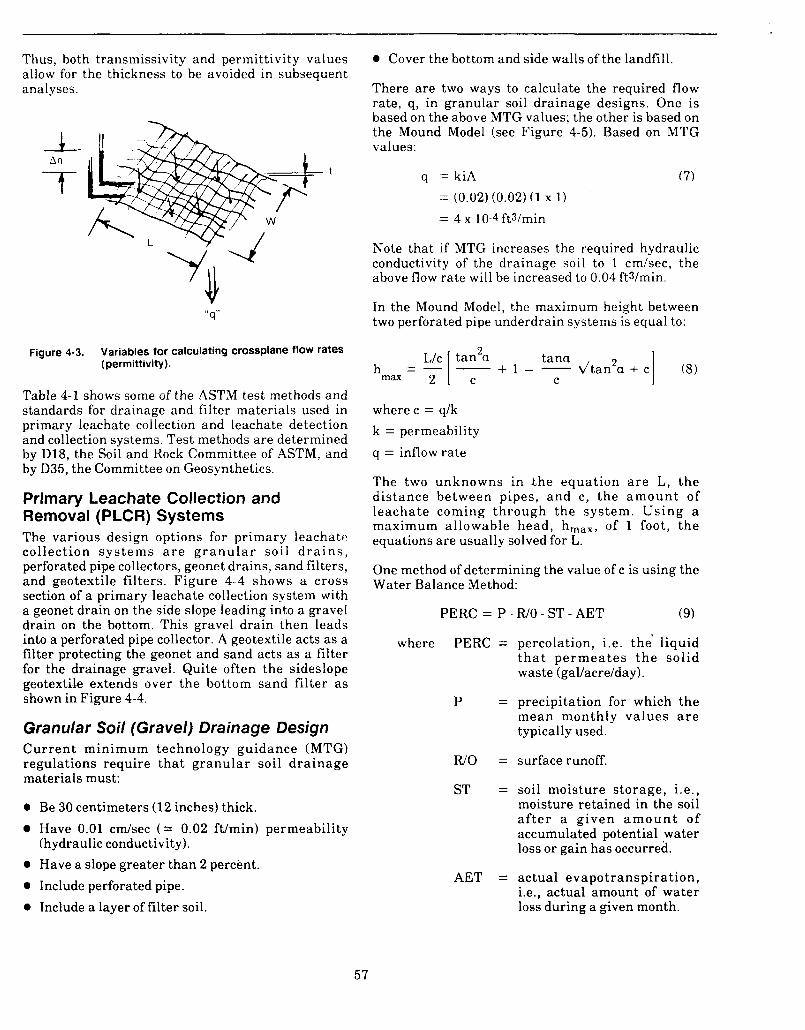
Thus, both transmissivity and permittivity values allow for the thickness to be avoided in subsequent analyses.
Ah t
Figure 4-3. Variables for calculating crossplane flow rates (permittivity).
Table 4-1 shows some of the ASTM test methods and standards for drainage and filter materials used in primary leachate collection and leachate detection and collection systems. Test methods are determined by D18, the Soil and Rock Committee of ASTM, and by D35, the Committee on Geosynthetics.
Primary Leachate Collection and Removal (PLCR) Systems The various design options for primary leachate collection sys t ems a r e g r a n u l a r soil d r a i n s , perforated pipe collectors, geonet drains, sand filters, and geotextile filters. Figure 4-4 shows a cross section of a primary leachate collection system with a geonet drain on the side slope leading into a gravel drain on the bottom. This gravel drain then leads into a perforated pipe collector. A geotextile acts as a filter protecting the geonet and sand acts as a filter for the drainage gravel. Quite often the sideslope geotextile extends over the bottom sand filter as shown in Figure 4-4.
Granular Soil (Gravel) Drainage Design Current minimum technology guidance (MTG) regulations require tha t granular soil drainage materials must:
0 Be 30 centimeters (12 inches) thick.
0 Have 0.01 c d s e c ( = 0.02 ft/min) permeability (hydraulic conductivity).
0 Have a slope greater than 2 percent. 0 Include perforated pipe. 0 Include a layer of filter soil.
0 Cover the bottom and side walls of the landfill.
There are two ways to calculate the required flow rate, q, in granular soil drainage designs. One is based on the above MTG values; the other is based on the Mound Model (see Figure 4-5). Based on MTG values:
q = kiA = (0.02) (0.02) (1 x 1)
= 4 x 10⁻⁴ ftslmin
(7)
Note that if MTG increases the required hydraulic conductivity of the drainage soil to 1 cmlsec, the above flow rate will be increased to 0.04 ftslmin.
In the Mound Model, the maximum height between two perforated pipe underdrain systems is equal to:
tana + 1 - - dtan’a + c 2 C
wherec = qlk k = permeability q = inflow rate
The two unknowns in t h e equat ion a r e L, the dis tance between pipes, and c, the a m o u n t of leachate coming through the system. Us ing a maximum allowable head, hmax, of 1 foot, the equations are usually solved for L.
One method of determining the value of c is using the Water Balance Method:
PERC = P - W O - S T - A E T (9)
where PERC = percolation, i .e. the‘ liquid t h a t pe rmea te s t h e solid waste (gallacrelday).
P = precipitation €or which the mean monthly values a r e typically used.
WO = surfacerunoff.
ST = soil moisture s torage, i .e . , moisture retained in the soil a f t e r a given a m o u n t of accumulated potential water loss or gain has occurred.
AET = actual evapotranspirat ion, i.e., actual amount of water loss during a given month.
57
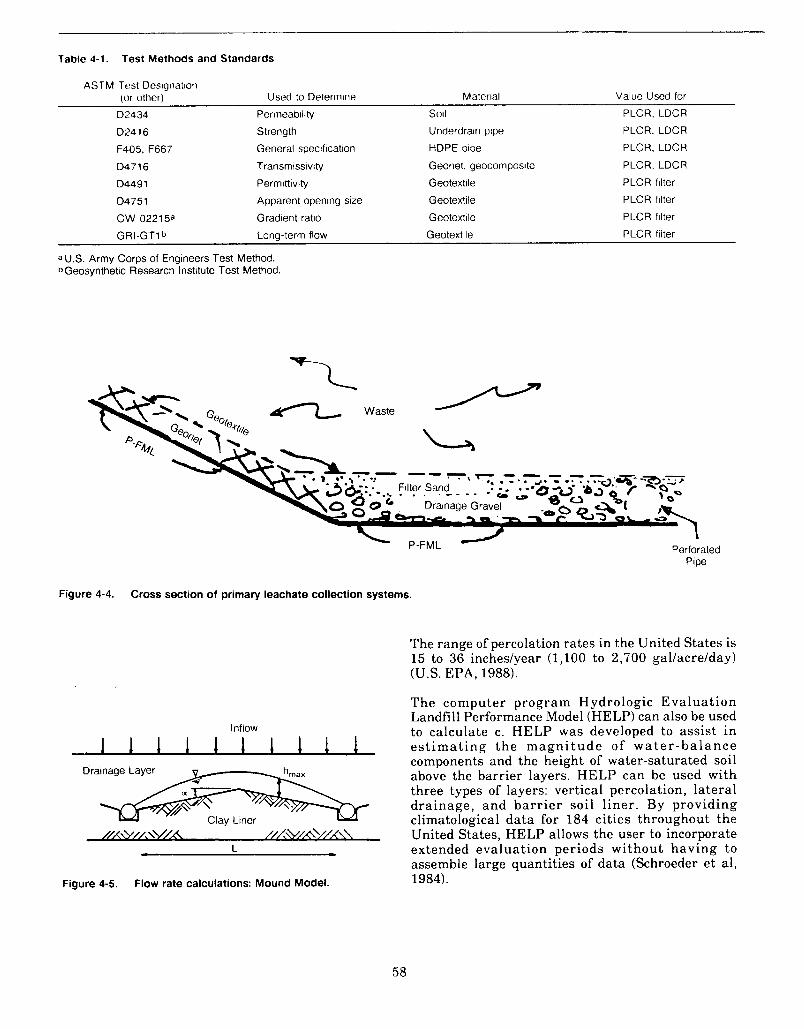
Table 4-1. Test Methods and Standards
ASTM Test Desigiiatioii (or other) Used to Determine Material Value Used for
Perineability soil PLCR, LDCR D2434 D24 16 Strength Underdrain pipe PLCR, LDCR
General specification HDPE pipe PLCR, LDCR F405, F667 D4716 Transmissivity Geonet, geocomposite PLCR, LDCR
D4491 Permittivity Geotextile PLCR filter
D4751 Apparent opening size Geotextile PLCR filter
cw-02215a Gradient ratio Geotextile PLCR filter
GRI-GTlb Long-term flow Geotextile PLCR filter
a US. Army Corps of Engineers Test Method. bGeosynthetic Research Institute Test Method.
& Waste
Perforated Pipe
Figure 4-4. Cross section of primary leachate collection systems.
The range of percolation rates in the United States is 15 to 36 incheslyear (1,100 to 2,700 gallacrelday) (U.S. EPA, 1988).
The computer program Hydrologic Evalua t ion Landfill Performance Model (HELP) can also be used to calculate c. HELP w a s developed to assist in
1 1 1 1 1 1 1 1 1 1 e s t i m a t i n g the m a g n i t u d e of w a t e r - b a l a n c e components and the height of water-saturated soil above the barrier layers. HELP can be used with three types of layers: vertical percolation, lateral drainage, and bar r ie r soil l iner . By providing climatological data for 184 cities throughout the
Inflow
Drainage Layer
///\W ,\V/A ///,W/A \//A,\ United States, HELP allows the user to incorporate e L extended evaluation periods without having to
assemble large quantities of data (Schroeder et al , Figure 4-5. Flow rate calculations: Mound Model. 1984).
58
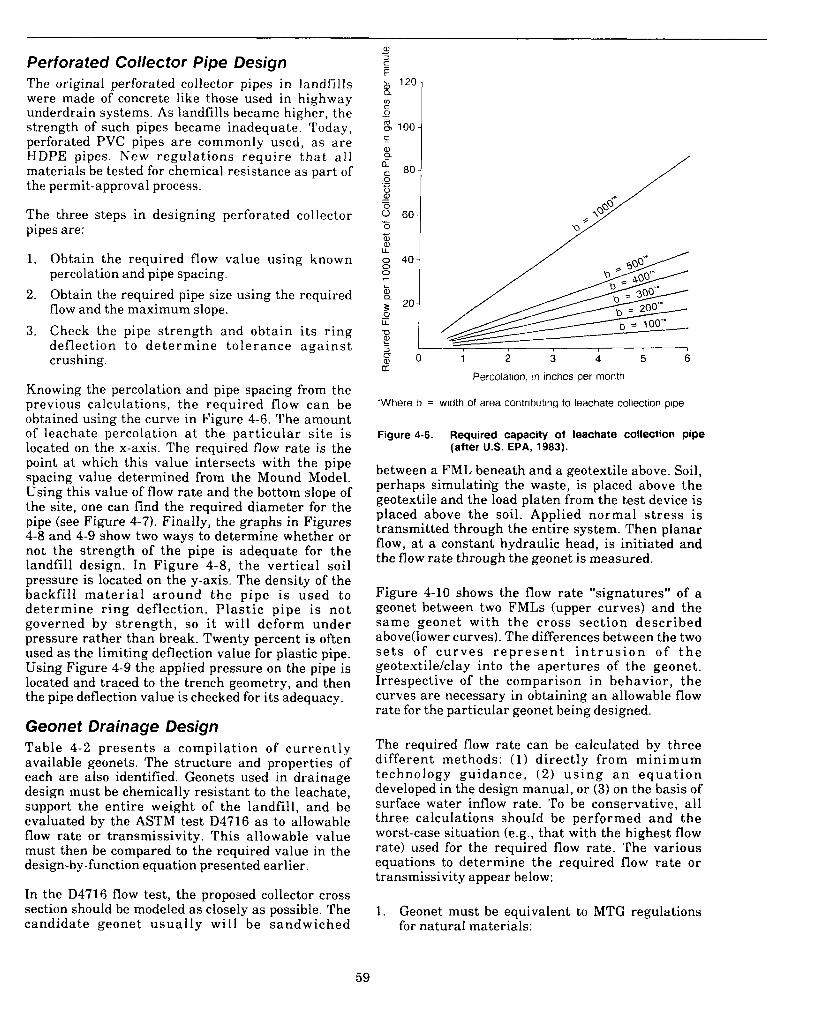
Perforated Collector Pipe Design The original perforated collector pipes in landfills were made of concrete like those used in highway underdrain systems. As landfills became higher, the strength of such pipes became inadequate. Today, perforated PVC pipes a re commonly used, as a re HDPE pipes. New regulat ions require tha t a l l materials be tested for chemical resistance as part of the permit-approval process.
The three steps in designing perforated collector pipes are:
1.
2.
3.
Obtain the required flow value using known percolation and pipe spacing. Obtain the required pipe size using the required flow and the maximum slope. Check the pipe strength and obtain i t s r ing deflection to de t e rmine to le rance a g a i n s t crushing.
Knowing the percolation and pipe spacing from the previous calculations, the required flow can be obtained using the curve in Figure 4-6. The amount of leachate percolation a t the par t icular s i te is located on the x-axis. The required flow rate is the point a t which this value intersects with the pipe spacing value determined from the Mound Model. Using this value of flow rate and the bottom slope of the site, one can find the required diameter for the pipe (see Figure 4-7). Finally, the graphs in Figures 4-8 and 4-9 show two ways to determine whether or not the s t rength of the pipe is adequate for the landfill design. In Figure 4-8, the vertical soil pressure is located on the y-axis. The density of the backfill ma te r i a l a r o u n d the pipe is used to determine r ing deflection. P las t ic pipe i s not governed by s t rength , so i t will deform under pressure rather than break. Twenty percent is often used as the limiting deflection value for plastic pipe. Using Figure 4-9 the applied pressure on the pipe is located qnd traced to the trench geometry, and then the pipe deflection value is checked for its adequacy.
Geonet Drainage Design Table 4-2 presents a compilation of cu r ren t ly available geonets. The structure and properties of each are also identified. Geonets used in drainage design must be chemically resistant to the leachate, support the ent i re weight of the landfill, and be evaluated by the ASTM test D4716 as to allowable flow rate or transmissivity. This allowable value must then be compared to the required value in the design-by-function equation presented earlier.
In the D4716 flow test, the proposed collector cross section should be modeled as closely as possible. The candidate geonet u sua l ly will be sandwiched
a, 3 c
c_ E
- % 100 c 1 2 0 i
Percolation, in inches per month
'Where b = width of area contributing to leachate collection pipe
Figure 4-6. Required capacity of leachate collection pipe
between a FML beneath and a geotextile above. Soil, perhaps simulatidg the waste, is placed above the geotextile and the load platen from the test device is placed above the soil. Applied normal s t r e s s is transmitted through the entire system. Then planar flow, a t a constant hydraulic head, is initiated and the flow rate through the geonet is measured.
(after US. EPA, 1983).
Figure 4-10 shows the flow rate "signatures" of a geonet between two FMLs (upper curves) and the same geonet with the cross sect ion descr ibed above(1ower curves). The differences between the two s e t s of c u r v e s r e p r e s e n t i n t r u s i o n of t h e geotextile/clay into the apertures of the geonet. Irrespective of the comparison in behavior, the curves are necessary in obtaining an allowable flow rate for the particular geonet being designed.
The required flow rate can be calculated by three different methods: ( 1 ) directly from minimum technology guidance , (2) u s i n g a n e q u a t i o n developed in the design manual, or (3) on the basis of surface water inflow rate. To be conservative, a l l three calculations should be performed and the worst-case situation (e.g., that with the highest flow rate) used €or the required flow rate. The various equations to determine the required flow rate or transmissivity appear below:
1. Geonet must be equivalent to MTG regulations for natural materials:
59
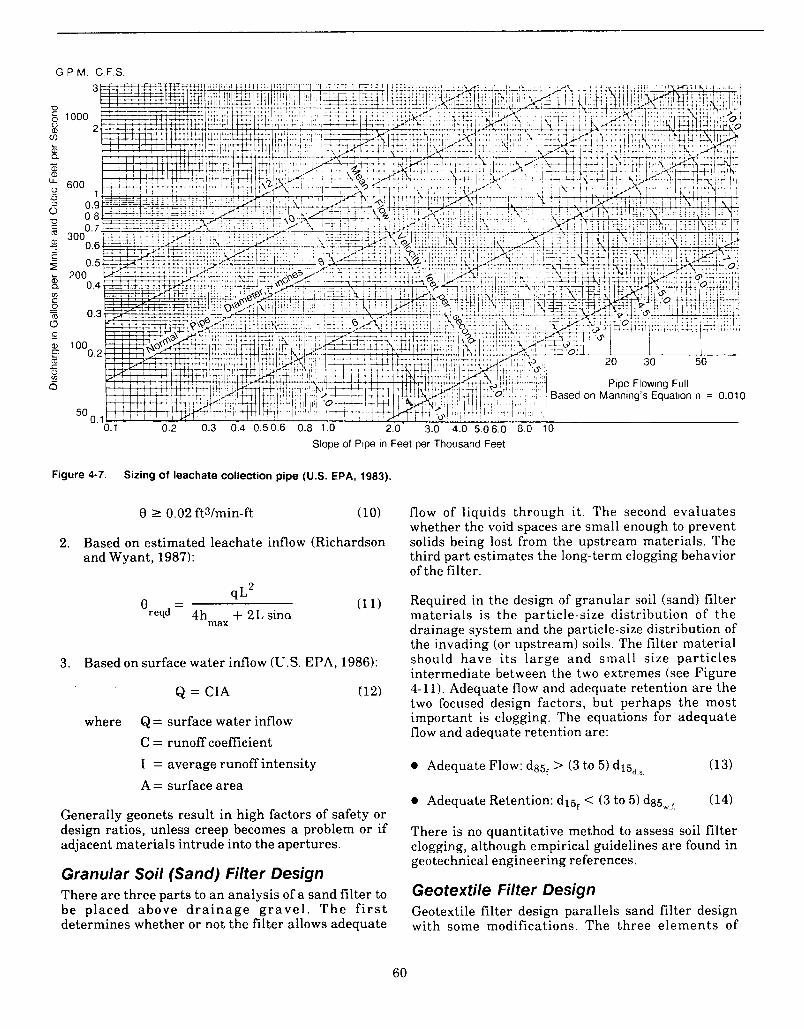
G.P.M. C.F.S
P 5 1000 V a, 0)
ai L
" !3 0
=O 0. 1
Slope of Pipe in Feet per Thousand Feet
Figure 4-7. Sizing of leachate collection pipe ( U S EPA, 1983).
0 2 0.02 ftalmin-ft (10)
2. Based on estimated leachate inflow (Richardson and Wyant, 1987):
Q L2 (1 1)
4h + 2Lsina max
3. Based on surface water inflow (U.S. EPA, 1986):
Q = CIA 112)
where Q = surface water inflow C = runoff coefficient I = average runoff intensity A = surface area
Generally geonets result in high factors of safety or design ratios, unless creep becomes a problem or if adjacent materials intrude into the apertures.
Granular Soil (Sand) filter Design There are three parts to a n analysis of a sand filter to be placed above d r a i n a g e g r a v e l . T h e f i r s t determines whether or not the filter allows adequate
Pipe Flowing Full on Manning's Equation n = 0.010
flow of liquids through it. The second evaluates whether the void spaces are small enough to prevent solids being lost from the upstream materials. The third part estimates the long-term clogging behavior of the filter.
Required in the design of granular soil (sand) filter materials is the particle-size distribution of the drainage system and the particle-size distribution of the invading (or upstream) soils. The filter material should have i t s large and small size par t ic les intermediate between the two extremes (see Figure 4-11). Adequate flow and adequate retention are the two focused design factors, but perhaps the most important is clogging. The equations for adequate flow and adequate retention are:
0 Adequate Flow: d ~ 5 ~ > (3 to 5) d15~,,. (13)
0 Adequate Retention: d15~ < (3 to 5) d85,,f, (14)
There is no quantitative method to assess soil filter clogging, although empirical guidelines are found in geotechnical engineering references.
Geotextile filter Design Geotextile filter design parallels sand filter design with some modifications. The three elements of
60
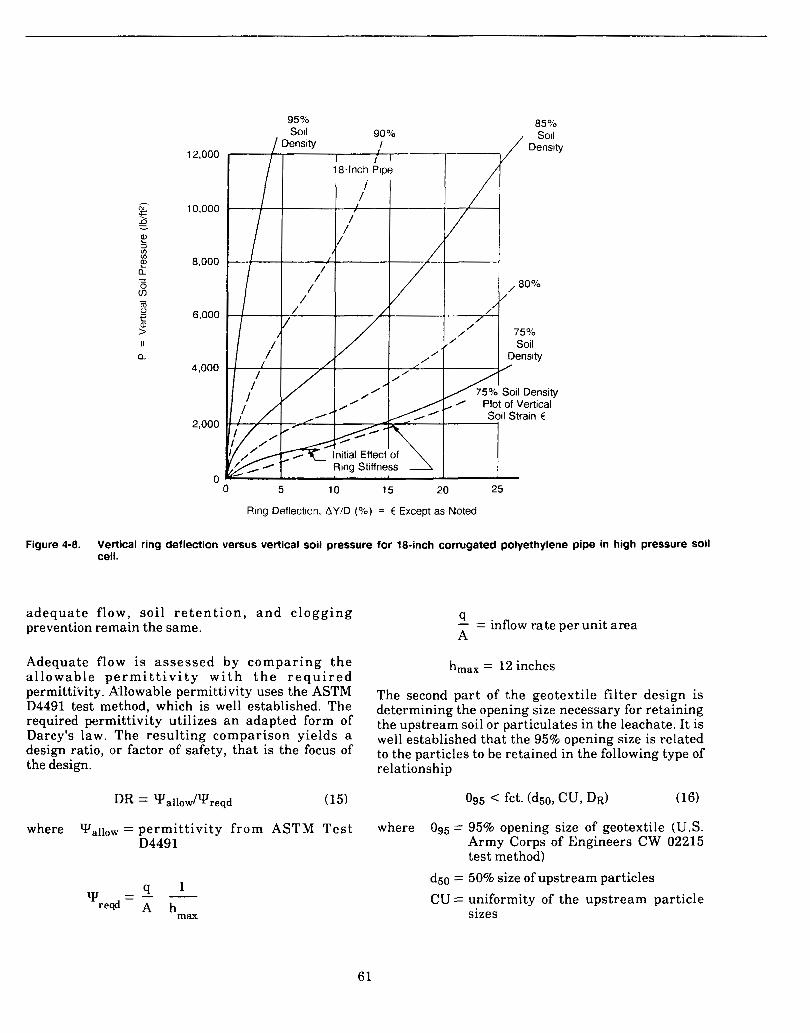
12,000
10,000
8,000
6,000
4,000
2,000
0
Ring Deflection, AY/D (%) = E Except as Noted
Figure 4-8. Vertical ring deflection versus vertical soil pressure for 18-inch corrugated polyethylene pipe in high pressure Soil cell.
adequa te flow, soi l r e t e n t i o n , a n d c logg ing prevention remain the same.
Adequate flow is a s ses sed by compar ing t h e a l lowab le p e r m i t t i v i t y w i t h t h e r e q u i r e d permittivity. Allowable permittivity uses the ASTM D4491 test method, which is well established. The required permittivity utilizes a n adapted form of Darcy's law. The resulting comparison yields a design ratio, or factor of safety, that is the focus of the design.
DR = 'Yallow/yreqd (15)
where Yallow = permit t ivi ty f rom ASTM T e s t D4491
q - = inflow rate per unit area A
h,,, = 12 inches
The second part of the geotextile filter design is determining the opening size necessary for retaining the upstream soil or particulates in the leachate. It is well established that the 95% opening size is related to the particles to be retained in the following type of relationship
095 < fct. (d50, cu, DR) (16)
095 = 95% opening size of geotextile (U.S. Army Corps of Engineers CW 02215 test method)
where
d50 = 50% size of upstream particles C U = uniformity of the upstream particle
sizes
61
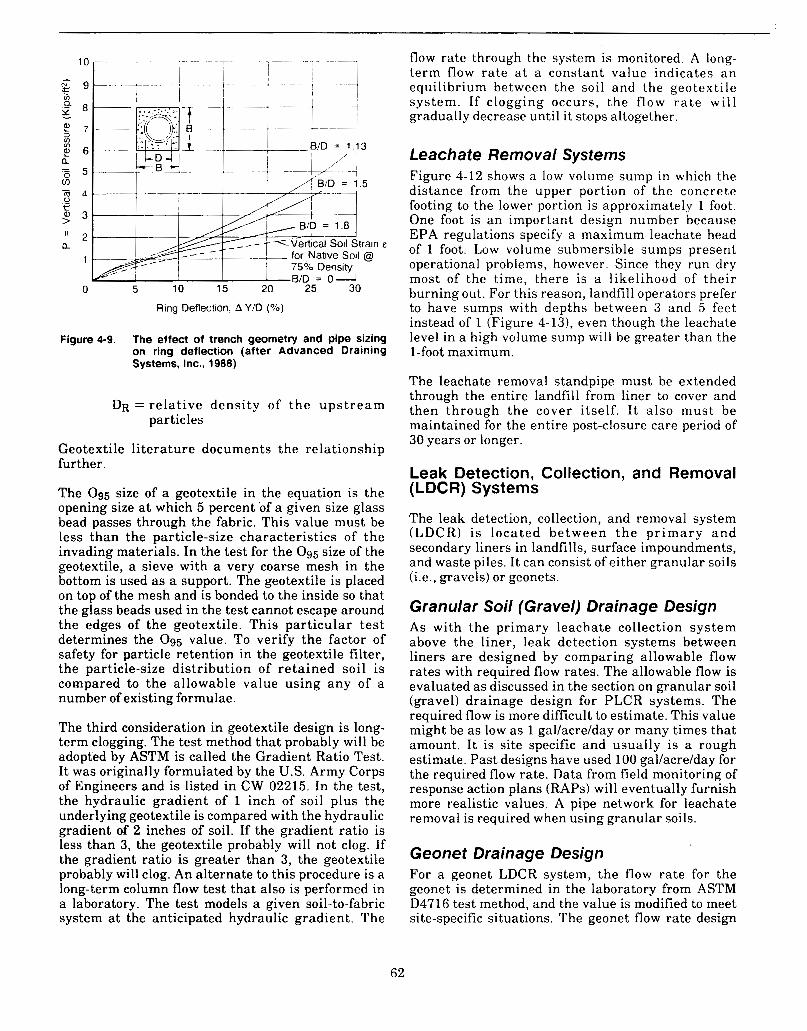
4
0 3
- : K > 'I 2 a
1
0
E= - - -Vertical Soil Strain E
for Native Soil @ 75% Densitv
i 1 B/D = 0- 5 10 15 20 25 30
Ring Deflection, A Y/D (YO)
Figure 4-9. The effect of trench geometry and pipe sizing on ring deflection (after Advanced Draining Systems, Inc., 1988)
DR = re lat ive density of t h e u p s t r e a m particles
Geotextile l i terature documents the relationship further.
The 095 size of a geotextile in the equation is the opening size a t which 5 percent of a given size glass bead passes through the fabric. This value must be less than the particle-size characteristics of the invading materials. In the test for the 0 9 5 size of the geotextile, a sieve with a very coarse mesh in the bottom is used as a support. The geotextile is placed on top of the mesh and is bonded to the inside so that the glass beads used in the test cannot escape around the edges of the geotextile. This particular tes t determines the 095 value. To verify the factor of safety for particle retention in the geotextile filter, the particle-size distribution of re ta ined soil is compared to the allowable value using any of a number of existing formulae.
The third consideration in geotextile design is long- term clogging. The test method that probably will be adopted by ASTM is called the Gradient Ratio Test. It was originally formulated by the U.S. Army Corps of Engineers and is listed in CW 02215. In the test, the hydraulic gradient of 1 inch of soil plus the underlying geotextile is compared with the hydraulic gradient d 2 inches of soil. If the gradient ratio is less than 3, the geotextile probably will not clog. If the gradient ratio is greater than 3, the geotextile probably will clog. An alternate to this procedure is a long-term column flow test that also is performed in a laboratory. The test models a given soil-to-fabric system a t the anticipated hydraulic gradient. The
flow rate through the system is monitored. A long- term flow rate a t a constant value indicates a n equilibrium between the soil and the geotextile system. If clogging occurs, the f l o w r a t e w i l l gradually decrease until it stops altogether.
Leachate Removal Systems Figure 4-12 shows a low volume sump in which the distance from the upper portion of the concrete footing to the lower portion is approximately 1 foot. One foot is an important design number because EPA regulations specify a maximum leachate head of 1 foot. Low volume submersible sumps present operational problems, however. Since they run dry most of the time, there is a likelihood of the i r burning out. For this reason, landfill operators prefer to have sumps with depths between 3 and 5 feet instead of 1 (Figure 4-13), even though the leachate level in a high volume sump will be greater than the 1-foot maximum.
The leachate removal standpipe must be extended through the entire landfill from liner to cover and then through the cover i tself . I t also must be maintained for the entire post-closure care period of 30 years or longer.
Leak Detection, Collection, and Removal (LDCR) Systems
The leak detection, collection, and removal system (LDCR) i s located be tween t h e p r i m a r y a n d secondary liners in landfills, surface impoundments, and waste piles. It can consist of either granular soils (i.e., gravels) or geonets.
Granular Soil (Gravel) Drainage Design As with the primary leachate collection system above the liner, leak detection systems between liners a re designed by comparing allowable flow rates with required flow rates, The allowable flow is evaluated as discussed in the section on granular soil (gravel) drainage design for PLCR systems. The required flow is more difficult to estimate. This value might be as low as 1 gallacrelday or many times that amount. It is site specific and usually is a rough estimate. Past designs have used 100 gallacreiday for the required flow rate. Data from field monitoring of response action plans (RAPS) will eventually furnish more realistic values. A pipe network for leachate removal is required when using granular soils.
Geonet Drainage Design For a geonet LDCR system, the flow rate for the geonet is determined in the laboratory from ASTM D4716 test method, and the value is modified to meet site-specific situations. The geonet flow rate design
62
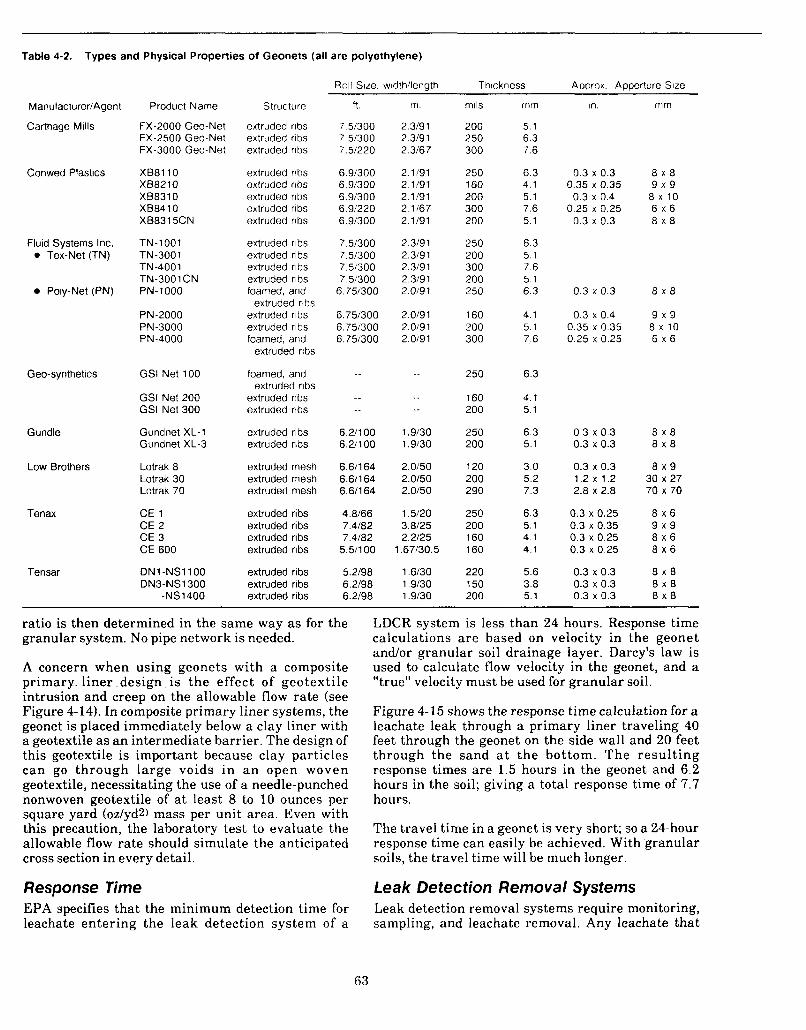
Table 4-2. Types and Physical Properties of Geonets (all are polyethylene)
Manufacturer/Agenl
Carthage Mills
Conwed Plastics
Fluid Systems Inc. 0 Tex-Net (TN)
Poly-Net (PN)
Geo-synthetics
Gundle
Low Brothers
Tenax
Tensar
Product Name
FX-2000 Geo-Net FX-2500 Geo-Ne1 FX-3000 Geo-Ne1
XB8110 XB8210 XB8310 XB84 10 XB8315CN
TN-1001 TN-3001 TN-4001 TN-3001CN PN- 1000
PN-2000 PN-3000 PN-4000
GSI Net 100
GSI Net 200 GSI Net 300
Gundnet XL-1 Gundnet XL-3
Lotrak 8 Lotrak 30 Lotrak 70
CE 1 CE 2 CE 3 CE 600
DN1-NS1100 DN3-NS1300
-NS1400
Roll Size, widthllenqth Thickness Approx. Apperture Size
Structure
extruded ribs extruded ribs extruded ribs
extruded ribs extruded ribs extruded ribs extruded ribs extruded ribs
extruded ribs extruded ribs extruded ribs extruded ribs foamed, and
extruded ribs extruded ribs foamed, and
foamed, and
extruded ribs extruded ribs
extruded ribs extruded ribs
extruded mesh extruded mesh extruded mesh
extruded ribs extruded ribs extruded ribs extruded ribs
extruded ribs extruded ribs extruded ribs
extruded ribs
extruded ribs
extruded ribs
f t m
7.51300 2.3191 7 51300 2.3191 7.51220 2.3167
6.91300 2.1191 6,91300 2 1/91 6.91300 2.1191 6.91220 2.1167 6.91300 2.1191
7.51300 2.3191 7.51300 2.3191 7.51300 2.3191 7.51300 2.3191
6.75i300 2.0191
6.751300 2.0191 6.751300 2.0191 6.751300 2.0191
6.211 00 1.9130 6.211 00 1.9130
6.61164 2.0150 6.61164 2.0150 6.611 64 2.0150
4.8166 1.5120
7.4182 2.2125 5.51100 1.67130.5
5.2198 1.6130 6.2198 1.9130 6.2/98 1.9130
7.4182 3.8125
mils
200 250 300
250 160 200 300 200
250 200 300 200 250
160 200 300
250
160 200
250 200
120 200 290
250 200 160 160
220 150 200
mm
5 1 6 3 7 6
6 3 4 1 5 1 7 6 5 1
6 3 5 1 7 6 5 1 6 3
4 1 5 1 7 6
6 3
4 1 5 1
6 3 5 1
3 0 5 2 7 3
6 3 5 1 4 1 4 1
5 6
5 1 3 8
in. mm
0.3 x 0.3 8 x 8
0.3 x 0.4 8 x 1 0
8 x 8
0.35 x 0.35
0.25 x 0.25 0.3 x 0.3
9 x 9
6 x 6
0.3 x 0.3 8 x 8
0.3 x 0.4 9 x 9
6 x 6 0.35 x 0.35 a x i o 0.25 x 0.25
0.3 x 0.3 0.3 x 0.3
0.3 x 0.3 1.2 x 1.2 2.8 x 2.8
0.3 x 0.25 0.3 x 0.35 0.3 x 0.25 0.3 x 0.25
0.3 x 0.3 0.3 x 0.3 0.3 x 0.3
8 x 8 8 x 8
8 x 9 30 x 27 70 x 70
8 x 6 9 x 9 8 x 6 8 x 6
8 x 8 8 x 8 8 x 8
ratio is then determined in the same way as for the granular system. No pipe network is needed.
A concern when using geonets with a composite primary. l iner .design is the effect of geotextile intrusion and creep on the allowable flow rate (see Figure 4-14). In composite primary liner systems, the geonet is placed immediately below a clay liner with a geotextile as a n intermediate barrier. The design of this geotextile is important because clay particles can go through la rge voids i n a n open woven geotextile, necessitating the use of a needle-punched nonwoven geotextile of a t least 8 to 10 ounces per square yard (ozJyd2) mass per unit area. Even with this precaution, the laboratory test to evaluate the allowable flow rate should simulate the anticipated cross section in every detail.
Response Time EPA specifies that the minimum detection time for leachate entering the leak detection system of a
LDCR system is less than 24 hours. Response time calculations a re based on velocity in the geonet andlor granular soil drainage layer. Darcy's law is used to calculate flow velocity in the geonet, and a "true" velocity must be used for granular soil.
Figure 4-15 shows the response time calculation for a leachate leak through a primary liner traveling 40 feet through the geonet on the side wall and 20 feet through the sand a t the bottom. The resul t ing response times are 1.5 hours in the geonet and 6.2 hours in the soil; giving a total response time of 7.7 hours.
The travel time in a geonet is very short; so a 24-hour response time can easily be achieved. With granular soils, the travel time will be much longer.
Leak Detection Removal Systems Leak detection removal systems require monitoring, sampling, and leachate removal. Any leachate that
63
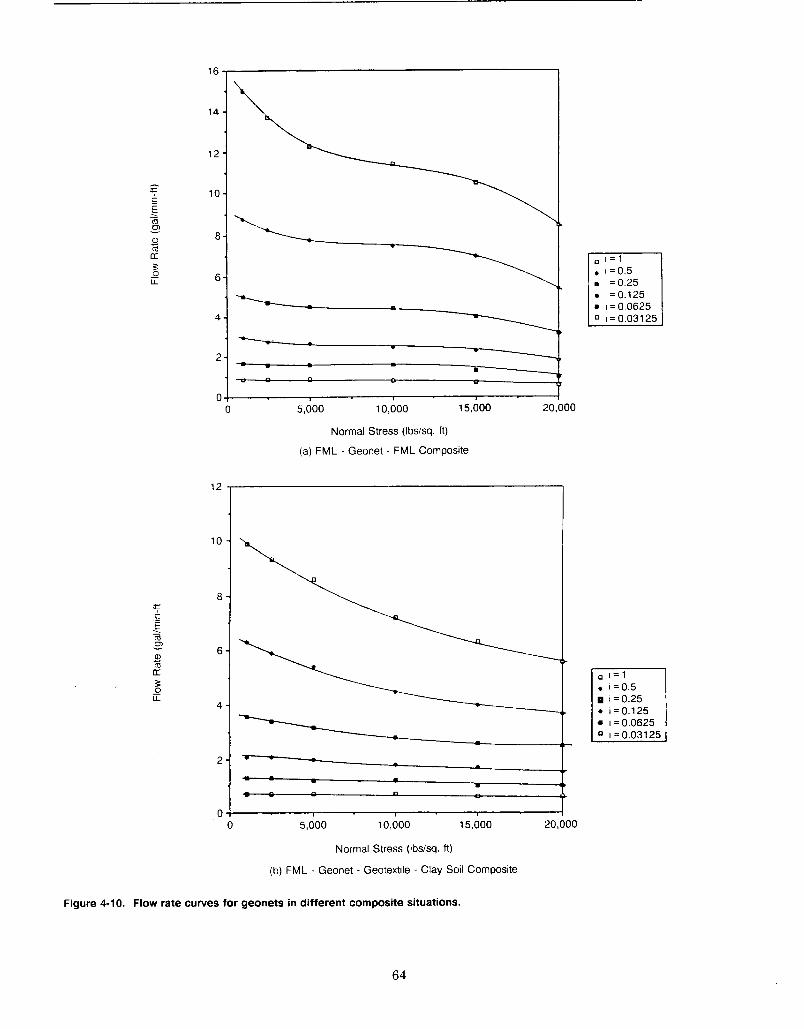
f r E 1 m m v
04 0 5,000 10,000 15,000 20,000
Normal Stress (Ibsisq. ft)
(a) FML - Geonet - FML Composite
10 -
a -
6 -
4 -
0 5,000 10,000 15,000 20,000
Normal Stress (Ibsisq. ft)
(b) FML - Geonet - Geotextile - Clay Soil Composite
. i = o 5
1=0.125 = I = O 0625
I = 0.25 e i=0.125
i=O.O625 0 I = 0.031 25
Figure 4-10. Flow rate curves for geonets in different composite situations.
64
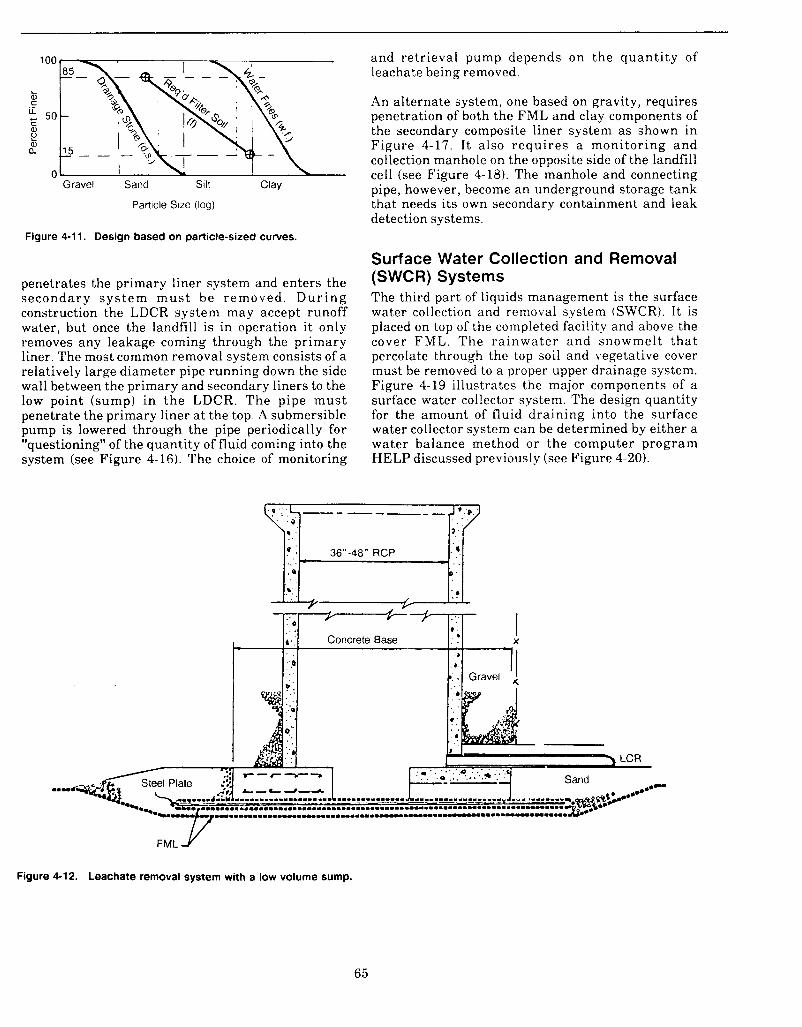
Gravel Sand Sllt Clay
Particle Size (log)
Figure 4-1 1. Design based on particle-sized curves.
penetrates the primary liner system and enters the secondary sys t em m u s t be removed. D u r i n g construction the LDCR system may accept runoff water, but once the landfill is in operation i t only removes any leakage coming through the primary liner. The most common removal system consists of a relatively large diameter pipe running down the side wall between the primary and secondary liners to the low point (sump) in the LDCR. The pipe mus t penetrate the primary liner a t the top. A submersible pump is lowered through the pipe periodically for "questioning" of the quantity of fluid coming into the system (see Figure 4-16). The choice of monitoring
and retrieval pump depends on the quant i ty of leachate being removed.
An alternate system, one based on gravity, requires penetration of both the FML and clay components of the secondary composite liner system as shown in Figure 4-17. I t also requi res a monitoring and collection manhole on the opposite side of the landfill cell (see Figure 4-18). The manhole and connecting pipe, however, become an underground storage tank that needs its own Secondary containment and leak detection systems.
Surface Water Collection and Removal (SWCR) Systems The third part of liquids management is the surface water collection and removal system (SWCR). It is placed on top of the completed facility and above the cover F M L . The ra inwater and snowmelt t ha t percolate through the top soil and vegetative cover must be removed to a proper upper drainage system. Figure 4-19 illustrates the major components of a surface water collector system. The design quantity for the amount of fluid draining into the surface water collector system can be determined by either a water balance method o r the computer program HELP discussed previously (see Figure 4-20).
Concrete Base
I . ( Gravel 'J
Figure 4-12. Leachate removal system with a low volume sump.
65
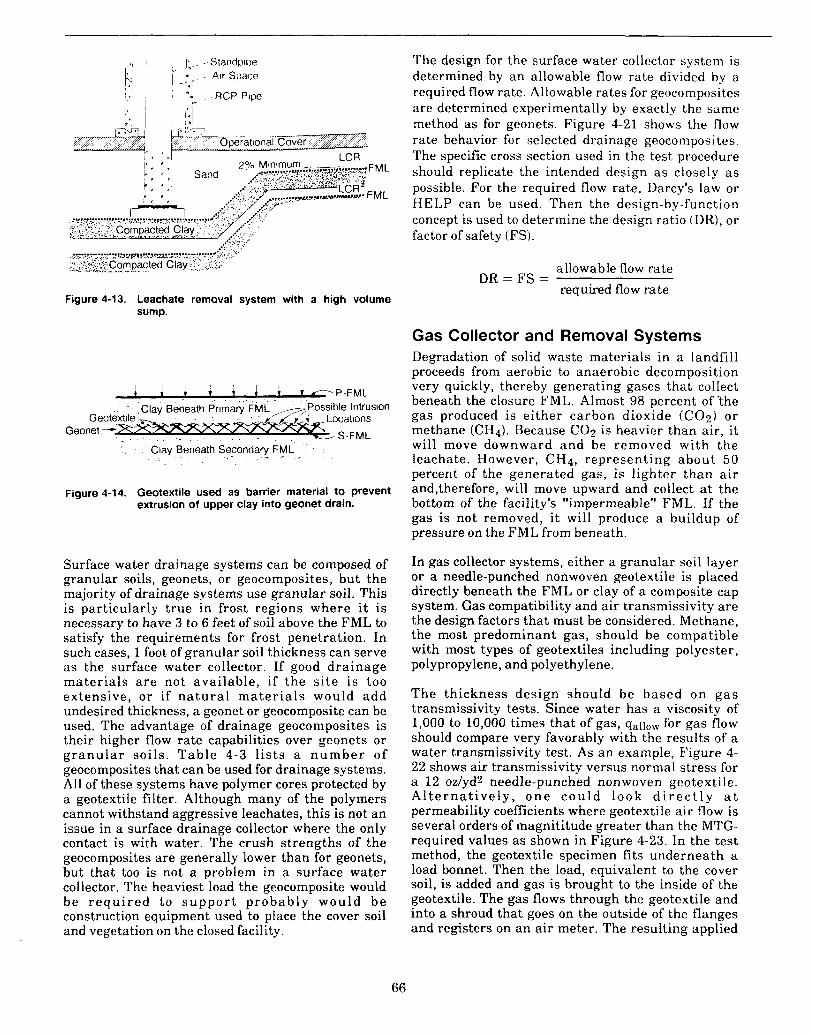
Figure 4-13. Leachate removal system with a high volume sump.
Clay Beneath Primary FML -Possible Intrusion Geotextile I ~ / i Locations
Geonet 4 x p I ~ G S-FML Clay Beneath Secondary FML -
Figure 4-1 4. Geotextile used as barrier material to prevent extrusion of upper clay into geonet drain.
Surface water drainage systems can be composed of granular soils, geonets, or geocomposites, but the majority of drainage systems use granular soil. This is particularly t rue in frost, regions where it is necessary to have 3 to 6 feet of soil above the FML to satisfy the requirements for frost penetration. In such cases, 1 foot of granular soil thickness can serve as the surface water collector. If good drainage mater ia ls a r e not available, if the s i t e is too extensive, or if n a t u r a l ma te r i a l s would add undesired thickness, a geonet or geocomposite can be used. The advantage of drainage geocomposites is their higher flow rate capabilities over geonets or g r a n u l a r soi ls . Table 4-3 l i s t s a n u m b e r of geocomposites that can be used for drainage systems. All of these systems have polymer cores protected by a geotextile filter. Although many of the polymers cannot withstand aggressive leachates, this is not an issue in a surface drainage collector where the only contact is with water. The crush strengths of the geocomposites are generally lower than for geonets, but that too is not a problem in a surface water collector. The heaviest load the geocomposite would be r e q u i r e d to s u p p o r t p robably would be construction equipment used to place the cover soil and vegetation on the closed facility.
The design for the surface water collector system is determined by an allowable flow rate divided by a required flow rate. Allowable rates for geocomposites are determined experimentally by exactly the same method as for geonets. Figure 4-21 shows the flow rate behavior for selected drainage geocomposites. The specific cross section used in the test procedure should replicate the intended design as closely as possible. For the required flow rate, Darcy's law or €fELP can be used. Then the design-by-function concept is used to determine the design ratio (DR), or factor of safety (FS).
allowable flow rate required flow rate
DR = FS =
Gas Collector and Removal Systems Degradation of solid waste materials in a landfill proceeds from aerobic to anaerobic decomposition very quickly, thereby generating gases that collect beneath the closure FML. Almost 98 percent of t he gas produced is either carbon dioxide ((202) o r methane (CH4). Because COz is heavier than air , it will move downward and be removed with the leachate. However, CH4, represent ing about 50 percent of the generated gas, is lighter than a i r and,therefore, will move upward and collect a t the bottom of the facility's "impermeable" FML. If the gas is not removed, i t will produce a buildup of pressure on the FML from beneath.
In gas collector systems, either a granular soil layer or a needle-punched nonwoven geotextile is placed directly beneath the FML or clay of a composite cap system. Gas compatibility and air transmissivity a re the design factors that must be considered. Methane, the most predominant gas, should be compatible with most types of geotextiles including polyester, polypropylene, and polyethylene.
The thickness design should be based on g a s transmissivity tests. Since water has a viscosity of 1,000 to 10,000 times that of gas, gallow for gas flow should compare very favorably with the results of a water transmissivity test. As an example, Figure 4- 22 shows air transmissivity versus normal stress for a 12 oz/yd2 needle-punched nonwoven geotextile. A l t e r n a t i v e l y , o n e c o u l d look d i r e c t l y a t permeability coefficients where geotextile air flow is several orders of magnititude greater than the MTG- required values as shown in Figure 4-23. In the test method, the geotextile specimen fits underneath a load bonnet. Then the load, equivalent to the cover soil, is added and gas is brought to the inside of the geotextile. The gas flows through the geotextile and into a shroud that goes on the outside of the flanges and registers on a n air meter. The resulting applied
66
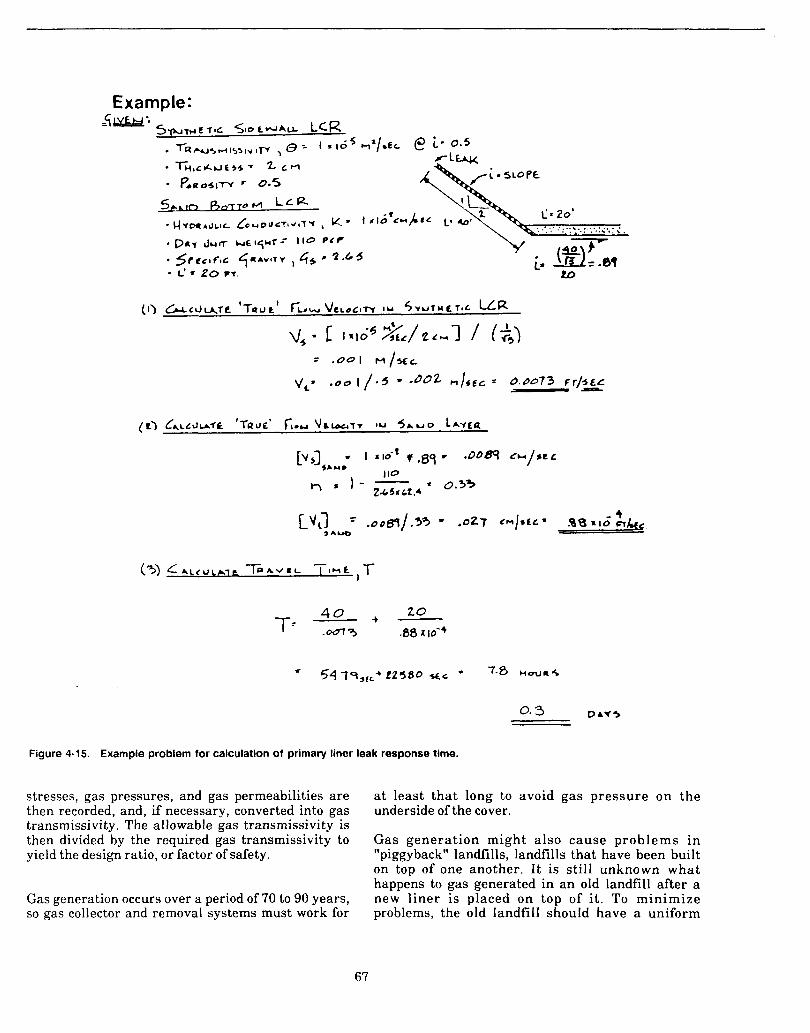
Figure 4-15. Example problem for calculation of primary liner leak response time.
stresses, gas pressures, and gas permeabilities are then recorded, and, if necessary, converted into gas transmissivity. The allowable gas transmissivity is then divided by the required gas transmissivity to yield the design ratio, or factor of safety.
a t least that long to avoid gas pressure on the underside of the cover.
Gas generation might also cause problems i n "piggyback" landfills, landfills that have been built on top of one another. It is still unknown what happens to gas generated in a n old landfill after a new l iner is placed on top of i t . To minimize problems, the old landfill should have a uniform
Gas generation occurs over a period of 70 to 90 years, so gas collector and removal systems must work for
67
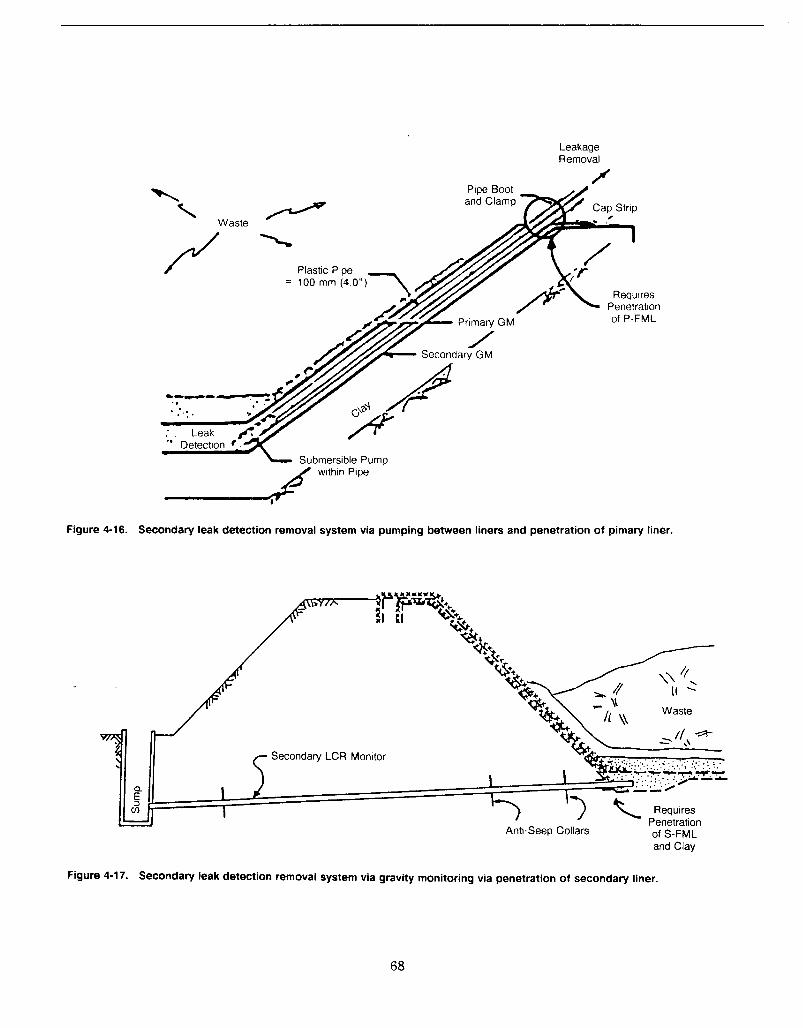
Leakage Removal
I I ,
Figure 4-16.
v
Submersible Pump
Secondary leak detection removal system via pumping between liners and penetration of pimary liner.
\ Requires Penetration
Wi-Seep Collars Of S-FML and Clay
Figure 4-1 7. Secondary leak detection removal system via gravity monitoring via penetration of secondary liner.
68
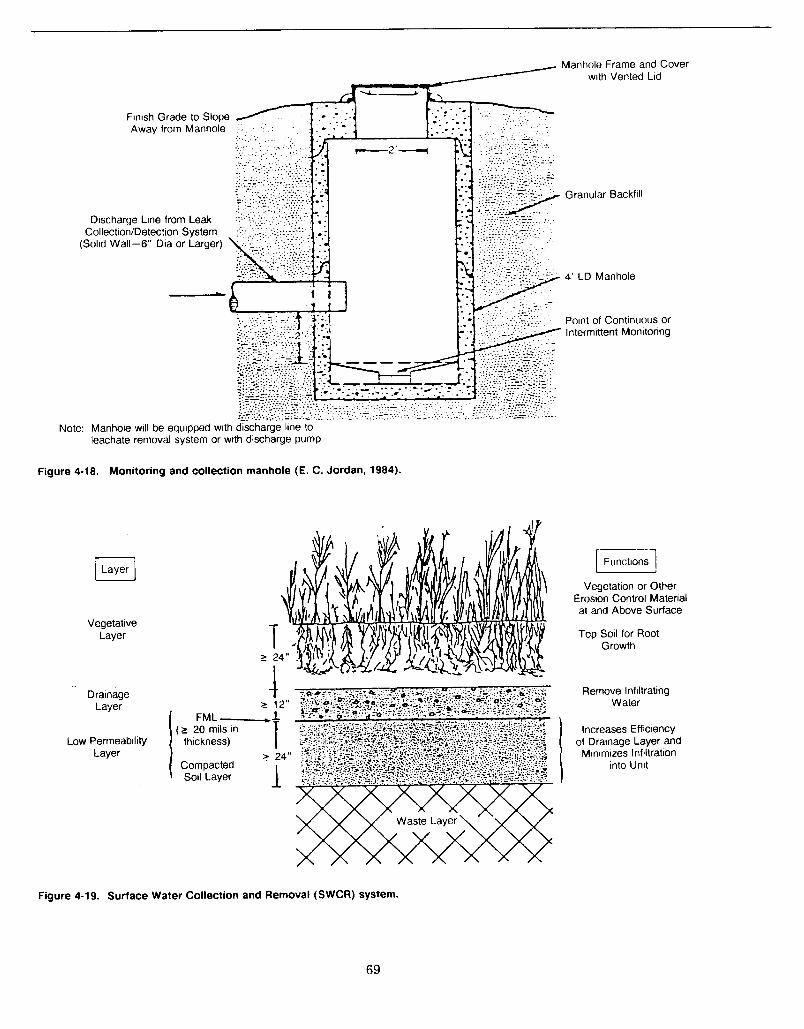
Note: Manhole will be equipped with discharge line to leachate removal system or with discharge pump
Figure 4-18. Monitoring and collection manhole (E. C. Jordan, 1984).
[Layer 1
Vegetative Layer
. Drainage Layer
Low Permeability Layer
Manhole Frame and Cover with Vented Lid
Granular Backfill
4' LD Manhole
Point of Continuous or ' Intermittent Monitoring
t 2 12"
FML .-.I
T ( t 20 mils in thickness)
2 24"
I Compacted Soil Layer
Vegetation or Other Erosion Control Material at and Above Surface
Top Soil for Root Growth
Remove Infiltrating Water
Increases Efficiency of Drainage Layer and
Minimizes Infiltration into Unit
I
Figure 4-19. Surface Water Collection and Removal (SWCR) system.
69
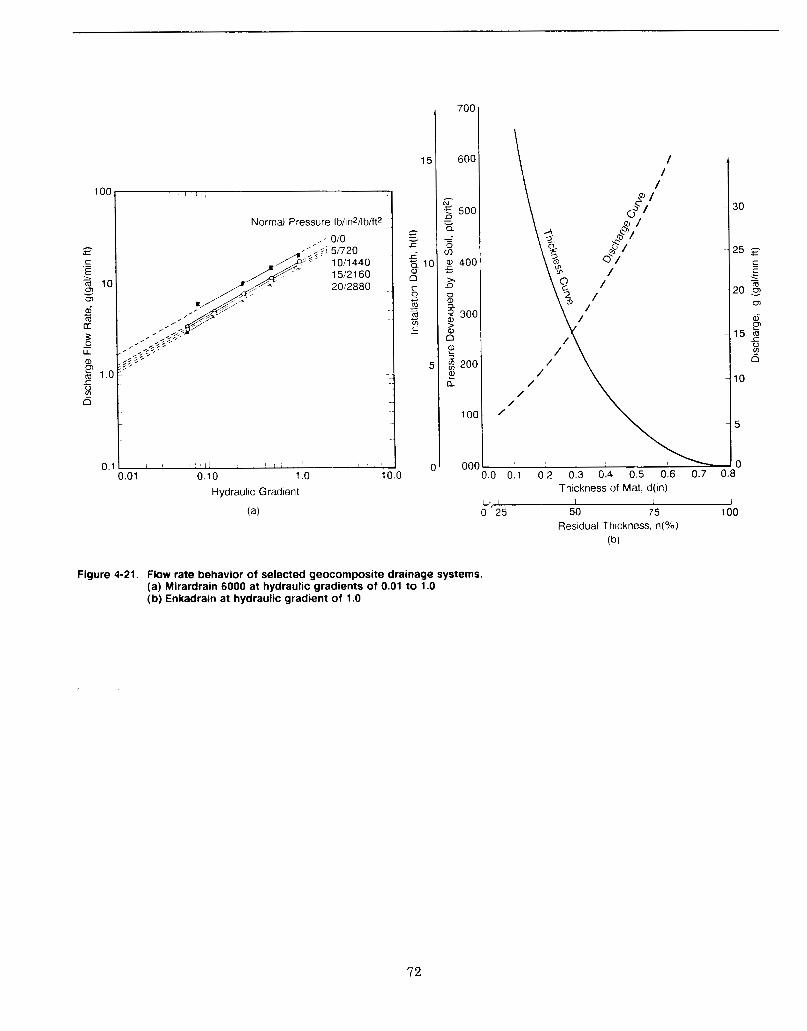
100
3z E E .
10 1
0
6 m a c
0 E
8 5 l o :
z
- LL
c
0
0 1
700
600
- 8 500 - e Q
0 Lo 5
- -
a, 4oa
2.
U a, a 8 30C > a, 0 ?? g 2oc 2 a
1 oc
OO(
1 1 1
Normal Pressure Iblin*/lb/ft*
, 010
1 O i l 440 1512160 2012880 {
, , , ,,,:
,,,&?- r , , 'i :,
-,,a%' :;5'
-
-
1 I l l I !
0.01 0 10 1 0 10 0
/ ( / /
/ /
Thickness of Mat, d(in) L'" I 1 1 I
0 25 50 75 100
(b) Residual Thickness, n(Y0)
30
25 p E E
20 s ul
ai
15 5 v, 0
ul
V
10
5
0
Figure 4-21. Flow rate behavior of selected geocomposite drainage systems. (a) Mirardrain 6000 at hydraulic gradients of 0.01 to 1.0 (b) Enkadrain at hydraulic gradient of 1.0
72
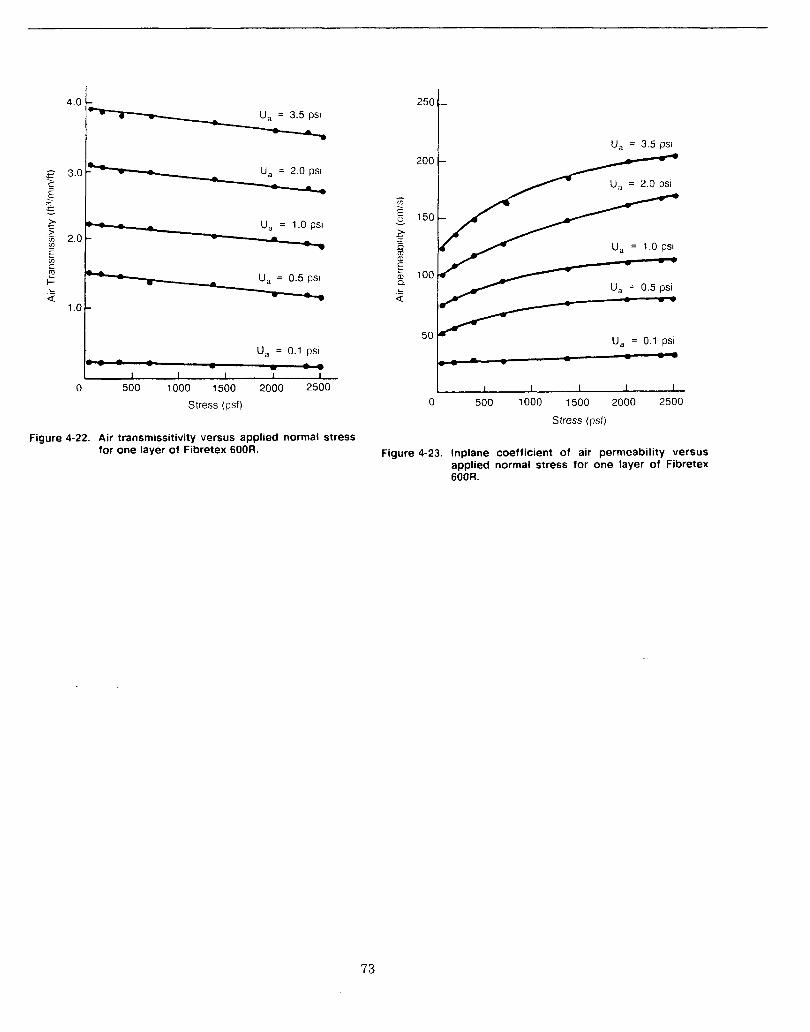
I
g 3 0 c E
E 2'
.
2 2 0 -
$ %
C
250 t 200 -
M - a u, = 1 0 PSI - 1 u, = 1 0 PSI
u, = 3.5 psi
L - a 1 0 -
1
1
u, = 0 1 PSI u, = 0 1 PSI C I - - - m - - - -
I I I I I - -
73
0 500 1000 1500 2000 2500 b 1 1 I 1 1
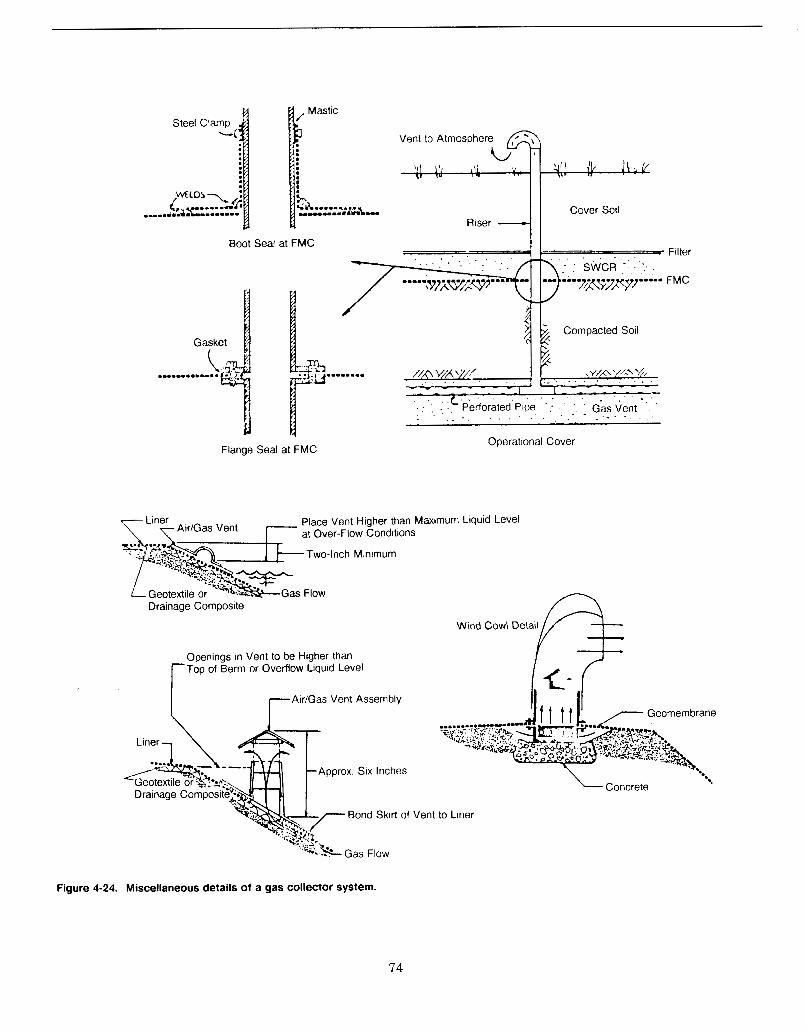
Boot Seal at FMC
Cover Soil Riser 4 1
Operational Cover Flange Seal at FMC
7 Liner Place Vent Higher than Maximum at Over-Flow Conditions
Two-inch Minimum
Air/Gas Vent
Drainage Composite
Liquid 1 .eve1
Openings in Vent to be Higher than Top of Berm or Overflow Liquid Level r T A i r l G a s Vent Assembly
Approx. Six inches
Drainage Composit 6'- Cjeotextile "+T'---H dr
1 A pprox. Six inches
Wind Cowl Detail e - Concrete
Vent to Liner
Figure 4-24. Miscellaneous details of a gas collector system.
74
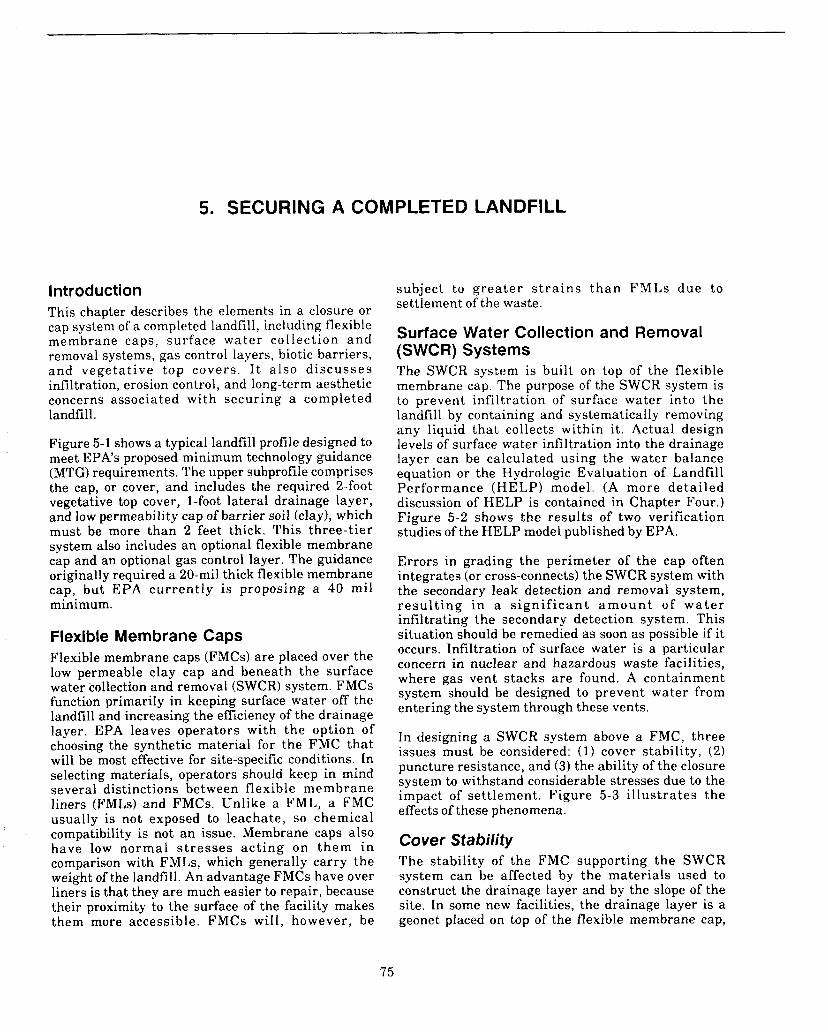
5. SECURING A COMPLETED LANDFILL
Introduction This chapter describes the elements in a closure or cap system of a completed landfill, including flexible membrane caps, surface water collection a n d removal systems, gas control layers, biotic barriers, and vegetative top covers. I t a lso d i scusses infiltration, erosion control, and long-term aesthetic concerns associated with securing a completed landfill.
Figure 5-1 shows a typical landfill profile designed to meet EPA's proposed minimum technology guidance (MTG) requirements. The upper subprofile comprises the cap, or cover, and includes the required 2-foot vegetative top cover, 1-foot lateral drainage layer, and low permeability cap of barrier soil (clay), which must be more than 2 feet thick. This three-tier system also includes an optional flexible membrane cap and an optional gas control layer. The guidance originally required a 20-mil thick flexible membrane cap, but EPA current ly is proposing a 40 mil minimum.
Flexible Membrane Caps Flexible membrane caps (FMCs) are placed over the low permeable clay cap and beneath the surface water collection and removal (SWCR) system. FMCs function primarily in keeping surface water off the landfill and increasing the efficiency of the drainage layer. EPA leaves operators with the option of choosing the synthetic material for the FMC that will be most effective for site-specific conditions. In selecting materials, operators should keep in mind several distinctions between flexible membrane liners (FMLs) and FMCs. Unlike a FML, a FMC usually is not exposed to leachate, so chemical compatibility is not a n issue. Membrane caps also have low normal s t r e s s e s ac t ing on them i n comparison with FMLs, which generally carry the weight of the landfill. An advantage FMCs have over liners is that they are much easier to repair, because their proximity to the surface of the facility makes them more accessible. FMCs wil l , however, be
'
subject to g rea t e r s t r a i n s t h a n FMLs due to settlement of the waste.
Surface Water Collection and Removal (SWCR) Systems The SWCR system is built on top of the flexible membrane cap. The purpose of the SWCR system is to prevent infiltration of surface water into the landfill by containing and systematically removing any liquid that collects within it. Actual design levels of surface water infiltration into the drainage layer can be calculated using the water balance equation or the Hydrologic Evaluation of Landfill Performance (HELP) model. (A more detai led discussion of HELP is contained in Chapter Four.) Figure 5-2 shows the results of two verification studies of the HELP model published by EPA.
Errors in grading the perimeter of the cap often integrates (or cross-connects) the SWCR system with the secondary leak detection and removal system, r e su l t i ng i n a s i g n i f i c a n t a m o u n t of w a t e r infiltrating the secondary detection system. This situation should be remedied as soon as possible if it occurs. Infiltration of surface water is a particular concern in nuclear and hazardous waste facilities, where gas vent stacks a re found. A containment system should be designed to prevent water from entering the system through these vents.
In designing a SWCR system above a FMC, three issues must be considered: (1) cover stability, (2) puncture resistance, and (3) the ability of the closure system to withstand considerable stresses due to the impact of settlement. Figure 5-3 i l lustrates the effects of these phenomena.
Cover Stability The stability of the FMC supporting the SWCR system can be affected by the materials used to construct the drainage layer and by the slope of the site. In some new facilities, the drainage layer is a geonet placed on top of the flexible membrane cap,
75
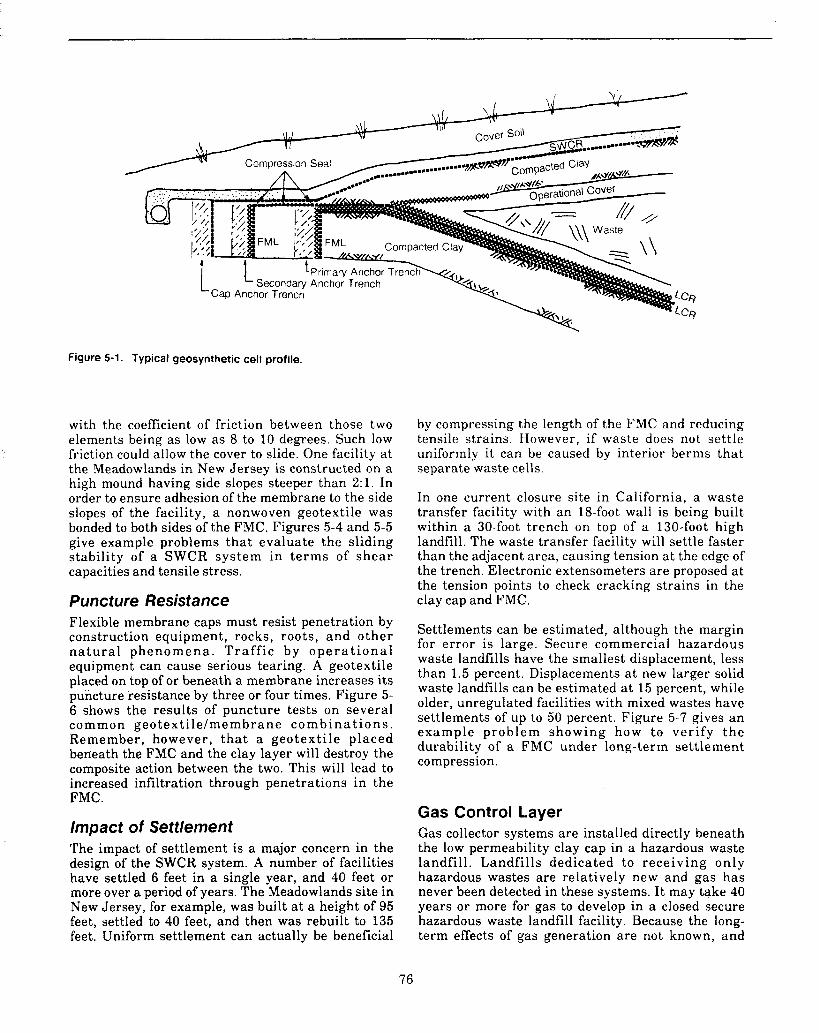
Figure 5-1. Typical geosynthetic cell profile.
with the coefficient of friction between those two elements being as low as 8 to 10 degrees. Such low friction could allow the cover to slide. One facility a t the Meadowlands in New Jersey is constructed on a high mound having side slopes steeper than 2:l. In order to ensure adhesion of the membrane to the side slopes of the facility, a nonwoven geotextile was bonded to both sides of the FMC. Figures 5-4 and 5-5 give example problems that evaluate the sliding stability of a SWCR system in t e rms of shea r capacities and tensile stress.
Puncture Resist an ce Flexible membrane caps must resist penetration by construction equipment, rocks, roots, and other n a t u r a l phenomena . T ra f f i c by o p e r a t i o n a l equipment can cause serious tearing. A geotextile placed on top of or beneath a membrane increases its puncture resistance by three or four times. Figure 5- 6 shows the results of puncture tests on several common geotext i le /membrane c o m b i n a t i o n s . Remember, however, t h a t a geotexti le placed berieath the FMC and the clay layer will destroy the composite action between the two. This will lead to increased infiltration through penetrations in the FMC.
Impact of Settlement The impact of settlement is a major concern in the design of the SWCR system. A number of facilities have settled 6 feet in a single year, and 40 feet or more over a period of years. The Meadowlands site in New Jersey, for example, was built a t a height of 95 feet, settled to 40 feet, and then was rebuilt to 135 feet. Uniform settlement can actually be beneficial
by compressing the length of the FMC and reducing tensile strains. However, if waste does not settle uniformly it can be caused by interior berms that separate waste cells.
In one current closure site in California, a waste transfer facility with an 18-foot wall is being built within a 30-foot trench on top of a 130-foot high landfill. The waste transfer facility will settle faster than the adjacent area, causing tension a t the edge of the trench. Electronic extensometers are proposed a t the tension points to check cracking strains in the clay cap and FMC.
Settlements can be estimated, although the margin for error is large. Secure commercial hazardous waste landfills have the smallest displacement, less than 1.5 percent. Displacements a t new larger solid waste landfills can be estimated a t 15 percent, while older, unregulated facilities with mixed wastes have settlements of up to 50 percent. Figure 5-7 gives an example problem showing how to verify the durability of a FMC under long-term settlement compression.
Gas Control Layer Gas collector systems are installed directly beneath the low permeability clay cap in a hazardous waste landfill. Landfills dedicated to receiving only hazardous wastes are relatively new and gas has never been detected in these systems. It may take 40 years or more for gas to develop in a closed secure hazardous waste landfill facility. Because the long- term effects of gas generation are not known, and
76
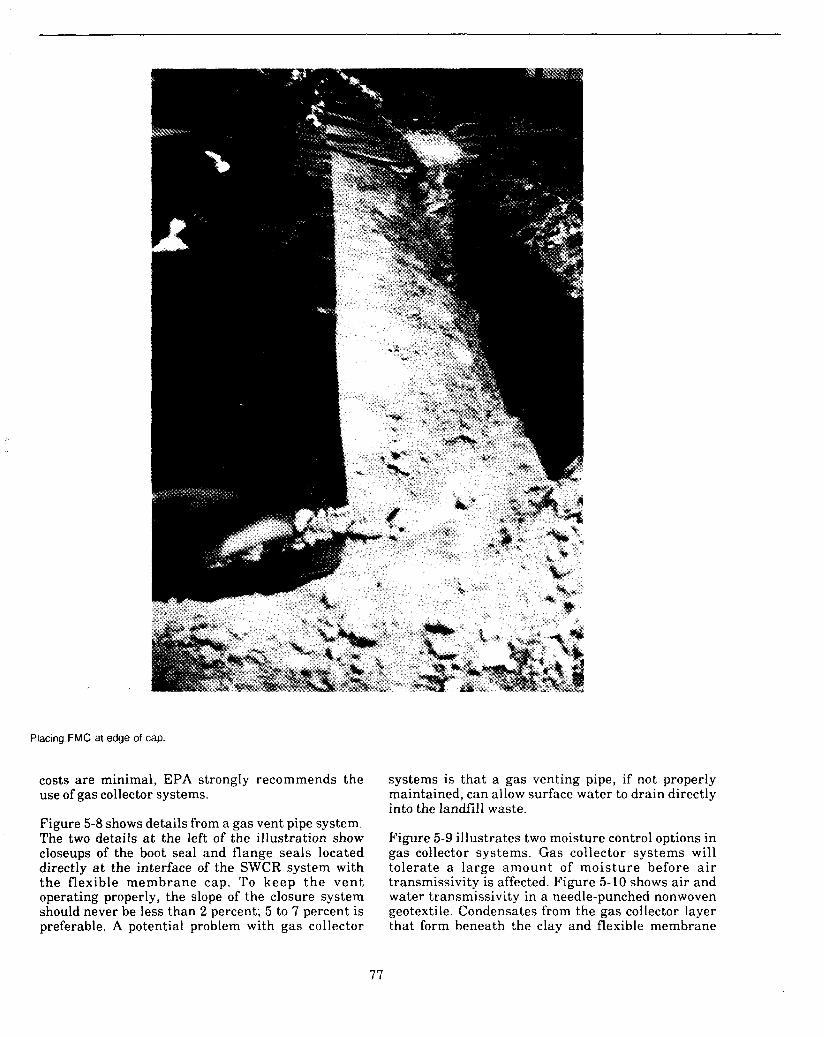
Placing FMC at edge of cap.
costs are minimal, EPA strongly recommends the use of gas collector systems.
Figure 5-8 shows details from a gas vent pipe system. The two details a t the left of the illustration show closeups of the boot seal and flange seals located directly a t the interface of the SWCR system with the flexible membrane cap. To keep t h e ven t operating properly, the slope of the closure system should never be less than 2 percent; 5 to 7 percent is preferable. A potential problem with gas collector
systems is that a gas venting pipe, if not properly maintained, can allow surface water to drain directly into the landfill waste.
Figure 5-9 illustrates two moisture control options in gas collector systems. Gas collector systems will tolerate a large amount of moisture before a i r transmissivity is affected. Figure 5-10 shows air and water transmissivity in a needle-punched nonwoven geotextile. Condensates from the gas collector layer that form beneath the clay and flexible membrane
77
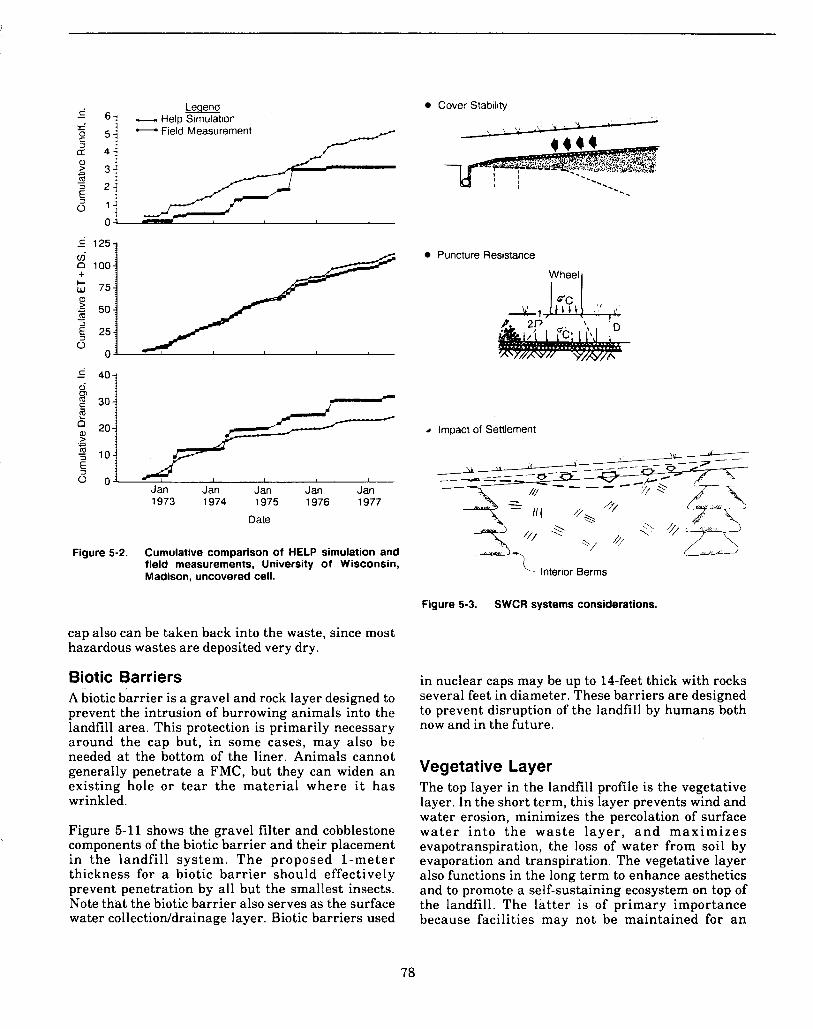
Leqend c - 6? - Help Simulation
c 5 5 1 - Field Measurement
2 41
2 "j
Cover Stability
Puncture Resistance
= 40 6
c !2 n
7 10 2 - R)
0 0 ~~~~ 5 5 Jan Jan Jan Jan Jan
1973 1974 1975 1976 1977
Date
Figure 5-2. Cumulative comparison of HELP simulation and field measurements, University of Wisconsin, Madison, uncovered cell.
4 Impact of Settlement
Figure 5-3. SWCR systems considerations.
cap also can be taken back into the waste, since most hazardous wastes are deposited very dry.
Biotic Barriers A biotic barrier is a gravel and rock layer designed to prevent the intrusion of burrowing animals into the landfill area. This protection is primarily necessary around the cap but, in some cases, may also be needed at the bottom of the liner. Animals cannot generally penetrate a FMC, but they can widen an existing hole or tear the material where it has wrinkled.
Figure 5-11 shows the gravel filter and cobblestone components of the biotic barrier and their placement in the landfill system. The proposed 1 -me te r thickness for a biotic barrier should effectively prevent penetration by all but the smallest insects. Note that the biotic barrier also serves as the surface water collectioddrainage layer. Biotic barriers used
in nuclear caps may be up to 1Cfeet thick with rocks several feet in diameter. These barriers are designed to prevent disruption of the landfill by humans both now and in the future.
Vegetative Layer The top layer in the landfill profile is the vegetative layer. In the short term, this layer prevents wind and water erosion, minimizes the percolation of surface wa te r i n to t h e was te l aye r , a n d max imizes evapotranspiration, the loss of water from soil by evaporation and transpiration. The vegetative layer also functions in the long term to enhance aesthetics and to promote a self-sustaining ecosystem on top of the landfill. The la t ter is of primary importance because facilities may not be maintained for a n
78
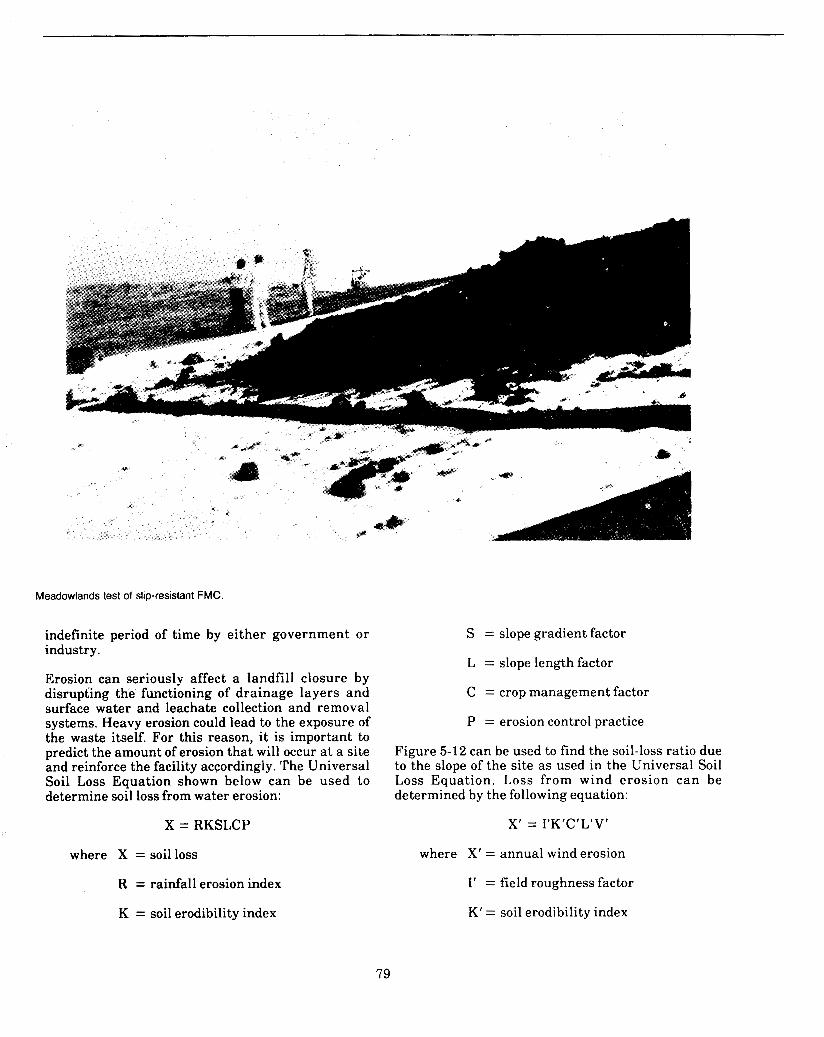
I
Meadowlands test of slip-resistant FMC.
indefinite period of time by either government or industry.
Erosion can seriously affect a landfill closure by disrupting the functioning of drainage layers and surface water and leachate collection and removal systems. Heavy erosion could lead to the exposure of the waste itself. For this reason, it is important to predict the amount of erosion that will occur a t a site and reinforce the facility accordingly. The Universal Soil Loss Equation shown below can be used to determine soil loss from water erosion:
X = RKSLCP
where X = soil loss
R = rainfall erosion index
K = soil erodibility index
S = slope gradient factor
L = slope length factor
C = crop management factor
P = erosion control practice
Figure 5-12 can be used to find the soil-loss ratio due to the slope of the site as used in the Universal Soil Loss Equation. Loss from wind erosion can be determined by the following equation:
where X' = annual wind erosion
I' = field roughness factor
K' = soil erodibility index
79
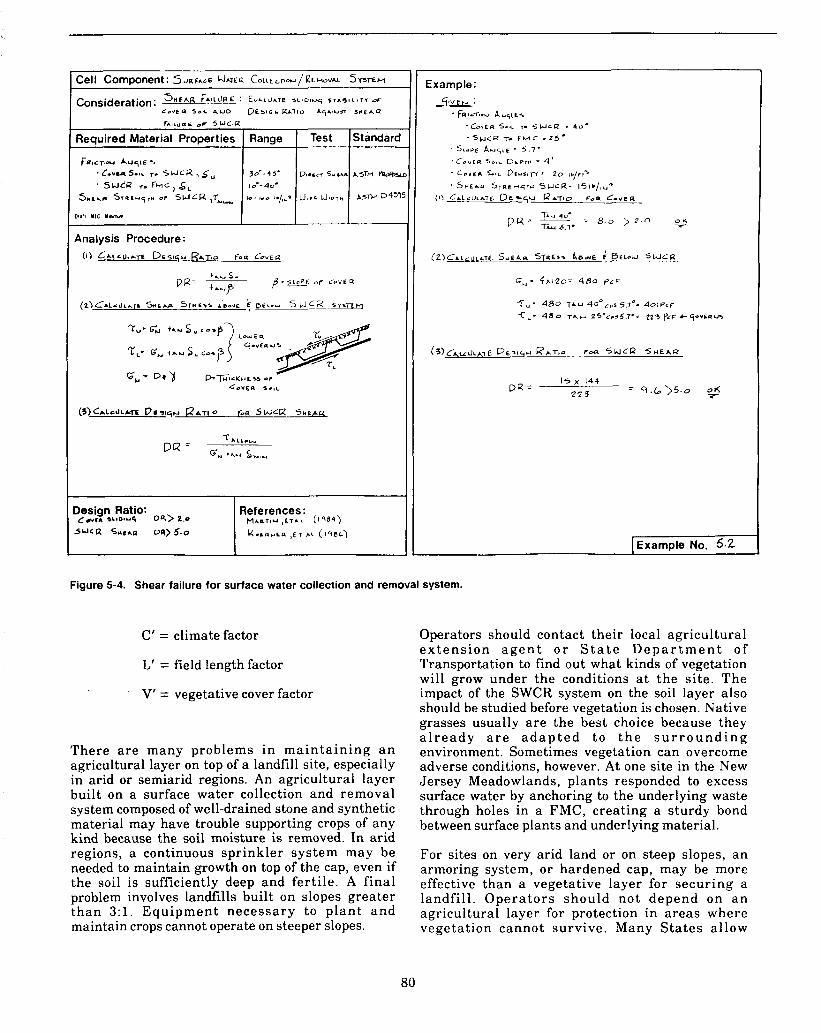
C' = climate factor
L' = field length factor
V' = vegetative cover factor
There a re many problems in ma in ta in ing a n agricultural layer on top of a landfill site, especially in arid or semiarid regions. An agricultural layer built on a surface water collection and removal system composed of well-drained stone and synthetic material may have trouble supporting crops of any kind because the soil moisture is removed. In arid regions, a continuous spr inkler system may be needed to maintain growth on top of the cap, even if the soil is sufficiently deep and fer t i le . A final problem involves landfills built on slopes greater than 3 : l . Equipment necessary to p l an t a n d maintain crops cannot operate on steeper slopes.
(Example No. 5.2
Figure 5-4. Shear failure for surface water collection and removal system.
Operators should contact their local agricultural e x t e n s i o n a g e n t o r S t a t e D e p a r t m e n t of Transportation to find out what kinds of vegetation will grow under the conditions a t the s i te . The impact of the SWCR system on the soil layer also should be studied before vegetation is chosen. Native grasses usually a re the best choice because they a l r e a d y a r e a d a p t e d t o t h e s u r r o u n d i n g environment. Sometimes vegetation can overcome adverse conditions, however. At one site in the New Jersey Meadowlands, plants responded to excess surface water by anchoring to the underlying waste through holes in a FMC, creating a sturdy bond between surface plants and underlying material.
For sites on very arid land or on steep slopes, a n armoring system, or hardened cap, may be more effective than a vegetative layer for securing a landfil l . Opera to r s should not depend on a n agricultural layer €or protection in a reas where vegetation cannot survive. Many Sta tes allow
80
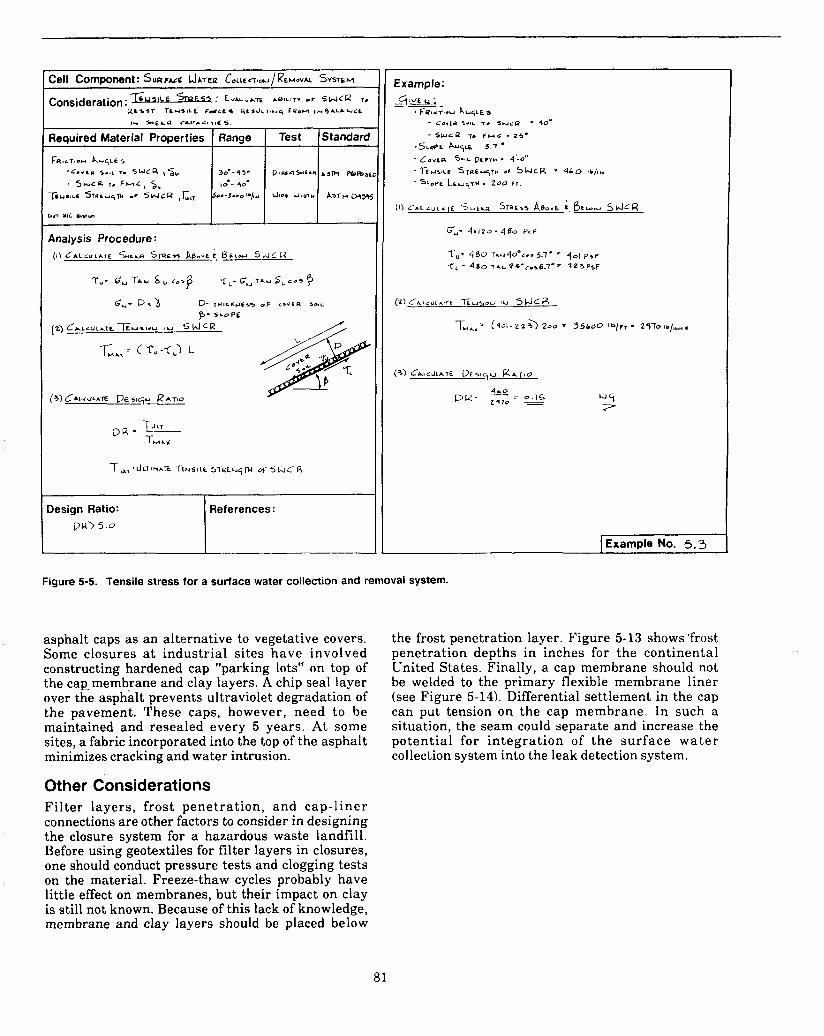
lesign Ratio: DR) 5 .o
[Example No. 5.3
References:
Figure 5-5. Tensile stress for a surface water collection and removal System.
asphalt caps as an alternative to vegetative covers. Some closures at industrial sites have involved constructing hardened cap "parking lots" on top of the cap. membrane and clay layers. A chip seal layer over the asphalt prevents ultraviolet degradation of the pavement. These caps, however, need to be maintained and resealed every 5 years. At some sites, a fabric incorporated into the top of the asphalt minimizes cracking and water intrusion.
Other Considerations Filter layers, frost penetration, and cap-l iner connections are other factors to consider in designing the closure system for a hazardous waste landfill. Before using geotextiles for filter layers in closures, one should conduct pressure tests and clogging tests on the material. Freeze-thaw cycles probably have little effect on membranes, but their impact on clay is still not known. Because of this lack of knowledge, membrane and clay layers should be placed below
the frost penetration layer. Figure 5-13 shows 'frost penetration depths in inches for the continental United States. Finally, a cap membrane should not be welded to the primary flexible membrane liner (see Figure 5-14). Differential settlement in the cap can put tension on the cap membrane. In such a situation, the seam could separate and increase the potential for integration of the surface wa te r collection system into the leak detection system.
81
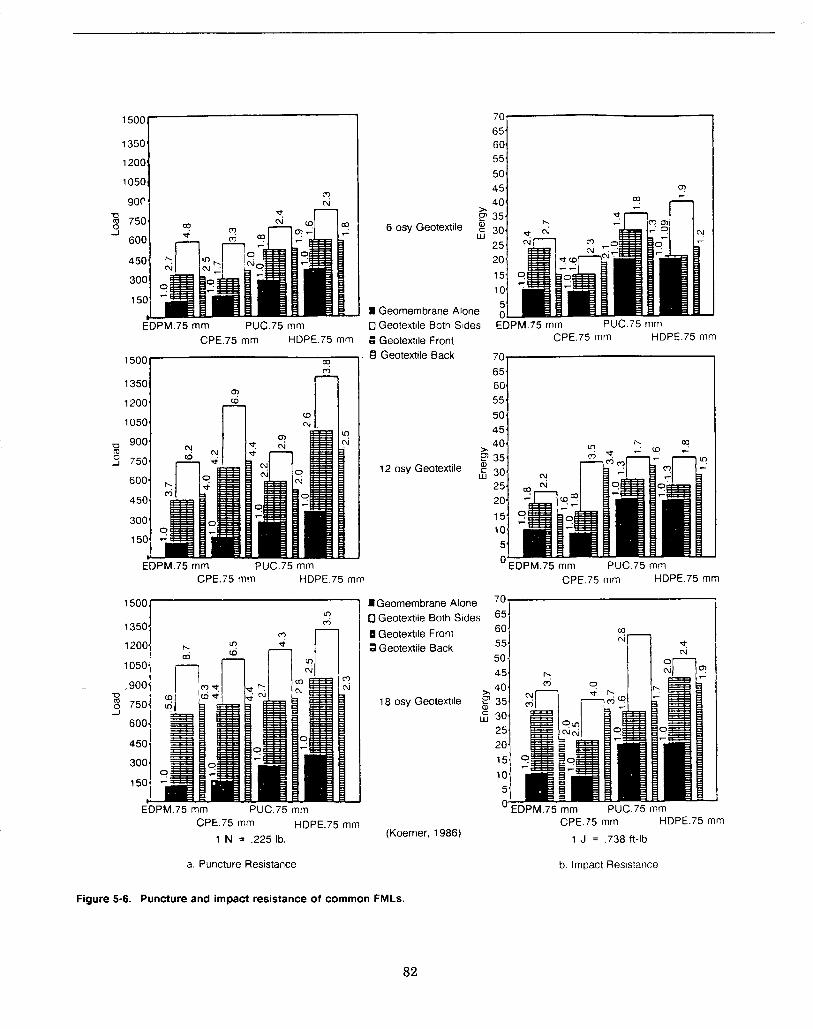
. - 65, 60, 55 50,
> F 35
6 osy Geotextile 30
25 20 15 10 5 I Geomembrane Alone
EDPM.75 mm PUC.75 mm 0 Geotextile Both Sides EDPM.75 mm PUC.75 mm
1500 ~ '
1350- 9 0
m n
CPE.75 mm HDPE.75 mm 6 Geotextile Front CPE.75 mm HDPE.75 mm
IGeomembrane Alone 0 Geotextile Both Sides PGeotextile Front
B Geotextlle Back
1200 55
12 osy Geotextile
EDPM.75 mm PuC.75 mm HDPE.75 mm CPE.75 mm HDPE.75 mrr CPE.75 mm
60
50
18 osy Geotextile
EDPM.75 mm PUC.75 mm CPE.75 mm HDPE.75 mm
(Koerner, 1986) 1 N = .225 Ib.
" EDPM.75 mm PUC.75 mm CPE.75 mm HDPE.75 mm
1 J = ,738 ft-lb
a. Puncture Resistance b. Imoact Resistance
Figure 5-6. Puncture and impact resistance of common FMLs.
82
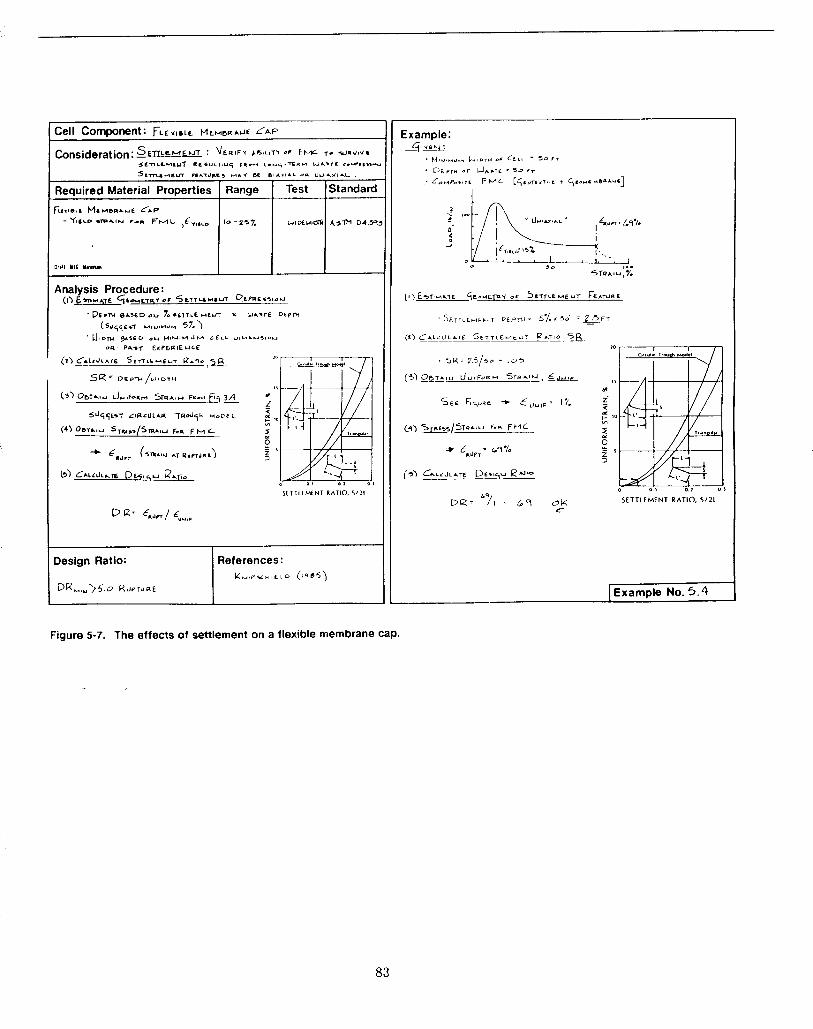
I
I t l T L t M f N l RATIO. S / Z L D I 0.2
DQ: '71 6 9 OK SETTLEMfNT RATIO, 5/21 7
[Example No. 5.4
Figure 5-7. The effects of settlement on a flexible membrane Cap.
83
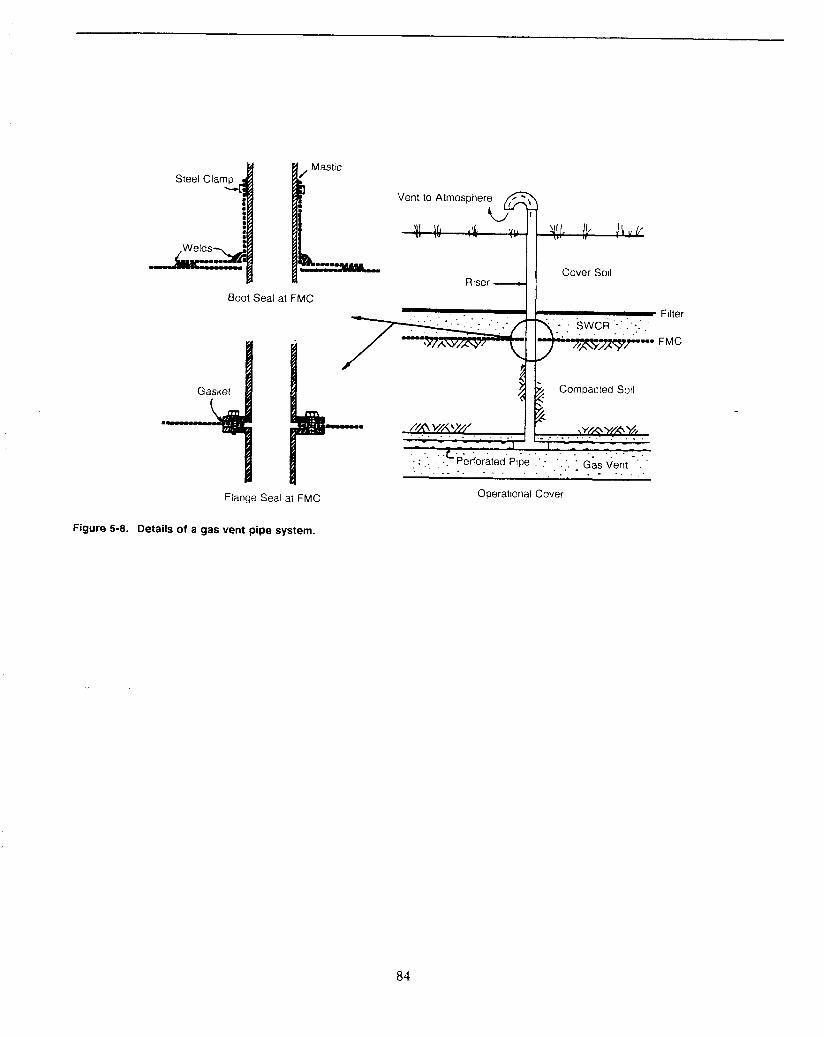
Boot Seal at FMC
VI 111 A\ VII 1, I” - 4 {L J \ ” L
Cover Soil Riser 4 I
Flange Seal at FMC
Figure 5-8. Details of a gas vent pipe system.
I I I \ -
/- a
. 1 Compacted sol1
. . . . . . . . .___ _. //A Y/A‘y//
. . . . - -
- . . . . . . 1 - _ - - -_-_- - _
. . . . - . . . , . . . . . . . . . . 1 . .FPerforated.Plpe _.: :.:. 1 G L ~ vent . . . _ . . . . . . . . . . . . . . . . - . . . . .
Ooerational Cover
84
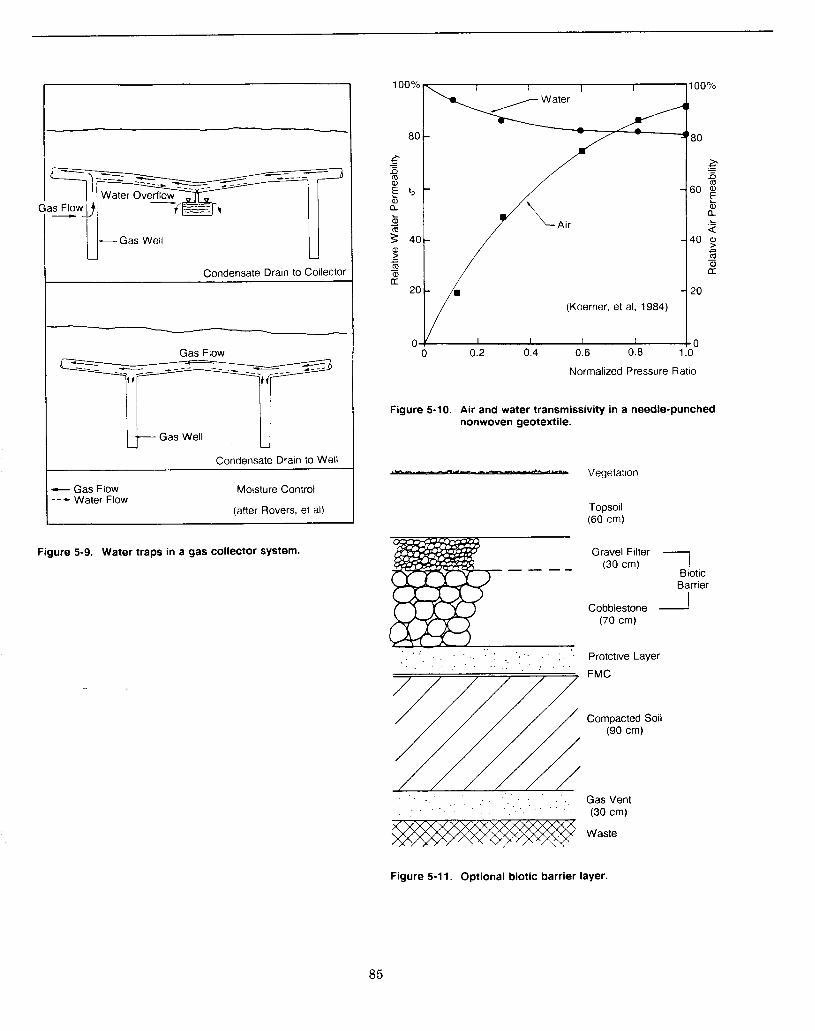
U -Gas Well
Condensate Drain to Collector
U
\
Gas Flow
U Gas Well
Condensate Drain to Well
- Gas Flow . - - Water Flow
Moisture Control
(after Rovers, et ai)
Figure 5-9. Water traps in a gas collector system.
100% r\ I I I I I1 00%
(Koerner, et al, 1984)
I I I I 0 0 0.2 0.4 0.6 0.8 1 .o
Normalized Pressure Ratio
Figure 5-10. Air and water transmissivity in a needle-punched nonwoven geotextile.
i- Vegetation
Topsoil (60 cm)
Gravel Filter (30 cm)
Cobblestone (70 cm)
1 I
Biotic Barrier
1
Protctive Laver
FMC
Compacted Soil (90 cm)
Gas Vent (30 cm)
Waste
Figure 5-1 1. Optional biotic barrier layer.
85
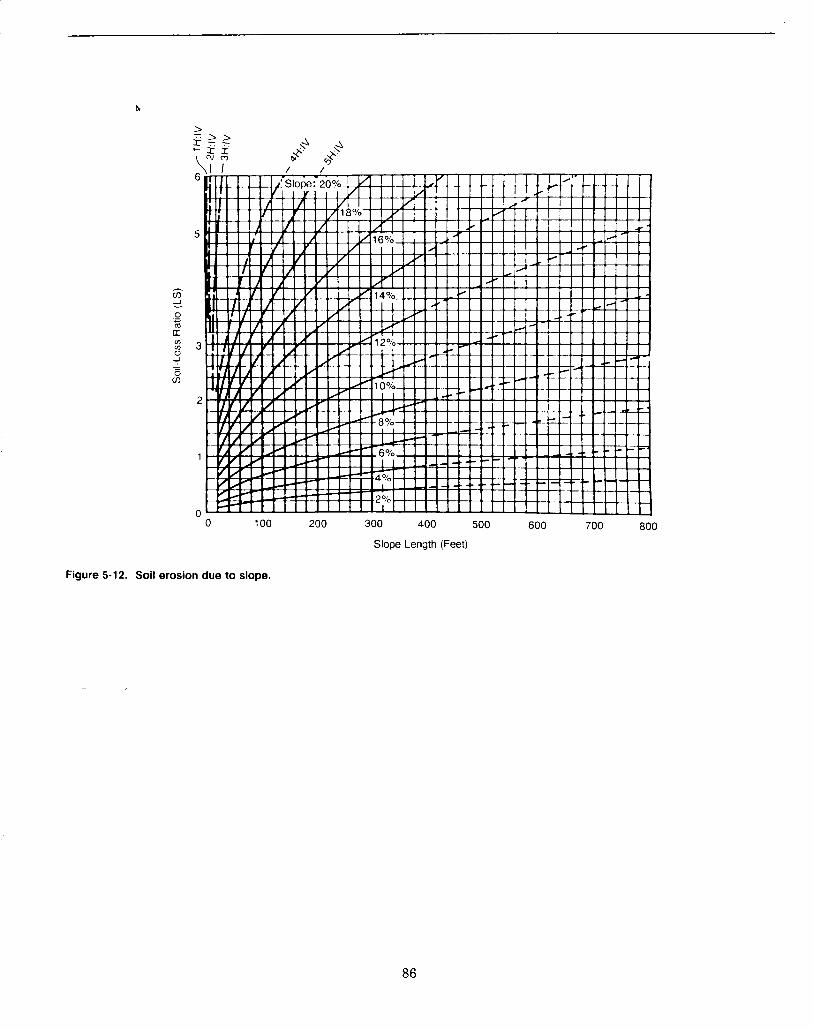
b
> - > > r - - -11
P c a a in in 0
0 100 200 300 400 500 600 700 800 Slope Length (Feet)
Figure 5-12. Soil erosion due to slope.
86
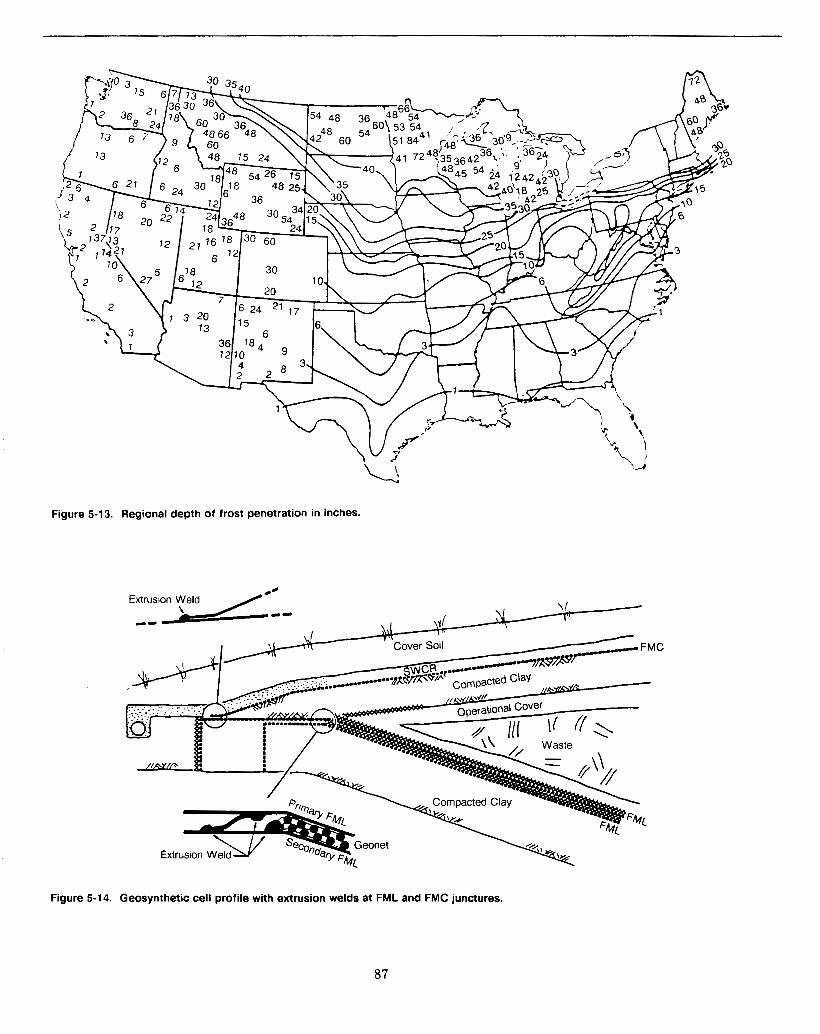
I
k
Figure 5-13. Regional depth of frost penetration in inches.
Figure 5-14. Geosynthetic cell profile with extrusion welds at FML and FMC junctures.
87

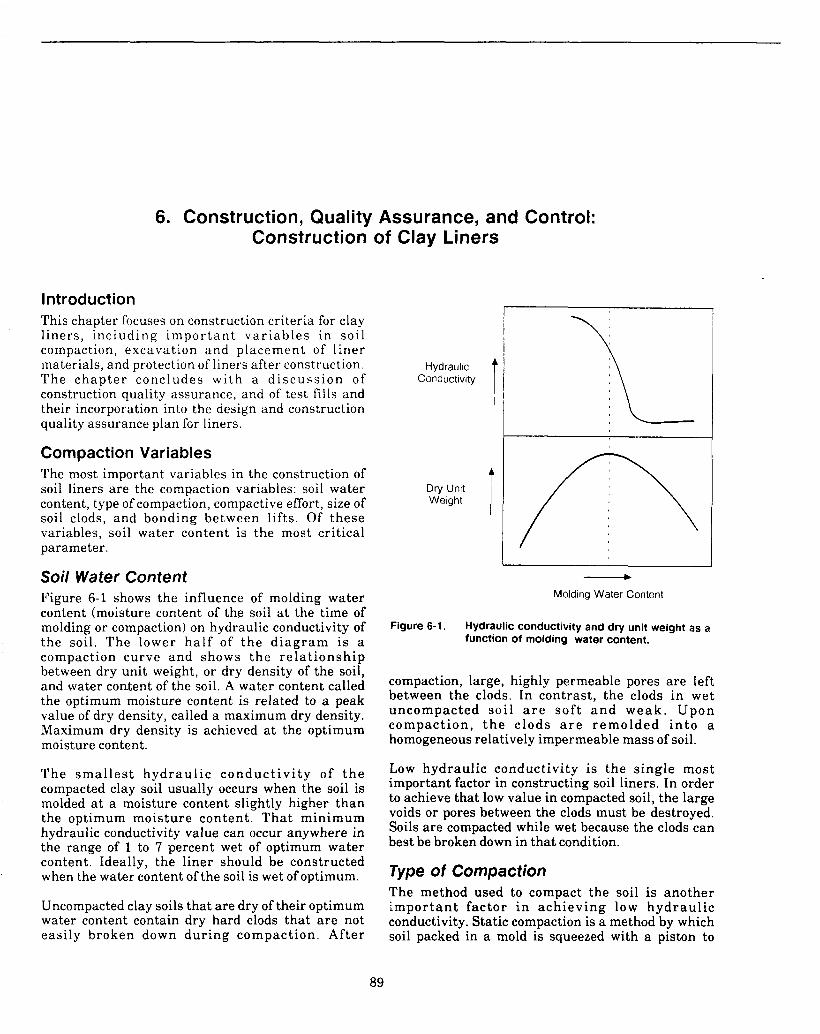
6. Construction, Quality Assurance, and Control: Construction of Clay Liners
Introduction This chapter focuses on construction criteria for clay l iners, including i m p o r t a n t var iab les in soil compaction, excavation and placement of l iner materials, and protection of liners after construction. The chapter concludes with a d iscuss ion of construction quality assurance, and of test tills and their incorporation into the design and construction quality assurance plan for liners.
Compaction Variables The most important variables in the construction of soil liners are the compaction variables: soil water content, type of compaction, compactive effort, size of soil clods, and bonding between lifts. Of these variables, soil water content is the most critical parameter.
Soil Water Content Figure 6-1 shows the influence of molding water content (moisture content of the soil at the time of molding or compaction) on hydraulic conductivity of the soil. The lower half of t h e d i ag ram is a compaction curve and shows t h e re la t ionship between dry unit weight, or dry density of the soil, and water content of the soil. A water content called the optimum moisture content is related to a peak value of dry density, called a maximum dry density. Maximum dry density is achieved at the optimum moisture content.
T h e smal les t h y d r a u l i c conduct iv i ty of t h e compacted clay soil usually occurs when the soil is molded at a moisture content slightly higher than the optimum moisture content. T h a t minimum hydraulic conductivity value can occur anywhere in the range of 1 to 7 percent wet of optimum water content. Ideally, the liner should be constructed when the water content of the soil is wet of optimum.
Uncompacted clay soils that are dry of their optimum water content contain dry hard clods that are not easily broken down during compaction. After
Hydraulic Conductivity
Dry Unit Weight
- Molding Water Content
Figure 6-1. Hydraulic conductivity and dry unit weight as a function of molding water content.
compaction, large, highly permeable pores are left between the clods. In contrast, the clods in wet uncompacted so i l a r e so f t a n d weak . Upon compact ion, t h e clods a r e r emolded i n t o a homogeneous relatively impermeable mass of soil.
Low hydraulic conductivity is the single most important factor in constructing soil liners. In order to achieve that low value in compacted soil, the large voids or pores between the clods must be destroyed. Soils are compacted while wet because the clods can best be broken down in that condition.
Type of Compaction The method used to compact the soil is another impor tan t factor i n achiev ing low hydraul ic conductivity. Static compaction is a method by which soil packed in a mold is squeezed with a piston to
89
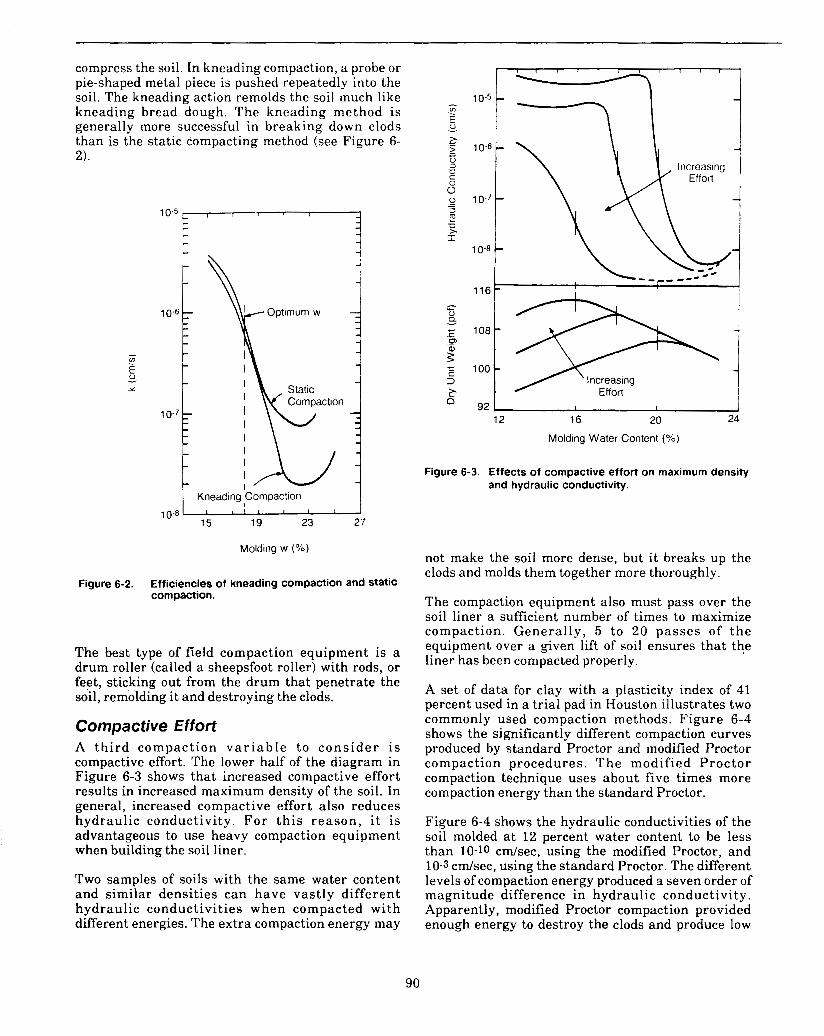
I
Kneading 'Compaction I !
compress the soil. In kneading compaction, a probe or pie-shaped metal piece is pushed repeatedly into the soil. The kneading action remolds the soil much like kneading bread dough. The kneading method is generally more successful in breaking down clods than is the static compacting method (see Figure 6- 21.
r - 7 4 i
Molding w (%)
Figure 6-2. Efficiencies of kneading compaction and static compaction.
The best type of field compaction equipment is a drum roller (called a sheepsfoot roller) with rods, or feet, sticking out from the drum that penetrate the soil, remolding it and destroying the clods.
Compactive Effort A th i rd compaction v a r i a b l e to cons ide r is compactive effort. The lower half of the diagram in Figure 6-3 shows that increased compactive effort results in increased maximum density of the soil. In general, increased compactive effort also reduces hydraulic conductivity. For t h i s reason, i t i s advantageous to use heavy compaction equipment when building the soil liner.
Two samples of soils with the same water content and similar densities can have vastly different hydraulic conductivities when compacted with different energies. The extra compaction energy may
12 16 20 24
Molding Water Content (YG)
Figure 6-3. Effects of compactive effort on maximum density and hydraulic conductivity.
not make the soil more dense, but it breaks up the clods and molds them together more thoroughly.
The compaction equipment also must pass over the soil liner a sufficient number of times to maximize compaction. Generally, 5 to 20 passes of t h e equipment over a given lift of soil ensures that the liner has been compacted properly.
A set of data for clay with a plasticity index of 41 percent used in a trial pad in Houston illustrates two commonly used compaction methods. Figure 6-4 shows the significantly different compaction curves produced by standard Proctor and modified Proctor compaction procedures. The modified Proctor compaction technique uses about five times more compaction energy than the standard Proctor.
Figure 6-4 shows the hydraulic conductivities of the soil molded a t 12 percent water content to be less than 10-10 c d s e c , using the modified Proctor, and 10-3 c d s e c , using the standard Proctor. The different levels of compaction energy produced a seven order of magnitude difference in hydraulic conductivity. Apparently, modified Proctor compaction provided enough energy to destroy the clods and produce low
90
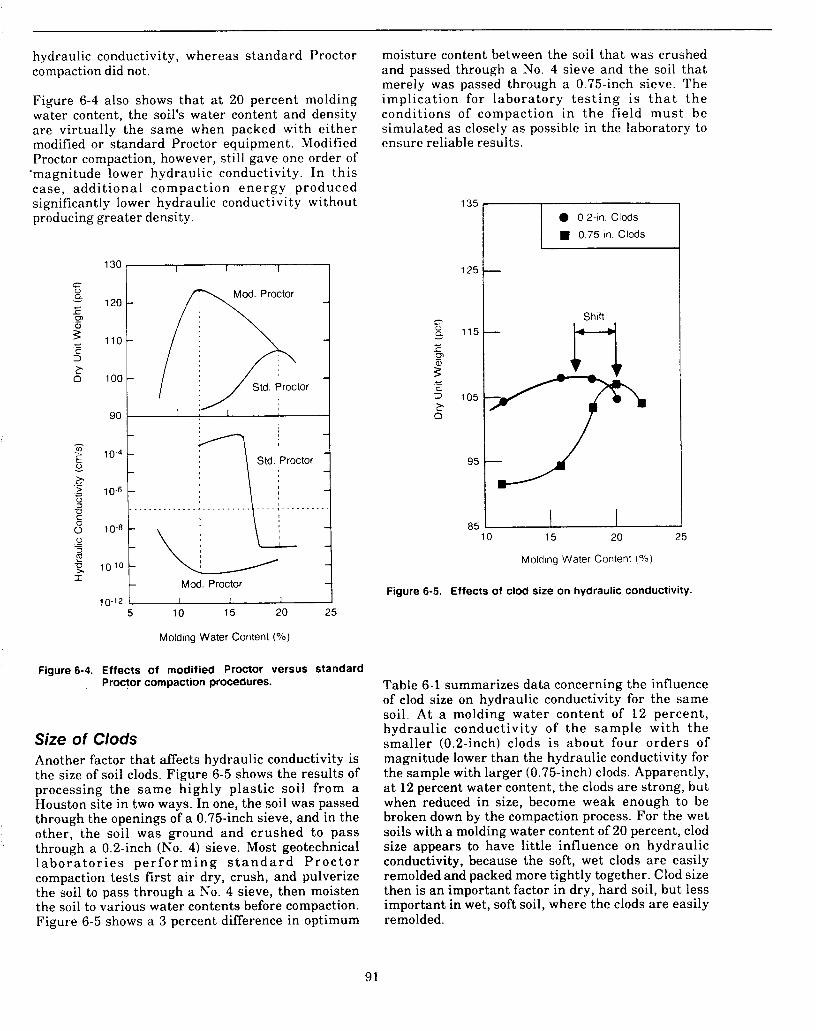
I
hydraulic conductivity, whereas standard Proctor compaction did not.
Figure 6-4 also shows that at 20 percent molding water content, the soil's water content and density are virtually the same when packed with either modified or standard Proctor equipment. Modified Proctor compaction, however, still gave one order of
'magnitude lower hydraulic conductivity. In this case, additional compaction energy produced significantly lower hydraulic conductivity without producing greater density.
130 '
moisture content between the soil that was crushed and passed through a No. 4 sieve and the soil that merely was passed through a 0.75-inch sieve. The implication for laboratory t e s t ing is t h a t t he conditions of compaction in the field must be simulated as closely as possible in the laboratory to ensure reliable results.
125
90 I : I
2. 0
U .....
s .." 10-8
Mod. Proctor I I I 1
5 10 15 20 25
Molding Water Content ("/o)
Figure 6-4. Effects of modified Proctor versus standard . Proctor compaction procedures.
Size of Clods Another factor that affects hydraulic conductivity is the size of soil clods. Figure 6-5 shows the results of processing the same highly plastic soil from a Houston site in two ways. In one, the soil was passed through the openings of a 0.75-inch sieve, and in the other, the soil was ground and crushed to pass through a 0.2-inch (No. 4) sieve. Most geotechnical l a b o r a t o r i e s p e r f o r m i n g s t a n d a r d P r o c t o r compaction tests first air dry, crush, and pulverize the soil to pass through a No. 4 sieve, then moisten the soil to various water contents before compaction. Figure 6-5 shows a 3 percent difference in optimum
- c 115 -
E P P c C 2 105 P D
95
a5 u 10 15 20 25
Molding Water Content ("/o)
Figure 6-5. Effects of clod size on hydraulic conductivity.
Table 6-1 summarizes data concerning the influence of clod size on hydraulic conductivity for the same soil. At a molding water content of 12 percent, hydraulic conductivity of the sample with the smaller (0.2-inch) clods is about four orders of magnitude lower than the hydraulic conductivity for the sample with larger (0.75-inch) clods. Apparently, at 12 percent water content, the clods are strong, but when reduced in size, become weak enough to be broken down by the compaction process. For the wet soils with a molding water content of 20 percent, clod size appears to have little influence on hydraulic conductivity, because the soft, wet clods are easily remolded and packed more tightly together. Clod size then is a n important factor in dry, hard soil, but less important in wet, soft soil, where the clods are easily remolded.
91
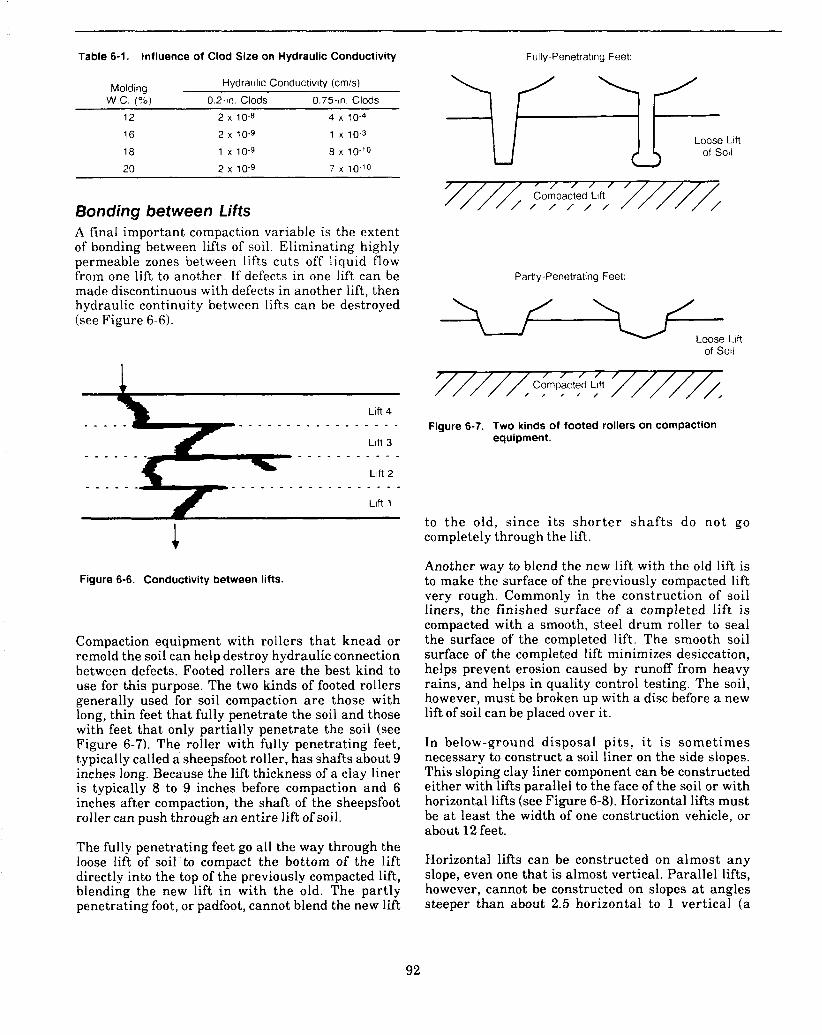
Table 6-1. Influence of Clod Size on Hydraulic Conductivity
Hydraulic Conductivity (cmis) Molding w c. (96) 0.2-ln. Clods 0.75-in. Clods
12 2 x 10⁻⁸ 4 x 10⁻⁴
16 2 x 10⁻⁹ 1 x 10⁻³
18 1 x 10-9 a x 10-10
20 2 x 10⁻⁹ 7 x 10⁻¹⁰
Bonding between Lifts A final important compaction variable is the extent of bonding between lifts of soil. Eliminating highly permeable zones between lifts cuts off liquid flow from one lift to another. If defects in one lift can be made discontinuous with defects in another lift, then hydraulic continuity between lifts can be destroyed (see Figure 6-6).
1 L Lift 4
r
Lift 3
Lift 1 f 1
Figure 6-6. Conductivity between lifts.
Compaction equipment with roilers that knead or remold the soil can help destroy hydraulic connection between defects. Footed rollers are the best kind to use for this purpose. The two kinds of footed rollers generally used for soil compaction a re those with long, thin feet that fully penetrate the soil and those with feet that only partially penetrate the soil (see Figure 6-7). The roller with fully penetrating feet, typically called a sheepsfoot roller, has shafts about 9 inches long. Because the lift thickness of a clay liner is typically 8 to 9 inches before compaction and 6 inches after compaction, the shaft of the sheepsfoot roller can push through an entire lift of soil.
The fully penetrating feet go all the way through the loose lift of soil to compact the bottom of the lift directly into the top of the previously compacted lift, blending the new lift in with the old. The partly penetrating foot, or padfoot, cannot blend the new lift
Fully-Penetrating Feet:
Loose Lift of soil
7 I / / / / / Compacted Lift
/ I / / / /
Partly-Penetrating Feet:
of sot1
7- / / / / / Compacted Lift
/ , , / ,
Figure 6-7. Two kinds of footed rollers on compaction equipment.
to the old, since i t s shor te r sha f t s do not go completely through the lift.
Another way to blend the new lift with the old lift is to make the surface of the previously compacted lift very rough. Commonly in the construction of soil liners, the finished surface of a completed lift is compacted with a smooth, steel drum roller to seal the surface of the completed lift. The smooth soil surface of the completed lift minimizes desiccation, helps prevent erosion caused by runoff from heavy rains, and helps in quality control testing. The soil, however, must be broken up with a disc before a new lift of soil can be placed over it.
In below-ground disposal pi ts , i t is sometimes necessary to construct a soil liner on the side slopes. This sloping clay liner component can be constructed either with lifts parallel to the face of the soil or with horizontal lifts (see Figure 6-8). Horizontal lifts must be a t least the width of one construction vehicle, or about 12 feet.
Horizontal lifts can be constructed on almost any slope, even one that is almost vertical. Parallel lifts, however, cannot be constructed on slopes a t angles steeper than about 2.5 horizontal to 1 vertical (a
92
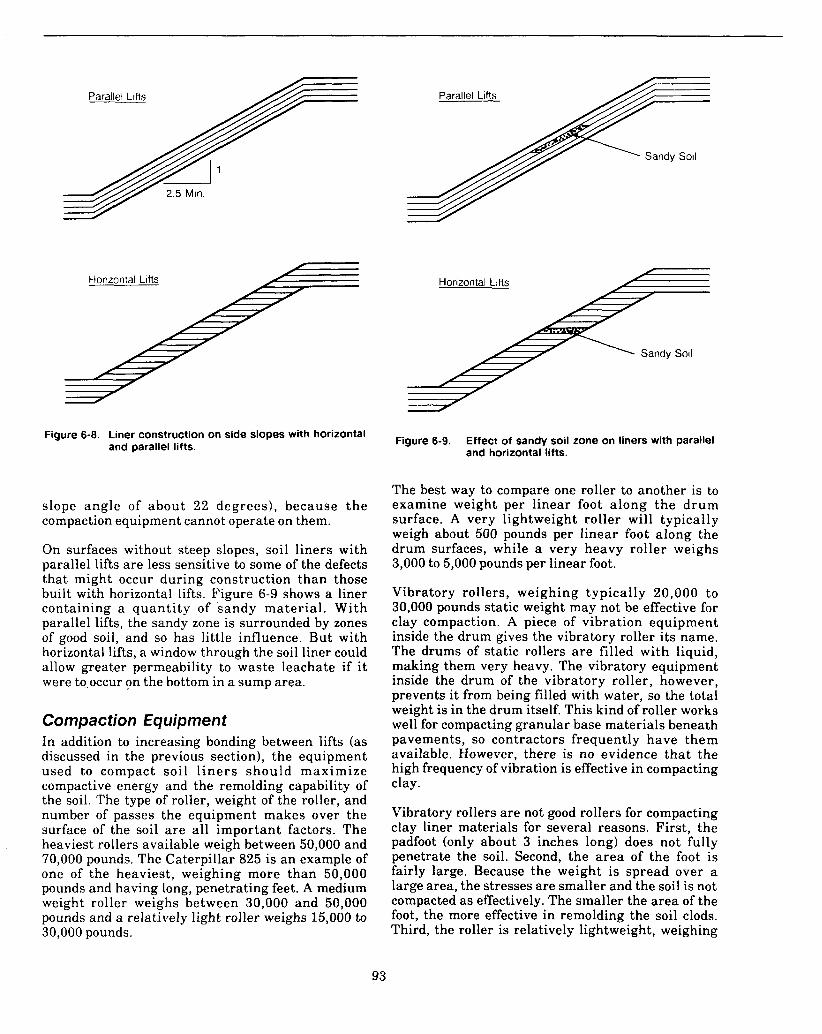
Parallel Lifts
5 Min.
Horizontal Lifts
Figure 6-8. Liner construction on side slopes with horizontal and parallel lifts.
slope angle of about 22 degrees), because t h e compaction equipment cannot operate on them.
On surfaces without steep slopes, soil liners with parallel lifts are less sensitive to some of the defects that might occur during construction than those built with horizontal lifts. Figure 6-9 shows a liner containing a quant i ty of sandy mater ia l . With parallel lifts, the sandy zone is surrounded by zones of good soil, and so has little influence. But with horizontal lifts, a window through the soil liner could allow greater permeability to waste leachate if it were to.occur on the bottom in a sump area.
Compaction Equipment In addition to increasing bonding between lifts (as discussed in the previous section), the equipment used to compact soil l i ne r s should maximize compactive energy and the remolding capability of the soil. The type of roller, weight of the roller, and number of passes the equipment makes over the surface of the soil a re all important factors. The heaviest rollers available weigh between 50,000 and 70,000 pounds. The Caterpillar 825 is an example of one of the heaviest, weighing more than 50,000 pounds and having long, penetrating feet. A medium weight roller weighs between 30,000 and 50,000 pounds and a relatively light roller weighs 15,000 to 30,000 pounds.
Parallel Lifts
Horizontal Lifts
Figure 6-9. Effect of sandy soil zone on liners with parallel and horizontal lifts.
The best way to compare one roller to another is to examine weight per linear foot along the d rum surface. A very lightweight roller will typically weigh about 500 pounds per linear foot along the drum surfaces, while a very heavy roller weighs 3,000 to 5,000 pounds per linear foot.
Vibratory rollers, weighing typically 20,000 to 30,000 pounds static weight may not be effective for clay compaction. A piece of vibration equipment inside the drum gives the vibratory roller its name. The drums of static rollers a r e filled with liquid, making them very heavy. The vibratory equipment inside the drum of the vibratory roller, however, prevents it from being filled with water, so the total weight is in the drum itself. This kind of roller works well for compacting granular base materials beneath pavements, so contractors frequently have them available. However, there is no evidence that the high frequency of vibration is effective in compacting clay.
Vibratory rollers are not good rollers for compacting clay liner materials for several reasons. First, the padfoot (only about 3 inches long) does not fully penetrate the soil. Second, the a rea of the foot is fairly large. Because the weight is spread over a large area, the stresses are smaller and the soil is not compacted as effectively. The smaller the area of the foot, the more effective in remolding the soil clods. Third, the roller is relatively lightweight, weighing
93

only 20,000 to 30,000 pounds . I n a d d i t i o n , approximately half the rollers' weight goes to the rear axle and the rubber tires, leaving only about 15,000 pounds or less to be delivered to the drum.
The feet of a classic sheepsfoot roller, in contrast to those of the vibratory roller, are about 9 inches long. The area of the foot is relatively small so that the compact stress on the tip typically ranges from 200 to 700 pounds per square inch. The drum normally is filled with liquid so that great weights are achieved directly on the drum. Manufacturers make very few sheepsfoot rollers now, despite the fact that they are the most effective roller for clay compaction. The Caterpillar 815 and 825 are two of the few sheepsfoot rollers currently being produced.
The Construction Process Table 6-2 outlines the major steps in the construction process for clay liners. First, a source of soil to be used in constructing the liner must be found. Then the soil is excavated a t this location from a pit called a "borrow pit." (Excavated soil is referred to as "borrow soil.") Digging tests pits in the borrow area helps determine the stratification of the soil before beginning excavation of the borrow pit itself.
Table 6-2. Steps in the Construction Process
1 Location of Borrow Source - Boreholes, Test Pits - Laboratory Tests
2. Excavation of Borrow Soil
3. Preliminary Moisture Adjustment, Amendments, Pulverization
4. Stockpile; Hydration; Other
5. Transport to Construction Area; Surface Preparation
6. Spreading in Lifts; Breakdown of Clods
7. Final Moisture Adjustment, Mixing; Hydration
8. Compaction; Smoothing of Surface
9. Construction Quality Assurance Testing
10. Further Compaction, If Necessary
The borrow soil is mixed and blended as i t is excavated to produce as homogeneous a soil as possible. Scrapers a r e useful for excavating soils from borrow areas, because the soil is mixed up in the scraper pan by the action of the scraper. The soil also can be sieved and processed through a rock crusher to grind down hard clods. Cutting across zones of horizontal stratification also will help mix up the soil as it is excavated. Using some of these methods, the excavation process can be designed to maximize soil mixing w i t h o u t s i g n i f i c a n t l y increasing excavation costs.
The next step is to moisten or dry the soil as needed. If the required change in water content is only 1 to 2 percent, the adjustment in moisture content can be
made after the soil is put in place and before it is compacted. However, if a substantial change in soil moisture content is necessary, it should be performed slowly so moistening occurs uniformly throughout the soil. To change the soil moisture content, the soil is spread evenly in a layer, moistened, and then covered for several days, if possible, while the moisture softens the soil clods. A disc or a rototiller passed through the soil periodically speeds up the process.
If soil moisture content is too high, the soil should be spread in lifts and allowed to dry. Mixing the soil during the drying process will prevent a dry crust of soil f rom forming on the top w i t h wet soi l underneath.
When the moisture adjustments have been made, the soil is transported to the construction area. Then the soil is spread in lifts by bulldozer or scraper, and a disc or rototiller is used to break down soil clods further. A pulvermixer, a piece of equipment widely used for reclaiming asphaltic concrete pavement, also works well. These machines can pulverize and mix a lift of soil as much as 24 inches deep.
Once the soil is in place and prior to compaction, minor adjustments in moisture content again can be made. No large changes in water content should be made a t this time, however.
In the next step, the soil is compacted. Afterwards, the surface of the soil may be smoothed by a smooth steel drum roller before the construction quality control inspector performs the moisture density test. If the test indicates that the soil has been compacted adequately, the next lift is placed on top of it. If the compaction has not been performed properly, the soil is either compacted further or that section of the liner is dug up and replaced.
Soil- Bentonite Liners When there is not enough clay available a t a site to construct a soil liner, the clay can be mixed with bentonite. The amount of bentonite needed should be determined in the laboratory and then adjusted to account for any irregularities occurring during construction. Dry bentonite is mixed with the soil first, and water is added only a f t e r the mixing process is complete.
The bentonite can be mixed using a pugmill or by spreading the soil in lifts and placing the bentonite over the surface. Passing a heavy-duty pulvermixer repeatedly through the soil in both directions mixes the soil with the bentonite. After the bentonite and clay are mixed, water is added in small amounts, with the soil mixed well after each addition. When the appropriate moisture content is reached, the clay-bentonite soil is compacted.
94
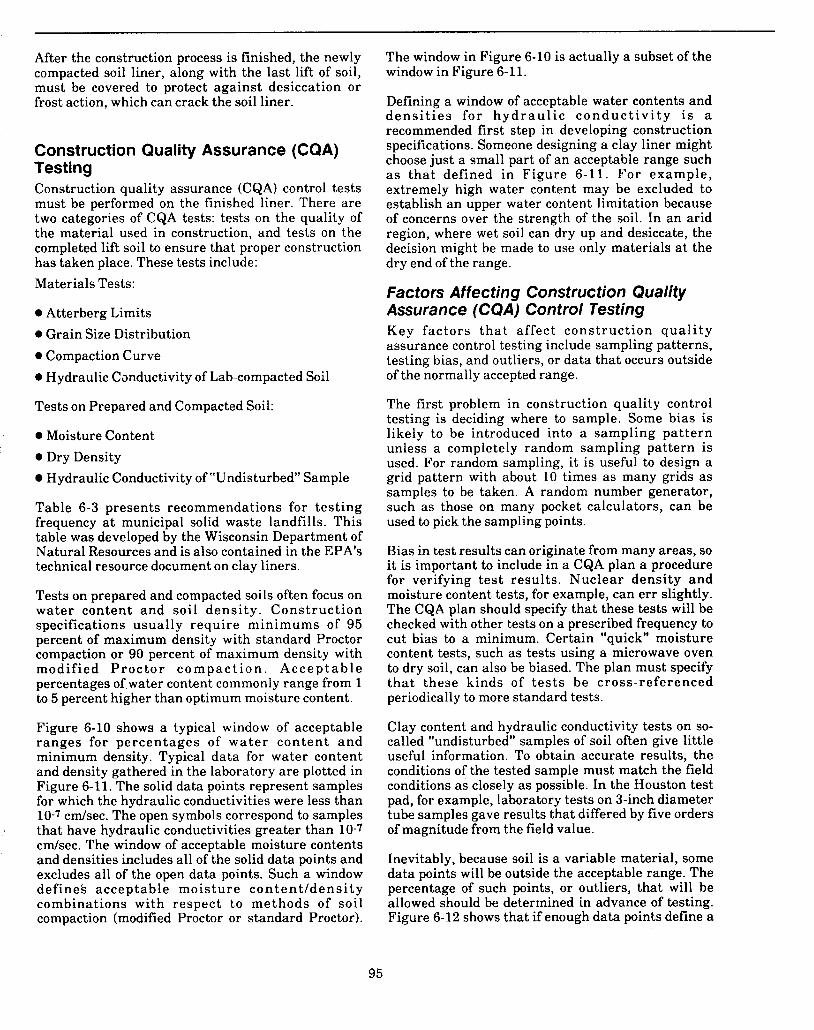
After the construction process is finished, the newly compacted soil liner, along with the last lift of soil, must be covered to protect against desiccation or frost action, which can crack the soil liner.
Construction Quality Assurance (CQA) Testing Construction quality assurance (CQA) control tests must be performed on the finished liner. There are two categories of CQA tests: tests on the quality of the material used in construction, and tests on the completed lift soil to ensure that proper construction has taken place. These tests include: Materials Tests:
0 Atterberg Limits 0 Grain Size Distribution 0 Compaction Curve 0 Hydraulic Conductivity of Lab-compacted Soil
Tests on Prepared and Compacted Soil:
0 Moisture Content 0 Dry Density
Hydraulic Conductivity of "Undisturbed" Sample
Table 6-3 presents recommendations for tes t ing frequency at municipal solid waste landfills. This table was developed by the Wisconsin Department of Natural Resources and is also contained in the EPA's technical resource document on clay liners.
Tests on prepared and compacted soils often focus on water content and soil dens i ty . Cons t ruc t ion specifications usually require minimums of 95 percent of maximum density with standard Proctor compaction or 90 percent of maximum density with modif ied P r o c t o r c o m p a c t i o n . Accept a b 1 e percentages of,water content commonly range from 1 to 5 percent higher than optimum moisture content.
Figure 6-10 shows a typical window of acceptable ranges for percentages of wa te r conten t and minimum density. Typical data for water content and density gathered in the laboratory are plotted in Figure 6-11. The solid data points represent samples for which the hydraulic conductivities were less than 10-7 c d s e c . The open symbols correspond to samples that have hydraulic conductivities greater than 10-7 c d s e c . The window of acceptable moisture contents and densities includes all of the solid data points and excludes all of the open data points. Such a window define5 acceptable mois ture c o n t e n t l d e n s i t y combinations with respect to methods of soil compaction (modified Proctor or standard Proctor).
The window in Figure 6-10 is actually a subset of the window in Figure 6-11.
Defining a window of acceptable water contents and d e n s i t i e s for h y d r a u l i c c o n d u c t i v i t y is a recommended first step in developing construction specifications. Someone designing a clay liner might choose just a small part of an acceptable range such as tha t defined in Figure 6-11. For example , extremely high water content may be excluded to establish an upper water content limitation because of concerns over the strength of the soil. In an arid region, where wet soil can dry up and desiccate, the decision might be made to use only materials a t the dry end of the range.
Factors Affecting Construction Quality Assurance (CQA) Control Testing Key fac tors t h a t affect cons t ruc t ion q u a l i t y assurance control testing include sampling patterns, testing bias, and outliers, or data that occurs outside of the normally accepted range.
The first problem in construction quality control testing is deciding where to sample. Some bias is likely to be introduced into a sampling pa t te rn unless a completely random sampling pattern is used. For random sampling, it is useful to design a grid pattern with about 10 times as many grids as samples to be taken. A random number generator, such as those on many pocket calculators, can be used to pick the sampling points.
Bias in test results can originate from many areas, so it is important to include in a CQA plan a procedure for verifying tes t results. Nuclear density and moisture content tests, for example, can err slightly. The CQA plan should specify that these tests will be checked with other tests on a prescribed frequency to cut bias to a minimum. Certain "quick" moisture content tests, such as tests using a microwave oven to dry soil, can also be biased. The plan must specify tha t these kinds of t e s t s be cross-referenced periodically to more standard tests.
Clay content and hydraulic conductivity tests on so- called "undisturbed" samples of soil often give little useful information. To obtain accurate results, the conditions of the tested sample must match the field conditions as closely as possible. In the Houston test pad, for example, laboratory tests on 3-inch diameter tube samples gave results that differed by five orders of magnitude from the field value.
Inevitably, because soil is a variable material, some data points will be outside the acceptable range. The percentage of such points, or outliers, that will be allowed should be determined in advance of testing. Figure 6-12 shows that ifenough data points define a
95
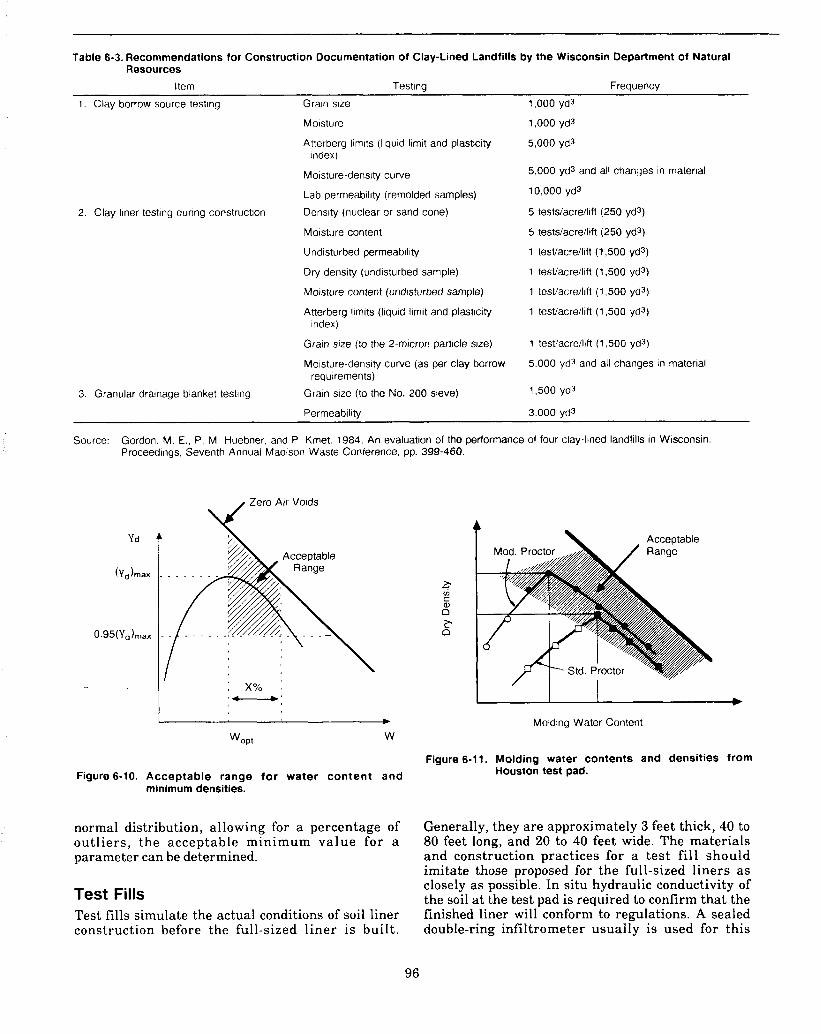
Table 6-3. Recommendations for Construction Documentation of Clay-Lined Landfills by the Wisconsin Department of Natural Resources
Item Testing Frequency
1 Clay borrow source testing Grain size 1,000 yd3
Moisture 1,000 yd3
Atterberg limits (liquid limit and plasticity 5.000 yd3
5,000 yd3 and all changes in material Moisture-density curve
Lab permeability (remolded samples) 10,000 yd3
index)
2 Clay liner testing during construction Density (nuclear or sand cone) 5 tests/acre/lift (250 yd3)
5 tests/acre/lift (250 yd3)
1 tesVacre/lift (?SO0 yd3)
1 tesVacre/lift (1,500 yd3)
1 testiacre/lift (1,500 yd3)
1 testiacreilift (1,500 yd3)
1 testiacrellift (1,500 yd3)
5,000 yd3 and all changes in material
Moisture content
Undisturbed permeability
Dry density (undisturbed sample)
Moisture content (undisturbed sample)
Atterberg limits (liquid limit and plasticity
Grain size (to the 2-micron particle size)
Moisture-density curve (as per clay borrow
index)
requirements) 3 Granular drainage blanket testing Grain size (to the No. 200 sieve) 1,500 yd3
Permeability 3 000 yd3
Source Gordon, M E , P M Huebner and P Kmet 1984 An evaluation of the performance of four clay-lined landfills in Wisconsin Proceedings, Seventh Annual Madison Waste Conference, pp 399-460.
wopt W
\ Acceptable
\ Molding Water Content
Figure 6-11. Molding water contents and densities from Houston test pad. Figure 6-10. Acceptable range for water content and
minimum densities.
normal distribution, allowing for a percentage of out l iers , the acceptable minimum value for a parameter can be determined.
Test Fills Test fills simulate the actual conditions of soil liner construction before the full-sized l iner is buil t .
Generally, they are approximately 3 feet thick, 40 to 80 feet long, and 20 to 40 feet wide. The materials and construction practices for a tes t fill should imitate those proposed for the full-sized l iners a s closely as possible. In situ hydraulic conductivity of the soil a t the test pad is required to confirm that the finished liner will conform to regulations. A sealed double-ring infiltrometer usually is used for this
96
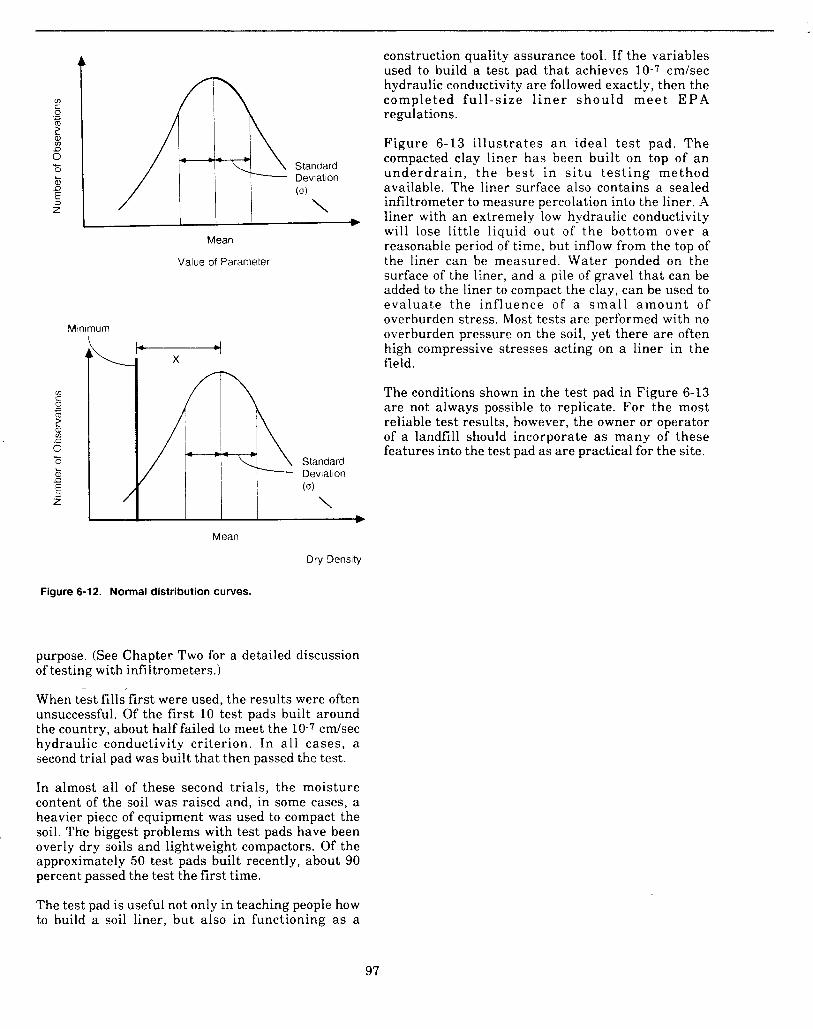
Mean
Value of Parameter
Minimum
L Mean
Dry Density
Figure 6-12. Normal distribution curves.
purpose. (See Chapter Two for a detailed discussion of testing with infiltrometers.)
When test fills first were used, the results were often unsuccessful. Of the first 10 test pads built around the country, about half failed to meet the 10-7 c d s e c hydraulic conductivity criterion. In a l l cases, a second trial pad was built that then passed the test.
In almost all of these second trials, the moisture content of the soil was raised and, in some cases, a heavier piece of equipment was used to compact the soil. The biggest problems with test pads have been overly dry soils and lightweight compactors. Of the approximately 50 test pads built recently, about 90 percent passed the test the first time.
The test pad is useful not only in teaching people how to build a soil liner, but also in functioning a s a
construction quality assurance tool. If the variables used to build a test pad that achieves 10-7 cmlsec hydraulic conductivity are followed exactly, then the completed ful l -s ize l i n e r s h o u l d m e e t E P A regulations.
Figure 6-13 i l lustrates a n ideal tes t pad. The compacted clay liner has been built on top of a n underdra in , t he best in s i t u t e s t i n g method available. The liner surface also contains a sealed infiltrometer to measure percolation into the liner. A liner with a n extremely low hydraulic conductivity will lose little liquid out of the bottom over a reasonable period of time, but inflow from the top of the liner can be measured. Water ponded on the surface of the liner, and a pile of gravel that can be added to the liner to compact the clay, can be used to evaluate the influence of a s m a l l amoun t of overburden stress. Most tests are performed with no overburden pressure on the soil, yet there are often high compressive stresses acting on a liner in the field.
The conditions shown in the test pad in Figure 6-13 are not always possible to replicate. For the most reliable test results, however, the owner or operator of a landfill should incorporate as many of these features into the test pad as are practical for the site.
97

Gravel to Load Clay to Evaluate Effect of Overburden Stress
Collection
Collection Pan Lysimeter
Geomembrane
Figure 6-13. An ideal test pad
98
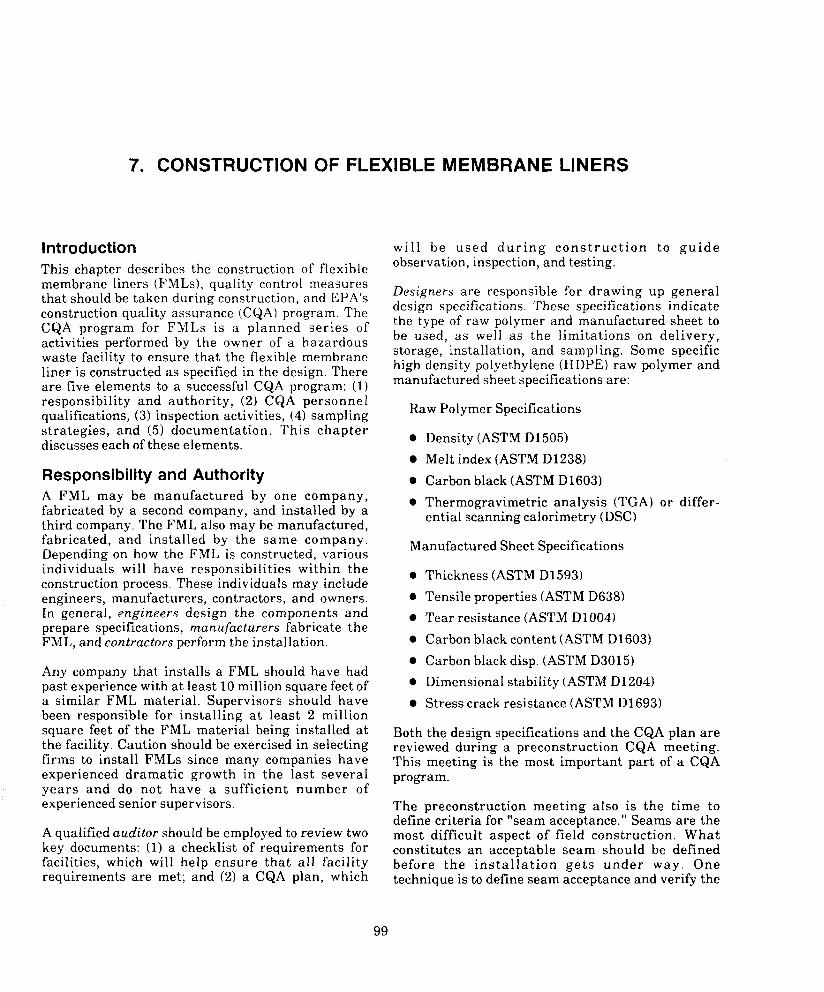
I c
7. CONSTRUCTION OF FLEXIBLE MEMBRANE LINERS
Introduction This chapter describes the construction of flexible membrane liners (FMLs), quality control measures that should be taken during construction, and EPA's construction quality assurance (CQA) program. The CQA program for FMLs is a planned series of activities performed by the owner of a hazardous waste facility to ensure that the flexible membrane liner is constructed as specified in the design. There are five elements to a successful CQA program: (1) responsibility and authority, (2) CQA personnel qualifications, (3) inspection activities, (4) sampling strategies, and (5) documentation. This chapter discusses each of these elements.
Responsibility and Authority A FML may be manufactured by one company, fabricated by a second company, and installed by a third company. The FML also may be manufactured, fabricated, and installed by the same company. Depending on how the FML is constructed, various individuals will have responsibilities within the construction process. These individuals may include engineers, manufacturers, contractors, and owners. In general, engineers design the components and prepare specifications, manufacturers fabricate the FML, and contractors perform the installation.
Any company that installs a FML should have had past experience with a t least 10 million square feet of a similar FML material. Supervisors should have been responsible for installing a t least 2 million square feet of the FML material being installed a t the facility. Caution should be exercised in selecting firms to install FMLs since many companies have experienced dramatic growth in the last several years and do not have a sufficient number of experienced senior supervisors.
A qualified auditor should be employed to review two key documents: (1) a checklist of requirements for facilities, which will help ensure that all facility requirements are met; and (2) a CQA plan, which
wil l be used d u r i n g c o n s t r u c t i o n to g u i d e observation, inspection, and testing.
Designers are responsible for drawing up general design specifications. These specifications indicate the type of raw polymer and manufactured sheet to be used, a s well as the limitations on delivery, storage, installation, and sampling. Some specific high density polyethylene (HDPE) raw polymer and manufactured sheet specifications are:
Raw Polymer Specifications
0 Density (ASTM D1505) Melt index (ASTM D1238)
0 Carbon black (ASTM D1603) 0 Thermogravimetric analysis (TGA) or differ-
ential scanning calorimetry (DSC)
Manufactured Sheet Specifications
0 Thickness (ASTM D1593) e Tensile properties (ASTM D638) 0 Tear resistance (ASTM D1004) 0 Carbon black content (ASTM D1603)
0 Carbon black disp. (ASTM D3015) 0 Dimensional stability (ASTM D1204)
Stress crack resistance (ASTM D1693)
Both the design specifications and the CQA plan are reviewed during a preconstruction CQA meeting. This meeting is the most important part of a CQA program.
The preconstruction meeting also is the time to define criteria for "seam acceptance." Seams are the most difficult aspect of field construction. What constitutes an acceptable seam should be defined before the in s t a l l a t ion g e t s unde r way. One technique is to define seam acceptance and verify the
99
I J
qualifications of the personnel installing the seams a t the same time. The installer's seamers produce samples of welds during the preconstruction CQA meeting that a r e then tested to determine seam acceptability. Samples of "acceptable" seams a re retained by both the owner and the installer in case of disputes la ter on. Agreement on the most appropriate repair method also should be made during the preconstruction CQA meeting. Various repair methods may be used, including capstripping or grinding and rewelding.
CQA Personnel Qualifications EPA requires that the CQA officer be a professional engineer (PE), or the equivalent, with sufficient practical, technical, and managerial experience. Beyond these basic criteria, the CQA officer must understand the assumptions made in the design of the facility and the installation requirements of the geosynthetics. Finding personnel with the requisite qualifications and actual field experience can be somewhat difficult. To develop field expertise in landfill CQA, some consulting firms routinely assign a n inexperienced engineer to work with trained CQA people on a job site and not bill for the inexperienced engineer receiving training. This enables companies to build up a reservoir of experience in a short period of time.
Inspection Activities Because handling and work in the field can damage the manufactured sheets, care must be taken when shipping, storing, and placing FMLs. At every step, the material should be carefully checked for signs of damage and defects.
Shipping and Storage Considerations FML panels frequently are fabricated in the factory, rather than on site. The panels must be shipped and stored carefully. High crystalline FML, for example, should not be folded for shipment. White lines, which indicate stress failure, will develop if this material is folded. Flexible membrane liners that can be folded should be placed on pallets when being shipped to the field. All FMLs should be covered during shipment. Each shipping roll should be identified properly with name of manufacturerlfabricator, product type and th i ckness , manufac tu re r ba t ch code, d a t e of manufacture, physical dimensions, panel number, and directions for unfolding.
Proper onsite storage also must be provided for these materials. All FMLs should be stored in a secure area, away from dirt, dust, water, and extreme heat. In addition, they should be placed where people and animals cannot dis turb them. P rope r s to rage p reven t s heat- induced bonding of t he rol led membrane (blocking), and loss of plasticizer or c u r i n g of t h e po lymer , which could c a u s e
embrittlement of the membrane and subsequent seaming problems.
Bedding Considerations Before placing the membrane, bedding preparations must be completed. Adequate compaction (90 percent by modified proctor equipment; 95 percent by standard proctor equipment) is a must. The landfill surface must be free of rocks, roots, and water. The subgrades should be rolled smooth and should be free from desiccation cracks. The use of herbicides can also affect bedding. Only chemically compatible herbicides should be used, particularly in surface impoundments. Many herbicides have hydrocarbon carriers that will react with the membranes and destroy them.
FML Panel Placement Prior to unfolding or unrolling, each panel should be inspected carefully for defects. If no defects a r e found, the panels may be unrolled. The delivery ticket should describe how to unroll each panel. Starting with the unrolling process, care should be taken to minimize sliding of the panel. A proper overlap €or welding should be allowed as each panel is placed. The amount of panel placed should be limited to that which can be seamed in 1 day.
Seaming and Seam Repair After the panels have been inspected for defects, they must be seamed by a qual i f ied s e a m e r . The membrane must be clean for the seaming process and there must be a firm foundation beneath the seam. Figure 7-1 shows the configuration of several types of seams.
The most important seam repair criterion is that any defective seam must be bounded by areas that pass fitness structure tests. Everything between such areas must be repaired. The repair method should be determined and agreed upon in advance, a n d following a repair, a careful visual inspection should be performed to ensure the repair is successful.
Weather and Anchorage Criteria Weather is a n additional considerat ion when installing a FML. From the seaming standpoint, it is important not to expose the liner materials to rain or dust. Any time the temperature drops below 50"F, t h e i n s t a l l e r s h o u l d t a k e p r e c a u t i o n s f o r temperature. For example, preheaters with the chambers around them may be used in cold weather to keep the FML warm. There also should be no excessive wind, because it is very difficult to weld under windy conditions.
In addition, FML panels should be anchored as soon as possible. The anchor trench may remain open for
100
I b
Lap Seam
Lap Seam with Gum Tape
Tongue and Groove Spllce
Extrusion Weld Lap Seam
Fillet Weld Lar, Seam
Double Hot Air or Wedge Seam
Figure 7-1. Configurations of field geomembrane seams.
several days after installation of a panel. However, the anchor trench must be filled when the panel is a t its coolest temperature and is, therefore, shortest in length. This will occur early in the morning.
Addition a / Polymer Components Polymer components, such as geotextiles, geonets, and geogrids, must be carefully inspected, as there is no CQA program for these components. Chapter Four discusses polymer components in more detail. To date; CQA activities have focused on FMLs, and there is no way to "fingerprint" other materials to determine their characteristic properties over the long term. Fingerprinting refers to the evaluation of the molecular structure of the polymer. For example, some geonets sold on the market use air-entrained polymers to create "foamed" geonets with greater thicknesses. Over time, however, the air .in the entrained bubbles diffuses through the polymer and the drainage net goes flat. When loads are left on these geonets for testing purposes, it is possible to observe orders-of-magnitude reductions in t h e capacity of these materials by the 30th day of testing.
Geotextiles, geogrids, and geonets all should be purchased from companies tha t have inst i tuted quality control procedures a t the i r plants and
understand the l iabil i t ies, t h e r i sks , and t h e problems associated with landfill liner failure.
Sampling Strategies In a CQA program, there a r e three sampl ing frequency criteria: (1) continuous (100 percent), (2) judgmental, and (3) statistical. Every FML seam should be tested over 100 percent of its length. Any time a seaming operation begins, a sample should be cut for testing. A sample also should be taken any time a seaming operation is significantly modified (by using a new seamer or a new factory extrusion rod, o r by making a major adjustment to the equipment).
Continuous (1 00 Percent) Testing There are three types of continuous tests: visual, destruct (DT), and nondestruct (NDT). Visual inspection must be done on all seams, and DT tests must be done on all startup seams.
There are several types of nondestruct (NDT) seam tests (see Table 7-1). The actual NDT test depends on the seam type and membrane polymer. An air lance (a low pressure blast of air focused on the edge of the seam) can be used on polyvinyl chloride (PVC), chlorinated polyethylene (CPE), and other flexible liner materials. If there is a loose bond, the air lance will pop the seam open.
In a mechanical point stress test, a screwdriver or a pick is pressed into the edge of the seam to detect a weak bond location. In a vacuum chamber test, the worker applies soapy water to the seam. The vacuum chamber is then moved over the seam. If there is a hole, the vacuum draws a i r from beneath t h e membrane, causing a bubble to occur. The chamber should not be moved too quickly across the seam. To be effective, the vacuum box should remain on each portion of the seam a t least 15 seconds before i t is moved. Otherwise, it may not detect any leaks.
The pressurized dual seam test checks air retention under pressure. This test is used with double hot air or wedge seams that have two parallel welds with an air space between them, so that air pressure can be applied between the welds. Approximately 30 psi is applied for 5 minutes with a successful seam losing no more than 1 psi in that time. This seam cannot be used in sumps or areas in which there is limited space for the equipment to operate.
Ultrasonic equipment also may be used in a variety of seam tests. This equipment measures the energy transfer across a seam using two rollers: one that transmits a high frequency signal, and one that receives it. An oscilloscope shows the signal being received. An anomaly in the signal indicates some change in properties, typically a void (caused by the
101
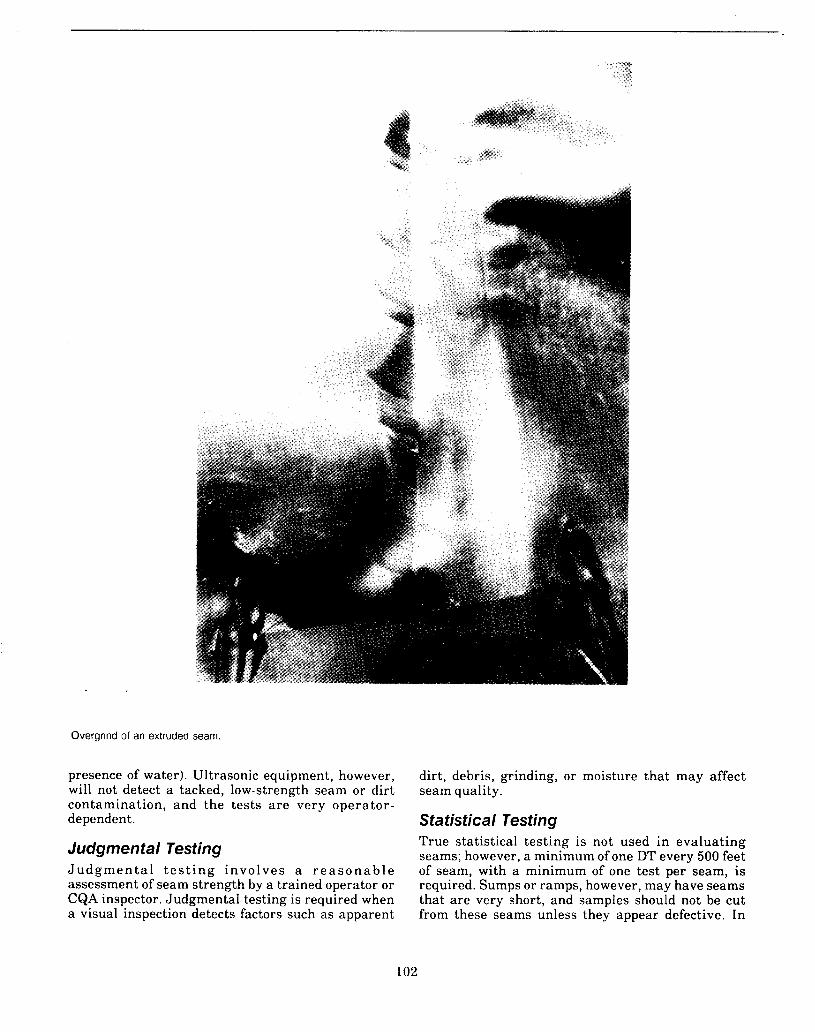
Overgrind of an extruded seam.
presence of water). Ultrasonic equipment, however, will not detect a tacked, low-strength seam or dirt contamination, and the tests a re very operator-
dirt, debris, grinding, or moisture that may affect seam quality.
dependent . Statistical Testing
Judgmental Testing True statistical testing is not used in evaluating seams; however, a minimum of one DT everv 500 feet
J u d g m e n t a l t e s t i n g invo lves a r e a s o n a b l e assessment of seam strength by a trained operator or CQA inspector. Judgmental testing is required when a visual inspection detects factors such as apparent
of seam, with a minimum of one test perlseam, is required. Sumps or ramps, however, may have seams that are very short, and samples should not be cut from these seams unless they appear defective. In
102
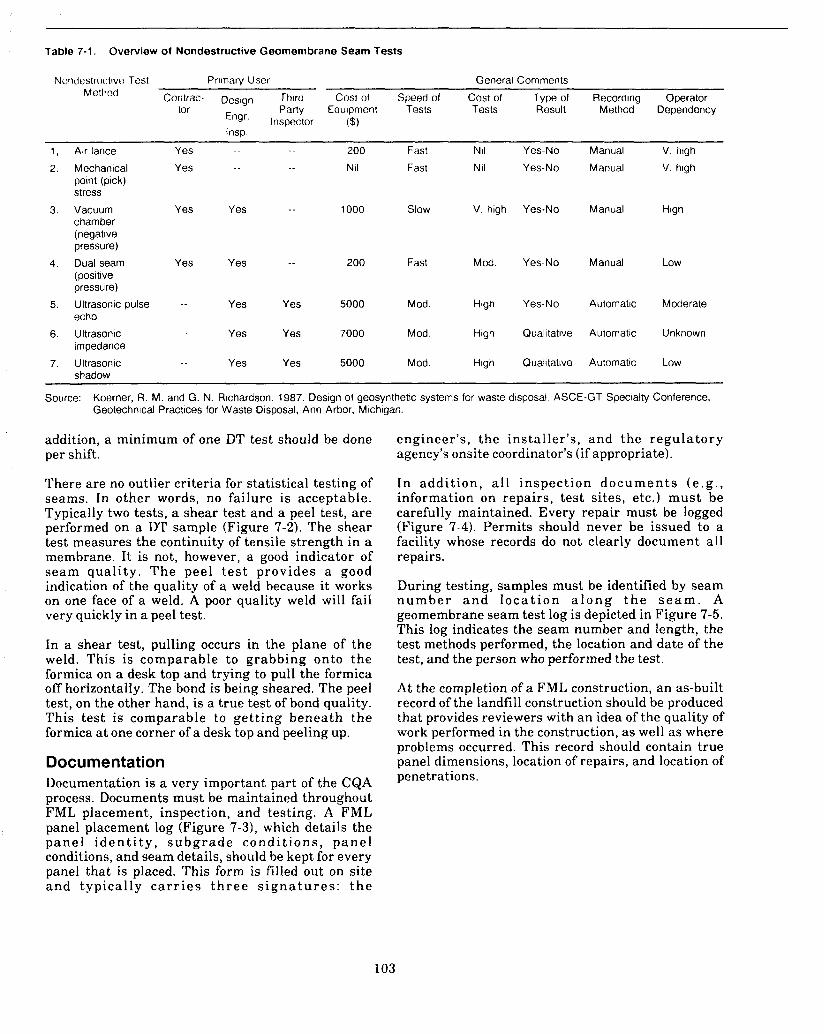
I
Table 7-1. Overview of Nondestructive Geomembrane Seam Tests
Noiidestrwtive Test Primary User General Comments
Coritrac- Design Third Cost of Speed of Cost of Type of Recording Operator Method
tor Party Equipment Tests Tests Result Method Dependency Engr. Inspector ($) lnsp
1, Air lance Yes .. .. 200 Fast Nil Yes-No Manual V high
2 Mechanical Yes .- ._ Nil Fast Nil Yes-No Manual V high point (pick) stress
chamber (negative pressure)
(positive pressure)
echo
impedance
shadow
3 Vacuum Yes Yes _ _ 1000 Slow V high Yes-No Manual High
4 Dual seam Yes Yes _ _ 200 Fast Mod. Yes-No Manual Low
5 Ultrasonic pulse -- Yes Yes 5000 Mod. High Yes-No Automatic Moderate
6 Ultrasonic _ _ Yes Yes 7000 Mod. High Oualitative Automatic Unknown
7 Ultrasonic -. Yes Yes 5000 Mod. High Qualitative Automatic Low
Source: Koerner, R. M and G. N Richardson. 1987. Design of geosynthetic systems for waste disposal ASCE-GT Specialty Conference, Geotechnical Practices for Waste Disposal, Ann Arbor, Michigan.
addition, a minimum of one DT test should be done per shift.
There are no outlier criteria for statistical testing of seams. In other words, no failure is acceptable. Typically two tests, a shear test and a peel test, are performed on a DT sample (Figure 7-2). The shear test measures the continuity of tensile strength in a membrane. It is not, however, a good indicator of seam qual i ty . The peel t e s t provides a good indication of the quality of a weld because it works on one face of a weld. A poor quality weld will fail very quickly in a peel test.
In a shear test, pulling occurs in the plane of the weld. This is comparable to grabbing onto the formica on a desk top and trying to pull the formica off horizontally. The bond is being sheared. The peel test, on the other hand, is a true test of bond quality. This test is comparable to get t ing beneath the formica a t one corner of a desk top and peeling up.
Documentation Documentation is a very important part of the CQA process. Documents must be maintained throughout FML placement, inspection, and testing. A FML panel placement log (Figure 7-31, which details the pane l i d e n t i t y , s u b g r a d e cond i t ions , pane l conditions, and seam details, should be kept for every panel that is placed. This form is filled out on site and typical ly c a r r i e s t h r e e s i g n a t u r e s : t h e
engineer’s, the installer’s, and the regula tory agency’s onsite coordinator’s (if appropriate).
In addi t ion , a l l inspect ion d o c u m e n t s ( e . g . , information on repairs, test sites, etc.) must be carefully maintained. Every repair must be logged (Figure 7-4). Permits should never be issued to a facility whose records do not clearly document all repairs.
During testing, samples must be identified by seam n u m b e r a n d l o c a t i o n a l o n g t h e s e a m . A geomembrane seam test log is depicted in Figure 7-5. This log indicates the seam number and length, the test methods performed, the location and date of the test, and the person who performed the test.
At the completion of a FML construction, an as-built record of the landfill construction should be produced that provides reviewers with an idea of the quality of work performed in the construction, a s well as where problems occurred. This record should contain true panel dimensions, location of repairs, and location of penetrations.
103
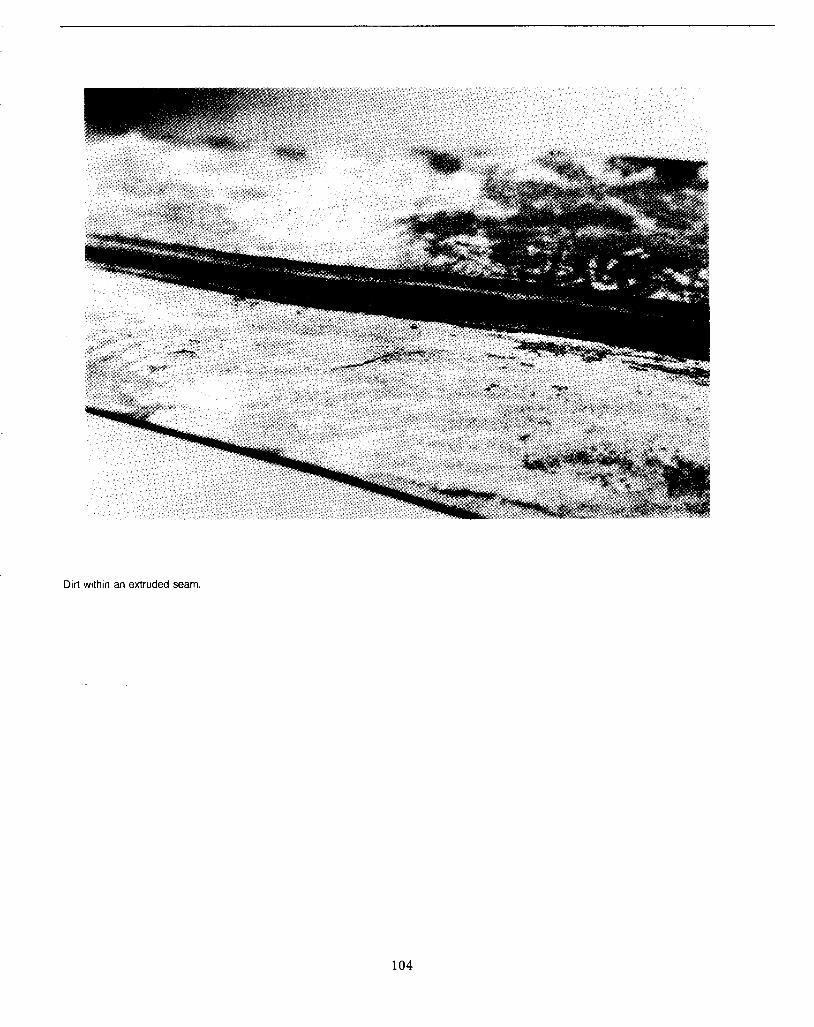
Dirt within an extruded seam
104
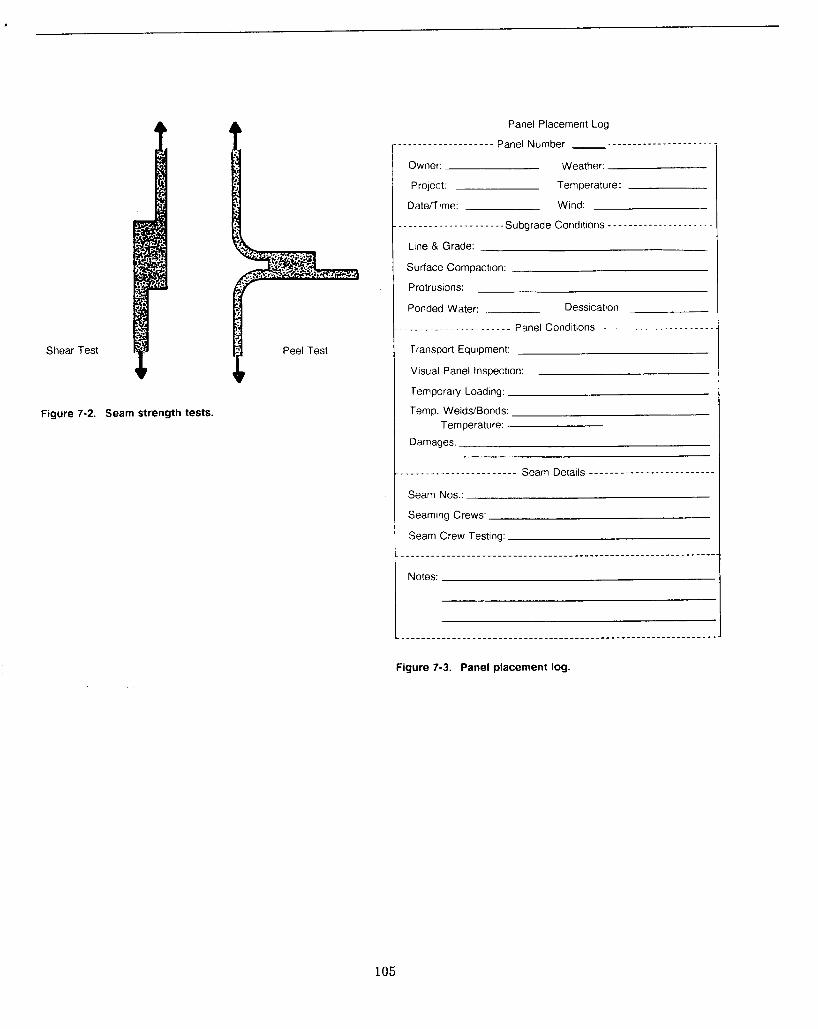
Shear Test
Figure 7-2. Seam strength tests.
Peel Test
Panel Placement Log
______--_.__._--__ Panel Number
Owner: Weather:
Project: Temperature:
Dateflime: Wind:
. -. .__ - _ _ _ _ - - - - - _ _ _ .Subgrade Condltlons _ _ _ _ .__- - .-_ - -. . . . . ~.
Line 8 Grade:
Surface Compaction:
Protrusions:
Ponded Water: Dessication
.____._...__ .- ~ .....- panel Conditions ._._..____._____...--..
Transport Equipment:
Visual Panel Inspection:
Temporary Loading:
Temp. Welds/Bonds: Temperature:
Damages:
____________....._____ Seam Details ____________________.-- -
Seam Nos.:
Seaming Crews:
Seam Crew Testing:
Notes:
Figure 7-3. Panel placement log.
105
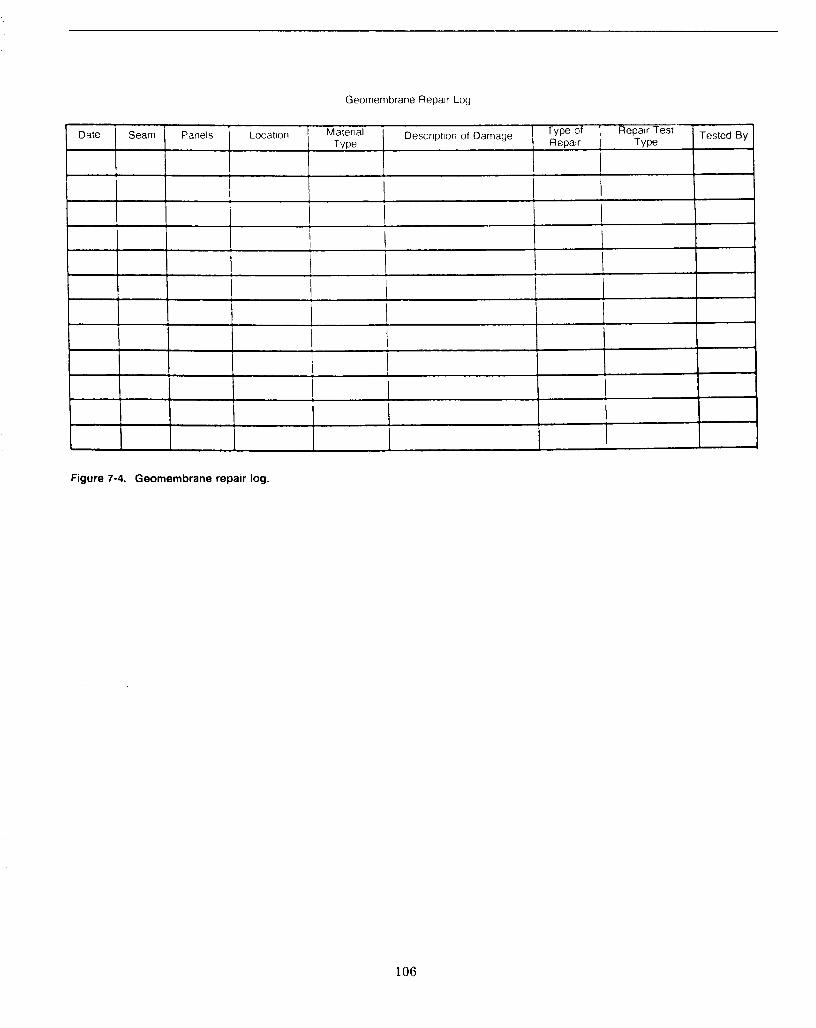
Geomembrane Repair Log
Type Repair Type
Figure 7-4. Geomembrane repair log.
Date
106
Seam Panels Location Material Description of Damage Type Of Repair Test Tested By '
I ! I
! I
I I
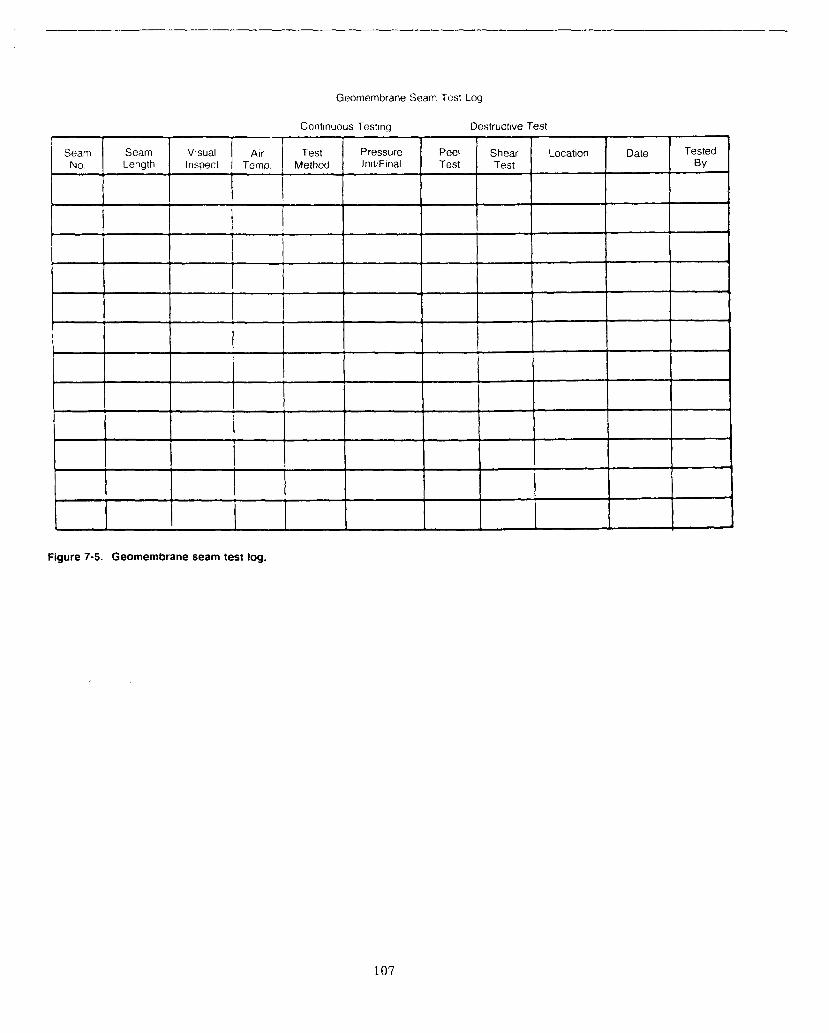
I
Destructive Test Continuous Testing
Seam Seam Visual Air Test Pressure Peel Shear Location Date Tested No Length Inspect Temp Method IniVFinal Test Test BY
I i ! I
I
i I I I I
1
i
Geomembrane Seam Test Log
Figure 7-5. Geomembrane seam test log.
107

8. LINER COMPATIBILITY WITH WASTES
Introduction This chapter discusses chemical compatibil i ty (resistance) of geosynthetic and n a t u r a l l i ne r materials with wastes and leachates. Even in a relatively iner t environment, cer ta in mater ia l s deteriorate over time when exposed to chemicals contained in both hazardous and nonhazardous leachate. It is important to anticipate the kind and quality of leachate a site will generate and select liner materials accordingly. The chemical resistance of any flexible membrane liner (FML) materials, geonets, geotextiles, and pipe should be evaluated before installation.
Chemical compatibility tests using EPA Method 9090 should always be performed for hazardous waste sites, but some municipal waste si tes also contain hazardous, nondegradable materials. EPA conducted a 5-year study of the impact of municipal refuse on commercially available liner materials and found no evidence of deter iorat ion within tha t period. However, in a current study of leachate quality in municipal landfil ls , the Agency has discovered some organic chemical const i tuents normally found in hazardous waste landfill facilities. Apparently small quantities of household hazardous waste .enter municipal sites or a re disposed of a s small quantity generator wastes. As a result of these findings, EPA is developing a position on the need €or chemical compatibil i ty tes t s for t housands of municipal waste disposal sites.
In general, cover materials, including membranes and geosynthetics, do not need to be checked for chemical compatibility since these materials do not encounter leachates. Research data indicate that the predominant gases coming from municipal sites are methane, hydrogen, and carbon dioxide, although a few others may be emitted from household hazardous waste. These gases pass through cover materials by diffusion and evidence to date indicates tha t they have caused no deterioration of membranes. Also, chemical compatibility of cover materials with gases
has not been a major problem a t hazardous waste facilities.
A primary objective of chemical compatibility testing is to ensure that liner materials will remain intact not just during a landfill’s operation but also through the post-closure period, and preferably longer. I t is difficult, however, to predict fu tu re chemical impacts. There is no guarantee that liner materials selected for a site today will be the same as materials manufactured 20 years from now. For example, the quality of basic resins has improved considerably over the last few years.
The wastes themselves also change over time. Tests should be performed to ensure that landfill leachate will not permeate the liner layer. EPA recommends a variety of physical property degradat ion tes ts , inc luding a f inge rp r in t p rog ram of t h e r m o - g rav ime t r i c a n a l y s i s , d i f f e r e n t i a l s c a n n i n g c a l o r i m e t r i c t e s t s , a n d i n f r a r e d a n a l y s i s . Fingerprinting involves analyzing the molecular structure of the leachate components. Sometimes a particularly aggressive leachate component can be identified by evaluating the fingerprint analysis tests after exposure of the membrane to the leachate.
Exposure Chamber The first area of concern in chemical compatibility testing is the exposure chamber used to hold the leachate and membranes being tested. The exposure chamber tank can be made of s ta inless s t ee l , polyethylene, glass, or a variety of other materials. Any geosynthetic liner material being considered must be tested for chemical compatibility with the leachate. Some leachates have caused rusting and deterioration of stainless steel tanks in the past, and if polyethylene is being evaluated, the tank should be of another type of material to prevent competition between the tank material and the test specimen for aggressive agents in the leachate.
The conditions under which the material is tested are crucial. The top of the exposure chamber must be
109
sealed and the tank should contain no free air space. A stirring mechanism in the tank keeps the leachate mixture homogeneous and a heater block keeps it a t an elevated temperature as required for the test. Stress conditions of the material in the field also should be simulated as closely as possible. The original EPA Method 9090 test included a rack to hold specimens under stress conditions but w a s revised when some materials shrank in the leachate. Due to the hazardous nature of the material, testing should be performed in a contained environment and safety procedures should be rigorously followed.
In some cases a sump a t the waste management facility can be used as an exposure chamber if it is large enough. The designer of a new landfill site can design a slightly larger sump especially for this purpose. However, since the temperature of a sump is colder than room temperature (55°F instead of 72"F), the geosynthetics need to be exposed for a longer period of time. Instead of 120 days, the test might take 6 months to a year or longer.
Representative Leachate
It is important that the sample being tested is representative of the leachate in the landfil l . Leachate sampled directly from a sump is usually representative, but care must be taken not to mix it during removal. This will dis turb the sample's homogeneity a n d may r e su l t i n componen t s separating out. Another problem is that municipal solid waste landfill leachate will start to oxidize as soon as it leaves the sump and probably should be sampled under a n inert atmosphere.
A sampler should be familiar with the source of all the leachate a t a site before removing a sample. If radioactive materials are present, extra care must be taken.
At some existing waste management facilities, operators have placed coupons of geosynthetic materials into sump a reas to monitor leachate effects. Information gathered from this monitoring procedure provides a n excellent data base. Regular recording of data allows the operator to discover compatibility problems as they develop, rather than waiting until a landfill liner fails. If the coupon shows early signs of deterioration, the operator can respond immediately to potential problems in the facility.
When planning construction of a new si te , a n operator first assesses the market to determine the quantity and quality of waste the landfill will receive. Representative leachate is then formulated based on the operator's assessment.
The Permit Applicant's Guidance Manua l for Treatment, Storage, and Disposal (TSD) facilities
con ta ins add i t iona l information on l e a c h a t e representativeness (see Chap te r 5 , pp. 15-17; Chapter 6, pp. 18-21; and Chapter 8, pp. 13-16).
Compatibility Testing of Components
Geosynthetics EPA's Method 9090 can be used to evaluate all geosynthetic materials used in liner and leachate collection and removal systems currently being designed. Method 9090 is used to predict the effects of leachate under field conditions and has been verified with limited field data. The test is performed by immers ing a geosynthet ic in a chemica l env i ronmen t €or 120 d a y s a t two d i f f e r e n t temperatures, room and elevated. Every 30 days, samples are removed and evaluated for changes in physical properties. Tests performed on FMLs a re listed in Table 8-1. The results of any test should be cross-referenced to a second, corollary test to avoid errors due to the test itself o r to the laboratory personnel.
Table 8-1. Chemical Compatibility Tests for FMLs
Hardness
Melt Index
Extractibles
Volatile Loss
Peel Adhesion
Tear Resistance
Specific Gravity
Low Temperature
Water Absorption
Puncture Resistance
Dimensional Stability
Modulus of Elasticity
Bonded Seam Strength
Hydrostatic Resistance
Carbon Black Dispersion
Thickness, Length, Width
Tensile at Yield and Break
Environmental Stress Crack
0 Elongation at Yield and Break
Physical property tests on geotextiles and geonets must be designed to assess different uses, weights, and thicknesses of these mater ia ls , as well as construction methods used in the field. EPA has a limited data base on chemical compatibility with geotextiles. Some tests for geonets and geotextiles recommended by EPA are listed in Table 8-2. The ASTM D35 Committee should be consulted for information on the latest testing procedures.
110
Table 8-2. Chemical Compatibility Tests for GeonetdGeotextiles
Puncture
Thickness
Permittivity
Transmissivity
MassNnit Area
Burst Strength
Abrasive Resistant
Percent Open Area
Ultraviolet Resistivity
Grab TensileiElongation
Equivalent Opening Size
Hydrostatic Bursting Strength
Tearing Strength (Trapezoidal)
Compression BehavioriCrush Strength
Until recently, EPA recommended using 1 1/2 times the expected overburden pressure for i np lane transmissivity tests. Laboratory research, however, has revealed that creep and intrusion cause a loss of transmissivity, so the Agency has amended i t s recommendation to 2 to 3 times the overburden pressure. EPA also recommends that the geotextile or geonet be aged in leachate, but that the actual test be performed with water. Performing the test with the leachate creates too great a risk of contamination to test equipment and personnel. The transmissivity test should be run for a minimum of 100 hours. The test apparatus should be designed to simulate the field conditions of the actual cross section as closely as possible.
Pipes The crushing strength of pipes also should be tested. There have been examples where pipes in landfills have actually collapsed, and thus forced the site to stop operating. The ASTM D2412 is used to measure the strength of pipe materials.
Natural Drainage Materials Natural drainage materials should be tested to ensure that they will not dissolve in the leachate or form a precipitant that might clog the system. ASTM D2434 will evaluate the ability of the materials to retain permeability characteristics, while ASTM D1883 tests for bearing ratio, or the ability of the material to support the waste unit.
Blanket Approvals EPA does not grant "blanket approvals" for any landfill construction materials. The quality of liner ma te r i a l s va r i e s considerably, depending on
quantities produced and on the manufacturer. Even high density polyethylene (HDPE) does not receive blanket approval. The Agency, together with a group of chemists, biologists, and researchers from the liner manufacturing industry, determined t h a t HDPE varies slightly in i ts composition among manufacturers. Because different calendaring aids, processing aids, or stabilizer packages can change the overall characterist ics of a product , each material should be individually tested.
Landfill designers should select materials on the basis of site-specific conditions, as the composition of specific leachates will vary from site to s i te . A designer working with the operator determines in advance of construction what materials will be most effective. In recent years, EPA has restricted certain wastes, including liquids, from land disposal. These regulations have expanded the number of potential candidate materials, thus allowing more flexibility to landfill designers.
Interpreting Data When liner material test data show the r a t e of change of the material to be nil over a period of time, then the membrane is probably not undergoing any chemical change. There have been in s t ances , however, in which a material was tested for a year without change and then suddenly collapsed. For this reason, the longer the tes t ing process can continue, the more reliable the data will be. When test data reveal a continuous rate of change, then the material is reacting with the leachate in some way. If the data show a n initial continuous rate of change that then tapers off, new leachate may need to be added more often. In any case, the situation should be studied in more detail.
A designer should consult with experts to interpret data from chemical compatibility tests. To meet this need, EPA developed a software system called Flexible Membrane Liner Advisory Expert System (FLEX) to assist in evaluating test data. FLEX is a n expert system that is based on data from many c h e m i c a l c o m p a t i b i l i t y t e s t s a n d c o n t a i n s interpretations from experts in the field.
1 1 1

I
I
9. LONG-TERM CONSIDERATIONS: PROBLEM AREAS AND UNKNOWNS
Introduction This chapter presents a n overview of long-term considerations regarding the liner and collection systems of hazardous waste landfil ls , sur face impoundments, and waste piles. Included in the discussion are flexible membrane liner and clay liner durability, potential problems in leachate collection and removal systems, and disturbance and aesthetic concerns in caps and closures.
will stay intact indefinitely. This is because stable polymers in isolation have an equilibrium molecular structure that prevents aging. The usual indicators of s t ress a r e changes in densi ty , p, and glass transition temperature, T,. The glass transition temperature is the temperature below which the amorphous region of a crystalline polymer is rigid and brittle (glossy) and above which it is rubbery or fluidlike,
In judging the impact of any facility, site-specific conditions such a s geology and s t r a t ig raphy ; seismicity; ground-water location and qual i ty; population density; facility size; leachate quantity and quality; and nontechnical political, social, and economic factors must be taken into account. Table 9-1 summarizes areas of concern in various landfill materials and components.
One of the most impor tan t considerat ions i n planning a waste facility is estimating the length of t ime the facility i s expected to operate. Some recommended time frames for different kinds of facilities are:
Polymers in the field, however, are subject to many external influences and stresses. Experiments done on FML materials attempt to simulate the long-term in situ aging processes. One approach is to place a sample of mater ia l i n a tes t chamber a t room temperature (approximately 70"F), and another sample in a chamber heated to 120" to 160°F. The activation energy for the two FMLs is evaluated. Then a model based on the Arrhenius equation is used to determine the length of time it would take the sample kept a t 70°F to degrade to the same extent a s the high t empera tu re sample . T h i s procedure, however, assumes t h a t tempera ture increase is physically equivalent to the t ime of exposure in the field, a n assumption with which
1-5 years many chemists disagree. Heap leach pads Waste piles 5-10 years Surface impoundments 5-25 years Solid waste landfills 30-100 years
0 Radioactive waste landfills 100-1000 + years
None of these t ime f r ames a r e se t f o r t h i n regulations, however. The only time frame regulated by EPA is the 30-year post-closure care period for all hazardous waste landfill facilities.
Flexible Membrane Liners T h e major l ong- t e rm cons ide ra t ion i n a n y synthetically lined facil i ty is the durabi l i ty of flexible membrane liners (FMLs). In the absence of sunlight, oxygen, or stresses of any kind, a properly formulated, compounded, and manufactured FML
Therefore, in the absence of a direct measurement method for FML lifetime, it becomes necessary to evaluate all of the possible degradation mechanisms that may contribute to aging.
Degradation Concerns A number of mechanisms contribute to degradation in the field, many of which can be controlled with proper design and construction. A FML can be weakened by v a r i o u s i n d i v i d u a l p h y s i c a l , mechanical, and chemical phenomena or by the synerg is t ic effects of two o r more of t h e s e phenomena. Polymeric materials have an extremely elongated molecular structure. Degradation cuts across the length of this structure in a process known as chain scission. The more chain breakages tha t occur, the more the polymer is degraded by loss of
113
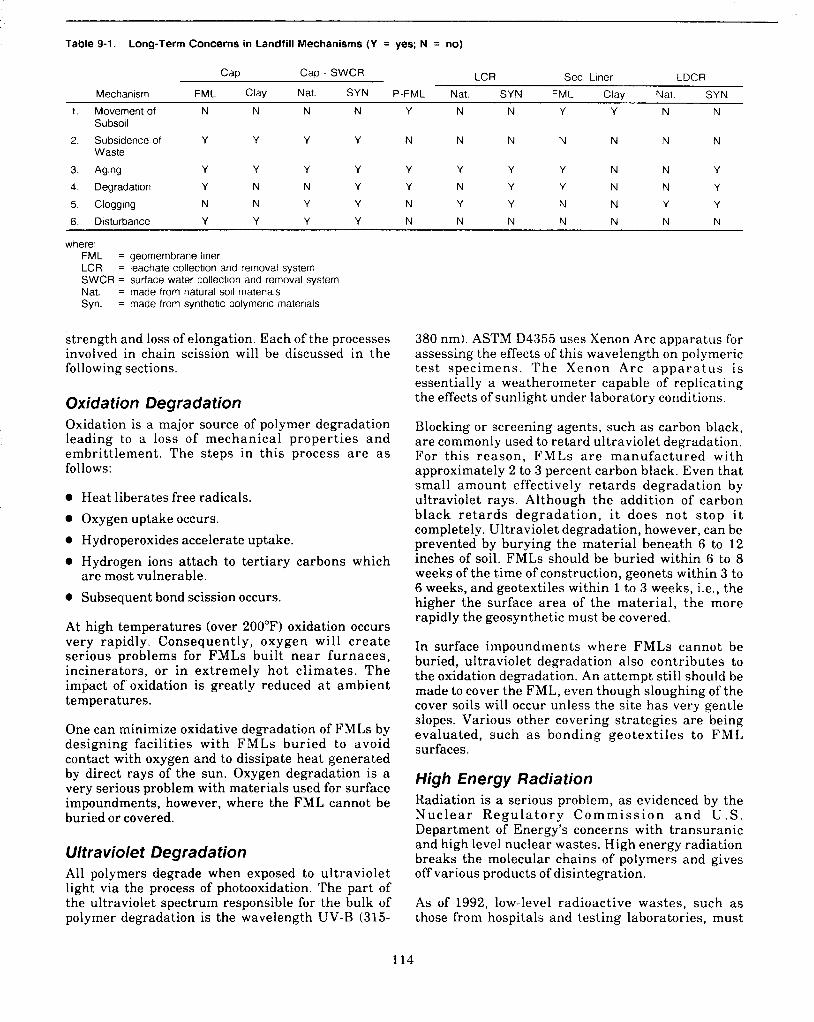
I
Table 9-1. Long-Term Concerns in Landfill Mechanisms (V = yes; N = no)
LCR Sec. Liner LDCR Cap Cap - SWCR
Mechanism FML Clay Nat. SYN P-FML Nat. SYN FML Clay Nat. SYN
Subsoil
Waste
1 . Movement of N N N N Y N N Y Y N N
2. Subsidence of Y Y Y Y N N N N N N N
3. Aging Y Y Y Y Y Y Y Y N N Y
4. Degradation Y N N Y Y N Y Y N N Y
5. Clogging N N Y Y N Y Y N N Y Y
6. Disturbance Y Y Y Y N N N N N N N
where: FML = geomembrane liner LCR SWCR = surface water collection and removal system Nat. = made from natural soil materials Syn.
= leachate collection and removal system
= made from synthetic polymeric materials
strength and loss of elongation. Each of the processes involved in chain scission will be discussed in the following sections.
Oxidation Degradation Oxidation is a major source of polymer degradation leading to a loss of mechanical properties and embrittlement. The steps in this process a r e a s follows:
0 Heat liberates free radicals. 0 Oxygen uptake occurs. 0 Hydroperoxides accelerate uptake. 0 Hydrogen ions attach to tertiary carbons which
0 Subsequent bond scission occurs.
At high temperatures (over 200°F) oxidation occurs very rapidly. Consequently, oxygen will create serious problems for FMLs built near furnaces, incinerators, or in extremely hot climates. The impact of oxidation is greatly reduced a t ambient temperatures.
are most vulnerable.
One can minimize oxidative degradation of FMLs by designing facilities with FMLs buried to avoid contact with oxygen and to dissipate heat generated by direct rays of the sun. Oxygen degradation is a very serious problem with materials used for surface impoundments, however, where the FML cannot be buried or covered.
Ultraviolet Degradation All polymers degrade when exposed to ultraviolet light via the process of photooxidation. The part of the ultraviolet spectrum responsible for the bulk of polymer degradation is the wavelength UV-B (315-
380 nm). ASTM D4355 uses Xenon Arc apparatus for assessing the effects of this wavelength on polymeric test specimens. The Xenon Arc a p p a r a t u s is essentially a weatherometer capable of replicating the effects of sunlight under laboratory conditions.
Blocking or screening agents, such as carbon black, are commonly used to retard ultraviolet degradation. For this reason, FMLs a r e manufactured with approximately 2 to 3 percent carbon black. Even that small amount effectively retards degradation by ultraviolet rays. Although the addition of carbon black retards degradation, it does not s top i t completely. Ultraviolet degradation, however, can be prevented by burying the material beneath 6 to 12 inches of soil. FMLs should be buried within 6 to 8 weeks of the time of construction, geonets within 3 to 6 weeks, and geotextiles within 1 to 3 weeks, i.e., the higher the surface area of the material, the more rapidly the geosynthetic must be covered.
In surface impoundments where FMLs cannot be buried, ultraviolet degradation also contributes to the oxidation degradation. An attempt still should be made to cover the FML, even though sloughing of the cover soils will occur unless the site has very gentle slopes. Various other covering strategies are being evaluated, such as bonding geotextiles to FML surfaces.
High Energy Radiation Radiation is a serious problem, as evidenced by the N u c l e a r R e g u l a t o r y C o m m i s s i o n a n d U . S . Department of Energy’s concerns with transuranic and high level nuclear wastes. High energy radiation breaks the molecular chains of polymers and gives off various products of disintegration.
As of 1992, low-level radioactive wastes, such as those from hospitals and testing laboratories, must
14
I .
be contained in landfills. The effects of low-level radiation associated with these waste materials on polymers still needs to be evaluated.
Chemical Degradation: pH Effects All polymers swell to a certain extent when placed in contact with water (pH = 7) because they accept water andlor water vapor into their molecular structure. Degrees of swelling for some common polymers are listed below:
Polyvinyl chloride (PVC) 10 percent Polyamide (PA) 4 to 4.5 percent Polypropylene (PPI 3 percent Polyethylene (PE) 0.5 to 2.0 percent Polyester (PETI 0.4 to 0.8 percent
Polymer swelling, however, does not necessarily prevent a material from functioning properly. The U.S. Bureau of Reclamation has observed polyvinyl chloride liners functioning adequately in water canals for 20 to 25 years despite relatively large increases in the thickness of the material.
In very acidic envi ronments (pH < 3 ) , some polymers, such as polyamides, (i.e., Kevlar and nylon) begin to degrade. On the other end of the spectrum, certain polyesters degrade in extremely a l k a l i n e e n v i r o n m e n t s ( p H > 1 2 ) . H i g h temperatures generally accelerate t he chemical degradation process. Most landfill leachates are not acidic or basic enough to cause concern. However, in certain kinds of landfills, such as those used for ash disposal, the pH of the leachate might be qui te alkaline and needs to be taken into account when choosing liner materials.
Chemical Degradation: Leachate EPA's Method 9090 is a test procedure used to evaluate leachate degradation of FML materials. As described in- Chapter Eight, t h e FML must be immersed in the site-specific chemical environment for at least 120 days at two different temperatures. Physical and mechanical properties of the tested material are then compared to those of the original material every 30 days. Assessing subtle property changes can be difficult. Flexible Liner Evaluation Expert (FLEX), a software system designed to assist in the Resource Conservation Recovery Act (RCRA) permitting process, can help in evaluating EPA Method 9090 test data.
Biological Degradation Neither laboratory nor field tests have demonstrated significant evidence of biological degradation. Degradation by fungi or bacteria cannot take place unless the microorganisms attach themselves to the
polymer and find the end of a molecular chain, a n extremely unlikely event. Chemical companies have been unable to manufacture biological additives capable of destroying high-molecular weight polymers, like those used in FMLs and related geosynthetic materials. Microbiologists have tried unsuccessfully to make usable biodegradable plastic trash bags for many years. The polymers in FMLs have 10,000 times the molecular weight of these materials, thus are very unlikely to biodegrade from microorganisms.
There also is little evidence that insects or burrowing animals destroy polymer liners or cover materials. In tests done with rats placed in lined boxes, none of the animals were able to chew their way through the FMLs. Thus, degradation from a wide spectrum of biological sources seems highly unlikely.
Other Degradation Processes Other possible sources of degradat ion include thermal processes, ozone, extraction via diffusion, and delamination. Freeze-thaw cycling, or the process by which a material undergoes alternating rapid extremes of temperature, has proven to have an insignificant effect on polymer strength or FML seam strength. Polymeric materials experience some stress due to warming, thereby slightly decreasing their strength, but within the range of 0" to 160"F, there is no loss of integrity.
Ozone is related to ultraviolet degradation in the photooxidation process, and, therefore, creates a more serious problem for polymeric mater ia ls . However, ozone effects can be essentially eliminated by covering the geosynthetic materials within the time frames previously mentioned.
I n t h e ex t rac t ion via d i f fus ion m e c h a n i s m , plasticizers leach out of polymers leaving a tacky substance on the surface of the material. The FML becomes less flexible, but not, apparently, weaker nor less durable.
Delamination of scrim-reinforced material was a problem until 15 years ago when manufacturers began using large polymer calendar presses. The p r e s s e s tho rough ly i n c o r p o r a t e t h e s c r i m reinforcement, so that delamination rarely occurs today.
Stress-induced Mechanisms Freeze-thaw, abrasion, creep, and stress cracking are all stress mechanisms that can affect polymers. The first two, freeze-thaw and abrasion, are not likely to be problems if the material is buried sufficiently deep. Soil burying will e l iminate tempera ture extremes. Abrasion is a consideration only in surface
115
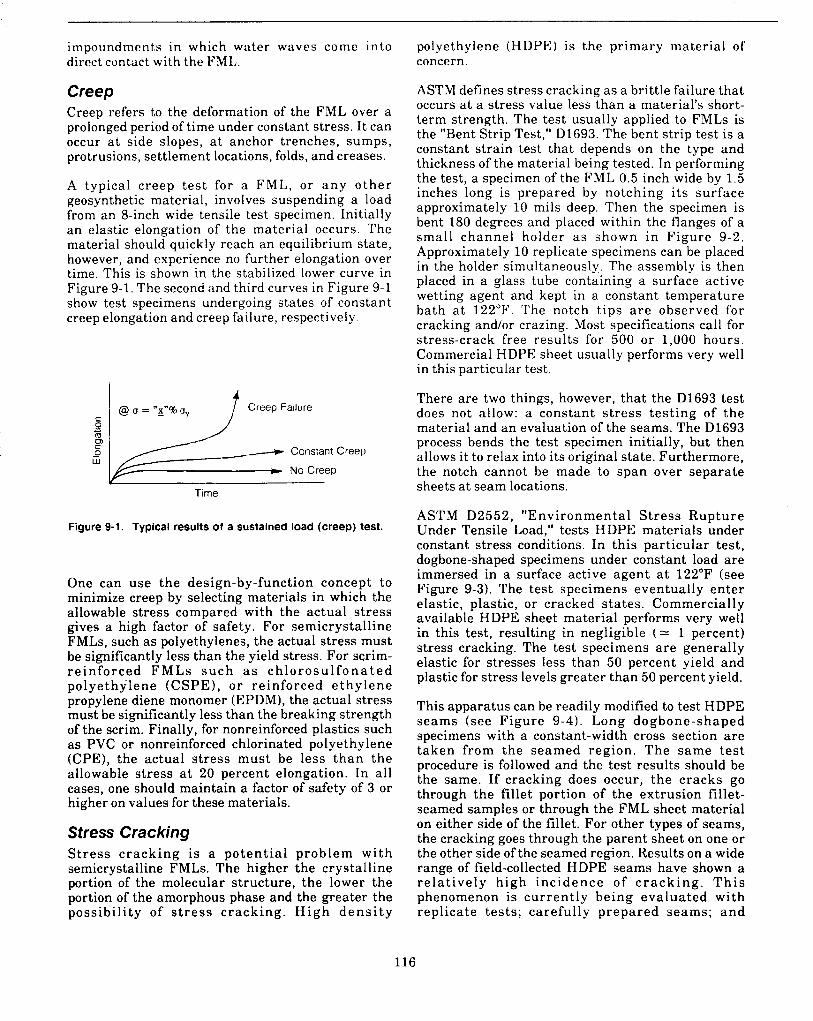
E
impoundments in which water wavcs come into direct contact with the FML.
Creep Creep refers to the deformation of the FML over a prolonged period of time under constant stress. It can occur a t side slopes, a t anchor trenches, sumps, protrusions, settlement locations, folds, and creases.
A typical creep test for a FML, o r a n y o t h e r geosynthetic material, involves suspending a load from an 8-inch wide tensile test specimen. Initially an elastic elongation of the material occurs. The material should quickly reach an equilibrium state, however, and experience no further elongation over time. This is shown in the stabilized lower curve in Figure 9-1. The second and third curves in Figure 9-1 show test specimens undergoing states of constant creep elongation and creep failure, respectively
I A Creep Failure
Constant Creep
No Creep
c 0 w
Time
Figure 9-1. Typical results of a sustained load (creep) test.
One can use the design-by-function concept to minimize creep by selecting materials in which the allowable stress compared with the actual stress gives a high factor of safety. For semicrystalline FMLs, such as polyethylenes, the actual stress must be significantly less than the yield stress. For scrim- reinforced FMLs such as c h l o r o s u l f o n a t e d polyethylene (CSPE), o r reinforced e thy lene propylene diene monomer (EPDM), the actual stress must be significantly less than the breaking strength of the scrim. Finally, for nonreinforced plastics such as PVC or nonreinforced chlorinated polyethylene (CPE), the actual stress must be less t h a n the allowable stress a t 20 percent elongation. In all cases, one should maintain a factor of safety of 3 or higher on values for these materials.
Stress Cracking S t r e s s c rack ing is a potent ia l problem with semicrystalline FMLs. The higher the crystalline portion of the molecular structure, the lower the portion of the amorphous phase and the greater the possibility of s t r e s s cracking. H i g h d e n s i t y
polyethylene (HDPE) is the primary material of concern.
ASTM defines stress cracking as a brittle failure that occurs a t a stress value less than a material's short- term strength. The test usually applied to FMLs is the "Bent Strip Test," D1693. The bent strip test is a constant strain test that depends on the type and thickness of the material being tested. In performing the test, a specimen of the FML 0.5 inch wide by 1.5 inches long is prepared by notching i t s surface approximately 10 mils deep. Then the specimen is bent 180 degrees and placed within the flanges of a small channel holder as shown i n Figure 9-2. Approximately 10 replicate specimens can be placed in the holder simultaneously. The assembly is then placed in a glass tube containing a surface active wetting agent and kept in a constant temperature bath a t 122°F. The notch t ips a r e observed for cracking and/or crazing. Most specifications call for stress-crack free results for 500 or 1,000 hours. Commercial HDPE sheet usually performs very well in this particular test.
There are two things, however, that the D1693 test does not allow: a constant s t ress tes t ing of the material and a n evaluation of the seams. The D1693 process bends the test specimen initially, but then allows it to relax into its original state. Furthermore, the notch cannot be made to span over separate sheets a t seam locations.
ASTM D2552, "Environmental S t r e s s Rupture Under Tensile Load," tests HDPE materials under constant stress conditions. In this particular test, dogbone-shaped specimens under constant load are immersed in a surface active agent at 122°F (see Figure 9-3). The test specimens eventually enter elastic, plastic, or cracked states. Commercially available HDPE sheet material performs very well in this test, resulting in negligible (= 1 percent) stress cracking. The test specimens a re generally elastic for stresses less than 50 percent yield and plastic for stress levels greater than 50 percent yield.
This apparatus can be readily modified to test HDPE seams (see Figure 9-41, Long dogbone-shaped specimens with a constant-width cross section a re taken from the seamed region. The same tes t procedure is followed and the test results should be the same. If cracking does occur, t he cracks go through the fillet portion of the extrusion fillet- seamed samples or through the FML sheet material on either side of the fillet. For other types of seams, the cracking goes through the parent sheet on one or the other side of the seamed region. Results on a wide range of field-collected HDPE seams have shown a r e l a t ive ly high incidence of c r a c k i n g . T h i s phenomenon is current ly being evaluated with replicate tests; carefully prepared seams; a n d
116
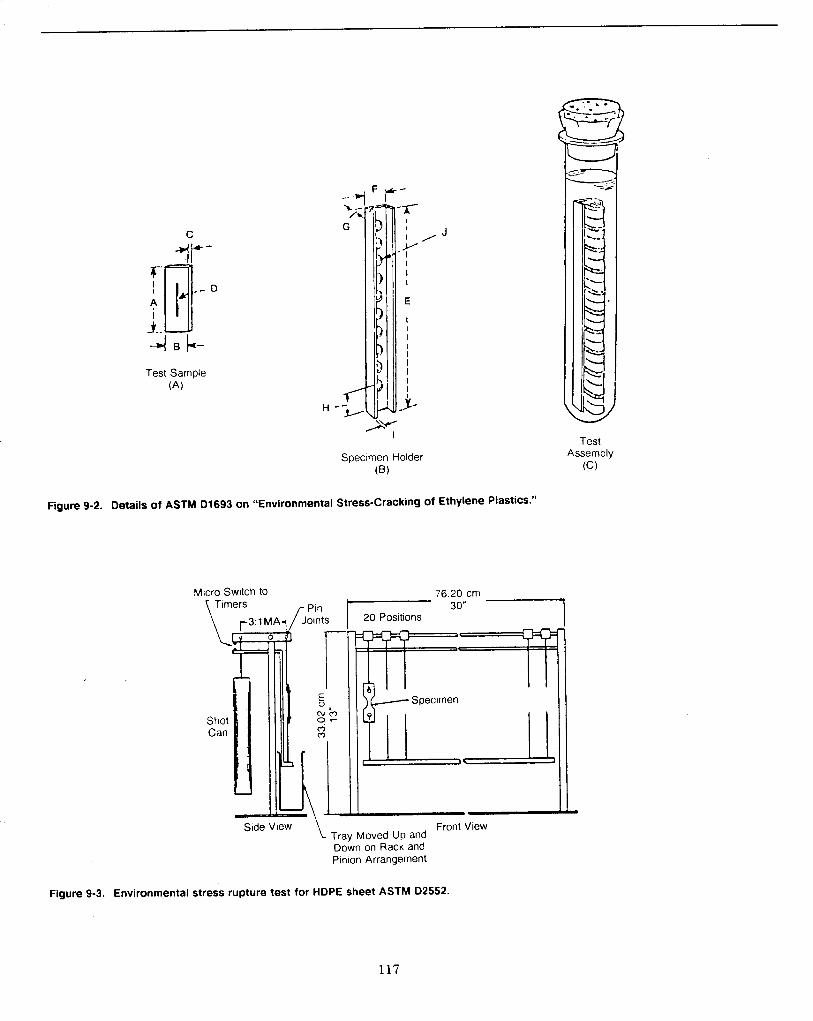
Test Sample (A)
F - -4 Ir-
’7
.-Y-
I I J ‘ / I I I
E l I I I I I I I I
,&
Specimen Holder (6)
Figure 9-2. Details of ASTM D1693 on “Environmental Stress-Cracking of Ethylene Plastics.”
Micro Switch to 76.20 cm
Front View Tray Moved Up and Down on Rack and Pinion Arrangement
Test Assembly
(C)
Figure 9-3. Environmental stress rupture test for HDPE sheet ASTM D2552.
117
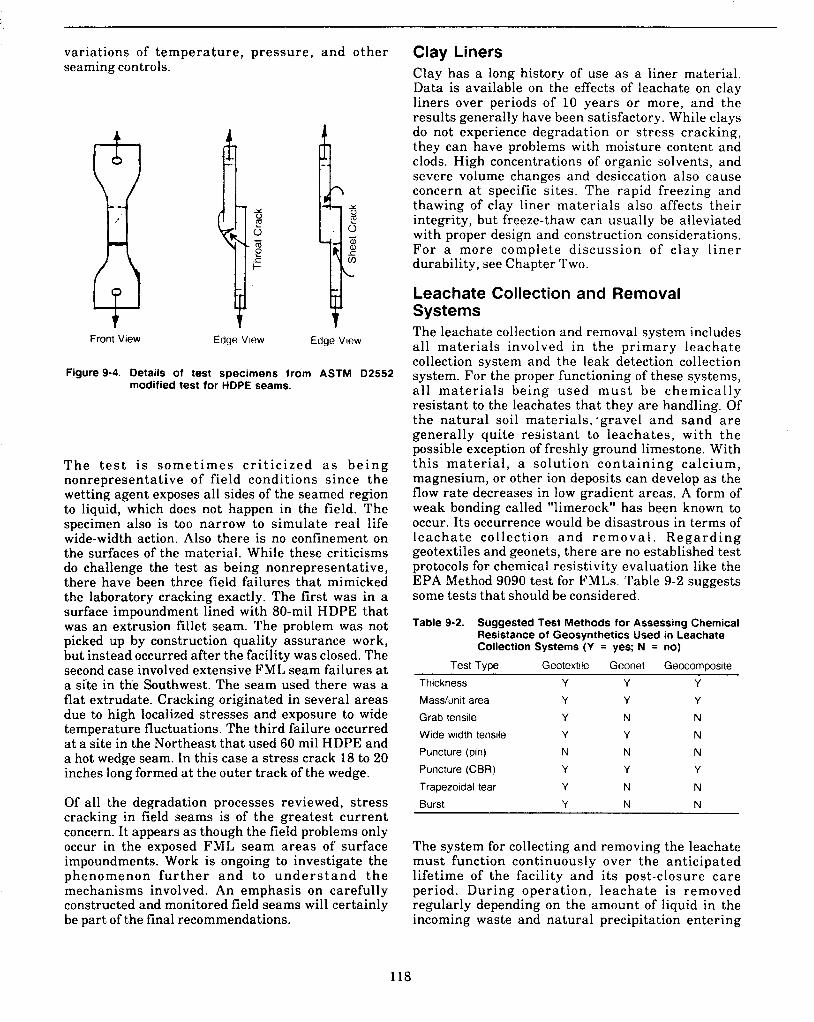
variations of temperature , pressure, and other seaming controls.
A A
Front View t
Edge View t
Edge View
Figure 9-4. Details of test specimens from ASTM D2552 modified test for HDPE seams.
T h e t e s t is s o m e t i m e s c r i t i c i zed a s b e i n g nonrepresentative of field conditions since the wetting agent exposes all sides of the seamed region to liquid, which does not happen in the field. The specimen also is too narrow to simulate real life wide-width action. Also there is no confinement on the surfaces of the material. While these criticisms do challenge the test as being nonrepresentative, there have been three field failures that mimicked the laboratory cracking exactly. The first was in a surface impoundment lined with 80-mil HDPE that was an extrusion fillet seam. The problem w a s not picked up by construction quality assurance work, but instead occurred after the facility was closed. The second case involved extensive FML seam failures a t a site in the Southwest. The seam used there was a flat extrudate. Cracking originated in several areas due to high localized stresses and exposure to wide temperature fluctuations. The third failure occurred a t a site in the Northeast that used 60 mil HDPE and a hot wedge seam. In this case a stress crack 18 to 20 inches long formed a t the outer track of the wedge.
Of all the degradation processes reviewed, stress cracking in field seams is of the greatest current concern. It appears as though the field problems only occur in the exposed FML seam areas of surface impoundments. Work is ongoing to investigate the phenomenon fu r the r and to u n d e r s t a n d t h e mechanisms involved. An emphasis on carefully constructed and monitored field seams will certainly be part of the final recommendations.
Clay Liners Clay has a long history of use a s a liner material. Data is available on the effects of leachate on clay liners over periods of 10 years or more, and the results generally have been satisfactory. While clays do not experience degradation or stress cracking, they can have problems with moisture content and clods. High concentrations of organic solvents, and severe volume changes and desiccation also cause concern a t specific sites. The rapid freezing and thawing of clay liner materials also affects their integrity, but freeze-thaw can usually be alleviated with proper design and construction considerations. For a more complete discussion of c lay l iner durability, see Chapter Two.
Leachate Collection and Removal Systems The leachate collection and removal system includes all materials involved in the pr imary leachate collection system and the leak detection collection system. For the proper functioning of these systems, a l l mater ia l s being used m u s t be chemical ly resistant to the leachates that they are handling. Of the natural soil materia1s;gravel and sand a r e generally quite resistant to leachates , with the possible exception of freshly ground limestone. With th i s mater ia l , a solution con ta in ing ca lc ium, magnesium, or other ion deposits can develop as the flow rate decreases in low gradient areas. A form of weak bonding called "limerock" has been known to occur. Its occurrence would be disastrous in terms of l eacha te collection and r e m o v a l . R e g a r d i n g geotextiles and geonets, there are no established test protocols for chemical resistivity evaluation like the EPA Method 9090 test for FMLs. Table 9-2 suggests some tests that should be considered.
Table 9-2. Suggested Test Methods for Assessing Chemical Resistance of Geosynthetics Used in Leachate Collection Systems (Y = yes; N = no)
Test Type Geotextile Geonet Geocomposite
Thickness Y Y Y
Mass/unit area Y Y Y
Grab tensile Y N N
Wide width tensile Y Y N
Puncture (pin) N N N
Puncture (CBR) Y Y Y
Trapezoidal tear Y N N
Burst Y N N
The system for collecting and removing the leachate must function continuously over the anticipated lifetime of the facility and i ts post-closure care period. During operat ion, leachate is removed regularly depending on the amount of liquid in the incoming waste and natural precipitation entering
118
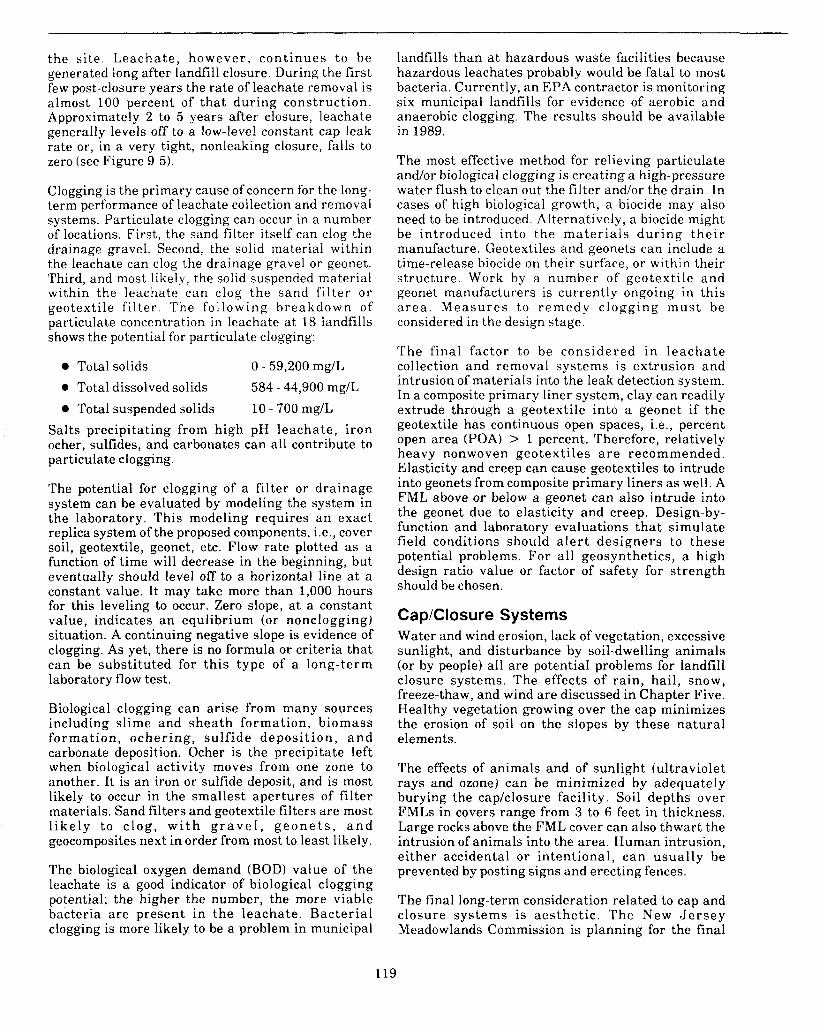
the si te. Leachate, however, cont inues to be generated long after landfill closure. During the first few post-closure years the rate of leachate removal is almost 100 percent of that during construction. Approximately 2 to 5 years after closure, leachate generally levels off to a low-level constant cap leak rate or, in a very tight, nonleaking closure, falls to zero (see Figure 9-51,
Clogging is the primary cause of concern for the long- term performance of leachate collection and removal systems. Particulate clogging can occur in a number of locations. First, the sand filter itself can clog the drainage gravel. Second, the solid material within the leachate can clog the drainage gravel or geonet. Third, and most likely, the solid suspended material within the leachate can clog the sand filter or geotextile f i l ter The following breakdown of particulate concentration in leachate a t 18 landfills shows the potential for particulate clogging:
Total solids 0 Total dissolved solids 584 - 44,900 mg/L
Total suspended solids
0 - 59,200 mg/L
10 - 700 mg/L Salts precipitating from high pH leachate, iron ocher, sulfides, and carbonates can all contribute to particulate clogging.
The potential for clogging of a filter or drainage system can be evaluated by modeling the system in the laboratory. This modeling requires a n exact replica system of the proposed components, i.e., cover soil, geotextile, geonet, etc. Flow rate plotted as a function of time will decrease in the beginning, but eventually should level off to a horizontal line a t a constant value. It may take more than 1,000 hours for this leveling to occur. Zero slope, a t a constant value, indicates a n equlibrium (or nonclogging) situation. A continuing negative slope is evidence of clogging. As yet, there is no formula or criteria that can be substituted for this type of a long-term laboratory flow test.
Biological clogging can arise from many sources including slime and sheath formation, biomass formation, ochering, sulfide deposi t ion, a n d carbonate deposition. Ocher is the precipitate left when biological activity moves from one zone to another. It is an iron or sulfide deposit, and is most likely to occur in the smallest apertures of filter materials. Sand filters and geotextile filters are most l i ke ly to c log, w i t h g r a v e l , g e o n e t s , a n d geocomposites next in order from most to least likely.
The biological oxygen demand (BOD) value of the leachate is a good indicator of biological clogging potential; the higher the number, the more viable bacteria are present in the leachate. Bacterial clogging is more likely to be a problem in municipal
landfills than a t hazardous waste facilities because hazardous leachates probably would be fatal to most bacteria. Currently, a n EPA contractor is monitoring six municipal landfills for evidence of aerobic and anaerobic clogging. The results should be available in 1989.
The most effective method for relieving particulate and/or biological clogging is creating a high-pressure water flush to clean out the filter and/or the drain. In cases of high biological growth, a biocide may also need to be introduced. Alternatively, a biocide might be introduced into the mater ia ls du r ing the i r manufacture. Geotextiles and geonets can include a time-release biocide on their surface, or within their structure. Work by a number of geotextile and geonet manufacturers is currently ongoing in this a r e a . Measures to remedy clogging mus t be considered in the design stage.
The final factor to be considered in l eacha te collection and removal systems is extrusion and intrusion of materials into the leak detection system. In a composite primary liner system, clay can readily extrude through a geotextile into a geonet if the geotextile has continuous open spaces, i.e., percent open area (POA) > 1 percent. Therefore, relatively heavy nonwoven geotextiles a r e recommended. Elasticity and creep can cause geotextiles to intrude into geonets from composite primary liners as well. A FML above or below a geonet can also intrude into the geonet due to elasticity and creep. Design-by- function and laboratory evaluations tha t simulate field conditions should a l e r t designers to these potential problems. For all geosynthetics, a high design ratio value or factor of safety for strength should be chosen.
Cap/Closure Systems Water and wind erosion, lack of vegetation, excessive sunlight, and disturbance by soil-dwelling animals (or by people) all are potential problems for landfill closure systems. The effects of rain, hail, snow, freeze-thaw, and wind are discussed in Chapter Five. Healthy vegetation growing over the cap minimizes the erosion of soil on the slopes by these natural elements.
The effects of animals and of sunlight (ultraviolet rays and ozone) can be minimized by adequately burying the caplclosure facility. Soil depths over FMLs in covers range from 3 to 6 feet in thickness. Large rocks above the FML cover can also thwart the intrusion of animals into the area. Human intrusion, either accidental or intentional, can usually be prevented by posting signs and erecting fences.
The final long-term consideration related to cap and closure systems is aesthetic. The New J e r s e y Meadowlands Commission is planning for the final
119
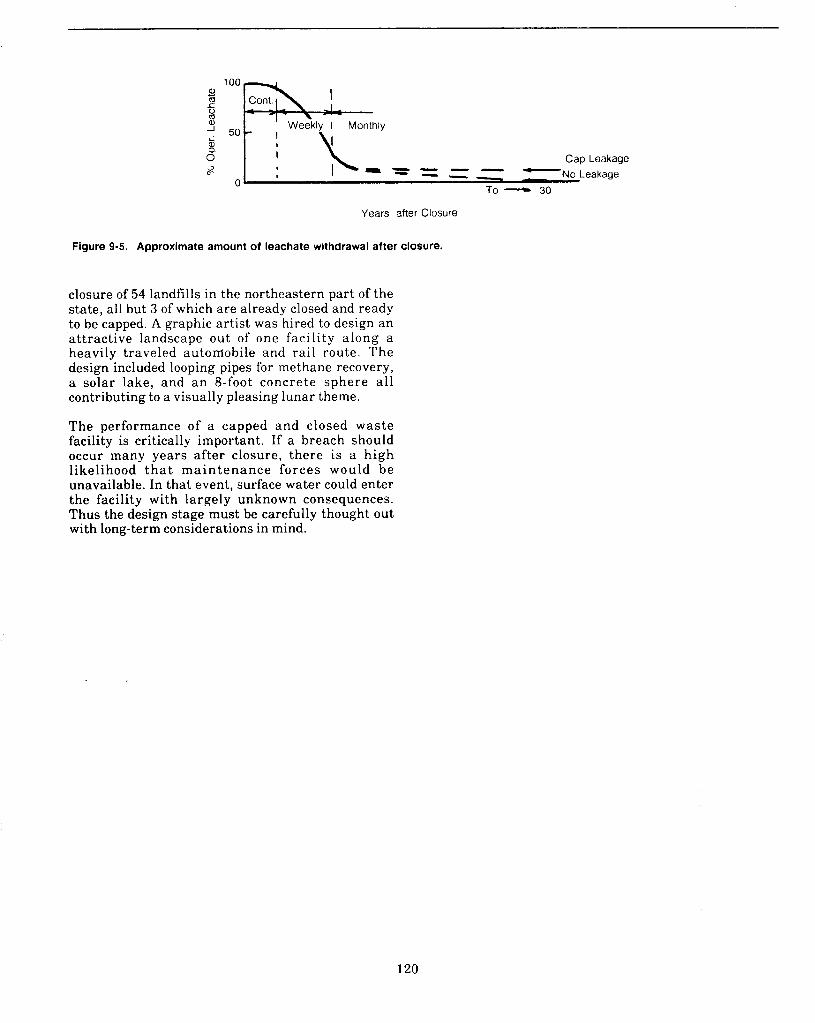
"'F, + a, Weekly I Monthly -I 50 a, i
0" s
Cap Leakage No Leakage
1
I - - - - e = = - - I
Years after Closure
Figure 9-5. Approximate amount of leachate withdrawal after Closure.
closure of 54 landfills in the northeastern part of the state, all but 3 of which are already closed and ready to be capped. A graphic artist was hired to design an attractive landscape out of one facility along a heavily traveled automobile and rail route. The design included looping pipes for methane recovery, a solar lake, and a n 8-foot concrete sphere all contributing to a visually pleasing lunar theme.
The performance of a capped and closed waste facility is critically important. If a breach should occur many years after closure, there is a high likelihood t h a t ma in tenance forces would be unavailable. In that event, surface water could enter the facility with largely unknown consequences. Thus the design stage must be carefully thought out with long-term considerations in mind.
120
IO. LEAK RESPONSE ACTION PLANS
This final chapter reviews proposed requirements for Response Action Plans, or RAPs, that are contained in the proposed leak detection rule issued in May, 1987. It focuses on the concepts behind the RAPs and the preliminary, technical calculations used in developing them. The main topics of discussion will be the technical basis for the two response action triggers, action leakage rate (ALR) and rapid and large leakage (RLL) rate; the RAPs themselves; and the RAP submittal process.
Background In the Hazardous and Solid Waste Amendments (HSWA) of 1984, Congress required that leaks from new land disposal facilities be detected a t the earliest practical time. However, HSWA did not require or specify actions to be taken once a leak is detected in the leak detection system. Therefore, EPA proposed requirements for response action plans to deal with leaks detected in the leak detection system between the two liners. EPA realizes that even with a good construction qua l i t y a s su rance p lan , f lexible membrane liners (FMLs) will allow some liquid transmission either through water vapor permeation of an intact FML, or through small pinholes or tears in a slightly flawed FML. Leakage rates resulting from these mechanisms can range from less than 1 to 300 gallons per acre per day (gal/acre/day). If unchecked, these leak rates may result in increased hydraulic heads acting on the bottom l iner and potential subsequent damage to the liner system.
The idea behind the RAP is to be prepared for any leaks or clogging of the drainage layer in the leak detection system that may occur during the active life or post-closure care period of a waste facility. The first step is to identify the top liner leak rates that would require response actions. Therefore, in the proposed leak detection rule of May 29, 1987, EPA established two triggers for response actions: the Action Leakage Rate (ALR) and the Rapid and Large Leakage (RLL) rate. The ALR is a low-level leak rate that would indicate the presence of a small hole or defect in the top liner. The RLL is indicative of a
severe breach or large tear in the top l iner . A different level of responsiveness would be required for leakage rates above these two triggers. RAPs developed by owners or operators may have more than two triggers as appropriate to cover the range of leak rates expected for a landfill unit. In addition to triggers, the proposed rule also defines the elemeqts of a RAP, gives an example of one, and discusses the procedures for submitting and reviewing a RAP.
Action Leakage Rate (ALR) EPA has historically used the term de minimus leakage when referring to leaks resul t ing from permeation of an intact FML. Action leakage rate (ALR) was developed to distinguish leak rates due to holes from mere permeation of an intact FML, and to initiate early interaction between the ownerloper- ator of the unit and the Agency. The ALR essentially defines top liner leakage in a landfil l , and the proposed value is based on calculated leak rates through a 1 to 2 mm hole in a FML subject to low hydraulic heads on the order of 1 inch. The proposed ALR, therefore, is representative of well-designed and operated landfills, although, a s proposed, i t would also apply to surface impoundments and waste piles.
Because EPA is considering setting a single ALR value applicable to landfills, surface impoundments, and waste piles, the Agency calculated top liner leak rates for different sizes of holes and for different hydraulic heads. In addition, EPA compared leak rates for a FML top liner with that for a composite top liner, since many new facilities have double composite liner systems. Table 10-1 shows the results of these calculations for FML and composite top liners. Even for FMLs with very small holes (Le., 1 to 2 mm in diameter), leak rates can be significant depending on the hydraulic head acting on the top l i n e r . T h e a d d i t i o n of t h e c o m p a c t e d low permeability soil layer to the FML significantly reduces these leak rates to less than 10 gal/acre/day, even for large hydraulic heads that are common in surface impoundments. These results indicate that,
121
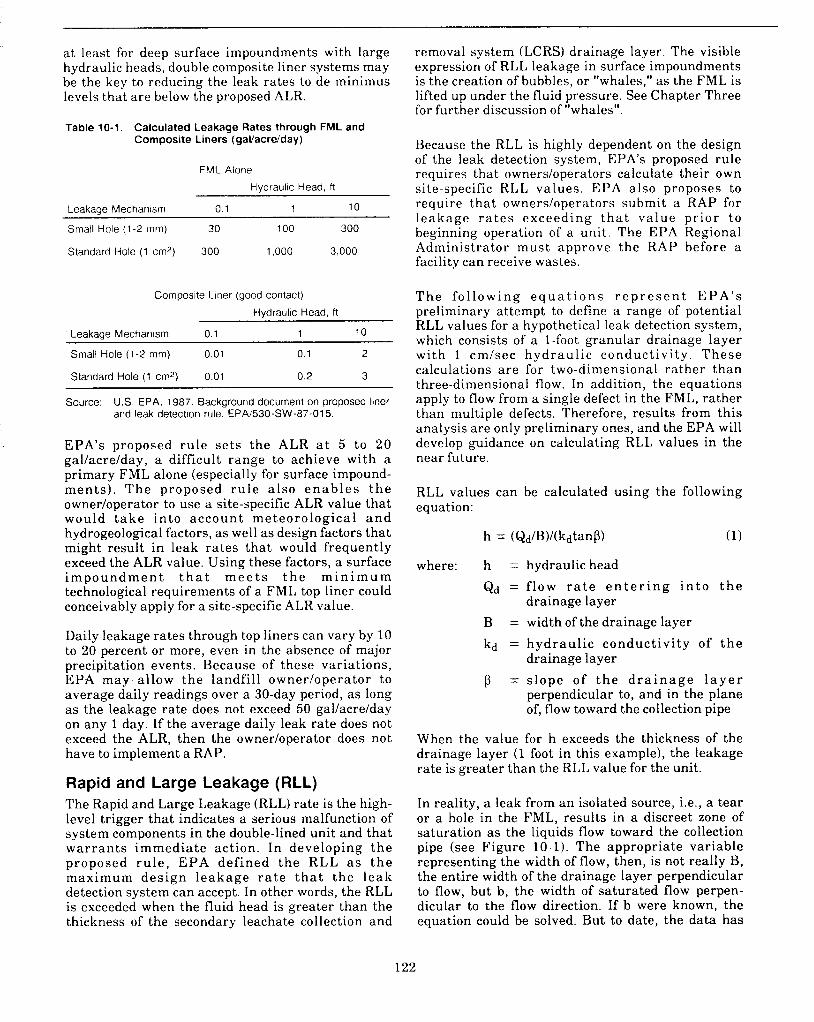
a t least for deep surface impoundments with large hydraulic heads, double composite liner systems may be the key to reducing the leak rates to de minimus levels that are below the proposed ALR.
Table 10-1. Calculated Leakage Rates through FML and Composite Liners (gavacrdday)
FML Alone
Hydraulic Head, R
Leakage Mechanism 0.1 1 10
Small Hole (1 -2 mm) 30 100 300
Standard Hole (1 cm2) 300 1,000 3,000
Composite Liner (good contact)
Hydraulic Head, R
Leakage Mechariism 0.1 1 10
Small Hole (1 -2 mm) 0.01 0.1 2
Standard Hole (1 cm2) 0.01 0.2 3
Source: U S . EPA. 1987. Background document on proposed liner and leak detection rule. EPA/530-SW-87-015.
EPA's proposed rule sets the ALR a t 5 to 20 gallacrelday, a difficult range to achieve with a primary FML alone (especially for surface impound- m e n t s ) . T h e proposed r u l e a lso e n a b l e s t h e ownerloperator to use a site-specific ALR value that would t a k e in to account meteorological a n d hydrogeological factors, as well as design factors that might result in leak rates that would frequently exceed the ALR value. Using these factors, a surface i m p o u n d m e n t t h a t m e e t s t h e m i n i m u m technological requirements of a FML top liner could conceivably apply for a site-specific ALR value.
Daily leakage rates through top liners can vary by 10 to 20 percent or more, even in the absence of major precipitation events. Because of these variations, EPA may allow t h e landfill ownerloperator to average daily readings over a 30-day period, as long as the leakage rate does not exceed 50 gallacrelday on any 1 day. If the average daily leak rate does not exceed the ALR, then the ownerloperator does not have to implement a RAP.
Rapid and Large Leakage (RLL) The Rapid and Large Leakage (RLL) rate is the high- level trigger that indicates a serious malfunction of system components in the double-lined unit and that warran ts immediate action. In developing t h e proposed r u l e , E P A defined t h e RLL as t h e maximum des ign l e a k a g e r a t e t h a t t h e leak detection system can accept. In other words, the RLL is exceeded when the fluid head is greater than the thickness of the secondary leachate collection and
removal system (LCRS) drainage layer. The visible expression of RLL leakage in surface impoundments is the creation of bubbles, or "whales," as the FML is lifted up under the fluid pressure. See Chapter Three for further discussion of "whales".
Because the RLL is highly dependent on the design of the leak detection system, EPA's proposed rule requires that ownersloperators calculate their own site-specific KLL values. EPA also proposes to require that ownersloperators submit a RAP for leakage r a t e s exceeding t h a t value p r io r t o beginning operation of a unit. The EPA Regional Administrator must approve the RAP before a facility can receive wastes.
T h e fo l lowing e q u a t i o n s r e p r e s e n t E P A ' s preliminary attempt to define a range of potential RLL values for a hypothetical leak detection system, which consists of a 1-foot granular drainage layer with 1 cmlsec hydraul ic conduct ivi ty . These calculations a re for two-dimensional rather than three-dimensional flow. In addition, the equations apply to flow from a single defect in the FML, rather than multiple defects. Therefore, results from this analysis are only preliminary ones, and the EPA will develop guidance on calculating RLL values in the near future.
RLL values can be calculated using the following equation:
h = (Qd/B)/(kdtanS) (1)
where: h =
Qd =
B = kd =
P =
When the value
hydraulic head flow ra te e n t e r i n g i n t o t h e drainage layer width of the drainage layer hydraul ic conduct ivi ty of t h e drainage layer s lope of t h e d r a i n a g e l a y e r perpendicular to, and in the plane of, flow toward the collection pipe
for h exceeds the thickness of the drainage layer (1 foot in this example), the leakage rate is greater than the RLL value for the unit.
In reality, a leak from an isolated source, Le., a tear or a hole in the FML, results in a discreet zone of saturation as the liquids flow toward the collection pipe (see Figure 10-1). The appropriate variable representing the width of flow, then, is not really B, the entire width of the drainage layer perpendicular to flow, but b, the width of saturated flow perpen- dicular to the flow direction. If b were known, the equation could be solved. But to date, the data has
122
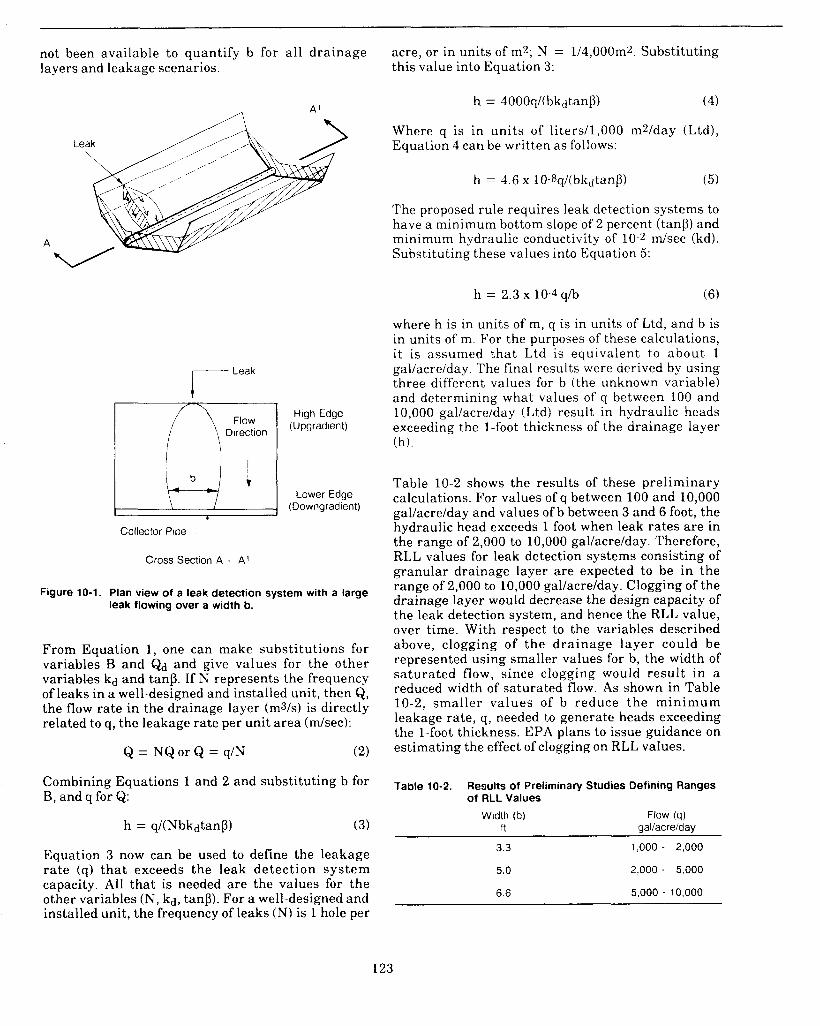
I s
not been available to quantify b for all drainage layers and leakage scenarios.
A ’
Leak
i Leak
High Edge (Upgradient)
Collector Pipe -1
Cross Section A . A1
Figure 10-1. Plan view of a leak detection system with a large leak flowing over a width b.
From Equation 1, one can make substitutions for variables B and Qd and give values for the other variables kd and tanp. If N represents the frequency of leaks in a well-designed and installed unit, then Q, the flow rate in the drainage layer (m31s) is directly related to q, the leakage rate per unit area ( d s e c ) :
Q = NQor Q = q/N (2)
Combining Equations 1 and 2 and substituting b for B, and q for Q:
h = ql(Nbkdtanp) (3)
Equation 3 now can be used to define the leakage rate (4) that exceeds the leak detection system capacity. All that is needed are the values €or the other variables (N, kd, tanp). For a well-designed and installed unit, the frequency of leaks (N) is 1 hole per
acre, or in units of m2; N = 114,000m2. Substituting this value into Equation 3:
h = 4000q/(bkdtanp) (4)
Where q is in units of litersl1,OOO mzlday (Ltd), Equation 4 can be written as follows:
The proposed rule requires leak detection systems to have a minimum bottom slope of 2 percent (tanp) and minimum hydraulic conductivity of 10-2 d s e c (kd). Substituting these values into Equation 5:
h = 2.3 x 10⁻⁴qh (6)
where h is in units of m, q is in units of Ltd, and b is in units of m. For the purposes of these calculations, i t is assumed that Ltd is equivalent to about 1 gallacrelday. The final results were derived by using three different values for b (the unknown variable) and determining what values of q between 100 and 10,000 gal/acre/day (Ltd) result in hydraulic heads exceeding the 1-foot thickness of the drainage layer (h).
Table 10-2 shows the results of these preliminary calculations. For values of q between 100 and 10,000 gallacrelday and values of b between 3 and 6 foot, the hydraulic head exceeds 1 foot when leak rates are in the range of 2,000 to 10,000 gallacrelday. Therefore, RLL values for leak detection systems consisting of granular drainage layer are expected to be in the range of 2,000 to 10,000 gallacrelday. Clogging of the drainage layer would decrease the design capacity of the leak detection system, and hence the RLL value, over time. With respect to the variables described above, clogging of the drainage layer could be represented using smaller values for b, the width of saturated flow, since clogging would result in a reduced width of saturated flow. As shown in Table 10-2, smaller values of b reduce the minimum leakage rate, q, needed to generate heads exceeding the 1-foot thickness. EPA plans to issue guidance on estimating the effect of clogging on RLL values.
Table 10-2. Results of Preliminary Studies Defining Ranges of RLL values
Width (b) Flow (q) f7 gallacrelday
3.3 1,000 - 2,000
5.0 2,000 - 5,000
6.6 5,000 - 10,000
123
Response Action Plans (RAPS) According to the proposed leak detection rule, the key elements of a RAP are:
0 General description of unit. 0 Description of waste constituents.
Description of all events that may cause leakage. 0 Discussion of factors affecting amounts of leakage
entering LCRS. 0 Design and operational mechanisms to prevent
leakage of hazardous constituents. Assessment of effectiveness of possible response actions.
In developing a RAP, ownersfoperators of landfills should gather information from Part B of the permit application, available operational records, leachate analysis results for existing facilities, and the construction q u a l i t y a s s u r a n c e r e p o r t . T h e construction qual i ty assurance r epor t is very important because it helps define where potential leaks are likely to occur in the unit.
Sources of Liquids Other than Leachate Depending on the unit design and location, other liquids besides leachate could accumulate in the leak detection system and result in apparent leak rates t h a t exceed t h e ALR v a l u e . F o r e x a m p l e , precipitation may pass through a tear in the FML that is located above the waste elevation (e.g. a tear in the FML a t a pipe penetration point). The liquids entering the leak detection system under this scenario may not have contacted any wastes and hence would not be considered to be hazardous leachate. In addition, rainwater can become trapped in the drainage layer during construction and installation of the leak detection system, but these construction waters are typically flushed through the system early on in the active life of the facility. In the case of a composite top liner, moisture from the compacted soil component may be squeezed out over time and also contribute to liquids collected in the leak detection sump. These sources of nonhazardous liquids can add significant quantities of liquids to a leak detection system and might result in a n ALR being exceeded. Therefore, these other sources of liquids should also be considered when developing a RAP, and steps to verify that certain liquids are not hazardous should be outlined in the plan.
Ground-water permeation is one other possible source of nonhazardous liquids in the leak detection system that can occur when the water table elevation is above the bottom of the unit. The ability of ground water to enter the leak detection sump, however, raises serious questions about the integrity of the bottom liner, which is the backup system in a double-
lined unit. If ground water is being collected in the leak detection system, then hazardous constituents could conceivably migrate out of the landfill and into the environment when the water table elevation drops below the bottom of the unit, e.g., in the case of dry weather conditions. As a result, while ground- water permeation is another source of liquids, it is not a source that would ordinarily be used by the ownerfoperator to justify ALR exceedances.
Preparing and Submitting the RAP Response action plans must be developed for two basic ranges: (1) leakage rates that exceed the RLL and (2) leakage rates that equal or exceed the ALR but are less than the RLL. In submitting a RAP, a facility ownerloperator has two choices. First, the ownerfoperator can submit a plan to EPA before the facility opens that describes all measures to be taken for every possible leakage scenario. The major drawback to this option is that the RAP may have to be modified as specific leak incidents occur, because there are several variables that affect the selection of suitable response actions. One variable is the time a t which the leak occurs. For example, if a leak is discovered a t the beginning of operation, the best response might be to locate and repair the leak, since there would be little waste in the unit and the tear or hole may be easy to fix. If, however, a leak is discovered 6 months before a facility is scheduled to close, it would probably make sense to close the unit immediately to minimize in f i l t r a t ion . I f the ownerfoperator chooses to develop and submit one RAP before the unit begins operation, he or she must develop suitable response actions for different leak rates and for different stages during the active life and post-closure care period of the unit.
The second choice a n ownerloperator has is to submit the RAP in two phases: one RAP for the first range, serious RLL leakage, that would be submitted before the start of operation; and another for the second range of leakage rates (exceeding the ALR but less than the RLL) that would be submitted after a leak has been detected.
EPA developed three generic types of response actions that the ownerloperator must consider when developing a RAP for leakage rates greater than or equal to the RLL. The three responses for very serious leakage are straightforward:
0 Stop receiving waste and close the unit, or close
0 Repair the leak or retrofit the top liner. 0 Institute operational changes
part of the unit.
These three response actions also would apply to leakage rates less than RLL, although, as moderate to serious responses, they would apply to leakage
124
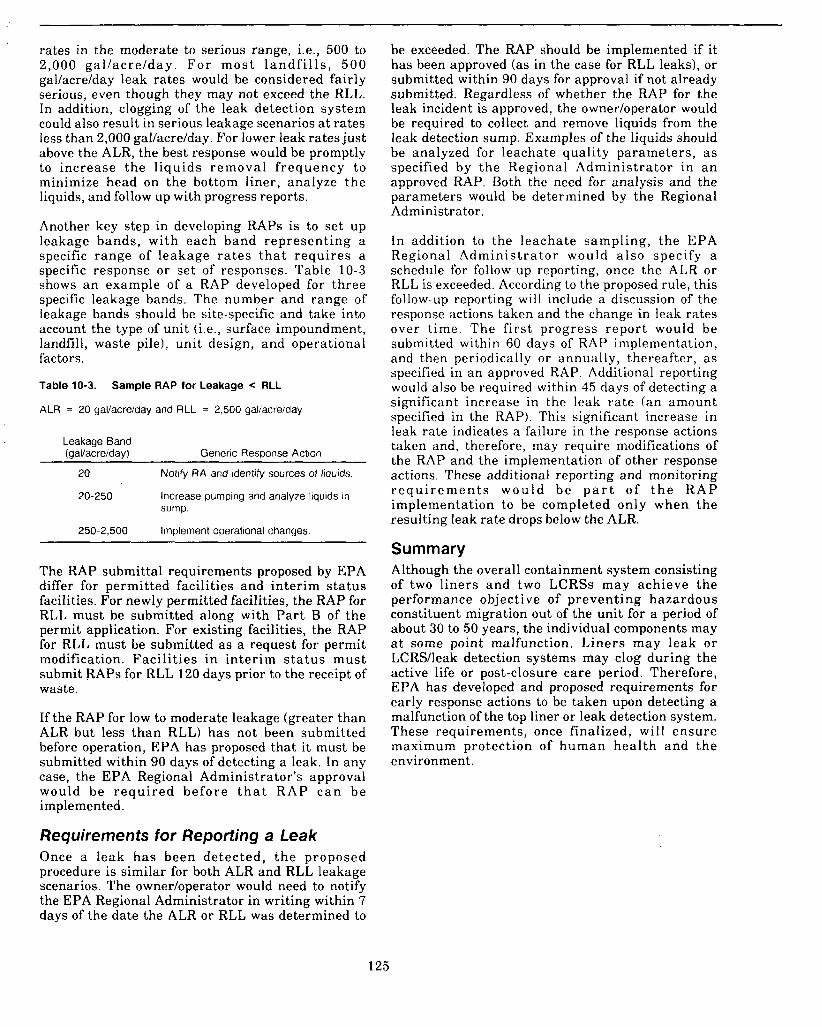
I
rates in the moderate to serious range, i.e., 500 to 2,000 gal lacrelday. F o r mos t l a n d f i l l s , 500 gallacrelday leak rates would be considered fairly serious, even though they may not exceed the RLL. In addition, clogging of the leak detection system could also result in serious leakage scenarios a t rates less than 2,000 gal/acre/day. For lower leak rates just above the ALR, the best response would be promptly to increase the l iquids removal f requency to minimize head on the bottom liner, analyze the liquids, and follow up with progress reports.
Another key step in developing RAPs is to set up leakage bands, with each band representing a specific range of leakage r a t e s t h a t requires a specific response or set of responses. Table 10-3 shows a n example of a RAP developed for three specific leakage bands. The number and range of leakage bands should be site-specific and take into account the type of unit (i.e., surface impoundment, landfill, waste pile), unit design, and operational factors.
Table 10-3.
ALR = 20 gal/acre/day and RLL = 2,500 gal/acre/day
Sample RAP for Leakage < RLL
Leakage Band (gallacreiday) Generic Response Action
20
20-250
Notify RA and identify sources of liquids
Increase pumping and analyze liquids in sump.
250-2,500 Implement operational changes.
The RAP submittal requirements proposed by EPA differ for permitted facilities and interim status facilities. For newly permitted facilities, the RAP for RLL must be submitted along with Part B of the permit application. For existing facilities, the RAP for RLL must be submitted as a request for permit modification. Facil i t ies in inter im s t a tus must submit RAPs for RLL 120 days prior to the receipt of waste.
If the RAP for low to moderate leakage (greater than ALR but less than RLL) has not been submitted before operation, EPA has proposed that it must be submitted within 90 days of detecting a leak. In any case, the EPA Regional Administrator’s approval would be r equ i r ed before t h a t RAP c a n be implemented.
Requirements for Reporting a Leak Once a leak has been detected, t h e proposed procedure is similar for both ALR and RLL leakage scenarios. The ownerloperator would need to notify the EPA Regional Administrator in writing within 7 days of the date the ALR or RLL was determined to
be exceeded. The RAP should be implemented if it has been approved (as in the case for RLL leaks), or submitted within 90 days for approval if not already submitted. Regardless of whether the RAP for the leak incident is approved, the ownerloperator would be required to collect and remove liquids from the leak detection sump. Examples of the liquids should be analyzed for leachate quality parameters, as specified by the Regional Administrator in a n approved RAP. Both the need for analysis and the parameters would be determined by the Regional Administrator.
In addition to the leachate sampling, the EPA Regional Adminis t ra tor would also specify a schedule for follow-up reporting, once the ALR or RLL is exceeded. According to the proposed rule, this follow-up reporting will include a discussion of the response actions taken and the change in leak rates over t ime. The first progress report would be submitted within 60 days of RAP implementation, and then periodically or annually, thereafter, as specified in an approved RAP. Additional reporting would also be required within 45 days of detecting a significant increase in the leak rate (an amount specified in the RAP). This significant increase in leak rate indicates a failure in the response actions taken and, therefore, may require modifications of the RAP and the implementation of other response actions. These additional reporting and monitoring r e q u i r e m e n t s wou ld be p a r t of t h e R A P implementation to be completed only when the resulting leak rate drops below the ALR.
Summary Although the overall containment system consisting of two liners and two LCRSs may achieve the performance objective of preventing hazardous constituent migration out of the unit for a period of about 30 to 50 years, the individual components may a t some point malfunction. Liners may leak or LCRSIleak detection systems may clog during the active life or post-closure care period. Therefore, EPA has developed and proposed requirements for early response actions to be taken upon detecting a malfunction of the top liner or leak detection system. These requirements, once finalized, will ensure maximum protection of human heal th and the environment.
125

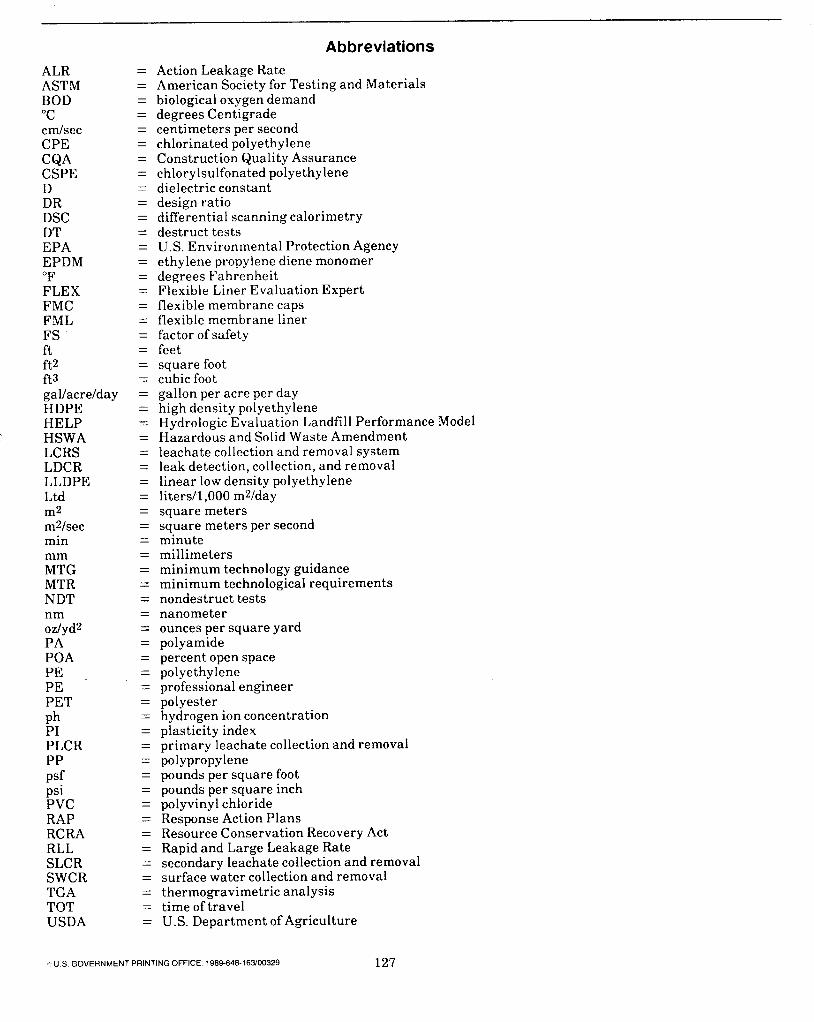
.
Abbreviations = Action Leakage Rate = American Society for Testing and Materials = biological oxygen demand = degrees Centigrade = centimeters per second = chlorinated polyethylene = Construction Quality Assurance = chlorylsulfonated polyethylene = dielectric constant = design ratio = differential scanning calorimetry = destruct tests = U.S. Environmental Protection Agency = ethylene propylene diene monomer = degrees Fahrenheit = Flexible Liner Evaluation Expert = flexible membrane caps = flexible membrane liner = factor of safety = feet = square foot = cubicfoot = gallon per acre per day = high density polyethylene = Hydrologic Evaluation Landfill Performance Model = Hazardous and Solid Waste Amendment = leachate collection and removal system = leak detection, collection, and removal = linear low density polyethylene = litersl1,OOO mzlday = square meters = square meters per second = minute = millimeters = minimum technology guidance = minimum technological requirements = nondestruct tests = nanometer = ounces per square yard = polyamide = percent open space = polyethylene = professional engineer = polyester = hydrogen ion concentration = plasticity index = primary leachate collection and removal = polypropylene = pounds per square foot = pounds per square inch = polyvinyl chloride = Response Action Plans = Resource Conservation Recovery Act = Rapid and Large Leakage Rate = secondary leachate collection and removal = surface water collection and removal = thermogravimetric analysis = time of travel = U.S. Department of Agriculture
ALR ASTM BOD "C cmlsec CPE CQA CSPE D DR DSC DT EPA EPDM "F FLEX FMC FML FS ft ft2 ft3 gallacrelda y HDPE HELP HSWA LCRS LDCR LLDPE Ltd m2 m2Isec min mm MTG MTR NDT nm ozlyd2 PA POA
PE PET
PI PLCR PP PSf psi PVC RAP RCRA RLL SLCR SWCR TGA TOT USDA
PE .
Ph
U S GOVERNMENT PRINTING OFFICE 1989-648-16300329 127