Embed Size (px)
Citation preview
RESEARCH AND DEVELOPMENT
DEPARTMENT
REPORT NO. 08-14
HANOVER PARK WATER RECLAMATION PLANT
FISCHER FARM MONITORING REPORT FOR
FOURTH QUARTER 2007
March 2008

........
........
........
........
........
........
........
........
........
........
........
........
........
........
........
........
........
........
........
........
........
........
........
........
........
........
........
........
........
........
........
........
........
........
........
........
........
........
........
........
........
........
........
........
........
........
........
........
........
........
........
........
........
........
........
........
........
........
........
........
........
........
........
........
........
........
........
........
........
........
........
........
........
........
........
........
........
........
........
........
........
........
........
........
........
........
........
........
........
........
........
........
........
........
........
........
........
........
........
........
........
........
........
........
........
........
........
........
........
........
........
........
........
........
........
........
........
........
........
........
........
........
........
........
........
........
........
........
........
........
........
........
........
........
........
........
........
........
........
........
........
........
........
........
........
........
........
........
........
........
........
........
........
........
........
........
........
........
........
........
........
........
........
........
........
........
........
........
........
........
........
........
........
........
........
........
........
........
........
........
........
........
........
........
........
........
........
........
........
........
........
........
........
........
........
........
........
........
...
........
........
........
........
........
........
........
........
........
........
........
........
........
........
........
........
........
........
........
........
........
........
........
........
........
........
........
........
........
........
........
........
........
........
........
........
........
........
........
........
........
........
........
........
........
........
........
........
........
........
........
........
........
........
........
........
........
........
........
........
........
........
........
........
........
........
........
........
........
........
........
........
........
........
........
........
........
........
........
........
........
........
........
........
........
........
........
........
........
........
........
........
........
........
........
........
........
........
........
........
........
........
........
........
........
........
........
........
........
........
........
........
........
........
........
........
........
........
........
........
........
........
........
........
........
........
........
........
........
........
........
........
........
........
........
........
........
........
........
........
........
........
........
........
........
........
........
........
........
........
........
........
........
........
........
........
........
........
........
........
........
........
........
........
........
........
........
........
........
........
........
........
........
........
........
........
........
........
........
........
........
........
........
........
........
........
........
........
........
........
........
........
........
........
........
........
........
........
...
....................................................................................................................................................................................................................................................................................................................................................................................................................................................................................................................................................................................................................................................................................................................................................................................................................................................................................................................................................................................................................................................................................................................................................................................................................................
.................................................................................... ..............................................................................Metropolitan Water Reclamation District of Greater Chicago
100 East Erie Street Chicago, Illinois 60611-2803 312-751-5600
HANOVER PARK WATER RECLAMATION PLANT
FISCHER FARM MONITORING REPORT
FOURTH QUARTER 2007
Research and Development
P. Lindo
A. Cox March 2008
Research and Development
P. Lindo
A. Cox March 2008
March 5, 2008 Mr. S. Alan Keller, P.E. Manager, Permit Section Illinois Environmental Protection Agency 1021 North Grand Avenue East P.O. Box 19276 Springfield, IL 62794 – 9276 Dear Mr. Keller:
Subject: Hanover Park WRP – IEPA Permit No. 2007-SC-2951, Monitoring Report for October, November, and December 2007
The attached report includes ten tables of the monitoring results for the Hanover Park
Water Reclamation Plant Fischer Farm site for the fourth quarter of 2007. Very truly yours, Louis Kollias Director Research and Development
LK:PL:spy Enclosure cc w/enc: Jay Patel, Manager, IEPA Region II – Des Plaines Mr. Valdis Aistars, USEPA Region V Mr. Ash Sajjad, USEPA Region V Stuba/Khalil Granato/O’Connor/Cox Lindo/Patel, M. cc w/o enc: Sharma/Garelli/Lazicki Library

TABLE OF CONTENTS
Page
FOREWORD ii
LIST OF TABLES iii
LIST OF FIGURE iv
ACKNOWLEDGMENT v
DISCLAIMER v
HANOVER PARK WATER RECLAMATION PLANT FISCHER FARM REPORT FOR
FOURTH QUARTER OF 2007
1

FOREWORD
The data and information in this report fulfill the frequency of monitoring and the report-
ing requirements for the Hanover Park Fischer Farm Site as specified in the Illinois Environmental
Protection Agency Permit No. 2007-SC-2951 for the fourth quarter of 2007.

LIST OF TABLES
Table Page
xxxNo.xx
x1x Analysis of Water from the Six Monitoring Wells at the Hanover Park
Fischer Farm Site Sampled on October 9, 2007
xx3
x2x Analysis of Water from the Six Monitoring Wells at the Hanover Park
Fischer Farm Site Sampled on October 23, 2007
xx4
x3x Analysis of Water from the Six Monitoring Wells at the Hanover Park
Fischer Farm Site Sampled on November 6, 2007
xx5
x4x Analysis of Water from the Six Monitoring Wells at the Hanover Park
Fischer Farm Site Sampled on November 20, 2007
xx6
x5x Analysis of Water from the Six Monitoring Wells at the Hanover Park
Fischer Farm Site Sampled on December 4, 2007
xx7
x6x Analysis of Water from the Six Monitoring Wells at the Hanover Park
Fischer Farm Site Sampled on December 18, 2007
xx8
x7xx Analysis of Combined Surface and Subsurface Drainage from the Fischer
Farm Site Returned to the Hanover Park Water Reclamation Plant During
October, November, and December 2007
xx9
x8x Analysis of Lagoon Supernatant Applied to Fields at the Hanover Park
Fischer Farm Site During October and November 2007
x10
x9x Analysis of Lagoon Biosolids Applied to Fields at the Hanover Park Fischer
Farm Site During November and December 2007
x11
10xx Volumes and Dry Weights of Lagoon Supernatant and Biosolids Applied to
Fields at the Hanover Park Fischer Farm Site During October, November,
and December 2007
x12

LIST OF FIGURES
Figure Page
xxxNo.xx
1111 Fields and Wells at the Hanover Park Fischer Farm Site of the Metropolitan
Water Reclamation District of Greater Chicago
2

ACKNOWLEDGMENT
The assistance given by Ms. Minaxi Patel, Sanitary Chemist I, of the Environmental
Monitoring and Research Division, and Mr. John Chavich, Sanitary Chemist IV, of the John E.
Egan Analytical Laboratory Section, is greatly appreciated.
DISCLAIMER
Mention of proprietary equipment and chemicals in this report does not constitute en-
dorsement by the Metropolitan Water Reclamation District of Greater Chicago.

HANOVER PARK WATER RECLAMATION PLANT FISCHER FARM REPORT FOR
FOURTH QUARTER OF 2007
During October, November, and December 2007, activities at the Hanover Park Water
Reclamation Plant (WRP) Fischer Farm included well and field drainage water sampling, and flow
measurements. These monitoring activities are required by the Illinois Environmental Protection
Agency Operating Permit No. 2007-SC-2951. Fields and water monitoring locations are presented
in Figure 1.
Water from each of the six monitoring wells was sampled twice monthly in October,
November, and December. Analytical data for samples collected during the quarter are presented
in Tables 1 through 6.
Drainage water (combined surface and subsurface) returned to the Hanover Park WRP
from the farm fields was sampled twice per month in October, November, and December. Ana-
lytical data for these samples are presented in Table 7. The volumes of drainage water returned
to the WRP during the fourth quarter were estimated as 2.62, 2.19, and 6.02 million gallons
(MG) in October, November, and December, respectively.
During the quarter, a total of 9.12 MG lagoon supernatant and biosolids containing 1,085
dry tons of solids was applied to Fields 1, 2, 3, 5, and 6 at the Fischer Farm site. The analytical
data for the lagoon supernatant and biosolids are presented in Table 8 and Table 9, respectively.
The volumes and dry weights applied are reported in Table 10.
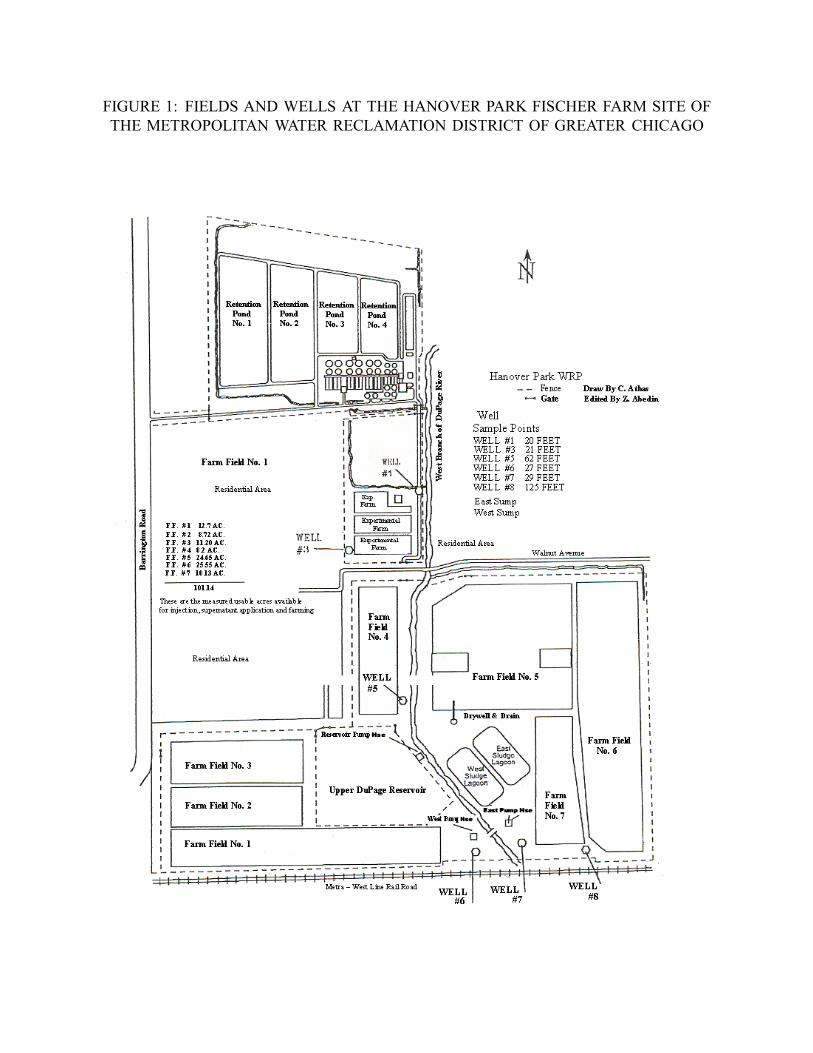
FIGURE 1: FIELDS AND WELLS AT THE HANOVER PARK FISCHER FARM SITE OF
THE METROPOLITAN WATER RECLAMATION DISTRICT OF GREATER CHICAGO

TABLE 1: ANALYSIS OF WATER FROM THE SIX MONITORING WELLS AT
THE HANOVER PARK FISCHER FARM SITE
SAMPLED ON OCTOBER 9, 2007
Well
Parameter Unit 1 3 5 6 7 8
pH1 xxxxx7.0xxxxxxxx7.0xxxxxxxx7.5xxxxxxxx7.4xxxxxxxx7.1xxxxxxxx8.0xxx
EC mS/mxxx202xxxxxxxx107xxxxxxxxx74xxxxxxxxx95xxxxxxxx120xxxxxxxxx64xxxxx
Cl− mg/L xxx539xxxxxxxxx23xxxxxxxxx13xxxxxxxxx41xxxxxxxxx43xxxxxxxxxx7.0xxx
SO4= x ,, xxxxx8.0xxxxxx287xxxxxxxxx98xxxxxxxx169xxxxxxxx241xxxxxxxxx63xxxxx
Alkalinity2 x ,, xxx255xxxxxxxx371xxxxxxxx320xxxxxxxx324xxxxxxxx442xxxxxxxx298xxxxx
TKN x ,, xxxxx5.9xxxxxxxx6.2xxxxxxxx0.30xxxxxxx0.40xxxxxxx9.3xxxxxxxx0.24xx
NH3-Nx ,, xxxxx4.2xxxxxxxx0.46xxxxxxx0.29xxxxxxx0.26xxxxxxx9.3xxxxxxxx0.35xx
NO2 + NO3-Nx ,, xxxxx0.31xxxxxxx0.20xxxxx<0.02xxxxxxx0.02xxxxx<0.02xxxxx<0.02xx
Total P x ,, xxxxx0.49xxxxxxx1.9xxxxxx<0.02xxxxxxx0.07xxxxxxx0.02xxxxxxx0.11xx
Cd x ,, xxxxx0.0018xxxxx0.0034xxx<0.0003xxx<0.0003xxxxx0.0003xxx<0.0003Cr x ,, xxx<0.002xxxxxx0.004xxxx<0.002xxxx<0.002xxxx<0.002xxxx<0.002xCu x ,, xxxxx0.0025xxx<0.0005xxxxx0.0111xxxxx0.0048xxx<0.0005xxxxx0.0046Fe x ,, xxxx33.7xxxxxx104xxxxxxxxxx1.76xxxxxxx3.12xxxxxxx4.97xxxxxxx1.52xx
Mn x ,, xxxxx0.7827xxxxx0.4333xxxxx0.0183xxxxx0.0394xxxxx0.0632xxxxx0.0412
Ni x ,, xxxxx0.0049xxxxx0.0558xxxxx0.0019xxxxx0.0050xxxxx0.0034xxxxx0.0015
Zn x ,, xxxxx0.1197xxxxx0.3553xxxxx0.0417xxxxx0.0040xxxxx0.0374xxxxx0.0029
Fecal Coliform MPN xxxxx8xxxxxxxx<1xxxxxxxx<1xxxxxxxx<1xxxxxxxx<1xxxxxxxx<1xxxxx
1Samples analyzed beyond recommended holding time of 15 minutes.2As CaCO3.1MPN = Most probable number/100 mL.

TABLE 2: ANALYSIS OF WATER FROM THE SIX MONITORING WELLS AT
THE HANOVER PARK FISCHER FARM SITE
SAMPLED ON OCTOBER 23, 2007
Well
Parameter Unit 1 3 5 6 7 8
pH1 xxxxx7.0xxxxxxxx7.0xxxxxxxx7.5xxxxxxxx7.4xxxxxxxx7.1xxxxxxxx7.9xxx
EC mS/mxxx210xxxxxxxx102xxxxxxxxx72xxxxxxxxx90xxxxxxxx123xxxxxxxxx65xxxxx
Cl− mg/L xxx543xxxxxxxxx22xxxxxxxxx13xxxxxxxxx31xxxxxxxxx44xxxxxxxxxx7.0xxx
SO4= x ,, xxxx11xxxxxxxx288xxxxxxxx103xxxxxxxx151xxxxxxxx234xxxxxxxxx71xxxxx
Alkalinity2 x ,, xxx271xxxxxxxx367xxxxxxxx317xxxxxxxx325xxxxxxxx426xxxxxxxx289xxxxx
TKN x ,, xxxxx7.0xxxxxxxx4.3xxxxxxxx0.29xxxxxxx0.28xxxxxxx9.6xxxxxxxx0.21xx
NH3-Nx ,, xxxxx4.7xxxxxxxx0.30xxxxxxx0.29xxxxxxx0.23xxxxxxx9.5xxxxxxxx0.39xx
NO2 + NO3-Nx ,, xxxxx0.28xxxxxxx0.14xxxxxxx0.02xxxxx<0.02xxxxx<0.02xxxxx<0.02xx
Total P x ,, xxxxx0.73xxxxxxx1.6xxxxxxxx0.11xxxxxxx0.15xxxxxxx0.13xxxxxxx0.12xx
Cd x ,, xxxxx0.0023xxxxx0.0048xxx<0.0003xxxxx0.0003xxxxx0.0004xxx<0.0003Cr x ,, xxx<0.002xxxxxx0.004xxxx<0.002xxxx<0.002xxxx<0.002xxxx<0.002xCu x ,, xxxxx0.0094xxx<0.0005xxxxx0.0193xxxxx0.0041xxxxx0.0005xxxxx0.0021Fe x ,, xxxx37.9xxxxxx103xxxxxxxxxx1.38xxxxxxx2.79xxxxxxx4.45xxxxxxx1.23xx
Mn x ,, xxxxx0.8693xxxxx0.4768xxxxx0.0141xxxxx0.0320xxxxx0.0581xxxxx0.0369
Ni x ,, xxxxx0.0055xxxxx0.0146xxxxx0.0013xxxxx0.0066xxxxx0.0022xxx<0.0007Zn x ,, xxxxx0.1888xxxxx0.4274xxxxx0.0057xxxxx0.0048xxxxx0.0308xxxxx0.0026
Fecal Coliform MPN xxx<1xxxxxxxx<1xxxxxxxx<1xxxxxxxx<1xxxxxxxx<1xxxxxxxx<1xxxxx
1Samples analyzed beyond recommended holding time of 15 minutes.2As CaCO3.1MPN = Most probable number/100 mL.

TABLE 3: ANALYSIS OF WATER FROM THE SIX MONITORING WELLS AT
THE HANOVER PARK FISCHER FARM SITE
SAMPLED ON NOVEMBER 6, 2007
Well
Parameter Unit 1 3 5 6 7 8
pH1 xxxxx7.4xxxxxxxx|xxxx xxxxx7.6xxxxxxxx7.4xxxxxxxx7.2xxxxxxxx8.0xxxEC mS/mxxx218xxxxxxxxxx|xxxx xxxx75xxxxxxxxx95xxxxxxxx115xxxxxxxxx64xxxxxCl− mg/L xxx581xxxxxxxxxx|xxxx xxxx14xxxxxxxxx47xxxxxxxxx45xxxxxxxxxx7.0xxxSO4
= x ,, xxxx12xxxxxxxxxx|xxxx xxxx94xxxxxxxx172xxxxxxxx245xxxxxxxxx67xxxxxAlkalinity2 x ,, xxx273xxxxxxxxxx|xxxx xxx320xxxxxxxx319xxxxxxxx424xxxxxxxx294xxxxx
xxx xxxx
TKN x ,, xxxxx8.2xxxxxx Wxxxx xxxxx0.21xxxxxxx0.33xxxxxxx8.9xxxxxxxx0.42xx
NH3-Nx ,, xxxxx4.3xxxxxx Exxxx xxxxx0.34xxxxxxx0.30xxxxxxx8.7xxxxxxxx0.38xx
NO2 + NO3-Nx ,, xxxxx0.59xxxxx Lxxxx xxxxx0.02xxxxxxx0.02xxxxxxx0.02xxxxxxx0.02xx
Total P x ,, xxxxx1.0xxxxxx Lxxxx xxxxx0.02xxxxxxx0.07xxxxxxx0.02xxxxxxx0.09xx
xxx xxxx
Cd x ,, xxxxx0.0021xxx Dxxxx xxx<0.0003xxx<0.0003xxx<0.0003xxx<0.0003Cr x ,, xxxxx0.003xxxx Rxxxx xxx<0.002xxxx<0.002xxxx<0.002xxxx<0.002xCu x ,, xxxxx0.0060xxx Yxxxx xxxxx0.0184xxxxx0.0009xxx<0.0005xxxxx0.0011Fe x ,, xxxx78.6xxxxxx xxxx xxxxx3.18xxxxxxx3.31xxxxxxx4.61xxxxxxx1.34xx
Mn x ,, xxxxx1.275xxxxxx|xxxx xxxxx0.0229xxxxx0.0425xxxxx0.0638xxxxx0.0415Ni x ,, xxxxx0.0098xxxxx|xxxx xxxxx0.0010xxxxx0.0013xxxxx0.0013xxx<0.0007Zn x ,, xxxxx0.3641xxxxx|xxxx xxxxx0.0092xxxxx0.0024xxxxx0.0393xxxxx0.0016
xxxxx|xxxxFecal Coliform MPN xxx<1xxxxxxxxxx|xxxx xxx<1xxxxxxxx<1xxxxxxxx<1xxxxxxxx<1xxxxx
1Samples analyzed beyond recommended holding time of 15 minutes.2As CaCO3.1MPN = Most probable number/100 mL.
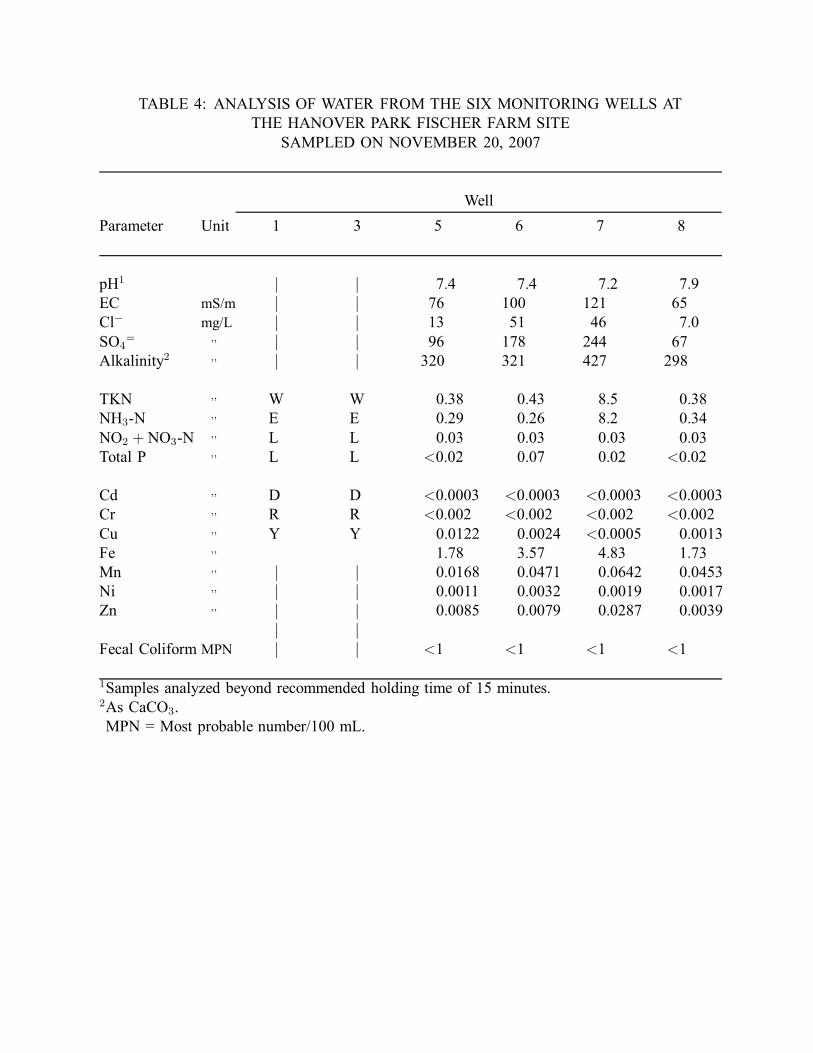
TABLE 4: ANALYSIS OF WATER FROM THE SIX MONITORING WELLS AT
THE HANOVER PARK FISCHER FARM SITE
SAMPLED ON NOVEMBER 20, 2007
Well
Parameter Unit 1 3 5 6 7 8
pH1 xxxxx|xxxx xxxxx|xxxx xxxxx7.4xxxxxxxx7.4xxxxxxxx7.2xxxxxxxx7.9xxxEC mS/mxxxxx|xxxx xxxxx|xxxx xxxx76xxxxxxxx100xxxxxxxx121xxxxxxxxx65xxxxxCl− mg/L xxxxx|xxxx xxxxx|xxxx xxxx13xxxxxxxxx51xxxxxxxxx46xxxxxxxxxx7.0xxxSO4
= x ,, xxxxx|xxxx xxxxx|xxxx xxxx96xxxxxxxx178xxxxxxxx244xxxxxxxxx67xxxxxAlkalinity2 x ,, xxxxx|xxxx xxxxx|xxxx xxx320xxxxxxxx321xxxxxxxx427xxxxxxxx298xxxxx
xxx xxxx xxx xxxx
TKN x ,, xxx Wxxxxxxx Wxxxx xxxxx0.38xxxxxxx0.43xxxxxxx8.5xxxxxxxx0.38xx
NH3-Nx ,, xxx Exxxx xxx Exxxx xxxxx0.29xxxxxxx0.26xxxxxxx8.2xxxxxxxx0.34xx
NO2 + NO3-Nx ,, xxx Lxxxx xxx Lxxxx xxxxx0.03xxxxxxx0.03xxxxxxx0.03xxxxxxx0.03xx
Total P x ,, xxx Lxxxx xxx Lxxxx xxx<0.02xxxxxxx0.07xxxxxxx0.02xxxxx<0.02xxxxx xxxx xxx xxxx
Cd x ,, xxx Dxxxx xxx Dxxxx xxx<0.0003xxx<0.0003xxx<0.0003xxx<0.0003Cr x ,, xxx Rxxxx xxx Rxxxx xxx<0.002xxxx<0.002xxxx<0.002xxxx<0.002xCu x ,, xxx Yxxxx xxx Yxxxx xxxxx0.0122xxxxx0.0024xxx<0.0005xxxxx0.0013Fe x ,, xxx xxxx xxx xxxx xxxxx1.78xxxxxxx3.57xxxxxxx4.83xxxxxxx1.73xx
Mn x ,, xxxxx|xxxx xxxxx|xxxx xxxxx0.0168xxxxx0.0471xxxxx0.0642xxxxx0.0453Ni x ,, xxxxx|xxxx xxxxx|xxxx xxxxx0.0011xxxxx0.0032xxxxx0.0019xxxxx0.0017Zn x ,, xxxxx|xxxx xxxxx|xxxx xxxxx0.0085xxxxx0.0079xxxxx0.0287xxxxx0.0039
xxxxx|xxxx xxxxx|xxxxFecal Coliform MPN xxxxx|xxxx xxxxx|xxxx xxx<1xxxxxxxx<1xxxxxxxx<1xxxxxxxx<1xxxxx
1Samples analyzed beyond recommended holding time of 15 minutes.2As CaCO3.1MPN = Most probable number/100 mL.
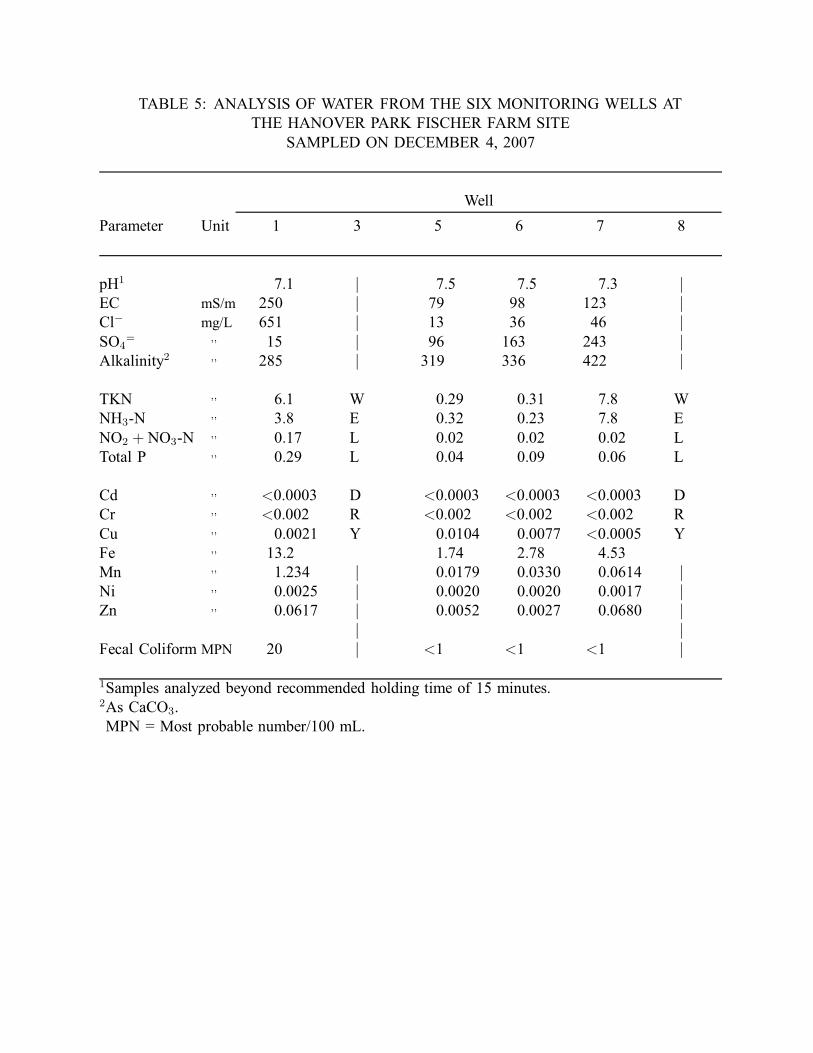
TABLE 5: ANALYSIS OF WATER FROM THE SIX MONITORING WELLS AT
THE HANOVER PARK FISCHER FARM SITE
SAMPLED ON DECEMBER 4, 2007
Well
Parameter Unit 1 3 5 6 7 8
pH1 xxxxx7.1xxxxxxxx|xxxx xxxxx7.5xxxxxxxx7.5xxxxxxxx7.3xxxxxxxx|xxxxEC mS/mxxx250xxxxxxxxxx|xxxx xxxx79xxxxxxxxx98xxxxxxxx123xxxxxxxxxx|xxxxCl− mg/L xxx651xxxxxxxxxx|xxxx xxxx13xxxxxxxxx36xxxxxxxxx46xxxxxxxxxx|xxxxSO4
= x ,, xxxx15xxxxxxxxxx|xxxx xxxx96xxxxxxxx163xxxxxxxx243xxxxxxxxxx|xxxxAlkalinity2 x ,, xxx285xxxxxxxxxx|xxxx xxx319xxxxxxxx336xxxxxxxx422xxxxxxxxxx|xxxx
xxx xxxx xxx xxxx
TKN x ,, xxxxx6.1xxxxxx Wxxxx xxxxx0.29xxxxxxx0.31xxxxxxx7.8xxxxxx Wxxxx
NH3-Nx ,, xxxxx3.8xxxxxx Exxxx xxxxx0.32xxxxxxx0.23xxxxxxx7.8xxxxxx Exxxx
NO2 + NO3-Nx ,, xxxxx0.17xxxxx Lxxxx xxxxx0.02xxxxxxx0.02xxxxxxx0.02xxxxx Lxxxx
Total P x ,, xxxxx0.29xxxxx Lxxxx xxxxx0.04xxxxxxx0.09xxxxxxx0.06xxxxx Lxxxx
xxx xxxx xxx xxxx
Cd x ,, xxx<0.0003xxx Dxxxx xxx<0.0003xxx<0.0003xxx<0.0003xxx DxxxxCr x ,, xxx<0.002xxxx Rxxxx xxx<0.002xxxx<0.002xxxx<0.002xxxx RxxxxCu x ,, xxxxx0.0021xxx Yxxxx xxxxx0.0104xxxxx0.0077xxx<0.0005xxx YxxxxFe x ,, xxxx13.2xxxxxx xxxx xxxxx1.74xxxxxxx2.78xxxxxxx4.53xxxxx xxxx
Mn x ,, xxxxx1.234xxxxxx|xxxx xxxxx0.0179xxxxx0.0330xxxxx0.0614xxxxx|xxxxNi x ,, xxxxx0.0025xxxxx|xxxx xxxxx0.0020xxxxx0.0020xxxxx0.0017xxxxx|xxxxZn x ,, xxxxx0.0617xxxxx|xxxx xxxxx0.0052xxxxx0.0027xxxxx0.0680xxxxx|xxxx
xxxxx|xxxx xxxxx|xxxxFecal Coliform MPN xxxx20xxxxxxxxxx|xxxx xxx<1xxxxxxxx<1xxxxxxxx<1xxxxxxxxxx|xxxx
1Samples analyzed beyond recommended holding time of 15 minutes.2As CaCO3.1MPN = Most probable number/100 mL.

TABLE 6: ANALYSIS OF WATER FROM THE SIX MONITORING WELLS AT
THE HANOVER PARK FISCHER FARM SITE
SAMPLED ON DECEMBER 18, 2007
Well
Parameter Unit 1 3 5 6 7 8
pH1 xxxxx7.4xxxxxxxx7.5xxxxxxxx7.7xxxxxxxx7.5xxxxxxxx|xxxx xxxxx|xxxxEC mS/mxxx269xxxxxxxx128xxxxxxxxx78xxxxxxxx104xxxxxxxxxx|xxxx xxxxx|xxxxCl− mg/L xxx740xxxxxxxxx19xxxxxxxxx13xxxxxxxxx53xxxxxxxxxx|xxxx xxxxx|xxxxSO4
= x ,, xxxxx9.0xxxxxx408xxxxxxxx101xxxxxxxx175xxxxxxxxxx|xxxx xxxxx|xxxxAlkalinity2 x ,, xxx251xxxxxxxx321xxxxxxxx319xxxxxxxx321xxxxxxxxxx|xxxx xxxxx|xxxx
xxx xxxx xxx xxxx
TKN x ,, xxxxx5.5xxxxxxxx1.3xxxxxxxx0.24xxxxxxx0.33xxxxx Wxxxx xxx Wxxxx
NH3-Nx ,, xxxxx4.0xxxxxxxx0.13xxxxxxx0.31xxxxxxx0.29xxxxx Exxxx xxx Exxxx
NO2 + NO3-Nx ,, xxxxx0.13xxxxxxx0.15xxxxxxx0.03xxxxx<0.02xxxxx Lxxxx xxx Lxxxx
Total P x ,, xxxxx0.14xxxxxxx0.15xxxxxxx0.02xxxxxxx0.09xxxxx Lxxxx xxx Lxxxx
xxx xxxx xxx xxxx
Cd x ,, xxxxx0.0066xxxxx0.0026xxx<0.0003xxx<0.0003xxx Dxxxx xxx DxxxxCr x ,, xxx<0.002xxxxxx0.004xxxx<0.002xxxx<0.002xxxx Rxxxx xxx RxxxxCu x ,, xxx<0.0005xxx<0.0005xxxxx0.0130xxxxx0.0026xxx Yxxxx xxx YxxxxFe x ,, xxxx90.0xxxxxxx73.2xxxxxxxx3.09xxxxxxx3.80xxxxx xxxx xxx xxxx
Mn x ,, xxxxx2.738xxxxxx0.3282xxxxx0.0228xxxxx0.0537xxxxx|xxxx xxxxx|xxxxNi x ,, xxxxx0.0071xxxxx0.0111xxxxx0.0012xxxxx0.0047xxxxx|xxxx xxxxx|xxxxZn x ,, xxxxx0.3326xxxxx0.3497xxxxx0.0095xxxxx0.0043xxxxx|xxxx xxxxx|xxxx
xxxxx|xxxx xxxxx|xxxxFecal Coliform MPN xxxx21xxxxxxxx<1xxxxxxxx<1xxxxxxxx<1xxxxxxxxxx|xxxx xxxxx|xxxx
1Samples analyzed beyond recommended holding time of 15 minutes.2As CaCO3.1MPN = Most probable number/100 mL.
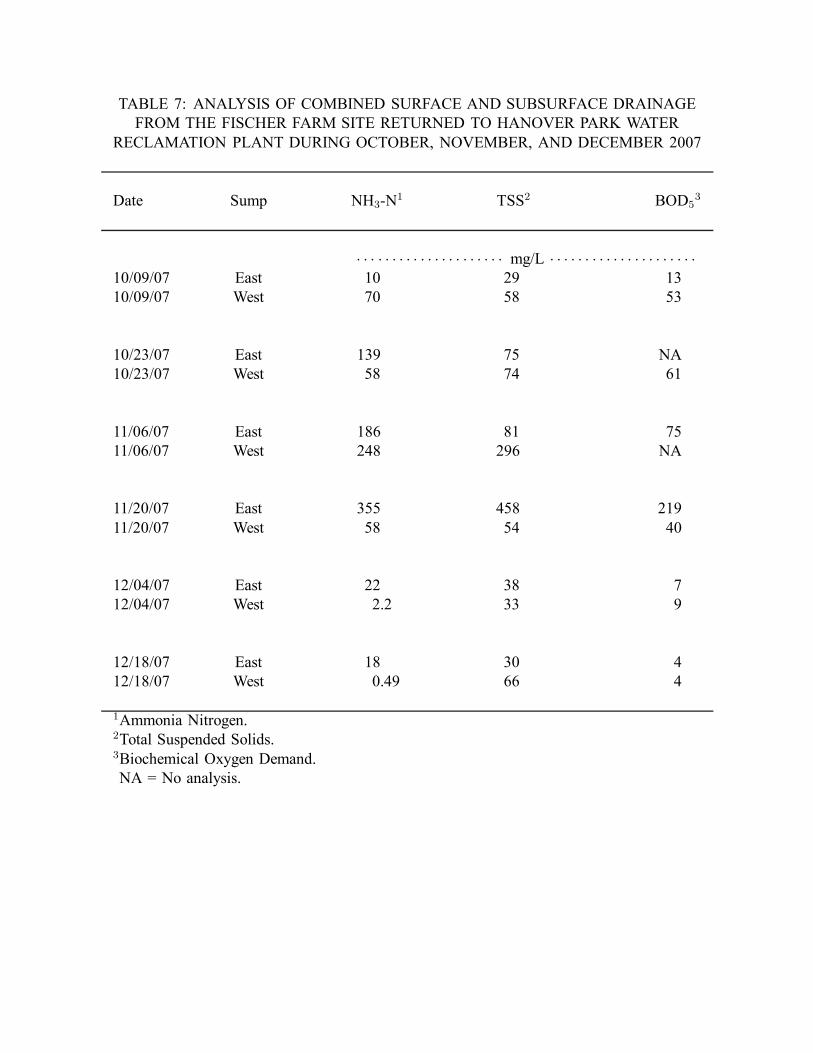
TABLE 7: ANALYSIS OF COMBINED SURFACE AND SUBSURFACE DRAINAGE
FROM THE FISCHER FARM SITE RETURNED TO HANOVER PARK WATER
RECLAMATION PLANT DURING OCTOBER, NOVEMBER, AND DECEMBER 2007
Date Sump xxxx NH3-N1xxxx xxxxxTSS2xxxxx BOD5
3
xxxxx· · · · · · · · · · · · · · · · · · · · · mg/L · · · · · · · · · · · · · · · · · · · · ·10/09/07 East xx10.xx xx29.xx xx13.xx
10/09/07 West xx70.xx xx58.xx xx53.xx
10/23/07 East x139.xx xx75.xx xNA.xx
10/23/07 West xx58.xx xx74.xx xx61.xx
11/06/07 East x186.xx xx81.xx xx75.xx
11/06/07 West x248.xx x296.xx xNA.xx
11/20/07 East x355.xx x458.xx x219.xx
11/20/07 West xx58.xx xx54.xx xx40.xx
12/04/07 East xx22.xx xx38.xx xxx7.xx
12/04/07 West xxx2.2x xx33.xx xxx9.xx
12/18/07 East xx18.xx xx30.xx xxx4.xx
12/18/07 West xxx0.49 xx66.xx xxx4.xx
1Ammonia Nitrogen.2Total Suspended Solids.3Biochemical Oxygen Demand.1NA = No analysis.

TABLE 8: ANALYSIS OF LAGOON SUPERNATANT APPLIED TO FIELDS
AT THE HANOVER PARK FISCHER FARM SITE
DURING OCTOBER AND NOVEMBER 2007
Parameter xxxxxUnitxxxxx xxxxxxxxxxxxxxConcentration1
pH xxxxxx7.9x
TS % xxxxxx0.12
TVS2 ,, xxxxx56.9x
TKN mg/kg 262,756.xx
NH3-N,, 252,672.xx
Volatile Acids3 ,, xx8,214.xx
Total P ,, x43,920.xx
As ,, xxxxx16.xx
Cd ,, xxxx<0.51Cr ,, xxxx<2.5xCu ,, xxxxx47.xx
Hg ,, xxxxxx0.07
Mn ,, xxxx179.xx
Mo ,, xxxx<1.7xNi ,, xxxxx23.xx
Pb ,, xxxxxx2.4x
Se ,, xxxxxx2.6x
Zn ,, xxxxx74.xx
1Values are the means of seven samples of lagoon supernatant.2Total volatile solids as a percentage of total solids.3As acetic acid.

TABLE 9: ANALYSIS OF LAGOON BIOSOLIDS APPLIED TO FIELDS
AT THE HANOVER PARK FISCHER FARM SITE
DURING NOVEMBER AND DECEMBER 2007
Parameter xxxxxUnitxxxxx xxxxxxxxxxxxxxConcentration1
pH xxxxxx7.6x
TS % xxxxxx3.36
TVS2 ,, xxxxx69.3x
TKN mg/kg 102,075.xx
NH3-N,, x26,277.xx
Volatile Acids3 ,, xxxx440.xx
Total P ,, x35,709.xx
As ,, xxxxx10.xx
Cd ,, xxxxxx2.xx
Cr ,, xxxxx44.xx
Cu ,, xx1,209.xx
Hg ,, xxxxxx2.4x
Mn ,, xxxx764.xx
Mo ,, xxxxx14.xx
Ni ,, xxxxx51.xx
Pb ,, xxxxx44.xx
Se ,, xxxxxx6.xx
Zn ,, xxxx943.xx
1Values are the means of three samples of lagoon supernatant.2Total volatile solids as a percentage of total solids.3As acetic acid.

TABLE 10: VOLUMES AND DRY WEIGHTS OF LAGOON SUPERNATANT
APPLIED TO FIELDS AT THE HANOVER PARK FISCHER FARM SITE
DURING OCTOBER, NOVEMBER, AND DECEMBER 2007
xxxxx Type of xxxxx xxxxVolume xxxxDry Weight
Field Date xxxxxMaterialxxxxx xxxx(Gallons) (Tons)xx
1 10/17/07 Supernatant xxxx80,000 x,xx0.40
1 10/26/07 ,, xxx260,000 x,xx1.30
1 11/13/07 Biosolids xxx378,000 x,x14.30
1 12/01/07 ,, xxx168,000 x,x32.90
2 10/10/07 Supernatant xxx150,000 x,xx0.80
2 10/15/07 ,, xxx150,000 x,xx1.00
2 11/05/07 ,, xxx130,000 x,xx0.60
2 11/30/07 Biosolids xxx756,000 x,132.70
3 11/28/07 Biosolids xxx200,000 x,x34.90
3 11/29/07 ,, xxx854,000 x,147.70
5 10/03/07 Supernatant xxx160,000 x,xx0.90
5 10/16/07 ,, xxxx90,000 x,xx0.50
5 10/29/07 ,, xxx140,000 x,xx0.60
5 11/01/07 ,, xxx230,000 x,xx1.10
5 11/20/07 ,, xxx630,000 x,xx3.10
5 11/14/07 Biosolids xxx560,000 x,x45.70
5 11/15/07 ,, xxx525,000 x,x62.60
5 11/16/07 ,, xxx567,000 x,x89.60
5 11/17/07 ,, xxx378,000 x,x68.40
6 11/17/07 Biosolids xxxx70,000 x,x12.60
6 11/19/07 ,, xxx567,000 x,109.40
6 11/20/07 ,, xxx560,000 x,117.60
6 11/21/07 ,, xxx350,000 x,x61.70
6 11/26/07 ,, xxx539,000 x,x42.40
6 11/27/07 ,, xxx581,000 x,x93.50
6 11/28/07 ,, xxxx45,000 x,xx7.80
Total x9,118,000 1,085.00
![23 - Berkeley City · Web view... (NH3)4Cl2]Cl ( [Co(NH3)4Cl2]+ + Cl-; (# of ions = 2) [Co(NH3)5Cl]Cl2 ... (III) chloride, [Co(NH3)5(NO2)]Cl2, and ... Copper Ceruloplasmin Hemoglobin](https://img.pdfslide.net/doc/110x75/5a9e9e6e7f8b9a0d158b9d45/doc23-berkeley-city-view-nh34cl2cl-conh34cl2-cl-of-ions.jpg)


![Trabalho NH3[1]](https://img.pdfslide.net/doc/110x75/5571f9ee497959916990cc2a/trabalho-nh31.jpg)