Embed Size (px)
Citation preview

RESEARCH AND DEVELOPMENT OF MAINTENANCE FUNCTIONS
The finishing line in the board factory
Sauli Lankinen
Bachelor's Thesis November 2010
Degree Programme in Wellness Technology Technology Unit

DESCRIPTION
Author(s) LANKINEN, Sauli Martti Topias
Type of publication Bachelor´s Thesis
Date 28.10.2010
Pages 71
Language English
Confidential ( ) Until
Permission for web publication ( X )
Title
Research and development of maintenance functions: The finishing line in the board
factory
Degree Programme
Degree programme in Wellness Technology
Tutor(s)
MÄKI, Kari, Principal Lecturer Assigned by
ARDIACA, Juan, Technical director, Stora Enso Barcelona Abstract The aim of the final thesis was to study the problems that were encountered in the Stora Enso
Barcelona Packaging Board Mill's finishing line. The thesis project studied causes for the failures and
looked for solutions to prevent them occurring to improve the reliability of the plant. Due to the
hardening competition companies are forced to find savings from new sectors and therefore
maintenance cost savings and availability performance of the machines has become additionally
important.
The thesis project was carried out concentrating on the Reliability Centered Maintenance, RCM,
methodologies. There were 13 different types of machines in the finishing line and 83 individual
machines. In the finishing line there were no preventive or planned maintenance at all, only reactive
maintenance when something failed. In the finishing line occurred many different types of failures,
such as mechanical, electrical and IT ones. For each studied failure a criticality rate was given. The
devices were relatively cheap and they did not have direct relation to the profit losses and maybe
because of these reasons the finishing line played a minor role. The line produced approximately less
pallets than it could have done or the sheeters could have cut.
There were found solutions that were thought to reduce the down time. Some of the solutions needed
small modifications of the finishing line, some operational procedure changes to modernize the
functions, and there came additional tasks for the operators to make the working more efficient.
During the thesis project the company had already called for offers to replace two of the three
bottleneck machines of the line, which was an option according to the studies. During the
investigation of the finishing line there was no time to implement these findings. It would be
interesting to see if the company decided to press some of the solutions into service and what would
be the benefits.
Keywords Finishing line, reliability centered maintenance, computerized maintenance management systems, operator driven reliability, 5Ss Miscellaneous

OPINNÄYTETYÖN KUVAILULEHTI
Tekijä(t) LANKINEN, Sauli Martti Topias
Julkaisun laji Opinnäytetyö
Päivämäärä 28.10.2010
Sivumäärä 71
Julkaisun kieli Englanti
Luottamuksellisuus ( ) saakka
Verkkojulkaisulupa myönnetty ( X )
Työn nimi
Kunnossapidon toimintojen tutkimus ja kehittämistyö: Loppukäsittelylinjasto
kartonkitehtaalla Koulutusohjelma
Hyvinvointiteknologian koulutusohjelma Työn ohjaaja(t)
MÄKI, Kari, yliopettaja Toimeksiantaja(t)
ARDIACA, Juan, Tekninen johtaja Stora Enso Barcelona Tiivistelmä Opinnäytetyön tarkoituksena oli tutkia ongelmia joita kohdattiin Stora Enson pakkauskartonkitehtaan
loppukäsittelylinjastolla. Opinnäytetyö selvitti syitä havaituille toimintahäiriöille ja etsi ratkaisuja
ehkäisemään ongelmien esiintymisen, jotta tehtaan luotettavuus parantuisi. Kovenevan kilpailun takia
yritykset joutuvat etsimään säästökeinoja uusilta aloilta ja sen vuoksi kunnossapidon säästöt ja
koneiden käyttövarmuus ovat tulleet merkittäviksi tekijöiksi.
Opinnäytetyössä seurattiin luotettavuuskeskeisen kunnossapidon periaatteita.
Loppukäsittelylinjastolla oli 13 eri tyypin laitetta ja 83 itsenäistä laitetta. Loppukäsittelylinjastolla ei
ollut ennakoivaa tai suunnitelmallista kunnossapitoa, vain reagoivaa kun jokin meni epäkuntoon.
Loppukäsittelylinjastolla esiintyi paljon erilaisia toimintahäiriöitä, kuten mekaanisia, elektronisia ja
informaatioteknisiä. Jokaiselle toimintahäiriölle tutkittiin kriittisyysarvo. Koneistot olivat suhteellisen
halpoja ja niillä ei ollut suoranaista yhteyttä tulon menetyksiin ja ehkä näiden seikkojen vuoksi
loppukäsittelylinjasto oli jätetty pienelle huomiolle. Linjasto tuotti keskimäärin vähemmän paletteja
kuin se olisi pystynyt tuottamaan tai arkkileikkurit olisivat voineet leikata.
Ratkaisuja, joiden ajateltiin pystyvän vähentämään seisokkiaikoja, löytyi. Osa ratkaisuista tarvitsi
pieniä modifikaatioita loppukäsittelylinjastolle, osa vaati toiminnallisia muutoksia toimintojen
modernisoimiseksi ja uusia tehtäviä ilmeni suorittaville tahoille työn tehokkuuden parantamiseksi.
Opinnäytetyön aikana yritys oli jo pyytänyt korvaamaan kaksi kolmesta linjaston pullonkaulakoneista,
mikä oli myös tutkittu olevan yksi vaihtoehto. Nopeassa loppukäsittelylinjaston tutkimisessa ei ollut
aikaa toteuttaa löytyneitä ratkaisuvaihtoehtoja käytännössä. Olisi mielenkiintoista nähdä, jos yritys
päätti tai päättäisi ottaa joitakin ratkaisuvaihtoehtoja käytäntöön ja mikä olisi näistä saavutettu hyöty.
Avainsanat (asiasanat)
Loppukäsittelylinjasto, luotettavuuskeskeinen kunnossapito, kunnossapidon
hallintaohjelmistot, käyttäjäkunnossapito, 5S
Muut tiedot

1
CONTENTS
LIST OF ABREVIATIONS ................................................................................ 4
1 INTRODUCTION ........................................................................................... 5
2 COMPANY INTRODUCTION ........................................................................ 6
2.1 Stora Enso .............................................................................................. 6
2.2 Barcelona Mill ......................................................................................... 6
2.3 Finishing line ........................................................................................... 7
3 MAINTENANCE ............................................................................................ 8
3.1 Different types of maintenance ............................................................. 10
3.1.1 Corrective, unplanned or reactive maintenance ............................. 10
3.1.2 Preventive Maintenance, PM ......................................................... 11
3.1.3 Failure finding ................................................................................. 12
3.1.4 Other default actions ...................................................................... 12
3.3 Operator driven reliability, ODR ............................................................ 13
3.4 Housekeeping & 5Ss ............................................................................ 14
4 RELIABILITY CENTERED MAINTENANCE, RCM ..................................... 15
4.1 The seven questions of the RCM ............................................................. 16
4.2 What RCM can achieve ........................................................................ 19
5 MAINTENANCE INFORMATION SYSTEMS (MIS) .................................... 19
5.1 Documentation parts ............................................................................. 20
5.2 Computerized maintenance management systems, CMMS ................. 22
6 PdM TESTING TOOLS AND METHODS .................................................... 24
6.1 Different PdM testing techniques .......................................................... 24
7 OBJECTIVES AND STRUCTURE .............................................................. 27

2
8 INTRODUCING THE FINISHING LINE ....................................................... 28
8.1 Machine descriptions briefly .................................................................. 29
8.2 Finishing line problems ......................................................................... 33
8.3 Failure survey ....................................................................................... 37
8.4 Line efficiency ....................................................................................... 39
9 RESULTS AND DISCUSSION .................................................................... 39
9.1 Modifications ......................................................................................... 40
9.2 Condition monitoring, visual inspections and ODR ............................... 42
9.3 Operation procedure changes .............................................................. 44
10 CONCLUSIONS ........................................................................................ 45
REFERENCES ............................................................................................... 48
APPENDICES ................................................................................................ 50
Appendix 1. Floor plan of the finishing line ................................................. 50
Appendix 2. RCM information worksheets .................................................. 51
Appendix 3. Gravity table for each failure ................................................... 61
Appendix 4. Criticality analysis of the failures ............................................. 62
Appendix 5. RCM decision worksheets....................................................... 63
Appendix 6. RCM decision logic to evaluate consequence of a failure ....... 71

3
FIGURES
FIGURE 1. Typical maintenance concepts.......................................................9
FIGURE 2. Preventive maintenance ratio- the key to minimize total costs.....10
FIGURE 3. A functional model of a maintenance documentation system.......20
FIGURE 4. Example chart of vibration monitoring .........................................25
FIGURE 5. Thermograph photos of dirt and a cleaned motor and its rotating cogwheel gear ................................................................................................26
FIGURE 6. Two dissimilar conveyors..............................................................29
FIGURE 7. Twirler turning a pallet..................................................................30
FIGURE 8. The centering device (right) and Reike (Left)...............................31
FIGURE 9. Octopus and covering equipment.................................................32
FIGURE 10. Too long rubber emergency stop plates, which are touching the conveyor..........................................................................................................34
FIGURE 11. Three example sites where incorrect direction of the pallet legs can cause problems........................................................................................34
FIGURE 12. Octopus' components that are stressed in mechanical
movements………………………………………………………………………….36
FIGURE 13. Label robot is attaching a label onto the front side………………37
FIGURE 14. Incidents that needed mechanics 29.5-29.6.2010......................38
FIGURE 15. Incidents that needed automation mechanics 29.5-29.6.2010........................................................................................................38
FIGURE 16. Strapping equipment and too loose plate...................................41
FIGURE 17. Examples of faults that the operators could maintain.................43

4
LIST OF ABREVIATIONS
BCM Business-centered maintenance
CD Condition-directed
CM Corrective maintenance
CMMS Computerized maintenance management system
EOP Equipment operating procedures
FF Failure-finding
FMEA Failure mode and effects analysis
IT Information technology
LCC Life cycle cost
LCP Life cycle profit
MIS Maintenance information system
MTBF Meantime between failures
MTTF Meantime to fail
MTTR Meantime to repair
ODR Operator driven reliability
OEE Overall equipment effectiveness
OIM Operator involved maintenance
OPM Operator performed maintenance
PDA Personal digital assistant
PdM Predictive maintenance
PM Preventive maintenance
RCM Reliability centered maintenance
RTF Run-to-failure
TD Time-directed

5
1 INTRODUCTION
One of the most important assets and objectives, while planning the
maintenance, is availability of the production equipment. Due to tougher
competition in many industrial sectors the availability performance of the
machinery has become additionally important. (Leiviskä 2009, 238.) Machine
reliability is an essential part of total efficiency and thereby a logical factor of
rationalization. In some cases it is necessary to invest in new technologies,
but on the other hand there are other possibilities to improve the machine
reliabilities. There are big differences between different mills for example the
existence and size of the finishing department and the packaging line, which
lead to mill-specific problems requiring mill-specific studies and solutions. In
this project the problems of the finishing line machines, their root causes and
solutions to prevent them occurring were studied. In this case machine
reliabilities were studied with Reliability centered maintenance (RCM)
methodologies starting from the conveyors of the sheet cutting machines and
continuing until the end of the finishing line in the warehouse.
The literature review of the thesis includes the company introduction and the
most important operational process phases of the operational environment.
Afterwards it is expanded to supportive activities tightly connected to the
industrial process. Different maintenance concepts are enlarged upon to
understand their roles in this project and in the complex aggregate of the
maintenance world. Sometimes they are really theoretical and can only be
adapted in some optimized circumstances.
The experimental part of the thesis concentrates on minimizing the machine
stops or the breakdowns and making the finishing line functions more efficient
by planning the maintenance and examining the most obvious root causes.
The used methods are well known in this field, but the solutions in this thesis
are established in order to meet the needs of Stora Enso Barcelona, and do
not necessarily apply to other destination areas.

6
2 COMPANY INTRODUCTION
2.1 Stora Enso
Stora Enso is a global company with some 27 000 employees in more than 35
countries. The products of the group consist of paper and wood products such
as consumer board, book paper, industrial packaging and fine paper. In 2009
their sales totaled EUR 8.9 billion and an annual production capacity reaches
12.7 million tons of paper and board, 1.5 billion square meters of corrugated
packaging and 6.9 million cubic meters of sawn wood products. (Stora Enso in
brief 2010.)
Stora Enso is using and developing expertise in renewable materials to meet
the needs of its customers and the challenges of today's global raw materials.
Their products provide a climate friendly alternative to many products made
from competing non-renewable materials and therefore have a smaller carbon
footprint. Wood based solutions give for them wide-reaching business benefits
as well benefits for people and the planet. Stora Enso's sustainability:
economic, social and environmental responsibility, underpins their thinking
and approach to every aspect of doing business. (Stora Enso in brief 2010.)
2.2 Barcelona Mill
The Barcelona mill was founded in 1964 and it started operations in 1968 with
annual 20.000 tons of board capacity and in 2010 the capacity is 160.000 tons
per annum. The board is made from recovered paper, collected in the
Barcelona metropolitan area. The mill produces white Line Chipboard (WLC),
the board is coated on both sides and some virgin fibers must be added in
order to meet the high quality standards. There is a new 8.000 square meter
warehouse and a 49 MW cogeneration plant fueled with natural gas.
(Barcelona Mill 2010.)

7
The board is manufactured by one board machine, and the sheeting plant
encompasses one winder and five sheeters. Most of the production is sold in
sheets.
2.3 Finishing line
In a factory manufacturing production systems are often organized with
machines or work centers. They are connected in series and separated by
buffers, better known in the literature as a production line, or a transfer line, or
a flow line. (Artiba & Riane. 2005, 22-23.)
Finishing lines are mostly individual solutions and varying a lot in different
factories of the same group. There are many factors that have an influence on
the layout of the finishing lines, among other things how much there is space,
how much money is available for the machines and how automated the whole
process is wanted to be. In the Barcelona mill the main tasks of the finishing
line are to transport the carton pallets forward, recognize the right pallets,
enclose the stack of cartons, and make the plastic packaging waterproof and
to put the right etiquettes on their sides. There are some special pallets that
need a strap around them. Primarily the finishing line of the Barcelona Mill
was planned to operate with three sheet cutting machines, but as of 2010 it
has to operate with five sheet cutting machines, which make it to be the
bottleneck of the finishing department (Caceres 2010).
In the Barcelona mill the finishing line is running 24 hours a day and 7 days a
week without planned stops and it only stops in uncontrolled conditions. There
are thirteen different kinds of machines and 83 different pieces of equipment
in the finishing line. The finishing packaging line is the last stage before
stocking the pallets and loading them into the trucks.

8
3 MAINTENANCE
Maintenance: Ensuring that physical assets continue to do what their users
want them to do (Moubray 1997, 7). Defining the mission of maintenance is a
challenging task. There seems to be as many different answers as there are
respondents (organizations). Some respondents emphasize quick reaction
times in fixing breakdowns in order to service the customer more efficiently.
Some organizations intent on reducing the downtime and others focus on
quality or cost control, while a few focus on safety or environmental security.
All the above are right, which means that each company has its own type of
interests. (Levitt 2003, 4.) If only thinking maintenance as repairing, it is too
narrow a viewpoint. Maintenance is maintaining and preserving the
productivity of fixed assets. According to the above statement the following
matters belong to the maintenance concept:
preserving the operative condition of the equipment (not letting it to get
worse or scatter)
complying the correct operational conditions
recovering the original condition
fixing the designing weaknesses
improving the operator and maintenance skills
(Järviö 2006, 11-12.)

9
FIGURE 1. Typical maintenance concepts (Original figure from Leiviskä 2009,
308.)
Figure 1 presents different types of typical maintenance concepts. At the
bottom of the picture it can be seen that there is only one concept, corrective
maintenance that is purely reactive maintenance. The other concepts are
above the run-to-failure dash line, which means that the others are trying to
affect before something breaks down, meaning that the planning level
increases; this is mostly known as proactive maintenance. Later there are
more detailed discussions about different methods, which were somehow
connected to this project.
Maintenance is one of the biggest expenditure of the companies and the
biggest uncontrolled cost item. In well-organized enterprises efforts have been
made to master the maintenance and control the costs. The influence of the
maintenance is indirect on the business result of an enterprise. It is truly
important to understand the influence mechanism to be able to calculate the
profits produced by the maintenance. (Järviö 2006, 20-21.)
Figure 2 illustrates how the total cost varies with different kind of maintenance
strategies. Figure shows clearly that there can be found an optimized
maintenance level for each plant and if there is too much preventive
maintenance, the cost rate arises exponentially. Similarly, if the maintenance
is only reactive the production losses cost rate becomes steeper.

10
Typically, the most important goal of the RCM analysis, in industrial
applications, is to evaluate the cost-effective maintenance tasks to minimize
the total cost (Leiviskä 2009, 315-316).
A proactive task is worth of doing if it reduces the consequences of the associated failure mode to an extent that justifies the direct and indirect costs of doing the task (Moubray 1997, 91).
FIGURE 2. Preventive maintenance ratio- the key to minimize total costs (Original figure: Leiviskä 2009, 315.)
3.1 Different types of maintenance
3.1.1 Corrective, unplanned or reactive maintenance
Corrective maintenance (CM) is the performance of unplanned (i.e., unexpected) maintenance tasks to restore the functional capabilities of failed or malfunctioning equipment or systems (Smith & Hinchcliffe 2004, 20).
If the maintenance is only made in the corrective mode, it can very seldom be
productive. Reactive maintenance can be an option if the plant has a very
good maintainability. Normally components are allowed run-to-failure, RTF,

11
and no efforts are taken to maintain the equipment as the design life originally
ensured. The main disadvantages of reactive maintenance are: increased
costs due to unplanned downtimes, increased labour costs, especially if
overtime is needed, costs related to the repair or replacement of the
equipment, possible secondary equipment or process damage from
equipment failure modes and inefficient use of staff resources. (Leiviskä 2009,
309.)
3.1.2 Preventive Maintenance, PM
Preventive maintenance is the performance of inspection and / or servicing tasks that have been preplanned (i.e., scheduled) for accomplishment of a specific points in time to retain the functional capabilities of operating equipment or systems (Smith & Hinchcliffe 2004, 20).
Preventive maintenance, PM can be efficient only if there are enough history
data about the failure rate and the distribution of failure modes, around 10-
20% of the failures can be predicted. It has been found out that most of the
failure modes are random, which cannot be foretold (up to 40-60%), and for
those failures, time-based preventive actions are not the best solution. The
advantages of preventive maintenance are: cost effectiveness, flexibility,
extended component life cycle, reduced number of equipment or process
failures and cost savings over the reactive maintenance program.
Disadvantages of PM are: catastrophic failures could still occur, labour
intensiveness can include performance of unnecessary maintenance if the
failure rate is un-known and the risk of incidental damage to the equipment in
conducting unnecessary maintenance (Järviö 2006, 53; Leiviskä 2009, 309-
310.)
There exist four basic elements behind the decision to define and choose PM
actions: to prevent (or mitigate) the failure occurrence, to detect the onset of
failure, discover a hidden failure and do nothing, because of valid limitations.
There are also four task categories from which a PM action may be specified.
The task categories are worldwide employed in constructing a PM program,
12
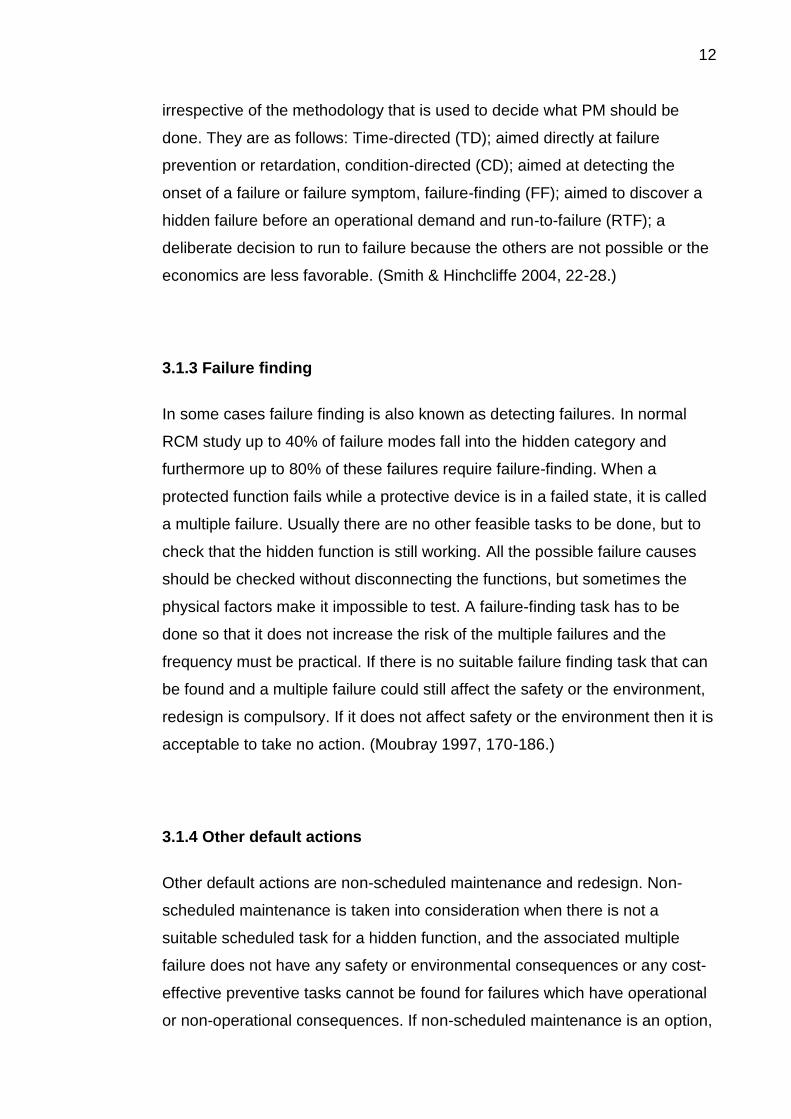
irrespective of the methodology that is used to decide what PM should be
done. They are as follows: Time-directed (TD); aimed directly at failure
prevention or retardation, condition-directed (CD); aimed at detecting the
onset of a failure or failure symptom, failure-finding (FF); aimed to discover a
hidden failure before an operational demand and run-to-failure (RTF); a
deliberate decision to run to failure because the others are not possible or the
economics are less favorable. (Smith & Hinchcliffe 2004, 22-28.)
3.1.3 Failure finding
In some cases failure finding is also known as detecting failures. In normal
RCM study up to 40% of failure modes fall into the hidden category and
furthermore up to 80% of these failures require failure-finding. When a
protected function fails while a protective device is in a failed state, it is called
a multiple failure. Usually there are no other feasible tasks to be done, but to
check that the hidden function is still working. All the possible failure causes
should be checked without disconnecting the functions, but sometimes the
physical factors make it impossible to test. A failure-finding task has to be
done so that it does not increase the risk of the multiple failures and the
frequency must be practical. If there is no suitable failure finding task that can
be found and a multiple failure could still affect the safety or the environment,
redesign is compulsory. If it does not affect safety or the environment then it is
acceptable to take no action. (Moubray 1997, 170-186.)
3.1.4 Other default actions
Other default actions are non-scheduled maintenance and redesign. Non-
scheduled maintenance is taken into consideration when there is not a
suitable scheduled task for a hidden function, and the associated multiple
failure does not have any safety or environmental consequences or any cost-
effective preventive tasks cannot be found for failures which have operational
or non-operational consequences. If non-scheduled maintenance is an option,

13
then the redesign might be a valid option. Redesign is changing the
specification of a component, adding a new item, replacing an entire machine,
or relocating a machine. It also means any other once-off change to a
procedure or process, which has something to do with the operation of the
plant. The redesign option might be an expensive alternative and also slow in
many cases. Before choosing the redesign alternative there has to be
economic trade-off studies carried out to show it can achieve expected cost
savings. (Moubray 1997, 187-197.)
3.3 Operator driven reliability, ODR
SKF reliability systems have noted that the operator driven reliability, ODR, is
the teamwork process of the whole company, which optimizes the functions of
a production plant and widens the operator's basic sphere of responsibilities.
The ODR can be divided into three smaller sub-concepts. Equipment
Operating Procedures (EOP): actions related to the equipment functions,
which manufacturers have specified, but normally after a certain time these
actions change a bit to the best established practice. Operator Involved
Maintenance (OIM): actions that are reacted by the operators and
maintenance are observed daily. The operators take part e.g. in finding the
causes to a problem. Operator Performed Maintenance (OPM): Operators
individually perform tasks, which improves the availability. These tasks can
consist of inspections, cleaning, repairs, measurements, oil / component
changing and adjustments. ODR attempts to change the attitudes and the
ownership scheme of the themes of the machines also to the lower operator
levels. (Numminen 2005, 32-33; Operator Driven Reliability; Kunnossapidon
toiminnot.)
Normally ODR is part of other maintenance systems and more likely
supporting them, and more from the preventive point of view. Many times
ODR is based on visual inspections, because the operators are closer to the

14
machine and can detect symptoms earlier. In many cases using personal
digital assistants, PDAs, is supported to achieve faster information change
and processing. Usually the successful ODR results have improved
availability, improved efficiency and improved quality of the products. The
three factors above affect the plant OEE (overall equipment
effectiveness=availability x performance x quality) and therefore the OEE-
parameters are good indicators to show the success of the program. The
hardest part to implement ODR is to train the operators properly and change
the attitudes toward the way of thinking that the operators own the machines.
The most important addition to the maintenance system that ODR brings
along is the earlier detection of problems, improved atmosphere and cost
savings from breaking the normal operator-maintenance interface. (Hykin n.d;
Numminen 2005, 33-34.)
3.4 Housekeeping & 5Ss
The 5Ss stand for the five Japanese words, whose English equivalents are
5Cs: Clear out, Configure, Clean and check, Conformity, Custom and practice.
The 5Ss method is practiced to achieve high quality standards in the
production of goods, from a well-organized working environment. The 5Ss, as
well as, other maintenance methodologies depend on the commitment from
top management to total quality management and continuous improvement
drives the initiative. It all goes to keep a good order in an applied field. The
method motivates to give positive feedback in order to show progress and
achievements and this way it gives employees a means of monitoring the
effectiveness of their actions. (O'hEocha 2000, 321.)
Implementation of the 5Ss improves environmental performance,
housekeeping or health and safety standards, which have been studied and
found to depend on a great extent upon the company culture. Normally the top
management and organizational structure determine the culture in the

15
company. A manager's actions of the top and middle management influence
the communication dynamics, which in turn determines the extent of
involvement and motivation at the operative level. In theory, the 5Ss set out a
clear way to achieve better results, but in practice the method is a far more
complex system, because of the plethora of human actions. (O'hEocha 2000,
322-330.) Ahonen (2010) also explicated that commitment for housekeeping
requires normally indication of the action from the company. If the company
makes such changes in the working environment which can be easily noted by
the employees, it can give the workers an idea that the company wants to take
care of its property in a new different way.
4 RELIABILITY CENTERED MAINTENANCE, RCM
Reliability-centred Maintenance: a process used to determine what must be done to ensure that any physical asset continues to do what its users want it to do in its present operating context (Moubray 1997, 7).
RCM can be considered as a maintenance development process that has
ascended from the aviation industry. RCM is a tool to improve the results and
the process is also a risk evaluation, while it tries to minimize all the
unplanned stops in a factory by studying equipment and components carefully
and their probability to fail. The RCM process is systematic, measurable, and
objective as it indicates and performs effective maintenance functions.
(August 2004, 1-6.) RCM is a suggestive, simple and fast framework for
enterprises to discover right manners of the maintenance and to take better
care of the economy. (Järviö 2000, 16-19.)
There are seven basic questions that the RCM process brings along and
these questions are asking about the assets or system under review, as
follows:

16
1. What are the functions and associated performance standards of the
asset in its present operating context (functions)?
2. In what ways does it fail to fulfill its functions (functional failures)?
3. What causes each functional failure (failure modes)?
4. What happens when each failure occurs (failure effects)?
5. In what way does each failure matter (failure consequences)?
6. What can be done to predict or prevent each failure (proactive tasks
and task intervals)?
7. What should be done if a suitable proactive task cannot be found
(default actions)?
(Moubray 1997, 7; Leiviskä 2009, 316.)
Normally the RCM is used as a tool to develop the proactive maintenance
program for the production line or plant asset. There have to be an accurate
plan, trained and motivated human resources, and effective tools (software).
Usually there is a facilitator, who leads the project and the role of the facilitator
is essential to achieve the goals of RCM. That person must master the RCM
methodology, have good skills to handle different situations and especially
have the skill to motivate people to do systematic, analytical work. It is
important that a team has know-how and skills to find answers to all seven
RCM questions. (Leiviskä 2009, 316-321.)
4.1 The seven questions of the RCM
Functions
A function definition- and by implicating the definition of the objectives of
maintenance for the asset - is not complete unless it specifies as precisely as
possible the level of performance desired by the user. A complete function
statement then consists of a verb, an object and the standard of performance
desired by the user. The maximum performance standard comes from the
physical limitations of the machine, but the minimum performance standard is

17
something that the user has to set, meaning that there are desired
performance (what the users want the asset to do) and built-in capability (what
it can do). It should be born in mind that maintenance can only restore the
asset to an initial level of capability; it cannot go beyond it, otherwise it is
modification. Functions should be written so clearly that everyone involved
could understand what is wanted, including enough quantitative performance
standards and secondary function information if possible. (Moubray 1997, 21-
44.)
Functional failures
If the asset is unable to do what the user wants, for any reason, the user will
consider it to have failed. Functional failure can be a complete loss of function
or a situation where the asset still functions, but performs outside acceptable
limits. What is considered as a failure depends highly on who is defining it, for
instance the safety manager and the production manager might have two
really different points of views. Functional failure can be said to be the level
when proactive maintenance is needed to sustain the required level of
performance. (Moubray 1997, 45-52).
Failure mode and effect analysis, FMEA
As a precise definition for a failure mode could be used the following: a failure
mode is any event which causes a functional failure. It is important to identify
the failure modes, which are reasonably likely to affect functional failures,
ideally identified before they occur at all, or before they occur again. In an
ideal situation they are analyzed to really itemized level, using detailed
vocabulary for each asset. Once they are identified it is possible to consider
what happens when a failure occurs, to assess its consequences and to
decide what to do to anticipate, prevent, detect or correct it, or maybe re-
design it. Without a descent failure mode analysis it is impossible to develop a
systematic, proactive maintenance management strategy. Probability of the

18
functional failures also affects the failure mode analysis; it is not wise to list
every single failure possibility. (Moubray 1997, 53-71.)
The next step would be to list what happens when each failure mode occurs,
known as failure effects. Anyhow, failure effects are not the same thing with
consequences. A good description of failure effects is used to evaluate the
consequences of the failure. Specially, when describing the effects of a failure,
the following should be recorded: what evidence there is (if any) that the
failure has occurred, in what ways (if any) it poses a threat to safety or the
environment, in what ways (if any) it affects production or operations, what
physical damage (if any) is caused by the failure, and what must be done to
repair the failure. (Moubray 1997, 73.)
Failure consequences
Each failure somehow affects an organization, which is using the asset.
Failures can affect the output, quality and customer service or maybe the
safety, environment, operating costs, energy or other consumption, while a
few have an impact on several above-mentioned, and still others may appear
to have no effect at all if they occur on their own. The last type can still expose
the organization to the risk of much more serious failures. If failures are not
prevented it binds resources, which could be used more efficiently elsewhere.
There is a difference between failure effect asking what happens and
consequences describing how- and how much - it matters. The list of failure
consequences is the ultimate stage before deciding whether proactive
maintenance is worth of doing in each case and it also suggest what action
should be taken if a suitable proactive task cannot be found. (Moubray 1997,
90-128.)

19
4.2 What RCM can achieve
Results of the RCM are mainly inspected from two points of views: (1)
performance efficiency of the maintenance and (2) cost efficiency of the
maintenance. Key figures of the number one aspect to measure the
performance are MTBF, MTTF, failure probability and effectiveness
(input/output). The key figures of the second aspect are direct maintenance
costs, labour costs, spare part and material costs, and design and supervision
costs. (Järviö 2000, 144.)
RCM can achieve and fulfill many expectations. RCM is contributing to greater
safety and environmental integrity, higher plant availability and reliability,
longer useful life of expensive items, minimizing the less sudden failures,
improved product quality, greater maintenance efficiency (cost-effectiveness),
and greater motivation of individuals, better teamwork, and improved
maintenance database and system. The key feature of the RCM is that it
provides an effective step-by-step framework for trying to tackle all of the
above at once, and for involving everyone who has anything to do with the
equipment in the process. (Moubray 1997, 307-317.)
5 MAINTENANCE INFORMATION SYSTEMS (MIS)
In the business-centered maintenance (BCM) some form of the
documentation system for recording and conveying information, is an
essential operational requirement for all the elements of the maintenance
management cycle. Documentation can be defined as: any record, manual,
catalog, drawing or computer file containing information that might be required
to facilitate maintenance work. Moreover, MIS can be described as: the formal
mechanism for collecting, analyzing, storing interrogating and reporting
maintenance information. Anyhow, most of the current systems are
computerized in the efficient business world of today, but their mode of

20
operation has evolved from the classical paperwork. Figure 3 is introducing
the basic model of the maintenance system. (Kelly 2006, 168-187.)
All the information should be documented just once and a backup file created.
History information base needs to be a real time system, which means that all
the information has to be open for everyone on the following day. All the
calculations and analyses must be performed in real time, updated with the
latest information. There should not be overlapping systems collecting the
same information and there always has to be LCC (life cycle cost) / LCP (life
cycle profit) calculations done when analyzing the history information. (Mäki
2009, 24.)
5.1 Documentation parts
FIGURE 3. A functional model of a maintenance documentation system
(Original figure: Kelly 2006, 169)

21
With the first glance Figure 3 might look a bit confusing, but when it is
internalized it can help to understand the benefits of a maintenance
documentation system. With the following introductions this Figure 3 can be
opened better. The documentation system can be roughly divided into seven
sections, which are made up of: (1) plant inventory, (2) maintenance
information base, (3) maintenance schedule, (4) condition monitoring, (5)
short-term planning, (6) shutdown work planning and (7) maintenance control.
(Kelly 2006, 169-171.)
The plant inventory (1) consists of a coded list of the plant units, which are
identified by a short description and all the basic information. This flags the
main way into the system to obtain information on the unit. The maintenance
information is a database (2) that includes information of the unit life plans, job
catalogs, maintenance instruction manuals, and safety information etc for
each individual unit. Suitable database is essential for the efficient planning of
work. A maintenance schedule (3) stores preventive maintenance jobs, which
are formulated from the recommendations of the studies and job
specifications. The indexes can be updated and if necessary re-scheduled as
on the return of the information. (Kelly 2006, 171-178.)
A condition monitoring (4) maintenance program might well include
inspections that need to be done and hence scheduled, independently from
the main maintenance jobs. There can be: condition checks, readings,
inspection routines undertaken by artisans, condition monitoring routines
carried out by technicians using off-line equipment. The short-term work
planning (5) system has to carry out and schedule preventive jobs, corrective
jobs and where necessary modifications. The system can produce a list of
most important jobs that has to be carried out and adds them into the task
planning system. The complete programs are formulated in terms of
resources, plant availability and the opportunities known to be arising.
Shutdown work planning (6); modification / preventive work and corrective
tasks are jobs that the plant needs to be offline for an extended period.
Ongoing maintenance originates from the shutdowns, because the overhaul of

22
a small unit might consist of hundreds of interrelated jobs. It is important that
the execution and the control of the shutdown should exploit the work order
system so that the cost control and history recording may be sustained. The
maintenance control (7) system collects information coming from a number of
different sources, such as work orders, time cards and material purchasing
records, to update the planning systems and provide various reports for
different parties that need the information. (Kelly 2006, 178-187.)
When talking about spare parts they are considered as a product support
items, whose availability is important when planned or unplanned
maintenance is to be carried out. One of the best ways to optimize the
unplanned stoppages is to forecast properly the required number of spare
parts, based on technical characteristics, operating environmental conditions
of a system and reliable history data. The environmental conditions should be
taken more into the consideration with part manufacturers to minimize the
MTBF. (Artiba & Riane. 2005, 70-82.) Delivery times depend a lot on the type
of the spare parts. With a well-organized warehouse and spare part system
costs can be saved, maybe less capital is tied up and maintenance is
improved, when there are the right parts available. (Leiviskä 2009, 345-352.)
5.2 Computerized maintenance management systems, CMMS
With computerized maintenance management systems, CMMS, the strategies
are organized and carried out and it is a managing tool for the maintenance
activities, meaning that it indicates where the maintenance activities have
been successful and where not. CMMS illustrates the direction of the
maintenance development and gives the feedback. (Mäki 2009, 54.) In the
CMMS the most important sources of information are the work orders. Many
times it is also the weakest point, because too often the operators and
maintenance crew do not record enough information, which makes the
analysis to be too superficial. Usually most of the programs give information

23
from MTBF, MTTR, availability, costs, timetables and TOP 10 lists of failures.
(Leiviskä 2009, 313-314.)
Kelly (2006, 194-195) highlights the easy access to CMMS from different
levels, it is easy to share, it has excellent storing possibilities, it is flexible and
it has an ability to analyze and report large quantities of control data. Usually
the main reasons why CMMS might operate below its capability is that the
organizations do not have the will to educate their employees, store enough
descent data, they underestimate their capabilities and benefits versus the
time and money to make the process on the functional level (Kelly 2006, 195-
196).
CMMS does not guarantee that planning is working automatically. Planning
with CMMS is not simple and just because the company has a computer does
not mean it has a planning function. It is a tool used, not only by the
maintenance staff, but by the entire plant or company. The system helps with
the information, but often the term "maintenance" has a bad connection to
previous history where maintenance is thought merely as the repair of broken
equipment. CMMS is not planning itself, but it can be a tremendous resource
for planning. (Palmer 2006, 283-284.)
When deciding, which program should be taken into use, it is really important
that different options are studied well, because each company has their own
needs and interests and not all the program providers have the same features,
although many have possibilities to do tailored versions. Another meaningful
factor to think about is that how much there is support available from the
program provider. The chosen option should stay for a long time in the market
to avoid sometimes painful system changes and education of the staff to use
them properly. There might be various databases between different
departments, which could be avoided with one common system and that way
the information flood is decreased. (Vekara 2003, 6-10+47.)
24
6 PdM TESTING TOOLS AND METHODS
Many testing techniques can be applied to a family of similar components, but
the periodicity of the predictive maintenance, PdM, tasks is individual for each
one depending on the environment, criticality, classification and operating
conditions. It also matters if the component is operating in continuous duty
mode or cyclic duty. (Bloom 2006, 172.)
The method decision involves selecting alternative designs, procedures,
plans, and methods that consider time and economy restrictions in their
implementation. In many cases it is needed to consider the situation from the
economic point of view; what is reasonable to test or inspect and also note
that common sense and experience can help to decide where to put the effort
and how to set realistic expectations. (Mobley, Higgins, Lindley & Wikoff 2008,
211-212; Neuwirth 2010,10-11.) With descent inspection system (around 30-
40% of the failures can be predicted by the condition) costs can be reduced,
security improves, and environment load diminishes. Inspection systems can
improve availability, quality, guarantee and product development questions
with a manufacturer. (Kunnossapidon toiminnot; Järviö 2006, 54.)
6.1 Different PdM testing techniques
Vibration monitoring is mostly valid for rotating machinery where alignment
problems, bearing wear or unbalanced conditions can be detected. Vibration
sensors are used to detect loose or cracked support mountings or support
pads, bent or cracked shafts, and coupling problems. Vibration measurements
can be controlled by software, which monitors incipient failures as they
progressively get worse. (Bloom 2006, 172-173; Kunnossapidon toiminnot.)
There are also portable off-line pieces of equipment, which can be carried to
non-stable locations and their data is analyzed by a specialized operator.

25
Acoustic monitoring can be used to detect internal and external leaks in all
types of valves such as motor and air-operated valves, manual valves, and
check valves. Normally it is air or water that leaks by or through different types
of valve parts. Acoustic monitoring can also detect leaks through heat
exchanger tubes that are cracked and it can be used to measure the general
condition of the machine. (Bloom 2006, 173; Kunnossapidon toiminnot.)
Figure 4 shows the rising trend toward the failure limits, which is already
known and set down. With the trend it is possible to prognoses which lighten
the maintenance planning and scheduling.
FIGURE 4. Example chart of vibration monitoring (Original figure:
Kunnossapidon toiminnot.)
Normally this type of thermograph monitoring is used to find heated spots
using an infrared camera. This is quite a precise technique as it can detect
electrical connections that have become loose and it can be programmed to
detect any parameter that might run hotter than usually expected, such as
relay coils, motor windings and hydraulic / pneumatic systems. Incipient

26
bearing or integral gear failures are commonly detected by oil sampling and
analysis. This is easy to do: a small amount of oil is drained from the unit and
analyzed and inspected for wear particles and other contaminants such as
water intrusion into the reservoir. (Bloom 2006, 172; Kunnossapidon
toiminnot.)
FIGURE 5: Thermograph photos of dirt (left) and a cleaned (right) motor and
its rotating cogwheel gear (Original Figure: Saarenpää 2006, 69-70).
Figure 5 shows how much difference normal cleaning can make to the
operating temperatures on electronic motors. The target is outside and the
temperature difference between the two photos is 7 °C and it can be said that
the cleaning reduced approximately 40 °C the surface temperature. If a motor
has to operate too long, too hot, its insulation's lifetime shortens considerably.
The lifetime of the winding insulation shortens approximately to half for every
8 ...10 °C rising of the temperature in continuous usage. A damage the heat
can do is not rapid; the motor can run few years properly without any
problems, but a cleaned motor can run multiple times, concerning the
insulation parts. (Saarenpää 2006, 68-70.)
Radiography inspections uses x-rays to detect subsurface flaws in welds or
other metallic parts such as casings or valve bodies and the same things can
be also tested by ultrasonic testing. Surface cracks on metallic parts can be
tested by magnetic particle inspection or by the Eddy current test. Pipe cracks

27
can be detected with the liquid penetration technique. Motor problems such as
cracked rotor bars and some motor winding, are detected by the motor current
signature analysis. A boroscope can inspect visually internal part of equipment
that cannot be inspected externally. (Bloom 2006, 172-175.)
7 OBJECTIVES AND STRUCTURE
Objective of this bachelor thesis is to locate problematic pieces of equipment
and components, to find reasons that cause the problems and improve the
finishing line reliability with suggested solutions. Physically the scope of
investigation starts from the beginning of the conveyor line (after sheeters)
and ends in the warehouse where pallets are transported by forklift trucks.
Problems on the finishing line are investigated whether electrical, mechanical
or information technology, IT. The actual board manufacturing process, the
board machine or cutting machines are not covered in this thesis.
There are 13 different category machines (later each are presented) in the
finishing line and some of them have a couple versions such as conveyor
parts. The primary focus will be on finding new maintenance possibilities to
improve the availability. Secondary focuses are to re-design the functions or
pieces of equipment in a way that they can run more reliably.
Ways to improve the reliability are evolved by generating ideas from
conversations with employees from different levels, using RCM
methodologies, supporting materials of the company and the writer's own
observations. Many theoretically ideal maintenance solutions cannot be
applied due to their high costs versus the minor benefits.
While carrying out the project there were no planned maintenance in the
finishing line, only reactive and corrective (except putting grease on the
crawler of the oven). A big problem is that there are many different kinds of
machines; each has unique problems, sometimes small ones, but they occur

28
often. One problem is that the machines are relatively cheap and their
disintegrations do not have as direct cost losses as for example the board
machine breakdown.
Failures, gravities and resolutions of each machine can be seen from the
appendices 1-6 and the most important solutions are presented in a separate
chapter in the thesis. The implementation of the suggested solutions and
obtaining is not possible in this thesis and therefore the solutions are
considered on the theoretical level, not forgetting the characteristic features of
the finishing line. Therefore the company has to implement the parts that they
consider to be reasonable to take into use and obtain the new findings.
8 INTRODUCING THE FINISHING LINE
There are a few logics controlling the line movements. Logics get their inputs
from the sensors that recognize pallets and if the pallet is free to continue on
the line, the logic puts an output on. Pallets go all the time on a conveyor line
or on a transfer carriage and all the machines are on the conveyor line. All the
compressed air, which a couple machines are using, is compressed in one
place and the finishing department is the last part of this system. All the 83
individual pieces of equipment in the finishing line are powered at least partly
by electric motors. In this thesis the primer and secondary functions of the
machines are not presented detailed or pieces of equipment are not listed
component by component, but below there is short introduction to the
machines of the finishing line. Nevertheless the components and functions of
the pieces of equipment were investigated and noted during the process. The
finishing line is divided into two parts. The finishing line layout can be seen in
the appendix 1. The first part, M3 and the pieces of equipment on the left side,
is meant for the pallets that can continue directly without interruptions. The
second part, TRM15 and the pieces of equipment on the right side, is meant

29
for the pallets that need quality control after the sheet cutters, e.g. if the carton
stack is not straight.
8.1 Machine descriptions briefly
Conveyors
There are two different types of conveyors in the finishing line, chain and belt
versions, which are seen in Figure 6. In the belt version the belt is in the
middle of the conveyor and under the rolls contrary to the chain version where
the chain transmission is in the side of the conveyor. Parts of the conveying
system are a few swivels and transfer carriages. Swivels are used to turn the
running direction of the pallets, normally 90 degree. The transfer carriages are
used to replace swivels and conveyors where walking or truck path has to go
through the line or simultaneously a few pallets have to be transferred at the
same time.
FIGURE 6 Two dissimilar conveyors
Twirler
A twirler machine is located on the side of the line where only go pallets that
need to be quality controlled. The twirler is meant to reform the carton sheet
stack in the way they fulfill the quality needs. There might be bad cartons in
the middle of the carton stack and when the machine turns it on its side and

30
releases the press, it is easy to take the bad sheet away or straighten the
stack. It has moving roll tables, which can press the pallets tight enough when
it turns upside down or just in its side like it is processing in Figure 7.
FIGURE 7. Twirler turning a pallet
Pushers
In some cases rolls of the conveyors are not in the same running direction and
the pallets have to be pushed to the following conveyor line, mostly the
pushers are after the sheeters, while the pallets are side by side. The pushers
work with hydraulic pumps and cylinders give the pushing power to the bar
that touches the pallets.
Centering devices, Reike & Centrador
Pallets can arrive in a two different ways and only one is the right. Therefore
pallets have to be turned into the right way as the pallet shown in Figure 8
(left). The latter part of the finishing line is above the earlier conveyor line and
therefore the pallets have to be raised on the same level. The centering
devices also center the pallets in the middle of the conveyor, straighten their
legs to the running direction and the equipment called Reike also pushes the
carton stack in the middle of the wooden pallet. Reike is considered to be one
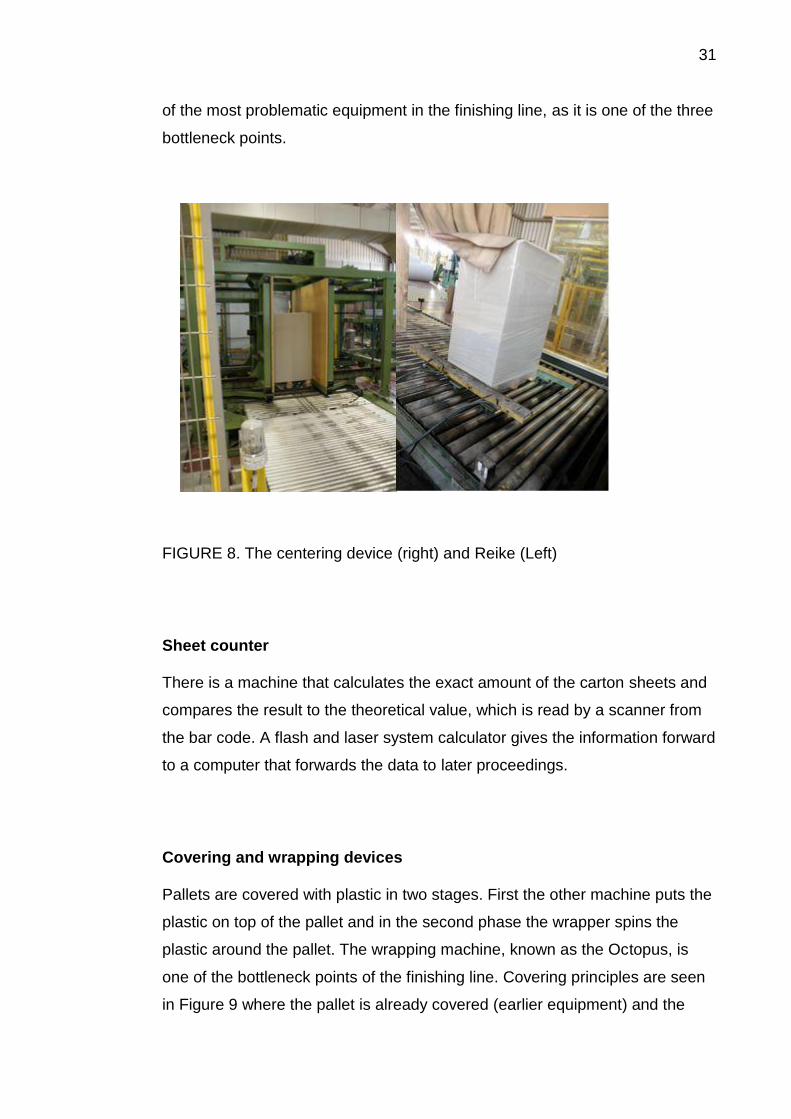
31
of the most problematic equipment in the finishing line, as it is one of the three
bottleneck points.
FIGURE 8. The centering device (right) and Reike (Left)
Sheet counter
There is a machine that calculates the exact amount of the carton sheets and
compares the result to the theoretical value, which is read by a scanner from
the bar code. A flash and laser system calculator gives the information forward
to a computer that forwards the data to later proceedings.
Covering and wrapping devices
Pallets are covered with plastic in two stages. First the other machine puts the
plastic on top of the pallet and in the second phase the wrapper spins the
plastic around the pallet. The wrapping machine, known as the Octopus, is
one of the bottleneck points of the finishing line. Covering principles are seen
in Figure 9 where the pallet is already covered (earlier equipment) and the

32
plastic around the pallet is put with the circling feeding, cutting and attaching
tool.
FIGURE 9. Octopus (left) and covering (right) equipment
Oven
Packaging around the pallet has to be enclosed to be waterproof. In the oven
the plastic shrinks tightly next to the carton and there is not much air inside.
The plastic layers attach to different layers and there is no need for further
compacting. There are four gas crematories heating the oven and ventilators
to circulate the air inside. There is an entrance and exit door and only one
pallet can enter into the oven at a time. The oven is one of the three
bottlenecks of the finishing line.
Strapping device
For every pallet after the oven the strapping device presses the packaging.
Pallets that are loaded to vessels need straps around the wooden pallet and
carton stack. An operator has to put carton softeners manually to the corners
of the carton stack. A pneumatic system feeds the strap to a passage system
and when the strap is properly around the pallet, there is an actual strapping
machine that connects the two ends and releases the passage system to the

33
waiting mode. A package can continue forward after the strap is attached to
the two leg holes of the pallet.
Robot attaching the labels
A scanner recognizes a pallet and gives orders for the computer, which
automatically prints the new labels. Printed labels move on tracks to the robot
that clings to the label with low pressure and takes it to a glue sprayer and
then it is attached to the pallet. The computer, printer, and logics are located
in an air-conditioned cubby, while the robot arm and the glue sprayer are next
to the conveyor.
8.2 Finishing line problems
Problems that are dealt with in this thesis can be found in appendix 2 (RCM 2
information worksheets) and here the most common problems and different
kinds of possible failure modes are presented. The thesis concentrates more
on the failures that occur more likely, but theoretical problems have also been
thought. The gravity chart of the failures can be found in appendix 3.
Appendix 4 is a model of criticality analysis of the failures to show how
gravities were chosen.
In many cases on this finishing line there occur problems even if nothing has
broken down and in some cases resetting by an operator can solve the
problem and the maintenance staff is not needed. Mostly these problems
occur, because the logic and the pieces of equipment do not communicate
correctly and a manual drive for a moment can make it operate again. Figure
10 shows a problem where nothing breaks down: only an emergency rubber
plate on an orange transfer carriage is dimensioned too long and it touches
unwillingly to a following conveyor (green part on the right in Figure 10) and
stops the automatic process.

34
FIGURE 10. Too long rubber emergency stop plates, which are touching the
conveyor
One of the biggest problems is the scenario, when pallets arrive really
indirectly to the centering equipment Reike. Indirect pallets wear down the
lifting table equipment or pneumatic parts have to use more than normal
amount of power to straighten the pallet. In many cases Reike cannot
recognize the pallet correctly and in the worst case a pallet can depart its legs
pointing to the wrong direction, which reflects later problems. Figure 11 shows
three possible problems where the original reason is an indirect pallet in the
beginning of the finishing line and the result can be stuck or fallen pallets.
FIGURE 11. Three example sites where the incorrect direction of the pallet
legs can cause problems (Oven, CTM 44 and M17)

35
There can be hydraulic problems, while the pusher and its cylinders are
powered by a hydraulic pump. Then the pallets cannot be pushed to the
conveyor line. There are problems with the twirler, because it cannot create
enough compressed air, in which case the process has to be more manual
and slower. Other air problems occur with the equipment called Reike when
there is not steady compressed-air available, due to the other usage of the air
in the factory. There are cases when pneumatic parts fail and they need to be
changed, such as valves in the machine Reike.
The oven is meant to operate approximately in 250 °C, but the temperature is
not regular, it varies a bit. If the crematories fail the temperature lowers, but
into a certain point pallets can stay for a longer time in the oven, which
nonetheless slows down the finishing line. The ventilators failing do not give
proper air circulation. The oven is one of the biggest reasons for quality
problems that occur in the finishing line.
There are also failures that appear due to physical breakdowns. On Octopus
there are lots of mechanical movements, high speed, torque and erosion and
components are more stressed (Figure 12). There are wheel abutments on
the circle, chain supports and their fasteners, a supporter of the motor and
transmission belt as well as a cutting and attaching tool of the plastic. The
supporter for the motor of the transmission belt that can be seen in Figure 12
(second from the right side) failed during the summer 2010. The bolts and
already once welded part had slowly started to warp. Finally the belt was too
low and the whole circling system had problems to operate correctly. The
attaching and cutting tool seen in Figure 12 (right one) finishes the wrapping
by melting the two plastic ends together by a small resistance wire. There is a
pneumatic cylinder moving the cutting blade. Electric wires are connected to
an electric lump, which has connection problems, because the cutting tool
movements stretch the connector. The consequence is that the wrapping is
not finished and the operators have to put the plastic end under other plastic
layers or the plastic end can give wrong information for the sensors while
hanging freely or the plastic end can unpack the plastic packaging.

36
FIGURE 12. Octopus' components that are stressed in mechanical
movements
Rolls on the conveyors can bend or their fasteners can fail. In some cases the
roll can bend so much that the pallets can jam into the gap. The chain version
is thought to be more reliable than the belt version, because the belt is torn
more likely. In the summer time working conditions and the temperature can
raise to really high readings. These conditions expose the pieces of
equipment to higher risk to fail and one good example is a servo motor for the
Octopus, which is located in a closed electric closet. One reason to the failure
can be overheat without a required cooling system and air circulation. One
problem is that sensors do not recognize the pallets when they should. Other
sensor types can break down, they can be just wrongly adjusted or they are
too much covered by dirt.
Problems can also be more in the program of the logic. There is an example
when the label robot is attaching (Figure 13) a label onto the front of the pallet.
When laser sensors do identify the pallet it stops immediately. It is possible
that the pallet moves backwards and the sensors do not recognize the pallet
anymore and the process stops due to wrong information. Actually there are
several possibilities to solve this problem, but in this thesis it is later
investigated from the IT point of view and solved with a small program
modification. The sheet counter and its scanner fail many times to operate
automatically. The scanner cannot read a bar code or a computer does not

37
accept values. The software turns to manual mode and the operator has to
feed the values and this failure mode occurs often.
FIGURE 13. Label robot is attaching a label onto the front side
8.3 Failure survey
The following Figures 14 and 15 illustrate a short time review of the finishing
line failures that needed repairmen to fix them during one month period.
However they do not represent the 100% truth as they are taken from manual
diaries of the mechanics, which caused several problems for the undersigned.
Also these results do not show more information than the devices, which were
maintained.
As shown in Figure 14 conveyor failures took 33 % of the work orders of the
mechanics and mostly they were roll changes. As indicated earlier the
bottlenecks are Octopus, Reike and the oven and they took all together 49 %
of the orders. The bottleneck pieces of equipment are single machines
whereas there are several conveyor units. In Figure 15 the bottleneck pieces
of equipment are also at the top of the list when automation mechanics were
needed, together they made 54 % of the orders. Some of these maintenance

38
orders needed both mechanics and automation mechanics, but there were
also individual tasks such as automation mechanics repairing photo sensors
or conveyor repairs needed more often only mechanics.
FIGURE 14. Incidents that needed mechanics 29.5-29.6.2010
FIGURE 15. Incidents that needed automation mechanics 29.5-29.6.2010
Reike 15 %
Covering device
6 %
Oven 13 %
Octopus 21 %
Conveyor 33 %
Twirler 5 %
Others 7 %
Reike
Covering device
Oven
Octopus
Conveyor
Twirler
Others
Others 11 %
Foto Sensors 15 %
Oven 14 %
Octopus 28 %
Conveyors 4 %
Twirler 4 %
Reike 12 %
Swivels 5 %
Transfer carriages
7 %
Others
Foto Sensors
Oven
Octopus
Conveyors
Twirler
Reike
Swivels
Transfer carriages

39
8.4 Line efficiency
The slowest machine (strapping equipment, special packaging) takes up to 80
seconds to process one pallet when the maximum amount that the finishing
line could process in an hour would be 45. The slowest machine, which every
pallet has to go through, takes up to 60-70 seconds to process one pallet.
With this cycle approximately 55 pallets per hour could be operated.
As of 2010 August the average the finishing line sheeters cut per hour is
31.25. In theoretical circumstances (thickness, quality, width of the roll, sheet
sizes etc) the maximum the five sheeters could cut can be close to 100 pallets
per hour (Caceres 2010.)
The sheeters have to operate below their capacity, because of the finishing
line, which illustrates indirect influences of the finishing line on the other parts
of the plant. The interviews also proved that approximately 20% of the pallets
have to re-enter the finishing line after they have gone through it due to the
quality problems, mostly caused by packing problems, such as holes in the
plastics.
9 RESULTS AND DISCUSSION
On the finishing line there does not exist continuous systematic condition
monitoring and most of the information is in the heads of the people. In this
thesis the results are suggestions to improve the maintenance planning
process and some more specific machine centered solutions. The conclusions
that are suggested in this thesis are partly confirmed by the operators or by
the maintenance staff to consider their usefulness or practicability.
On the appendix 5 (RCM decision worksheets) indicative solutions are
suggested for each conceivable failure. Appendix 6 is presenting the RCM
decision logic to evaluate consequence of a failure and to choose a proper

40
solution suggestion. Technological PdM methods cannot be taken into a
bigger picture, because mostly the testing equipment could be expensive and
their use can be directed to more important locations. In the finishing line the
benefits got from PdM tools does not mostly pay the effort. In this the focus is
not that much on electronics, because electronic devices have been said to
fulfill their life time expectations.
9.1 Modifications
One major finding is not that much from the maintenance point of view, but
implementing a centering device (an example is introduced in Figure 8) on the
conveyor M13 could reduce many failures that are caused by the indirect
pallets. The implementation could reduce problems with the centering
equipment Reike, sheet counter, transfer carriage and oven. The
implementation of the equipment could reduce falling or jamming of the
pallets, mechanical stressing of the lifting table M16 and functional disorders
of the Reike and sheet counter. In addition, the program of the centering
device Reike could be changed in the way it reduces mechanical stressing. As
of 2010 August pallets were driven against the M17 conveyor and M16 rolls
were forced to spin with the heavy pallet on it. The conveyor M16 tried to
straighten the pallet this way. With the implementation of the centering
equipment the earlier phase is unnecessary and the system could recognize
the pallet before it hits the M17 edge.
Transfer carriages TFR-7 and TFR-10 rubber emergency stopping plates
(Figure 10) could be cut from the sides in the way that they do not touch
unintentionally other components. The parameters of the sheet counter
software could be changed in a way that it accepts a bigger difference
between the theoretic amount of layers and the real amount of layers. The
scanner of the sheet counter could be re-situated in the way that it can read
the barcodes even the barcodes are little indirect.

41
The strapping device is a really old and unique machine and therefore it is
difficult to find spare parts for it. During one failure situation the machine was
opened and all the components were cleaned, which showed that most of
them were worn down. One option could be to invest into a new machine,
which could insert two straps at the same time. Some smaller modifications
could also be done. In Figure 16 there is a plate tightened by one spring,
which is an essential part when locking the two strap ends together.
Sometimes this plate is too loose and the locking cannot be completed. One
option could be to drill holes and tighten the plate with more springs.
FIGURE 16. Strapping equipment and too loose plate
The servo motor of the octopus fails due to high temperatures in the closet.
Normally it helps when the door of the closet is opened and the servo is let to
cool for a while. There is not a proper air ventilation in the closet; there are
only small holes in one side, which do not create enough air circulation.
Implementing a ventilator on the other side could add more air flow that could
cool enough the working conditions for the servo motor. As of 2010 August
there had been called for an offer to replace the octopus with a new machine.
The new machine is a different type and it is not wrapping the plastic around

42
the stack of carton, but the pallet runs toward a big plastic that is attached
when the pallet have passed by. In this type of machine there are less
susceptible components to fail. The oven is also the other equipment, which
the finishing section manager has called for an offer to replace it with a new
machine.
The previous problem described about the label robot was solved by a small
program modification. The problem was that the pallet moved away from the
sensor line. The solution was to insert a small waiting time after the sensor
pair has recognized the pallet. Now the pallet runs approximately 3 cm over
the sensor line before the logic stops the conveyor. This way it does not
matter if the pallet can move a little backwards. This is also a long time
solution and the chain of the conveyor does not have to be tightened that
often. Tightening the chain, not to let the rolls spin backwards, was another
solution, but it would not have guaranteed as good reliability as the program
change.
9.2 Condition monitoring, visual inspections and ODR
In a defined routine the operators could make visual inspections and basic
maintenance tasks for the machinery. The equipment and components that
really need inspections should be studied further, because there is no point to
loose recourses to check everything. The operators should be fully trained to
make the advantageous visual inspections, not just sent them to walk around
and look over the machines. There could be a checklist indicating all the
components that need revision solved in a way that pleases the enterprise.
The operators could make the basic preventive or corrective maintenance
tasks such as tightening chains and fasteners, lubricating components,
changing failed or probably failing parts, adding missing rivets or other
elements and cleaning also the operating equipment and components, not just
the environment. Figure 17 is an example of the strapping equipment where

43
the operators could do preventive or corrective maintenance while there are
symptoms available.
There are some predictive tasks that the operators could do. E.g. the laser
sensors on the G2 swivel did not recognize the pallet leg and the front part of
the pallet was empty and it was allowed to move too long with the result that
the pallet was tightly jammed to the cage around. This can be avoided if the
operators check that the sensors recognize the pallets from the correct height.
TFR-7 and TFR-10 positions are recognized by a laser distance meter. Many
times the system has problems to identify the transfer carriages and the
system turns to off-line mode. The operators could check the parameters and
make sure they are between the desired limits.
FIGURE 17. Examples of faults that the operators could maintain
There are some elements that should be taken into consideration if they need
preventive maintenance such as the oven. The doors of the oven are
supported firmly only above and in which case it wastes the heat. Many times
there occur problems in opening and closing the doors and the mechanical
failures could be prevented with the correct maintenance. The logic program is
one of the causes for the opening and closing problem and this needs more
studying why the problem occurs.

44
There have been tools for the operators to do basic maintenance tasks and
there have also been a mechanic only for this section, but they have been
taken away to reduce costs. This thesis is not indicating that a new mechanic
should be hired, but the maintenance skills and tools for the existing operators
could be improved. A further investigation has to be done to sort out the real
needs.
9.3 Operation procedure changes
There were cases when the automation mechanics did not have enough
useful information of the systems. All the important documents, such as circuit
designs, should be up to date to ensure the sufficient aid for the maintenance
staff. Only small failure descriptions exist in the manual diaries of the
mechanics and each writer seems to write in a way and a different amount of
information.
Taking a CMMS into use could help to improve the maintenance system in the
whole factory. After a certain time there would be much more data from the
machine problems such as running times, random and regular error rates,
downtimes, MTTF, MTTR, MTBF, OEE etc. The information could be used to
make more efficient planning of the maintenance tasks and to follow the
results of the maintenance. Taking the CMMS into use can be time and
resources consuming, but its paybacks have been said to be undeniable.
The company could change with small actions the way how the finishing line is
maintained to give a new picture that the finishing department also matters in
the bigger picture. It was seen that some operators felt the present situation
hilarious in cases when down times were high. With some actions the
motivation and teamwork could be improved.

45
10 CONCLUSIONS
None of the findings or the results was taken into action while the
experimental part was carried out. Another report was delivered to the
company and it is up to them if they consider that the solutions are worth of
trying. Therefore there is no observational information of the results. During
the project there were also carried out different layout modification
suggestions. They were to ensure more intermediate storage space on the
conveyor line without changing the general layout and sketches to change the
whole floor plan for the future investments. Nonetheless those suggestions
are not presented in this thesis, but were thought as an option to improve the
availability.
This project was carried out really independently, on a tight schedule and
without advanced special studies. This thesis involved a great amount of
communication. All the communication was carried out in Spanish, which the
writer can only speak satisfactory. These facts surely have some influence on
the results and with better language skills the findings would have been
undoubtedly more extensive. The other factor that is affecting to the results is
the fact that some functional failures, failure modes and failure effects were
undemanding to study precise enough. Therefore there can be too much
vague descriptions that need further studies.
The biggest problem in the finishing line is that there are plenty of different
kinds of small problems, such as hydraulic, electronic, pneumatic, mechanic
and IT ones. There is something failing often, which makes the working
impracticable sometimes. The machines are dissimilar devices and relatively
cheap and they do not have direct relations to profit losses and maybe
because of these reasons the finishing line plays a minor role in the factory.
There is only reactive maintenance and when another problem is fixed it does
not take a long time in general when the next failure occurs. Some of the
failures are the type that it is really hard to make preventive maintenance cost
effectively or it is not reasonable to do predictive maintenance tasks. For this
reason many problems are allowed to run-to-failure, RTF.

46
The maintenance process is suggested to have some modifications in a
couple of different ways. There were few functional problems caused by
indirect pallets, which can be avoided with a relatively cheap investment. It is
often better if there is a possibility to find solutions that do not need
investments, but in this case adding the centering equipment can reduce
notably the number of failures. This is also known as eliminating the root
cause. Other big finding was that there is no clear documentation system in
use. While having interviews each operator knew a bit about different failures
and causes for them. Also the maintenance staff diaries describing tasks done
vary a lot. There is no controlled system how each work order should be
identified and described in the diary. Thereby it is suggested that CMMS is
taken into the consideration. It was seen that the tasks were divided with the
classical world of ideas; the operator mostly just run the machines and the
maintenance staff repair them. One option to improve the process could be
dissipating the dividing the tasks between different workers. Giving proper
tools and education for the operators could in some cases hasten the
maintenance or reduce the amount of the failures.
With the latest studies it is not always the age of the machine that
automatically causes problems, but in this finishing line some of the machines
are thought to fail due to the high age. Therefore there have been made two
offers to replace the two bottleneck machines in the finishing line, because
they have reached their life time expectations. If investments could be done
freely, there would be several ways to improve the availability and reliability of
the plant. As mentioned earlier the finishing line was planned to work with
three sheeters and now there are five of them. There has also been some talk
about that there would be more sheeters coming in the future. As of 2010
August, the finishing line efficiency and effectiveness are that low that in the
future bigger changes might be needed.
One interesting point is; how important the better availability of the equipment
is for the community spirit. The workers from the section manager to the
operators emphasized the fact that the more there are problems the worse the
community spirit is. It was also easy to see that the operators did not feel their
work as important as it should be, because that much attention is not paid to

47
the finishing line from the higher levels. With small inputs the company could
change the operator’s appreciation of their work, not letting them feel that their
tasks are of secondary importance compared to the other sections of the
factory. The biggest risks why these findings would not give any real results,
such as longer equipment life time and improved efficiency and effectiveness
of the finishing line, are that the company has too fast expectations, lack of
patience and lack of discipline of the employees towards the changing
process. One major factor is that there has to be enough data from failure
history and that is why the CMMS is suggested.
It is important that the enterprise examines the findings and if necessary make
some modifications to them before implementing, which unfortunately was not
possible during the thesis project. The whole process was that fast that from
the training the writer to writing the first report took only five weeks. That is a
short time of period and it can be said that there are more ways to improve the
availability than anyone can present in a bachelor's thesis. Gullsten (2010)
indicates that the best way to implement continuous improvement is to keep
eyes and ears open. The earlier statement applied to the maintenance field
means more communication between the operators, maintenance staff and
technical managers to make better planning of the maintenance and achieving
better results on different measurements.

48
REFERENCES
Ahonen, P. 2010. Paper Machine Professor, JAMK University of Applied Sciences. Interview 21.09.2010.
Artiba, A., Riane, F. 2005. Maintenance strategies and reliability optimization. Journal of Quality maintenance engineering 11, 2, 22-82.
August, J. 2004. RCM guidebook: Building a reliable plant maintenance program. Oklahoma: Penn Well.
Barcelona Mill, 2010. Stora Enso homepage online, Accessed on 27.9.2010. http://www.storaenso.com/about-us/mills/spain/barcelona-mill/Pages/barcelona-mill.aspx
Bloom, N. 2006. Reliability centered maintenance (RCM). New York: McGraw-Hill.
Caceres, R. 2010. Finishing department manager, Stora Enso Barcelona Mill. Interview 20.07.2010.
Gullsten, P. 2010. Improving a board mill's material efficiency. Master's thesis, Aalto University, School of Science and Technology, Forest Products Technology.
Hykin, C. Operator driven reliability- who owns your mill's equipment? Accessed on 30.9.2010. http://www.idcon.com/article-operatordriven.htm
Järviö, J. 2006. Kunnossapito. Kunnossapidon julkaisusarja N:o 10. (Maintenance. Maintenance publication series) Third edition. Helsinki: KP-Media.
Järviö, J. 2000. Luotettavuuskeskeinen kunnossapito. Kunnossapidon julkaisusarja N:o 4. (Reliability centered maintenance. Maintenance publication series.) Rajamäki: KP-tieto.
Kelly, A. 2006. Maintenance systems and documentation. Oxford: Elsevier.
Kunnossapidon toiminnot ennen vian ilmenemistä. Opetushallituksen verkkopalvelusivusto. (Maintenance operations before failures. Internet page of national board of education.) Accessed on 1.10.2010. http://www03.edu.fi/oppimateriaalit/kunnossapito/perusteet_2-3_kunnossapidon_toiminnot_ennen_vian_ilmenemista.html
Leiviskä, K. 2009. Process and maintenance management. Paper making science and technology. Second edition. Jyväskylä: Gummerus.

49
Levitt, J. 2003. Complete guide to preventive and predictive maintenance. New York: Industrial press.
Mobley, R., Higgins, K., Lindley, R., Wikoff, D. 2008. Maintenance engineering handbook. 7th edition. New York: McGraw-Hill.
Moubray, J. 1997. Reliability-centred maintenance. Second edition. Oxford: Butterworth-Heinemann.
Mäki, K. 2009. Kunnossapidon toiminnanohjaus. (Maintenance operation management.) JAMK University of Applied Sciences, educational material, PowerPoint slide show.
Neuwirth, P. 2010. Condition monitoring increases availability and quality. Vibration monitoring in a Tandem Mill. Maintenance & asset management. Maintworld. 2, 10-11.
Numminen, A. 2005. Operator Driven Reliability (ODR) osana käynnissäpito- ja kunnossapitotoimintaa. (ODR, part of the maintenance actions.) Kunnossapito, 1, 32-34.
O'hEocha, M. 2000. A study of the influence of company culture, communications and employee attitudes on the use of 5Ss for environmental management at Cooke Brothers Ltd. The TQM magazine, 12, 5, 321-330.
Operator Driven Reliability. Article on SKF.com online maintenance information page. Accessed on 29.10.2010. http://www.skf.com/portal/skf/home/services?contentId=447770
Palmer, R, D. 2006. Maintenance planning and scheduling handbook. Second edition.New York: McGraw-Hill.
Saarenpää, J. 2006. Sähkölaitteiden kunnossapidon kehittäminen sinkkitehtaalla. (Improvement of the maintenance of electro-technical devices at a zinc plant.) Diploma thesis. Lappeenranta University of Technology, Electrical engineering. Accessed on 30.9.2010. https://oa.doria.fi/bitstream/handle/10024/29885/TMP.objres.476.pdf?sequence=1
Smith, A., Hinchcliffe, G. 2004. RCM gateway to world class maintenance. Oxford: Elsevier Butterworth-Heinemann.
Stora Enso in brief, 2010. Stora Enso homepage online, Accessed on 27.9.2010. http://www.storaenso.com/about-us/stora-enso-in-brief/Pages/stora-enso-in-brief.aspx
Vekara, K. 2003. Kunnossapidon hallinnon ohjelmistot Suomen markkinoilla 2003. Kunnossapidon julkaisusarja N:o 9. Kunnossapitoyhdistys. (Maintenance management systems in the Finnish markets in 2003. Maintenance publication series. Maintenance society.)

50
APPENDICES
Appendix 1. Floor plan of the finishing line

51
Appendix 2. RCM information worksheets

52
RCM Information worksheet

53
RCM Information worksheet

54
RCM Information worksheet

55
RCM Information worksheet

56
RCM Information worksheet

57
RCM Information worksheet

58
RCM Information worksheet

59
RCM Information worksheet

60
RCM Information worksheet

61
Appendix 3. Gravity table for each failure

62
Appendix 4. Criticality analysis of the failures
CRITICALITY ANALYSIS OF THE FAILURES
Safety and environment Production Maintenance
Serious accident, probableNeeds stopping or affects to
efficiency or performance
High cost of
reparation
(>10.000€) Critic
Serious accident, improbable
Affect to efficiency and/or
performance, but the failure is
improbable
Medium cost of
reparation (1.000-
10.000) Important
Little influence in safety or
environmentNo affect to the prodution
Low cost of
reparation
(<1.000€) Tolerable
If one of the answers for each failure were chosen to be important then the
gravity was also important. If one of the answers were chosen to be critic then
the gravity was chosen to be critic. If all the answers were on the tolerable
line, then the gravity was tolerable. On each answer option it did not matter
how many answers there were in the same class, just the highest ruled the
gravity class. This is fast and easy way to study criticalities of the machinery.

63
Appendix 5. RCM decision worksheets

64
RCM Decision worksheet
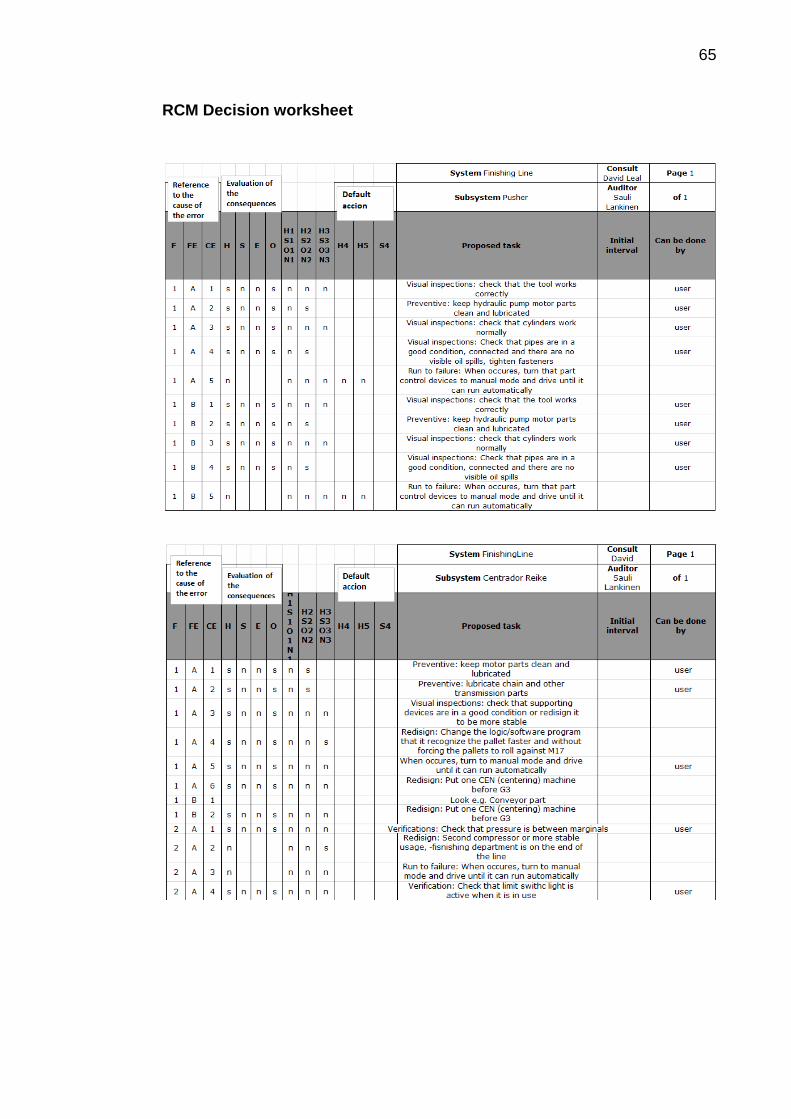
65
RCM Decision worksheet

66
RCM Decision worksheet

67
RCM Decision worksheet

68
RCM Decision worksheet

69
RCM Decision worksheet

70
RCM Decision worksheet

71
Appendix 6. RCM decision logic to evaluate consequence of a
failure