Embed Size (px)
Citation preview
i
RESEARCH AND PRODUCT DESIGN TO MINIMIZE
FOOD WASTE IN WESTERN DOMESTIC KITCHENS
A THESIS SUBMITTED TO
THE GRADUATE SCHOOL OF NATURAL AND APPLIED SCIENCES
OF
MIDDLE EAST TECHNICAL UNIVERSITY
AND
THE FACULTY OF INDUSTRIAL DESIGN ENGINEERING
OF
DELFT UNIVERSITY OF TECHNOLOGY
BY
AHMET BEKTEŞ
IN PARTIAL FULFILLMENT OF THE REQUIREMENTS
FOR
THE DEGREE OF MASTER OF SCIENCE
IN
DESIGN RESEARCH FOR INTERACTION
SEPTEMBER 2010

ii
Approval of the thesis:
RESEARCH AND PRODUCT DESIGN TO MINIMIZE
FOOD WASTE IN WESTERN DOMESTIC KITCHENS
submitted by AHMET BEKTEŞ in partial fulfillment of the requirements for the degree of Master of Science in Design Research for Interaction, Department of Industrial Design, Middle East Technical University and Faculty of Industrial Design Engineering, Delft University of Technology by,
Prof. Dr. Canan Özgen Dean, Graduate School of Natural and Applied Sciences, METU Prof. Dr. Cees de Bont Dean, Faculty of Industrial Design Engineering, TUDelft Assoc. Prof. Dr. Gülay Hasdoğan Head of Department, Department of Industrial Design, METU Prof. Dr. David Keyson Supervisor, Faculty of Industrial Design Engineering, TUDelft Assist. Prof. Dr. Owain Pedgley Supervisor, Department of Industrial Design, METU Assist. Prof. Dr. Walter Aprile Co-Supervisor, Faculty of Industrial Design Engineering, TUDelft
Examining Committee Members: Prof. Dr. Paul Hekkert Faculty of Industrial Design Engineering, TUDelft Prof. Dr. David Keyson Faculty of Industrial Design Engineering, TUDelft Assist. Prof. Dr. Owain Pedgley Department of Industrial Design, METU Assoc. Prof. Dr. Gülay Hasdoğan
Department of Industrial Design, METU Assist. Prof. Dr. Cağla Doğan Department of Industrial Design, METU
Date: 15 September 2010

iii
I hereby declare that all information in this document has been obtained and presented in accordance with academic rules and ethical conduct. I also declare that, as required by these rules and conduct, I have fully cited and referenced all material and results that are not original to this work.
Name, Last Name : Ahmet Bekteş
Signature: :

iv
ABSTRACT
RESEARCH AND PRODUCT DESIGN TO MINIMIZE
FOOD WASTE IN WESTERN DOMESTIC KITCHENS
Bekteş, Ahmet
M.S., Department of Industrial Design, METU
M.Sc., Faculty of Industrial Design Engineering, TUDelft
Supervisor (METU) : Assist. Prof. Dr. Owain Pedgley
Supervisor (TU Delft) : Prof. Dr. David Keyson
Co-Supervisor (TU Delft) : Assist. Prof. Dr. Walter Aprile
September 2010, 154 pages
The aim of this thesis is to explore design directions to minimize a food wastage
problem in western domestic kitchens. Central to the thesis is an understanding of people‟s
behavior towards the food waste phenomenon. Three interconnected studies and one design
project are included. In Study I, 18 participants were interviewed to explore their perceptions
and attitudes towards food waste, revealing the most wasted food types and reasons for food
wastage. The findings of Study I are clustered under four phases of food handling: acquisition,
preparation, consumption and storage. Study II comprised a generative session with three
users and two designers, devised to explore latent and tacit knowledge regarding food
wastage. Study II resulted in user-generated ideas for minimizing food waste, which were
analyzed so as to reveal possible design directions. From these results, a set of criteria for a
„perfect‟ kitchen appliance, which could minimize food waste, was drawn-up. The design
project took the research findings of Study I and II and devised a collection of design concepts
as possible ways to help reduce domestic food waste. Two concepts – Philips Dispense and
Canvas - are taken further because they relate to the most wasted food types: „bread‟ and
„vegetables and fruits‟. In Study III, Philips Dispense and Canvas were evaluated with a
questionnaire. According to the results, in households containing busy couples without
children, Philips Dispense is valued highest (it takes the food waste responsibility away from
users) whereas Philips Canvas was valued lower (it gives feedback on current stocks and
persuades homeowners not to waste food).
Keywords: food waste, kitchen appliances, user-centred design

v
ÖZ
BATI EV MUTFAKLARINDA YİYECEK ATIKLARINI AZALTMAK ÜZERİNE
ARAŞTIRMA VE ÜRÜN TASARIMI
Bekteş, Ahmet
Yüksek Lisans, Endüstri Ürünleri Tasarımı Bölümü, ODTÜ Yüksek Lisans, Endüstriyel Tasarım Mühendisliği Fakultesi, TUDelft
Tez Yöneticisi (ODTÜ) : Assist. Prof. Dr. Owain Pedgley
Tez Yöneticisi (TUDelft) : Prof. Dr. David Keyson
Ortak Tez Yöneticisi (TUDelft) : Assist. Prof. Dr. Walter Aprile
September 2010, 154 sayfa
Bu tezin amacı batılı ev mutfaklarında yiyecek atığı sorununu en aza indirgemek için
tasarım yaklaşımlarını incelemektir. Tez insanların yiyecek atığına karşı olan davranışlarını
anlamaya odaklanmaktadır. Bu çalışmaya birbirine bağlı üç çalışma ve bir tasarım projesi dahil
edilmiştir. Çalışma I‟de, yiyecek atığına olan tavırları ve algıları incelemek için 18 katılımcıyla
en fazla atılan yiyecek çeşitlerini ve yiyecek atıklarının nedenlerini ortaya çıkaran görüşme
yapılmıştır. Çalışma I‟in bulguları yiyeceğin işlendiği 4 farklı aşamada yoğunlaşmaktadır:
edinme, hazırlama, tüketme ve depolama. Çalışma II, yiyecek atığı ile ilgili gizli ve sözle
anlatılmayan bilginin incelenmesi için düzenlenmiş, üç kullanıcı ve iki tasarımcıdan oluşan
üretken bir oturumdan oluşmuştur. Çalışma II, muhtemel tasarım yaklaşımlarını ortaya koymak
için analiz edilen yiyecek atığının azaltılmasına yönelik kullanıcı tarafından oluşturulmuş
fikirlerle sonuçlandırılmıştır. Bu sonuçlardan, yiyecek atığını asgariye düşürebilen “kusursuz”
mutfak aleti için bir ölçüt grubu düzenlenmiştir. Tasarım projesi, Çalışma I ve II‟nin araştırma
bulgularını temel alarak ev yiyeceği atıklarını azaltmaya yardımcı olmak için olası çözümleri
içeren tasarım konseptleri derlemesinden oluşturmuştur. İki konsept – Philips Dispense ve
Canvas – en çok atılan yemek çeşidiyle (ekmek ve “meyve ve sebze”) ilgili olduğu için daha
ileriye taşınmıştır. Çalışma III‟te, Philips Dispense ve Canvas bir anketle değerlendirilmiştir.
Sonuçlara gore, çocuğu olmayan yoğun çalışan çiftler tarafından, Philips Canvas en düşük
dereceyle değerlendirilirmiştir. Canvas mevcut stok hakkında bilgi verip ev sahiplerini
yiyecekleri israf etmemeleri için ikna etmektedir. Philips Dispense ise en yüksek dereceyle
değerlendirilmiştir olup bu ürün yiyecek atığı sorumluluğunu kullanıcının üzerinden almaktadır.
Anahtar kelimeler: mutfak aletleri, yemek ziyanı, kullanıcı odaklı tasarım

vi
To my little sister

vii
ACKNOWLEDGEMENTS
If you accept the life as a chain of people and actions, it is really hard to find a person
to thank or curse. However, I am definitely sure that my deepest thankfulness goes to my
supervisory team Gijs Geleijnse, David Keyson, Jurgen Wagner, Owain Pedgley and Walter
Aprile for their guidance, advice, criticism, encouragements and insight throughout the
research. It has been an enormous pleasure to get to know you and work with you on this
project. Thank you one more time for positivity, kindness, motivation and your persevering
confidence in me and this project. I want to thank to Philips Research, TU Delft , METU
(Middle East Technical University) and IMMIB (General Secretariat of Istanbul Mineral and
Metal Exporters‟ Association) since they provide this opportunity.
Additionally, I would like to thank my friends and family for all the moral support that I
received during this project. Special thanks must go to my parents, my sister Gizem, my
friends Nuray and Koray for everything.
Finally, the technical assistance of Dr. Owain Pedgley, Dr. David Keyson and Therese
Overbeek are gratefully acknowledged.

vii
TABLE OF CONTENTS
ABSTRACT ............................................................................................................iv
ÖZ ......................................................................................................................... v
ACKNOWLEDGEMENTS ...................................................................................... vii
LIST OF FIGURES .................................................................................................xi
LIST OF TABLES ................................................................................................. xiv
1 INTRODUCTION .......................................................................................... - 1 -
1.1 Opening Position ........................................................................................... - 1 -
1.2 Problem Definition ......................................................................................... - 3 -
1.3 Objectives ..................................................................................................... - 4 -
1.4 Outline of Thesis ........................................................................................... - 5 -
2 LITERATURE REVIEW ................................................................................ - 6 -
2.1 Food and Food Waste ................................................................................... - 6 -
2.2 Food and Food Waste Models ....................................................................... - 8 -
2.2.1 Food Models .............................................................................................. - 8 -
2.2.2 Food Waste Management Models ............................................................ - 11 -
2.3 Existing Solutions to Reduce Food Waste: .................................................. - 12 -
2.3.1 Composting:............................................................................................. - 12 -
2.3.2 Industrial uses of food waste: ................................................................... - 14 -
2.3.3 Feeding Animals ...................................................................................... - 15 -
2.3.4 Feeding People ........................................................................................ - 16 -
2.3.5 Source Reduction .................................................................................... - 17 -
2.4 Previous Food Waste Studies...................................................................... - 21 -
2.4.1 Subtraction method .................................................................................. - 21 -
2.4.2 Food Waste Diary .................................................................................... - 21 -
2.4.3 Compositional analysis............................................................................. - 21 -
2.4.4 Hybrid Models .......................................................................................... - 22 -
2.4.5 Discussion of Previous Food Waste Studies ............................................. - 22 -
3 RESEARCH SET-UP.................................................................................. - 25 -

viii
4 STUDY I: EXPLORING FOOD WASTE ...................................................... - 28 -
4.1 General View .............................................................................................. - 28 -
4.2 Methodology ............................................................................................... - 30 -
4.2.1 Limitation of Study ................................................................................... - 30 -
4.2.2 Population and Sample ............................................................................ - 30 -
4.2.3 Data Collection and Procedure ................................................................. - 32 -
4.2.4 Structure of Interview and Questions ........................................................ - 32 -
4.2.5 Analysis Procedure .................................................................................. - 34 -
4.3 Results and Discussion of Study I................................................................ - 35 -
4.3.1 Individuals‟ Opinions about Food Waste ................................................... - 35 -
4.3.2 Intentionally Wasted Food ........................................................................ - 36 -
4.3.3 Unintentionally Wasted Food .................................................................... - 38 -
4.4 Findings of Study I....................................................................................... - 45 -
4.4.1 The core findings ..................................................................................... - 45 -
4.4.2 Contextual Findings ................................................................................. - 46 -
5 STUDY II: GENERATIVE SESSION ........................................................... - 47 -
5.1 Workbook .................................................................................................... - 47 -
5.1.1 Workbook Tasks ...................................................................................... - 48 -
5.2 Focusing Paper ........................................................................................... - 52 -
5.3 Focus Group Session .................................................................................. - 53 -
5.4 Discussion of Study II .................................................................................. - 57 -
6 PRODUCT DESIGN TO REDUCE FOOD WASTE ..................................... - 60 -
6.1 Design Criteria ............................................................................................ - 60 -
6.1.1 Criteria based on Study I and II ................................................................ - 60 -
6.1.2 Criteria based on project aims: ................................................................. - 60 -
6.2 Product Design Ideas .................................................................................. - 62 -
6.2.1 Philips Dispense ...................................................................................... - 62 -
6.2.2 Philips Swab ............................................................................................ - 63 -
6.2.3 Food Management Software .................................................................... - 63 -
6.2.4 Philips Canvas ......................................................................................... - 64 -
6.2.5 Philips Rapid Chopper ............................................................................. - 65 -
6.2.6 Philips Tupper Light ................................................................................. - 66 -
6.2.7 Philips Ambil-TV Software ........................................................................ - 67 -
7 STUDY III: PRODUCT DESIGN EVALUATION ........................................... - 76 -

ix
7.1 Methodology of Study III .............................................................................. - 77 -
7.1.1 Participants and Procedure ...................................................................... - 78 -
7.1.2 Evaluation of Questionnaire ..................................................................... - 80 -
7.2 Results and Discussion of Study III .............................................................. - 81 -
7.2.1 What food type do people waste most? .................................................... - 81 -
7.2.2 Results of Canvas and Dispense Against Nine Criteria ............................. - 82 -
7.2.3 Strong and Weak Aspects of Concepts and Suggestions.......................... - 86 -
8 CONCLUSIONS ......................................................................................... - 96 -
8.1 Main Findings from Chapters ....................................................................... - 96 -
8.2 Recommended Product Development Route ............................................... - 97 -
8.2.1 Relative Advantage of Dispense ............................................................... - 98 -
8.2.2 Compatibility with Values and Experiences ............................................. - 100 -
8.2.3 Complexity in Use or Understanding ...................................................... - 100 -
8.2.4 Trialability .............................................................................................. - 101 -
8.2.5 Observability .......................................................................................... - 101 -
8.3 Short Technological Feasibility Study ........................................................ - 102 -
8.3.1 Extrusion Production for Baking Bread ................................................... - 102 -
8.3.2 Electrical Motor for Slicing and Mixing .................................................... - 103 -
8.3.3 Flexibility of Silicon Moulds..................................................................... - 103 -
8.3.4 Integrated Weight Scale to Monitor Production and Consumption ........... - 103 -
8.4 Answers to Research Questions ................................................................ - 103 -
8.5 Limitations of Study and Possible Improvements ....................................... - 105 -
8.6 Further Research for Dispense .................................................................. - 106 -
8.7 Personal Reflections on Researching and Designing ................................. - 107 -
REFERENCES ............................................................................................... - 110 -
APPENDICES ................................................................................................ - 115 -
A.STUDY I – INTERVIEW FORMS ................................................................. - 116 -
B.AN EXAMPLE OF SEMI TRANSCRIBED INTERVIEW ................................ - 125 -
C.STUDY I – CLUSTERED QUOTES ............................................................. - 129 -
D.WORKBOOK TASKS .................................................................................. - 133 -
E.FOCUSING PAPER .................................................................................... - 137 -
F.ADJECTIVES FROM STUDY II-WORKBOOK ............................................. - 140 -

x
G.WEAK STRONG ASPECTS AND USER SUGGESTIONS FROM STUDY III- 141
-
H T-TEST RESULTS FOR STUDY III ............................................................. - 151 -

xi
LIST OF FIGURES
Figure 1.1: Amount of generated Waste in USA (Shedroff, 2009) ................. - 2 -
Figure 2.1: To some people, ox penis is not regarded as food ...................... - 7 -
Figure 2.2: Food Chain Model (Sobal, et al., 1998) ...................................... - 9 -
Figure 2.3: Food Cycle Model (Sobal, et al., 1998) ....................................... - 9 -
Figure 2.4: Food Network Model (Sobal, et al., 1998) ................................. - 10 -
Figure 2.5: Food Context Model (Sobal, et al., 1998) ................................. - 10 -
Figure 2.6: Modified Flow Model, adjusted and adopted from (Quested & Johnson, 2009; Sobal, et al., 1998) ................................................... - 11 -
Figure 2.7: Waste Hierarchy and EPA‟s Food Waste Hierarchy Model ....... - 12 -
Figure 2.8: Products for Composting (right- green cone; left –natural mill) .. - 13 -
Figure 2.9: Pulper Machine Example ......................................................... - 15 -
Figure 2.10: Sonextra Sustain Production Illustration (from webpage of Sonneveld B.V) ................................................................................. - 17 -
Figure 2.11: Smart Shopper (Left); One-Trip Iphone (Right) ....................... - 18 -
Figure 2.12: Salter 1460 SV (Right); PortionPal (Left) ................................ - 19 -
Figure 2.13: Jeffrey Harris Portion Plate..................................................... - 20 -
Figure 2.14: Day-Ago (right), Stayfresh (middle), ExtraFresh (left) .............. - 20 -
Figure 2.15: The food waste in the kitchens of the UK (Quested & Johnson, 2009) ................................................................................................ - 22 -
Figure 2.16: Mean average avoidable waste (kg) per week per person in households of different life stage (Ventour, 2008) .............................. - 23 -
Figure 2.17: Mean average avoidable waste (kg) per week per person in households of different life stage (Ventour, 2008) .............................. - 24 -
Figure 3.1:Research Set-Up (adapted from Visser 2003) ........................... - 26 -
Figure 4.1: Study I Filtering Questions ....................................................... - 29 -
Figure 4.2: Distribution of Participants by Household Type ......................... - 30 -
Figure 4.3: Distribution of Participants by Gender ...................................... - 31 -
Figure 4.4: Distribution of Participants by Education( wo: master degree; hbo: bachelor degree; mbo:college degree; vmbo-havo-vwo: high school; basisonderwijs: primary school) ......................................................... - 31 -
Figure 4.5: Distribution of Participants by Age ............................................ - 31 -
Figure 4.6: Clustered quotes from interviews (source: couples without kids)- 35 -
Figure 4.7: Weight of avoidable food and drink waste by food group by reason of disposal(Quested & Johnson, 2009) .............................................. - 45 -
Figure 5.1: A filled waste dairy example ..................................................... - 48 -

xii
Figure 5.2: A filled example of cooking routine task .................................... - 52 -
Figure 5.3: Set-up for the focus group session ........................................... - 53 -
Figure 6.1: Philips Dispense – provides freshly baked bread everyday ....... - 62 -
Figure 6.2: Philips Swab – gives information while consuming ................... - 63 -
Figure 6.3: Philips Food Management Software- provides shopping list with meal management ............................................................................ - 64 -
Figure 6.4: Philips Canvas- gives feedback about the amount and condition of vegetables and fruits ......................................................................... - 65 -
Figure 6.5: Philips Rapid Chopper – chops vegetables according to portion sizes ................................................................................................. - 66 -
Figure 6.6: Philips Tupperlight – reminds about leftovers using light feedback ... - 67 -
Figure 6.7: Philips Ambilight TV ................................................................. - 68 -
Figure 6.8: Philips Ambi-TV Software - gives feedback food supply in the storage units ..................................................................................... - 68 -
Figure 6.9: Detail sketches of selected concepts ........................................ - 70 -
Figure 6.10: Scenes from prepared movie clips.......................................... - 70 -
Figure 6.11: Images from Scenario of Canvas ........................................... - 72 -
Figure 6.12: Images from Scenario of Canvas (continued) ......................... - 73 -
Figure 6.13: Images from Scenario of Dispense ......................................... - 74 -
Figure 6.14: Images from Scenario of Dispense (continued) ...................... - 75 -
Figure 7.1: Philips Dispense (left) and Philips Canvas (right) ...................... - 77 -
Figure 7.2: Do you throw away food? ......................................................... - 79 -
Figure 7.3: Distributions of Household Types ............................................. - 79 -
Figure 7.4: Distributions of Genders ........................................................... - 79 -
Figure 7.5: Distributions of Age .................................................................. - 80 -
Figure 7.6: Distributions of Education ......................................................... - 80 -
Figure 7.7: Percentages of Wasted Food Types ......................................... - 81 -
Figure 7.8: Evaluation against criteria means (*= significant difference) n=28 .... - 83 -
Figure 7.9: Evaluation against criteria means (*= significant difference) n=13 (couples without kids) ........................................................................ - 84 -
Figure 7.10: Word Cloud of Canvas Strong Aspects ................................... - 87 -
Figure 7.11: Word Cloud of Canvas Weak Aspects .................................... - 88 -
Figure 7.12: Word Cloud of User Suggestions for Canvas .......................... - 89 -
Figure 7.13: Word Cloud of Dispense‟s Strong Aspects ............................. - 90 -
Figure 7.14: Word Cloud of Dispense‟s Weak Aspects ............................... - 91 -
Figure 7.15: Energy use for hamburger bread taken from (LRF, 2002) ....... - 92 -
Figure 7.16: Word Cloud of User Suggestions for Dispense ....................... - 93 -
Figure 7.17: Do you think that this concept is suitable for your household? - 94 -

xiii
Figure 8.1: Extrusion production method for pasta (above), baking bread in a water bottle ..................................................................................... - 102 -
Figure 8.2: Silicone mould by Wilton Easy Flex (left), an example slicing mechanism by Kenwood (middle), food scale by Direct Industry (right) ..... - 103 -
Figure 8.3: Detailed Model of Philips Dispense ........................................ - 108 -
Figure 8.4- Reflecting a finding (emotional connection between people and animals) to product .......................................................................... - 109 -

xiv
LIST OF TABLES
Table 5.1:Prices and Water Footprints of several food types (Hoekstra & Chapagain, 2005).............................................................................. - 50 -
Table 5.2: Frequency of mention of problem statements for the origin of food waste ................................................................................................ - 51 -
Table 5.3:Concepts created during the generative session ......................... - 54 -
Table 5.4: Results of the “how can you…?” generative method .................. - 57 -
Table 6.1: Criteria for design concept generation/evaluation ...................... - 69 -
Table 6.2: Scenario scripts for Philips Canvas and Dispense ..................... - 71 -
Table 7.1: Likert scale items for evaluation of concepts shown as movie clips ... - 78 -
Table 8.1: Comparison of buying daily bread, baking your own bread, using Dispense, and storing bread in a freezer ........................................... - 98 -

- 1 -
1 INTRODUCTION
1.1 Opening Position
Global warming and climate change problems have been discussed by several
scientists and politicians in different forums and are considered important problems that
humankind must face (Copenhagen, 2009; Kyoto, 1998). Recent studies show a
consensus that a 60-80% reduction over 1990 levels of greenhouse emission (CO2,
methane) is required by 2050 to avoid substantial climate change and global warming.
Otherwise, climate change and global warming problems are predicted to escalate to
intolerable levels (Broer & Titheridge, 2010).
In order to preserve the Earth as a self-supporting system, humanity needs not only to
reduce greenhouse emissions but also to change the general consumption behavior made
possible by fossil fuel. John R. Ehrenfeld used the metaphor of an „alcoholic man‟ to explain
the current situation of humanity and its overconsumption behavior. He stated in his book
that the over consumption behavior not only harms the environment and creates
environmental problems but it also creates unethical problems such as child labor and
working in hazardous environments (Ehrenfeld, 2008).According to him, replacing the
overconsumption patterns with the sustainable ones can help Earth to keep its self-
supporting system.
Humanity needs to understand the current situation better and is required to give
effort to change its behavior towards the Earth. Several research studies have shown that
some consumers and manufacturers have started to change their behavior into positive
moves towards the environment and ethical issues. For an example, the Dow Jones
Sustainability Group Index was founded in 1999 to track the share value of companies that
integrate both economic and environmental factors. It has managed over 8 billion
USD(investment)so far. Although the size of the managed portfolio isn‟t comparable with the
whole economic system, it shows that there are some stakeholders and consumers that care
about ethical and environmental problems. Furthermore, research carried out by ES
Magazine has shown that 75% of consumers claim to favor products with tangible
environmental advantages. In the same study it was also stated that 86% of British
consumers prefer to select products from companies that have an environmentally friendly
image (Chapman, 2005). In addition to changing their attitude towards purchases,
consumers have tried to reduce the impact of their consumption by recycling. This is

- 2 -
exemplified by inhabitants of San Francisco, a city that has reached a 70% recycling rate
(Newswire, 2008).
Although the general recycling rate amongst citizens of Western countries has
increased, it has not helped to reduce the total amount of waste because the same citizens
have increased their consumption rate. From Figure 1.1, it can be stated that US citizens
recycled approximately one third the amount of waste that went into municipal waste
systems, while the total amount of domestic waste increased to around 110 million tons in
2005 (Shedroff, 2009). Similarly, in the UK, the rates of recycling and composting household
waste per person have increased to 27%, whilst the amount of generated waste has also
increased (DEFRA, 2008).
Recent studies show that the total annual waste output of the UK, based on 2002
data, is approximately 428 million tons, of which 30 million tons is named under domestic
waste (Warp, 2002). Moreover, several studies have shown that 50% of domestic waste (9
million tons food waste, 6 million tons food packaging waste) is food and food related
packaging waste (Pocock, Stone, Clive, Smith, & M.E.L, 2008). In other words, this is the
equivalent to 330 kg food waste and 220 kg food waste related packaging waste per year for
each household in the UK or just over 6kg per food waste and 4 kg food waste related
packaging waste household per week. Therefore, it is desirable and important to find
Figure 1.1: Amount of generated Waste in USA (Shedroff, 2009)

- 3 -
design solutions that will reduce the amount of food waste and food packaging, and which
can directly change people‟s recycling rates.
1.2 Problem Definition
Food Waste is a complex problem that has economic, social and environmental
aspects. From the economic perspective, food has a value that can be exchanged with any
other goods in the global market. According to WRAP (Quested & Johnson, 2009), UK
citizens annually throw away food costing 12 billion Euro, of which 68% can be classified as
„avoidable‟. The same report also states that the each household of the UK can save up to
480 Euro every year from being more careful about food wastage. By reducing the amount
of generated food waste will enable to reduce the food waste related cost and bills since
many countries already “integrated polluter pays principle” into their waste policies.
(Linderhof, Kooreman, Allers, & Wiersma, 2001). In this policy, the more that somebody
waste, the more he needs to pay as waste collection taxes. For another example to show
the importance of food waste in economic terms, 2.2 million terajoules (equal to
Switzerland‟s total annual energy consumption) was embedded in food wasted in the USA in
2007 (Kirshenbaum, 2010).
From the social aspect, wasting food cannot be a desirable human behavior,
although it is legal. However, it can be questioned whether it is unethical or not since The
Universal Declaration of Human Rights (article 25) states:
“Everyone has the right to a standard of living adequate for the health and well-being
of himself and his family, including food.”
The FAO (Food and Agriculture Organization of the United Nations) estimated that
854 million people were undernourished in 2001-03. According to the FAO‟s report, 9 million
of these people lived in developed countries whereas 820 million lived in developing
countries. The number of undernourished people is expected to increase in the future
because of an increasing world population. The FAO report estimated that world population
will double in 50 years, meaning that to feed the global population (in 2050), agricultural
production across the globe will need to be increased by 110% to 170% (Skoet & Stamoulis,
2006).
From the environmental aspect, wasted food in landfill creates greenhouse gases,
mainly methane and CO2 that increase the pace of global warming and climate change.
According to WRAP, the total CO2 emission of food waste generated from domestic kitchens
is estimated to be 20 million tons (which is equal to 2.4% annual greenhouse gases
emission of the UK) (Quested & Johnson, 2009).

- 4 -
To summarize, it can be stated that addressing the food waste problem of domestic
kitchens can create multiple advantages from social, environmental and economic
perspectives.
1.3 Objectives
After scanning literature, it was decided that the main objective was to create a
framework for designing a product/service that can help users reduce the waste of
perishable food types in domestic kitchens of Western Countries. To achieve this goal, it
was judged that users‟ decisions and behavior during acquisition, preparation, consumption
and storage of food must be analyzed. The framework is based on these analyses and
literature findings.
In order to fulfill the main objectives, the following sub-objectives were identified.
- Conduct interviews to collect insights about users‟ waste behavior and their
perceptions of waste.
- Generative session for gathering latent and tacit knowledge (Sanders, 2001).
- Designing concepts that can reduce the amount of generated food waste.
- Evaluation of these concepts.
Furthermore, the following research questions were identified.
RQ1. Do people think that they waste food?
RQ2. What are the main reasons for people‟s wasting behavior?
RQ3. Is it possible to solve food wastage problems with the help of design thinking?
What kinds of product/service solutions are appropriate to users and their contexts?”
Throughout the entire research, a user centered design (UCD) approach was applied.
There are three interconnected studies and one design project were conducted to answer
these research questions. The overall schema of study can be seen in Figure 1.2. In Study I,
18 participants were interviewed to explore their perceptions and attitudes towards food
waste, revealing the most wasted food types and reasons for food wastage. The findings of
Study I were clustered under four phases of food handling: acquisition, preparation,
consumption and storage. With the help of study I, the food waste problem in domestic
kitchens and user behavior became clear. These results were helped to designate the Study
II, a generative session with three users and two designers, which mainly aimed to
understand latent and tacit information about the possible solution ways and reasons behind
the food waste problem. The results of Study II were used for creating a set of criteria for a
„perfect‟ kitchen appliance, which could minimize food waste, was drawn-up. Afterwards, the
design project took the research findings of Study I and II and devised a collection of design
concepts as possible ways to help reduce domestic food waste. After generating and

- 5 -
selecting possible design ideas according to this criteria list; these concepts were evaluated
by possible users in Study III that was in the form of questionnaire.
Figure 1.2: Research Set-Up adapted from (Sleeswijk Visser , Stappers, & Van der Lugt, 2005)
1.4 Outline of Thesis
The thesis continues with a literature review in the next chapter. After the literature
review, the research set-up is explained in a detailed way. Afterwards, Study I, II, design
project, Study III are explained and discussed one by one in subsequent chapters. Lastly,
the conclusions of the research are explained in Chapter 8.

- 6 -
2 LITERATURE REVIEW
This chapter deals with the problem of food wasting the possible solution are going to
be discussed from the literature. The literature review is structured into four parts. The first
one gives the basic definition about food and food waste. Although these definitions seem to
be straight forward literature shows that there are different perceptions about food and food
waste. In the second part, models about food waste and food are explained and discussed.
The following part is focused on existing product and service solutions that aim to support
the user to reduce the domestic waste. The last part discusses previous studies about
reducing food waste.
2.1 Food and Food Waste
“Starting from the trivial, in order to survive, man, like other more complex life
forms must feed himself with natural organic substances called “food”. Or, to be
more precise, the term “food” should be replaced by “edible” because the most
fundamental distinction made by man, the original Homo culinarius, divides the
world into edible and inedible, into that which may be incorporated and that which
may not.” (Falk, 1994 p.69)
Falk‟s definition can be stated as one of the most succinct food definitions. According
to his definition, food can be literally edible or inedible, but perhaps more important is
people‟s perception that food can be edible or inedible. The former case is about the
biological diet of humans while the latter case is about the cultural diet of humans (Falk,
1994). To give an example for the former case, humans are able to eat wood or some plant
types; however, people cannot digest these in-taken organic substances due to human
biological limits. Therefore, these organic substances cannot be regarded as food fit for
human consumption. As an example for the latter case, pork, beef or horse meat, each of
which are suitable for the biological diet of humans, can be regarded as acceptable food to
some people but unacceptable to others owing to religious or cultural prohibition. Thus some
groups of people prefer not to eat certain organic substances, even though those
substances pose no digestive problems. Moreover, the food preferences of humans are
determined with benefit of sensation (gustatory and representative) and cultural-
classificatory terms (legality and justification). According to Falk, the border between

- 7 -
sensation and cultural terms about food preferences can be vague and these terms
influence each other (Falk, 1994).
These sensation and cultural-classificatory terms of food preferences can be
considered to increase the amount of generated food waste in an indirect way. For instance,
while eating ox meat is acceptable for western society, eating ox penis (Figure 2.1) is not a
preferable thing for most individuals from western societies. It is defined as one of the least
preferred types according to several taste-recipe sites (Chowhund, 2010; Hunch, 2010).
Figure 2.1 shows not only that ox penis is a marketable and edible product, but also to
somebody happy to eat such a product, their purchase ($5) is almost the same price with
regular ox meat. From the view of somebody who eats ox penis, it is objectionable to label
such a product „food waste‟. However, as stated before, food preferences are built up with
cultural matters which influence the definition of food. Somebody who rejects the principle
that ox penis is a „food‟ will never accept the throwing away of this part of an ox as „food
waste‟ but, instead, will be more comfortable with the notion that the ox part is simply
„waste‟.
Figure 2.1: To some people, ox penis is not regarded as food
As with the definition of food, there are several different definitions in literature for
waste. Among these definitions, the European Directive 2008/98/EC definition was selected
for this study because this definition is legally binding according to European Union laws.
The directive defines waste as: “any substance or object which the holder discards or

- 8 -
intends or is required to discard”(European Parliament, 2008). According to this definition,
any discarded object or substance is regarded as “waste”. However, not every substance
can be named as waste, especially when it falls under the category of „organic substances‟.
These have their own recycling mechanism. For example, feeding animals with organic
substances that are removed from the human food chain is a vital component of livestock
production, which provides a value to the holder(Westendorf, 2000). Additionally, organic
substances can be advantageously used as agricultural fertilizer. In these two cases, these
organic substances cannot be named as waste since they will provide an economical benefit
to the holder. However, if these organic substances are accepted as “food”, from both
biological and cultural perspectives, then using them for downgraded purposes (i.e. feeding
to animals) can reduce the substances to ‟food waste‟.
The previous paragraphs give an overview of the wide range of definition about food
and food waste. It shows that the culture has a great influence on the users‟ perception
about food and food waste. Considering these findings, in this study, food waste is defined
as:
“an act of discarding intentionally or unintentionally any organic substances that are
accepted as ‘food’ either culturally or biologically.”
2.2 Food and Food Waste Models
2.2.1 Food Models
There are several models of food systems that are used in agriculture, food science,
nutrition and medicine to describe the position of food in the whole system. Not only having
the function of placing the food, these models are also accepted as “conceptual tools” for
thinking about the relationships between agricultural, economic, ecological, social, health
and other factors that are involved in food and nutrition (Sobal, Kettel Khan, & Bisogni,
1998). Furthermore, the same models can be used to place food waste in the context of
domestic kitchens, so their closer examination is necessary for this thesis.
Sobal and colleagues (1998) categorized the models into four main types according to
their structure and the way that they define food: Flow Model, Circular Model, Network
Model and Ecological Model. These models are explained in following paragraphs.
2.2.1.1 Flow Model
The first food system model type is named as the „Flow Model‟ (Figure 2.2), in that it
concentrates on the flow of food through a series, emphasizing movement and
transformations. Sobal (1999) used the Flow Model to divide food and nutrition systems into
the sub-categories of: Producer Subsystem, Consumer Subsystem and Nutrition

- 9 -
Subsystem. With this model, not only food but also the energy, material and nutrients can be
easily followed in the entire system. On the other hand, adding influences from outside of the
chain was challenging because the model presents a closed system (Sobal, et al., 1998).
From the perspective of designers wishing to respond to food waste problem, this model can
be helpful to illustrate in which phase individuals waste more (i.e. acquisition, preparing,
consumption)
Figure 2.2: Food Chain Model (Sobal, et al., 1998)
2.2.1.2 Circular Model
The second food system model type is named the Food Cycle (Circular Model), which
focuses on feedback mechanisms of food and nutrition system. Several studies used this
model to address concerns about the output of subsystems both in macro and micro scale -
from the harvesting of crops to water cycles. From the perspective of designers wishing to
respond to food waste problem, this model can be helpful to show the effect of composting
in households.
Figure 2.3: Food Cycle Model (Sobal, et al., 1998)
2.2.1.3 Network Model
The third type of food system model type is referred to as the Food Web (Network
Model). It focuses on the interrelationship between the operational and control points related
to food and nutrition systems. This model is used in several studies to add and subtract food
system elements into the whole food system, usually for changing or monitoring the
relationships of the new elements compared with the old ones. From the perspective of
designers wishing to respond to food waste problem, this model can be suitable for

- 10 -
monitoring the impacts of new solution in the whole food system (i.e. the food waste amount
before having fridge, after having fridge)
Figure 2.4: Food Network Model (Sobal, et al., 1998)
2.2.1.4 Ecological Model
The fourth food system model type is known as the Food Context (Ecological Model),
concentrating on relationships of food and nutrition systems with their context. The context
of food contains many internal and external factors that can alter the food system directly or
indirectly. For example, regulations of governments in terms of food distribution,
technological boundaries about food packaging can influence the food related problems.
Although it enables to show the influences of internal and external factors, the major
limitation of the Ecological Model is its lack of specificity about the structure.
Figure 2.5: Food Context Model (Sobal, et al., 1998)
2.2.1.5 Modified Flow Model
After analyzing these models and other food waste studies (Griffin, Sobal, & Lynson,
2009; Quested & Johnson, 2009; Ventour, 2008) the flow model is adopted for food waste in
domestic kitchens. According to this model, food follows a flow model that starts with
acquisition of food and continues with preparation, consumption and disposal. Furthermore,
storage has a connection with all these stages for preserving or increasing the availability of
food in the household. To illustrate the model, the food can be purchased from a food
retailer, take-away restaurant or from a garden. While some of these foods are ready to be
eaten, some of them need effort for preparation. For instance, an apple is ready to be
consumed but a potato generally needs to be peeled and cooked before being eaten. The
prepared food can be eaten in the household or it can be taken outside the household (e.g.

- 11 -
in a lunch box, for a picnic). Lastly, uneaten or rotten food can be disposed into a household
sewer or trash bin; or, it can be used as animal feed or fertilizer at home.
Figure 2.6: Modified Flow Model, adjusted and adopted from (Quested & Johnson, 2009; Sobal, et al., 1998)
2.2.2 Food Waste Management Models
There are several waste management models in the literature such as;
„muda‟(Womack & Jones, 1996); „polluter pays principle‟ (Linderhof, et al., 2001); „proximity
principle waste hierarchy‟(Department of the Environment and Welsh Office, 1995); and
„zero waste‟ (zerowaste.org). It has been observed that these waste management models
cannot always be applicable for foods waste management because some of them are not
compatible with organic substances. For that reason, researchers at some institutions have
tried to adjust the models for a food context.
The waste hierarchy pyramid is accepted as one of the important models that deal
with waste management by many researchers and organizations (DEFRA, 2008; EPA, 2010;
Pocock, et al., 2008; Shedroff, 2009). The EPA developed a model that was tailored from
the Waste Hierarchy Pyramid in order to show several ways of dealing with food waste in
general. The similarities of the original model and the EPA-adjusted model these two
models can be seen in Figure 2.7. According to the EPA Food Waste Hierarchy model,
recovery of food waste should follow a defined path for extracting the maximum benefits
from food waste which is something also valid for the Waste Hierarchy Pyramid. Moreover, it

- 12 -
can be stated (Figure 2.7) that disposal is the least favored option while generating less
waste in the first place is the most favorable option for both models.
Figure 2.7: Waste Hierarchy and EPA‟s Food Waste Hierarchy Model
2.3 Existing Solutions to Reduce Food Waste:
In the following section EPA‟s food waste hierarchy pyramid steps will be explained
and the related examples will be discussed.
2.3.1 Composting:
Composting can be defined as the decomposition of organic substances under
controlled conditions. Water and heat are released as a result of microbial activity during the
composting process. Moreover, there are four main factors that have an effect on
composting: moisture, carbon/nitrogen ratio, oxygen and temperature (El-Haggar, 2007).
The ideal percentage of the moisture content is between 40%- 60%. If the moisture
decreases to less than 40% or increases above 60%, decomposition slows down and odor
from anaerobic decomposition is emitted (El-Haggar, Hamouda, & Elbieh, 1998). During
composting, the microorganisms require carbon and nitrogen as a nutrient to grow
population. Microbes work actively if the carbon/nitrogen ratio is 30:1 and within a range of
10:1 to 50:1. One of the other factors is temperature, which has an effect on decomposition
speed. In winter the composting process is slower than in spring and summer. Moreover, the
ideal temperature varies from 32ºC to 60ºC according the species of microorganism present
in the compost heap (El-Haggar, 2007).
Although there are many different composting techniques, the main ones are Natural,
Passive, Forced Aeration and Vermi-Composting. While Natural, Passive and Forced
Aeration use almost the same method by adding some features (e.g. perforated pipes,
rotational movement) to the infrastructure; Vermi-Composting is achieved using the Red
Wiggler (Eisensia foetida) and Red Worm (Lumbricus rebellus) instead of microorganisms.
El Haggar (2007) states that under suitable aeration, humidity and temperature, worm feed

- 13 -
on organic wastes and expel their manure (worm castings) that separate soil and provide it
with aeration and drainage. It is stated that 1000 worms produce 1,000,000 worms in one
year and that the worms are odorless and free from disease (El-Haggar, 2007)(El- Haggar,
2007 p.194).
In the consumer market, there are several composting products aimed at reducing the
food waste from domestic kitchens as well as garden waste. Some of the composting
products are installed to gardens. Nature Mill (Figure 2.8) is one of the composting machines
that is designed for kitchen. By using Nature Mill, food waste can be turned to fertilizer in two
weeks. Moreover, Green Cone is another composting product that was installed to garden
instead of having a place in the kitchen environment. It was launched in 2002 in the UK
(Figure 2.8). These products have both advantages and disadvantages from different
viewpoints.
Figure 2.8: Products for Composting (right- green cone; left –natural mill)
According to the study of Bench and colleagues (2003), Green Cone has a potential
to reduce domestic kitchen waste. They stated that 15.4 kg of food waste (mainly vegetables
and fruits and peel) per month was decomposited in each Green Cone. However, 90% of
respondents of questionnaire set up by Bench, experienced at least one problem whilst
using the Green Cone. The problems occurred because of composting nature of the product.
They stated that flies, slow decay, maggots, smell, difficulty installing, rats, and poor
drainage were the main problems of Green Cone (Bench, Woodard, & Stantzos, 2003). On
the other hand, the Nature Mill Composter gives a guarantee to users about odorless
composting.
To sum up, composting solutions reduce the amount of food waste that is directed to
landfill by using the natural process of organic substances: decomposition. Although it

- 14 -
reduces the collection cost of food waste and creates an economic value to the holder, it can
be stated that it does not extract the maximum benefits from food waste. Moreover, as it is
not the most favorable solution according to the EPA Waste Pyramid, users are generally
not in favor of having a composter (Bench, et al., 2003) since it has many problems that had
been stated by Bench and his colleagues.
2.3.2 Industrial uses of food waste:
Industrial uses of food waste are placed at the second level according to EPA (Figure
2.7). Recent years, food waste is perceived as a new source for different purposes. One of
these purposes is using food waste for creating new material sources for industrial uses.
Sakai and his colleagues (2004) found a method capable of producing plastic from municipal
food waste. In their study, they state that it is possible to produce 7.0kg of PLLA (high
quaiity poly-l-lactate) from 100kg of collected food waste(Sakai, et al., 2004). Moreover, food
waste can also be used to generate energy by turning it to “Biodiesel”.
Biomass (e.g. fuel-wood, dung, crop residues, ethanol) has a history of use as one of
the major energy resource of mankind. In recent years, food waste (mainly oil, fat, grease)
has been used for producing biodiesel. The city of San Francisco will be ready to launch a
program that will use brown grease (left-over foods cooked in oil) in order to produce
biodiesel in 2011. This is an extension of the city‟s existing program, which since 2007 has
used yellow grease (oil that has been used for frying) to produce biodiesel (Allday, 2009)
Biodiesel is not the only option for generating energy from food waste. With anaerobic
digestion (i.e. in the absence of oxygen), the organic carbon in the waste can be converted
to carbon dioxide (CO2) and methane (CH4), which can then be used as an energy source.
The same method has been used for water waste, sewer and cattle manure; however, food
waste has more potential due to its higher levels of organic carbon. According to the EPA,
food waste has three times the methane production potential (376m3/ton) than biosolids
(120m3/ ton).
Methane is one of the greenhouse gases, alongside carbon dioxide, that needs to be
reduced in output if global warming is to be kept within tolerable levels (Broer & Titheridge,
2010). Capturing methane will reduce methane emission of landfills, which can be named
as an environmental benefit. Moreover, the captured methane can be used as an energy
source. For these reasons, it can be stated that using food waste for industrial uses provides
benefits from both environmental and economical aspects.
While we can accept the fact that using food waste for industrial uses creates
environmental benefits, these solutions have some limits since the initial technology and
infrastructure costs are generally high.
- 15 -
2.3.3 Feeding Animals
Instead of disposing of food waste in landfills or incinerators, food waste can be used
as animal feed. One of the earliest recorded uses of food waste as animal feed was
described by Minkler in 1914. He stated that In Hudson Country, USA, 25000 pigs were
feeding with hotels‟ and resorts‟ food waste that had been collected from New York and New
Jersey (Westendorf, 2000). In modern times, there are many “recycling and roll-off
companies” that offer free or low-cost pick-up services for food waste. To illustrate, Barthold
Recycling & Roll-off Services (EPA, 2010)has collected food from 400 customers including
restaurants, hotels and grocery stores in the area of St. Francis, Minnesota, USA.
According to the calculation of the company, customers pay 30% less to give away their
food waste instead of throwing it away. On a related point, many western countries have
changed their collection policy to a „weight pricing policy(Linderhof, et al., 2001). The
services of recycling and roll-off companies offer a better option than government collection
since they avoid costs of sending waste to landfills and incinerators (EPA 2010)
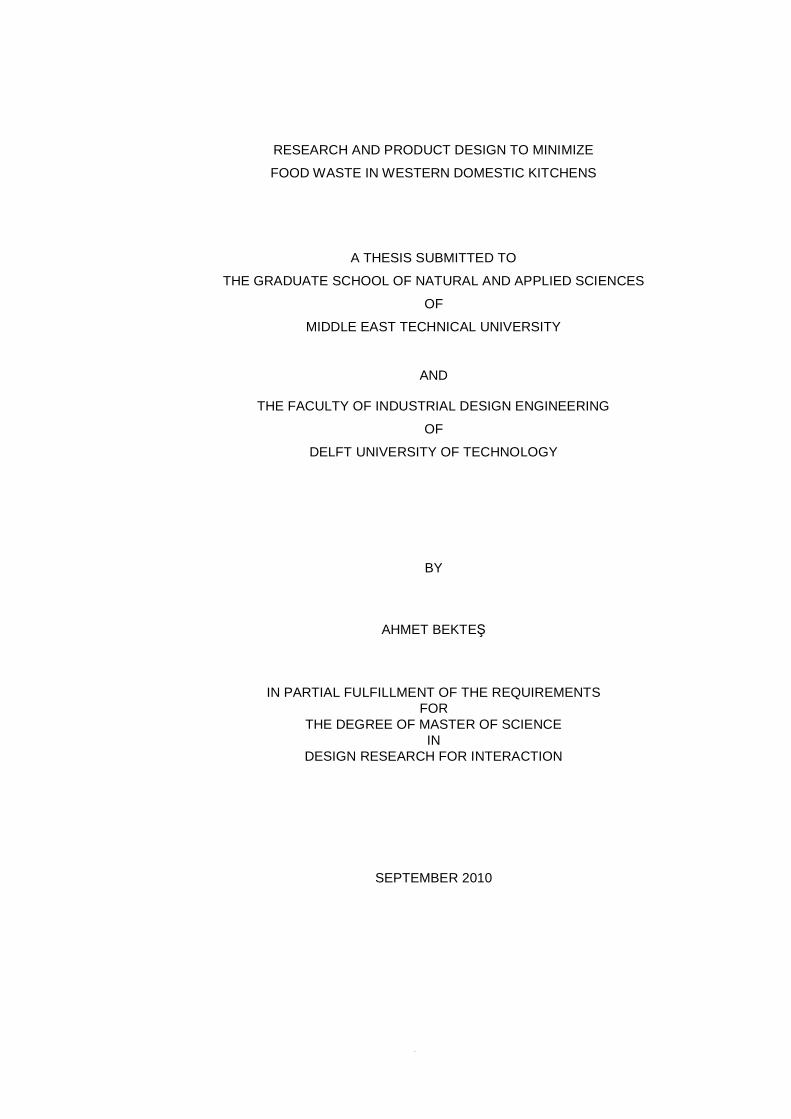
Another example is the Food Waste Recovery Program of Rutgers University(EPA,
2009), which is one of the oldest food recovery programs of the USA, still operating since its
establishment in the 1960s. Approximately 3.3 million meals are served each year in the
dining operation of Rutgers University. In 2007, Rutgers‟ partnership with Pinter Farms
saved more than $100,000 in total for both side(EPA, 2007). In their example, the food
scraps are collected into a pulper machine (Figure 2.9) that reduces the water level of food
waste, having the effect that the waste can be stored without odor and with a much reduced
volume in a cold storage. When needed, the food waste is taken from storage and collected
by farmers to feed hogs and cattle.
Figure 2.9: Pulper Machine Example

- 16 -
Although using food waste as animal feed provides economical advantages for both
the collector and the waste generator, the collected food cannot be used directly as animal
feed if it contains „meat‟. According to USA Federal Rules(United States Department of
Agriculture, 1998) (Part 166-1), food waste that contains meat and meat-based products
should be heated at 100ºC for 30 minutes under the supervision of a licensee in order to
prevent transmittable disease such as tuberculosis, hog cholera, or pseudorabies (P.
Walker, 2000). Because of concern for the safety of animal feed, companies integrated
different design solutions for killing transmittable bacteria and microbes before using food
waste as animal feed. For instance, Barthold Recycling (EPA, 2006) has been using an
integrated water-steam system that can cook food waste in a truck; in contrast, Pinter Farms
(EPA, 2009) freezes food waste in cold storage.
To sum up, using food waste as animal feed can be defined as natural reuse since the
recipient animals generally turn into food sources for society (e.g. dairy products, meat). Up
to this level of the pyramid, all solutions about food waste accept the fact that food waste will
occur and that it is somewhat inevitable. However, with proper planning and a monitoring
system, food waste can be prevented, for example by donating the food before it is wasted.
2.3.4 Feeding People
The second most favored solution for dealing with food waste is to donate excess
food to other people before it turns rotten. In western countries, governments encourage
donating food by provision of law. For instance, the USA encourages donations with the
Good Samaritan Law and The Federal Food Donation Act of 2008 by providing tax benefits
to the donor(Department of Defense & Administration, 2009)
Food can be donated to food banks and food rescue programs. There are a few
differences between these two places. For instance, food banks tend to accept food that is
relatively less perishable and, such as canned goods, because of durability. Moreover, food
rescue programs collect perishable foods such as ready and cooked meals rather than
packaged food. Donor profiles of food rescue programs are typically restaurants, cafeterias,
and catering firms, while donors to food banks are retail stores and food producers and
manufactures (EPA 2010). In the Netherlands, the Voedselbanken (food bank in the
Netherlands) accepts both perishable and non-perishable food types; however, donated
food needs to meet the appropriate guidelines of the VMA (Voedsel en Waren Autoriteit –
Dutch Food and Safety Authority) (Voedselbanken 2010).
In these examples, the donated food must be consumed before it becomes rotten or
expired. In contrast, there are a few examples that uses expired food for feeding people. For
instance, Sonneveld Group B.V(Sonneveld) launched a new bread type called Sonextra
Sustain, which uses downgraded old bread as a source for baking new bread (Figure 2.10).

- 17 -
According to their method, 1-2% of bread waste is added as sour dough to virgin flour during
the baking process. The company state that this sour dough delivers extra taste, flavor and
softness without reducing bread quality.
Figure 2.10: Sonextra Sustain Production Illustration (from webpage of Sonneveld B.V)
2.3.5 Source Reduction
The most favored option for reducing food waste is actually to prevent food being
wasted in the first place. The EPA defines solutions of preventing food waste as ‟source
reduction‟; however, this term can be open to misinterpretation. As stated Chapter 1, 854
million people were undernourished in 2001-03. Furthermore, the number of undernourished
people is expected to increase in the future because of increased world population (Skoet &
Stamoulis, 2006). For these reasons, statements and definitions concerning the prevention
of food waste will be redefined.
Essentially what the EPA defines as „source reduction‟ can be delineated as finding
the equilibrium point between food sources and consumption with the view to prevent food
waste. If consumption is equal to the food that is purchased and produced, then there will
be no avoidable food waste. The same statement is also valid for cooking and serving
processes. However, what happens in the domestic kitchen is far away from this ideal. To
illustrate, in UK domestic kitchens 2.9 million tons of food (53% of the total food waste) is
wasted because the food is not used in time (i.e. past its best before date)(Quested &
Johnson, 2009). Moreover, according to the same study, cooking, preparing or serving too
much food are other important reasons for the occurrence of food waste in domestic
kitchens. In other words, not only the acquisition phase but also consumption, preparation
and storing phases alter the amount of food waste generated in domestic kitchens.

- 18 -
In the consumer goods market, there are many products that aim to reduce the
quantity of food waste generated in domestic kitchens. The products target different phases
of the food lifecycle and can be clustered as acquisition, preparation, consumption and
storage related.
2.3.5.1 Acquisition Related Solutions
Several products and applications focus on food planning and creating shopping lists
that correspond to the actual acquisition needs of a household. For instance, Smart Shopper
(Figure 2.11) is a shopping list gadget with voice recognition that records the needs of
households. Users can record their needs and make a plan for the shopping trip. The
proposition is that having a proper list before shopping can help to reach the equilibrium
point between source and need. Therefore, the food waste can be reduced or prevented by
purchasing according to actual needs but no more. Similarly, the One-Trip iPhone
application (Figure 2.11) eases the preparation of a shopping list by focusing on purchasing
behaviors.
Figure 2.11: Smart Shopper (Left); One-Trip iPhone (Right)
2.3.5.2 Preparation Related Solutions
Although some food types are ready to be consumed, generally food needs some
level of preparation before it is consumed. During this phase, it is quite possible that more
food can be prepared than is actually needed. In this case, the prepared food can be
preserved as a „leftover‟ for consumption on a later occasion. Or, it will be thrown away. As

- 19 -
stated before, cooking or serving too much food is one of the main reasons for food waste in
domestic kitchens. Therefore careful attention to correct portion sizes is essential during
preparation if waste is to be avoided.
Figure 2.12: Salter 1460 SV (Right); PortionPal (Left)
In the marketplace, there are several products that concentrate on obtaining
appropriate portion sizes of food. For instance, the Salter 1460 SV Nutritional Dietary
Computer Scale (Figure 2.12) is a product that not only weights and measures the food
quantity but also helps to track eating behaviors in order to change people towards more
healthy habits. For that reason, a dietary computer was embedded into the device. In
another example, PortionPal (Figure 2.12) is a cutting board which has graphical elements
that show the actual food need of an average adult. With these products, the amount of
prepared food can be controlled, thus helping to prevent food waste.
2.3.5.3 Consumption Related Solutions
Food scraps from served dishes are also one of the main sources of food waste in
domestic kitchens (Tom and Hannah, 2009). On a related matter, people can intentionally
prepare excess food so that they have leftovers for the next day. To this end, it is possible to
conceive of products that help achieve appropriate food portioning in a consumption context.
For example, the Jeffrey Harris Portion Plate (Figure 2.13) has graphical elements printed
onto the plate surface that gives clues about the nutrition needs and relative portion sizes of
different food types for an average adult.

- 20 -
Figure 2.13: Jeffrey Harris Portion Plate
2.3.5.4 Storage Related Solutions
There are several products that concentrate on preventing food waste during the
storage phase. Whilst some of these products try to extend the life of food, others provide
„reminder‟ functions to people that they have food to be consumed. Day-Ago (Figure 2.14) is
a reminder product that counts the days since storing food leftovers and opened canned
food. This information is provided to user via the screen.
Another storage solution is named StayFresh (Figure 2.14) (Lakeland, 2010) which is
a kind of fridge bag that reduces the natural aging of food by reducing moisture content and
killing bacteria with the help of special materials.
ExtraFresh (Figure 2.14) uses chemical disks containing potassium permanganate
(KMnO4) to absorb ethylene gases. Lowered presence of ethylene gases has been shown to
extend the life of vegetables and fruit (ExtraFresh).
Figure 2.14: Day-Ago (right), Stayfresh (middle), ExtraFresh (left)

- 21 -
2.4 Previous Food Waste Studies
In literature, several studies tried to estimate the food waste stream and amount of
generated food waste in particular context or national wide by using different methods
(Griffin, et al., 2009; Hall, Guo, Dore, & Chow, 2009; IGD, 2007; David Johnson, Neil Hipps,
& Simon Hails, 2008; Kantor, Lipton, Manchester, & Oliveira, 1997; Quested & Johnson,
2009; Ventour, 2008). These methods can be clustered as compositional analysis, diary
keeping and subtraction method (Quested & Johnson, 2009).
2.4.1 Subtraction method
Subtraction method can be defined as measuring the difference between total food
acquisition and consumption of food, and assuming that the difference is waste and stored
food. After subtracting stored food from this difference, food waste can be defined precisely.
This method has been used at a macro scale, such as defining the food waste of a city.
Griffin and his colleagues used this method to find the amount of generated waste In
Upstate (population 97.000) in U.S. (Griffin, et al., 2009). Moreover, some studies modified
this method in order to estimate the total waste of U.S (Hall, et al., 2009; Kantor, et al., 1997)
2.4.2 Food Waste Diary
Food waste diary is another method that has been used in many studies (Baqtiste,
2007; David Johnson, Neil Hipps, & Simon Hails, 2008; Quested & Johnson, 2009). In this
method, a sample group from a population keeps a log file of wasted food on a daily basis.
Generally, researchers try to estimate the amount of food waste of whole population by
using these gathered data from diaries. Studies that make use of a diary have limitation such
as the response rate of participants which can distort the results.
2.4.3 Compositional analysis
It can be defined as combining several food waste collecting systems into one source
in order to analyze a total waste stream. At least two studies (conducted by EPA and
DEFRA) have used this method; however, they were unable to measure the exact amount of
waste since they found that some of the food waste could not be monitored. To give an
example, food waste also could be disposed into a sewer, which generally connects with
sanitary sewerage. In this case, food waste mixes with fecal materials. Moreover, food waste
also can be used as pet food or composting in people‟s gardens (Westendorf, 2000) which
makes it difficult to trace the exact amount of food waste from a household (Quested &
Johnson, 2009).
- 22 -
2.4.4 Hybrid Models
Some studies have combined these three outlined methods in order to reach a more
accurate estimation of domestic food waste (e.g.(Quested & Johnson, 2009; Ventour,
2008)). Therefore, the result of this study is explained not only because it is the most
accurate but also it was conducted in a Western Europe Country (UK) and newly done.
2.4.5 Discussion of Previous Food Waste Studies
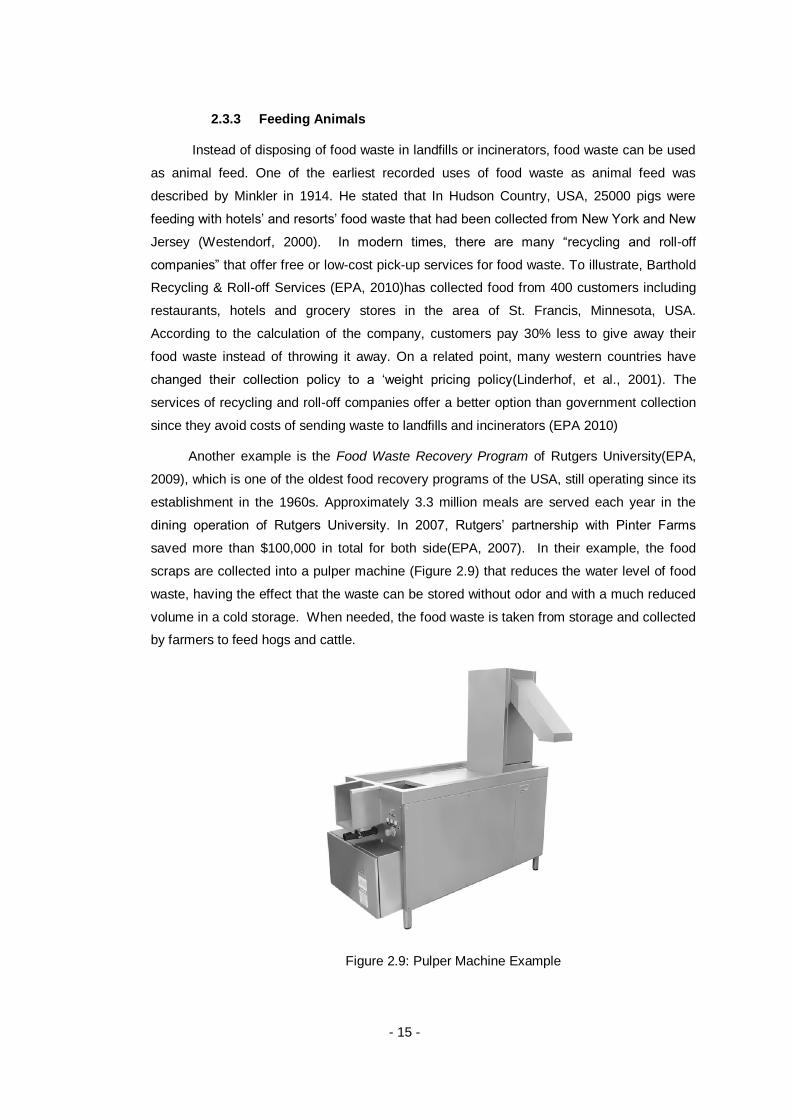
According to the findings of these studies, there are several types of foods that were
wasted more than the others. The results can be seen in Figure 2.15. According to this
chart, the vegetables and salads are the most common wasted food type in domestic
kitchens. Drinks and fresh fruits come after vegetables and salads. Bakery and prepared
meals followed fresh fruits in an order. Additionally, this study divided food waste as
avoidable (food is still edible), possibly avoidable (edible for some people but not for some of
them) and unavoidable (inedible parts like bones, peelings). From the perspective of
avoidable waste, vegetables-salads (16%), bread (13%), egg (12%) and meals (12%) have
the same weighted percentages. All these food types can be clustered as perishable food
types since they have close expiring dates(Quested & Johnson, 2009).
Figure 2.15: The food waste in the kitchens of the UK (Quested & Johnson, 2009)

- 23 -
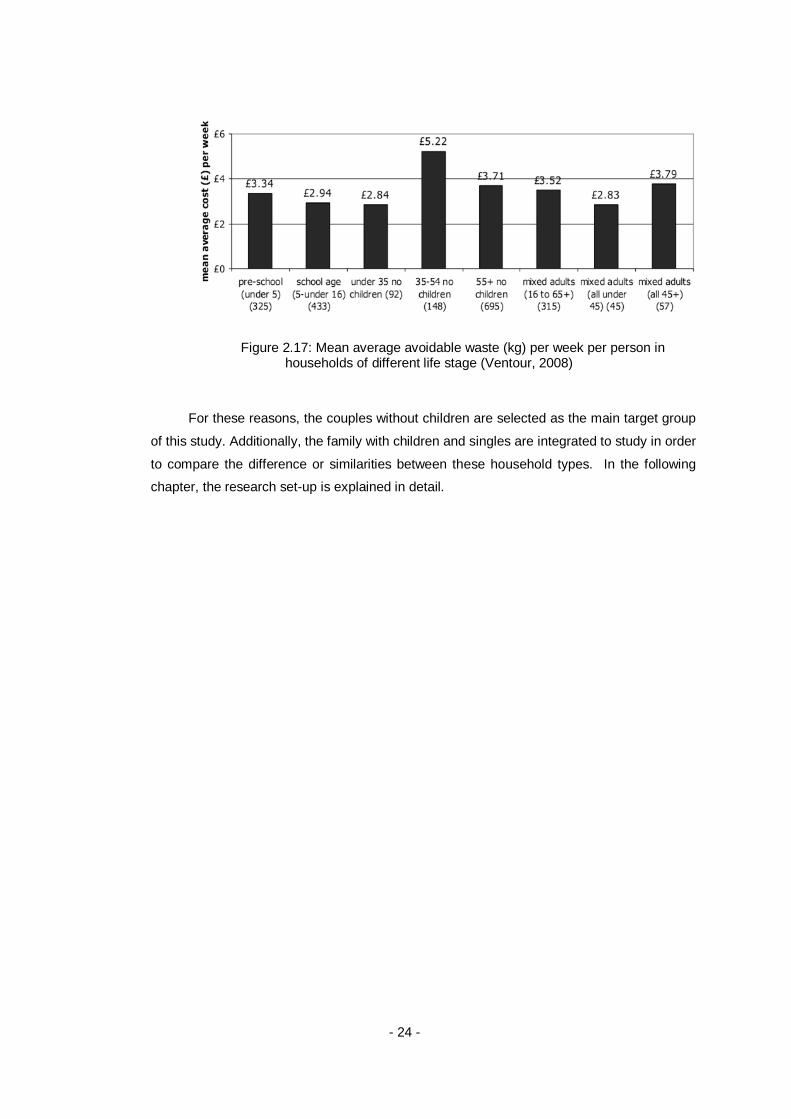
Ventour‟s study clustered the food waste according to many variables including
household types, ethnicity, gender, age, job status. According to its result, the household
size, age and household composition have higher correlation with food waste than ethnicity,
job status. He stated that the waste amount increases with the household size. In other
words, the higher the number of occupants in a household, the greater amount of food waste
generated. However, this increase is not linearly proportional; the average four-person
household waste is less than two times the average two-person household waste.
Ventour compared the household types in terms of the amount of generated avoidable
waste (Figure 2.16). According to the results, households without children, all adults less
than 35 ages waste 2.1 kg avoidable waste per week per person which is the highest one if
it is compared with the other ones. Moreover, the study of Ventour shows the economic
value of avoidable food waste (Figure 2.17). From this perspective, the households without
children, all adults aged between 35-54 wastes avoidable food that has value of 5.22 GBP
(6.05 EUR) per week(Ventour, 2008).
Figure 2.16: Mean average avoidable waste (kg) per week per person in households of different life stage (Ventour, 2008)
- 24 -
Figure 2.17: Mean average avoidable waste (kg) per week per person in households of different life stage (Ventour, 2008)
For these reasons, the couples without children are selected as the main target group
of this study. Additionally, the family with children and singles are integrated to study in order
to compare the difference or similarities between these household types. In the following
chapter, the research set-up is explained in detail.

- 25 -
3 RESEARCH SET-UP
As stated in Chapter 2, several about food waste (Griffin, et al., 2009; Kantor, et al.,
1997; Quested & Johnson, 2009; Ventour, 2008) are focused on the amount and type of
food waste in domestic kitchens in real life. As stated in Chapter 2, the couples without
children are the main target group of this project because they generate the most avoidable
food waste per person from the other household types (Ventour, 2008). However, singles
and immediate families are also accepted as participants for comparing the behaviors and
defining the significant differences.
No previous studies have focused on the mindset of people when wasting food, nor
about individuals‟ perception of food waste as an issue to be contended with in domestic
kitchens. Therefore, the perception of individuals and the reasons of food waste are the
focus for the research contained in this thesis. There are several reasons behind this
decision.
Firstly, the wastage of food is not an illegal action and people can be considered free
to waste. Accordingly, people can waste food intentionally. To illustrate, if an individual does
not like the taste of a recently purchased fruit, he/she can throw it away even though it will
still be considered edible by somebody else. Such behavior will be named as „intentionally
wasting food‟ during this research. If the reasons for intentionally wasting food are known,
then design thinking can find be used to reach solutions to reduce food waste in domestic
kitchens.
Secondly, some individuals may not aware of their food waste stream nor of the
amount of waste that they generate. In that condition, product and service solutions that
arise from design thinking can help to create within people an intention to reduce their food
wastage, for example by showing and/or monitoring the food waste stream and inducing
behavioral change built on guilt, shock, surprise etc. However, people‟s opinion about these
solutions again must be known, since any new product or service must be acceptable to the
targeted users.
Thirdly, some people cannot reduce their food waste even if they are aware of what
they waste as food. To give an example, an individual can forget a head of lettuce in his/her
fridge. The lettuce becomes inedible and must be thrown away before it contaminates other
perishable food. Such behaviors will be named as “unintentionally wasting food” during this

- 26 -
research. In that condition, the reasons for food being unintentionally wasted need to be
analyzed so as to point to possible ways to reduce food waste.
Although food waste can be grouped in the broad categories of intentional and
unintentional food waste (CR: prompted, unprompted)(IGD, 2007), it is the reasons for the
food waste that are most important to uncover. To understand why food is wasted in
domestic kitchens, the research reported in this thesis was set up with a structure described
in Figure 3.1. To examine the underlying issues in detail, it can be seen that the research
contained four interconnected sub-studies (Study I Interview Sessions; Study II Generative
Session; Concept Generation; and Study III Concept Evaluation).
Figure 3.1:Research Set-Up (adapted from Visser 2003)
In Study I, the opinions of individuals about food waste were gathered through
interviews. In the interview sessions, questions regarding food acquisition, preparation,
consumption and storing behaviors of individuals were posed, each of which were
considered as influences on an individual‟s waste behavior. However, the information that
could be obtained through interviews was more likely to show what individuals think and say
about food waste, and would not necessarily document the individuals‟ actual wastage.
Sanders (2001) stated that the interview data can be defined as explicit information. From
the perspective of product and service design, this information alone cannot lead reliably to

- 27 -
an effective solution to reduce food waste. For this reason, a generative session (Study II)
was devised to follow Study I, during which tacit or even latent knowledge regarding food
waste was intended to be uncovered (Sanders, 2001; Sleeswijk Visser , et al., 2005).
Through a combination of the results of Studies I and II, the waste behaviors and reasons
behind those behaviors could be determined. In turn, the gathered information was used to
help conceive and develop design solutions (Concept Generation) towards the food waste
problem in domestic kitchens. To complete the research, Study III was undertaken, not only
to evaluate whether the concepts would be effective in reducing food waste but also to
check whether the concepts would be generally suitable for the target users and their
environment.
From the arguments presented in this chapter, the main research questions to be
answered in this study are as follows.
RQ1. Do people think that they waste food?
RQ2. What are the main reasons for people‟s wasting behavior?
RQ3. Is it possible to solve food wastage problems with the help of design thinking?
What kind of product/service solutions are appropriate to users and their environment?”

- 28 -
4 STUDY I: EXPLORING FOOD WASTE
Chapter 4 is composed of four main parts. In the first part, general information about
Study I is presented. In the second part, the methodology of Study I is explained from
several points. In the third part of the chapter, the results of Study I are presented with
quotes from participants. The last part of the chapter comprises discussion and final
findings.
4.1 General View
As stated in Chapter 3, individuals can waste food intentionally and unintentionally.
Study I was devised to discern the behaviors of individuals falling into these two categories.
However, some individuals may not be aware of what they waste, whilst others may not
waste any food at all. To take these points into account, a filtering function was added to
Study I for selecting the participants.
In Figure 4.1, this filtering function is displayed as a flow chart. According to this chart,
participant candidates were asked whether or not they waste food. Candidates who
answered “no” to this question were not selected as participants for Study I, even though
they might not have been aware of their waste behavior. Furthermore, for such candidates, it
is hard to determine whether they really do not waste food or whether they are not aware of
their food waste behaviors.
In fact, candidates who answered “no” to first question can be clarified by installing
monitoring systems (sensors, RFID etc.) into their households in order to track food storage,
consumption and disposal. However, the data generated by such infrastructure may be
distorted, since food waste can be disposed of in locations outside of the household and
therefore out of range of monitoring. We decided to instead to simply exclude from the study
the candidates who answered “no” to “do you waste food?”.
Candidates who responsed with a “yes” to the first question became the participants
of Study I. With the second question, we tried to divide participants‟ behaviors into
intentional and unintentional food wasting. Afterwards, the participants were asked several
questions to learn whether food wastage is really a problem according to their perception.
These questions were as follows.

- 29 -
- Do you remember what kind of food did you throw away last week?
- How can the food waste problem be solved? Do you think that it can be
solved with regulations and education? Or, can it be solved by the help of
products or services?
- Do you think that food waste is our individual problem? Can we solve it by
changing our behaviors such as planning skills?
After these questions were asked, participants were requested to answer several
questions about their acquisition, preparation, consumption and disposing behaviors, in
order to gather explicit knowledge about the issue. These questions are explained in detail in
section 5.2.4.
Figure 4.1: Study I Filtering Questions

- 30 -
4.2 Methodology
In this section, the methodology of Study I is explained briefly under five subheadings:
“limitation of study”, “population and sample” “data collection procedure and tools” “structure
of interview and questions” and “analysis procedure”.
4.2.1 Limitation of Study
Study I was structured in order to gather more qualitative data than quantitative. For
that reason, 26 interview questions were prepared to comprehend any behavior that could
be the reason for food wastage in domestic kitchens. Since there were many questions,
some of the questions were skipped by the researcher in some interview sessions. The
reason of this skipping can be explained because of lack of time and irrelevancy to the
participants. This flexible structure to the interviewing can also be named as a limitation of
Study I.
Secondly, before commencing the interview sessions, it was discovered that “waste”
has a negative meaning that might encourage participants to answer dishonestly. To prevent
this, at the outset, participants were kindly informed about interview procedure with a
consent form. Additionally, “throwing away food” had been used instead of wasting food for
the early interview questions since it has less negative meaning according to the pilot test.
4.2.2 Population and Sample
The participants (n=18) were, Philips employees, in Philips Research High Tech
Campus (HTC) at Eindhoven, who lived in the Netherlands. Probability sampling method
was used to select these participants by the help of internal mailing lists of Philips.
Participants‟ demographic distributions can be seen in Figures 4.2 to 4.5.
Figure 4.2: Distribution of Participants by Household Type
49
50
5
10
15
SINGLE COUPLE FAMILY

- 31 -
Figure 4.3: Distribution of Participants by Gender
Figure 4.4: Distribution of Participants by Education (wo: master degree; hbo: bachelor degree; mbo:college degree; vmbo-havo-vwo: high school; basisonderwijs:
primary school)
Figure 4.5: Distribution of Participants by Age
10 8
0
5
10
15
FEMALE MALE
14
2 202468
10121416
1
106 1
0
5
10
15
<25 25-34 35-44 45-59 60-74 75+

- 32 -
4.2.3 Data Collection and Procedure
Before starting Study I, a pilot test was conducted on 15 April 2010 with one Philips
Researcher. There were no significant changes needed after the results of the pilot study
were evaluated, except some wording corrections and a few changes in the organization of
the items for the interviews. Collection of Study I started on 16 April and finished on 30 April.
The study was conducted in a meeting room at Philips HTC. Each interview session
was around 50 minutes and the environment of session was quiet and well-lit. During the
interviews, note taking and voice recording were selected as data collection tools. All the
recorded interviews were transferred to a digital format.
4.2.4 Structure of Interview and Questions
At the beginning of each session, a brief description of the study objectives was
explained to the participants by giving a consent form. Participants were requested to sign
this consent form before starting the interview.
The interview sessions continued with another document that was mainly prepared for
gathering demographical data of participants. After the form was filled, the interview
questions were asked in a set order: general questions, shopping related questions, cooking
related questions, consumption related questions.
As stated in 4.1, the questions in the first part were for receiving acknowledgement
from participants about whether or not food waste was really a problem for them. These
questions were as follows.
- Do you remember what kind of food you threw away last week?
- How can the food waste problem be solved? Do you think that it can be
solved with regulations and education? Or it can be solved by the help of
products or services?
- Do you think that food waste is our individual problem? Can we solve it by
changing our behaviors such as planning skills?
In the second part, questions related to shopping behavior were asked, as follows.
- How often do you go grocery shopping?
- Do you use any vehicle (bike, car, bus...) to go there or do you go on foot?
- Before shopping, what do you take from the home? Shopping bag, key,
phone…
- Do you plan what are you going to buy before going shopping?
- What do you generally buy in every grocery shopping?

- 33 -
- Do you go to local marketplaces or do you prefer to go to retail stores?
- After finishing grocery shopping, how do you store foods?
- Do you put vegetables in plastic bags or do you put them without any
package?
- Is your refrigerator always full?
The aim of asking these questions was to gather enough information about acquisition
behaviors of individuals. In addition to this, some of the questions were related to storage
behaviors of individuals. In the third part of interview, questions related to food preparation
were asked, as follows.
- How often do you cook in your home? Which meal do you eat more often
than the others?
- Do you like to cook? Is there any difference between cooking for you and
cooking for somebody? Is it a hobby or a duty?
- Do you plan before starting cooking? And how do you decide what you
are going to cook? Why don’t you want to cook?
- Do you burn any food during cooking? Do you remember when it was?
- If you are cooking, can you give more information about your cooking
process?
- Do you use any scale and portion measuring products during your cooking
process?
- Do you tend to use vegetables as an ingredient to every meal? Or do you
use another food type? What is the reason of it?
The preparation related questions were asked to detect behaviors that might increase
the amount of food waste in domestic kitchens. In the fourth part, participants were
requested to answer questions related to their food consumption behaviors, as follows.
- Do you scrap leftovers after finishing your dinner? According to you, what
is the main reason of throwing away that food?
- How do you serve food? Is it equal for everyone or do you try to adjust it
with your experience?
- Are there any differences between eating alone and eating with somebody
from the point view of wasting food?
- Do you think that there is a taste difference between fresh food and frozen
food?
- Is there any difference between a freshly cooked meal and waited
leftovers?
- Do you put your leftovers to your refrigerator after finishing your meal?

- 34 -
- Do you compost the leftover food that you didn’t like? Do you give it
someone or to animals?
In the last part, participants were asked to fill another form that asked about which
food type they perceived to waste the most frequently than others. Each participant identified
the top three food types that they wasted, the reasons for the wastage and possible
solutions to avoid it. The form continued with vegetable-fruit sheets, to gather more detailed
data about what kinds of vegetables and fruits were wasted more than others. The last
question of the interview session was as follows.
- If there is a product solution that has a function of reducing your food
waste, would you want to buy it? If yes, how much would you want to
spend on it?
The example consent and other forms can be found in Appendix A.
4.2.5 Analysis Procedure
After gathering data for Study I, the answers of participants were semi-transcribed(
question by question) and labeled with keywords such as (frequency of shopping, having
shopping list, food preferences (picky, efficient, freshness, compositing, leftover usage,
dream, animal feeding) in order to ease clustering process. A semi-transcribed document
can be seen as an example at Appendix B. Afterwards, labeled answers were written onto
Post-It notes with participants‟ number. After writing the Post-Its, they were clustered
according to household types (as seen in Figure 4.6). The high-resolution clustered photos
can be found in Appendix C.

- 35 -
Figure 4.6: Clustered quotes from interviews (source: couples without kids)
In addition to this, the demographical information and the rankings of the most wasted
food type were transferred into a Microsoft Excel document. This document was used for
calculating frequency and percentages of selected food types.
4.3 Results and Discussion of Study I
In the following sections, the results of Study I are presented under three sub-
categories, “individuals‟ opinions about food waste”, “intentionally wasted food” and
“unintentionally wasted food”. Moreover, the reasons of unintentional food waste are divided
into four sub-elements that are “acquisition related”, “preparation related”, “consumption
related” and “storage related”.
4.3.1 Individuals’ Opinions about Food Waste
After conducting Study I, it can be clearly stated that participants do not want to waste
food in general, and they try to reduce the amount of food waste in their kitchens. Out of 18
participants, 14 agreed that wasting food is an undesirable action, whilst 4 found throwing
food away acceptable for several reasons.
As stated in the literature review (section 1.3), the definition of food and waste
changes from author toauthor . The same phenomenon can be seen also in Study I. For

- 36 -
instance, PN13 (=participant number 13) stated that if wasted food ends up in the
composting (green) containers provided by the government, it implies that thrown food
cannot be named as „waste‟ since it will find a new use in the garden. In contrast, giving food
to birds on a river was defined as food waste by PN15, since these birds do not give back
any utility. In addition to this, giving food to animals was not accepted as food waste by 15
participants.
Another result that was found through Study I is that individuals accepted the
importance of education and regulation regarding food waste. They stated that the amount
of food waste of society can be reduced by educating people. Additionally, more than half of
the participants claimed that they tried their best not to waste food but accepted the fact that
it was part of their daily kitchen habits. Moreover, some participants accused other members
of their household as the source of food waste. Similarly, some participants accused other
households for wasting food.
Most of the participants thought that the problem occurred due to a lack of food
planning skills, not only in the acquisition activity but also during preparation and
consumption. According to participants, the cheapness and availability of food weakens the
need to build a plan for food.
Lastly, according to the result of Study I, it can be stated that bread, fruits and
vegetables, were the most wasted food types for couples without kids and single households
while leftovers, fruits and vegetables were the most wasted food types for immediate
families. Meat was the least wasted food for all types of households.
In the next sections, reasons for participants‟ intentional and unintentional food waste
behavior are presented.
4.3.2 Intentionally Wasted Food
As mentioned in the previous section, it can be clearly stated that people generally do
not want to waste and they try to reduce food waste: 14 out of 18 participants disliked
throwing away food. However, some of the participants sometimes intentionally wasted food
for several reasons including taste and reliability. PN 01, PN 10 and PN10 explained their
own cases.
PN16 - “… Sometimes onion, when it is half, it stays in the fridge… Instead of
using half, I cut a new one because it is fresh and onion is cheap….”
PN10 - “… Yes, I throw away… mainly leftovers but it depends on the meal...
Pasta and Potatoes.. You can reheat them but I don’t like taste of them, I just
throw them away...”

- 37 -
PN01- Sometimes old bread... [Why?] Because it is old and I don’t like old bread. I
sometimes give it to the birds or throw it away…I don’t eat the end part (first-last
slices) of the bread...
According to these quotes, it can be stated that some individuals can waste food while
seeking quality and freshness in their food choices. In other words, food waste is not a
priority of these individuals in their food related decisions. For instance, PN16 rejects to use
half an onion since he prefers to eat a fresh one. Additionally, the price and availability of
onions makes the wasting behavior easier for PN16. PN10 throws away food even if she
knows that they are still edible; she says that instead of eating leftover pasta and potatoes,
she prefers to cook a new fresh batch since she doesn‟t like the taste of leftovers. As with
onion and pasta, bread has the same fate. PN01 and four additional participants stated that
they did not like to eat the end slices of bread. In these three examples, intentionally wasted
food types can be defined as cheap and highly-available food types. The cheapness and
high availability of food may trigger people to engage in a „highest quality and freshest food‟
behavior that has a negative effect on food waste behavior.
Just as cheapness and high availability of food have a negative effect on food waste,
so the visual appearance of food can be another reason that people throw food away
intentionally, especially for fruits and vegetables. To give an example, four participants
stated that the visual appearance of food can be a reason for wasting food because they
linked it to the reliability of that food. Related quotes for this problem can be seen below.
PN10 – “...I am picky about food... You can understand from its appearance... It
seems dry…”
PN01 – “I don’t eat oranges if it is not nice, I gave it to my boyfriend...”
PN12 – “It (throwing away) happens with banana… It doesn’t seem nice
anymore...”
From these quotes, it can be stated that the visual appearance of food can reduce the
desire of consumption. If the food appearance is below somebody‟s acceptable level of
edibility, then intentional food wastage turns to a tolerable act (even though they do not like
to waste). Moreover, this acceptance level of users is subjective and can be different not
only from sub-culture to sub-culture but also from individual to individual. PN01‟s quote is
useful for showing the subjectivity of food acceptance levels for individual people. With a
deeper explanation, it is revealed that PN01 does not want to eat bad looking food, but her
boyfriend has no problem to eat it. The same behavior can be seen during preparation.
While some participants do not use pullulated (having pop-outs) potato, some of them use it
in their meals without any problem.

- 38 -
As stated in the previous paragraph, the visual appearance of food can have an effect
on the perceived reliability of food. This negative effect can also increase the rate of
intentional food waste in domestic kitchens. PN10 remarked on the reliability of food as an
important reason of intentionally wasting food by giving olives as an example (even though
she knew that they were still edible). Moreover, wasting food intentionally due to visual
appearance, taste and smell can be connected to the behavior of finding a “good” food. In
literature, there were several studies that investigated the correlation between Olfactory and
Visual Sensation Systems (Dematte, Sanabria, & Spence, 2006; Schifferstein & Tanudjaja,
2004 ). Dematte and colleagues conducted a study that participants had to answer rapidly to
a random sequence of odors (mint –strawberry) and color patches (pink-turquoise) which
was presented via computer screen. They stated that participants responded significantly
more rapidly and accurately to odor-color pairings (pink – strawberry) compatible than to
those having no association( green-strawberry) (Dematte, et al., 2006). According to their
findings, the visual system and olfactory systems can be considered as connected.
To sum up, the physical condition of food is the main reason for people intentionally
wasting food; however, this problem is not impossible to solve. This problem can be
overcome by changing the acceptance level of users, keeping the qualities of food or adding
desired qualities to food. These possibilities are discussed in chapter 6 (design concepts).
4.3.3 Unintentionally Wasted Food
Although some participants stated that they waste food intentionally, in most cases
participants throw away food unintentionally and they dislike this situation. Unintentionally
wasted food will be discussed under four sections: acquisition, preparation, consumption
and storage.
4.3.3.1 Acquisition Related Reasons
According to Study I, it can be stated that acquisition decisions have great influence
on the occurrence of food waste. The amount of acquired food and frequency of shopping
are the main variables that have effect on food waste in domestic kitchens. As stated before,
the food stream in domestic kitchens can be equated as follows.
Acquired Food = Storage + Consumption + Waste (4.1)
Acquired Food - Storage - Consumption = Waste (4.2)
With this equation, it can be stated that the less difference there is between the
acquired foods (purchased or produced food) and the sum of consumed and stored food, the

- 39 -
less food waste there will be. Therefore, the quantity of acquired food is an essential variable
that can prevent food waste in domestic kitchens, since it is the source of both waste and
consumption.
According to the results of Study I, many participants agreed that they generally
purchase more food than their actual need. Moreover, a combination of this behavior and
the food types that have a short life cycle sharply increases the amount of food waste.
The amount of acquired food depends also on the frequency of shopping. As found in
Study I, some participants follow a different path from others. In relation to frequency of
shopping, participants‟ behavior can be clustered as „daily based‟ shoppers (5 participants),
„weekly based‟ shoppers (11 participants) and „hybrid (mixed)‟ shoppers (2participants) . In
the following section, these behaviors are explained individually.
4.3.3.1.1 Daily Based Shoppers
Firstly, the daily based shoppers go shopping more frequently than other shoppers.
They generally go shopping after work and they decide what they are going to eat once they
are in the shopping environment, by comparing price, quality and portions of food. In other
words, daily based shoppers are influenced by sales offers of retail stores.
PN01- “We ask each other what we would like to eat... We get inspiration from
supermarket... We do not have that much in fridge then we decide in supermarket...I like to
look around in the store and find the sales…”
The effects of sale offers are arguable from the perspective of food waste. Retail
stores offer these sales and promotions in order to deplete their stock (i.e. destocking
strategy) for several reasons. One reason is the presence in the store of food that is
approaching the expiry date. In these cases, retail stores create a demand on expiring food
by lowering the price or increasing the quantity (Wrap, 2008). These sales are economically
advantageous not only from the perspective of retail store but also for consumer. However,
these sales and promotions can increase the amount of food waste in domestic kitchens
because some shoppers buy more than they need. PN04 explained her prepared salad
waste with the following words.
PN04- [talking about prepared salads] “I waste prepared salad… (Prepared salads
are in) bigger packages that I can eat... Also they (retail stores) have exclusive
salad with a sale. I buy three of them. I went somewhere at weekend, when I come
back I think that they are not good so I wait the next Wednesday. Normally, my
boyfriend eats what I buy but prepared salad always stays in fridge…”
Although PN04 lives one floor above the retail store, she buys more than she needs
when food is less than its regular price. From the view of daily shoppers, the reason for

- 40 -
purchasing more food than actual need can be because of economic benefits. Faber and his
colleagues explained it with Homo economicus model that is defined as who seeks to
achieve his objectives with minimal costs (Faber, Petersen, & Schiller, 2002). In addition to
this, going shopping frequently increases the quality and freshness of food in one sense,
since the shoppers decide what they are going to eat only when in the acquisition
environment.
Lastly, it can be stated that daily based shoppers are not the major group. Singles
and some young couples exhibit this acquisition behavior.
4.3.3.1.2 Weekly Based Shoppers
More than half of the participants (11) choose to do a main shop on a weekly basis.
The shopping day is generally at weekends or Friday afternoons. In addition to this, they go
shopping one more time in the middle of week if it is necessary to go shopping again. Due to
the fact that they go shopping once or twice, these shoppers generally prepare a shopping
list. The main motivation for going shopping once is to reduce the time that is spent
shopping. According to these shoppers, the shopping time is a time consuming task that is
seen as a duty. Some participants take turns with their spouse and they have a rota (written
plan for alternating who does the shopping). PN03 explains this situation.
PN03 - “… usually I try to go once a week but it ends up with going twice. [Do you
go alone or with somebody?] I take turns with my wife.”
Five weekly based shoppers (mostly couples and immediate family) mentioned that
they prepared a shopping list one day before shopping. Two of them had a regular shopping
list (template) that could be changed by adding or subtracting entries. The modified
shopping list generally needed to be confirmed by the spouse before going shopping.
Moreover, they affirmed that preparing a shopping plan could help reduce food waste, since
they would not duplicate food that they already had.
However, this is the case only if the plan is strictly followed during the shopping. If it is
not followed, the purchased food can still have a chance to end up in the trash bin. One
participant claimed that buying in advance actually increases the amount of wasted food in
his household, since participant and householder(s) sometimes cannot follow the plan.
4.3.3.1.3 Hybrid (Mixed) Shoppers
Some participants modify their shopping behavior according to food types. Although
they had one large shopping trip during the weekend, in the same way as weekly based
shoppers, they tend to buy several types of food on a daily basis. These food types were
mainly fruits, breads, milk and yogurt. PN01, PN08 and PN16 can be named as hybrid
shoppers.

- 41 -
PN08 - “Yes, we buy bread on daily basis and I like to go bakery, I like the
smell…”
PN01 - “I buy fruits on daily basis since it moulds quickly…”
PN16 - “My wife buys fruits, vegetable, bread … she buys the small ones. [Why?]
Not wasting. [Isn’t it more expensive?] I think yes but if you buy daily basis, it has
quality and freshness…”
These shoppers change their acquisition behavior for a specific food type for several
reasons. As for intentionally wasted food, seeking the desired values “quality, freshness and
taste” can be one of the motivations. Additionally, as PN01 and PN16 state, they try to not
waste food; thus, reducing waste food can be another motivator.
Comparing the three shopping behavior types can provide a clear image about
people‟s food acquisition behaviors.
Daily basis shopping behaviors make individuals more flexible regarding food
acquisition. However, going shopping everyday takes time, since they need to go to retail
stores and take decisions about their food choices.
Weekly basis shopping behaviors reduce the frequency of shopping, which is
perceived as „saving time‟ by some individuals who regard spending time shopping as
something not very desirable.
Some individuals have mixed behaviors due to motivators such as seeking quality,
freshness or other criteria.
It cannot be directly said that one type of acquisition behavior is better than another
with respect to reducing food waste, since the decisions made during acquisition are also
connected to preparation and consumption phases of the food lifecycle. In short, the
frequency of shopping alters the amount of acquired food, which can increase the amount of
food waste in domestic kitchens. Additionally, there was found to be a common factor for
these shopping groups, which increases the amount of food waste in domestic kitchens: lack
of appropriate (generally smaller) portion sizes.
Several studies (Hill, 1998; Harnack, 2000) show that the quantity of portion sizes has
increased since the 1970s both in eating establishments (restaurants, take away, fast food
restaurants) and retail stores, whilst the price of food has decreased. In addition to this,
eating establishments and retail stores have promoted a culture of buying more and paying
less through their marketing strategies. For these reasons, people sometimes find it difficult
to acquire their actual food needs. PN11 described the portion problem as follows.

- 42 -
PN11 – “…wasting bread for sure. I think it is cheap and you cannot buy two slices
of bread. I cannot just buy 4. Normally I buy half but I can’t consume everything... I
don’t change my idea because it is cheap.”
4.3.3.2 Storage Related Reasons
After food acquisition, unconsumed food turns into stored food. Supplied food
generally needs to be preserved in storage units. During this phase, due to the passiveness
of the food, the connection between that food and people is relatively low. For this reason,
people can forget what they have as food in their supply. In Study I, many participants
described this problem.
PN01 – “My dream product will be a kind of monitoring gadget that will give
feedback to me about expiring dates.”
PN02 – “Yeah we do waste potato and onions. They need dark environment and
we forget them in there…”
PN06 – “… forget leftover in fridge.....if I don’t see, I cannot use them...”
PN09 – “… (talking about vegetables)... Vegetable Drawer, I found some bags full
with rotten vegetables…”
PN11 – “during cleaning fridge, I found old cheese that moulds….. If I have control
on what it’s expiring, and then it would be nice...”
PN13 – “I want to be aware of what I have then I can change my plans.”
PN17 – “I want to have expiring alarm system for everything.”
With these quotations it can be stated that the lack of connection is not only for a
specific food type but for foods in general. To illustrate, while PN11 complained about the
moldy cheese in the fridge, PN02 pointed out onions and potatoes, which are stored in a
dark environment.
The reasons of this connection problem can be clustered into three categories. Firstly,
people are not able to monitor what they have as food because each food type has a
different expiry date and also they are stored in different places. To illustrate, two
participants had two freezers and one of them was located outside of the kitchen (in a
cellar). In such cases, people cannot monitor what they have and they do not take
purchased food into account during their preparation and consumption decisions. From the
previously listed quotation, it can be stated that PN01, PN11, PN13 and PN17 each have a
willingness to monitor their food storage. By getting information about the food condition,
these participants stated that they could minimize the amount of wasted food in their
domestic kitchens.

- 43 -
Secondly, PN02 pointed out another aspect of the connection problem. In his
example, the food was stored in a dark environment; therefore he confessed that he lost the
connection with the food. Similarly, PN06 and PN 09 had the same problem due to the fact
that they could not „see‟ what they had. Indeed, many storing-preserving products are messy
and non-transparent. Therefore, it can be stated that the current “physical appearance of
storage products” increases the amount of food waste in domestic kitchens.
Thirdly, some participants had a lack of knowledge about how to store several food
types, especially fruits and vegetables. Johnson and his colleagues (2008) conducted a
research project to help consumers reduce fruit and vegetable waste. Moreover, it is well
known in the fresh produce industry that most fruits and vegetables keep longer at low
temperatures and high humidity. For that reason, fruits and vegetables should be stored in
bags but not completely sealed containers. Three of the participants‟ storage behavior for
several vegetables types was totally contrary to this storage advice.
If these three reasons are compared, the physical appearance and the connection
problem, both due to having different expiring dates, can be asserted as the main reasons
for food waste that originates in the storage phase. These problems can be overcome by
reducing the amount of stored food, improving preserving technologies and enabling users
to track what they have as supplied food.
4.3.3.3 Preparation and Consumption Related Reasons
Acquired food can be ready to consume or it can require preparation. Food
preparation can be defined as cooking, processing food, and heating leftovers for
consumption. The food stream in the preparation phase can be equated as follows:
UF – IF = S+ W+ C (4.3)
Where UF is unprocessed food, IF is inedible food parts, S is storage, W is waste and
C is the Consumption.
According to this equation, it can be stated that preparation and consumption have a
strong connection, since preparation is (in general) followed by consumption. For that
reason, preparation and consumption are explained together.
From the results of Study I, it was found that the preparation related reasons for food
waste are mainly the following: unclear hunger level of people, over estimation of
consumption, lack of using a measurement system (portioning-weighing-serving),
uncoordinated food preparation and limited time for preparation.

- 44 -
Participants stated that estimating the consumption was difficult because of unclear
hunger levels of individuals. For that reason, participants tended to cook more instead of
less food. This has knock-on effects, for example, if the leftover food is less than one
portion, the interviewed participants stated that they generally would not keep it for the next
day. PN08 explained this situation with the following words.
PN08 – “Plates are not empty and tiny leftover that you can’t eat next day... One is
more or less hungry then you can’t decide it...”
In immediate families, this problem can be seen more often than singles and couples
because children sometimes reject to eat the prepared food. PN03 and PN07 complained
about this problem.
PN03 – “Children don’t eat food on their plates... I throw it away or I try to keep it
sometimes but it (food waste) happens...”
PN07 – “I cook precisely but my daughter is a bad eater… so we throw away food
but wasted food is generally expired food.”
In these examples, the participants tried to prepare the exact amount of food that
would be consumed. Moreover, these individuals tried to weigh and measure the food
amount during the preparation phase. However, some participants told that they did not
generally scale the food, for example PN04 and PN13.
PN04 – “It is hard to determine the amount exactly... I do not weigh [why?]
because it is hassle, time consuming...”
PN13 – “I use my visual weigh skills during cooking pasta or rice…I am not
weighing them.”
From these quotes, it can be stated that participants do not tend to use scaling or
measurement gadgets since they find them inconvenient and time consuming. These
participants try to save time by by-passing the weigh step. Moreover, some participants use
pre-cut and portioned food instead of weighing them, which is perceived as time saving
during the preparation phase. Indeed, many participants tried to minimize the time that they
spent during preparation. For instance, eight participants (PN3, 4, 7, 8, 12, 13, 15, and 17)
said that they prepared extra quantities of food so that they could have food for the next day,
since they believed that they did not have enough time for cooking. Moreover, sixteen
participants stated that cooking was generally perceived as a duty. However, when they did
have time, this duty turned into a hobby. The words mentioned by PN16 can be shown as
another example to save time during preparation.
PN16 –“My wife bought a new device for chopping. It actually works and saves
time. Time is really important for her…”

- 45 -
4.4 Findings of Study I
4.4.1 The core findings
In Study I, the food waste problem was explored in four different phases. According
to the results of Study I, the acquisition decisions need to be directly connected to
consumption decisions in order to reduce the gap between acquired food and consumed
food. With a better food management, amount of stored food can be reduced which could
also reduce the generated food waste amount.
According to results of Study I, it can be stated that participants unlikely go food
shopping frequently thus they need to store more food for unexpected situations and
upcoming days. Due to having different expiring dates of different food types and differently
located storage units, participants cannot monitor what they have food as in these storage
units ( i.e freezer(s), fridge, cupboards).
In Study I, participants selected the bread, leftovers, fruits and vegetables as the most
wasted food type in their household. Forgetting these food types in storage units, portion
problem and short life-cycle of these food types can be regarded as the main reasons of
food waste in the western domestic kitchens. In addition to this, during preparation and
consumption, uneaten food on the dishes and in the pans increases the amount of food
waste. However, preparation phase (especially cooking) is consists of complex variables
such as hunger level, nutrition level and portion. For these reasons, reducing the food waste
by enhancing preservation qualities and changing acquisition behavior seem more logical
though underlining the importance of preparation and consumption decisions related to food
management.
Figure 4.7: Weight of avoidable food and drink waste by food group by reason of disposal(Quested & Johnson, 2009)

- 46 -
In the study of Tom and Hannah, the food types were clustered with the reasons for
disposal In Figure 4.7. According to this figure, not using in time can be asserted as the main
reason for bread, vegetables and products whilst cooking, preparing and serving too much is
the main reason of waste.
4.4.2 Contextual Findings
In Study I, there are some results that are also related to food waste but not that
important as the core ones. Firstly, giving food to the animals wasn‟t perceived as food
waste by five participants (Appendix C). As stated in Chapter 2, the prevention is more
favorable approach than using food waste as animal food. Participants stated that they feel
better from the emotional perspective because they see that the wasted food was consumed
by these animals. This emotional connection can be embedded to the concepts for
bypassing these emotions to the concepts.
Additionally, six participants stated that they generally do not want to spend too much
time during preparation (Appendix C). Since they want to reduce time that is spent during
cooking, they generally skip scaling (especially for granule food) tasks or tend to buy pre-
portioned and pre-cut food (meat-vegetables-ready food). Moreover, participants seemed to
be prejudiced to have another kitchen appliance due to the lack of space in the kitchen
environment. However, showing saving money (being more efficient) and time as motivators
can change their mind and demolish their prejudice (Appendix C).
- 47 -
5 STUDY II: GENERATIVE SESSION
After exploring the problem with interviewing techniques, collecting multiple viewpoints
with regard to food waste was the next crucial step of the study. For that reason, a group
session was scheduled with three users and two designers. The selected participants for
Study II were individuals who live as couples and singles, are highly educated (WO
(master)- HBO (bachelor)) and accept the fact that they waste food. These participants were
selected from Philips Research by using an internal mailing list with availability sampling.
The goal of Study II was to gather latent and tacit knowledge about the food waste
problem in domestic kitchens. Moreover, bringing designers and users together in the same
environment was anticipated to help turn gathered knowledge into design ideas.
Before group session, both users and designers needed to be sensitized to the
problem (Sleeswijk Visser , et al., 2005).For that reason, a workbook and focusing paper
were prepared. In the following sections, firstly, the prepared materials are explained then,
the accompanying results are presented. Lastly, the conclusion of Study II is discussed.
5.1 Workbook
The workbook had six different tasks, which were related to different aspects of
individuals‟ food waste behavior. Moreover, a waste-monitoring diary (Figure 5.1), which had
been used in previous studies (Baqtiste, 2007; David Johnson, et al., 2008; Quested &
Johnson, 2009)was integrated into this workbook. The workbook example and its
component tasks can be found in Appendix D.

- 48 -
Figure 5.1: A filled waste dairy example
5.1.1 Workbook Tasks
Several tasks were designed in order to get more information about the following
topics: meal planning, the routine of cooking, changing the currency of food, waste pyramid,
kitchen with adjectives and mind-map of food wastage.
5.1.1.1 Meal Planning
For the first day, participants were asked to write what they were going to eat for the
following day. Meanwhile, they were asked to write the reason(s) of their food preferences
with open ended questions. In the following day‟s task, there was one question for
controlling whether they followed their plan or not. According to their answers, four
participants did not cook what they had planned. Participants were asked to indicate why
they did not obey the plan, even though they were free to eat whatever they wanted.
One participant stated that he was tired and he did not want to cook what he had
planned the day before. He just prepared a simpler meal and changed his plans. Two
participants wrote that they changed their plan because they ate outside of the home.
Moreover, one participant wrote that she changed the plan because she decided to finish a
leftover from two days previously. The last participant claimed that he did not have time to
prepare what he had planned.
To sum up, the participants did not follow their own plans that were created just one
day before. According to their answers, food planning would be difficult to integrate to users‟

- 49 -
lives for such short-notice (one day) meals. Moreover, the planned way was fragile to
external factors such as eating outside or being tired. These behaviors of participants show
similarities with the result of Study I, which showed people wanted to be flexible in cooking
and meal planning and were not really favor of following a plan.
5.1.1.2 Change the currency of food
In the second task, participants were asked to predict the price and water footprint of
several food types. As stated in the results of Study I, the cheapness of some food types is
one of the reasons of individuals‟ food wasting behavior. Similarly, Falk (1994) points out
that the food waste behavior of western culture occurs due to the availability and cheapness
of food in general. However, the principle of „cheapness‟ is a perceived image of reality,
which can be altered by changing the currency system of food.
In this task, the water footprint of a food is selected as an alternative currency to the
retail price of the food. This alternative currency is defined as a footprint model for industries
that work with organic materials such as clothing, the food industry, irrigation, and
stockbreeding(Hoekstra, Chapagain, Aldaya, & Mekonnen, 2009). The currency can be used
to calculate water consumption and pollution associated with production of a given product.
In Table 5.1 the water footprint of food types for the Netherlands can be seen, calculated by
the Water Footprint Network(Hoekstra & Chapagain, 2005). Table 5.3 was explicitly used in
the task to enable participants to compare their predictions with real values. Additionally,
information on the average water consumption per person taking a shower (358 liters per
week) was added, to elicit an opinion about the water consumption (Lenneke Kuijer & Jong,
2009)
Participants filled in their predictions both for the food prices and the water footprint.
One participant claimed that he did not understand the task, therefore he did not fill anything.
After collecting and analyzing their responses, it can be stated that the participants had a
lack of knowledge on water footprints generally, whilst they predict the prices of food types
quite well. Moreover, they agreed that valuing food with reference to a water footprint could
increase the value that people place on food and that it might be a motivating factor for
adopting a new product that seeks to reduce domestic food waste.

- 50 -
Table 5.1:Prices and Water Footprints of several food types (Hoekstra & Chapagain, 2005)
Food Type (1kg or 1lt) Price (EURO) Water Footprint (lt)
Beef Steak 5-10 15550
Orange 2-4 500
Potato 0.5-2 250
Bread 2-4 1330
Milk 1-2 1000
Apple 1-2 700
Tomato 3-6 185
Cheese 5-20 5000
Chicken Fillet 4-8 3900
Pork Steak 4-8 4800
5.1.1.3 Waste Pyramid
In the third task, the waste pyramid was explained to participants with help from an
example. In that example, the waste pyramid was used for a plastic bottle to show how it can
be prevented, reduced, reused, recycled and disposed. Participants were asked to use the
same model in a similar way to describe potential solutions to the food waste problem in
domestic kitchens.
According to their responses, three participants stated that buying food in a planned
way could prevent food waste. Additionally, all participants accepted that feeding animals
could not be justifiably named under „wasting food‟, which is a result having similarities with
Study I section 4.5.
5.1.1.4 Food Waste Mind Map
In the fourth task, participants were asked to write down why they consider people
waste food. Their answers were clustered as seen in Table 5.2. During the categorization of
their responses, some of the reasons were reduced to a single problem statement. To
illustrate, “people do not know how much food they need” and “people cannot estimate the
amount they need” were reduced to the problem statement “Over Estimation of Buying and
Cooking”.

- 51 -
Table 5.2: Frequency of mention of problem statements for the origin of food waste
Problem Statement Number of Participants
Over Estimation of buying and cooking 4 participants
People do not care food waste that much (culture) 4 participants
Changing plans( unexpected events) 3 participants
Expiring too quickly 3 participants
Hard to track 3 participants
Not sufficient space to keep fresh 1 participants
5.1.1.5 Cooking routine
In the fifth task, participants were asked to illustrate their cooking routine on a time
line (Figure 5.2). Also, they needed to indicate their positive and negative feelings towards
their cooking routine and duties. After analyzing their routines, duties and feelings, it can be
stated that:
- time-consuming tasks during preparation generally evoke negative
feelings (4 participants);
- eating is a pleasure-giving activity (5 participants);
- eating alone creates a tendency to cook simple meals and decreases the
eating pleasure, whereas eating together and socializing evokes positive
feelings (4 participants);
- delaying some tasks is a usual phenomenon in a kitchen environment
(e.g. leaving yesterday‟s dishes to be washed the day after).

- 52 -
Figure 5.2: A filled example of cooking routine task
5.1.1.6 Negative and Positive Adjectives for the kitchen
In the sixth task, participants were asked to select which adjectives they would like
their ideal kitchen to be associated with. The most frequently used adjectives from Study I
(hassle, smart, convenient, fast, clean, compact, flexible, organic, and efficient) and their
opposites were selected for this task. Additionally, five blank spaces were provided to allow
participants to add additional adjectives at their own will. According to their answers, „clean‟,
„smart‟, and „fresh‟ were the most favorable and repeated adjectives that they wanted to hear
applied to their kitchen context. The complete list of adjectives and responses of
participants can be found in Appendix F.
5.2 Focusing Paper
After participants had completed the workbook, one day before the focus group
session, a three-paged document, comprising a short literature review, was delivered to the
participants via e-mail. The focusing paper can be found in Appendix E. The goal of giving
the focusing paper before the focus group session was to draw participants into the problem
space by exposing them to reliable knowledge.
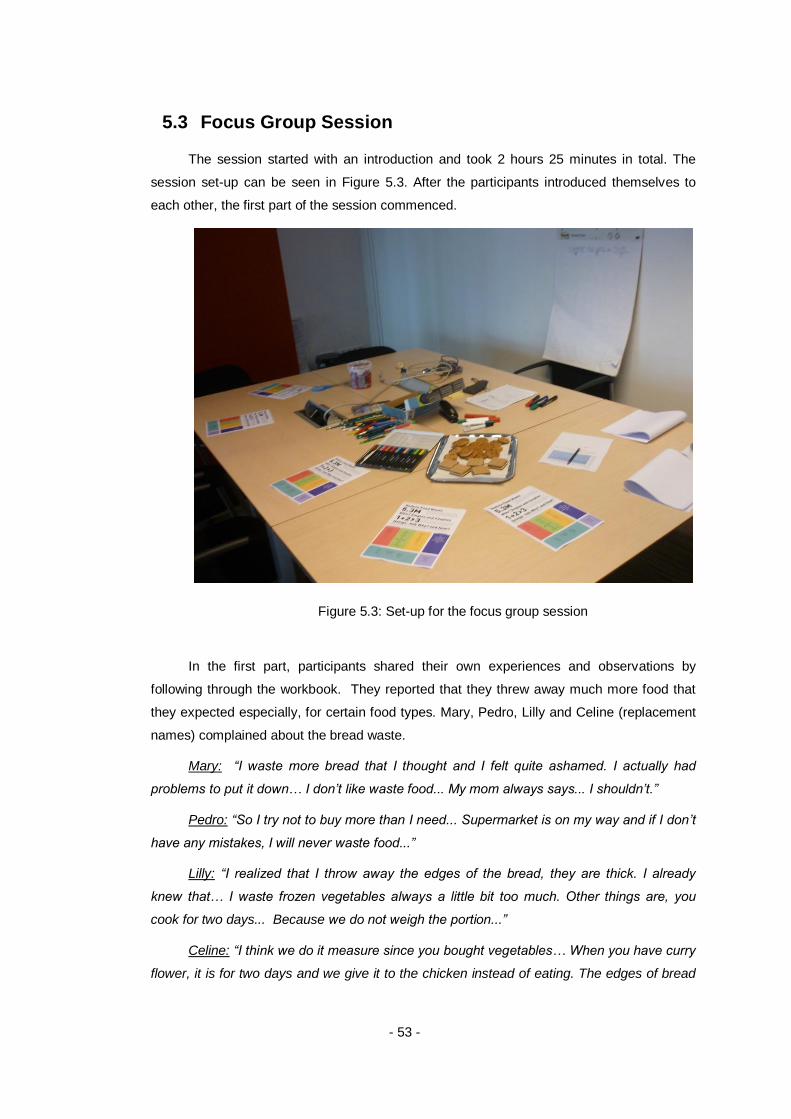
- 53 -
5.3 Focus Group Session
The session started with an introduction and took 2 hours 25 minutes in total. The
session set-up can be seen in Figure 5.3. After the participants introduced themselves to
each other, the first part of the session commenced.
Figure 5.3: Set-up for the focus group session
In the first part, participants shared their own experiences and observations by
following through the workbook. They reported that they threw away much more food that
they expected especially, for certain food types. Mary, Pedro, Lilly and Celine (replacement
names) complained about the bread waste.
Mary: “I waste more bread that I thought and I felt quite ashamed. I actually had
problems to put it down… I don’t like waste food... My mom always says... I shouldn’t.”
Pedro: “So I try not to buy more than I need... Supermarket is on my way and if I don’t
have any mistakes, I will never waste food...”
Lilly: “I realized that I throw away the edges of the bread, they are thick. I already
knew that… I waste frozen vegetables always a little bit too much. Other things are, you
cook for two days... Because we do not weigh the portion...”
Celine: “I think we do it measure since you bought vegetables… When you have curry
flower, it is for two days and we give it to the chicken instead of eating. The edges of bread

- 54 -
are also for chicken… [How do you feel when you give bread to the chicken?] Yes, I feel
good and it is kind of recycling.”
Although participants gave complaints about the different food types, these complaints
can be named under the underlying issue of inappropriate portion size of food, which was
one of the main findings of Study I concerning food waste in domestic kitchens.
After participants shared their observations about their food wasting behavior, the
second part of the session started. To commence, the Matec technique (cross ref: Sol,
1974), creative distancing matrix, was used (Tassoul, 2009). The basic idea here was to
generate a great number of associations around the problem, which can be used to define a
behavior and a solution that can reduce food waste. Thus, the problem statement was
separated into the root words “Minimize”, “Food Waste” and “Philips”.
Participants tried to suggest related words to the root word, one by one in a round.
Participants were free to say “pass” if they were not able to add a word when it was their
time to do so. In the end, three word clouds were built by the participants. After creating a
huge word clouds, all participants were asked to select one word from each word cloud (i.e.
three words in total) and to create an idea. This part took fifteen minutes to complete, after
which the participants gave a brief presentation of their stories and concepts. The results
are presented in Table 5.3. In this table, not only the concept description but also three
selected words from the word clouds are indicated. Keywords were added due to the fact
that some participants used metaphors which could be understood differently from person to
person.
Table 5.3:Concepts created during the generative session
Selected
Words
Concept Description Keywords
Faster - User-
Space
The concept is about social eating
and sharing. The world can be like a
big picnic and if somebody needs
bread you can take the basket and
offer it kindly. It is like community.
Social eating, Donating,
Sharing, Community,
Collaboration, People-Food-
Balance
Production-Mc
Donald‟s -
Calm
Efficient production of food like in
McDonalds but in a more calm way.
Small portions very organized no
need to rush.
Portion Size, Calm
Environment, Efficient

- 55 -
Table 5.4:Concepts created during the generative session(continued)
Nature- Mixer -
Going Working
Energy friendly mixer that will do the
job when you are at work. Using
nature for wind energy. Put it outside
in the open and a timer will make sure
the job is done when you get home…
Reducing Tasks, Energy
Friendly, Timer
Children-
Usability-
Crumble
Children will spoil a lot of crumbs.
Take the crumbs and use them for
other purposes. A device that collects
crumbles and feed animals.
Animal Feeding, Collecting
God- Apple -
Egg
While somebody is walking to the
McDonald‟s…
God says: “Eat healthy food, like eggs
and apples that is good for you”.
Healthy food, Authority,
Advise
Sun- Ant-
Sucks
There is an ant coming to the apple
which will destroy it. Sun (not with an
order) burns the ant thus food is still
safe.
Protective, Extended Life-
Cycle of Food
Restriction-
Ritual-Birth
Babies used to eat too much so there
are plates and cups that indicate
healthy and normal amount of food.
Reducing Tasks, Energy
Friendly, Timer
Enjoy – Color -
Environment
There are colorful garbage cans and if
you throw more than one level their
color turns to grey.. It can be used to
educate kids.
Joyful, Punishment, Giving
Feedback,Education
Health- Brain-
Apple
Stimulate brain to be attracted to eat
what they really need.
Control Behavior
Water-Loss-
Present
Good use of sources needs to be
rewarded as a present.
Reward
Richness-
Poor-Planning
A solution for unfair distribution of
food. Your food waste can be food of
somebody.
Donating, Sharing

- 56 -
In the second part of the creative session, the “how can you….?” technique” (Tassoul,
2009) was used to generate ideas for specific questions about food waste. Five questions
were determined before the session, based on conclusions from Study I.
- “How can you reduce the stress level (in the kitchen)?” – Increasing well-
being reducing stress
- “How can you reduce food waste during cooking?” – Planning during
cooking
- “How can you remind somebody what (food) s/he has?” – Reminding what
s/he has
- “How can you increase the value of something (food)?” - Cheapness and
availability of food
- “How can you make somebody buy what (food) s/he actually needs?”-
Planning during Shopping
Participants drew or wrote their ideas in six minutes for each question. Then, they
exchanged the question papers with their fellow participants in a clockwise direction. By
exchanging papers, each participant answered all of the questions. After finishing the
session, the question papers were collected and then redistributed randomly to the
participants. They were asked to chose and present the most favored best solutions in
response to the questions. Results can be seen in Table 5.4.
These solutions are used during the design process that is explained in Chapter 6.

- 57 -
Table 5.5: Results of the “how can you…?” generative method
Question Most Favored Ideas and Solutions
How can you remind
somebody what
(food) s/he has?
Lightning spots, Display glass, Smart fridge, Sending information to GSM
or laptop, Transparent, Showing recipes for what s/he currently has,
Short movie to your e-mail.
How can you reduce
the stress level (in
the kitchen)?
Charlie and The Chocolate Factory, Bright and clean environment,
Recipe in sound format and turns to music, Playful elements, Machine
that orders everything for me.
How can you
increase the value of
something (food)?
Surprise package for food, Education and learning experience (where it
comes from, ingredients, water consumption), Less choice and fewer
brands, Social rating/support (persuasive technology), Turn cooking to a
ritual.
How can you reduce
food waste during
cooking?
Smart recipe book – giving recipes and give suggestions about what you
can do with wasted food and leftovers. Device recognizes bad parts (skin,
rotten) of food and cuts into small pieces. Refreshing device – your
leftover turns to freshly cooked meal.
How can you make
somebody to buy
what (food) s/he
actually needs?
A fridge that sends shopping list to your GSM when you are in the
supermarket. Buy large packages and a device that divides the big
packages to proportions. Smart-Shop: “Hi, I would like to buy 3 kg of
potato and 1 kg of tomato.” “For how many persons?” “1” “for 1 person we
only give three potatoes and one tomato, NOT MORE!”
5.4 Discussion of Study II
Across the focus group and generative session, a total of 42 ideas were created.
Some of the ideas (e.g. Smart Fridge) were repeated; therefore, the ideas were filtered and
combined with similar ones.
One observation is that most of the ideas were in a kitchen context and had
connections with particular decision making processes. For example, the most favorite idea
was a fridge that had more than one function. It could monitor what users already had in the
fridge and give feedback about this information during shopping. Also it could suggest
recipes during the food preparation process. In another example, a portion device could

- 58 -
divide the purchased food into small portions for preparation with deciding the exact amount
of food that is decided by product. The originator of this idea also suggested that the device
could chop the vegetables into small pieces when it was needed.
With these two examples, and more in table 5.3 and 5.4, it can be stated that
participants didn‟t want only to reduce the food waste but also they wanted to add elements
that would help to reduce users‟ tasks and time during preparing and monitoring stored food.
Participants are ready to give some of their responsibility and control to the machines that
could take perfect decisions for the amount of food that they have and they need to
consume. These products that participants designed can be named intelligent or smart
products as participants already did during Study II.
Keyson discussed the user experience issues of intelligent products in under three
factors: understanding and sense of control, emotionally appealing and engaging, expected
and perceived functional performance. According to him, firstly, an intelligent products‟
function should be perceivable for the users and it is expected to be usable, stable and
predictable. Secondly, the control should be seen along a continuum from a product taking
no action, giving suggestions collaboration with user and at the end, taking action completely
autonomously. Thirdly, an intelligent product should evoke initial emotions not only the
sense of appeal but also ergonomic and hedonic aspects(Keyson, 2008).
Implementing these arguments to the food waste phenomenon and findings of Study
II, it can be stated that there are two possible design ways which can be characterized as
“transferring decision making process from man to machine” or “assisting man about his
food related decision making processes” for minimizing food waste. It can be reworded as
“taking (do not) responsibility from user” or “reminding (not wasting) responsibility to the
user”.
The generated concepts in Study II mainly focused on solving the portion problem of
food and increasing the lifecycle of food. The portion size problem should not be understood
as only about the consumption or preparation phases as it is relevant to acquisition
decisions. Moreover, according to the generated concepts, it can be asserted that
solutions for increasing the lifecycle of food should preserve the perceived quality of the
food. The appearance of concepts such as “refreshing the leftover” and “turning leftovers
into freshly cooked food” can be seen as evidence of this assertion..
Lastly, in Study II, the concepts generated for minimizing food waste were generally
placed in the kitchen context as opposed to the retail environment or the transportation
context. Moreover, in many concepts, the function of minimizing food waste was embedded
into kitchen appliances such as fridge, chopper or display. Participants indicated the kitchen
space problem as a reason why they combined the food waste functions with other products.
Norman pointed out the space problem of kitchen by highlighting the number of appliances

- 59 -
that are tucked away in the closet shelves and kitchen drawers in an average household
(Norman, 2009).
In the following chapter, the design process of this study is explained briefly.

- 60 -
6 PRODUCT DESIGN TO REDUCE FOOD
WASTE
After conducting Study I and II, the results of these studies are combined into a
criteria list for a design concept to reduce food waste in western domestic kitchens.
6.1 Design Criteria
6.1.1 Criteria based on Study I and II
During Study I it was found that participants waste particular food types more than
others. These food types are bakery products, vegetables, fruits and leftovers. Based on this
observation, design ideas that focus on these food types, whilst solving the general food
wastage problems, were regarded as a priority and consequently graded higher. Moreover,
participants frequently mentioned the need for perceivable time savings and problems of
lack of space. Therefore, space problem and convenience are added to the criteria list.
In Study II, after analyzing the created concepts, two possible design ways, taking
responsibility and reminding stored food are added to criteria list. Moreover, the project
constraint, effective solution to reduce waste is added this criteria list. In short, criteria based
on Study I and II are;
- Favor of prevention (Literature Review - EPA food hierarchy model)
- Perceivable time-saving – Convenience (Study I - Findings)
- Related to the most wasted food types (Study I – Findings)
- Effective solution (continuously helping to reduce food waste – Study II )
- Space problem (Study I, II)
- Taking responsibility or reminding of responsibility (Study II)
6.1.2 Criteria based on project aims:
Several additional criteria were added based on requirements of Philips and the
author‟s (designer‟s) personal ambitions for the project. These criteria are;
- Feasibility of concept with current technology (Designer Constraint)
- Being connected to Philips (Project Constraint)

- 61 -
- Innovation level (Designer Constraint)
- Continuous interaction (Study I and Designer Constraint)
- Healthy eating from sensible portion sizes (Philips Constraint – well being)
During the design process, the generated concepts needed to meet these criteria, or
at least they should not conflict with them. Those concepts that meet all criteria can be
named as perfect concepts. In the design process, the author tried to reach this point. Each
concept was internally evaluated for each criterion using a 7-point (-3/0/+3) scale. Food
waste related criteria were considered to have more weight than the others because of the
scope of the study. These criteria were:
- Favor of prevention
- Related to the most wasted food types
- Effective solution to food waste
- Taking the responsibility or reminding of responsibility
After deciding on the design criteria, possible ideas and solutions that were indicated
in the results of Study I and II were reviewed as a source of inspiration before generating
and sketching coherent product concepts. The following ideas and solutions can be found in
Chapters 4.3, 5.3 and 5.4. They are:
- Reducing the amount of stored perishable food
- Improving preserving technologies
- Enabling users to track what they have
- Changing acceptance levels of users regarding food quality
- Preserving the qualities of food
- Clarifying the consumption level (i.e. nutrition or hunger level)
- Make measuring tasks easier
- The results of “How can you…?” session (Table 5.4)
Additionally, before sketching concepts, possible ways to connect those concepts to
Philips was investigated, by identifying existing Philips products that might have crossovers
or similarities. The following were noted:
- Philips Senseo (fast, quality, portioned coffee maker)
- Activity Monitor (calculates how much energy used by tracking
movements (i.e. running, bending, climbing stairs...)
- Kitchen appliances (all kinds of small kitchen appliances, e.g. bread
machine, juicer, mixer, blender…)
- Light and lighting effects – Ambilight and Ambilight TV.

- 62 -
6.2 Product Design Ideas
During the design process, seven design concepts were sketched. After sketching the
design concepts, technological constraints associated with the concepts were investigated. If
the technological constraints made a concept unrealistic or not feasible, this concept was
eliminated directly. In the following sections, the seven generated concepts are explained
briefly.
6.2.1 Philips Dispense
Philips Dispense (Figure 6.1) is a fully automated bread machine that provides the
exact amount of bread by following the bread consumption pattern of the household. It gets
confirmation from users about the number of slices that is needed for the next day. Freshly
baked bread has several qualities, including flavor that comes from the baking process.
These qualities can increase the value of bread, which can result in increased pleasure for
users. Moreover, it is conceived using a water footprint model for feedback regarding food
waste. Since there will be no dried bread slices, an alternative solution is embedded to this
concept. It has a tray with a bird icon for collecting breadcrumbs, which is in response to the
animal feeding connection that was found in Study I (Section 4.5).
Pros. Stores in a different way – precooked thus increased life-cycle, preserving
qualities, continuous interaction, connected to Philips (Philips produces bread machines).
Cons. Needs space, energy consumption, getting confirmation, bread price.
Figure 6.1: Philips Dispense – provides freshly baked bread everyday

- 63 -
6.2.2 Philips Swab
Philips Swab (Figure 6.2) is simply a rectangular mat (for heat and cleaning) that has
weight sensors to scale the portion size of food during the consumption phase. It gives not
only feedback about the nutrition facts but also weighs the pan and leftover amounts in the
pan. It reminds about leftovers available to be consumed.
Pros. Gives feedback during consumption, reminding about leftovers, everyday
routine.
Cons. Separated pieces, recharging, energy consumption, not in favor of preventing
food waste in earlier stages.
Figure 6.2: Philips Swab – gives information while consuming
6.2.3 Food Management Software
Philips Food Management Software (Figure 6.3) persuades users to plan their food
preferences in advance. With this software, users can select recipes for the next week‟s
meals by accessing a recipe database. According to the selected recipes, a shopping list is
built up and prices for the next food acquisition are calculated.

- 64 -
By using this software, participants can have economical advantages from a
partnership retail store. Albert Heijn, which has food retail store chains in the Netherlands, is
suggested as a possible partner because the retailer already has similar web-based
software.
Pros. Ease food management, can be embedded to mobile gadgets and kitchen
environment, perceivable time saving.
Cons. Following a food plan is hard (Study II), not taking or reminding the
responsibilities of user.
Figure 6.3: Philips Food Management Software- provides shopping list with meal management
6.2.4 Philips Canvas
Philips Canvas is a cold storage kitchen unit for perishable fruits and vegetables. It will
recognize what fruit and vegetables users have stored away by reflecting the colors of those
goods on the product cover. Users can change the „painting‟ of Canvas by putting purchased
vegetables and fruits in different slots of the product. The „painting‟ will give feedback by
reminding users of the fruits and vegetables they have not yet used and must use within a
certain time period.
Pros. Connected to Philips (Ambilight), increasing connection between people and
food, using food itself instead of added techology (RFID, packaging), increasing the life-time

- 65 -
of vegetables and fruits, reminding users of responsibilty, decorative, enabling users to track
what they have.
Cons. Subtle feedback, energy consumption due to the light infrastructure, space.
Figure 6.4: Philips Canvas- gives feedback about the amount and condition of vegetables and fruits
6.2.5 Philips Rapid Chopper
Rapid Chopper is a vegetable chopping appliance that also preserves vegetables in a
4 -14oC environment. Moreover, it calculates portion sizes according to recipes from its
cooking recipe database and the number of the people who will eat. Since it preserves the
unused (i.e. half onion, paprika, broccoli pieces), it recommends next-day dishes that can
make use of these unused vegetables/ingredients. The storage units of Rapid Chopper are
constructed from transparent material, which informs the user about the current content of
the appliance.
Instead of buying pre-cut products, which increase food-related packaging waste, a
solution like Rapid Chopper will not only reduce food and food-related waste but also reduce
the time that users spend on chopping.
Pros. Perceivable time saving, increasing connection between people and food
because of physical transparency, helping to decide on meal choices.
Cons. Space problem, existence of pre-cut vegetables in current system.

- 66 -
Figure 6.5: Philips Rapid Chopper – chops vegetables according to portion sizes
6.2.6 Philips Tupper Light
Tupper Light is a set of storage boxes, mainly for leftovers. It has a special air suction
unit that takes out the air from the storage box. During the sucking action, it also charges the
small battery of an indicator light and starts a timer. When the user opens the storage unit‟s
door, Tupper Light gives feedback via its indicator light to remind the user to eat the food
leftovers. Day by day, the indicator light gives out reduced luminosity, thereby showing the
condition of the leftover food.
Metals cannot be placed into microwave ovens; however Tupper Light consists of
metal components. For that reason, this concept has application limitations. The usage of
microwave ovens in western domestic kitchens is quite high.
Pros. Increasing the lifetime of leftovers because of isolation from air, innovative,
reminding function.
Cons. Unsuitable for microwave oven use, not in favor of preventing food waste in
earlier stages, adding a task (sucking task).

- 67 -
Figure 6.6: Philips Tupperlight – reminds about leftovers using light feedback
6.2.7 Philips Ambil-TV Software
Philips Ambilight (Figure 6.8) is a television that changes room lighting ambience
according to the images on the screen. This media can be used to give feedback about the
condition of stored food in the house (Figure 6.9). According to cooking routines uncovered
through Study II, most participants told that they watched television after they finished their
meals. Using this daily routine can help to reduce food waste by helping users plan their
food for following days.
Pros. Reminding the responsibility of users makes food planning easier.
Cons. Out of kitchen environment, add-on.

- 68 -
Figure 6.7: Philips Ambilight TV
Figure 6.8: Philips Ambi-TV Software - gives feedback food supply in the storage units
6.3 Evaluation of Concepts
As stated before, the concepts were evaluated against a criteria list that was created
according to Studies I and II, the literature and project constraints. In Table 6.1, the scores of
each concept can be seen. The grey cells indicate high-scores: those concepts having a
large number of grey cells were considered as the strongest candidates, suitable for further
development. Moreover, the green and blue colors were used for coding whether the
concept took responsibility for food waste (green), or reminded users of their food wastage
responsibilities (blue).
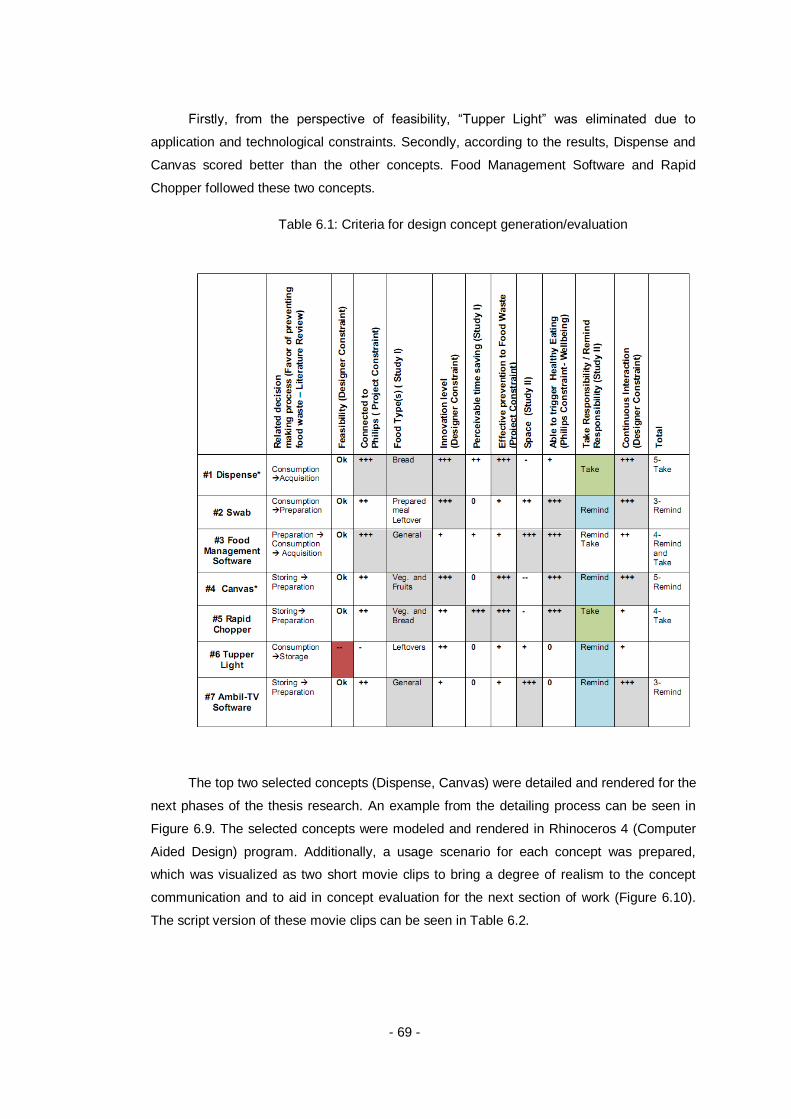
- 69 -
Firstly, from the perspective of feasibility, “Tupper Light” was eliminated due to
application and technological constraints. Secondly, according to the results, Dispense and
Canvas scored better than the other concepts. Food Management Software and Rapid
Chopper followed these two concepts.
Table 6.1: Criteria for design concept generation/evaluation
The top two selected concepts (Dispense, Canvas) were detailed and rendered for the
next phases of the thesis research. An example from the detailing process can be seen in
Figure 6.9. The selected concepts were modeled and rendered in Rhinoceros 4 (Computer
Aided Design) program. Additionally, a usage scenario for each concept was prepared,
which was visualized as two short movie clips to bring a degree of realism to the concept
communication and to aid in concept evaluation for the next section of work (Figure 6.10).
The script version of these movie clips can be seen in Table 6.2.

- 70 -
Figure 6.9: Detail sketches of selected concepts
Figure 6.10: Scenes from prepared movie clips

- 71 -
Table 6.2: Scenario scripts for Philips Canvas and Dispense
Philips Canvas:
A1- Mary and John are at the home. Then, they decide to go shopping. They take
their bikes and go to the supermarket. They buy some meat and John wants to buy more
meat. However, Mary stops him and buys more fresh veggies and fruits. Then they buy
some extra stuff and of course less meat. They go ahead to the cashier table. They pay and
get their bags and it is a little bit heavy. When they reach home, they are a little bit tired.
Philips Canvas is waiting for them and John has a subtle smile upon his face. They take the
veggies and fruits one by one from the shopping bag. They discuss about how they need to
store them. After a while, they put everything into Canvas. Then they close the door. It is an
art and gives light…
They save this canvas and canvas sends it to the computer background.
A2- Mary comes home and tries to cook something... One of the lights on Canvas is
blinking, which creates a little irritation. Then, she opens the door and finds out that the
eggplant is almost rotten. She changes her plans and cooks eggplant…
A3- Canvas becomes emptied since Mary and John eat vegetables and fruits day by
day. It is a nice loop, starts again.
Philips Dispense:
B1- John wakes up at 7 o‟clock. He has closed eyes and gets his bathrobe and goes
to the bathroom. He has a warm shower then he puts on his clothes. He smells the flavor of
freshly cooked bread from the kitchen. Then, he gets just two slices of bread from Dispense.
He makes a sandwich for lunch. Dispense asks him: “Do you again want four slices of bread
for tomorrow?”. He presses yes and Dispense gives feedback: “one slice of bread equals to
40 liters of water”.
B2- He eats his sandwiches during lunch. He finishes his job at 5 o‟clock and he
passes by the bread stand quickly and buys a prepackaged Dispense bread mix capsule. He
puts the capsule into Dispense… Again it is 7 o‟clock; a nice loop starts again…
B3- He takes the crumbs of the bread and gives it to the birds… (Focus on the iconic
symbol)
In the next chapter, Philips Canvas and Dispense are subjected to a systematic
evaluation by users.

- 72 -
Figure 6.11: Images from Scenario of Canvas

- 73 -
Figure 6.12: Images from Scenario of Canvas (continued)

- 74 -
Figure 6.13: Images from Scenario of Dispense

- 75 -
Figure 6.14: Images from Scenario of Dispense (continued)

- 76 -
7 STUDY III: PRODUCT DESIGN EVALUATION
In the previous chapter, the design criteria list, the evaluation and generated concepts
were explained. As a short summary, Philips Dispense and Canvas were selected for Study
III. Study III was structured to gather both qualitative and quantitative data for evaluating
these concepts, Philips Dispense and Philips Canvas (Figure 7.1), from several points,
including being effective in reducing food waste.
According to criteria list, solutions for dealing with domestic food waste should:
- be connected to Philips,
- be convenient,
- increase the pleasure,
- increase well-being,
- strengthen the connection between food and humans,
- trigger eating healthily,
- be space-friendly for the kitchen,
- be effective to reduce food waste.
As a reminder, Philips Dispense is an appliance to bake bread according to the daily
consumption needs of a household. It has scaling ingredients and slicing bread functions
that differentiate the product from existing bread machines in the market. The bread
ingredients are provided in a special package that fits into the appliance. Philips Dispense
allows bread to be freshly baked with minimal effort.
Philips Canvas is a cold storage kitchen unit for perishable fruits and vegetables. It will
recognize what fruit and vegetables users have stored away by reflecting the colors of those
goods on the product cover. Users can change the „painting‟ of Canvas by putting purchased
vegetables and fruits in different slots of the product. Lastly, it will give feedback if users
forget to use some of the purchased food within a certain time period.

- 77 -
Figure 7.1: Philips Dispense (left) and Philips Canvas (right)
7.1 Methodology of Study III
Canvas and Dispense were visualized to help communicate the interactions in use for
Dispense and Canvas. These visuals and scenarios were rendered as two two-minute movie
clips in .flv format. The movie clips were integrated to an Internet-based questionnaire
intended to uncover people‟s acceptance and impressions of the two product concepts. The
language of both the questionnaire and the movie clips was English. The movies and
questionnaire example can be found in DVD.
In the first part of the questionnaire, participants were asked to fill in demographic
information and what they had in their kitchen environment as appliances and apparatus.
After filling this part of questionnaire, participants were again asked whether they waste food
in their household or not as in Study I because the participants whose answers in “No” were
evaluated differently. The main reason of separating them from other participants was that
these individuals might not have any need of solutions which are related to reduce food
waste in domestic kitchens. If they said “yes”, they were subsequently asked to rank the top
three wasted food types in their household.
In the second part of the questionnaire, the short movie clips were shown for each
concept. After showing each movie, participants were asked to fill a seven -point Likert scale
for nine items. These items are shown in Table 7.1.

- 78 -
Table 7.1: Likert scale items for evaluation of concepts shown as movie clips
(7)Connected to Philips (4) Not connected to Philips (1)
(7)Convenient (4) Inconvenient (1)
(7)Increases Pleasure (4) Increases Hassle (1)
(7)Innovative (4) Ordinary (1)
(7)Strengthens connection between
people and food
(4) Weakens connection between people and
food(1)
(7)Effective solution to reduce food
waste
(4) Not an effective solution to reduce food
waste(1)
(7)Increases Well-Being (4) Decreases Well-Being(1)
(7)Triggers eating more healthily (4) Does not trigger eating more healthily(1)
(7)Compact (4) Spacious(1)
After asking these nine items, the participants were asked whether the concepts were
suitable for their household with a “yes/no” question. Moreover, they were requested to fill in
why they thought that concept was suitable or not.
In the third part of questionnaire, participants were asked to fill their opinions about
the concepts with three open-ended questions. The questions aimed at revealing weak and
strong aspects of the concepts while also asking for suggestions to improve the concepts.
For these reasons, three questions were posed.
- What are the weakest aspects of this concept according to you?
- What are the strongest aspects of this concept according to you?
- Do you have any suggestions to improve this concept?
7.1.1 Participants and Procedure
The data collection was performed between 20 July and 2 August 2010, following a
pilot test. The pilot test was performed with two researchers who are experienced in
designing questionnaire and two individuals (Res. Name: Therese Overbeek, Henriette
Jossen). There were no significant changes needed after the results of the pilot were
evaluated, except some wording corrections and a few changes in the organization of items.
The participants (n=35) were mainly Philips employees in HTC (High Tech Campus,
Eindhoven) who live in the Netherlands. Probability sampling method was used to select
these participants, with the help of internal mailing lists of Philips.

- 79 -
Seven participants stated that they were not wasting food; hence, data from these
participants were removed from the data set. Responses from 28 participants therefore
remained in the data set, with demographic information contained in Table 7.2 and
visualized in Figures 7.2 to 7.6. Participants were 14 female and 14 male. While 13 of them
were 13 Couples without Kids, 9 Immediate Families, 6 Singles. From the education level
aspect, participants were distributes as 17 WO (Master Degree), 8 HBO (Bachelor), 3
Voorgezet Onderwijs (Secondary Schools). Additionally, 1 participant was aged less than
25; 16 between 25 and 34; 7 participants were between 35 and 44; 4 of them were between
45 and 59.
Figure 7.2: Do you throw away food?
Figure 7.3: Distributions of Household Types
Figure 7.4: Distributions of Genders
28
7
YES NO
6
13
9
SINGLE COUPLES WITHOUT KIDS
IMMEDIATE FAMILY
14 14
FEMALE MALE

- 80 -
Figure 7.5: Distributions of Age
Figure 7.6: Distributions of Education
7.1.2 Evaluation of Questionnaire
7.1.2.1 First Part: Food wasting types
Before showing the concepts, participants were asked about their waste behaviors.
They asked to rank the most wasted food type from the list that consists of several food
types. The frequencies of the selected food types were analyzed in SPSS 17 software.
These frequencies were multiplied by 3 (if placed as first rank), by 2 (if placed as second
rank) and by 1 (if placed as third rank).
7.1.2.2 Second Part: 9 –item 7 scaled
The mean value of each item on the Likert scale was determined separately for each
concept; then, the mean values of items were compared in terms of household types and
1
16
74
0 0
LESS THAN
25
25-34 35-44 45-59 60-74 75 AND OVER
0
3
0
8
17

- 81 -
gender. Dependent and Independent Sample T-Tests were conducted by SPSS 17 software
in order to find significant differences between the evaluations of the two concepts.
7.1.2.3 Third Part: Open-ended Questions
Data from the three open-ended questions were analyzed by using thematic coding
and categorization methods. After calculating the frequency of repeated words, Wordle
internet based software was used to generate word clouds. In these clouds, words repeated
more often are presented in larger fonts than those repeated less often.
7.2 Results and Discussion of Study III
In the following section the results of Study III will be presented in four main parts. In
the first part, the participants‟ waste perception in terms of food type is presented. In the
second part, the two developed design concepts (Canvas, Dispense) are compared against
each other with reference to the nine items from the Likert scale questionnaire. In third part,
the weak and strong aspects of Canvas are discussed, along with users‟ suggestions for
improvements.
7.2.1 What food type do people waste most?
Figure 7.7: Percentages of Wasted Food Types
0%
10%
20%
30%
N=28 COUPLES N=13

- 82 -
According to the findings of Study III, couples without kids responded that they wasted
bread slices, vegetables and fruits more than the other food types as seen in Figure 7.7.
Moreover, 6 participants out of 13 stated that bread slices was the most wasted food type
while 2 participants selected vegetables for the most wasted food in their households.
As acknowledged in Chapter 2, Tom and Hannah (2008) stated that the waste amount
of fresh vegetables and salads was higher than any other wasted food type. Wasted bakery
products followed the vegetables and fruits. By comparing the results of Study III with those
of Tom and Hannah‟s study, it can be noticed that there is a difference between what people
waste and what people think that they waste. However, the study of Tom and Hannah was
conducted in the UK while Study III was conducted in the Netherlands. For that reason,
comparison of the two studies is open to discussion, but nevertheless the top three wasted
food types are the same for both studies.
7.2.2 Results of Canvas and Dispense Against Nine Criteria
According to the results of the quantitative part of Study III, Philips Dispense scores
higher (tending towards 7 – see table 7.1) than Philips Canvas in seven out of nine criteria.
Only for the criteria “Innovative - Ordinary” and “Strengthens the connection between food
and humans - Weakens the connection between food and humans” did Philips Canvas score
higher than Philips Dispense. The results are discussed for each criterion in the following
sections individually. The results were prepared for whole group (n=28) and couples without
kids (n=13) because, as acknowledged in Chapter 2, 3, couples without kids waste more
avoidable food than the other household types (Ventour, 2008).
In the following session some abbrevesion are used.
M - Mean
SE - Standart Error
p - Sig. (two tailed) - <.05 –significant ; =.05 – trend ; >.05 not significant
r - Effect Size
t(x) – t test

- 83 -
Figure 7.8: Evaluation against criteria means (*= significant difference) n=28
7.2.2.1 Connection to Philips
As stated in Chapter 5.4, Philips Dispense was positioned to contribute to “Waking up
Experiences and Kitchen Appliances”, in order to have a good connection with Philips
product ranges. Philips Canvas was positioned near to the “Lighting and Kitchen
Appliances” of Philips‟ current product ranges.
In Study III, Couples (n=13) found that both concepts are connected to Philips
strongly but there are no significant differences between these two concepts (Canvas
M=5.62 SE=.331; Dispense M=5.62 SE=.290). From the view of all participants (n=28),
Philips Dispense (M= 5.64) scores slightly better than Canvas (M= 5.36) but still there is no
significant differences.
1.00
2.00
3.00
4.00
5.00
6.00
7.00
All=28Philips Canvas
Philips Dispense
* * **
Mid Point
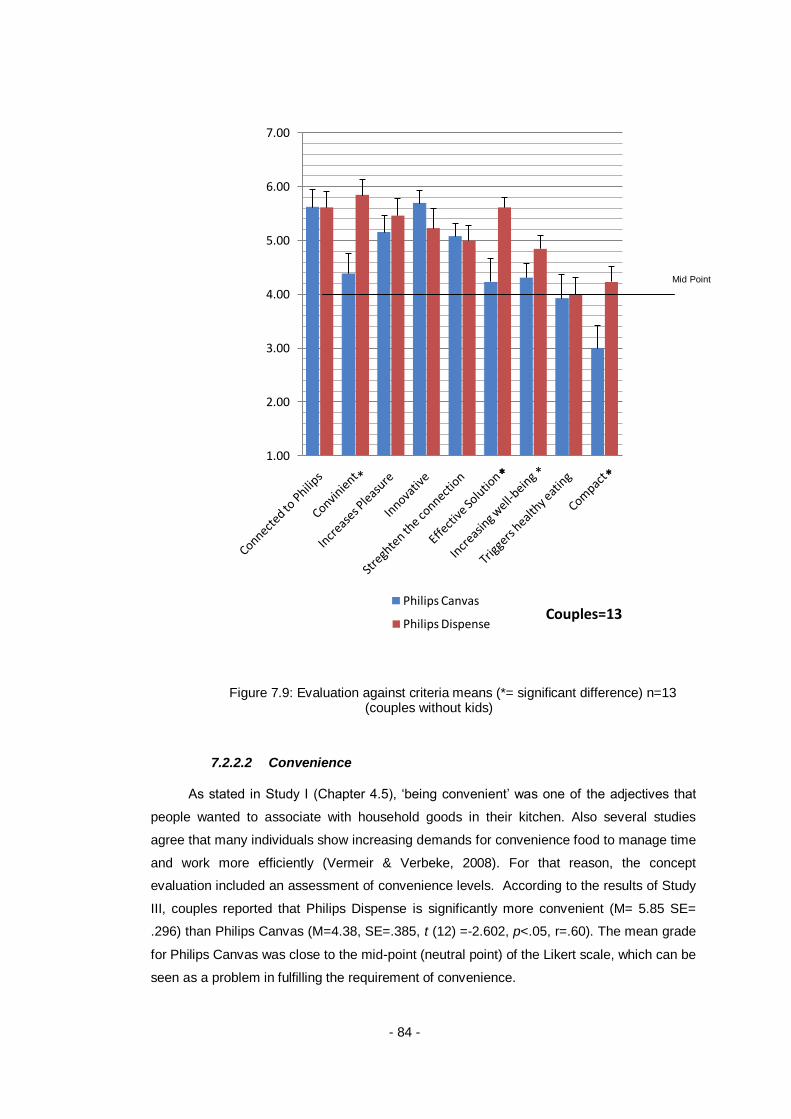
- 84 -
Figure 7.9: Evaluation against criteria means (*= significant difference) n=13 (couples without kids)
7.2.2.2 Convenience
As stated in Study I (Chapter 4.5), „being convenient‟ was one of the adjectives that
people wanted to associate with household goods in their kitchen. Also several studies
agree that many individuals show increasing demands for convenience food to manage time
and work more efficiently (Vermeir & Verbeke, 2008). For that reason, the concept
evaluation included an assessment of convenience levels. According to the results of Study
III, couples reported that Philips Dispense is significantly more convenient (M= 5.85 SE=
.296) than Philips Canvas (M=4.38, SE=.385, t (12) =-2.602, p<.05, r=.60). The mean grade
for Philips Canvas was close to the mid-point (neutral point) of the Likert scale, which can be
seen as a problem in fulfilling the requirement of convenience.
1.00
2.00
3.00
4.00
5.00
6.00
7.00
Couples=13Philips Canvas
Philips Dispense
* * ** ** *
Mid Point

- 85 -
7.2.2.3 Increasing Pleasure
According to Study III, both Canvas (M=5.15, SE=.317) and Dispense (M=5.46,
SE=.317, t (12)= -.693, p>.05, r=.19) increase the pleasure of users and there is significant
difference between the two concepts both for couples (n=13) and all participants(n=28).
7.2.2.4 Innovation
As stated before, Canvas scores higher in “Being Innovative – Being Ordinary” than
Dispense. The mean grade of both Canvas (M=5.69 SE=.237) and Dispense (M= 5.23
SE=.361) are higher than the midpoint (4) of the Likert scale; therefore, it can be stated that
both ideas cannot be named as ordinary ideas.
7.2.2.5 Strengthening Connections between Food and Humans
The ways that Dispense and Canvas strengthen the connection between food and
users are different from each other. Dispense strengthens this connection with daily routines
while adding a desired value (freshness, sliced bread) to a specific food that is often wasted
(bread). On the other hand, Canvas amplifies this connection with a visual reminder function
of foods remaining in the household; the visual reminder can also be used for other
purposes (e.g. lighting, decoration). According to the results of Study III, both Canvas
(M=5.08 SE=.237) and Dispense (M=5.00 SE=.277, t (12) =.201, p>.05, r=.05) strengthen
the connection between food and humans. However, there is no significant difference
between the grades for this criterion.
7.2.2.6 Effective Solution for Reducing Food Waste
As stated before, Dispense finds the equilibrium point between food demand and
supply by monitoring the bread consumption pattern of users. In other words, Dispense
modifies the production according to demand; hence, there will be no bread waste. In case
of Canvas, it has a reminding function that can persuade people to find an equilibrium point
with his own. In other words, Canvas doesn‟t give any recommendation about acquisition of
vegetables and fruits but instead presents the current situation regarding stocks of
vegetables and fruits; users make up their own minds about what to purchase next and
when. From this point of view, Dispense might be seen as a more effective solution for
reducing food waste because it takes some responsibility away from of the user. On the
other hand, Canvas can remind users of the responsibility they have for sensible food
purchases. Indeed, according to the second part of Study III, participants who live as
couples reported that Philips Dispense (M= 5.62 SE= .180) is a significantly more effective
solution for reducing food waste than Philips Canvas (M=4.23, SE=.441, t(12)= -3.95, p<.01,
r=.75). Also, Philips Dispense (M= 5.18 SE= .242) is also found more effective than Canvas
(M=4.29, SE=.316, t (27) = -2.80, p<.01, r=.47) for the full group of participants (n=28).

- 86 -
It can be reiterated that the participants of Study III selected bread as the most
wasted food type (11 times in 1st place); this fact could be a reason of why Dispense was
found a more effective solution for reducing food waste compared to Canvas.
7.2.2.7 Increasing Wellbeing
Wellbeing is defined by Philips as a sense of fulfillment, feeling good and at ease;
feeling comfortable and secure in an environment. According to couples (n=13), there is no
significant difference for the criterion of „increasing wellbeing‟ between Philips Canvas
(M=4.31 SE=.263) and Philips Dispense (M=4.85 SE=.249, t (12) =-1.849, p>.05, r=.47).
7.2.2.8 Triggers Healthy Eating
According to the analysis, both Canvas (M=4.00 SE=.445) and Dispense (M=3.92
SE=.32, t (12) =1.285, p>.05, r=.03) were regarded as neutral for triggering healthy eating.
Therefore it cannot be stated that Canvas or Dispense triggers healthy eating.
7.2.2.9 Space Friendly
Participants who live as couples reported that Philips Dispense was significantly more
compact (M= 4.23 SE= .281) than Philips Canvas (M=3.00, SE=.424, t (12) =-2.704, p<.05,
r=.61). However, both Dispense and Canvas have a low mean that are below the midpoint
(4). Although Dispense scores average; space issue can turn into a problem for both
concepts.. In Study I, participants stated that they do not have enough space for additional
appliances and apparatus in their kitchens.
7.2.3 Strong and Weak Aspects of Concepts and Suggestions
In the following section, the weak and strong aspects of both concepts are discussed.
Firstly, the strong aspects of Canvas are explained; then weak aspects and suggestions
from participants to redress these weak aspects are discussed. After Canvas, Philips
Dispense is discussed in the same manner. As stated before, participants were also asked
open-ended questions. These answers can be found in Appendix G.
7.2.3.1 Philips Canvas: Strong Aspects
In Study III, detailed opinions of participants were gathered using open-ended
questions. Although there were negative opinions (e.g. spacious, not convenient...) about
Philips Canvas, participants also pointed out strong aspects. According to participants‟
opinions, Canvas can reduce vegetable and fruit waste because it makes vegetable and
fruits visible and reminds users to consume food that is going to be rotten soon. Using the
color of vegetables and fruits instead of any added to give such feedback was appreciated
by the participants.

- 87 -
Another strong aspect of Canvas is to build a new ritual for storing behavior.
Participants stated that building up a new ritual for storing could enhance their life especially
with „fun‟ and „pleasure‟ elements. These elements were described insightfully by two
participants whose household types were „immediate family‟ (i.e. they have children). They
said that Canvas can have educational and nutritional benefits for their children to
encourage them to eat more vegetables and fruits while “playing” with Canvas.
Figure 7.10: Word Cloud of Canvas Strong Aspects
Canvas was accepted as a product that can trigger healthy eating because it can
remind people to consume more vegetables and fruits. Some of the participants confessed
that they don‟t consume enough vegetables and fruits even though they know that they need
to consume more. They stated that having a product like Canvas may improve their
commitment to vegetables and fruits.
Another strong aspect of Canvas is to change the kitchen environment with the
lighting elements. Some of the participants stated that they may like to use Canvas for its
properties to change the kitchen environment. They also stated that they would like to save
the created light formation of Canvas and recall it at a later time.
Lastly, as stated in qualitative analysis, participants found Canvas an original and
innovative product. One participant said that, “Canvas is an original way of reducing food
waste which is really appealing…
7.2.3.2 Philips Canvas: Weak Aspects and Suggestions from Participants
According to the analysis of Study III, „space‟ was the weakest aspect of Philips
Canvas (M=3.00, lower than the grade 4 midpoint). Participants stated that the function of
Philips Canvas shows similarities with the function of a refrigerator. For that reason, they did

- 88 -
not think that they may need an additional chilled storage unit, such as Canvas, for storing
vegetables and fruits. Besides that, many participants stated that they did not have an empty
wall to mount Canvas in their kitchen, which highlights to a critical space problem. However,
participants suggested several solutions to get over the space problem.
Figure 7.11: Word Cloud of Canvas Weak Aspects
A common suggestion was to integrate the concept behind Canvas into current
refrigerators. The reason behind this suggestion can be having already a fridge in their
household. According to the Study III, 98% of participants claimed that they have a fridge in
their kitchen. Another suggestion for the space problem was to change the form of Canvas
into a fruit bowl, while preserving the functions.
Another weak aspect of Canvas was considered to be energy consumption. Although
many participants confirmed that Canvas may indeed reduce food waste, some participants
thought that it would increase the energy consumption of a household and that this would be
counter to desired behavior, especially for people who seek a „sustainable‟ lifestyle. For that
reason, Canvas could evoke unpleasant emotions which can also obstruct the acceptance of
Philips Canvas for a certain group. Some participants suggested implementing energy
efficient lighting systems and sensors into Canvas to reduce energy consumption.
Cleaning issues and the rigid space arrangement of Philips Canvas were the other
weak points according to the participants. They stated that they would like to change the
arrangement of spaces not only for functional reasons, such as to cope with different sized
vegetables and fruits, but also to change the arrangement of lights for decorative reasons.
Moreover, some participants claimed that cleaning Canvas would be harder than cleaning a
regular refrigerator because it has many separated compartments. However, having

- 89 -
separated compartments will block the diffusion of ethylene, which reduces the pace of
natural ageing (ExtraFresh).
Figure 7.12: Word Cloud of User Suggestions for Canvas
Early on, it was mentioned that Philips Canvas was evaluated as neither a convenient
nor an inconvenient product (M=4.38, near midpoint). As found in Study I, people would like
to reduce their tasks in the kitchen. However, Canvas tries to reframe the storage task for
fruits and vegetables, instead of diminishing the task. The reason that the midpoint score for
„being convenient‟ was received, could be linked to this reason.
Another weak point of Canvas for some of the participants was the subtlety of
feedback that it provides, instead of solid information. In other words, the feedback style
didn‟t give enough satisfaction to some participants. These participants stated that they
would like to know more about the produce they have stored in Canvas. For instance, one
participant suggested a function for Canvas that transmits information about the quantity of
food and expiry date to a mobile phone.
To sum up, Philips Canvas could reduce domestic food waste (of fruit and vegetables)
if users accept to place the product in their kitchen. However, it seems a little problematic to
integrate such a product into every kitchen due to lack of space. For that reason,
redesigning the concept or integrating it into an existing product (e.g. refrigerator) might
increase the acceptability and uptake of Philips Canvas.

- 90 -
7.2.3.3 Philips Dispense: Strong Aspects
Figure 7.13: Word Cloud of Dispense‟s Strong Aspects
According to the participants, one of the strong aspects of Philips Dispense was to
provide fresh bread every day without bread waste. Having regular patterns in bread
consumption was also accepted by many participants. They stated that tailoring bread
production according to consumption was found logical and promising.
Philips Dispense has a good connection with Philips, since some participants
recognized the similarities of Dispense with Philips Senseo. Philips Senseo is a coffee-
machine that uses its special coffee pads for single or double serves coffee (portioning
coffee) automatically. As a reminder, there was no information about Senseo in the
questionnaire. Therefore, it can be stated that likening the concept to Senseo can be shown
as evidence of a good connection between Philips and Dispense.
Another strong aspect of Dispense is to enhance the waking experience with the smell
of freshly baked bread. Many participants stated that they would like to wake up to a bread
flavor, especially considering they do not have to perform any task to have it. Additionally,
they stated that eating fresh bread every morning may affect the waking experience in a
positive way.
Another highlighted point by participants was to eat bread free of chemical
preservatives, as stated in the product story movie clip. Although some participants knew
that baked food often contains preservatives in order to extend its life, they did not show any
extra effort to purchase more „natural‟ baked produce. However, providing an opportunity to
have natural bread was perceived as a strong aspect of Philips Dispense.

- 91 -
Lastly, many participants stated that Philips Dispense enters the daily routine with a
regular pattern. Therefore they stated that Dispense can be one of the most used kitchen
appliances in their kitchen.
7.2.3.4 Philips Dispense: Weak Aspects and Suggestions from
Participants
Figure 7.14: Word Cloud of Dispense‟s Weak Aspects
According to the participants, Philips Dispense has several weak points even though
most of the participants like the idea of having fresh bread without any bread waste. Firstly,
four participants think that although Philips Dispense may reduce the bread waste, it will
increase the energy consumption of the household since baking requires energy. Moreover,
three participants did not agree that Philips Dispense may save water, since baking also
consumes water.
These statements from participants are somewhat misguided though. Every wasted
bread slice consists of wasted water and energy. In figure 7.16, the life cycle assessment of
hamburger bread can be seen from the perspective of energy usage. According to this chart,
the bakery part of production of hamburger bread consumes 4Mj (1.16 kWh) energy per kg
which also contains several procedures like mixing and baking. On the other hand, using
bread machine per 800gr bread consumes 0.36 kWh (1 kWh= 0.241EUR in the Netherlands
(EU, 2009)) according to sustainweb.org(Sustainweb, 2008 ). From these facts, it can be

- 92 -
stated that Using Dispense for bread can be named under saving energy since it minimizes
the waste.
Figure 7.15: Energy use for hamburger bread taken from (LRF, 2002)
Hoekstra estimated that one bread slice to reach our plates requires 40 liters of
water (Hoekstra & Chapagain, 2005). This water is equal to the amount of water that is
spent showering for five minutes. Since these facts cannot be observed by participants, as
a suggestion, such information needs to be reflected clearly onto the packaging or actual
product of Dispense, in order to change participants‟ minds towards Dispense.
Secondly, some participants pointed out cultural issues of bread consumption. As they
stated, in some western countries, the consumption of bread is not as high as in the
Netherlands. To give an example, the Netherlands consumes three times more bread than
the UK per capita(Euromonitor-International, 2009). Besides that, culture varies the bread
shape and types in some western countries such as France and Italy. For these reasons,
Philips Dispense cannot be named as an appropriate kitchen apparatus for these countries.
Thirdly, some participants wondered about the bread types that will be available for
Philips Dispense. Some thought that there would be only one kind of bread type, which they
viewed negatively. For that reason, they suggested having several kinds of bread to reflect
the wide variety of bread types available in bakeries.
Another weak aspect of Philips Dispense was considered compatibility with irregular
patterns of bread consumption. Although most participants agreed that their bread
consumption is quite patterned, there could be some specific time or circumstances (e.g a

- 93 -
guest, holiday, eating outside) that can disrupt that pattern. For that reason, some
participants suggested having a direct connection with Philips Dispense to customize and
modify the quantity of bread produced.
Another weak aspect of Philips Dispense is that participants did not believe that
Dispense could be produced with current technology. In addition to this, some participants
indicated that “the price” of Dispense was a weak aspect. Interestingly, in the questionnaire
there was no information about the price and production methods of Dispense; however,
participants perceived that Dispense was an expensive high-end product.
Figure 7.16: Word Cloud of User Suggestions for Dispense
Many participants recognized Dispense as a second step of Senseo; hence, their
main suggestions were around this topic. The packages of Philips bread mix were
mentioned as a weak aspect of Dispense: they suggested that the bread packages could
work with a depositing system, similar to some beverage bottles.
Lastly, some participants suggested that although some functions of dispense, such
as slicing, would be admired by some users, it was suggested that these functions could be
user-controllable and adjusted, or even optional.
Figure 7.18 provides results from the questionnaire response to the question, „do you
think that this concept is suitable for your household?‟

- 94 -
Figure 7.17: Do you think that this concept is suitable for your household?
According to participants‟ answers, Philips Dispense fitted into couples‟ households,
whilst Canvas was not accepted as much as Dispense. While eight participants accepted
that Dispense fitted their household, only three participants thought Canvas fitted their
household.
There can be several reason of why people accepted Dispense into their household
instead of Canvas.
Firstly, as stated in previous sections, Canvas occupies more space than Dispense.
For that reason, participants might have thought that Canvas was not suitable for their
household. Secondly, the reason why participants tended to Dispense can also come from
the wasted food type that the product deals with. As stated before, participants thought that
bread slices were the most wasted food type in their households. Therefore participants may
have selected Dispense as an appliance that deals directly with perceived problems in their
household. Thirdly, as acknowledged before, the conceptual approaches of Canvas and
Dispense were very different. While Dispense takes the responsibility of creating food waste
away from users, Canvas has a reminding function to users that does not remove food
waste responsibility but instead reminds users of their wastage responsibilities. Fourthly,
participants stated in Study III that Dispense is more convenient that Canvas. Additionally, it
had been found in Study I, where people expressed desire to reduce their tasks in their
3
10
8
5
YES NO
PHILIPS CANVAS PHILIPS DISPENSE

- 95 -
kitchen. Combining these facts can be another reason for why participants selected
Dispense as a suitable appliance for their household instead of Canvas.
Lastly, according to Walker, people are reluctance to accept innovative ideas and
products (L. J. Walker, 1969). Since Canvas was chosen as more innovative than Dispense,
it can also be the reason of why participants did not select Canvas.

- 96 -
8 CONCLUSIONS
After performing four interconnected studies, the results of this research are
explained. Firstly, the main findings from chapters are explained briefly. Afterwards,
recommendations about product development route of Dispense are explained. In this
section, the adoption of Dispense, relative advantages of Dispense can be found. Lastly,
answers of research questions, limitations and possible improvements for further studies are
discussed.
8.1 Main Findings from Chapters
As stated before in Study I (Chapter 4.4), participants unlikely go food shopping
frequently because they do not want to spend too much time. Thus, they need to store more
food for unexpected situations and upcoming days. Due to having different expiring dates of
different food types and differently located storage units, participants cannot monitor what
they have food as in these storage units. Participants loose connection with acquired food.
The reasons of forgetting are lack of food management (i.e. preparing shopping list, deciding
on menu) external factors (i.e. going out with friends) and physical appearance of storage
units (i.e. non-transparent, located in dark environment). Forgotten food that has limited life
time become rotten or mould which is resulted as an increase the amount of food waste. For
that reason, the acquisition decisions need to be directly connected to consumption
decisions in order to reduce the gap between acquired food and consumed food. In other
words, the amount of stored food needs to be reduced. By reducing the stored food amount
in household and also, as another solution, increasing the storage facilities that amplify the
lifecycle of perishable food types are possible ways to reduce the amount of avoidable food
waste.
In Study II (Chapter 5.4), what participants and designer designed during generative
session matches with the results of Study I. Participants suggested having a monitoring
system that also suggests the recipes for the preparation process. Moreover, participants
want to have these functions not in another form of gadget or product but embedded to
related context because of space problem in the kitchen. From the solutions that they
created, it can be stated that participants are ready to give some of their responsibilities to
the machines and getting advises from machines for gaining free time for themselves. This
finding can be showed as one of the main findings about how to reduce food waste with the
help of product which was used in designing process. However, it is still questionable that

- 97 -
the smart machines can take wasting responsibility from user especially the preparation of
complex foods (i.e. nutrition level, hunger level, cooking skills) or not. For that reason, in
design process, the feasible smart-machine concepts were generated in order to reduce the
food waste in domestic kitchens with a criteria list that was built by the help of Study I, II, and
literature review.
In this research, bread and vegetables were selected because results of Study I, III
and literature shows these food types are wasted more than the other. Starting to enhance
the products that they are related to these food types were accepted as the starting point of
embedding food waste function. For that reason, the concepts were related to mentioned
food types were selected for evaluation.
With the study III, it has been found that people selected (Dispense) a machine that
provides exact amount of food that they need instead of reminding people what food is going
to be expired soon (Canvas). However, this result should not be accepted as reminding
function cannot reduce the food waste. Additionally, there are some other variables (space,
feedback style, having a product that have similar function) that can influence of people
choices.
In short, the food waste function needs to be embedded into the current products and
kitchen environment. While doing it, the portion sizes, understanding the existence and
amount of stored food is the issues that needs to be taken care by manufacturers and
designers. The weight sensors and time (expiring date) functions are the essential issues
that need to be clarified better.
Last but not least, reminders from researcher, people are bombarded with a lot of
information from almost everywhere. Creating useless information about food situation is not
going to increase the well-being of people. For that reason, whatever takes or reminds
responsibility, the information needs to be tailored according to enhance people life. In the
end, every machine is created by human and for human.
8.2 Recommended Product Development Route
Guiltinan J. (1999) stated that depending on the degree of product innovativeness,
managers may establish one of three types of desired outcomes, regarding adoption of new
products and technologies: (1) trial and repurchasing, (2) customer immigration and (3)
innovation adoption and diffusion (Guiltinan, 1999). Moreover, Rogers (1995) discussed the
characteristic of a new product that influences adoption and diffusion under five sub-
categories (Rogers, 1995):
- relative advantage;
- compatibility with values and experiences;

- 98 -
- complexity in use or understanding;
- trialability;
- observability.
In the following part, Philips Dispense is critiqued against Rogers‟s remarks on the
adoption of a new product, so that some of the challenges of taking Dispense from a
concept to a commercialized product can be highlighted.
8.2.1 Relative Advantage of Dispense
According to Rogers (1995), competitive price, performance, social prestige, savings
in time and effort, a decrease in discomfort and immediacy of benefit can be a relative
advantage of a product. In table 8.X, the relative advantages of Dispense are shown by
comparing with buying daily bread, baking your own bread and storing bread in a freezer.
The relative advantages of Dispense are:
- providing freshly baked and sliced bread in a daily routine that will result in
minimal food waste;
- enabling control and monitoring of bread consumption;
- repetitive interaction – (at least) 5 days in a week; entering daily routine
- preserving the qualities of bread which can be sensed by olfactory,
gustatory and visual senses.
Table 8.1: Comparison of buying daily bread, baking your own bread, using Dispense, and storing bread in a freezer
With the results of Study I, II and III, it can be stated that saving time and reducing
tasks in the kitchen environment are phrases that people would like to associate with
appliances in their kitchen. „Saving time‟ and „reducing tasks‟ are the main reasons why the
target user group for Dispense (busy couple without kids) generally stays out of buying daily
bread and baking bread with conventional bread machines. To illustrate, if an individual
needs to bake his/her own bread, it is required to scale ingredients, control whether
everything is ok and then slice the loaf of bread. Similarly, going bakery shop everyday for
Buying Daily Bread Baking your own
bread
Using Dispense Storing bread in the
freezer (current)
Time-Task - -- ++ ++
Sensational
Connection
+ ++ ++ --
Portion Size - - ++ ++
Price + ++ + ++
Waste - + ++ ++

- 99 -
purchasing bread takes time too and can be named as an increased task. However,
Dispense takes not the responsibility of baked-related tasks but also it takes the
responsibility of not wasting bread slices. One of the relative advantages of Dispense is
reducing task and saving time than the other possible behaviors and products.
Philips Dispense provides bread in a daily routine while preserving its most valued
qualities (freshness, warmth, taste, flavor, smell). According to the results of Study III, it can
be stated that participants would like to have these perceivable qualities. These qualities
can increase the sensational connection between product and user that can be also named
as another relative advantage of Dispense. In other words, Dispense enhances the
experiences by interconnecting the sensation channels (Olfactory + Gustatory + Visual).
In particular, in the course of time, „buying more‟ and „storing in the cold storage unit‟
are accepted as the most efficient ways according to the target group, because they provide
a way of saving time and increasing availability of food, while having economic benefits. This
behavior is supported by pricing and portion strategies of retail stores and continues today.
In short, these external food acquisition related variables encourages buying more with a
cheap price. This behavior causes the more generated food waste in domestic kitchens.
Philips Dispense cannot compete with the other situation in terms of economical price.
For that reason, instead of competing in terms of economic benefits, competing on the
perceivable qualities such as freshness, quality of bread produced by Dispense, saving
money and water due to not wasting can be perceived as another relative advantage of
Dispense according to the target group since they are aware of what they waste (Study I,III).
According to Study III, only 13% of the target user group (young busy couples and
singles) have a bread machine, while this number is larger (20%) in the whole population. It
can be clearly stated that the target user group is biased against having a machine for
baking bread, since they perceived such products as not convenient enough to put into their
everyday life (Study I, II and III). For that reason, conventional bread-making appliances end
up in a garage or cellar instead of holding a place in the kitchen environment. However,
Philips Dispense has been found as a convenient product according to Study III. Moreover,
Dispense can find a place for itself or seize the place of another appliance due to entering
daily routine and continuous use patterns.
To sum up, while Dispense provides according to direct need, it minimizes the number
of tasks for users, by taking care of the bread baking process including scaling, mixing, and
slicing. Hence, it is suggested with Philips Dispense that:
- individuals will not consume too much time, which is important for them;
- individuals will save money because they will not waste bread;

- 100 -
- individuals will perceive that they consume better food because of valued
qualities;
- individuals can monitor their consumption behavior.
8.2.2 Compatibility with Values and Experiences
According to Rogers (1995), innovation needs to be compatible with (1) socio-cultural
values and beliefs of the market; (2) previously introduced ideas/practices; and (3) felt needs
for the innovation.
In current market, as stated before, there are dozens of bread machines
manufactured by different companies. Therefore, it can be stated that „baking your own
bread‟ is not a novel idea or practice. However, adding an automated scaling and slicing
function contributes to Dispense being a novel form of bread making and consumption.
Although Philips Dispense follows previously introduced ideas and practices, it is
shielded with the future socio-cultural values and beliefs of the market. Several studies state
that having a sustainable lifestyle is predicted to become increasingly popular in the near
future (Chapman, 2005; Shedroff, 2009). Therefore, it can be stated that „being more
sustainable‟ and „preventing food waste (bread)‟ strengthen the concept of Dispense with
regard to socio-cultural values and beliefs.
According to Study I, II and III, it can be stated that bread is perceived as the most
wasted food type according to the individuals. People‟s perception is not much different than
the facts of food waste. According to Tom and Hannah (2008), people who live in the UK
throw away 600,000 tons bread per year, which has value of 750 million Euros. If these facts
are embedded in a product launch strategy, customers can connect with the need for a
product innovation to address the bread wastage problem.
8.2.3 Complexity in Use or Understanding
According to Rogers (1995), in some cases customers believe that they need new
proficiency to properly use or understand how a product works. Although this statement is
correct for some products, Dispense is designed for simplicity in use, which is a key point
towards reducing the number of tasks in everyday life. However, the product needs to give
feedback to users in order to show the effects of minimizing food waste in households.
Details of carbon footprints could be the model that is embedded into Dispense, for giving
feedback of saved food since it has become quite widely known (Safire, 2008). However,
using water footprint (Hoekstra, 2003) is more appropriate for Dispense for the following
reasons.

- 101 -
- Water is more tangible than carbon; it is consumed throughout the day but
especially during activities such as a morning shower (prior to consuming
bread prepared by Dispense).
- Water is spatially explicit (not abstract) and locally sourced.
Hoekstra (2008) reports that one slice of bread has required 40 liters of water before it
comes to our plates. The same amount of water is consumed in a 5 minutes shower.
Therefore, saving bread slices can also be redefined as saving water, which is an important
principle behind „being sustainable‟ (Water Footprint, 2009; Kuijer 2009). Moreover, using a
water print is more feasible, since Dispense will use electricity - which can be perceived as
increasing the carbon footprint of food.
8.2.4 Trialability
Rogers (1995) stated that sample test-drives, trials are ways of reducing customer
uncertainty with respect to how well an innovation will perform.
In the case of Dispense, these methods can be used as a promotion strategy for a
launch program. Allowing potential customers to test the bread quality in retail stores can be
a good way of showing what people are missing and what they can have if they purchase
the product. Additionally, the participants of Study III stated that Dispense showed
similarities with Philips Senseo. Therefore, the same trialability methods can be used for
Dispense.
8.2.5 Observability
According to Rogers (1995), people are more likely adopt an innovation if the benefits
can be comprehended from observing tangible features of a product. He also noted that
non-observable benefits (e.g. a product that fights tooth decay) or subjective benefits (e.g.
something that „tastes great‟) require far more validation in order to be accepted.
Reducing bread waste can be observed in the long term but its advantage cannot be
monitored in one or two days. Therefore, one of the design methods associated with Design
for Intent, bundling, was used during the design process for Dispense. Freshness, which is
an adjective that bread looses after a while, and reducing bread waste were embedded into
Dispense to increase the observable tangible features of the product. The connection
between trialability and observability is a vital point for Dispense.
To sum up, Philips Dispense can be adopted by our target user group (couples
without kids). However, the product requires more technological, marketing and user studies
to be confident of successes. Therefore a short technological feasibility study has been
made as an additional piece of work.

- 102 -
8.3 Short Technological Feasibility Study
Philips Dispense is a vertical positioned bread machine that uses extrusion bread
production methods. As with conventional bread-making machines, it uses an electrical
motor for kneeing the dough. However, due to the vertical orientation, the same electrical
motor with some improvements can be used for slicing bread. Moreover, silicon material is
used instead of non-stick coated metal moulds for Dispense mould. Therefore, the cleaning
of Dispense and shaping of bread is expected to be easier than existing appliances.
8.3.1 Extrusion Production for Baking Bread
Extrusion production methods have been used in the bakery industry in order to
produce snacks and pasta (Figure 8.1). The prepared dough is pushed through a die,
therefore giving the dough the preferred form of the die openings. Although, it is possible to
produce different shaped breads with this technology, Philips Dispense will use this method
to have stereotype bread shapes according to people preferences. According to a small
study that was conducted by researcher, people chose conventional bread shapes instead
of circle and super-ellipse. In this small study, none of participants selected super-ellipse
shaped bread slice. Since the number of participants was quite low, an intensive study
should be done for understanding the user preferences about bread slice shapes.
Figure 8.1: Extrusion production method for pasta (above), baking bread in a water bottle

- 103 -
8.3.2 Electrical Motor for Slicing and Mixing
In current bread machines, there is an electrical motor for mixing the dough, which
creates a rotational movement within the mixer. Current food slicers also use an electrical
motor for creating the same rotational movement. Therefore, these motions can be provided
from one motor placed into Dispense. In Figure 8.2, a slicer mechanism that is used in food
processor appliances can be seen.
8.3.3 Flexibility of Silicon Moulds
In current bread machines, the bread mould is made of metal, which is coated by the
nonstick materials Teflon (until 2015) and Thermolon. However, silicone solves the sticking
solution with its flexibility. In Figure 8.2, an example silicone bread mould produced by
Wilton Easy Flex is shown.
Figure 8.2: Silicone mould by Wilton Easy Flex (left), an example slicing mechanism by Kenwood (middle), food scale by Direct Industry (right)
8.3.4 Integrated Weight Scale to Monitor Production and Consumption
As stated before, understanding the amount and existence of food is an essential
issue to build up products that can reduce food waste. For that reason, a weight scale is
integrated for scaling the amount of flour, water and liquid margarine. With the help of scale,
the exact amount bread can be provided for the householders.
8.4 Answers to Research Questions
Do people think that they waste food?
According to the Study III, 28 out of 35 people think that they waste food. The most
wasted food types are bakery (bread), vegetables, fruits and leftovers. During study I, it was
found that couples without kids think that they waste bread, vegetables and fruits whilst the
immediate families stated that they waste generally leftovers. If the results of these
interconnected studies were compared to the previous food waste studies that were
conducted in the UK, it can be stated that the amount of generated food and wasted food
types are different from each other.
- 104 -
What are the main reasons for people’s wasting behavior?
According to this study, it can be stated that there are two major wasting behavior
types that are intentionally and unintentionally wasting behaviors.
People who intentionally waste food seek for perceivable quality that matches with
their perception. It can be stated that seeking perceivable quality is one of the main reason
of wasting food behavior for this group. Moreover, the external factors, cheapness and high
availability of food encourage these people‟s wasting behavior. This group is not that big and
can be called minority.
There are also some people that waste food unintentionally. They generally acquired
more food in one big shopping in order to have an economical benefit because they know
and apply the rule of current system: if people buy more, they will pay less. Acquiring more
food increases the gap between consumed food and acquired food. For that reason, these
group need to put the food into storage units which can cause a connection lost between
people and food. Due to having much and differently located stored food, people cannot
monitor what they have. Discovering the wasted food during cleaning or remembering it
when it is needed, can be show as an evidence of this connection lost.
Lastly, people generally do not want to spend too much time for food preparation if it
is not for something special (weekend, festival food, food for guests). They try to reduce
preparation time by skipping some tasks that are related to determine the portion size of
food. Although 5 participants have a weigh measurement product, they do not use it
because they find to use these product time consuming and hassle.
Is it possible to solve food wastage problem with the help of design
thinking? What kind of product/service solutions are appropriate to users
and their environment?
Yes, it is possible to solve food wastage problem with the help of products and
services. Currently, in our everyday life, people are surrounded by many objects and these
objects influence the behavior of users (Shove, Watson, Hand, & Ingram, 2007). In the
kitchen environment, the same statement is still valid.
As stated before, people tend to buy more food in one time instead of shopping
everyday therefore; they need to store the food in several storage units. However, the
communication between these storage units and people is not good enough thus people
forget about what they have as food. The food that has short life cycle faces with being
mould before consumption. For that reason, the storage products need to be redesigned for
increasing the communication with people and enhancing preservation in order to extend
life-cycle of food. Participants of this research stated that instead of having this kind of
function in a new form of product, it is better to embed this function into existing products

- 105 -
which are located in the kitchen context according to them. Moreover, they want to
communicate with products when they are out of kitchen environment like during acquisition
phase.
Food preparation generally consists of several interconnected tasks such as scaling,
chopping, heating and serving. Since there are many tasks before the consumption, people
tend to skip several tasks but especially scaling since they find that measuring and scaling
related tasks are time-consuming and not convenient. For that reason, assisting people
during preparation or redesigning preparation related product into more intuitively used
products can be another way to minimizing food waste which is related to portion problem.
In Western Society, the food is cheap and highly available. Having a lot of choices
and paying less amount of money makes people to search for the most quality ones. In this
study, many participants of this research highlighted the importance of quality of food and
they are picky about food intake decisions. For that reason, products that are increasing or
preserving perceivable qualities of food can also indirectly reduce the amount of food waste.
The same strategy was mentioned for promoting organic food types in several journal and
reports (DEFRA, 2008; Vermeir & Verbeke, 2008).
According to this research, participants generally do not want to not waste food;
however, it is hard to see the reflection of this consciousness on their act and behavior.
People do not want to have strict plans which can reduce the amount of waste by food
planning and management because there are other external and internal factors that are
more important than not wasting food. In study II (5.1.1.1), participants have different kind of
excuses for not following their plans even one day before. For that reason, persuading
people to follow their plans about their food decisions can be also a solution that reduces the
generated food waste amount in domestic kitchens.
To sum up, reducing a percentage of food waste in domestic kitchen can be achieved
by following only one possible approaches that is mentioned; however in order to catch zero
food waste level, these approaches suggested to be implemented altogether to the kitchen
environment. .
8.5 Limitations of Study and Possible Improvements
There are several limitations about this study. Firstly, people were asked about their
waste behavior and opinion with interviews and questionnaire. Therefore, there can be
difference between what people think and what people waste especially the amount of food
waste. In Study II, one participant realized after keeping diary that she waste more than what
she think. This difference between what people think and waste could be named under
limitations of study. For clarifying this difference, collecting and weighting the exact amount
of food waste of domestic kitchen could be proposed as a possible improvement.
- 106 -
Secondly, the products ideas were in the form of movie clips and participants did not
feel the appearance and the interaction with product ideas. Building prototypes and testing
these prototypes that can be integrated to users‟ daily life is suggested as a possible
improvements of this study. By testing these prototypes in a long period, the effectiveness
of these concepts can be turned into solid data. As a reminder, the effects of product may
not be seen in short term therefore having long-termed observation is also a necessity of
further researches.
Thirdly, the sample group can be accepted as too small to generalizing the whole
population. For that reason, another possible improvement is to conduct same study with a
bigger sample group.
Lastly, this study was conducted in the Netherlands. By following the same steps of
this research in another country or culture enables to compare if there is significant
differences between people perception towards food waste. To conclude, the material
presented in this thesis was aiming to create a framework for designing a product/service
that can help user reduce the waste of perishable food types in domestic kitchens of
Western Countries. It is assumed that the findings of this study would contribute to show
possible ways to designers for designing products/services that can help user to reduce food
waste.
8.6 Further Research for Dispense
Additionally, in Study III, participants suggested to improve several aspects of
Dispense and Canvas that needs also further researches. These possible ways are
discussed in Chapter 7.2.3.2 and 7.2.3.4. According to these suggestions, the preferred
bread slice shape, preferred bread types (flavor), bread slice thickness can be addressed as
further research for Dispense.
Bread is a cultural phenomenon and Dispense is not a product for every culture.
Therefore, another further research topic is to find out in which countries bread is wasted
more than other perishable food types. By answering this question, possible markets of
Dispense can be clarified.
In short technological feasibility study (Chapter 8.3), the possible technologies were
pointed out; however, combining these solutions into one product needs more detailed
design process. Therefore, an manufacturing based feasibility study is also recommended
as in further research.

- 107 -
8.7 Personal Reflections on Researching and Designing
As stated before, in Study I, the aim of the interviewing sessions is to explore the
users‟ perception towards food waste problem from different angles. Although these users
can be grouped under one category, their experiences and lifestyles can be different and
point out hidden details. For that reason, designer could try to get differentiated information
from every user. During these interviews, using metaphoric connections and adjectives
could be helpful while trying to identify problem. Also, asking “why?” and “how?” questions
during interview may trigger user to explore the issue in a deeper sense. To give an
example, one of participants in Study I selected bread as the most wasted food type after
asking defined questions. His answer was that he did not like the dried bread. Researcher
asked which bread is not dried. The answer of the participant was not like the edge. In
following interview session, researcher asked “Can you remember how many slices you
threw away if you wasted bread in last two weeks? Do you throw away the edges of the
bread?” questions in a sequence although it is not in the list. Five participants pointed out
the edges of bread as the most wasted part of the bread. In this example, researcher
modified the structure of interview questions and he added one question after conducting the
interview to several participants. In short, instead of having static question list, having a
dynamic question list that has free slots for future questions can be helpful to find out details
that can be used in design phase. As a reminder, interviews are based on the words and
participants tend to distort the reality especially if the subject accuse user like in this
research. In these cases, researchers should ask test questions in order to clarify the
validity of information.
Generative sessions are very valuable before starting any design phase because
the problems turn into raw design ideas with the help of participants. In this study, I chose to
have a session that consists of both designers and users instead of having them separately.
The reason of this decision was providing an environment enable me to gather different
designer visions towards to the same problem. In Study II, it can be stated that there is a
significant differences in terms of matureness between the ideas that created by designers
and users. While designers tried to visualize their ideas, the users wrote the basis of ideas.
Researcher should be turn to designer in this session. From the results of generative
session, designer could have opinion what kind of products he should design. In Study II, the
smartness was repeated pattern for created ideas. In generative session, designer should
not be afraid of interpreting the gathered data with his vision because the vision of designer
accelerates finding novel ideas.

- 108 -
Figure 8.3: Detailed Model of Philips Dispense
In particular, connecting what people said and dreamed into one, helped to create a
design criteria list that enabled designer to find a fixation point. Instead of floating over
endless design ideas, designer could evaluate design ideas before having a user evaluation.
Thus, the cost of design research and consumed time can be optimized. After selecting
several design ideas with a well-structured criteria list, a user evaluation study is needed to
test whether users interpret the selected ideas as same as the designer. In user evaluation,
getting the user suggestions, negative and positive aspects according to users can be prove
of which criterion is accomplished and which is not. Moreover, these gathered data from
user evaluation study enables designer to redesign the concept until reaching a point that
satisfies both designer and users. In the first user evaluations (Chapter 7), instead of having
a prototype, scenario-based movie-clips were prepared because a movie clip is cheaper and
more flexible to change than an existing prototype. In the next user evaluation, a more
detailed concept can be tested with another user evaluation. In figure 8.3, more detailed
version of Dispense can be seen.
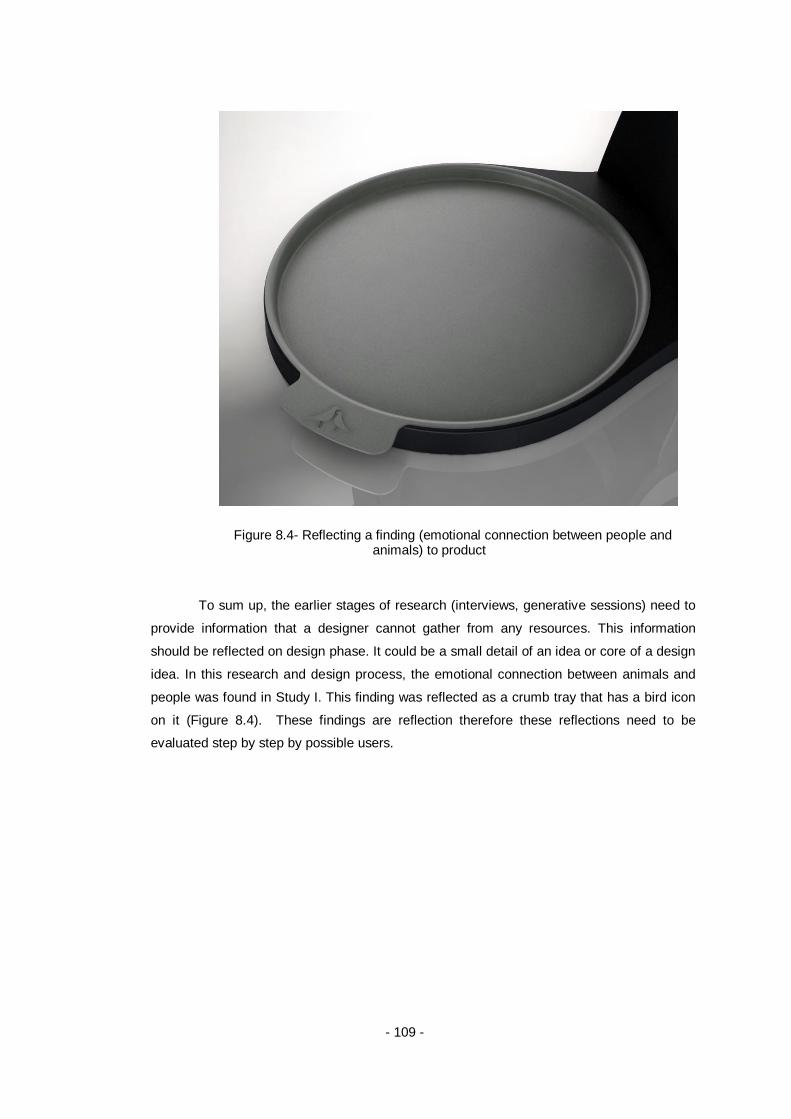
- 109 -
Figure 8.4- Reflecting a finding (emotional connection between people and animals) to product
To sum up, the earlier stages of research (interviews, generative sessions) need to
provide information that a designer cannot gather from any resources. This information
should be reflected on design phase. It could be a small detail of an idea or core of a design
idea. In this research and design process, the emotional connection between animals and
people was found in Study I. This finding was reflected as a crumb tray that has a bird icon
on it (Figure 8.4). These findings are reflection therefore these reflections need to be
evaluated step by step by possible users.

- 110 -
REFERENCES
Allday, E. (2009, 05.02.2009). San Francisco to convert guckiest cooking grease to
fuel. San Francisco Chronicle, from http://www.sfgate.com/cgi-
bin/article.cgi?f=/c/a/2009/02/05/BA5D15NJD0.DTL
Baqtiste, N. J. (2007). People,Nature & Waste: Ecological Value of Waste in Urban
Areas. Bauhaus, Weimar.
Bench, M., Woodard, R., & Stantzos, N. (2003). Minimisation of Food Waste through
Home Digestion: Results of trials in West Sussex: WERG, University of Brighton.
Broer, S., & Titheridge, H. (2010). Enabling low-carbon living in new UK housing
developments. Management of Environmental Quality: An International Journal,
Vol.21(No.1), 90-107
Chapman, J. (2005). Emotionally Durable Design: Objects, Experiences and
Empathy: Earthscan.
Chowhund (2010). Ox Penis.Seriously. Retrieved 24.08, 2010, from
http://chowhound.chow.com/topics/600332
Copenhagen (2009). World Business Summit on Climate Change, Copenhagen
DEFRA (2008). A Framework for Pro-environmental Behaviours. London DEFRA.
Dematte, M. L., Sanabria, D., & Spence, C. (2006). Cross-Modal Associations
Between Odors and Colors. Chemical Senses, 31, 291-300.
Department of Defense, & Administration, N. A. a. S. (2009). Federal Acquisition
Regulation; FAR Case 2008-017, Federal Food Donation Act of 2008. Retrieved 25.08.2010.
from http://edocket.access.gpo.gov/2009/E9-5861.htm.
Making waste work: A strategy for sustainable waste management in England and
Wales (1995).
Ehrenfeld, J. R. (2008). Sustainability by Design: A Subversive Strategy for
Transforming Our Consumer Culture. London: Yale University Press/ New Haven and
London.
El-Haggar, S. (2007). Sustainable Industrial Design and Waste Management: Cradle-
to-cradle for Sustainable Development. London: Elsevier.

- 111 -
El-Haggar, S., Hamouda, M. F., & Elbieh, M. A. (1998). Compositing of Vegetable
Waste in Subtropical Climates. Int. J. Environment and Pollution, 11(2), 211-227.
EPA, U. E. P. A. (2006, 25.08.2010). Food Scraps Go to the Animals: Barthold
Recycling and Roll-off Services, from
http://www.epa.gov/osw/conserve/materials/organics/food/success/barthold.pdf
EPA, U. E. P. A. (2007, 20.08.2010). from
http://www.epa.gov/osw/conserve/materials/organics/food/success/rutgers.pdf
EPA, U. E. P. A. (2009, 25.08.2010). Feeding Animals - The Business Solution to
Food Scraps, from
http://www.epa.gov/osw/conserve/materials/organics/food/success/rutgers.pdf
EPA, U. E. P. A. (2010). Food Waste
EU (2009). Europe's Energy Portal (www.energy.eu).
Euromonitor-International (2009). London: Euromonitor
European Parliament, C. (2008). Directive 2008/98/EC of the European Parliament
and of the Council of 19 November 2008 on waste and repealing certain Directives. from
http://eur-lex.europa.eu/LexUriServ/LexUriServ.do?uri=CELEX:32008L0098:EN:NOT.
ExtraFresh. from http://extrafresh.com.au/
Faber, M., Petersen, T., & Schiller, J. (2002). Homo oeconomicus and homo politicus
in Ecological Economics. Ecological Economics, 40, 323-333.
Falk, P. (1994). The Consuming Body. London: Sage Publications.
Griffin, M., Sobal, J., & Lynson, T. A. (2009). An analysis of a community food waste
stream. Agric Hum Values, Vol.26, 67-81.
Guiltinan, J. P. (1999). Launch Strategy, Launch Tactics and Demand Outcomes. J
PROD INNOV MANAG, 16, 509-529.
Hall, K. D., Guo, J., Dore, M., & Chow, C. C. (2009). The Progressive Increase of
Food Waste in America and Its Environmental Impact. PLoS ONE, 4(11), 6.
Hoekstra, A., & Chapagain, A. (2005). De water-voetafdruk van de Nederlanders en
de wereldbevolking. H2O, 37-41.
Hoekstra, A., Chapagain, A. K., Aldaya, M. M., & Mekonnen, M. M. (2009). Water
Footprint Manual -State of the Art 2009-. Enschede: Water Footprint Network.
Hunch (2010). Wierd Foods, from http://hunch.com/weird-foods/ox-penis/1640563/

- 112 -
IGD (2007, 24.08.2010). Household Foodwaste, from
http://www.igd.org.uk/index.asp?id=1&fid=1&sid=5&tid=153&foid=70&cid=298
Johnson, D., Hipps, N., & Hails, S. (2008). Helping Consumers Reduce Fruit and
Vegetable Waste: Final Report WRAP.
Johnson, D., Hipps, N., & Hails, S. (2008). Helping Consumers Reduce Fruit and
Vegetable Waste: Final Report.
Kantor, L. S., Lipton, K., Manchester, A., & Oliveira, V. (1997). Estimating and
Addressing America's Food Losses. Food Review, 20, 2-12.
Keyson, V. D. (2008). The Experience of Intelligent Products. In H. N. J. Schifferstein
& P. P. M. Hekkert (Eds.), Product Experience. Amsterdam: Elsevier.
Kirshenbaum, S. R. (2010, 14.08.2010). Waste not, want less. New Scientist.
Kyoto (1998). Report of the Conference of the Parties on its third session, held at
Kyoto. Paper presented at the United Nations Framework Convention on Climate Change,
Kyoto.
Lakeland (2010). Retrieved 25.08, 2010, from
http://www.lakeland.co.uk/F/product/1932_1094_1092
Lenneke Kuijer, & Jong, A. d. (2009). A Practice Oriented Approach to User Centered
Sustainable Design Japan Society of Mechanical Engineers, 6.
Linderhof, V., Kooreman, P., Allers, M., & Wiersma, D. (2001). Weight-based pricing
in the collection of household waste: the Oostzaan Case. Resource and Energy Economics,
Vol 23, 359-371
Newswire (2008). San Francisco Hits 70 Percent City Recycling Rate. Environment
News Service, from http://www.ens-newswire.com/ens/apr2008/2008-04-24-092.asp
Norman, A. D. (2009, Jan+Feb ). People are from Earth, Machines are from Outer
Space. Interactions, 39.
Pocock, R., Stone, I., Clive, H., Smith, R., & M.E.L, J. J. o. (2008). Barriers to
recycling at home: WRAP.
Quested, T., & Johnson, H. (2009). Household Food and Drink Waste in the UK.
Banbury: Wrap.
Rogers, E. (1995). Diffusion of Innovation 4th Edition (4th Edition ed.). New York:
Free Press.

- 113 -
Sakai, K., Taniguchi, M., Miura, S., Ohara, H., Matsumoto, T., & Shirai, Y. (2004).
Making Plastics from Garbage: A Novel Process for Poly-L-Lactate Production from
Municipal Food Waste. journal of Industrial Ecology, Volume 7(Number 3-4), 63-74.
Sanders, E. B. (2001). Virtuosos of the experience domain. Paper presented at the
IDSA Education Conference, London.
Schifferstein, H. N. J., & Tanudjaja, I. (2004 ). Visualizing fragrances through colors:
the mediating role of emotions. Perception, 33, 1249-1266.
Shedroff, N. (2009). Design is the Problem: The future of Design Must be Sustainable.
Brooklyn, New York: Rosenfeld Media.
Shove, E., Watson, M., Hand, M., & Ingram, J. (2007). The design of everday life.
Oxford|New York: Berg.
Skoet, J., & Stamoulis, K. (2006). The State of Food Insecurity in the World. Rome:
Food and Agriculture Organization of the United Nations.
Sleeswijk Visser , F., Stappers, P. J., & Van der Lugt, R. (2005). Context mapping In
P. J. Stappers, R. v. d. Lugt, P. P. M. Hekkert & F. S. Visser (Eds.), Context and
Conceptualization (pp. 25-50). Delft: TU Delft Industrial Design Faculty.
Sobal, J., Kettel Khan, L., & Bisogni, C. (1998). A conceptual model of the food and
nutrition system. Soc. Sci. Med., Vol.47(No.7), 853-863.
Sonneveld. Retrieved 25.08, 2010, from http://www.sonneveld.com/nl/
Sustainweb (2008 ). Bread Machines - Saving Energy and Cost Retrieved 2.9, 2010,
from www.sustainweb.org/realbread/bread_machines
Tassoul, M. (2009). Creative Facilitation (3rd edition ed.). Delft: VSSD.
United States Department of Agriculture, U. (1998). Swine Brucellosis
Control/Eradication (State-Federal-Industry Uniform Methods and Rules).
http://www.aphis.usda.gov/animal_health/animal_dis_spec/swine/downloads/sbruumr.pdf
Ventour, L. (2008). The food that we waste: WRAP.
Vermeir, I., & Verbeke, W. (2008). Sustainable food consumption among adults in
Belgium: Theory of planned behavior and he role of confidence and values Ecological
Economics, 64, 542-553.
Walker, L. J. (1969). The Diffusion of Innovations among the American States. The
American Political Science Review, 63(3), 880-889.
Walker, P. (2000). Food Residuals: Waste Product, By-product, or Coproduct. In M. L.
Westendorf (Ed.), Food Waste to Animal Feed (pp. 17-31): Iowa State University Press.

- 114 -
Westendorf, M. L. (2000). Food Waste as Animal Feed - An introduction. In M. L.
Westendorf (Ed.), Food Waste to Animal Feed (pp. 3-16). Iowa: Iowa State University Press.
Womack, P. J., & Jones, D. T. (1996). Beyond Toyota: how to root out waste and
persue perfection. Harvard Business Review(September-Octover 1996), 16.
zerowaste.org. Retrieved 20.08.2010, from http://www.zerowaste.org/

- 115 -
APPENDICES

- 116 -
A.STUDY I – INTERVIEW FORMS
Consent Form
I had sufficient time to consider my participation into this investigation and I am aware
that participation into this investigation is completely voluntary. I realize that I may decide to
refuse participation or stop participation at any time.
I have been told that this session will be recorded for later analysis and it will never be
shared by anyone except members of the research and team without my express permission.
I understand and agree that personal information about me will be collected during this
investigation, which will be used and processed anonimized (manually and/or by computer) by
the researcher responsible for this investigation.
I acknowledge that participation in this study may include access to Philips' proprietary
information and agree that I will maintain full secrecy and confidentiality with regard to Philips'
proprietary information which has explicitly been indicated as such or which should reasonably
have been understood by me to be of Philips' proprietary/confidential nature.
I have been informed and understand my role in the registration, participation and
execution of the above mentioned investigation. I understand that I am entitled to access the
personal information collected about me and to have inaccuracies corrected.
I have read and understand the text.
Participant’s Signature and Date
Participants’s Name
Researchers’ Signature and Date
Ahmet Bektes Researchers’s Name
[email protected] 0 614 370729

- 117 -
Demographic Information:
Age: * Less than 25 years
25-34 years
35-44 years
45-59 years
60-74 years
75 years or older
Gender: * Male
Female
Occupation * Employed
Unemployed
Student
Retired
Unable to work for medical reasons
Education Level *
Basisonderwijs Voorgezet Onderwijs(VMBO,HAVO,VWO)
MBO
HBO
WO
Annual Household Income *
< 18.000 EUR
18.000 – 27.000 EUR
27.000 – 36.000 EUR
36.000 – 45.000 EUR
45.000 – 54.000 EUR
54.000 – 63.000 EUR
> 63.000 EUR
I don't want to share this information
Household type: *
Couple (without kids)
Nuclear (with one or two kids)
Extended (grandmother or grandfather lives with the family)
One-Person (living alone)
Single-Parent (living with kids but without wife or husband )
Living with Friends
Please mark the products or services that you have in your kitchen context
Refrigerator
Freezer
Stove
Oven
Microwave
Water boiler(Kattle)
Fryer
Coffee/Tea Machine
Juicer
Television
Radio
Newspaper Subscription
Internet Connection (3G)
Hood Fume (Aspirator)
Composter
Bread Machine
Toaster
Gourmet Machine

- 118 -
Further Contact:
Do you want to be a participant for further research of this study? * Yes
No
Phone*
E-mail *
City
* = Input is required

- 119 -
o Potatoes and Onions ……………………………………………………………………………………….
o Bread Slices ……………………………………………………………………………………………………
o Fruits ……………………………………………………………………………………………………………..
o Vegetables ……………………………………………………………………………………………………..
o Milk, Yoghurt and Cheese …………………………………………………………………………………
o Meat and Fish …………………………………………………………………………………………………
o Prepared Salad ………………………………………………………………………………………………..
o Sliced Fruit ………………………………………………………………………………………………………
o Prepared Meal Sandwiches ………………………………………………………………………………..
o Home Cooked/Prepared Meal …………………………………………………………………………….
1- Which one do you think that you waste more than the others? Which one do you think
less? Why? Can you put them into an order? (First three and last three)
2- Which one is easier to avoid wasting than the others? Which one is the hardest to
avoid? Can you put them into an order?

- 120 -
In this section, you are asked to mark vegetables and fruits that you buy every week.
Artichokes/ Artisjokken
Asparagus/ Asperge
Bananas/ Bananen
Basil
Broccoli
Cherries/Kersen
Corn /Mais
Dill /Dille
Green beans / Groene Bonen
Mushrooms / Champignons
Strawberries / Aardbeien
Watercress / Waterkers
Arugula/ Rucola
Avocados/ Avocado's
Cucumbers/ Komkommers
Eggplant/
Aubergine
Grapes/ Druiven
Lettuce/ Sla
Limes/ Limes
Pineapple/ Ananas
Zucchini/ Courgette
Apricots / Abrikozen
Blueberries / Bosbessen
Brussels sprouts/ Spruitjes
Cauliflower/ Bloemkool
Grapefruit/ Grapefruit
Leeks/ Prei
Lemons/ Citroenen
Oranges/ Sinaasappels
Oregano/ Oregano
Parsley/ Peterselie
Peaches/Perziken
Pears/ Peren
Peppers/ Peppers
Plums/ Pruimen
Spinach/ Spinazie
Tomatoes/ Tomaten
Watermelon/ Watermeloen
Apples/Appels
Beets / Beets
Cabbage / Kool
Carrots / Wortelen
Celery / Selderij
Garlic / Knoflook
Squash
Onions /Uien
Potatoes / Aardappelen

- 121 -
In this section, you are asked to mark vegetables and fruits that you throw away without using.
Artichokes/ Artisjokken
Asparagus/
Asperge
Bananas/ Bananen
Basil
Broccoli
Cherries/Kersen
Corn /Mais
Dill /Dille
Green beans / Groene Bonen
Mushrooms / Champignons
Strawberries / Aardbeien
Watercress / Waterkers
Arugula/ Rucola
Avocados/ Avocado's
Cucumbers/ Komkommers
Eggplant/ Aubergine
Grapes/ Druiven
Lettuce/ Sla
Limes/ Limes
Pineapple/ Ananas
Zucchini/ Courgette
Apricots / Abrikozen
Blueberries / Bosbessen
Brussels sprouts/ Spruitjes
Cauliflower/ Bloemkool
Grapefruit/ Grapefruit
Leeks/ Prei
Lemons/ Citroenen
Oranges/ Sinaasappels
Oregano/ Oregano
Parsley/ Peterselie
Peaches/Perziken
Pears/ Peren
Peppers/ Peppers
Plums/ Pruimen
Spinach/ Spinazie
Tomatoes/ Tomaten
Watermelon/ Watermeloen
Apples/Appels
Beets / Beets
Cabbage / Kool
Carrots / Wortelen
Celery / Selderij
Garlic / Knoflook
Squash
Onions /Uien
Potatoes / Aardappelen

- 122 -
Interview Questions:
1- Food Waste is really a problem for participant or not?
Do you throw away food?
Do you remember what kind of food did you throw away last week? If yes, can you share this
information with me?
According to you, how can be this problem solved? Do you think that it can be solved with
regulations and education?
Do you think that food waste is our individual problem? Can we solve it by changing our
planning skills?
2- Shopping Behavior
The half of food waste can be named as perishable short life products. For instance,
Milk, meat, fish, vegetables, fruits, ham, yogurt, some cheese kinds and bread are perishable
short life foods. I will ask several questions about grocery shopping of these products.
How often do you go grocery shopping?
Do you plan what are you going to buy before going shopping? What do you generally buy?
-(Give the Food types document)
Do you go to local marketplaces or do you prefer to go retail stores?
Do you use any vehicle (bike, car, bus..) to go there or do you go on foot?
Before shopping, what do you take from the home? Shopping bag, key, phone…
After finishing grocery shopping, how do you store foods?
Do you put vegetables with plastic bags or do you put them without any package? Is your
refrigerator always full?
3- Cooking Behavior
Meal preparation is not only cooking fresh foods but also it can be heating frozen pizza in
couple of minutes. In this section, cooking behaviors are taken into account instead of meal
preparations.
How often do you cook in your home? Which meal do you eat more often than the others?
Do you like to cook? Is there any difference between cooking for you and cooking for
somebody? Is it a hobby or a duty?
Do you plan before starting cooking? And how do you decide what you are going to cook?
Why don’t you want to cook?
Do you burn any food during cooking? Do you remember when it was?
If you are cooking, Can you give more information about your cooking process?
Do you use any scale and proportion measuring products during your cooking process?
Do you tend to use vegetables as an ingredient to every meal? Or do you use another food
type? What is the reason of it?
4- Eating Behavior
The last section is about your eating behavior and food waste. The leftovers also have
limited time as perishable short life foods.

- 123 -
Do you scrap leftovers after finishing your dinner? According to you, what is the mean reason
of throwing away that food?
How do you serve food? Is it equal for everyone or you try to adjust it with your experience?
Are there any differences between eating alone and eating with somebody from the point
view of wasting food?
Do you think that there is a taste difference between fresh food and frozen food?
Is there any difference between freshly cooked meal and waited leftovers?
Do you put your leftovers to your refrigerator after finishing your meal?
Do you compost the leftover food that you didn’t like? Do you give someone or to animals?
If there is a product solution that has a function of reducing your food wastes? Do you want
to buy it? If yes, how much do you want to spend on it?

- 124 -
Action>> Take to participant into decided area
Script>>
My name is Ahmet. I am working on food waste for my master thesis.
I want to thank you for your participation to this interview. I am interested in your
answers which will help me and my project. The interview is going to be 45 minutes about
wasting food and I will ask several questions to get insight of your shopping, cooking and
eating behaviors for reducing waste in domestic kitchen. Please be honest and always
remember there is no right or wrong answer. This session is going to be recorded for
documenting the findings, therefore, before starting I would like you to read and sign the
consent agreement document.
Action>> Give the consent form (not wait for the paper)
Script>> Lastly, I would like to give this form that is related to your demographical
information and it will help me to sort information. If you have any question please don’t
hesitate to ask.
Action>> Give the questionnaire
Action>> While participant is filling the questionnaire, check the record settings, and
prepare yourself.
Don’t forget:
Participant number name
Check whether it is recording or not
Visual Documents
Probing for Responses:
“Anything more..?”
“How is that?”
“Would you say you strongly agree or agree somewhat? “
Action>> Start Interview

- 125 -
B.AN EXAMPLE OF SEMI TRANSCRIBED
INTERVIEW
Food Waste:
Yes, I am…
Last week:
The food that throwing away... Often Bread, rarely vegetables and fruits…
We eat chicken rarely pork almost never beefs…
Problem:
It is not a major problem…Education can be helpful and regulation will not help because
of pushing. It is up to them… if they want waste food they have right of waste..
Damn again! Usually you notice when you want to use it. It is out dated and expired.
[Interesting point]
Shopping:
Once a week, solid… Friday afternoon and weekend...
What do you buy in your shopping?
Meat, bread, vegetables, fruits... Cleaning stuff, toilet paper… I buy the big one… it is a
little bit annoying before but not it is ok.[ for me it takes too much spaces, it is annoying for me] I
am using trolleys and I usually go to Albert Hein XL. Because of the alternative and quality we
go there…
Healthy food it does not contains any chemicals, pesticides... It is natural and of course
processed.
Never buy precut packages of Albert Hein.
[Wife is not working; they want to have a baby.] The behavior will change.. We need to
share our love with somebody else. I am optimistic for future; I hope it will be good…
I take shopping bags from home before going shopping. I have a big one from Albert
Hein and I have a plastic box in my car. It is time to go shopping [wife].. In addition to this, my
wife buys fresh fruits and fresh vegetable, breads and buys small one. [Why?] Not for wasting,
[isn‟t it more expensive?] I think yes it is but also it has quality and freshness…
Addition to this, we go to marketplace to buy fish, just fish… Also sometimes Turkey…

- 126 -
Shopping Planning:
I do shopping list… A piece of paper, sometimes on PDA but it is not convenient
because you carry heavy bags.
Transport:
I usually go by car.
Storing:
We have special section for vegetables; some of them remain plastic bags without
cleaning them. You clean before the consumption. [Do you forget them?] Our fridge is not full...
It is big one for two of us…
Cooking:
I cook two times in a week and my wife cooks for five times.
Cooking in Home:
I like to cook and I cook on Saturday and Sunday. It is more like hobby for me because I
cook for my wife. I try to find some recipes from internet. Sometime it is duty, when it must be
quickly and I don‟t enjoy cooking…
Scaling and Measuring During Cooking:
For liquids yes but not for pasta and the others no… [Do you make pasta?] No, I am not.
[Bread?] I was thinking about it. There are three-four types of bread that we like.
Vegetables:
We are making salads and it is an extra. Sometimes we just eat salads and add some
chicken, oil. Bertolli [6 Euro].
Frozen Food:
Yes sometimes, in albert hein, we buy frozen fish. Also frozen vegetables, sparchabolen
.. We usually microwave, Oven is more than microwave..[Combo oven]
Fresh- Frozen:
It is healthy to eat fresh food. I believe it like that.
Leftover:
I prefer to have freshly cooked ones. My wife doesn‟t but I try to finish if we had but we
have rarely. We keep it, hoping that it will be consumed next time. [And?] 70 percentage is ok,
30 % not. [Why?]. Well, it sometimes too little, sometimes looking into that and it doesn‟t look
good..

- 127 -
[Convert leftover to other dishes] It looks more attractive but it remains the quality.
Composter:
We don‟t have composter but we have green box... My parents do have this in Minsk... it
is small garden and composer is a must in there. I don‟t want to buy it in here.. Well, no… I
don‟t waste that much food… And also, fan of garden…
We have cat and dog. We give food them and I don‟t see it as a food waste because it is
consumed.
We are not well planners; I want to feel the freedom. If you plan something and if you
don‟t want to follow the plan, then you can be unhappy. Regularly, probably not, I am going to
follow the plan…
Form Session:
Potatoes and Onions: Sometimes onion, when it is half, it stays in the fridge.. Instead of
using half, I cut a fresh one because it is cheap.
Bread Slices: Happens, pretty often. We start to put the bread fridge… 1st / Portion/
Instead of buying one, we buy half of it now, we are doing our best.
Fruits: No
Vegetables: Sometimes, when I buy packages of fresh salad… 3rd
/ the main reason is
again portion…
Milk, Yogurt and Cheese: Milk is for preparing pastry, cornflakes and dishes... 2nd
/ we
are not consuming that much milk... We have special milk for coffee. / Portion / if you can buy
smaller packaging that would help as well. You need to prepare everything…
Meat and Fish: No
Prepared Salad: No
Sandwiches: No.
Leftover: Sometimes…
Vegetable and Fruits:
Banana, Broccoli, Lettuce, Cherries, Dill, Cucumbers, Arugula, Eggplant, Lettuce,
Zucchini, Brussels sprouts, Lemons, Oranges, Tomatoes, Apples, Beets, Cabbage, Carrots,
Celery, Potatoes
Arugula, Cucumbers

- 128 -
Dream:
[Time or Money] I don‟t think that it is really important. All these environmental things, we
are living environmentally friendly… I am using my car... All the factories we have, the main
problem... Converting them to consumer life is political…
Time… I do enjoy cooking, but she doesn‟t. She wants to shrink the time that she
spends. All devices that prepare our meals of choice and time are all welcome.. We buy a
product for cutting potatoes into cubes [Nicer Dicer]. It saves time…
[Effort] I think it is not same, you value your own time.. You try not to waste it. It is easy
to say goodbye to fast food hamburger.
[ If you make your own bread, the bread slices can be reduced] It is a good idea; it is
taste, quality…
[Quality, Healthy] I eat quality food for being healthy. I go to party and take all the bad
things but it is different and it happens rarely...

- 129 -
C.STUDY I – CLUSTERED QUOTES
1-COUPLES WITHOUT KIDS
2- IMMEDIATE FAMILIES
3- SINGLES

- 130 -
1-COUPLES WITHOUT KIDS:

- 131 -
2- IMMEDIATE FAMILIES:

- 132 -
3- SINGLES

- 133 -
D.WORKBOOK TASKS

- 134 -

- 135 -

- 136 -
Back side

- 137 -
E.FOCUSING PAPER

- 138 -

- 139 -
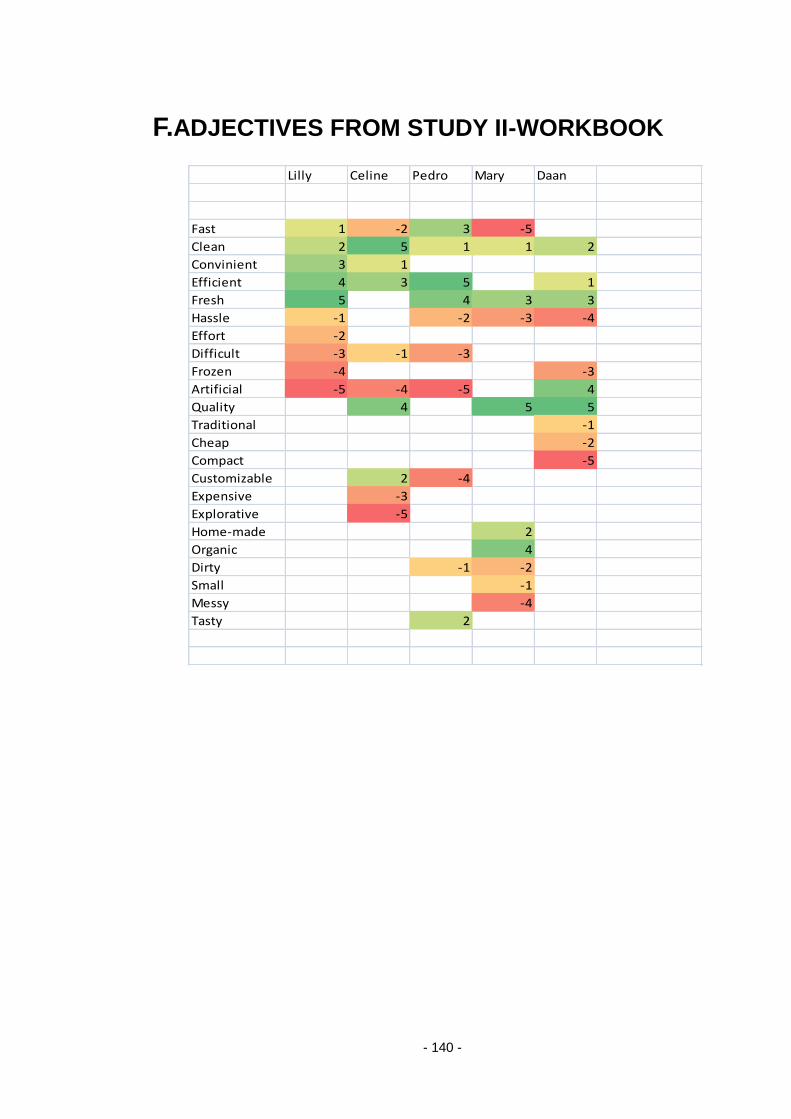
- 140 -
F.ADJECTIVES FROM STUDY II-WORKBOOK
Lilly Celine Pedro Mary Daan
Fast 1 -2 3 -5
Clean 2 5 1 1 2
Convinient 3 1
Efficient 4 3 5 1
Fresh 5 4 3 3
Hassle -1 -2 -3 -4
Effort -2
Difficult -3 -1 -3
Frozen -4 -3
Artificial -5 -4 -5 4
Quality 4 5 5
Traditional -1
Cheap -2
Compact -5
Customizable 2 -4
Expensive -3
Explorative -5
Home-made 2
Organic 4
Dirty -1 -2
Small -1
Messy -4
Tasty 2

- 141 -
G.WEAK STRONG ASPECTS AND USER
SUGGESTIONS FROM STUDY III
Canvas:
Why?
Inspite we are very award about what food we have, once in the two week we forget or we don't like some food we had bought.
sizes of the food do not match the pockets I can imagine to use it as a kind of fruit basket. It keeps the fruit fresh and while you see it, you will eat it. I buy all fruit and vegatables once a week: it is very spacious (one banana box full), and i can't imagine to use it for all my fruit and vegatables
you don't need to keep track on what is in it.
I live alone, not much food in the fridge. Looks cool. As far as I understood there are 'spacious' and - above all - rigid compartments for several types of vegetables or fruit. It depends on how flexible these can be positioned or resized; may be a double sizedfridge for storing the same amount of food would be needed. While I like being aware of what vegetables are still in the fridge, I don't like having another fridge on my very limited free wall space. Also, I expect that the small individual compartments are inefficient to store vegetables. I hardly ever buy fruits because the get rotten so quickly and I have to throw them away. So I only buy fruits and vegetables that I will use the same day
no, I mostly know what I have in the fridge. But I don't always feel like eating that.
to remind me of the amount and the sort of food that has to be cooked
I don't want another device that's primarily intended for food storage in the kitchen
Will take up too much room
no need for it
I don't like fruits
It fits our style in the house
I'm not sure that it will fit in my kitchen. Not enough space. Doesn't fit my interior. I like the look of fruit and vegetables when they are in my fruitbowl on the counter. I think it is innovative. I'm not sure about placing the vegetables and fruits one by one to the Canvas, it may be time consuming. But other than that it looks nice. Honestly, I still don't understand the concept exactely and why is it less hassle to put it into this new canvas box instead of the fridge. How big is this box actually? and what about the extra space that you need in your kitchen to store this canvas box? Canvas souds also like a painting but is it probably on a different hight....call it different (my suggestion)
It will remind me what I have left in storrage. I always use my vegetables in time. I only waste bread slices, potatoes or prepared meals.
Frigg is always too full Usually the veggies and fruits are in the fridge basket or end up behind something else in the fridge. Such kind of product would give an immediate overview of what do we have. This will also help deciding what to buy. I like the way it looks a lot and would like to have it at home.
stored food is more visible and might be remembered while in store
Forget have food notliked bought food space fruitbowl fruit fresh see eat buy fruit vegetable space track keep cool fridge spacious vegetable fruit flexible positioned aware vegetable fridge space inefficient fruits rotten quickly throw away fruits buy vegetables know fridge notliked remind another device space no-need fruits style interior fruit vegetable fruitbowl innovative nice vegetable counter fruit time consuming nice hassle remind vegetable fridge full vegetables fruit fridge basket deciding what to buy nice visible remind remember store space

- 142 -
it's too big, so not necessarely i have enough space for it. extra work and extra space most important: you miss the smell and fragances
I shop at such a way that I hardly do not have food waste in my kitchen I am a very late adopter... this is a very innovative product which I would only use if others have very possitive / effective experiences with it
No place in the kitchen
I always forget with kind of vegetables we have already bought.
It will fit in my kitchen and kids would like to get some fruit out of it, and put it in. The rendering is too nice to be informative. In simple words, For long term I get positively affected by the lights and do not bother about food waste. and how the board knows when I consume the food?
We normally buy what we need and not more. It may reduce it slightly but not fully because the main cause for my food waste is that I buy more than I need.
It seems to require too much space. I do not have a free wall in my kitchen.
Not enough space
space innovative positive experience space vegetable kids playing informative fruit vegetable consume food waste kitchen light light space space product positive visible
Negative Aspects:
patatoes and unions are not as colourfull as it likes in the video uneconomical energy wise, most likely more anergie (cold) is lost than when you use a normal refrigerator
size, You need space in the kitchen for it
?
Little space.
see above Space requirement Efficiency of storage Canvas will only remind me more that I didnot eat my fruits fast enough which will only make me feel bad. It is annopying that it will turn on when I enter the kitchen and will distract me. having another storage unit in the house it only works out nice if you have multiple coloured items in house
I think, in many household there is a lack of space in the kitchen
Same-colored vegetables A second refrigeration unit
Need space for this in my kitchen it needs space on the wall and we go more often to the supermarket. Then we mostly forgot what we have already in the house and buy more of the same.
I'm not really sure how much space it will need. See previous question. I don't usually buy so many different kinds of fruit and veg at a time - only for a few days, and we are only with two in my household, so you never get a nice artwork. that you have to place your food cautiously into the slots. the grid inside can be different. it doesn't need to work only for vegetables or fruits. i may put my dairy products and stuff there may be?
Potato onion colorful uneconomical energy cold space space space efficiency remind fruit fast storage color space same color vegetable refrigerator space space forget buy duplication space space wall vegetable fruits space expensive artwork energy consumption popular plastic package package bananas cleaning refrigerator educate place aesthetic device useful mistreating

- 143 -
I think it is rather spacious. Probably it will be an expensive asset for the single households because of the specific technology.
Some considerations would be: how do you place a watermelon or the very popular here plastic packages with strawberries or grapes inside? Another thing to take into account is the energy consumption. We reduce food waste but increase energy consumption, so the effect balances out. One more thing is that some fruits are better off fridge (e.g. bananas). They stay longer if they are kept outside. How are you going to educate the user about this. cleaning seems more difficult than firdge drawer. Need empthy place on wall to hand the canvas. too big. i'm not sure whether seeing an orage spot in philips canvas will make me more aware about the amout of carrot i have, for instance. i think it's more a aesthetic device, than really useful.
mistreating vegetables and food
yet another "apparatus" in your household You have to put extra effort into conserving your vergetatbles maybe, compared to a regular fridge. Also, there might not be a huge problem in general with waisted vegetables (but I suppose you have studied that first :-) )
Too gimicky Accurate relation between the colors on the canvas and the actual vegetables in my home store. Can I see the quality of the vegetables on canvas? My own storage is not suitable for this, my cups and plastics. Also I like to have some fruits and vegatables in the in the frindge and others not.
It uses energy, but don't know how much The space it takes, you need quite some vegetables to have a nice decoration. Also some vegetables/fruits need to be cooled (like strawberries) others don't (like banana's) 1) The user just has an indication of the color of the vegetables. He does not know if he has a tomato or a red paprika left... I would like better to have a kind of small image of vegetable to know exactly. 2) It only works for vegetables and fruit, not for fish and meat. 3) I have the impression it would not fit large vegetables 4) It is an additionnal device in the kitchen... I have no room any more
Inefficient storage, does not integrate well in current overcrowded kitchen
Modular design such to monitor food type freshness.
vegetable fruit effort refrigerator carrot orange color indication fish meat space addition addition refrigerator quantity inefficient storage integrate wall wise lack lack second lack little lack
Strong Aspects:
Its new and it helps you remember what you have in stock
looks nice and colorful, nice decoration of your kitchen
to keep it fresh and still you can see the fruit.
less waste of food
Fun, pleasent, helps reducing waste Prevention of overdue/decayed/rotten food and, indeed, waste of food. Especially for busy DINKs (orDIWKs)
Awareness of what vegetables are still there and how long it is there.
A possibility to remind me to be more healthy
remember nice colorful nice decoration kitchen keep fresh see fruit less waste fun pleasant reducing waste prevention awareness
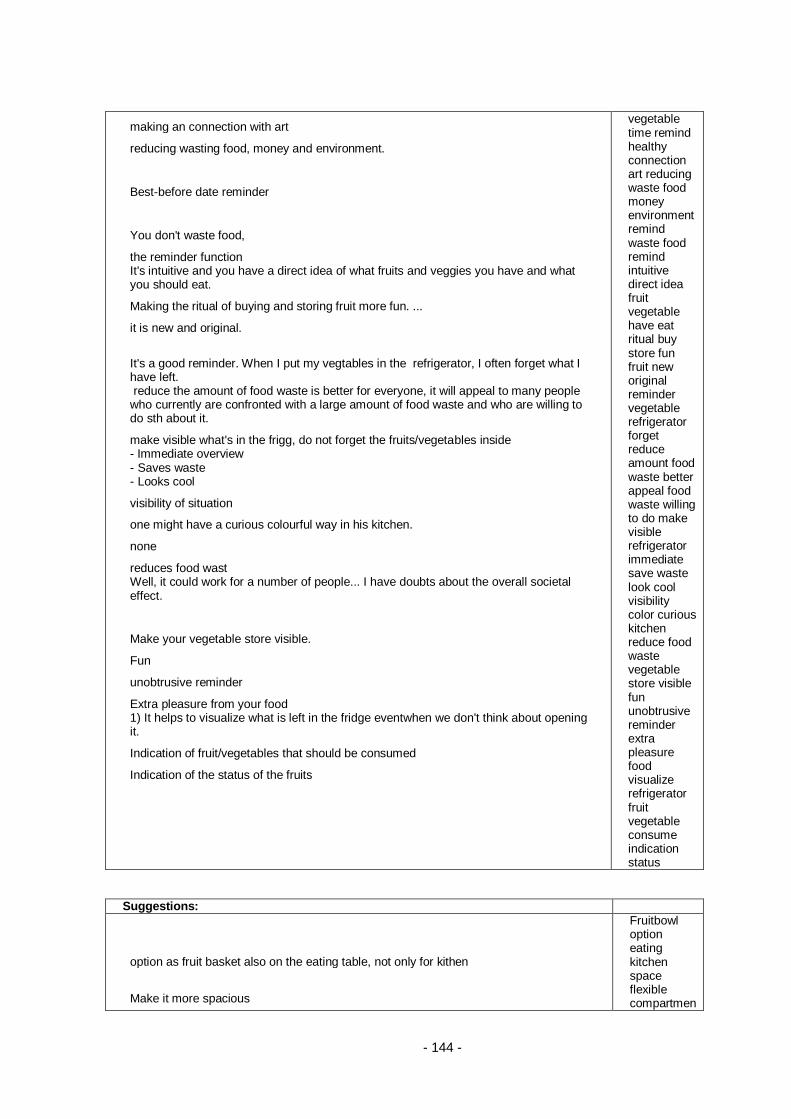
- 144 -
making an connection with art
reducing wasting food, money and environment.
Best-before date reminder
You don't waste food,
the reminder function It's intuitive and you have a direct idea of what fruits and veggies you have and what you should eat.
Making the ritual of buying and storing fruit more fun. ...
it is new and original.
It's a good reminder. When I put my vegtables in the refrigerator, I often forget what I have left. reduce the amount of food waste is better for everyone, it will appeal to many people who currently are confronted with a large amount of food waste and who are willing to do sth about it.
make visible what's in the frigg, do not forget the fruits/vegetables inside - Immediate overview - Saves waste - Looks cool
visibility of situation
one might have a curious colourful way in his kitchen.
none
reduces food wast Well, it could work for a number of people... I have doubts about the overall societal effect.
Make your vegetable store visible.
Fun
unobtrusive reminder
Extra pleasure from your food 1) It helps to visualize what is left in the fridge eventwhen we don't think about opening it.
Indication of fruit/vegetables that should be consumed
Indication of the status of the fruits
vegetable time remind healthy connection art reducing waste food money environment remind waste food remind intuitive direct idea fruit vegetable have eat ritual buy store fun fruit new original reminder vegetable refrigerator forget reduce amount food waste better appeal food waste willing to do make visible refrigerator immediate save waste look cool visibility color curious kitchen reduce food waste vegetable store visible fun unobtrusive reminder extra pleasure food visualize refrigerator fruit vegetable consume indication status
Suggestions:
option as fruit basket also on the eating table, not only for kithen
Make it more spacious
Fruitbowl option eating kitchen space flexible compartmen

- 145 -
flexibility of compartment sizes
build it onto an existing refridgerator
not at his moment
Integrate it into standard refrigerator unit
No
The problem is, if you eat something, your artwork becomes less nice. How could you make it attractive (and not boring white) even when you do not have so much food in it? If you buy more fruit and veg just to fill the canvas, you might just waste even more.
Design different sizes. The concept itself is quite ok I think, but I think it needs a lot of media attention, commercials, ... to make it known among the people.
Make sure you can fit a week long of fruits and veggies in this canvas. Consider the size and shape of the packaging in different countries. May be the separation inside can be arranged or at least changed by the user. Consider ways to save energy (the proximity sensor is a good step in that direction). Suggestions of good combinations on the canvas can be also appreciated.
test at homes i think the information provided about food is too vage. it doesn't say much, so i would have to check my fridge anyway to see what's there.
discard
no
/
Control the concentration of ethyleen to manage freshness (see http://www.exo.science.ru.nl/bronnen/scheikunde/fruitschaal.html )
cooling I don't understand the claim 'you can reach redirectly what you have in canvas'. I cannot figure out from the light rendering which vegetables I have still by just looking at it, or I missed something? I like it better as a cupboard to store food that has a longer expiry date. Or have non-food articles that give color to your room 1) It could be nice to enter quickly per vegetable the expiry date and be reminded around this date to use the aliment. 2) I would like better such a concept to be integrated to my fridge than to have an additional device. That would really be Sense and Simplicity ;) Decouple sensing food state from visual representation. The sensing part should be done in the fridge or other suitable more optimized container. The visualization of the food state should be optional and on demand
t integrate integrate refrigerator art attractive waste size media fruits vegetables fruits vegetables canvas size shape packaging separation change customization user save energy sensors good combinations discard freshness ethylene canvas light subtle expiry color vegetable data fruits integrate additional device refrigerator sense visual representation visualization problem space
Dispense:
Why?
You have to think, say a day before, how much bread you want. Every day the bakkery smell isn't nice anymore
I already use a bread machine and do not have any water of it, furthermore I
everyday bread want bakery nice bread

- 146 -
eat 12 slices every day, probably this new machine is much more expensive than what I bake now myself all bread I buy goes to the freezer and I only take what I need. Our bread waste is because the children eat sometimes less. When baking my own bread our family consume it in one day. I like to change the type of bread I eat sometimes. You should leave baking bread to the people who understand what they are doing. The people of the Bakery. I waste bread often and I like freasly baked bread (I bake bread from time to time on we) We doubt that fresh baked bread is healthy, although, admittedly, it tastes very good! We store bread (long term) in the freezer and portions for a few days are stored in the fridge
I would like not having to slice my bread every morning
my bread is always old
I keep my bread in the freezer, and waste only the ends of the bread. This days you can buy healthy bread at the supermarket or bakkery on your needs. It is easier, comfortable, faster and cheaper. I like that it bakes 'bread slices' instead of a complete loaf of bread which would take me 4-5 days to eat. Irregular bread consumption We typically have two varieties of bread at a time
Would love to have it.
I take the slices I need directly from my freezer, Is always fresh
We like baking bread, but sometimes do not have the time. Although it is quite big, I would try to find space for it because it would really help in the food waste. I love the smell of fresh bread. We are always buying bread and keeping it in the freezer to keep it from going off. But it's not as good anymore after being frozen, than when it is fresh (like in the weekend). Plus I always eat the same amount of bread every day. (My partner doesn't though...) I think it is effective for reducing bread waste, but it wouldn't work for me because I don't eat bread that often.
Since I live alone, I buy a bread a put a part of it in the freezer. I make packages with 3 slices, so I only have to take 1 pack each day and defrost it. This way, I don't waste any bread. I waste a lot of bread and it would help me to reduce the waste and still have freshly baked bread. It's also customized to the needs.
every day the bread consumption differs. also use freezer to keep bread
It would be nice to have a fresh bread every day.
we like the coffee-senseo so we should love the bread-senseo I'm not sure if i would buy it, since my bread consumption is very low. But it could be a good incentive to increase my bread consumption. I have no bread waste. Use the freezer for storage. Prefer the bakery skills of my local baker to a ready-mix (must be full of chemicals, otherwise you can't get it like that)
I keep my bread in refrigerator and take out per day what I need You have to put on the machine and put in raw bread. You will also have to clean the machine. And the machine takes space in your household.
We need 1 breath per day because I have 4 children at home. depending how fast, if everybody has to wait for a time before it is finished it will take to long. Will it bake me 10 slices if needed, that is a must
I am an Asian, not a bread eater. I don't have the problem.
When I buy bread in the supermarket I waste the crusts. In this case I would
machine waste expensive bake freezer bread waste type bakery waste bread fresh baked bread fresh bread healthy taste good freezer portion freezer old freezer waste bakery expensive slices freezer space help food waste smell fresh smell freezer fresh frozen effective reduce waste bread freezer fresh nice bread senseo senseo bread consumption bread waste freezer bakery fridge fridge machine raw routine space space fast fresh suitable demand fresh baked bread everyday

- 147 -
only get fresh baked ideal slices of bread and just enough
I tend to buy fresh bread or if I make it with my bread machine we eat it so fast that we don't waster it. However, I think that this concept could be suitable for people living alone.
I'd love to have on demand freshly baked bread
Negative Aspects:
The picture of waste bread No chemicals in the bread, I think the Philips bread contains also chemicals how fast is the machine, for example when my whole family has to eat bread it needs to bake (12+4+4+2=)22 slices of bread that need to be ready all at the same time the package with 120 slices: really no conserving ingredients? How long can you use it, a week or a month or longer? Else you have to through away even more slices of braed?!? What if some members wants dark bread and others prefer
The lack of the possiblity to change
Only one bread type available (e.g. no baguette or ciabatta or pave...)
Supply of bread 'precursor' guaranteed? Dependence on availability of dedicated prepackaged bread. I would need to be convinced that this bread is at least as good as the bread from my breadmaker. it is an expensive luxory for the kitchen, has to deal with normal bread makers and seems hard to use
That it always bakes the same amount, and that this takes time.
It need electricity, time, cleaning, water and buying the dough.
Vendor lock-in Would create too much crust
Again another apparate in your kitchen It is quit similar to the current breadmachine, it only gives the opportunity to make slices
That the device is quite big, What if you don't eat the same amount of bread every day? This does increase power consumption in your home... Does this equal out the power consumption otherwise used to bake bread in a factory/bakery, like the water explanation? I don't believe the water saving by using the breadmaker - you still need water and energy...
I think a lot of people allready have a baking machine. My concerns are the healthiness of the bread. Ok, it's stated that there are no preservatives, no chemicals, but is it really 100% natural??
It can be fun in the beginning but at some point it ca sees as a burden to prepare the machine every morning. Is it going to be fast? Bread usually need hour(s) to bake. The price of ingredients + energy consumption again. Currently it is a lot more expensive to buy pre-made bread mixes compared to buying industrially baked bread. Also how are the bread mixed going to be sold? Like Douwe Egberts - Senseo?
does it work? Food waste goes a way beyond bread consumption, but as a device to replace a bread maker it sounds interesting. another point is that i don't eat bread every day or in a regular basis. i basically eat it when i feel like, so if the machine tries to predict it, the machine will have a hard
chemicals speed type type available bread availability energy water expensive luxury electricity cleaning apparatus apparatus bread comsumption pattern water saving expensive energy water energy type artificial space money manual eat more pattern pattern culture culture irregular irregular

- 148 -
time!
artificial bread
another machine in the kitchen time consuming. it costs money space consuming1
At least in the movie looks to automatic, would like more manual control
Waiting (I could not see the video)
everyday fresh bread... it is nice but you eat more
What happens if I would like to take bread to work? It should not be warm anymore before I take it. If I'm ill or have weekend I may want to have more or less slices... 1) On the video it seems really easy to use, but I have the impression that a lot of practical aspects are not mentioned: does it need to be cleaned or refilled everyday? I'm afraid it would require some efforts from the user. 2) The device plans how many slides you need per day. What happens if you invite a friend or if you are just hungrier one morning? 3) Important for Philips on the market point of view: I think that this solution could be appreciated in a country like the Netherlands were people buy industrial bread in advance for the whole week. However, in other countries like France (but also maybe Italy, Spain) people buy fresh bread everyday from the bakery so I don't think they would make use of this concept. Perhaps technical feasibility? Speed of preparation. The bread machine should be very quick in preparing break if it needs to do it on demand. Otherwise, if I have to plan one day in advance how much break I'm going to eat, I will end up preparing more and wasting
Strong Aspects:
Its new
indeed a breadmachine in the mornig smells great !!
the smell of fresh bread
?
Fresh bread every day, learns patterns of consumption, so no waste. For 'busy' people (DINKs etc.) who only eat fresh bread and trow away one day old bread, indeed, this will reduce waste of food.
Convenience of having sliced bread ready every morning it will make sure the bread is fresh and won't get old which will make sure I eat better and more healty in the mornings (and dont have to deal with white/green bread anymore)! If you like home baked bread, you don't waste that bread because it bakes only a little.
Fresh and warm bread.
Fresh food
Fresh bread
Nothing
fresh bread how much you want and need!
That it is very personal and it helps you in your daily routine. Nice fresh bread all the time, and probably more healthy as well due to fewer preservatives (=fat a lot of the time).
You have fresh bread every day.
reduce of amount of waste food, freshly baked bread, ...
smells great smell fresh fresh bread patterns busy people sliced bread sliced fresh home baked bread fresh warm fresh food fresh bread fresh bread need want personal routine nice fresh healthy fresh reduce waste reduce waste senseo nice smell fresh bakery personalize bread demand reduce waste chemicals preservation chemicals fresh nice

- 149 -
You got me at the 'smell of bakery'. All the senseo proofpoints: less waste, nice smell, freshly baked, personalised (if you can switch bread type easily)
bread on demand. that's cool.
?
reduces food waste
no added chemicals in the bread for preservation.
Freshness
nice smell in the house
fresh baked bread that is ready when I need it. nice smell in the kitchen. No waste 1) For someone leaving on his own, it could be a good solution to have fresh bread everyday without waste.
On demand preparation combines freshness and less waste
smell fresh bread fresh waste demand preparation freshness less waste
Suggestions:
the package size must be max for one week, else it feels not as fresh braed possibility to make very fast an extra slice if you want more.
Consider leaven instead of yeast (or bicarbonate)varieties for the bread pecursor. How long can the precursor stuff be stored before it ends up as waste?
It's perfect! Tell me when it gets on the market and I'll buy it! ;)
Also allow to set how many slices you want to have.
Not for this concept.
No
I think you do need to think about how to make bread slices (the shape of the bread is because of the baking).
Make it possible to alternate kinds of bread - don't always want 120 slices of the same (=30 days the same bread in my case).
package size leaven slices shape slices alternative type optional slices personalize slices personalize type type alternative waste slice market senseo senseo type personalize package store perfect perfect no no no no no no

- 150 -
no
Slice the bread optionally. I like tearing it myself. Consider the energy waste. The quantity also should allow a level of control. "I usually eat 2 slices every evening but today I have 10 friends over for dinner." make it work and it will fly
for me it sounds the next generation of bread maker, no more no less.
no
no
/
personal adaptations should be possible per day (if necessary)
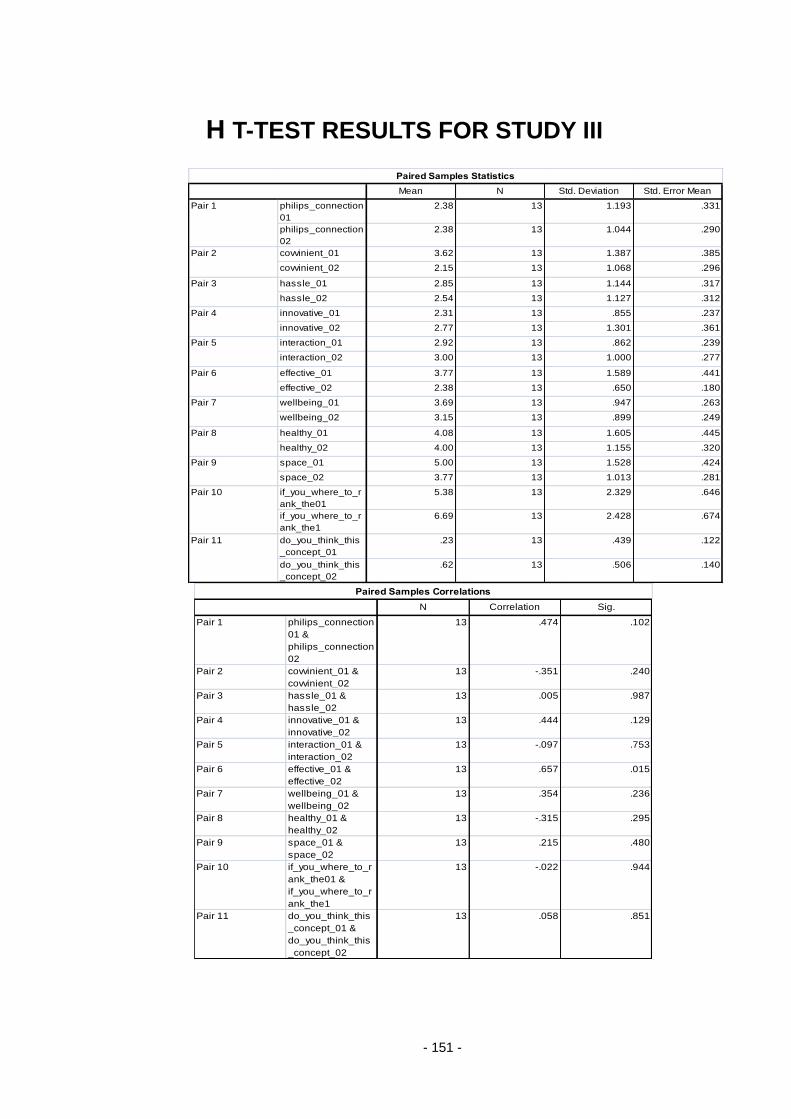
- 151 -
H T-TEST RESULTS FOR STUDY III
Mean N Std. Deviation Std. Error Mean
philips_connection
01
2.38 13 1.193 .331
philips_connection
02
2.38 13 1.044 .290
covvinient_01 3.62 13 1.387 .385
covvinient_02 2.15 13 1.068 .296
hassle_01 2.85 13 1.144 .317
hassle_02 2.54 13 1.127 .312
innovative_01 2.31 13 .855 .237
innovative_02 2.77 13 1.301 .361
interaction_01 2.92 13 .862 .239
interaction_02 3.00 13 1.000 .277
effective_01 3.77 13 1.589 .441
effective_02 2.38 13 .650 .180
wellbeing_01 3.69 13 .947 .263
wellbeing_02 3.15 13 .899 .249
healthy_01 4.08 13 1.605 .445
healthy_02 4.00 13 1.155 .320
space_01 5.00 13 1.528 .424
space_02 3.77 13 1.013 .281
if_you_where_to_r
ank_the01
5.38 13 2.329 .646
if_you_where_to_r
ank_the1
6.69 13 2.428 .674
do_you_think_this
_concept_01
.23 13 .439 .122
do_you_think_this
_concept_02
.62 13 .506 .140
Pair 10
Paired Samples Statistics
Pair 1
Pair 2
Pair 3
Pair 4
Pair 5
Pair 6
Pair 7
Pair 8
Pair 9
Pair 11
N Correlation Sig.
Pair 1 philips_connection
01 &
philips_connection
02
13 .474 .102
Pair 2 covvinient_01 &
covvinient_02
13 -.351 .240
Pair 3 hassle_01 &
hassle_02
13 .005 .987
Pair 4 innovative_01 &
innovative_02
13 .444 .129
Pair 5 interaction_01 &
interaction_02
13 -.097 .753
Pair 6 effective_01 &
effective_02
13 .657 .015
Pair 7 wellbeing_01 &
wellbeing_02
13 .354 .236
Pair 8 healthy_01 &
healthy_02
13 -.315 .295
Pair 9 space_01 &
space_02
13 .215 .480
Pair 10 if_you_where_to_r
ank_the01 &
if_you_where_to_r
ank_the1
13 -.022 .944
Pair 11 do_you_think_this
_concept_01 &
do_you_think_this
_concept_02
13 .058 .851
Paired Samples Correlations
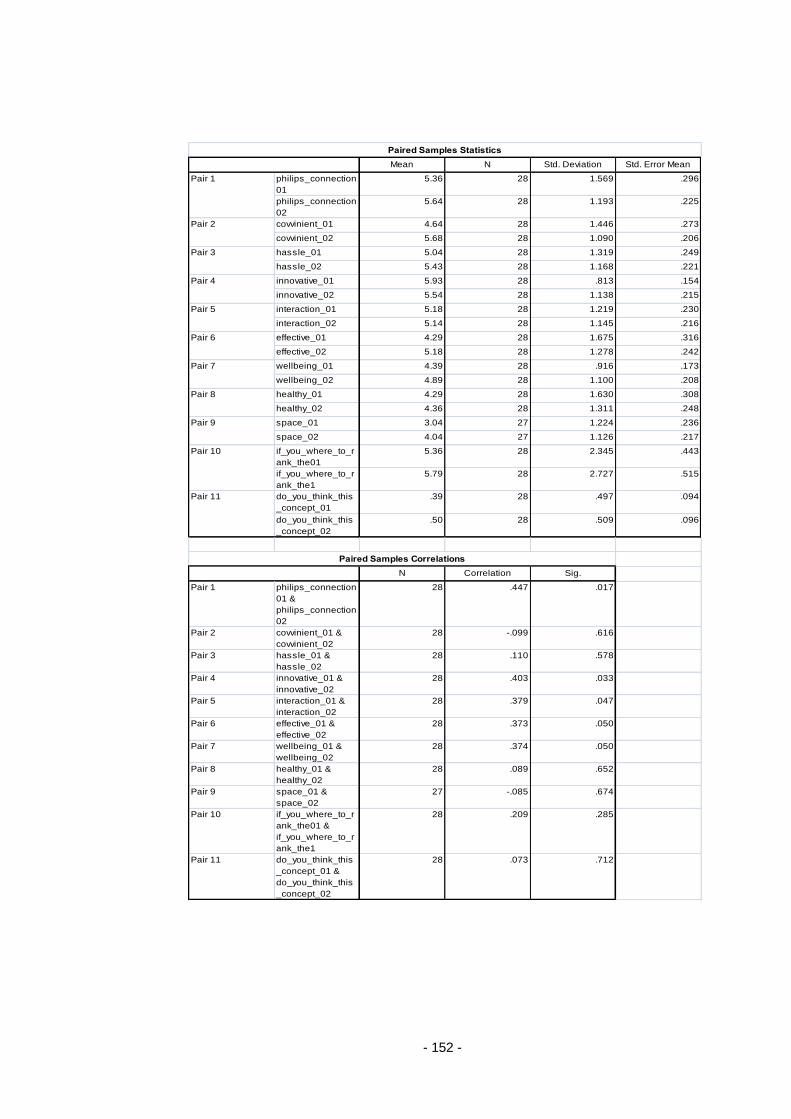
- 152 -
Mean N Std. Deviation Std. Error Mean
philips_connection
01
5.36 28 1.569 .296
philips_connection
02
5.64 28 1.193 .225
covvinient_01 4.64 28 1.446 .273
covvinient_02 5.68 28 1.090 .206
hassle_01 5.04 28 1.319 .249
hassle_02 5.43 28 1.168 .221
innovative_01 5.93 28 .813 .154
innovative_02 5.54 28 1.138 .215
interaction_01 5.18 28 1.219 .230
interaction_02 5.14 28 1.145 .216
effective_01 4.29 28 1.675 .316
effective_02 5.18 28 1.278 .242
wellbeing_01 4.39 28 .916 .173
wellbeing_02 4.89 28 1.100 .208
healthy_01 4.29 28 1.630 .308
healthy_02 4.36 28 1.311 .248
space_01 3.04 27 1.224 .236
space_02 4.04 27 1.126 .217
if_you_where_to_r
ank_the01
5.36 28 2.345 .443
if_you_where_to_r
ank_the1
5.79 28 2.727 .515
do_you_think_this
_concept_01
.39 28 .497 .094
do_you_think_this
_concept_02
.50 28 .509 .096
N Correlation Sig.
Pair 1 philips_connection
01 &
philips_connection
02
28 .447 .017
Pair 2 covvinient_01 &
covvinient_02
28 -.099 .616
Pair 3 hassle_01 &
hassle_02
28 .110 .578
Pair 4 innovative_01 &
innovative_02
28 .403 .033
Pair 5 interaction_01 &
interaction_02
28 .379 .047
Pair 6 effective_01 &
effective_02
28 .373 .050
Pair 7 wellbeing_01 &
wellbeing_02
28 .374 .050
Pair 8 healthy_01 &
healthy_02
28 .089 .652
Pair 9 space_01 &
space_02
27 -.085 .674
Pair 10 if_you_where_to_r
ank_the01 &
if_you_where_to_r
ank_the1
28 .209 .285
Pair 11 do_you_think_this
_concept_01 &
do_you_think_this
_concept_02
28 .073 .712
Pair 10
Pair 11
Paired Samples Correlations
Pair 7
Pair 8
Pair 9
Paired Samples Statistics
Pair 1
Pair 2
Pair 3
Pair 4
Pair 5
Pair 6

- 153 -

- 154 -