Embed Size (px)
Citation preview

Research ArticleA Control Strategy with Tactile Perception Feedback forEMG Prosthetic Hand
Changcheng Wu, Aiguo Song, Yun Ling, Nan Wang, and Lei Tian
School of Instrument Science and Engineering, Southeast University, Nanjing 210096, China
Correspondence should be addressed to Aiguo Song; [email protected]
Received 6 September 2014; Revised 13 January 2015; Accepted 18 January 2015
Academic Editor: Lei Wang
Copyright © 2015 Changcheng Wu et al. This is an open access article distributed under the Creative Commons AttributionLicense, which permits unrestricted use, distribution, and reproduction in any medium, provided the original work is properlycited.
To improve the control effectiveness and make the prosthetic hand not only controllable but also perceivable, an EMG prosthetichand control strategy was proposed in this paper. The control strategy consists of EMG self-learning motion recognition,backstepping controller with stiffness fuzzy observation, and force tactile representation. EMG self-learning motion recognition isused to reduce the influence on EMG signals caused by the uncertainty of the contacting position of the EMG sensors. Backsteppingcontroller with stiffness fuzzy observation is used to realize the position control and grasp force control. Velocity proportionalcontrol in free space and grasp force tracking control in restricted space can be realized by the same controller. The force tactilerepresentation helps the user perceive the states of the prosthetic hand. Several experiments were implemented to verify the effectof the proposed control strategy. The results indicate that the proposed strategy has effectiveness. During the experiments, thecomments of the participants show that the proposed strategy is a better choice for amputees because of the improved controllabilityand perceptibility.
1. Introduction
Prosthetic hands are of great importance to the upper limbsamputees which can help them to complete some manipu-lations such as grasping. How to make the prosthetic handgrasp objects by following inclinations of amputees is amean-ingful research direction. Scholars in this filed have done a lotof research work and made some important development.
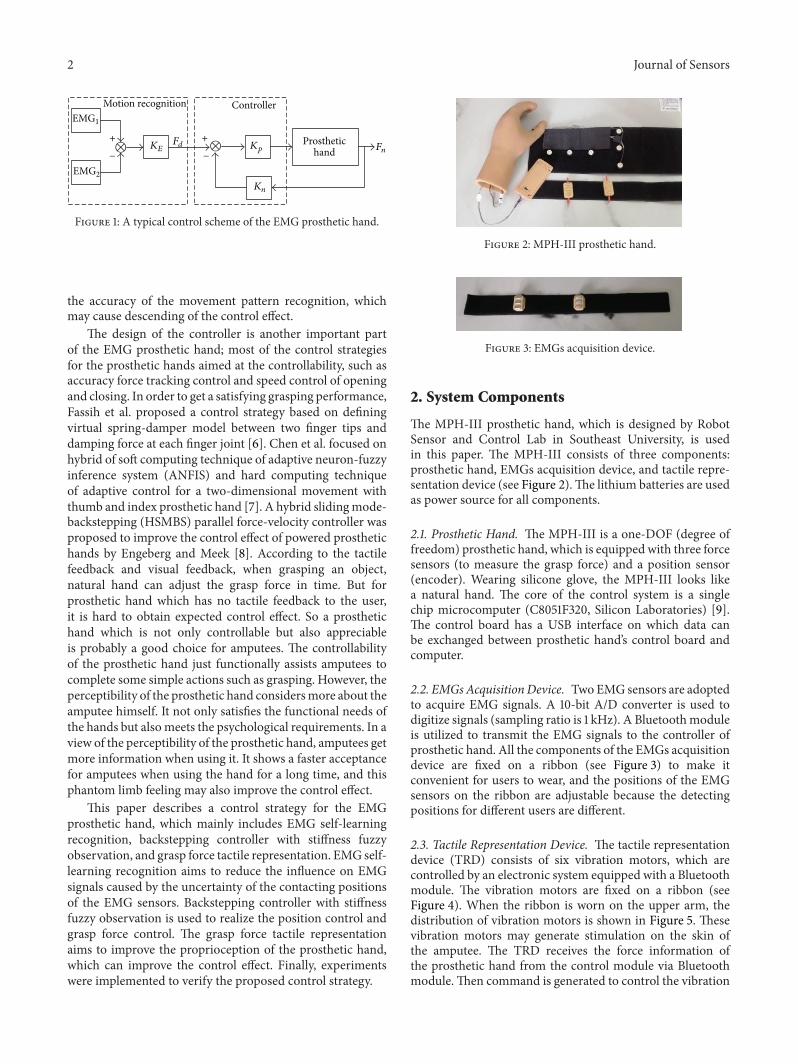
At present, there are some kinds of prosthetic hands:decorative prosthetic hand (for the purpose of decoration,without function), switches controlled prosthetic hand, elec-tromyography (EMG) signal controlled prosthetic hand, andso forth. A typical control scheme of EMG prosthetic handis shown in Figure 1 [1]. EMG
1and EMG
2are EMG signals
acquired from a pair of antagonistic muscles, 𝐾𝐸is the scale
factor, 𝐹𝑑is the expected grasp force, and 𝐹
𝑛is the grasp force
measured by force sensors. 𝐾𝑛is the feedback gain and 𝐾
𝑝is
the proportional gain for the force error. This control modeis popular due to its simple operation and in accordance withthe operation habits of natural hand. However, there are stillsome problems to be solved. Firstly, this control mode doesnot fully consider the influence of EMG signals on control
strategy: the EMG signals measured from different personsare different, and the EMG signals measured from differentstate of the same individual may be different. Secondly, thiscontrol mode lacks perceptibility: the user cannot perceivethe grasp force of the prosthetic hand when grasping anobject.
EMG motion pattern recognition is a basic techniqueof EMG prosthetic hand; a great number of recognitionmethods have been developed, such as time-domain methodand frequency-domain method [2]. Parameters of ARMAmodel and Kalman filter were adopted as character vectors toidentify the movement patterns [3]. Khoshaba et al. used theintegral absolute value of the EMG signals to recognize themovement patterns [4]. Autoregressive (AR) model, powerspectrum, wavelet coefficients, neural network, and somesignal processing methods were also used [5]. However,due to the difference of the sticking positions of EMGsensors and the difference of temperature and humidity ofthe environment, the EMG signals measured from differentpersons or different states of the same individual may leadto different results. This kind of phenomenon may affect
Hindawi Publishing CorporationJournal of SensorsVolume 2015, Article ID 869175, 15 pageshttp://dx.doi.org/10.1155/2015/869175
2 Journal of Sensors
Kp
+ +
− −
Prosthetichand
Kn
Fd FnKE
Motion recognition ControllerEMG1
EMG2
⨂ ⨂
Figure 1: A typical control scheme of the EMG prosthetic hand.
the accuracy of the movement pattern recognition, whichmay cause descending of the control effect.
The design of the controller is another important partof the EMG prosthetic hand; most of the control strategiesfor the prosthetic hands aimed at the controllability, such asaccuracy force tracking control and speed control of openingand closing. In order to get a satisfying grasping performance,Fassih et al. proposed a control strategy based on definingvirtual spring-damper model between two finger tips anddamping force at each finger joint [6]. Chen et al. focused onhybrid of soft computing technique of adaptive neuron-fuzzyinference system (ANFIS) and hard computing techniqueof adaptive control for a two-dimensional movement withthumb and index prosthetic hand [7]. A hybrid slidingmode-backstepping (HSMBS) parallel force-velocity controller wasproposed to improve the control effect of powered prosthetichands by Engeberg and Meek [8]. According to the tactilefeedback and visual feedback, when grasping an object,natural hand can adjust the grasp force in time. But forprosthetic hand which has no tactile feedback to the user,it is hard to obtain expected control effect. So a prosthetichand which is not only controllable but also appreciableis probably a good choice for amputees. The controllabilityof the prosthetic hand just functionally assists amputees tocomplete some simple actions such as grasping. However, theperceptibility of the prosthetic hand considersmore about theamputee himself. It not only satisfies the functional needs ofthe hands but alsomeets the psychological requirements. In aview of the perceptibility of the prosthetic hand, amputees getmore information when using it. It shows a faster acceptancefor amputees when using the hand for a long time, and thisphantom limb feeling may also improve the control effect.
This paper describes a control strategy for the EMGprosthetic hand, which mainly includes EMG self-learningrecognition, backstepping controller with stiffness fuzzyobservation, and grasp force tactile representation. EMG self-learning recognition aims to reduce the influence on EMGsignals caused by the uncertainty of the contacting positionsof the EMG sensors. Backstepping controller with stiffnessfuzzy observation is used to realize the position control andgrasp force control. The grasp force tactile representationaims to improve the proprioception of the prosthetic hand,which can improve the control effect. Finally, experimentswere implemented to verify the proposed control strategy.
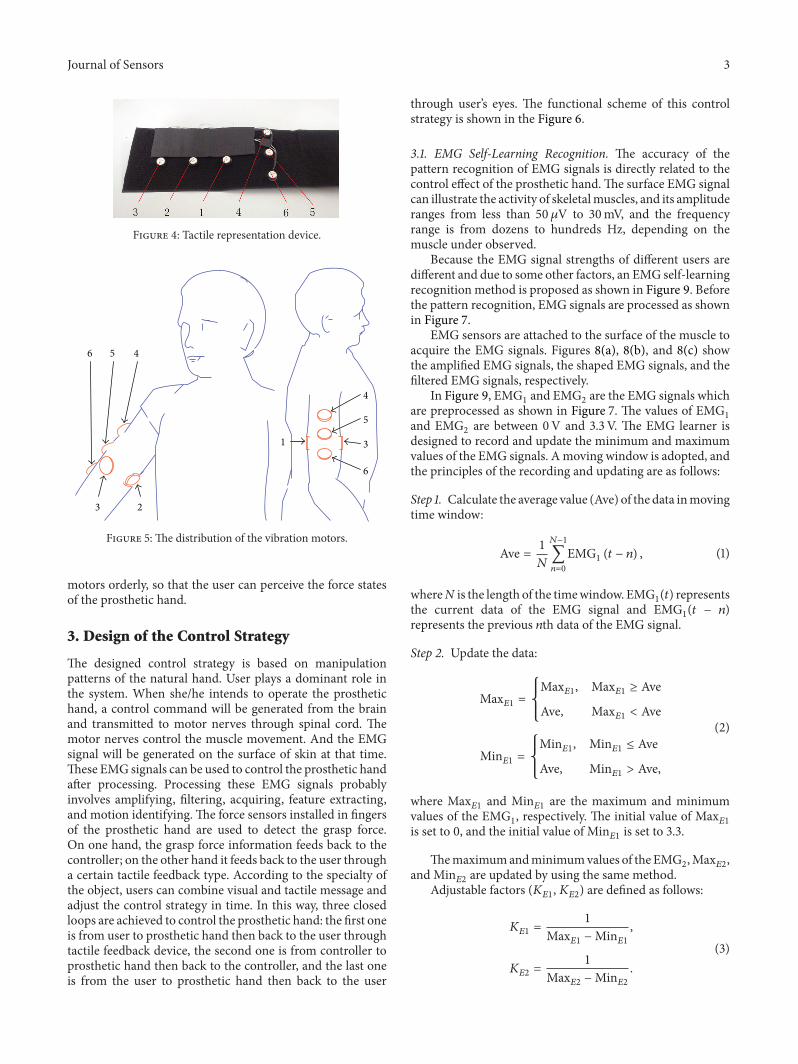
Figure 2: MPH-III prosthetic hand.
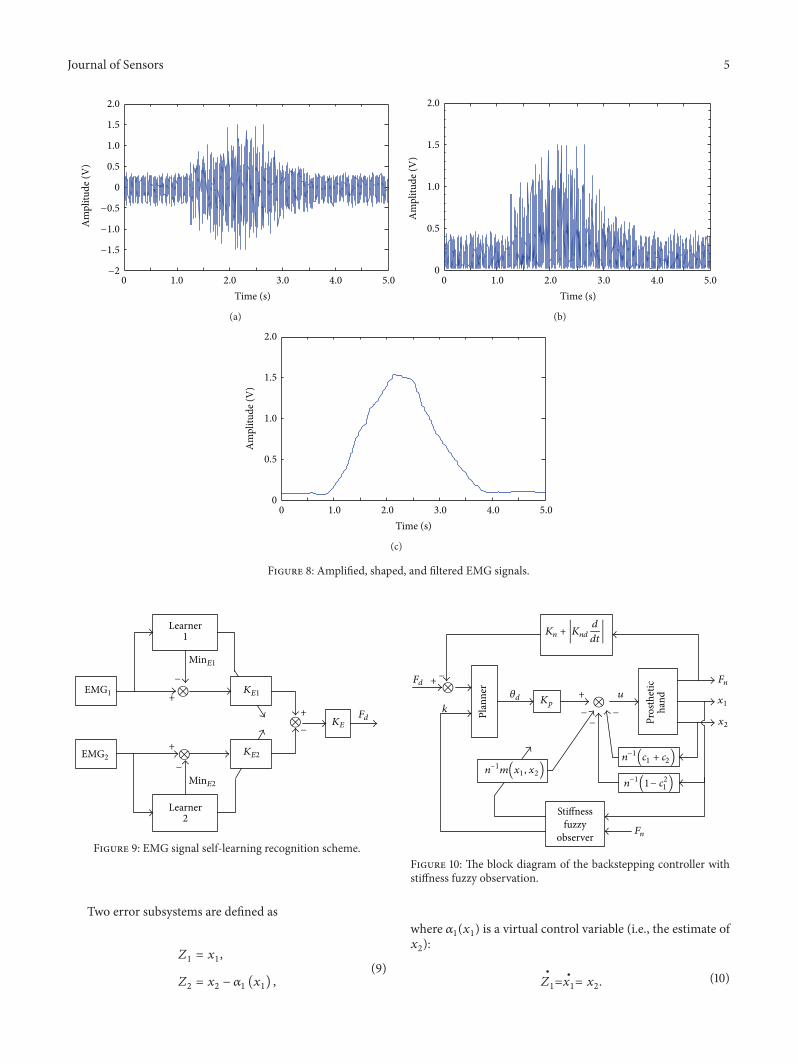
Figure 3: EMGs acquisition device.
2. System Components
The MPH-III prosthetic hand, which is designed by RobotSensor and Control Lab in Southeast University, is usedin this paper. The MPH-III consists of three components:prosthetic hand, EMGs acquisition device, and tactile repre-sentation device (see Figure 2).The lithium batteries are usedas power source for all components.
2.1. Prosthetic Hand. The MPH-III is a one-DOF (degree offreedom) prosthetic hand, which is equipped with three forcesensors (to measure the grasp force) and a position sensor(encoder). Wearing silicone glove, the MPH-III looks likea natural hand. The core of the control system is a singlechip microcomputer (C8051F320, Silicon Laboratories) [9].The control board has a USB interface on which data canbe exchanged between prosthetic hand’s control board andcomputer.
2.2. EMGsAcquisitionDevice. TwoEMG sensors are adoptedto acquire EMG signals. A 10-bit A/D converter is used todigitize signals (sampling ratio is 1 kHz). A Bluetoothmoduleis utilized to transmit the EMG signals to the controller ofprosthetic hand. All the components of the EMGs acquisitiondevice are fixed on a ribbon (see Figure 3) to make itconvenient for users to wear, and the positions of the EMGsensors on the ribbon are adjustable because the detectingpositions for different users are different.
2.3. Tactile Representation Device. The tactile representationdevice (TRD) consists of six vibration motors, which arecontrolled by an electronic system equipped with a Bluetoothmodule. The vibration motors are fixed on a ribbon (seeFigure 4). When the ribbon is worn on the upper arm, thedistribution of vibration motors is shown in Figure 5. Thesevibration motors may generate stimulation on the skin ofthe amputee. The TRD receives the force information ofthe prosthetic hand from the control module via Bluetoothmodule.Then command is generated to control the vibration
Journal of Sensors 3
Figure 4: Tactile representation device.
46 5
3 2
4
6
5
31
Figure 5: The distribution of the vibration motors.
motors orderly, so that the user can perceive the force statesof the prosthetic hand.
3. Design of the Control Strategy
The designed control strategy is based on manipulationpatterns of the natural hand. User plays a dominant role inthe system. When she/he intends to operate the prosthetichand, a control command will be generated from the brainand transmitted to motor nerves through spinal cord. Themotor nerves control the muscle movement. And the EMGsignal will be generated on the surface of skin at that time.These EMG signals can be used to control the prosthetic handafter processing. Processing these EMG signals probablyinvolves amplifying, filtering, acquiring, feature extracting,and motion identifying. The force sensors installed in fingersof the prosthetic hand are used to detect the grasp force.On one hand, the grasp force information feeds back to thecontroller; on the other hand it feeds back to the user througha certain tactile feedback type. According to the specialty ofthe object, users can combine visual and tactile message andadjust the control strategy in time. In this way, three closedloops are achieved to control the prosthetic hand: the first oneis from user to prosthetic hand then back to the user throughtactile feedback device, the second one is from controller toprosthetic hand then back to the controller, and the last oneis from the user to prosthetic hand then back to the user
through user’s eyes. The functional scheme of this controlstrategy is shown in the Figure 6.
3.1. EMG Self-Learning Recognition. The accuracy of thepattern recognition of EMG signals is directly related to thecontrol effect of the prosthetic hand.The surface EMG signalcan illustrate the activity of skeletalmuscles, and its amplituderanges from less than 50 𝜇V to 30mV, and the frequencyrange is from dozens to hundreds Hz, depending on themuscle under observed.
Because the EMG signal strengths of different users aredifferent and due to some other factors, an EMG self-learningrecognition method is proposed as shown in Figure 9. Beforethe pattern recognition, EMG signals are processed as shownin Figure 7.
EMG sensors are attached to the surface of the muscle toacquire the EMG signals. Figures 8(a), 8(b), and 8(c) showthe amplified EMG signals, the shaped EMG signals, and thefiltered EMG signals, respectively.
In Figure 9, EMG1and EMG
2are the EMG signals which
are preprocessed as shown in Figure 7. The values of EMG1
and EMG2are between 0V and 3.3 V. The EMG learner is
designed to record and update the minimum and maximumvalues of the EMG signals. Amoving window is adopted, andthe principles of the recording and updating are as follows:
Step 1. Calculate the average value (Ave) of the data inmovingtime window:
Ave = 1
𝑁
𝑁−1
∑
𝑛=0
EMG1(𝑡 − 𝑛) , (1)
whereN is the length of the timewindow. EMG1(𝑡) represents
the current data of the EMG signal and EMG1(𝑡 − 𝑛)
represents the previous 𝑛th data of the EMG signal.
Step 2. Update the data:
Max𝐸1=
{
{
{
Max𝐸1, Max
𝐸1≥ Ave
Ave, Max𝐸1< Ave
Min𝐸1=
{
{
{
Min𝐸1, Min
𝐸1≤ Ave
Ave, Min𝐸1> Ave,
(2)
where Max𝐸1
and Min𝐸1
are the maximum and minimumvalues of the EMG
1, respectively. The initial value of Max
𝐸1
is set to 0, and the initial value of Min𝐸1
is set to 3.3.
Themaximumandminimumvalues of the EMG2,Max𝐸2,
and Min𝐸2
are updated by using the same method.Adjustable factors (𝐾
𝐸1, 𝐾𝐸2) are defined as follows:
𝐾𝐸1=
1
Max𝐸1−Min
𝐸1
,
𝐾𝐸2=
1
Max𝐸2−Min
𝐸2
.
(3)

4 Journal of Sensors
Opticnerves
Eyes
Brain
Forcesensors
Prosthetichand
Motioncommand
Perceivesimulation
Spinalcord
Tactilefeedback
Generatecommand Controller Motion
identification
Featureextraction
Motornerves
Perceivenerves
Physicallysensors
EMGsignals
EMGsacquisition
Figure 6: Control strategy functional scheme.
Amplify Shaping FilterEMGelectrode
Figure 7: Preprocessing scheme of the EMG signals.
The output, 𝐹𝑑, is determined by EMG
1and EMG
2, which is
as follows:𝐹𝑑= [(EMG
1−Min
𝐸1) × 𝐾𝐸1− (EMG
2−Min
𝐸2) × 𝐾𝐸2]
× 𝐾𝐸,
(4)
where𝐾𝐸is the scale factor.
In free space, 𝐹𝑑reflects the closing or opening speed of
the prosthetic hand, and in restricted space, 𝐹𝑑reflects the
grasp force.With the help of this recognitionmethod, the influence of
the diversity of the EMGsignals on the accuracy of the patternrecognition is reduced.
3.2. Backstepping Controller with Stiffness Fuzzy Observation.To realize the position control and grasp force control,a backstepping controller with stiffness fuzzy observation(BCSFO) is designed in this paper.The designed controller isshown in Figure 10. The input signal, 𝐹
𝑑, is the output of the
motion recognizer. 𝐹𝑛is the grasp force measured by force
sensor which is attached to the prosthetic hand’s finger, 𝐾𝑛
is the scaling factor, 𝐾𝑛𝑑
is the differential scaling factor, and𝑢 is the voltage applied to motor. 𝑥
1and 𝑥
2are, respectively,
the position and velocity of the prosthetic hand’s finger. 𝑘 isobject’s stiffness and the stiffness is defined as
𝑘 =𝐹𝑛
𝑥0− 𝑥1
(𝑁/∘) , (5)
where 𝑥0is the original size of the object and it is the position
of the prosthetic hand’s finger when the object and fingercontact for the first time.
In free space, the output of the planner is as follows:
𝜃𝑑= 𝜃0+ ∫(𝐹
𝑑− 𝐾𝑛𝐹𝑛− 𝐾𝑛𝑑
𝑑
𝑑𝑡𝐹𝑛)𝑑𝑡 = 𝜃
0+ ∫𝐹𝑑𝑑𝑡, (6)
where 𝜃0is the positionwhen prosthetic hand’s finger changes
from restricted space to free space.In restricted space, the stiffness of the object and the
deformation of the structure may affect the relationshipbetween the grasp force of the prosthetic hand and theangle of the motor rotation. Since the range of the designedgrasp force is relatively small (0∼30N), the influence ofthe structure deformation is ignored, and the output of theplanner in restricted is as follows:
𝜃𝑑= 𝜃𝑛+𝐹𝑑− (𝐾𝑛𝐹𝑛+ 𝐾𝑛𝑑(𝑑/𝑑𝑡) 𝐹
𝑛)
𝑘. (7)
The system model of prosthetic hand is selected as follows:
∙
𝑥1= 𝑥2,
∙
𝑥2= 𝑚 (𝑥
1, 𝑥2) + 𝑛𝑢,
𝑚 (𝑥1, 𝑥2) = −
𝐵
𝐽𝑥2−𝐷
𝐽,
(8)
where 𝐵, 𝐽, and𝐷 are, respectively, the inertia, damping, andunknown nonlinear damping of the system. 𝑢 is the output ofthe system, and it is the control voltage of the motor.
Journal of Sensors 5
0 1.0 2.0 3.0 4.0 5.0−2
−1.5
−1.0
−0.5
0
0.5
1.0
1.5
2.0
Time (s)
Am
plitu
de (V
)
(a)
0 1.0 2.0 3.0 4.0 5.0
Time (s)
Am
plitu
de (V
)
0
0.5
1.0
1.5
2.0
(b)
0 1.0 2.0 3.0 4.0 5.0
Time (s)
Am
plitu
de (V
)
0
0.5
1.0
1.5
2.0
(c)
Figure 8: Amplified, shaped, and filtered EMG signals.
EMG1
EMG2
Learner1
Learner2
MinE1
MinE2
−
−
−
+
+
+
KE1
KE2
KE
Fd
⨂
⨂
⨂
Figure 9: EMG signal self-learning recognition scheme.
Two error subsystems are defined as
𝑍1= 𝑥1,
𝑍2= 𝑥2− 𝛼1(𝑥1) ,
(9)
Fd
Fn
+
+
−
−−
−Planner
𝜃d Kp
n−1m(x1, x2)
u
Stiffnessfuzzy
observer
Prosthetic
hand
n−1(c1 + c2)n−1(1− c21 )
Fn
x1
x2
k⨂
⨂
Kn + |Kndd
dt|
Figure 10: The block diagram of the backstepping controller withstiffness fuzzy observation.
where 𝛼1(𝑥1) is a virtual control variable (i.e., the estimate of
𝑥2):
∙
𝑍1=∙
𝑥1= 𝑥2. (10)

6 Journal of Sensors
ZO PS PL
0 1
NSNL
−2 −1
1
2
ZO S M L
0
1
51 10 15
𝜇k 𝜇
k.k
.k
(a)
ZO S L
0
1M
0.2 0.4 0.6 0.8
𝜇w
w
(b)
Figure 11: Membership functions for fuzzy reasoning. (a) Input member functions. (b) Output member functions.
Take 𝛼1(𝑥1) = −𝑐
1𝑍1, 𝑐1> 0; then
∙
𝑍1= 𝑍2+ 𝛼1(𝑥1) = 𝑍2− 𝑐1𝑍1. (11)
The Lyapunov function of the first error subsystem is definedas
𝑉1=1
2𝑍2
1,
∙
𝑉1= 𝑍1
∙
𝑍1= −𝑐1𝑍2
1+ 𝑍1𝑍2,
∙
𝑍2=∙
𝑥2−∙
𝛼1(𝑥1)
= 𝑚 (𝑥1, 𝑥2) + 𝑛𝑢 + 𝑐
1
∙
𝑍1
= 𝑚 (𝑥1, 𝑥2) + 𝑛𝑢 − 𝑐
2
1𝑍1+ 𝑐1𝑍2.
(12)
The Lyapunov function of the second error subsystem isdefined as
𝑉2= 𝑉1+1
2𝑍2
2,
∙
𝑉2 =
∙
𝑉1+𝑍2
∙
𝑍2
= − 𝑐1𝑍2
1+ 𝑍1𝑍2+ 𝑍2[𝑚 (𝑥
1, 𝑥2) + 𝑛𝑢 + 𝑐
1
∙
𝑍1]
= − 𝑐1𝑍2
1+ 𝑍1𝑍2+ 𝑍2[𝑚 (𝑥
1, 𝑥2) + 𝑛𝑢 − 𝑐
2
1𝑍1+ 𝑐1𝑍2] .
(13)
Take the control law for 𝑢 as follows:
𝑢 =1
𝑛[−𝑚 (𝑥
1, 𝑥2) − (1 − 𝑐
2
1)𝑍1− (𝑐2+ 𝑐1) 𝑍2] . (14)
Then
∙
𝑉2= −𝑐1𝑍2
1− 𝑐2𝑍2
2≤ 0, 𝑐
1> 0, 𝑐
2> 0. (15)
By the Lyapunov stability theory, the designed control systemcan reach a steady state in a limited time, so the system hasthe stability.
In order to grasp objects with different stiffness stably, astiffness fuzzy observer is designed to adjust 𝑚(𝑥
1, 𝑥2). The
employed fuzzy logic reasoning has double inputs (𝑘 and∙
𝑘)

Journal of Sensors 7
Table 1: Fuzzy reasoning rules.
𝑤 𝑘
ZO S M L
∙
𝑘
NL ZO ZO S MNS ZO S S MZO ZO S M LPS S S M LPL S M L L
05
1015
20
−2
0
2
0
0.2
0.4
0.6
0.8
1
w
k
.k
Figure 12: Input–output relationship surface map for fuzzy reason-ing.
and a single output (𝑤). 𝑘 and∙
𝑘 are, respectively, the stiffnessand the stiffness’ derivative.𝑚(𝑥
1, 𝑥2) is adjusted as follows:
𝑚(𝑥1, 𝑥2) = − (1 + 𝑤)
𝐵
𝐽𝑥2−𝐷
𝐽. (16)
During fuzzification and defuzzification, the inputs and theoutput types are defined as several fuzzy sets with trigonom-etry/trapezoidalmembership functions as shown in Figure 11.The fuzzy reasoning rules for𝑤 are shown inTable 1. Figure 12shows the overall input–output relationship of the fuzzy logicreasoning.
3.3. Tactile Representation System. There are lots of neuronsdistributed on the skin all over the body. The mechanism iscalled tactile perception.These neurons can receive the infor-mation (temperature, humidity, pain, pressure, vibration,etc.) outside the body. One of the most common phenomenaof tactile perception is that when natural hand touches anobject, the characteristics of the object such as the shape andsurface roughness can be felt. Tactile perception is a wayto obtain information. It involves human physiology, tactilephysiology, tactile phenomenon, and so forth [10, 11].
Whenworking in this, tactile representation is important.It is important to transmit grasp force and slide informationback to the user.
3.3.1. Grasp Force Detection. In order to achieve a morecomprehensive and more accurate measurement of the graspforce, several force sensors are developed [12, 13]. Figure 13(a)shows the thumb of the prosthetic hand. A force sensor(FSS SMT Series, Honeywell) is installed on the tip of thefinger; the other two half bridges (Wheatstone half bridge)are separately fixed on the middle and the root of the thumb.This kind of distribution is utilized because the force pointson the finger may be different when user grasps objects.
The sensitivity of the force sensor is 12.2mV/N.The force,𝐹1, applied to area 1 is as follows:
𝐹1=
𝑢𝐹
12.2mV, (17)
where 𝑢𝐹is the output of the force sensor.
Four strain gauges (sg1, sg2, sg3, and sg4) which havethe same properties (material, size, strain coefficient, etc.) areattached to the thumb of the prosthetic hand as shown inFigure 13. 𝑅
1, 𝑅2, 𝑅3, and 𝑅
4represent the resistance of these
strain gauges, respectively. And 𝑅1, 𝑅2, 𝑅3, and 𝑅
4are of the
same value.The thumb of the prosthetic hand is made of aluminum.
There is a deformation in the thumb when the force isapplied to it. The deformation of the thumb will lead to thecorresponding deformation of the strain gauges. And thedeformation of the strain gauges will lead to the change ofthe resistances’ value of these strain gauges.
Take sg1 and sg2; for example, tensile deformation andcompressive deformation occurred in sg1 and sg2, respec-tively, when the force is applied to the thumb. Tensiledeformation of sg1 results in the increasing of the resistance’value of sg1. On the contrary, compressive deformation of sg2results in the decreasing of the resistance’ value of sg2. Thevariations of the resistance’ value of sg1 and sg2 are consideredto be the same for the reason that the deformation is small andsg1 and sg2 have the same properties.
sg1 and sg2 are connected in the measurement circuit asshown in Figure 13(b). sg1, sg2, and two additional resistances(𝑅𝑎1, 𝑅𝑎2) constitute a Wheatstone bridge. The output of the
circuit, 𝑈𝑔1, is as follows:
𝑈𝑔1=
𝑅2− Δ𝑅
(𝑅1+ Δ𝑅) + (𝑅
2− Δ𝑅)
× 𝐸 −𝑅
𝑅 + 𝑅× 𝐸
= −Δ𝑅
2 × 𝑅1
× 𝐸,
(18)
where 𝐸 is the power voltage supplied to the circuit, Δ𝑅 is thechange of resistance of sg1 and sg2, and 𝑅 is the value of 𝑅
𝑎1
and 𝑅𝑎2.
Because the force, 𝐹2, applied to area 2 (as shown in
Figure 13) is proportional to the deformation of the straingauges, it can be obtained by measuring the output of thecircuit (𝑈
𝑔1, shown in Figure 13(b)).
The force, 𝐹3, applied to area 3 can be obtained by using
the same method.When the prosthetic hand contacts the object in areas 1,
2, and 3, the grasp forces are measured by force sensor, halfbridge 1, and half bridge 2, respectively.

8 Journal of Sensors
Forcesensor
Area 1
Area 2
Area 3
sg4sg3
sg2sg1 Half bridge 1
Half bridge 2
(a)
sg2sg1
Ug1
+
+
−
−
E
Ra1 Ra2
(b)
Figure 13:The thumb of the prosthetic hand and the sensormeasurecircuit.
3.3.2. Sliding State Detection. A polyvinylidene fluoride(PVDF) piezoelectric film is often used for tactile sensordesign to detect the sliding for its excellent dynamic char-acteristics and physical characteristics, such as light quality,soft, large contact resistance, and plasticity [14, 15]. In thispaper, a PVDF piezoelectric film is attached to the surfaceof the silicone glove of the prosthetic hand. The signal inFigure 14(a) shows a sliding during a grasp operation. In thisfigure, 𝑇 indicates the time span of a sliding process.
To reduce the influence of noise on sliding detection,the filtering process is implemented. In addition, a smallthreshold is subtracted. Figure 14(b) shows the sliding signalsafter these two processes. Compared with the sliding signals,temperature is a slow change variable. The influence of thetemperature is ignored when using PVDF to detect the slidestate.
According to the signals shown in Figure 14 and thecharacteristics of the PVDF, the number of zero-crossing pertime unit is adopted to indicate the sliding situation.
3.3.3. Tactile Representation. Themain tactile representationtechniques are pneumatic stimulation, vibration stimulation,functional neuromuscular stimulation, thimble stimulation,thermal stimulation, and so forth [16]. The vibration stim-ulation is adopted because it is convenient to use and doesnot cause damage to human body. The vibration codingpatterns, including vibration frequency, amplitude, duration,rhythm, and order [17, 18], affect the accuracy of the tactileperception of the user directly. However, due to the existenceof the tactile illusion phenomenon, an efficient vibrationcoding pattern must be established. The tactile illusion isa kind of phenomenon in which tactile perceptions do notmatch the objective stimulation.Many kinds of tactile illusionphenomena have already been discovered, such as phantomsensation and apparentmovement.The reasonable utilizationof these phenomena may contribute to realization of thetactile representation.
0 0.5 1.0 1.5 2.0 2.5 3.0−1.5
−1
−0.5
0
0.5
1.0
1.5
Time (s)
Volta
ge (V
)
T
(a)
0 0.5 1.0 1.5 2.0 2.5 3.0
Time (s)
Volta
ge (V
)
−1
−0.5
0
0.5
1
(b)
Figure 14: Sliding signals.
t0 t1 t2 t (ms)
3
1
2
Vibration duration time
Mot
or n
umbe
r
Figure 15: The coding pattern of the grasp force tactile representa-tion.
A coding pattern (vibration coding) of grasp force isdesigned. As shown in Figure 15, when the grasp force isdetected, motor number 2 begins to vibrate, and then motornumber 1 and motor number 3 begin to vibrate. 𝑡
0is the
beginning time of motor number 2, 𝑡1is the beginning time
of motors number 1 and number 3, and 𝑡2is the ending time
of all these motors. 𝑡0is the time of grasp force being detected
as well, and 𝑡2shows the time when the grasp force reduces to
zero.The interval between 𝑡0and 𝑡1is 300ms.The grasp force
measured by the sensor is used to modulate the vibrationstrength (VS) according to the principle as shown in formula
Journal of Sensors 9
t0 t1 t2 t3 t4 t (ms)
6
5
4
Vibration duration time
Mot
or n
umbe
r
Figure 16: The coding pattern of the sliding tactile representation.
Table 2: Relationship between vibration strength level and voltageapplied to motor.
Vibration strength level Voltage applied to motor (V)I 1.0II 2.0III 3.0IV 4.0V 5.0
(19), and the vibration frequency is set to 100Hz. By thismethod, the user may feel his/her arm being grasped:
VS =
{{{{{{{{{{
{{{{{{{{{{
{
I 0 < 𝑟 ≤ 0.2
II 0.2 < 𝑟 ≤ 0.4
III 0.4 < 𝑟 ≤ 0.6
IV 0.6 < 𝑟 ≤ 0.8
V 0.8 < 𝑟 ≤ 1.0,
(19)
where I, II, III, IV, and V are the vibration strength levels; therelationship between vibration strength levels and the voltageapplied to the motor is as shown in Table 2. 𝑟 is the ratio ofgrasp force detected by the force sensors to the maximumallowable value of the grasp force:
𝑟 =𝐹
𝐹max, (20)
where 𝐹 is the grasp force detected by the force sensors and𝐹max is the maximum allowable value of the grasp force.
A sliding tactile representation coding pattern is designedaccording to the phenomenon of apparent movement (seeappendix) [19]. The vibration strength is set to level III,and the vibration frequency is set to 100Hz. As shown inFigure 16, 𝑡
0, 𝑡1, and 𝑡
2are, respectively, the beginning time of
the motors number 4, number 5, and number 6. The endingtimes of these three motors, respectively, are 𝑡
2, 𝑡3, and 𝑡
4.
The time intervals of 𝑡0∼ 𝑡1, 𝑡1∼ 𝑡2, 𝑡2∼ 𝑡3, and 𝑡
3∼ 𝑡4are
EMG sensor1 EMG sensor2 EMG sensor3 EMG sensor4
2 cm Wrist
Figure 17: Laminating position of the EMG sensors.
0 1 2 3 4 5 6 7 8 9
Ch 4
Ch 3
Ch 2
Ch 1
Time (s)
EMG
sign
als
Figure 18: EMG signals coming from 4 EMG sensors.
Table 3: Combination of the EMG signals.
Group Composition1 Ch1 and Ch32 Ch1 and Ch43 Ch2 and Ch34 Ch2 and Ch4
250ms. 𝑡0is the time of sliding situation being detected as
well. By this method, the user may feel something sliding onhis/her arm.
4. Experiments and Results
To verify the validity of the control strategy presented in thispaper, lab-based experiments were carried out.
4.1. Evaluation Experiments of the EMG Self-Learning MotionRecognition Method. Motion recognition experiment wasconducted to verify the effectiveness of the EMG self-learningmotion recognition method. In the experiment, four EMGsensors were distributed on the participants’ forearms asshown in Figure 17. The participants executed hand motions(hand grasp and hand open) according to the commands.Figure 18 shows the EMG signals when participants executedthe hand motions.
According to the laminating positions of the EMG sen-sors, EMGsignals coming from four sensors can be combinedinto four groups as shown in Table 3. Two recognitionmethods, including one shown in Figure 1 and the other EMGself-learning recognition method, have been applied to thesefour groups EMG signals. Figure 19 shows the recognitionresults by using the recognitionmethod as shown in Figure 1,and Figure 20 shows the recognition results by using theEMG self-learning recognition method.

10 Journal of Sensors
Table 4: Correlation coefficients between every two recognition results by using the recognition method shown in Figure 1.
Correlation coefficient (%) Recognition resultsof group 1
Recognition resultsof group 2
Recognition resultsof group 3
Recognition resultsof group 4
Recognition results of group 1 100 89.39 94.35 87.84Recognition results of group 2 100 90.49 97.91Recognition results of group 3 100 91.58Recognition results of group 4 100
Table 5: Correlation coefficients between every two recognition results by using the EMG self-learning recognition method.
Correlation coefficient (%) Recognition resultsof group 1
Recognition resultsof group 2
Recognition resultsof group 3
Recognition resultsof group 4
Recognition results of group 1 100 99.20 99.25 98.11Recognition results of group 2 100 98.28 99.53Recognition results of group 3 100 99.04Recognition results of group 4 100
0 1 2 3 4 5 6 7 8 9−60
−40
−20
0
20
40
60
Time (s)
Fd
Results of group 1
Results of group 2
Results of group 3Results of group 4
Figure 19: Motion recognition results by using the recognitionmethod shown in Figure 1.
To evaluate the consistency of the recognition results,the correlation coefficients between every two recognitionresultswere calculated as shown inTables 4 and 5. Correlationcoefficient (𝜌) is a measurement of the linear correlation(dependence) between two variables 𝑋 and 𝑌. It is widelyused as a measurement of the degree of linear dependencebetween two variables. The formula for 𝜌 is
𝜌𝑋,𝑌
=cov (𝑋, 𝑌)𝜎𝑋𝜎𝑌
=𝐸 [(𝑋 − 𝜇
𝑋) (𝑌 − 𝜇
𝑌)]
𝜎𝑋𝜎𝑌
, (21)
where cov is the covariance, 𝜎𝑋is the standard deviation of
𝑋, 𝜇𝑋is the mean of𝑋, and 𝐸 is the expectation.
From the results of the EMG motion recognition exper-iment, recognition results by using the EMG self-learningrecognition method have a better consistency. EMG self-learning can reduce the influence on EMG signals causedby the uncertainty of the contacting position of the EMGsensors.
0 1 2 3 4 5 6 7 8 9−40
−30
−20
−10
0
10
20
30
40
Time (s)
Fd
Results of group 1
Results of group 2
Results of group 3
Results of group 4
Figure 20: Motion recognition results by using the EMG self-learning recognition method.
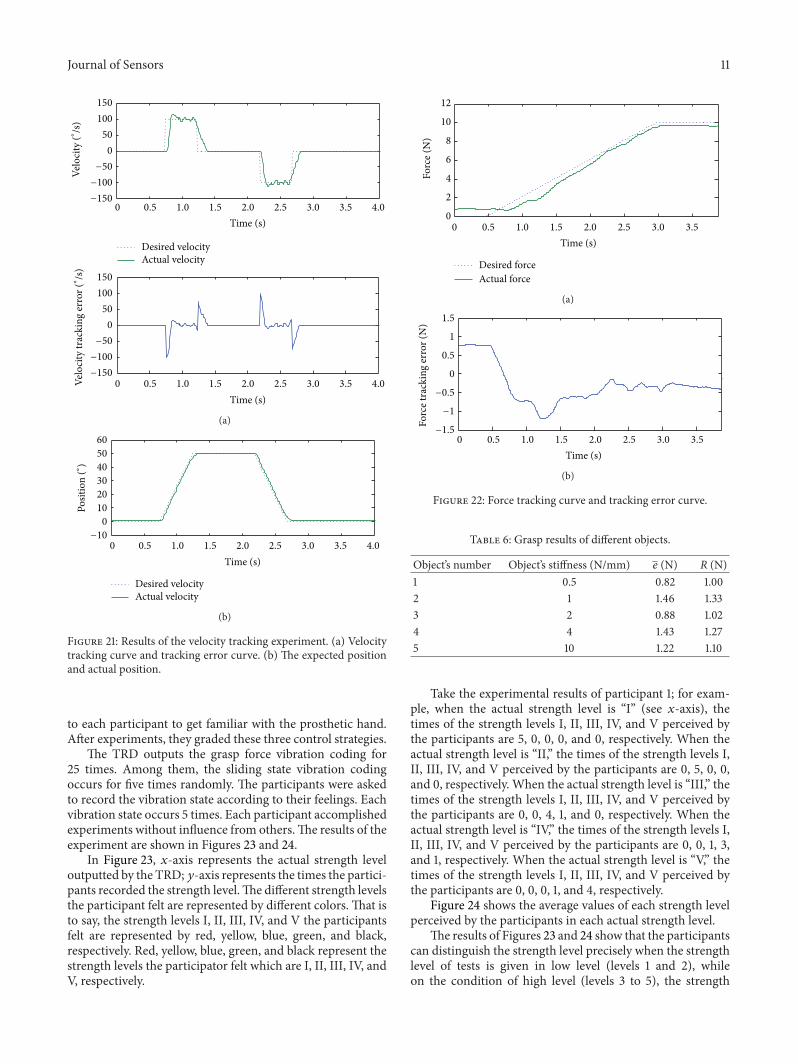
4.2. Evaluation Experiments of the Backstepping Controller.To verify the effectiveness of the BCSFO, velocity trackingand force tracking experiments were implemented. Thedesigned speed was inputted to the controller in free space,while the designed grasp force was inputted to the controllerin restricted space.The results are shown in Figures 21 and 22.The objects with different stiffness were grasped by prosthetichand in the experiment, and the results are shown in Table 6.Table 6 contains the mean value (𝑒) andmean variance (𝑅) ofthe force tracking error. The results show that the controllercan track the designed velocity and designed grasp forcequickly; the tracking error is in the acceptable range.
4.3. Tactile Representation Coding Experiment and Results.Ten nonamputee volunteers (fivemales and five females, agedfrom 22 to 27) were chosen to use the MPH-III. The EMGacquisition device was worn on the forearm, and the EMGsensors were put on a pair of antagonistic muscles. The TRDwas worn on the upper arm. Five minutes or more was given
Journal of Sensors 11
0 0.5 1.0 1.5 2.0 2.5 3.0 3.5 4.0
0 0.5 1.0 1.5 2.0 2.5 3.0 3.5 4.0−150
−100
−50
0
50
100
150
−150
−100
−50
0
50
100
150
Time (s)
Time (s)
Velo
city
(∘/s
)Ve
loci
ty tr
acki
ng er
ror (
∘ /s)
Desired velocityActual velocity
(a)
0 0.5 1.0 1.5 2.0 2.5 3.0 3.5 4.0
Time (s)
Desired velocityActual velocity
−10
0
10
20
30
40
50
60
Posit
ion
(∘)
(b)
Figure 21: Results of the velocity tracking experiment. (a) Velocitytracking curve and tracking error curve. (b) The expected positionand actual position.
to each participant to get familiar with the prosthetic hand.After experiments, they graded these three control strategies.
The TRD outputs the grasp force vibration coding for25 times. Among them, the sliding state vibration codingoccurs for five times randomly. The participants were askedto record the vibration state according to their feelings. Eachvibration state occurs 5 times. Each participant accomplishedexperiments without influence from others.The results of theexperiment are shown in Figures 23 and 24.
In Figure 23, 𝑥-axis represents the actual strength leveloutputted by the TRD;𝑦-axis represents the times the partici-pants recorded the strength level.The different strength levelsthe participant felt are represented by different colors. That isto say, the strength levels I, II, III, IV, and V the participantsfelt are represented by red, yellow, blue, green, and black,respectively. Red, yellow, blue, green, and black represent thestrength levels the participator felt which are I, II, III, IV, andV, respectively.
0
2
4
6
8
10
12
Forc
e (N
)
0 0.5 1.0 1.5 2.0 2.5 3.0 3.5
Time (s)
Desired forceActual force
(a)
−1.5
−1
−0.5
0
0.5
1
1.5
0 0.5 1.0 1.5 2.0 2.5 3.0 3.5
Time (s)
Forc
e tra
ckin
g er
ror (
N)
(b)
Figure 22: Force tracking curve and tracking error curve.
Table 6: Grasp results of different objects.
Object’s number Object’s stiffness (N/mm) 𝑒 (N) R (N)1 0.5 0.82 1.002 1 1.46 1.333 2 0.88 1.024 4 1.43 1.275 10 1.22 1.10
Take the experimental results of participant 1; for exam-ple, when the actual strength level is “I” (see 𝑥-axis), thetimes of the strength levels I, II, III, IV, and V perceived bythe participants are 5, 0, 0, 0, and 0, respectively. When theactual strength level is “II,” the times of the strength levels I,II, III, IV, and V perceived by the participants are 0, 5, 0, 0,and 0, respectively. When the actual strength level is “III,” thetimes of the strength levels I, II, III, IV, and V perceived bythe participants are 0, 0, 4, 1, and 0, respectively. When theactual strength level is “IV,” the times of the strength levels I,II, III, IV, and V perceived by the participants are 0, 0, 1, 3,and 1, respectively. When the actual strength level is “V,” thetimes of the strength levels I, II, III, IV, and V perceived bythe participants are 0, 0, 0, 1, and 4, respectively.
Figure 24 shows the average values of each strength levelperceived by the participants in each actual strength level.
The results of Figures 23 and 24 show that the participantscan distinguish the strength level precisely when the strengthlevel of tests is given in low level (levels 1 and 2), whileon the condition of high level (levels 3 to 5), the strength

12 Journal of Sensors
I II III IV V0
1
2
3
4
5
Participant 1
The actual strength level
Cou
nts
I II III IV V0
1
2
3
4
5
The actual strength level
Cou
nts
I II III IV V0
1
2
3
4
5
The actual strength levelC
ount
s
I II III IV V0
1
2
3
4
5
The actual strength level
Cou
nts
I II III IV V0
1
2
3
4
5
The actual strength level
Cou
nts
I II III IV V0
1
2
3
4
5
The actual strength level
Cou
nts
I II III IV V0
1
2
3
4
5
The actual strength level
Cou
nts
I II III IV V0
1
2
3
4
5
The actual strength level
Cou
nts
I II III IV V
IIIIII
IVV
IIIIII
IVV
0
1
2
3
4
5
The actual strength level
Cou
nts
I II III IV V0
1
2
3
4
5
The actual strength level
Cou
nts
Participant 2
Participant 3 Participant 4
Participant 5 Participant 6
Participant 7 Participant 8
Participant 9 Participant 10
Figure 23: Results of the grasp force coding experiment.

Journal of Sensors 13
I II III IV V
1(I)1.5
2(II)2.5
3(III)3.5
4(IV)4.5
5(V)
Actual strength level
Subject 1Subject 2Sunject 3Subject 4Subject 5
Subject 6Subject 7Subject 8Subject 9Subject 10
Aver
age v
alue
s of e
ach
stren
gth
leve
l per
ceiv
ed b
y th
e par
ticip
ants
in ea
ch ac
tual
stre
ngth
leve
l
Figure 24: Average values of each strength level perceived by theparticipants in each actual strength level.
Figure 25: Experiment scene of grasping.
level perceived by the participants in each actual strengthlevel fluctuates around the actual strength level. The errorsbetween false records and correct records are no more than1 level. The results of all the participants show the sametrend. In the view of the experimental results, this kind ofvibration coding can help users to perceive the grasp forceof the prosthetic hand.
The experimental result of tactile representation of slidingstate is as its expected because the coding pattern is simpleand there is no relationship between the siding coding patternand grasp force tactile feedback. Most of the participants canmake the judgment whether the sliding occurs or not.
4.4. Grasp Experiments and Results. The force control strat-egy (M1) shown in Figure 1, the EMG self-learning controlstrategy (M2), and control strategy shown in Figure 2 (M3)were compared with each other. These three strategies allcontain visual feedback.The differences are thatM2 has EMGself-learning function and the controller in M2 is BCSFO.Besides the features of M2, M3 has an additional function oftactile feedback. The experiments assume that the functionsof visual feedback in these three strategies are the same.Five minutes was given for participants to get familiar with
0 0.5 1.0 1.5 20
1
2
3
4
5
6
Time (s)
Grip
forc
e (N
)
Figure 26: Grasp force curve.
these control strategies. Then, ten participants were askedto grasp and lift a paper cup which was full of water (seeFigure 25). In this process, the participant should keep waterwithout overflowing or dropping. All control strategies weretested for ten times. The number of successful lifting wasused to quantify the performance of the control strategy.And the participants were asked to evaluate every controlstrategy after experiments according to their feeling aboutthe performance of the control strategy. And the performanceincludes flexibility and usability.The best control strategy wasmarked as highest grade, 10. Table 7 shows the results of theexperiment. Figure 26 shows the grasp force curve which wasrecorded in the process of a participant grasping a paper cupby using the control strategy of M3.
In this experiment, the comments from all participantsshow that theM3 is the best one among these three strategies.When using prosthetic hand without EMG self-learning,most of the participants have to adjust the positions of theEMG sensors on the skin surface, while it is unnecessary toadjust by using the strategies with EMG self-learning.
5. Conclusions
The control strategy with tactile feedback for EMG prosthetichand is described in detail. Aiming at reducing the influ-ence on the EMG signals which comes from the attachingpositions of EMG sensors, an EMG self-learning recognitionmethod is proposed. A BCSFO is proposed to realize thevelocity proportional control in free space and grasp forcetracking control in restricted space. A tactile representationsystem is designed to help the user perceive the state of theprosthetic hand, and the states include grasp force and slidinformation.
The experiments are implemented to verify the effectof the proposed control strategy. And the results show thatthe different contacting positions between sensors and armlead to the variance of the EMG signals, and this kind ofinfluence can be reduced by the proposed EMG self-learningmethod. The proposed BCSFO can meet the requirementsof the prosthetic hand (velocity proportional control in freespace and grasp force tracking control in restricted space).And the results of the grasping experiments show that thestrategy with EMG self-learning method and tactile feedback(M3) is better than the strategy of the force control (M1) and

14 Journal of Sensors
Table 7: Results of the paper cup grasping experiment.
Mean success rate of papercup grasping (%)
Standard deviation of papercup grasping (%)
Mean score marked by thetest participants
Force control (M1) 51 18 6.35EMG self-learning force control (M2) 59 20 7.25EMG self-learning force control withtactile feedback (M3) 79 15 10
A B A B A B
A B A B A B
Vibr
atio
nsti
mul
usTa
ctile
perc
eptio
n
Figure 27: Diagram of the apparent movement.
the strategy of the EMG self-learning control (M2) in theaspect of control effect of the prosthetic hand.
Moreover, all the participants think that the EMG signalself-learning pattern recognition method is much morehelpful and convenient in the process of manipulating theprosthetic hand.
For the future work, after lots of experiments we willresearch a more effective coding pattern for tactile represen-tation, which would be easily accepted by amputees.
Appendix
This phenomenon was described in detail in [19]. Its basicprinciple is as follows.
(1) Point A starts to vibrate.
(2) Point B starts to vibrate.
(3) Point A stops.
By applying vibration stimulation in this order, theparticipant will get an illusion that point A is moving towardspoint B (see Figure 27).
Conflict of Interests
The authors declare that there is no conflict of interestsregarding the publication of this paper.
Acknowledgment
This paper was supported by the Nature Science foundationof China under Grant no. 61325018.
References
[1] H. H. Sears and J. Shaperman, “Proportional myoelectric handcontrol: an evaluation,” American Journal of Physical Medicineand Rehabilitation, vol. 70, no. 1, pp. 20–28, 1991.
[2] M. H. M. Zaini and S. A. Ahmad, “Surgical and non-surgicalprosthetic hands control: a review,” in Proceedings of the IEEESymposium on Industrial Electronics and Applications (ISIEA’11), pp. 634–637, 2011.
[3] D. Graupe and W. K. Cline, “Functional separation of EMGsignals via ARMA identificationmethods for prosthesis controlpurposes,” IEEE Transactions on Systems, Man and Cybernetics,vol. 5, no. 2, pp. 252–259, 1975.
[4] T. Khoshaba, K. Badie, and R. M. Hashemi, “EMG patternclassification based on back propagation neural network forprosthesis control,” in Proceedings of the 12th Annual Inter-national Conference of the IEEE Engineering in Medicine andBiology Society, pp. 1474–1475, November 1990.
[5] K. Mahaphonchaikul, D. Sueaseenak, C. Pintavirooj, M. Sang-worasil, and S. Tungjitkusolmun, “EMG signal feature extrac-tion based on Wavelet transform,” in Proceedings of the7th Annual International Conference on Electrical Engineer-ing/Electronics, Computer, Telecommunications and InformationTechnology (ECTI-CON ’10), pp. 327–331, May 2010.
[6] A. Fassih, D. S. Naidu, S. Chiu, and M. P. Schoen, “Preci-sion grasping of a prosthetic hand based on virtual springdamper hypothesis,” inProceedings of the 5thCairo InternationalBiomedical Engineering Conference (CIBEC ’10), pp. 79–82,Cairo, Egypt, December 2010.
[7] C.-H. Chen, D. S. Naidu, A. Perez-Gracia, and M. P. Schoen, “Ahybrid adaptive control strategy for a smart prosthetic hand,”in Proceedings of the 31st Annual International Conference of theIEEE Engineering in Medicine and Biology Society (EMBC ’09),pp. 5056–5059, IEEE, September 2009.
[8] E. D. Engeberg and S. G.Meek, “Backstepping and slidingmodecontrol hybridized for a prosthetic hand,” IEEE Transactions on

Journal of Sensors 15
Neural Systems and Rehabilitation Engineering, vol. 17, no. 1, pp.70–79, 2009.
[9] C. Wu, A. Song, and H. Zhang, “Adaptive fuzzy controlmethod for EMG prosthetic hand,” Chinese Journal of ScientificInstrument, vol. 34, no. 6, pp. 1339–1345, 2013.
[10] J. Liu and A. Song, “Discrimination and memory experimentson haptic perception of softness,” Perceptual and Motor Skills,vol. 106, no. 1, pp. 295–306, 2008.
[11] C. Antfolk, M. D’alonzo, B. Rosen, G. Lundborg, F. Sebelius,and C. Cipriani, “Sensory feedback in upper limb prosthetics,”Expert Review of Medical Devices, vol. 10, no. 1, pp. 45–54, 2013.
[12] A. Song, J. Wu, G. Qin, and W. Huang, “A novel self-decoupledfour degree-of-freedom wrist force/torque sensor,” Measure-ment, vol. 40, no. 9-10, pp. 883–891, 2007.
[13] J. Ma, A. Song, and D. Pan, “Dynamic compensation for two-axis robot wrist force sensors,” Journal of Sensors, vol. 2013,Article ID 357396, 5 pages, 2013.
[14] A. Song, Y. Han,H.Hu, and J. Li, “A novel texture sensor for fab-ric texture measurement and classification,” IEEE Transactionson Instrumentation and Measurement, vol. 63, no. 7, pp. 1739–1747, 2013.
[15] H. Hu, Y. Han, A. Song, S. Chen, C. Wang, and Z. Wang, “Afinger-shaped tactile sensor for fabric surfaces evaluation by2-dimensional active sliding touch,” Sensors, vol. 14, no. 3, pp.1588–1592, 2014.
[16] D.Wood, “Tactile displays: present and future,”Displays, vol. 18,pp. 125–128, 1998.
[17] S. A. Brewster and L. M. Brown, “Tactons: structured tactilemessages for non-visual information display,” in Proceedings ofthe 5th Australasian User Interface Conference (AUIC ’04), pp.15–23, Dunedin, New Zealand, 2004.
[18] K. MacLean and M. Enriquez, “Perceptual design of hapticicons,” in Proceedings of Eurohaptics, pp. 351–363, 2003.
[19] G. V. Bekesy, “Sensation on the skin similar to directionalhearing, beats, and harmonics of the ear,” Journal of the AcousticSociety of America, vol. 29, no. 4, pp. 489–501, 1957.

International Journal of
AerospaceEngineeringHindawi Publishing Corporationhttp://www.hindawi.com Volume 2014
RoboticsJournal of
Hindawi Publishing Corporationhttp://www.hindawi.com Volume 2014
Hindawi Publishing Corporationhttp://www.hindawi.com Volume 2014
Active and Passive Electronic Components
Control Scienceand Engineering
Journal of
Hindawi Publishing Corporationhttp://www.hindawi.com Volume 2014
International Journal of
RotatingMachinery
Hindawi Publishing Corporationhttp://www.hindawi.com Volume 2014
Hindawi Publishing Corporation http://www.hindawi.com
Journal ofEngineeringVolume 2014
Submit your manuscripts athttp://www.hindawi.com
VLSI Design
Hindawi Publishing Corporationhttp://www.hindawi.com Volume 2014
Hindawi Publishing Corporationhttp://www.hindawi.com Volume 2014
Shock and Vibration
Hindawi Publishing Corporationhttp://www.hindawi.com Volume 2014
Civil EngineeringAdvances in
Acoustics and VibrationAdvances in
Hindawi Publishing Corporationhttp://www.hindawi.com Volume 2014
Hindawi Publishing Corporationhttp://www.hindawi.com Volume 2014
Electrical and Computer Engineering
Journal of
Advances inOptoElectronics
Hindawi Publishing Corporation http://www.hindawi.com
Volume 2014
The Scientific World JournalHindawi Publishing Corporation http://www.hindawi.com Volume 2014
SensorsJournal of
Hindawi Publishing Corporationhttp://www.hindawi.com Volume 2014
Modelling & Simulation in EngineeringHindawi Publishing Corporation http://www.hindawi.com Volume 2014
Hindawi Publishing Corporationhttp://www.hindawi.com Volume 2014
Chemical EngineeringInternational Journal of Antennas and
Propagation
International Journal of
Hindawi Publishing Corporationhttp://www.hindawi.com Volume 2014
Hindawi Publishing Corporationhttp://www.hindawi.com Volume 2014
Navigation and Observation
International Journal of
Hindawi Publishing Corporationhttp://www.hindawi.com Volume 2014
DistributedSensor Networks
International Journal of


![Strategy for Development, First Article[1], Traduccion](https://img.pdfslide.net/doc/110x75/577cc4691a28aba711993650/strategy-for-development-first-article1-traduccion.jpg)