Embed Size (px)
Citation preview
Research ArticleA New Approach to Determine the Critical Path in StochasticActivity Network
Weng-Ming Chu1 Koan-Yuh Chang2 Chien-Yu Lu3 Chang-Hung Hsu4
Chien-Hung Liu5 and Yung-Chia Hsiao6
1 Department of Electrical Engineering National Chin-Yi University of Technology Taichung 41170 Taiwan2Department of Electronic Engineering Chienkuo Technology University Changhua 500 Taiwan3Department of Industrial Education and Technology National Changhua University of Education Changhua 500 Taiwan4Department of Power Mechanical Engineering Army Academy Zhongli 32093 Taiwan5Department of Computer Science and Information Engineering National Taipei University of Technology Taipei 10608 Taiwan6Department of Electro-Optical and Energy Engineering MingDao University Changhua 52345 Taiwan
Correspondence should be addressed to Koan-Yuh Chang kychangccctuedutw
Received 26 February 2014 Accepted 13 April 2014 Published 14 May 2014
Academic Editor Her-Terng Yau
Copyright copy 2014 Weng-Ming Chu et al This is an open access article distributed under the Creative Commons AttributionLicense which permits unrestricted use distribution and reproduction in any medium provided the original work is properlycited
The determination of the critical path (CP) in stochastic networks is difficult It is partly due to the randomness of path durationsand partly due to the probability issue of the selection of the critical path in the network What we are confronted with is not onlythe complexity among random variables but also the problem of path dependence of the network Besides we found that CP is notnecessarily the longest (or shortest) path in the network which was a conventional assumption in useThe Program Evaluation andReview Technique (PERT) and Critical Path Index (CPI) approaches are not able to deal with this problem efficiently In this studywe give a new definition on the CP in stochastic network and propose a modified label-correcting tracing algorithm (M-LCTA)to solve it Based on the numerical results compared with Monte Carlo simulation (MCS) the proposed approach can accuratelydetermine the CP in stochastic networks
1 Introduction
The CP does not only help managers in making decision foroptimal resource allocation but also help in doing networksensitivity analysis Although the conventional critical pathmethod (CPM) can be used to solve CP very easily [1]CPM does not work properly in stochastic networks due tothe reason that the durations of activities and paths are allrandom variables The values of random variables are in theform of probability which lets the selection of CP becomevery difficult to solve (refer to [2 3]) The well-known andpopular PERT model did not solve it as well according to[4] In other cases some papers use the method of CPIwhere [5] is the early one involved [6 7] used ldquocrude MCSrdquoand ldquoconditional MCSrdquo methods to simulate CPI and [8ndash11]approximated CPI through complex mathematical analysisNo matter what the results of the above approaches are
the CP is not any more the path that has the most importantpriority to accept the rare allocated resources in the networkThis will be explained later in this study Besides none of theabove papers can efficiently afford big-size network which isan important issue in practical applications
For approximating the critical path duration we find that[12 13] have just only aimed at the mean of duration forthe shortest path (SP) instead of procuring the values ofprobability distribution Moreover [14ndash16] have applied theway of simplifying the stochastic network into a deterministicnetwork before solving the SP In other cases the MCS wassuggested and [17] used the discrete Markov chain to dealwith SP
Most of the above studies are either too simple or gottenwith the heavy calculations Further [18] has indicated thatthe CP will be more complex by taking path dependency intoconsideration In this study we have also found that the CP is
Hindawi Publishing CorporationMathematical Problems in EngineeringVolume 2014 Article ID 547627 13 pageshttpdxdoiorg1011552014547627
2 Mathematical Problems in Engineering
not necessarily the longest (or shortest) path in the stochasticnetwork as what the project managers suppose in ordinaryIn this study the CP is redefined as follows
Definition 1 The CP should have dominated the completiontime of the network
Definition 2 Theduration perturbation of activities includedin CP would be more sensitive to the change of completiontime than that of other activities
A new approach of the modified M-LCTA with therevised stochastic dominance operation (RSDO) is developedin this study where the detailed descriptions will be givenin the following sections The rest of this paper is organizedas follows Section 2 discusses how difficult it is to solve theCP in stochastic networks Section 3 provides detailed expla-nations for M-LCTA and RSDO Section 4 demonstratesthe proposed algorithm via two examples Section 5 givesfurther numerical experiments of various large sized networkinstances to illustrate the feasibility of the proposed approachfor CP Finally the concluding remarks are presented inSection 6
2 The Difficulty of Solving Critical Path inStochastic Network
The CP of stochastic network is not as instinctive and easyas using CPM in deterministic network for the sake of fivereasons listed as follows
(a) For solving CP it has to approximate all completionpathsrsquo durations in the network
(b) In general the selection of the CP depends on thesorting of all the network completion paths Thesorting has to be executed through the max or minoperations among the probability distribution func-tions (PDF) of path durations instead of comparingthe pathsrsquo mean value of duration (such as PERTmodel)
(c) There is a bias between the results of PERTmodel andmax or min operations among random variables Inthis study the bias is named as the longest path bias(LPB) or the shortest path bias (SPB) in respect to themax or min operations They have to be consideredduring the network analysis
(d) The path dependence caused by the shared subpath inthe network generates a bias too It is rarely noticedand no solutions have been found yet in the presentpaper
(e) As mentioned in the above section each completionpath could have the probability to be CP in stochasticnetwork Therefore it needs to have a criterion forcomparing the probability values of all completionpaths and to select one of them as CP
According to the above reasons there are more detailedexplanations presented in the following subsections
2
3
1 4
Figure 1 The network with four nodes
21 The Approximation of Path Duration In the network therealization of path duration time is conducted through seriesof convolution and max operations (or min operations) overthe nodes in the network By taking node (119895) that is 120574119895 as anexample the calculations are represented as follows
119884119895
119894 = 120574119894 oplus 119883119894119895 119894 isin 119861119895
Pr (119884119895119894 ) = intinfin
minusinfin
119892119894 (119905 minus 120591) 119891119894119895 (120591) 119889120591
120574119895 = max 119884119895
1 119884119895
2 119884119895
119894
Pr (120574119895 ge 119909) = Pr (1198841198951 ge 119909 119884119895
2 ge 119909 119884119895
119894 ge 119909)
= Pr (1198841198951 ge 119909) sdot Pr (1198841198952 ge 119909) sdot sdot sdot sdot sdot Pr (119884119895119894 ge 119909)
119902 =10038161003816100381610038161003816119861119895
10038161003816100381610038161003816
(1)
where the symbol oplus denotes the convolution operation andPr(sdot) denotes the probability value of the internal function119884119895
119894 is the 119894th incident path of node (119895) 119861119895 is the precedencenodes set of node (119895) and 119892119894(sdot) and 119891119894119895(sdot) denote the PDF of120574119895 and 119883119894119895 respectively It is well known that the estimationof the PDF for the completion time of a project is a nonpoly-nomial hard problem (please see [3] for further reference)
Over the past double decades Dodinrsquos research [20] wasa rare one which can afford a feasible algorithm denoted asDodin algorithm (DA) to solve network completion timeand has been applied to big-size network DA used thediscretization technique to ldquodiscretizerdquo the PDF of each nodersquosduration in the network first it then executed the convolutionand max operations consecutively on nodes so as to deletethe LPB problem Finally DA approximates the PDF of thenetwork completion time By taking Figure 1 as an examplethe iterative steps of the DA are as follows
1205742 = 11988312
11988432 = 1205742 oplus 11988323
1205743 = max 11988313 11988432
11988442 = 1205742 oplus 11988324 (1-2-4)
11988443 = 1205743 oplus 11988334 (1-3-4)
1205744 = max 11988314 11988442 11988443 (1-2-3-4)
(2)
Mathematical Problems in Engineering 3
Though DA provides an elegantly simple and intuitivelyappealing procedure for dealing with the realization times ofpaths in stochastic network there are still two shortages Firstthere exists neither an exact data structure nor implemen-tation scheme for the computer programming Second anapproximated error may arise from assuming independencebetween subpaths in the activity network such a bias will begetting larger when increasing the network size [19]
22 The Sorting among Network Paths In the stochastic net-work all the completion paths could have their probabilitiesto be selected as the CPTherefore one has to offer a criterionto judge and select the highest probability of completion pathsto be the CP from all the paths Dodin algorithm [20] hassuggested the stochastic dominance operation (SDO) for tworandom variablesrsquo comparison By taking variables 1198841198951 and119884119895
2 as examples if 1198841198951 dominates 119884119895
2 (represented as 119884119895
1 ≻
119884119895
2 ) it means that 1198841198951 has a greater possibility than 119884119895
2 to bethe longest path or the shortest path in the network Theirequation relations are represented as follows
Pr (1198841198951 ≻ 119884119895
2) ge Pr (1198841198952 ≻ 119884119895
1) (3)
The SDO just operates for only two variables because of theproblem of the variables transitivity It means that if we have119884119895
1 ≻ 119884119895
2 and119884119895
2 ≻ 119884119895
3 it does not necessarily imply1198841198951 ≻ 119884119895
3 Inthis study transitivity problemwill be solved by the proposedmodified SDO in the following section
23 The Longest Path Bias and Shortest Path Bias Let 1198841198951 sim119884119895119898 represent totally 119898 incident paths of node (119895) and 120574119895the output duration of node (119895) According to the PERTmodel 120574119895 is secured as 120574PERT119895 and calculated by picking thelargest mean value of paths 119884
119895
1 sim 119884119895119898 where 119864[120574PERT119895 ] =
max (119864[1198841198951 ] 119864[119884119895
2 ] 119864[119884119895119898]) But in mathematical realiza-
tion the real mean value of 120574119895 should be calculated as119864[120574Real119895 ] = 119864[max (1198841198951 119884
119895
2 119884119895119898)] where the max operation
is executed among all incident paths 1198841198951 sim 119884119895119898 119864[120574Real119895 ] is
usually greater than 119864[120574PERT119895 ] and their deviation is namedas the longest path bias (LPB)
24 The Bias of Path Dependency among Subpaths The pathsin a stochastic network are not necessarily independent sincethey usually share activities with each other This may alsocause significant bias in approximation of network comple-tion time However most studies did not consider such factorin their approaches In Figure 2(a) the paths ⟨1 2 3 4 5 7⟩and ⟨1 2 3 4 6 7⟩ are assumed to be independent with eachother then we have 1205744 = 11988312 oplus 11988323 oplus 11988334 1205745 = 1205744 oplus 119883451205746 = 1205744 oplus 11988346 119884
71 = 1205745 oplus 11988357 119884
72 = 1205746 oplus 11988367 and
1205747 = max11988471 11988472 With the above numerical calculations the
expected duration of 1205747 is solved as 119864[1205747] = 1769 which isdifferent from the result 119864[1205747] = 1589 simulated out of MCSwithin 20000 samples (the result of MCS could be taken asthe nearly real solution)The above deviation is caused by the
1
1 3 5 2
2
3
3
2 3 4
5
6
7
(a)
X12 X23 X34 X45
X57
X67
X19984002998400 X
29984003998400 X
39984004998400 X
49984006
1998400
2998400
3998400
4998400
1 2 3 4 5
6
7
(b)
Figure 2 A simple network example
1
5
3
46
7
44
6
6
3
2
1
1
4
Figure 3 A simple network example
shared subpath ⟨1 2 3 4⟩ between the paths ⟨1 2 3 4 5 7⟩and ⟨1 2 3 4 6 7⟩ We named it as the shared activity bias(SAB) in this study
For further comprehension of the causes of SAB fromFigure 2(b) ⟨1 2 3 4⟩ and ⟨11015840 21015840 31015840 41015840⟩ are shared pathswhere 11988312 = 1198831101584021015840 11988323 = 1198832101584031015840 and 11988334 = 1198833101584041015840 From theview of DA subpaths ⟨1 2 3 4⟩ and ⟨11015840 21015840 31015840 41015840⟩ are treatedas two individual subpaths in the networkThemax operationexecuted on node (7) will cause extra LPB from subpath⟨11015840 21015840 31015840 41015840⟩ since the duration variance of the shared path⟨1-2-3-4⟩ is double-counted by subpath ⟨11015840 21015840 31015840 41015840⟩ in themax operation It brings more to the overlapping domainof variable distribution between subpaths ⟨1 2 3 4⟩ and⟨11015840 21015840 31015840 41015840⟩
25 A New Criterion for CP Judgment The PERT model andthe method of CPI do not properly determine the CP instochastic network Taking Figure 3 as an example there arethree completion paths represented as ⟨1 2 5 7⟩ ⟨1 3 6 7⟩and ⟨1 4 6 7⟩ The durations of activities are assumed asexponential distribution where their expected values areshown in the graph of Figure 3
By using the PERT model ⟨1 2 5 7⟩ is taken as the CPsince its expected path duration is 12 which is greater thanthose of the other paths Accordingly the expected comple-tion time of network is calculated as 12 too On the otherhand the authors use MCS within 20000 samples to simulatethe CPI of all paths that indicate the possibilities of how thepath can become the critical path of the network The results
4 Mathematical Problems in Engineering
are as follows ⟨1 2 5 7⟩CPI = 0426 ⟨1 3 6 7⟩CPI = 0286and ⟨1 4 6 7⟩CPI = 0288 From the results of MCS thepath ⟨1 2 5 7⟩ is still to be taken as the CP due to its highestCPI value But the completion time of MCS is simulated as119864[1205747] = 1662 which is different from the result of PERT Forfurther comprehension of above deviation the authors checkthe expected output of node (6) simulated as 119864[1205746] = 986and 119864[11988471 ] = 119864[1205746] + 119864[11988367] = 1286 which is greater thanthe expected output value of path ⟨1 2 5 7⟩ Obviously theabove result has shown that the network completion timeis not dominated by path ⟨1 2 5 7⟩ but by a two-pair path⟨1 3 6 7⟩ and ⟨1 4 6 7⟩ which is named as incidence pathclusters (IPC) in this study even though the path ⟨1 2 5 7⟩has the highest CPI value
From above experiment results it seems that we shouldneed a new criterion to judge CP in stochastic networkThe CP does not only have to do with the variables sortingLPB (or SPB) and SAB in stochastic network but also needto develop an implementation algorithm so as to efficientlyexecute all the max and convolution operations of nodes inthe network
3 The Proposed Algorithm for Critical Path ina Stochastic Network
A new proposed algorithm named as the modified M-LCTAis developed for CP in stochastic network The label-correcting tracing algorithm (LCTA) is originally developedfor approximating the completion time of stochastic network[19] In this study it is added with a RSDO for executing thepaths sorting so as to solve the CP
LCTA can efficiently get rid of the LPB SPB and SAB thatare mentioned in the last section during the approximationsomething that no other approaches can deal with properlyThere are more detailed explanations and many practicalexperiments for comparing various methods with LCTA in[19] Due to space limitations the comparisons are abridgedin this paper
31 The Expanded-Tree Structure and Node Data StructureThe M-LCTA has to first transfer the physical network intoa tree structure named as expanded-tree structure (ETS)according to the connected relation between the nodes inthe network Each node in the network has a unique indexnumber 119894 where node (1) represents the start node and node(119899) represents the terminal node (there are a total 119899 numberof nodes in the network) Figure 4 is an example of the ETS
M-LCTA has to visit each node in sequence and commitcalculations the generated results during the processes haveto be saved in a specified data structure in the nodes of ETSFor the objective of this research the structure of node (119894)includes the contents as follows
119894 index number of node (119894)
119861119894 set of precedent nodes of node (119894)
output119894 the realization time of output of node (119894)
2
3
1 4
4
1 2 3
1 1 2
1
Figure 4 The tree structure transformation
finish flag119894 visited flag of node (119894) where it is initiallyset as 0 when node (119894) has been visited it will be setas 1
node (119894)flag visited-flag set of incident paths of node(119894) where all are initially set as 0 when the 119896th incidentpath of node (119894) has finished its time realization thecorresponding 119896th position of node (119894)flag will be setas 1
node (119894)Inpath for each incidence path of node (119894)it includes a sequence of nodes from node (1) to node(119894) the realization time of incidence paths will besaved in node (119894)Inpath
32 The Two Tracing Procedures in M-LCTA When apply-ing the M-LCTA the authors employ two tracing proce-dures namely Upward Tracing (last node current node)and Downward Tracing (current node) where the cur-rent node is the node currently visited in the tracking processand the last node is the precedent node visited in thecurrent process These two procedures are listed as shown inAlgorithm 1
Initially the M-LCTA executes Downward Tracing(119899)and starts tracing from the terminal node (119899) Then it goesdownward until it reaches node (1) It then traces upwardand starts node-visiting and calculationsThe labels of visitednode are put into stack where data access follows the rule ofFirst InFirst Out (FIFO) Labels recording and reading aredenoted as push stack() and pull stack() in the proceduresrespectively The stack is used for recording the path-track ofvisited nodes by which the tracing procedures can judge andfind their ways to the nodes they have not visited yet
M-LCTA can sequentially visit each node in the networkAccording to the post-order tracing algorithm (POTA) ruleldquobefore visiting the node (119894) it has to confirm that all the childnodes of node (119894) have been visited The visits of child nodesshould be in sequence following the left-to-right directionrdquo
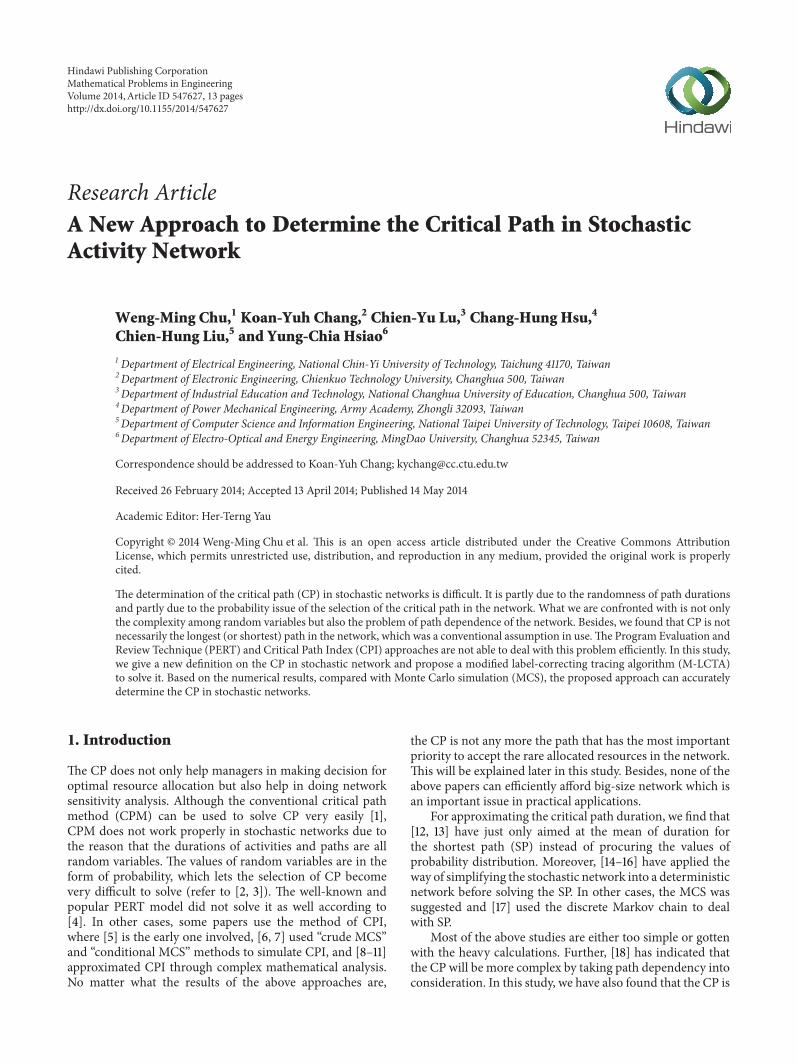
Using Figure 1 as an example we first change the networkinto a tree-structure and the sequence for visiting the nodes isshown in Figure 5The tracing procedures start from terminalnode (4) and through recursive executions of downwardand upward procedures the visiting sequence of M-LCTAis shown in blue arrow line Finally it stops and backs toterminal node (4)
Mathematical Problems in Engineering 5
Downward Tracing (current node)i = current nodewhile (120574119873 has not been calculated) do
if (119891119894119899119894119904ℎ 119891119897119886119892119894 = 1)119878ℎ119886119903119890119889 119891119897119886119892 = 1119896 = 119888119906119903119903119890119899119905 119899119900119889119890119894 = 119901119906119897119897 119904119905119886119888119896()perform Upward Tracing(ki )
Elseif (119894 = 1)
1205741 = 0119891119894119899119894119904ℎ 119891119897119886119892119894 = 1119896 = 119894119894 = 119901119906119897119897 119904119905119886119888119896()perform Upward Tracing(k i )
Elsepush stack(i)119894 = 119896
EndEnd
EndUpward Tracing (last node current node )119896 = 119897119886119904119905 119899119900119889119890119894 = 119888119906119903119903119890119899119905 119899119900119889119890while (120574119873 not been calculated) do
if (Has node(k) been visited)
119884119894119896 = [120583(120574119896)
1] oplus 119883119896119894 an constant mean 120583(120574119896)
119878ℎ119886119903119890119889 119891119897119886119892 = 0Else
119884119894119896 = 120574119896 oplus 119883119896119894119878ℎ119886119903119890119889 119891119897119886119892 = 0
Endif (119891119894119899119894119904ℎ 119891119897119886119892119894 = 1)
119882119894 = 119877119878119863119874(119894) = 119884119894119896 | forall119896 isin 119861119894120574119894 = min(119884119894119896) or 120574119894 = max(119884119894119896)119878ℎ119886119903119890119889 119891119897119886119892 = 0119896 = 119894119894 = 119901119906119897119897 119904119905119886119888119896()
Else119901119906119904ℎ 119904119905119886119888119896(119894)performDownward Tracing(i )
EndEnd
Algorithm 1
33 The Function of Eliminating Shared Activity BiasShared flag is a Boolean variable in both tracing proce-dures for identifying shared activities between paths in thenetwork During the implementation of the M-LCTA theUpward Tracing procedure first checks the value of theShared flag for the current node If the current node has beenpreviously visited and its realization time has been obtainedthe Shared flag will be set as 1 by the Downward Tracingprocedure Using the values of the Shared flag procedurescan find all of the activities shared by the subpaths in thenetwork Once the shared activities have been found theSAB can be eliminated by applying a heuristic to ldquocorrectrdquo
4
12
3
1 1 2
1
Figure 5 The tracing sequence
the computations in the max operation the PDF of theredundant shared activities is replaced with the value of theirmean (which is a fixed constant) in the Upward Tracingprocedure For more details of the SAB one could refer tothe experiments in [19]
34 The Function of Finding the Critical Path The operationof RSDO in the algorithms is responsible for sorting thesequence order of paths It is executed inM-LCTA during thenode visiting The processes are described below
In the Upward Tracing procedure if all the child nodesof the current node node (119894) have been visited node (119894) willexecute the RSDO and max (or min operation) operationsamong its incidence paths as follows
(a) 119882119894 = RSDO(119894) = 119884119894119896 | forall119896 isin 119861119894 of node (119894)is to rearrange the child-node position of node (119894)according to the results of RSDO(119894)The highest valueRSDO(119894) of child node will be put on the extremeright side of child-node position
(b) 120574119894 = min (119884119894119896) or 120574119894 = max (119884119894119896) for all 119896 isin 119861119894 isexecuted for the shortest path or the longest pathrespectively These calculations can release SPB orLPB in the approximationThe result 120574119894 is saved in theoutput119894 of node (119894)
(c) Otherwise the tracing procedures will execute 119884119894119896 =120574119896 oplus 119883119896119894 to accumulate the 119896th incidence path ofnode (119894) and save 119884119894119896 in the node (119894)Inpath119896 of node(119894) Then it goes back in the Downward Tracingprocedure
The executions of max (or min) operation and con-volution in M-LCTA apply techniques of discretizationM-LCTA first needs to replace the continuous PDF of 119883119894119895with its discretized version using the approach of Chebychevsampling points [21] The discretized PDF is represented byan ordered vector as
(V1198941198951 V1198941198952 sdot sdot sdot V119894119895119898119901119894119895
1 119901119894119895
2 sdot sdot sdot 119901119894119895119898) (4)
where V119894119895119896and 119901119894119895
119896are the values of the 119896th sample point of119883119894119895
and its corresponding probability respectively and m is the
6 Mathematical Problems in Engineering
total number of sample points Equations (1) executed in thealgorithm are all calculated in the form of discretization (seedetails in [19])
Through the iterative executions of theDownward Tracing and Upward Tracing proceduresthe M-LCTA will finally visit all the nodes and stop at theterminal node node (119899) Meanwhile all incidence pathsof nodes have rearranged their position sequence of childnode according to the sorting operation of RSDO in theprocedures so that the CP can be found
35 The Revised Stochastic Dominance Operator (RSDO)RSDO is different from Dodinrsquos SDO in solving the tran-sitivity problem [15] The RSDO determines the sortingorder of random variables through matrix operations Firstit has to construct an 119899 times 119899 pairwise comparison matrix(PCM) represented as 119875 for 119899 stochastic variables 119885 (119885 =(1199111 1199112 119911119899)) and shown in
119875 =[[[[
[
1 11988612 sdot sdot sdot 119886111989911988621 1 sdot sdot sdot 1198862119899
1198861198991 1198861198992 sdot sdot sdot 1
]]]]
]
=
[[[[[[[[[
[
11990811199081
11990811199082
sdot sdot sdot1199081119908119899
11990821199081
11990821199082
sdot sdot sdot1199082119908119899
119908119899
1199081
119908119899
1199082sdot sdot sdot
119908119899
119908119899
]]]]]]]]]
]
(5)
where 119886119894119895 = 119911119894119911119895 = 119908119894119908119895 and 119882 = (1199081 1199082 119908119899) is theideal-sorting ratio within 119885 variables The sorting order of 119885variables could be judged by the values of 119882 If all variablesfulfill the characteristics of transitivity each pair of variablesshould follow the equation below
119886119894119895 sdot 119886119895119896 = (119908119894
119908119895) sdot (
119908119895
119908119896)
= (119908119894
119908119896)
= 119886119894119896 119894 119895 119896 isin [1 119899]
(6)
In the case of (5) thematrix119875 is called the consistencymatrixand the119882 can be directly calculated as follows
∵119899
sum119895=1
1198861198941198951199081198951
119908119895= 119899 119886119894119895 sdot
119908119895
119908119894= 1
119899
sum119895=1
119886119894119895119908119895 = 119899119908119895 119894 = 1 119899
119875119882 = 119899119882 119882 = (1199081 119908119899)119879
(7)
The 119899 and (1199081 1199082 119908119899) could be solved as the eigenvalueand eigenvector of 119875 respectively In other cases if any oneof the elements in 119875 does not fulfill the condition of (5) 119882cannot be taken as the solutionThe eigenvalue of 119875would bechanged to 1198991015840 and the eigenvector 1198821015840 = (11990810158401 119908
10158402 119908
1015840119899) is
used as the approximation of119882
By referring to (3) and (5) the element 119886119894119895 of the PCMcould be calculated between variables 119911119894 and 119911119895 119894 119895 isin [1 119899]where
119886119894119895 = Pr (119911119894 ≻ 119911119895)
119886119895119894 = Pr (119911119895 ≻ 119911119894) = 1 minus Pr (119911119894 ≻ 119911119895)
(8)
Therefore PCM can be represented as 1198751015840
1198751015840=[[[[
[
1 11988612 sdot sdot sdot 1198861119899(1 minus 11988612) 1 sdot sdot sdot 1198862119899
(1 minus 1198861119899) (1 minus 1198862119899) sdot sdot sdot 1
]]]]
]
=
[[[[[[[[[
[
11990811199081
11990811199082
sdot sdot sdot1199081119908119899
11990821199081
11990821199082
sdot sdot sdot1199082119908119899
119908119899
1199081
119908119899
1199082sdot sdot sdot
119908119899
119908119899
]]]]]]]]]
]
0 lt 119886119894119895 lt 1
(9)
From (9) the lower triangle of 1198751015840 does not fulfill the patternof (6) It leads119882 not to be represented as the sorting ratio of119885 Therefore 1198751015840 needs to be regulated before calculating itseigenvalue and eigenvector The elements of 1198751015840 are regulatedas below
1199081015840119894
1199081015840119895 where 119908
1015840119894 = 119886119894119895 119908
1015840119895 = 119886119895119894 = (1 minus 119886119894119895) (10)
The regulation will not ruin the sorting ratio of 119885 since itjust changes the complementary relations (refer to (8)) intothe proportional relations of variables After the regulation1198751015840 is changed to 11987510158401015840 and is represented as follows
11987510158401015840=
[[[[[[[[[[[[
[
11199081015840111990810158402
sdot sdot sdot119908101584011199081015840119899
1199081015840211990810158401
1 sdot sdot sdot119908101584021199081015840119899
1199081015840119899
11990810158401
1199081015840119899
11990810158402sdot sdot sdot 1
]]]]]]]]]]]]
]
(11)
The eigenvalue of 11987510158401015840 is calculated as the sorting sequenceratio of incidence paths
By taking Figure 6 as an example node (119894) executes RSDOon four incidence paths 1198841198941 119884
1198942 1198841198943 1198841198944
According to (8) we calculate stochastic dominate prob-ability value (SDPV) for each incidence path 1198841198941 119884
1198942 1198841198943 1198841198944
where we have
Mathematical Problems in Engineering 7
Table 1 The comparison of running time between the proposed method (M-LCTA) and MCS
Index 1 2 3 4 5 6 7 8 9 10 11 12 13 14 15 (100 nodes)M-LCTA 0003 0006 001 0012 0015 0018 0019 0021 0031 0028 0034 0079 0099 0132 031MCS 08 15 23 33 44 45 52 64 67 92 107 177 446 1998 18406
12 3
4 12 3
4
i iYi
1
Yi
2 Yi
3
Yi
4Yi
1
Yi
2Yi
3
Yi
4
Figure 6 Four incident paths of node (119894)
Table 2
1
1
3
2
3
2
The shortest path ⟨1-3⟩The longest path ⟨1-2-3⟩
Index 1 2 3Mean 50 100 143
Table 3
1
1
2
2
3
44
5
3
The shortest path ⟨1-2-4⟩The longest path ⟨1-2-3-4⟩
Index 1 2 3 4 5Mean 500 333 250 417 400
11988612 = Pr (1198841198941 ≻ 1198841198942) = 02 11988621 = 1 minus 11988612 = 08
11988613 = Pr (1198841198941 ≻ 1198841198943) = 015 11988631 = 1 minus 11988613 = 085
11988614 = Pr (1198841198941 ≻ 1198841198944) = 0123 11988641 = 1 minus 11988614 = 0877
11988623 = Pr (1198841198942 ≻ 1198841198943) = 0248 11988632 = 1 minus 11988623 = 0752
11988624 = Pr (1198841198942 ≻ 1198841198944) = 02 11988642 = 1 minus 11988624 = 08
11988634 = Pr (1198841198943 ≻ 1198841198944) = 0333 11988643 = 1 minus 11988634 = 0667
(12)
By referring to (10) we have 11987510158401015840 as
11987510158401015840=[[[
[
1 025 017 0144 1 033 0256 3 1 057 4 2 1
]]]
]
(13)
1
3
7
6
8
9
42
2 2
3
3
2
54
3
2
2
5
Figure 7 The 9 nodes of demonstrative example
The eigenvalue of11987510158401015840 is calculated as 11989910158401015840 = 4102which is closeto 119899 = 4 the eigenvector is calculated as the 1198821015840 = (06170224 0097 0062) which is the sorting ratio of incidencepaths According to the 1198821015840 and sorting rule of M-LCTAthe 1198841198941 should be put on the extreme right side of child-nodeposition where we have a sequence order of (1198841198944 119884
1198943 1198841198942 1198841198941)
To represent the M-LCTA procedure scheme conve-niently we define the above operation as 1198821015840 = RSDO(119894) toshow the execution of RSDO on the node (119894) and produce thesorting result1198821015840 from its incidence paths
4 Demonstrative Examples
By taking the network of Figure 7 as the demonstrativeexample there are a total of 9 nodes and all the activitydurations are assumed to be exponential distributions wheretheir duration means are shown in the figure
There are three completion paths included ⟨1-2-3-9⟩⟨1-4-5-6-8-9⟩ and ⟨1-4-5-7-8-9⟩ where the path ⟨1-2-3-9⟩ istaken as the shortest path from the viewpoint of the PERTmodel In another method MCS within 20000 samples isused to simulate the same network (MCS result could betaken as the nearly real solution) and the result is differentfrom that of PERT This shows obviously that PERT cannotsolve CP correctly in stochastic network
Let us apply our method to the same example It has totransfer the network into a tree structure first as shown inFigure 8 M-LCTA starts the Downward Tracing (9) at node(9) Downward Tracing and Upward Tracing procedures areexecuted iteratively with each other Finally it calculates theexpected completion time as 1205749 = 712 from node (9) whichis very close to the simulated result of the MCS
During the executions1198828 = RSDO(8) = 1198848119896 | forall 119896 isin 1198618
and min (11988481 11988482 ) are performed at node (8) We find that the
two incidence paths have to swap their child-node positionbecause of the sorting result of the RSDO The modified M-LCTAfinally stops at node (9) and executes1198829 = RSDO(9) =1198849119896 | forall 119896 isin 1198619 and min (11988491 119884
92 ) The result of the RSDO (9)
8 Mathematical Problems in Engineering
9
3
2
8
1
7 6
5
4
1
5
4
1
9
3
2
8
1
6 7
5
4
1
5
4
1
Figure 8 The tree structure of Figure 3
Table 4
1
2
1
3
24
4
53
5
6
7
The shortest path ⟨1-3-5⟩The longest path ⟨1-2-3-4-5⟩
Index 1 2 3 4 5 6 7Mean 125 167 111 200 143 333 250
Table 5
1
4
6
18
39
2
53
2
7
4
6
5
The shortest path ⟨1-2-4-6⟩The longest path ⟨1-6⟩
Index 1 2 3 4 5 6 7Mean 250 1000 143 286 200 167 222Index 8 9Mean 167 256
shows that the incidence paths need not to change theirchild-node position at node (9) After the repositioning of allincident paths in the network Figure 8 gives the final resultThe path ⟨1-4-5-7-8-9⟩ is selected as the critical path whichlays on the extreme right side of the tree
Finding the longest path is the same as above except thatthe min operator is replaced by the max operator at node (8)and node (9)
Table 6
1 3 6
1 9
3 11
2
5
4
2
8
6
5
4
107
The shortest path ⟨1-4-6⟩The longest path ⟨1-2-3-4-5-6⟩
Index 1 2 3 4 5 6 7Mean 100 111 25 50 33 125 25Index 8 9 10 11Mean 50 100 33 33
Table 7
1 2 7
2
39
3
6
4
1
8
7
5
4
10
6
5
11
The shortest path ⟨1-2-5-7⟩The longest path ⟨1-2-3-6-7⟩
Index 1 2 3 4 5 6 7Mean 100 83 200 125 50 250 333Index 8 9 10 11Mean 250 417 67 63
From the above experiments it is noticed that thecompletion time of network is actually dominated by one ofIPC of terminal node instead of the result of PERT model orthe highest CPI The domination on the network completiontime should be the key characteristic for CP so as to let CP bethe right target for project managers to allocate the resources
5 Numerical Experiments
This section will verify the efficiency and accuracy of ourproposed approach on various sizes of stochastic networksespecially the larger ones The first part of network instancesis generated from [22] where there are a total of 14 instancenetworks and the activity number ranges from 3 to 76 Allactivities durations are also assumed to have exponential dis-tribution Their parameters information and experimentalresults are shown in the appendix
Mathematical Problems in Engineering 9
1
2 4
5
7
8
9
3
610
11 17
18 26
27
25 35
3416
15
14
13
12
22
23 33
32
31
30
21
20
19 29
36
37
38
45
44
43
42
41
40
39
46
47
48
49
50
2457
56
55
54
53
52
51
58
59
60
61
62
69
68
67
66
65
64
63
70
71
72
81
82
80
77
78
76
75
74
7988
89
87
86
85
84
8390
91
92
93
94
95
96
97
98
99
100
28
73
Figure 9 The 100-node network instance of [19]
Table 8
1
2
8
3
2 12
4
6
5
1
10
9
8
5
7
6
3
11
7
4
The shortest path ⟨1-2-7-8⟩The longest path ⟨1-2-4-6-8⟩
Index 1 2 3 4 5 6 7Mean 100 111 125 100 111 125 100Index 8 9 10 11Mean 125 100 111 100
The second part is a network of 100 nodes and 135activities generated by [19] It was designed by followingthe rules of [23] where the network complexity factor wasset to 20 For each node the incidence path number wasrandomly determined from a range of [1 2] and the PDF wasdetermined randomly from normal exponential or uniformdistributionThe correspondent parameters of PDFwere alsorandomly selected within the range of [2 16] Figure 9 showsits detailed structure and experiment results as follows
Table 9
13
7
1
3
2
6
4
28
6
9
5
10
7
5
12
11
13
14
The shortest path ⟨1-2-7⟩The longest path ⟨1-3-4-5-7⟩
Index 1 2 3 4 5 6 7Mean 50 40 63 50 100 63 20Index 8 9 10 11 12 13 14Mean 40 50 125 111 100 80 100
The shortest path⟨1-3-5-10-15-23-33-55-68-78-86-92-97-99-100⟩
The longest path⟨1-2-4-8-13-20-30-42-54-63-76-84-90-96-98-100⟩
Since the simulated results of MCS are close to the realsolution (please refer to [7 20]) the authors employ theMCS within 20000 samples as the benchmark and simulate
10 Mathematical Problems in Engineering
Table 10
1
3
91
3
2 5
4
2
4
6
5
8
76 11
12
13
7
89
10
14
10
The shortest path ⟨1-4-7-10⟩The longest path ⟨1-2-5-9-10⟩
Index 1 2 3 4 5 6 7Mean 500 333 250 400 286 222 200Index 8 9 10 11 12 13 14Mean 167 333 500 667 500 400 333
Table 11
1
3
8
1
2
2 6
5
7
8
3
5
144
4
13
15
17
7
9
10
11
12
16
6
10
9
The shortest path ⟨1-2-4-7-10⟩The longest path ⟨1-2-4-5-7-8-10⟩
Index 1 2 3 4 5 6 7Mean 60 100 50 100 40 50 100Index 8 9 10 11 12 13 14Mean 30 30 40 20 60 70 20Index 15 16 17Mean 80 60 91
all the network instances twice one for the longest path andthe other for the shortest path The MCS simulations focuson checking the accuracy of RSDO results and the outputduration of each node in the networks After completingall experiments we have excellent performances that theexperiment networks are all matching the results of MCSBeyond that the efficiency of proposed method is alsoextraordinarily superior to that ofMCS (see Table 1) Accord-ing to the network of 100 nodesMCS requires 18406 secondsto complete the simulation while our method takes only031 seconds
Table 12
1
4
9
1
2
2 5
8
3
5
4
14
7
3
1511
6
10
11
12
9
168
106
7
17
1813
14
1213
The shortest path ⟨1-4-7-13-14⟩The longest path ⟨1-3-5-9-11-12-14⟩
Index 1 2 3 4 5 6 7Mean 167 250 100 143 125 250 125Index 8 9 10 11 12 13 14Mean 50 143 200 125 143 111 111Index 15 16 17 18Mean 200 111 250 167
Table 13
1
8
14
2
1
34
74
5
7
143
2
13
15
813
6
9
11
912
6 10
16
10
11
155 17
12
16
17
18
19
20
21
22
23
24
The shortest path ⟨1-2-5-13-17⟩The longest path ⟨1-2-5-7-11-16-17⟩
Index 1 2 3 4 5 6 7Mean 400 500 450 549 300 350 400Index 8 9 10 11 12 13 14Mean 250 300 400 500 260 280 200Index 15 16 17 18 19 20 21Mean 250 300 200 180 360 450 150Index 22 23 24Mean 599 250 461
6 Conclusions
Since activity duration and path duration are both randomvariables the methods employed for deterministic networkscannot be used in this study In addition the popular PERTmodel and CPI method do not work either since they ignorethe effects of the LPB SPB and SAB which have to beconsidered in the stochastic networksThat is why wemodifythe LCTA of [19] by adding the revised stochastic dominance
Mathematical Problems in Engineering 11
Table 14
1
4
8
1
2
6
7
7
2
5
3
15
4
3
13
17
69
10
11
11
8
22
9
32
10
12
13
15
5
16
14
17
16
25
18
19
20
23
21
18
19
20
12
14
26
24
27
29
30
2836
3331
35
38
3734
The shortest path ⟨1-2-3-16-20⟩The longest path ⟨1-2-3-5-8-12-15-18-20⟩
Index 1 2 3 4 5 6 7 8 9 10 11 12 13 14 15Mean 160 300 160 200 100 180 150 110 120 400 200 160 100 80 14Index 16 17 18 19 20 21 22 23 24 25 26 27 28 29 30Mean 210 160 200 190 170 150 180 210 160 200 180 160 120 180 150Index 16 31 32 33 34 35 36 37 38Mean 300 240 110 110 220 240 300 150 80
operation (RSDO) in this research and employ it to solve CPin stochastic networks In the experiments of this study wehave various sizes of instance networks from [19 22] wherethe activity numbers ranged from 3 to 135 According to theexperimental results they all comply with the simulationresults of the MCS within 20000 samples Beyond that theefficiency of the proposedmethod is extraordinarily great Asshown inTable 1 it is almost 780 times faster than that ofMCSin average Therefore according to the overall performancewe confirmed that the proposed algorithm in this study is anexcellent tool for solving CP in stochastic networks
In addition this study has also proved and pointed outthat the CP generated from traditionalmethods (ie PERT orCPI methods) is not necessarily the key path in the networkThe CP should follow the spirit of Definitions 1 and 2 whichis ldquothe critical path of stochastic network should be highestinfluence of dominating the network completion timerdquo Withthe above assertion it could help the project managers tokeep off allocating the precious resources into null and voidactivities in the network and that would also be the maincontribution in this study
Appendix
Network 1 see Table 2
Network 2 see Table 3
Network 3 see Table 4
Network 4 see Table 5
Network 5 see Table 6
Network 6 see Table 7
Network 7 see Table 8
Network 8 see Table 9
Network 9 see Table 10
Network 10 see Table 11
Network 11 see Table 12
Network 12 see Table 13
Network 13 see Table 14
Network 14 see Table 15
Conflict of Interests
The authors declare that there is no conflict of interestsregarding the publication of this paper
12 Mathematical Problems in Engineering
Table 15
1
2
5
11
10
16 22
28
2317
12
6
7
3 8
94
15
21
27
32
26
20
25
31
35
30
3436
29
24
33
18
13
19
141
2
3 10
11
9
8
7
6
20
191817
54 16 21
14
13
12 15
24 23
36
37
38
52
51
48
64
65
63
6173
50
68
7169
58
5949
564657
67
6655
54
74
75
7670
72
60
62
44
45
30
34
32
47
29
35
31 42
4133
3953
4043
25
26
27
28
22
The shortest path ⟨1-3-5-12-20-27-30-35-36⟩The longest path ⟨1-4-6-13-16-22-28-34-36⟩
Index 1 2 3 4 5 6 7 8 9 10 11 12 13 14 15Mean 167 125 143 20 50 100 111 17 33 143 125 29 38 23 118Index 16 17 18 19 20 21 22 23 24 25 26 27 28 29 30Mean 400 18 133 105 67 40 67 29 25 27 21 118 125 67 40Index 31 32 33 34 35 36 37 38 39 40 41 42 43 44 45Mean 40 29 25 143 17 67 40 67 154 133 67 45 29 19 143Index 46 47 48 49 50 51 52 53 54 55 56 57 58 59 60Mean 29 83 143 77 40 29 22 48 119 50 22 18 111 83 56
Acknowledgment
This research was supported in part by the National ScienceCouncil of Taiwan under the Grant no NSC 102-2221-E-270-005
References
[1] S E Elmaghraby Activity Networks Project Planning andControl by Network Models John Wiley amp Sons New York NYUSA 1977
[2] V G Adlakha and V G Kulkarni ldquoA classified bibliography ofresearch on stochastic PERT networks 1966ndash1987rdquo InformationSystems and Operational Research vol 27 no 3 pp 272ndash2961989
[3] J NHagstrom ldquoComputational complexity of PERTproblemsrdquoNetworks vol 18 no 2 pp 139ndash147 1988
[4] C A Gallagher ldquoNote on PERT assumptionrdquo ManagementScience vol 33 pp 1360ndash1362 1987
[5] J J Martin ldquoDistribution of the time through a directed acyclicnetworkrdquo Operations Research vol 13 pp 46ndash66 1965
[6] RM van Slyke ldquoMonteCarlomethods and the PERTproblemrdquoOperations Research vol 11 pp 839ndash861 1963
[7] C E Sigal A A B Pritsker and J J Solberg ldquoThe use of cutsetsin Monte Carlo analysis of stochastic networksrdquo Mathematicsand Computers in Simulation vol 21 no 4 pp 376ndash384 1979
[8] B Dodin ldquoDetermining the 119870 most critical paths in PERTnetworksrdquoOperations Research vol 32 no 4 pp 859ndash877 1984
[9] B M Dodin and S E Elmaghraby ldquoApproximating the criti-cality indices of the activities in PERT networksrdquoManagementScience vol 31 no 2 pp 207ndash223 1985
Mathematical Problems in Engineering 13
[10] S E Elmaghraby ldquoOn criticality and sensitivity in activitynetworksrdquo European Journal of Operational Research vol 127no 2 pp 220ndash238 2000
[11] SM T Fatemi Ghomi and E Teimouri ldquoPath critical index andactivity critical index in PERT networksrdquo European Journal ofOperational Research vol 141 no 1 pp 147ndash152 2002
[12] J Kamburowski ldquoAn upper bound on the expected completiontime of PERT networksrdquo European Journal of OperationalResearch vol 21 no 2 pp 206ndash212 1985
[13] J Kamburowski ldquoNormally distributed activity durations inpert networksrdquo Journal of the Operational Research Society vol36 no 11 pp 1051ndash1057 1985
[14] R P Loui ldquoOptimal paths in graphs with stochastic or mul-tidimensional weightsrdquo Communications of the Association forComputing Machinery vol 26 no 9 pp 670ndash676 1983
[15] P B Mirchandani and H Soroush ldquoOptimal paths in proba-bilistic networks a case with temporary preferencesrdquo Comput-ers amp Operations Research vol 12 no 4 pp 365ndash381 1985
[16] I Murthy and S Sarkar ldquoA relaxation-based pruning techniquefor a class of stochastic shortest path problemsrdquo TransportationScience vol 30 no 3 pp 220ndash236 1996
[17] G A Corea and V G Kulkarni ldquoShortest paths in stochasticnetworks with arc lengths having discrete distributionsrdquo Net-works vol 23 no 3 pp 175ndash183 1993
[18] G H Polychronopoulos and J N Tsitsiklis ldquoStochastic shortestpath problems with recourserdquo Networks vol 27 no 2 pp 133ndash143 1996
[19] M-J Yao and W-M Chu ldquoA new approximation algorithmfor obtaining the probability distribution function for projectcompletion timerdquo Computers ampMathematics with Applicationsvol 54 no 2 pp 282ndash295 2007
[20] BDodin ldquoApproximating the distribution functions in stochas-tic networksrdquoComputers and Operations Research vol 12 no 3pp 251ndash264 1985
[21] M K Agrawal and S E Elmaghraby ldquoOn computing the distri-bution function of the sum of independent random variablesrdquoComputers and Operations Research vol 28 pp 473ndash483 2001
[22] A P Tereso M M T Araujo and S E Elmaghraby ldquoAdaptiveresource allocation in multimodal activity networksrdquo Interna-tional Journal of Production Economics vol 92 no 1 pp 1ndash102004
[23] R Kolisch and A Sprecher ldquoPSPLIBmdasha project schedulingproblem libraryrdquo European Journal of Operational Research vol96 no 1 pp 205ndash216 1996
Submit your manuscripts athttpwwwhindawicom
Hindawi Publishing Corporationhttpwwwhindawicom Volume 2014
MathematicsJournal of
Hindawi Publishing Corporationhttpwwwhindawicom Volume 2014
Mathematical Problems in Engineering
Hindawi Publishing Corporationhttpwwwhindawicom
Differential EquationsInternational Journal of
Volume 2014
Applied MathematicsJournal of
Hindawi Publishing Corporationhttpwwwhindawicom Volume 2014
Probability and StatisticsHindawi Publishing Corporationhttpwwwhindawicom Volume 2014
Journal of
Hindawi Publishing Corporationhttpwwwhindawicom Volume 2014
Mathematical PhysicsAdvances in
Complex AnalysisJournal of
Hindawi Publishing Corporationhttpwwwhindawicom Volume 2014
OptimizationJournal of
Hindawi Publishing Corporationhttpwwwhindawicom Volume 2014
CombinatoricsHindawi Publishing Corporationhttpwwwhindawicom Volume 2014
International Journal of
Hindawi Publishing Corporationhttpwwwhindawicom Volume 2014
Operations ResearchAdvances in
Journal of
Hindawi Publishing Corporationhttpwwwhindawicom Volume 2014
Function Spaces
Abstract and Applied AnalysisHindawi Publishing Corporationhttpwwwhindawicom Volume 2014
International Journal of Mathematics and Mathematical Sciences
Hindawi Publishing Corporationhttpwwwhindawicom Volume 2014
The Scientific World JournalHindawi Publishing Corporation httpwwwhindawicom Volume 2014
Hindawi Publishing Corporationhttpwwwhindawicom Volume 2014
Algebra
Discrete Dynamics in Nature and Society
Hindawi Publishing Corporationhttpwwwhindawicom Volume 2014
Hindawi Publishing Corporationhttpwwwhindawicom Volume 2014
Decision SciencesAdvances in
Discrete MathematicsJournal of
Hindawi Publishing Corporationhttpwwwhindawicom
Volume 2014 Hindawi Publishing Corporationhttpwwwhindawicom Volume 2014
Stochastic AnalysisInternational Journal of

2 Mathematical Problems in Engineering
not necessarily the longest (or shortest) path in the stochasticnetwork as what the project managers suppose in ordinaryIn this study the CP is redefined as follows
Definition 1 The CP should have dominated the completiontime of the network
Definition 2 Theduration perturbation of activities includedin CP would be more sensitive to the change of completiontime than that of other activities
A new approach of the modified M-LCTA with therevised stochastic dominance operation (RSDO) is developedin this study where the detailed descriptions will be givenin the following sections The rest of this paper is organizedas follows Section 2 discusses how difficult it is to solve theCP in stochastic networks Section 3 provides detailed expla-nations for M-LCTA and RSDO Section 4 demonstratesthe proposed algorithm via two examples Section 5 givesfurther numerical experiments of various large sized networkinstances to illustrate the feasibility of the proposed approachfor CP Finally the concluding remarks are presented inSection 6
2 The Difficulty of Solving Critical Path inStochastic Network
The CP of stochastic network is not as instinctive and easyas using CPM in deterministic network for the sake of fivereasons listed as follows
(a) For solving CP it has to approximate all completionpathsrsquo durations in the network
(b) In general the selection of the CP depends on thesorting of all the network completion paths Thesorting has to be executed through the max or minoperations among the probability distribution func-tions (PDF) of path durations instead of comparingthe pathsrsquo mean value of duration (such as PERTmodel)
(c) There is a bias between the results of PERTmodel andmax or min operations among random variables Inthis study the bias is named as the longest path bias(LPB) or the shortest path bias (SPB) in respect to themax or min operations They have to be consideredduring the network analysis
(d) The path dependence caused by the shared subpath inthe network generates a bias too It is rarely noticedand no solutions have been found yet in the presentpaper
(e) As mentioned in the above section each completionpath could have the probability to be CP in stochasticnetwork Therefore it needs to have a criterion forcomparing the probability values of all completionpaths and to select one of them as CP
According to the above reasons there are more detailedexplanations presented in the following subsections
2
3
1 4
Figure 1 The network with four nodes
21 The Approximation of Path Duration In the network therealization of path duration time is conducted through seriesof convolution and max operations (or min operations) overthe nodes in the network By taking node (119895) that is 120574119895 as anexample the calculations are represented as follows
119884119895
119894 = 120574119894 oplus 119883119894119895 119894 isin 119861119895
Pr (119884119895119894 ) = intinfin
minusinfin
119892119894 (119905 minus 120591) 119891119894119895 (120591) 119889120591
120574119895 = max 119884119895
1 119884119895
2 119884119895
119894
Pr (120574119895 ge 119909) = Pr (1198841198951 ge 119909 119884119895
2 ge 119909 119884119895
119894 ge 119909)
= Pr (1198841198951 ge 119909) sdot Pr (1198841198952 ge 119909) sdot sdot sdot sdot sdot Pr (119884119895119894 ge 119909)
119902 =10038161003816100381610038161003816119861119895
10038161003816100381610038161003816
(1)
where the symbol oplus denotes the convolution operation andPr(sdot) denotes the probability value of the internal function119884119895
119894 is the 119894th incident path of node (119895) 119861119895 is the precedencenodes set of node (119895) and 119892119894(sdot) and 119891119894119895(sdot) denote the PDF of120574119895 and 119883119894119895 respectively It is well known that the estimationof the PDF for the completion time of a project is a nonpoly-nomial hard problem (please see [3] for further reference)
Over the past double decades Dodinrsquos research [20] wasa rare one which can afford a feasible algorithm denoted asDodin algorithm (DA) to solve network completion timeand has been applied to big-size network DA used thediscretization technique to ldquodiscretizerdquo the PDF of each nodersquosduration in the network first it then executed the convolutionand max operations consecutively on nodes so as to deletethe LPB problem Finally DA approximates the PDF of thenetwork completion time By taking Figure 1 as an examplethe iterative steps of the DA are as follows
1205742 = 11988312
11988432 = 1205742 oplus 11988323
1205743 = max 11988313 11988432
11988442 = 1205742 oplus 11988324 (1-2-4)
11988443 = 1205743 oplus 11988334 (1-3-4)
1205744 = max 11988314 11988442 11988443 (1-2-3-4)
(2)
Mathematical Problems in Engineering 3
Though DA provides an elegantly simple and intuitivelyappealing procedure for dealing with the realization times ofpaths in stochastic network there are still two shortages Firstthere exists neither an exact data structure nor implemen-tation scheme for the computer programming Second anapproximated error may arise from assuming independencebetween subpaths in the activity network such a bias will begetting larger when increasing the network size [19]
22 The Sorting among Network Paths In the stochastic net-work all the completion paths could have their probabilitiesto be selected as the CPTherefore one has to offer a criterionto judge and select the highest probability of completion pathsto be the CP from all the paths Dodin algorithm [20] hassuggested the stochastic dominance operation (SDO) for tworandom variablesrsquo comparison By taking variables 1198841198951 and119884119895
2 as examples if 1198841198951 dominates 119884119895
2 (represented as 119884119895
1 ≻
119884119895
2 ) it means that 1198841198951 has a greater possibility than 119884119895
2 to bethe longest path or the shortest path in the network Theirequation relations are represented as follows
Pr (1198841198951 ≻ 119884119895
2) ge Pr (1198841198952 ≻ 119884119895
1) (3)
The SDO just operates for only two variables because of theproblem of the variables transitivity It means that if we have119884119895
1 ≻ 119884119895
2 and119884119895
2 ≻ 119884119895
3 it does not necessarily imply1198841198951 ≻ 119884119895
3 Inthis study transitivity problemwill be solved by the proposedmodified SDO in the following section
23 The Longest Path Bias and Shortest Path Bias Let 1198841198951 sim119884119895119898 represent totally 119898 incident paths of node (119895) and 120574119895the output duration of node (119895) According to the PERTmodel 120574119895 is secured as 120574PERT119895 and calculated by picking thelargest mean value of paths 119884
119895
1 sim 119884119895119898 where 119864[120574PERT119895 ] =
max (119864[1198841198951 ] 119864[119884119895
2 ] 119864[119884119895119898]) But in mathematical realiza-
tion the real mean value of 120574119895 should be calculated as119864[120574Real119895 ] = 119864[max (1198841198951 119884
119895
2 119884119895119898)] where the max operation
is executed among all incident paths 1198841198951 sim 119884119895119898 119864[120574Real119895 ] is
usually greater than 119864[120574PERT119895 ] and their deviation is namedas the longest path bias (LPB)
24 The Bias of Path Dependency among Subpaths The pathsin a stochastic network are not necessarily independent sincethey usually share activities with each other This may alsocause significant bias in approximation of network comple-tion time However most studies did not consider such factorin their approaches In Figure 2(a) the paths ⟨1 2 3 4 5 7⟩and ⟨1 2 3 4 6 7⟩ are assumed to be independent with eachother then we have 1205744 = 11988312 oplus 11988323 oplus 11988334 1205745 = 1205744 oplus 119883451205746 = 1205744 oplus 11988346 119884
71 = 1205745 oplus 11988357 119884
72 = 1205746 oplus 11988367 and
1205747 = max11988471 11988472 With the above numerical calculations the
expected duration of 1205747 is solved as 119864[1205747] = 1769 which isdifferent from the result 119864[1205747] = 1589 simulated out of MCSwithin 20000 samples (the result of MCS could be taken asthe nearly real solution)The above deviation is caused by the
1
1 3 5 2
2
3
3
2 3 4
5
6
7
(a)
X12 X23 X34 X45
X57
X67
X19984002998400 X
29984003998400 X
39984004998400 X
49984006
1998400
2998400
3998400
4998400
1 2 3 4 5
6
7
(b)
Figure 2 A simple network example
1
5
3
46
7
44
6
6
3
2
1
1
4
Figure 3 A simple network example
shared subpath ⟨1 2 3 4⟩ between the paths ⟨1 2 3 4 5 7⟩and ⟨1 2 3 4 6 7⟩ We named it as the shared activity bias(SAB) in this study
For further comprehension of the causes of SAB fromFigure 2(b) ⟨1 2 3 4⟩ and ⟨11015840 21015840 31015840 41015840⟩ are shared pathswhere 11988312 = 1198831101584021015840 11988323 = 1198832101584031015840 and 11988334 = 1198833101584041015840 From theview of DA subpaths ⟨1 2 3 4⟩ and ⟨11015840 21015840 31015840 41015840⟩ are treatedas two individual subpaths in the networkThemax operationexecuted on node (7) will cause extra LPB from subpath⟨11015840 21015840 31015840 41015840⟩ since the duration variance of the shared path⟨1-2-3-4⟩ is double-counted by subpath ⟨11015840 21015840 31015840 41015840⟩ in themax operation It brings more to the overlapping domainof variable distribution between subpaths ⟨1 2 3 4⟩ and⟨11015840 21015840 31015840 41015840⟩
25 A New Criterion for CP Judgment The PERT model andthe method of CPI do not properly determine the CP instochastic network Taking Figure 3 as an example there arethree completion paths represented as ⟨1 2 5 7⟩ ⟨1 3 6 7⟩and ⟨1 4 6 7⟩ The durations of activities are assumed asexponential distribution where their expected values areshown in the graph of Figure 3
By using the PERT model ⟨1 2 5 7⟩ is taken as the CPsince its expected path duration is 12 which is greater thanthose of the other paths Accordingly the expected comple-tion time of network is calculated as 12 too On the otherhand the authors use MCS within 20000 samples to simulatethe CPI of all paths that indicate the possibilities of how thepath can become the critical path of the network The results
4 Mathematical Problems in Engineering
are as follows ⟨1 2 5 7⟩CPI = 0426 ⟨1 3 6 7⟩CPI = 0286and ⟨1 4 6 7⟩CPI = 0288 From the results of MCS thepath ⟨1 2 5 7⟩ is still to be taken as the CP due to its highestCPI value But the completion time of MCS is simulated as119864[1205747] = 1662 which is different from the result of PERT Forfurther comprehension of above deviation the authors checkthe expected output of node (6) simulated as 119864[1205746] = 986and 119864[11988471 ] = 119864[1205746] + 119864[11988367] = 1286 which is greater thanthe expected output value of path ⟨1 2 5 7⟩ Obviously theabove result has shown that the network completion timeis not dominated by path ⟨1 2 5 7⟩ but by a two-pair path⟨1 3 6 7⟩ and ⟨1 4 6 7⟩ which is named as incidence pathclusters (IPC) in this study even though the path ⟨1 2 5 7⟩has the highest CPI value
From above experiment results it seems that we shouldneed a new criterion to judge CP in stochastic networkThe CP does not only have to do with the variables sortingLPB (or SPB) and SAB in stochastic network but also needto develop an implementation algorithm so as to efficientlyexecute all the max and convolution operations of nodes inthe network
3 The Proposed Algorithm for Critical Path ina Stochastic Network
A new proposed algorithm named as the modified M-LCTAis developed for CP in stochastic network The label-correcting tracing algorithm (LCTA) is originally developedfor approximating the completion time of stochastic network[19] In this study it is added with a RSDO for executing thepaths sorting so as to solve the CP
LCTA can efficiently get rid of the LPB SPB and SAB thatare mentioned in the last section during the approximationsomething that no other approaches can deal with properlyThere are more detailed explanations and many practicalexperiments for comparing various methods with LCTA in[19] Due to space limitations the comparisons are abridgedin this paper
31 The Expanded-Tree Structure and Node Data StructureThe M-LCTA has to first transfer the physical network intoa tree structure named as expanded-tree structure (ETS)according to the connected relation between the nodes inthe network Each node in the network has a unique indexnumber 119894 where node (1) represents the start node and node(119899) represents the terminal node (there are a total 119899 numberof nodes in the network) Figure 4 is an example of the ETS
M-LCTA has to visit each node in sequence and commitcalculations the generated results during the processes haveto be saved in a specified data structure in the nodes of ETSFor the objective of this research the structure of node (119894)includes the contents as follows
119894 index number of node (119894)
119861119894 set of precedent nodes of node (119894)
output119894 the realization time of output of node (119894)
2
3
1 4
4
1 2 3
1 1 2
1
Figure 4 The tree structure transformation
finish flag119894 visited flag of node (119894) where it is initiallyset as 0 when node (119894) has been visited it will be setas 1
node (119894)flag visited-flag set of incident paths of node(119894) where all are initially set as 0 when the 119896th incidentpath of node (119894) has finished its time realization thecorresponding 119896th position of node (119894)flag will be setas 1
node (119894)Inpath for each incidence path of node (119894)it includes a sequence of nodes from node (1) to node(119894) the realization time of incidence paths will besaved in node (119894)Inpath
32 The Two Tracing Procedures in M-LCTA When apply-ing the M-LCTA the authors employ two tracing proce-dures namely Upward Tracing (last node current node)and Downward Tracing (current node) where the cur-rent node is the node currently visited in the tracking processand the last node is the precedent node visited in thecurrent process These two procedures are listed as shown inAlgorithm 1
Initially the M-LCTA executes Downward Tracing(119899)and starts tracing from the terminal node (119899) Then it goesdownward until it reaches node (1) It then traces upwardand starts node-visiting and calculationsThe labels of visitednode are put into stack where data access follows the rule ofFirst InFirst Out (FIFO) Labels recording and reading aredenoted as push stack() and pull stack() in the proceduresrespectively The stack is used for recording the path-track ofvisited nodes by which the tracing procedures can judge andfind their ways to the nodes they have not visited yet
M-LCTA can sequentially visit each node in the networkAccording to the post-order tracing algorithm (POTA) ruleldquobefore visiting the node (119894) it has to confirm that all the childnodes of node (119894) have been visited The visits of child nodesshould be in sequence following the left-to-right directionrdquo
Using Figure 1 as an example we first change the networkinto a tree-structure and the sequence for visiting the nodes isshown in Figure 5The tracing procedures start from terminalnode (4) and through recursive executions of downwardand upward procedures the visiting sequence of M-LCTAis shown in blue arrow line Finally it stops and backs toterminal node (4)
Mathematical Problems in Engineering 5
Downward Tracing (current node)i = current nodewhile (120574119873 has not been calculated) do
if (119891119894119899119894119904ℎ 119891119897119886119892119894 = 1)119878ℎ119886119903119890119889 119891119897119886119892 = 1119896 = 119888119906119903119903119890119899119905 119899119900119889119890119894 = 119901119906119897119897 119904119905119886119888119896()perform Upward Tracing(ki )
Elseif (119894 = 1)
1205741 = 0119891119894119899119894119904ℎ 119891119897119886119892119894 = 1119896 = 119894119894 = 119901119906119897119897 119904119905119886119888119896()perform Upward Tracing(k i )
Elsepush stack(i)119894 = 119896
EndEnd
EndUpward Tracing (last node current node )119896 = 119897119886119904119905 119899119900119889119890119894 = 119888119906119903119903119890119899119905 119899119900119889119890while (120574119873 not been calculated) do
if (Has node(k) been visited)
119884119894119896 = [120583(120574119896)
1] oplus 119883119896119894 an constant mean 120583(120574119896)
119878ℎ119886119903119890119889 119891119897119886119892 = 0Else
119884119894119896 = 120574119896 oplus 119883119896119894119878ℎ119886119903119890119889 119891119897119886119892 = 0
Endif (119891119894119899119894119904ℎ 119891119897119886119892119894 = 1)
119882119894 = 119877119878119863119874(119894) = 119884119894119896 | forall119896 isin 119861119894120574119894 = min(119884119894119896) or 120574119894 = max(119884119894119896)119878ℎ119886119903119890119889 119891119897119886119892 = 0119896 = 119894119894 = 119901119906119897119897 119904119905119886119888119896()
Else119901119906119904ℎ 119904119905119886119888119896(119894)performDownward Tracing(i )
EndEnd
Algorithm 1
33 The Function of Eliminating Shared Activity BiasShared flag is a Boolean variable in both tracing proce-dures for identifying shared activities between paths in thenetwork During the implementation of the M-LCTA theUpward Tracing procedure first checks the value of theShared flag for the current node If the current node has beenpreviously visited and its realization time has been obtainedthe Shared flag will be set as 1 by the Downward Tracingprocedure Using the values of the Shared flag procedurescan find all of the activities shared by the subpaths in thenetwork Once the shared activities have been found theSAB can be eliminated by applying a heuristic to ldquocorrectrdquo
4
12
3
1 1 2
1
Figure 5 The tracing sequence
the computations in the max operation the PDF of theredundant shared activities is replaced with the value of theirmean (which is a fixed constant) in the Upward Tracingprocedure For more details of the SAB one could refer tothe experiments in [19]
34 The Function of Finding the Critical Path The operationof RSDO in the algorithms is responsible for sorting thesequence order of paths It is executed inM-LCTA during thenode visiting The processes are described below
In the Upward Tracing procedure if all the child nodesof the current node node (119894) have been visited node (119894) willexecute the RSDO and max (or min operation) operationsamong its incidence paths as follows
(a) 119882119894 = RSDO(119894) = 119884119894119896 | forall119896 isin 119861119894 of node (119894)is to rearrange the child-node position of node (119894)according to the results of RSDO(119894)The highest valueRSDO(119894) of child node will be put on the extremeright side of child-node position
(b) 120574119894 = min (119884119894119896) or 120574119894 = max (119884119894119896) for all 119896 isin 119861119894 isexecuted for the shortest path or the longest pathrespectively These calculations can release SPB orLPB in the approximationThe result 120574119894 is saved in theoutput119894 of node (119894)
(c) Otherwise the tracing procedures will execute 119884119894119896 =120574119896 oplus 119883119896119894 to accumulate the 119896th incidence path ofnode (119894) and save 119884119894119896 in the node (119894)Inpath119896 of node(119894) Then it goes back in the Downward Tracingprocedure
The executions of max (or min) operation and con-volution in M-LCTA apply techniques of discretizationM-LCTA first needs to replace the continuous PDF of 119883119894119895with its discretized version using the approach of Chebychevsampling points [21] The discretized PDF is represented byan ordered vector as
(V1198941198951 V1198941198952 sdot sdot sdot V119894119895119898119901119894119895
1 119901119894119895
2 sdot sdot sdot 119901119894119895119898) (4)
where V119894119895119896and 119901119894119895
119896are the values of the 119896th sample point of119883119894119895
and its corresponding probability respectively and m is the
6 Mathematical Problems in Engineering
total number of sample points Equations (1) executed in thealgorithm are all calculated in the form of discretization (seedetails in [19])
Through the iterative executions of theDownward Tracing and Upward Tracing proceduresthe M-LCTA will finally visit all the nodes and stop at theterminal node node (119899) Meanwhile all incidence pathsof nodes have rearranged their position sequence of childnode according to the sorting operation of RSDO in theprocedures so that the CP can be found
35 The Revised Stochastic Dominance Operator (RSDO)RSDO is different from Dodinrsquos SDO in solving the tran-sitivity problem [15] The RSDO determines the sortingorder of random variables through matrix operations Firstit has to construct an 119899 times 119899 pairwise comparison matrix(PCM) represented as 119875 for 119899 stochastic variables 119885 (119885 =(1199111 1199112 119911119899)) and shown in
119875 =[[[[
[
1 11988612 sdot sdot sdot 119886111989911988621 1 sdot sdot sdot 1198862119899
1198861198991 1198861198992 sdot sdot sdot 1
]]]]
]
=
[[[[[[[[[
[
11990811199081
11990811199082
sdot sdot sdot1199081119908119899
11990821199081
11990821199082
sdot sdot sdot1199082119908119899
119908119899
1199081
119908119899
1199082sdot sdot sdot
119908119899
119908119899
]]]]]]]]]
]
(5)
where 119886119894119895 = 119911119894119911119895 = 119908119894119908119895 and 119882 = (1199081 1199082 119908119899) is theideal-sorting ratio within 119885 variables The sorting order of 119885variables could be judged by the values of 119882 If all variablesfulfill the characteristics of transitivity each pair of variablesshould follow the equation below
119886119894119895 sdot 119886119895119896 = (119908119894
119908119895) sdot (
119908119895
119908119896)
= (119908119894
119908119896)
= 119886119894119896 119894 119895 119896 isin [1 119899]
(6)
In the case of (5) thematrix119875 is called the consistencymatrixand the119882 can be directly calculated as follows
∵119899
sum119895=1
1198861198941198951199081198951
119908119895= 119899 119886119894119895 sdot
119908119895
119908119894= 1
119899
sum119895=1
119886119894119895119908119895 = 119899119908119895 119894 = 1 119899
119875119882 = 119899119882 119882 = (1199081 119908119899)119879
(7)
The 119899 and (1199081 1199082 119908119899) could be solved as the eigenvalueand eigenvector of 119875 respectively In other cases if any oneof the elements in 119875 does not fulfill the condition of (5) 119882cannot be taken as the solutionThe eigenvalue of 119875would bechanged to 1198991015840 and the eigenvector 1198821015840 = (11990810158401 119908
10158402 119908
1015840119899) is
used as the approximation of119882
By referring to (3) and (5) the element 119886119894119895 of the PCMcould be calculated between variables 119911119894 and 119911119895 119894 119895 isin [1 119899]where
119886119894119895 = Pr (119911119894 ≻ 119911119895)
119886119895119894 = Pr (119911119895 ≻ 119911119894) = 1 minus Pr (119911119894 ≻ 119911119895)
(8)
Therefore PCM can be represented as 1198751015840
1198751015840=[[[[
[
1 11988612 sdot sdot sdot 1198861119899(1 minus 11988612) 1 sdot sdot sdot 1198862119899
(1 minus 1198861119899) (1 minus 1198862119899) sdot sdot sdot 1
]]]]
]
=
[[[[[[[[[
[
11990811199081
11990811199082
sdot sdot sdot1199081119908119899
11990821199081
11990821199082
sdot sdot sdot1199082119908119899
119908119899
1199081
119908119899
1199082sdot sdot sdot
119908119899
119908119899
]]]]]]]]]
]
0 lt 119886119894119895 lt 1
(9)
From (9) the lower triangle of 1198751015840 does not fulfill the patternof (6) It leads119882 not to be represented as the sorting ratio of119885 Therefore 1198751015840 needs to be regulated before calculating itseigenvalue and eigenvector The elements of 1198751015840 are regulatedas below
1199081015840119894
1199081015840119895 where 119908
1015840119894 = 119886119894119895 119908
1015840119895 = 119886119895119894 = (1 minus 119886119894119895) (10)
The regulation will not ruin the sorting ratio of 119885 since itjust changes the complementary relations (refer to (8)) intothe proportional relations of variables After the regulation1198751015840 is changed to 11987510158401015840 and is represented as follows
11987510158401015840=
[[[[[[[[[[[[
[
11199081015840111990810158402
sdot sdot sdot119908101584011199081015840119899
1199081015840211990810158401
1 sdot sdot sdot119908101584021199081015840119899
1199081015840119899
11990810158401
1199081015840119899
11990810158402sdot sdot sdot 1
]]]]]]]]]]]]
]
(11)
The eigenvalue of 11987510158401015840 is calculated as the sorting sequenceratio of incidence paths
By taking Figure 6 as an example node (119894) executes RSDOon four incidence paths 1198841198941 119884
1198942 1198841198943 1198841198944
According to (8) we calculate stochastic dominate prob-ability value (SDPV) for each incidence path 1198841198941 119884
1198942 1198841198943 1198841198944
where we have
Mathematical Problems in Engineering 7
Table 1 The comparison of running time between the proposed method (M-LCTA) and MCS
Index 1 2 3 4 5 6 7 8 9 10 11 12 13 14 15 (100 nodes)M-LCTA 0003 0006 001 0012 0015 0018 0019 0021 0031 0028 0034 0079 0099 0132 031MCS 08 15 23 33 44 45 52 64 67 92 107 177 446 1998 18406
12 3
4 12 3
4
i iYi
1
Yi
2 Yi
3
Yi
4Yi
1
Yi
2Yi
3
Yi
4
Figure 6 Four incident paths of node (119894)
Table 2
1
1
3
2
3
2
The shortest path ⟨1-3⟩The longest path ⟨1-2-3⟩
Index 1 2 3Mean 50 100 143
Table 3
1
1
2
2
3
44
5
3
The shortest path ⟨1-2-4⟩The longest path ⟨1-2-3-4⟩
Index 1 2 3 4 5Mean 500 333 250 417 400
11988612 = Pr (1198841198941 ≻ 1198841198942) = 02 11988621 = 1 minus 11988612 = 08
11988613 = Pr (1198841198941 ≻ 1198841198943) = 015 11988631 = 1 minus 11988613 = 085
11988614 = Pr (1198841198941 ≻ 1198841198944) = 0123 11988641 = 1 minus 11988614 = 0877
11988623 = Pr (1198841198942 ≻ 1198841198943) = 0248 11988632 = 1 minus 11988623 = 0752
11988624 = Pr (1198841198942 ≻ 1198841198944) = 02 11988642 = 1 minus 11988624 = 08
11988634 = Pr (1198841198943 ≻ 1198841198944) = 0333 11988643 = 1 minus 11988634 = 0667
(12)
By referring to (10) we have 11987510158401015840 as
11987510158401015840=[[[
[
1 025 017 0144 1 033 0256 3 1 057 4 2 1
]]]
]
(13)
1
3
7
6
8
9
42
2 2
3
3
2
54
3
2
2
5
Figure 7 The 9 nodes of demonstrative example
The eigenvalue of11987510158401015840 is calculated as 11989910158401015840 = 4102which is closeto 119899 = 4 the eigenvector is calculated as the 1198821015840 = (06170224 0097 0062) which is the sorting ratio of incidencepaths According to the 1198821015840 and sorting rule of M-LCTAthe 1198841198941 should be put on the extreme right side of child-nodeposition where we have a sequence order of (1198841198944 119884
1198943 1198841198942 1198841198941)
To represent the M-LCTA procedure scheme conve-niently we define the above operation as 1198821015840 = RSDO(119894) toshow the execution of RSDO on the node (119894) and produce thesorting result1198821015840 from its incidence paths
4 Demonstrative Examples
By taking the network of Figure 7 as the demonstrativeexample there are a total of 9 nodes and all the activitydurations are assumed to be exponential distributions wheretheir duration means are shown in the figure
There are three completion paths included ⟨1-2-3-9⟩⟨1-4-5-6-8-9⟩ and ⟨1-4-5-7-8-9⟩ where the path ⟨1-2-3-9⟩ istaken as the shortest path from the viewpoint of the PERTmodel In another method MCS within 20000 samples isused to simulate the same network (MCS result could betaken as the nearly real solution) and the result is differentfrom that of PERT This shows obviously that PERT cannotsolve CP correctly in stochastic network
Let us apply our method to the same example It has totransfer the network into a tree structure first as shown inFigure 8 M-LCTA starts the Downward Tracing (9) at node(9) Downward Tracing and Upward Tracing procedures areexecuted iteratively with each other Finally it calculates theexpected completion time as 1205749 = 712 from node (9) whichis very close to the simulated result of the MCS
During the executions1198828 = RSDO(8) = 1198848119896 | forall 119896 isin 1198618
and min (11988481 11988482 ) are performed at node (8) We find that the
two incidence paths have to swap their child-node positionbecause of the sorting result of the RSDO The modified M-LCTAfinally stops at node (9) and executes1198829 = RSDO(9) =1198849119896 | forall 119896 isin 1198619 and min (11988491 119884
92 ) The result of the RSDO (9)
8 Mathematical Problems in Engineering
9
3
2
8
1
7 6
5
4
1
5
4
1
9
3
2
8
1
6 7
5
4
1
5
4
1
Figure 8 The tree structure of Figure 3
Table 4
1
2
1
3
24
4
53
5
6
7
The shortest path ⟨1-3-5⟩The longest path ⟨1-2-3-4-5⟩
Index 1 2 3 4 5 6 7Mean 125 167 111 200 143 333 250
Table 5
1
4
6
18
39
2
53
2
7
4
6
5
The shortest path ⟨1-2-4-6⟩The longest path ⟨1-6⟩
Index 1 2 3 4 5 6 7Mean 250 1000 143 286 200 167 222Index 8 9Mean 167 256
shows that the incidence paths need not to change theirchild-node position at node (9) After the repositioning of allincident paths in the network Figure 8 gives the final resultThe path ⟨1-4-5-7-8-9⟩ is selected as the critical path whichlays on the extreme right side of the tree
Finding the longest path is the same as above except thatthe min operator is replaced by the max operator at node (8)and node (9)
Table 6
1 3 6
1 9
3 11
2
5
4
2
8
6
5
4
107
The shortest path ⟨1-4-6⟩The longest path ⟨1-2-3-4-5-6⟩
Index 1 2 3 4 5 6 7Mean 100 111 25 50 33 125 25Index 8 9 10 11Mean 50 100 33 33
Table 7
1 2 7
2
39
3
6
4
1
8
7
5
4
10
6
5
11
The shortest path ⟨1-2-5-7⟩The longest path ⟨1-2-3-6-7⟩
Index 1 2 3 4 5 6 7Mean 100 83 200 125 50 250 333Index 8 9 10 11Mean 250 417 67 63
From the above experiments it is noticed that thecompletion time of network is actually dominated by one ofIPC of terminal node instead of the result of PERT model orthe highest CPI The domination on the network completiontime should be the key characteristic for CP so as to let CP bethe right target for project managers to allocate the resources
5 Numerical Experiments
This section will verify the efficiency and accuracy of ourproposed approach on various sizes of stochastic networksespecially the larger ones The first part of network instancesis generated from [22] where there are a total of 14 instancenetworks and the activity number ranges from 3 to 76 Allactivities durations are also assumed to have exponential dis-tribution Their parameters information and experimentalresults are shown in the appendix
Mathematical Problems in Engineering 9
1
2 4
5
7
8
9
3
610
11 17
18 26
27
25 35
3416
15
14
13
12
22
23 33
32
31
30
21
20
19 29
36
37
38
45
44
43
42
41
40
39
46
47
48
49
50
2457
56
55
54
53
52
51
58
59
60
61
62
69
68
67
66
65
64
63
70
71
72
81
82
80
77
78
76
75
74
7988
89
87
86
85
84
8390
91
92
93
94
95
96
97
98
99
100
28
73
Figure 9 The 100-node network instance of [19]
Table 8
1
2
8
3
2 12
4
6
5
1
10
9
8
5
7
6
3
11
7
4
The shortest path ⟨1-2-7-8⟩The longest path ⟨1-2-4-6-8⟩
Index 1 2 3 4 5 6 7Mean 100 111 125 100 111 125 100Index 8 9 10 11Mean 125 100 111 100
The second part is a network of 100 nodes and 135activities generated by [19] It was designed by followingthe rules of [23] where the network complexity factor wasset to 20 For each node the incidence path number wasrandomly determined from a range of [1 2] and the PDF wasdetermined randomly from normal exponential or uniformdistributionThe correspondent parameters of PDFwere alsorandomly selected within the range of [2 16] Figure 9 showsits detailed structure and experiment results as follows
Table 9
13
7
1
3
2
6
4
28
6
9
5
10
7
5
12
11
13
14
The shortest path ⟨1-2-7⟩The longest path ⟨1-3-4-5-7⟩
Index 1 2 3 4 5 6 7Mean 50 40 63 50 100 63 20Index 8 9 10 11 12 13 14Mean 40 50 125 111 100 80 100
The shortest path⟨1-3-5-10-15-23-33-55-68-78-86-92-97-99-100⟩
The longest path⟨1-2-4-8-13-20-30-42-54-63-76-84-90-96-98-100⟩
Since the simulated results of MCS are close to the realsolution (please refer to [7 20]) the authors employ theMCS within 20000 samples as the benchmark and simulate
10 Mathematical Problems in Engineering
Table 10
1
3
91
3
2 5
4
2
4
6
5
8
76 11
12
13
7
89
10
14
10
The shortest path ⟨1-4-7-10⟩The longest path ⟨1-2-5-9-10⟩
Index 1 2 3 4 5 6 7Mean 500 333 250 400 286 222 200Index 8 9 10 11 12 13 14Mean 167 333 500 667 500 400 333
Table 11
1
3
8
1
2
2 6
5
7
8
3
5
144
4
13
15
17
7
9
10
11
12
16
6
10
9
The shortest path ⟨1-2-4-7-10⟩The longest path ⟨1-2-4-5-7-8-10⟩
Index 1 2 3 4 5 6 7Mean 60 100 50 100 40 50 100Index 8 9 10 11 12 13 14Mean 30 30 40 20 60 70 20Index 15 16 17Mean 80 60 91
all the network instances twice one for the longest path andthe other for the shortest path The MCS simulations focuson checking the accuracy of RSDO results and the outputduration of each node in the networks After completingall experiments we have excellent performances that theexperiment networks are all matching the results of MCSBeyond that the efficiency of proposed method is alsoextraordinarily superior to that ofMCS (see Table 1) Accord-ing to the network of 100 nodesMCS requires 18406 secondsto complete the simulation while our method takes only031 seconds
Table 12
1
4
9
1
2
2 5
8
3
5
4
14
7
3
1511
6
10
11
12
9
168
106
7
17
1813
14
1213
The shortest path ⟨1-4-7-13-14⟩The longest path ⟨1-3-5-9-11-12-14⟩
Index 1 2 3 4 5 6 7Mean 167 250 100 143 125 250 125Index 8 9 10 11 12 13 14Mean 50 143 200 125 143 111 111Index 15 16 17 18Mean 200 111 250 167
Table 13
1
8
14
2
1
34
74
5
7
143
2
13
15
813
6
9
11
912
6 10
16
10
11
155 17
12
16
17
18
19
20
21
22
23
24
The shortest path ⟨1-2-5-13-17⟩The longest path ⟨1-2-5-7-11-16-17⟩
Index 1 2 3 4 5 6 7Mean 400 500 450 549 300 350 400Index 8 9 10 11 12 13 14Mean 250 300 400 500 260 280 200Index 15 16 17 18 19 20 21Mean 250 300 200 180 360 450 150Index 22 23 24Mean 599 250 461
6 Conclusions
Since activity duration and path duration are both randomvariables the methods employed for deterministic networkscannot be used in this study In addition the popular PERTmodel and CPI method do not work either since they ignorethe effects of the LPB SPB and SAB which have to beconsidered in the stochastic networksThat is why wemodifythe LCTA of [19] by adding the revised stochastic dominance
Mathematical Problems in Engineering 11
Table 14
1
4
8
1
2
6
7
7
2
5
3
15
4
3
13
17
69
10
11
11
8
22
9
32
10
12
13
15
5
16
14
17
16
25
18
19
20
23
21
18
19
20
12
14
26
24
27
29
30
2836
3331
35
38
3734
The shortest path ⟨1-2-3-16-20⟩The longest path ⟨1-2-3-5-8-12-15-18-20⟩
Index 1 2 3 4 5 6 7 8 9 10 11 12 13 14 15Mean 160 300 160 200 100 180 150 110 120 400 200 160 100 80 14Index 16 17 18 19 20 21 22 23 24 25 26 27 28 29 30Mean 210 160 200 190 170 150 180 210 160 200 180 160 120 180 150Index 16 31 32 33 34 35 36 37 38Mean 300 240 110 110 220 240 300 150 80
operation (RSDO) in this research and employ it to solve CPin stochastic networks In the experiments of this study wehave various sizes of instance networks from [19 22] wherethe activity numbers ranged from 3 to 135 According to theexperimental results they all comply with the simulationresults of the MCS within 20000 samples Beyond that theefficiency of the proposedmethod is extraordinarily great Asshown inTable 1 it is almost 780 times faster than that ofMCSin average Therefore according to the overall performancewe confirmed that the proposed algorithm in this study is anexcellent tool for solving CP in stochastic networks
In addition this study has also proved and pointed outthat the CP generated from traditionalmethods (ie PERT orCPI methods) is not necessarily the key path in the networkThe CP should follow the spirit of Definitions 1 and 2 whichis ldquothe critical path of stochastic network should be highestinfluence of dominating the network completion timerdquo Withthe above assertion it could help the project managers tokeep off allocating the precious resources into null and voidactivities in the network and that would also be the maincontribution in this study
Appendix
Network 1 see Table 2
Network 2 see Table 3
Network 3 see Table 4
Network 4 see Table 5
Network 5 see Table 6
Network 6 see Table 7
Network 7 see Table 8
Network 8 see Table 9
Network 9 see Table 10
Network 10 see Table 11
Network 11 see Table 12
Network 12 see Table 13
Network 13 see Table 14
Network 14 see Table 15
Conflict of Interests
The authors declare that there is no conflict of interestsregarding the publication of this paper
12 Mathematical Problems in Engineering
Table 15
1
2
5
11
10
16 22
28
2317
12
6
7
3 8
94
15
21
27
32
26
20
25
31
35
30
3436
29
24
33
18
13
19
141
2
3 10
11
9
8
7
6
20
191817
54 16 21
14
13
12 15
24 23
36
37
38
52
51
48
64
65
63
6173
50
68
7169
58
5949
564657
67
6655
54
74
75
7670
72
60
62
44
45
30
34
32
47
29
35
31 42
4133
3953
4043
25
26
27
28
22
The shortest path ⟨1-3-5-12-20-27-30-35-36⟩The longest path ⟨1-4-6-13-16-22-28-34-36⟩
Index 1 2 3 4 5 6 7 8 9 10 11 12 13 14 15Mean 167 125 143 20 50 100 111 17 33 143 125 29 38 23 118Index 16 17 18 19 20 21 22 23 24 25 26 27 28 29 30Mean 400 18 133 105 67 40 67 29 25 27 21 118 125 67 40Index 31 32 33 34 35 36 37 38 39 40 41 42 43 44 45Mean 40 29 25 143 17 67 40 67 154 133 67 45 29 19 143Index 46 47 48 49 50 51 52 53 54 55 56 57 58 59 60Mean 29 83 143 77 40 29 22 48 119 50 22 18 111 83 56
Acknowledgment
This research was supported in part by the National ScienceCouncil of Taiwan under the Grant no NSC 102-2221-E-270-005
References
[1] S E Elmaghraby Activity Networks Project Planning andControl by Network Models John Wiley amp Sons New York NYUSA 1977
[2] V G Adlakha and V G Kulkarni ldquoA classified bibliography ofresearch on stochastic PERT networks 1966ndash1987rdquo InformationSystems and Operational Research vol 27 no 3 pp 272ndash2961989
[3] J NHagstrom ldquoComputational complexity of PERTproblemsrdquoNetworks vol 18 no 2 pp 139ndash147 1988
[4] C A Gallagher ldquoNote on PERT assumptionrdquo ManagementScience vol 33 pp 1360ndash1362 1987
[5] J J Martin ldquoDistribution of the time through a directed acyclicnetworkrdquo Operations Research vol 13 pp 46ndash66 1965
[6] RM van Slyke ldquoMonteCarlomethods and the PERTproblemrdquoOperations Research vol 11 pp 839ndash861 1963
[7] C E Sigal A A B Pritsker and J J Solberg ldquoThe use of cutsetsin Monte Carlo analysis of stochastic networksrdquo Mathematicsand Computers in Simulation vol 21 no 4 pp 376ndash384 1979
[8] B Dodin ldquoDetermining the 119870 most critical paths in PERTnetworksrdquoOperations Research vol 32 no 4 pp 859ndash877 1984
[9] B M Dodin and S E Elmaghraby ldquoApproximating the criti-cality indices of the activities in PERT networksrdquoManagementScience vol 31 no 2 pp 207ndash223 1985
Mathematical Problems in Engineering 13
[10] S E Elmaghraby ldquoOn criticality and sensitivity in activitynetworksrdquo European Journal of Operational Research vol 127no 2 pp 220ndash238 2000
[11] SM T Fatemi Ghomi and E Teimouri ldquoPath critical index andactivity critical index in PERT networksrdquo European Journal ofOperational Research vol 141 no 1 pp 147ndash152 2002
[12] J Kamburowski ldquoAn upper bound on the expected completiontime of PERT networksrdquo European Journal of OperationalResearch vol 21 no 2 pp 206ndash212 1985
[13] J Kamburowski ldquoNormally distributed activity durations inpert networksrdquo Journal of the Operational Research Society vol36 no 11 pp 1051ndash1057 1985
[14] R P Loui ldquoOptimal paths in graphs with stochastic or mul-tidimensional weightsrdquo Communications of the Association forComputing Machinery vol 26 no 9 pp 670ndash676 1983
[15] P B Mirchandani and H Soroush ldquoOptimal paths in proba-bilistic networks a case with temporary preferencesrdquo Comput-ers amp Operations Research vol 12 no 4 pp 365ndash381 1985
[16] I Murthy and S Sarkar ldquoA relaxation-based pruning techniquefor a class of stochastic shortest path problemsrdquo TransportationScience vol 30 no 3 pp 220ndash236 1996
[17] G A Corea and V G Kulkarni ldquoShortest paths in stochasticnetworks with arc lengths having discrete distributionsrdquo Net-works vol 23 no 3 pp 175ndash183 1993
[18] G H Polychronopoulos and J N Tsitsiklis ldquoStochastic shortestpath problems with recourserdquo Networks vol 27 no 2 pp 133ndash143 1996
[19] M-J Yao and W-M Chu ldquoA new approximation algorithmfor obtaining the probability distribution function for projectcompletion timerdquo Computers ampMathematics with Applicationsvol 54 no 2 pp 282ndash295 2007
[20] BDodin ldquoApproximating the distribution functions in stochas-tic networksrdquoComputers and Operations Research vol 12 no 3pp 251ndash264 1985
[21] M K Agrawal and S E Elmaghraby ldquoOn computing the distri-bution function of the sum of independent random variablesrdquoComputers and Operations Research vol 28 pp 473ndash483 2001
[22] A P Tereso M M T Araujo and S E Elmaghraby ldquoAdaptiveresource allocation in multimodal activity networksrdquo Interna-tional Journal of Production Economics vol 92 no 1 pp 1ndash102004
[23] R Kolisch and A Sprecher ldquoPSPLIBmdasha project schedulingproblem libraryrdquo European Journal of Operational Research vol96 no 1 pp 205ndash216 1996
Submit your manuscripts athttpwwwhindawicom
Hindawi Publishing Corporationhttpwwwhindawicom Volume 2014
MathematicsJournal of
Hindawi Publishing Corporationhttpwwwhindawicom Volume 2014
Mathematical Problems in Engineering
Hindawi Publishing Corporationhttpwwwhindawicom
Differential EquationsInternational Journal of
Volume 2014
Applied MathematicsJournal of
Hindawi Publishing Corporationhttpwwwhindawicom Volume 2014
Probability and StatisticsHindawi Publishing Corporationhttpwwwhindawicom Volume 2014
Journal of
Hindawi Publishing Corporationhttpwwwhindawicom Volume 2014
Mathematical PhysicsAdvances in
Complex AnalysisJournal of
Hindawi Publishing Corporationhttpwwwhindawicom Volume 2014
OptimizationJournal of
Hindawi Publishing Corporationhttpwwwhindawicom Volume 2014
CombinatoricsHindawi Publishing Corporationhttpwwwhindawicom Volume 2014
International Journal of
Hindawi Publishing Corporationhttpwwwhindawicom Volume 2014
Operations ResearchAdvances in
Journal of
Hindawi Publishing Corporationhttpwwwhindawicom Volume 2014
Function Spaces
Abstract and Applied AnalysisHindawi Publishing Corporationhttpwwwhindawicom Volume 2014
International Journal of Mathematics and Mathematical Sciences
Hindawi Publishing Corporationhttpwwwhindawicom Volume 2014
The Scientific World JournalHindawi Publishing Corporation httpwwwhindawicom Volume 2014
Hindawi Publishing Corporationhttpwwwhindawicom Volume 2014
Algebra
Discrete Dynamics in Nature and Society
Hindawi Publishing Corporationhttpwwwhindawicom Volume 2014
Hindawi Publishing Corporationhttpwwwhindawicom Volume 2014
Decision SciencesAdvances in
Discrete MathematicsJournal of
Hindawi Publishing Corporationhttpwwwhindawicom
Volume 2014 Hindawi Publishing Corporationhttpwwwhindawicom Volume 2014
Stochastic AnalysisInternational Journal of
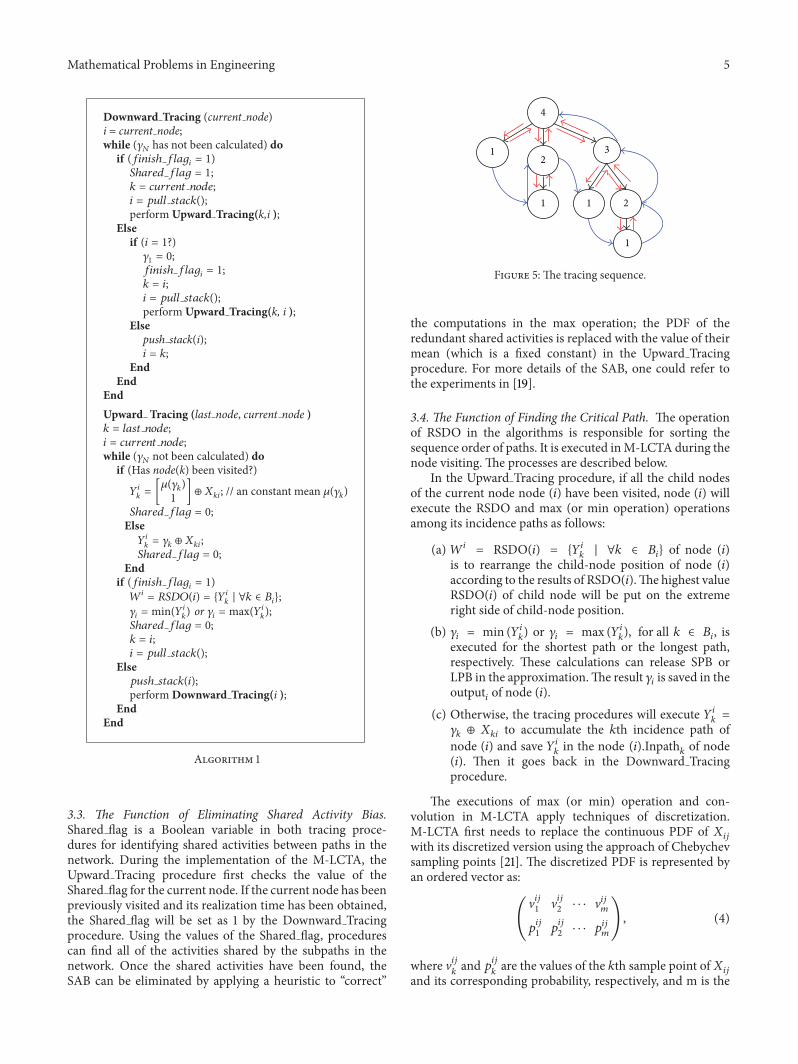
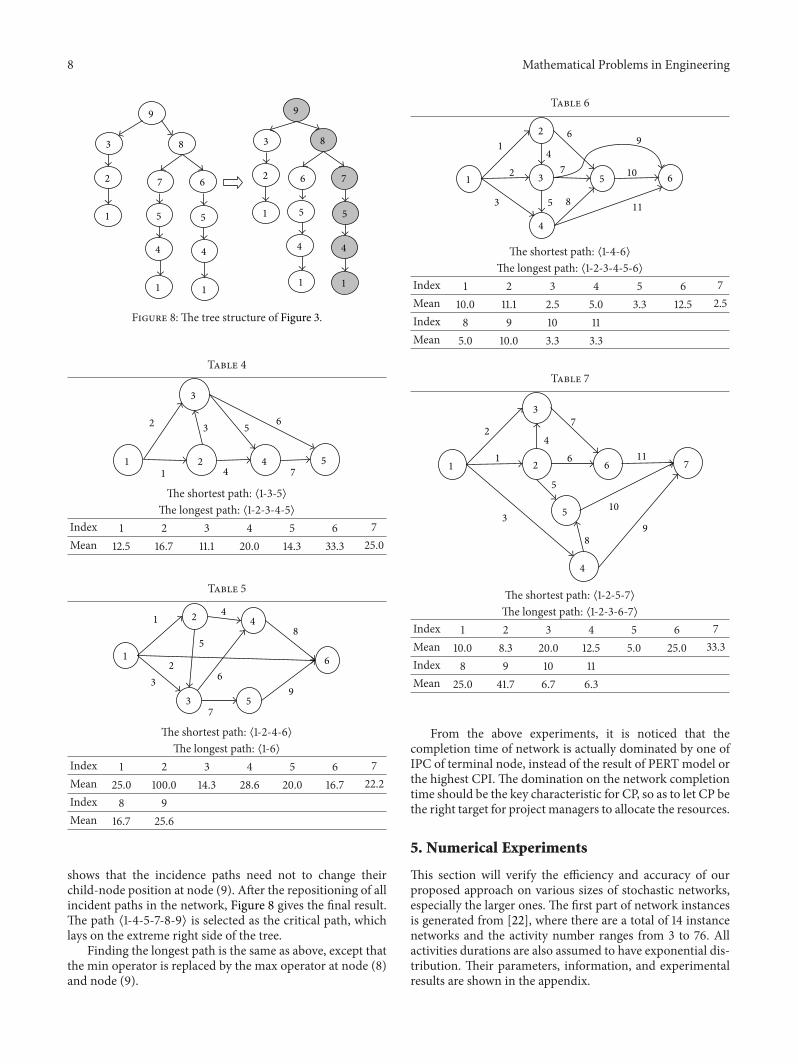
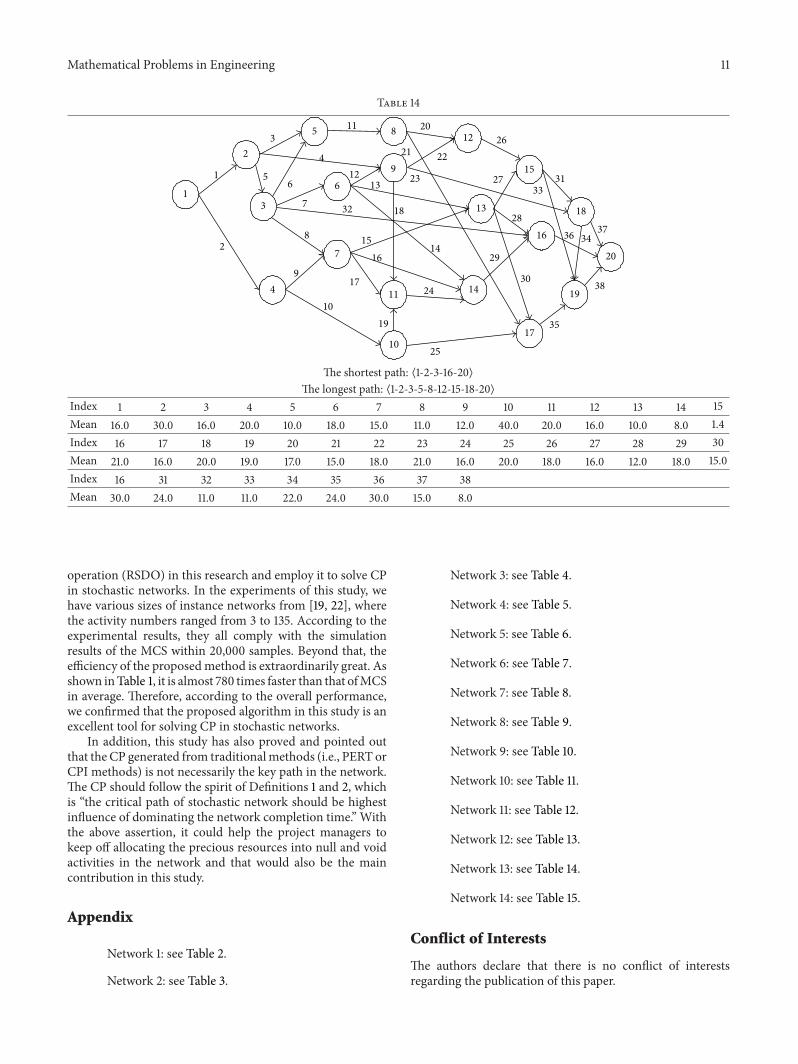
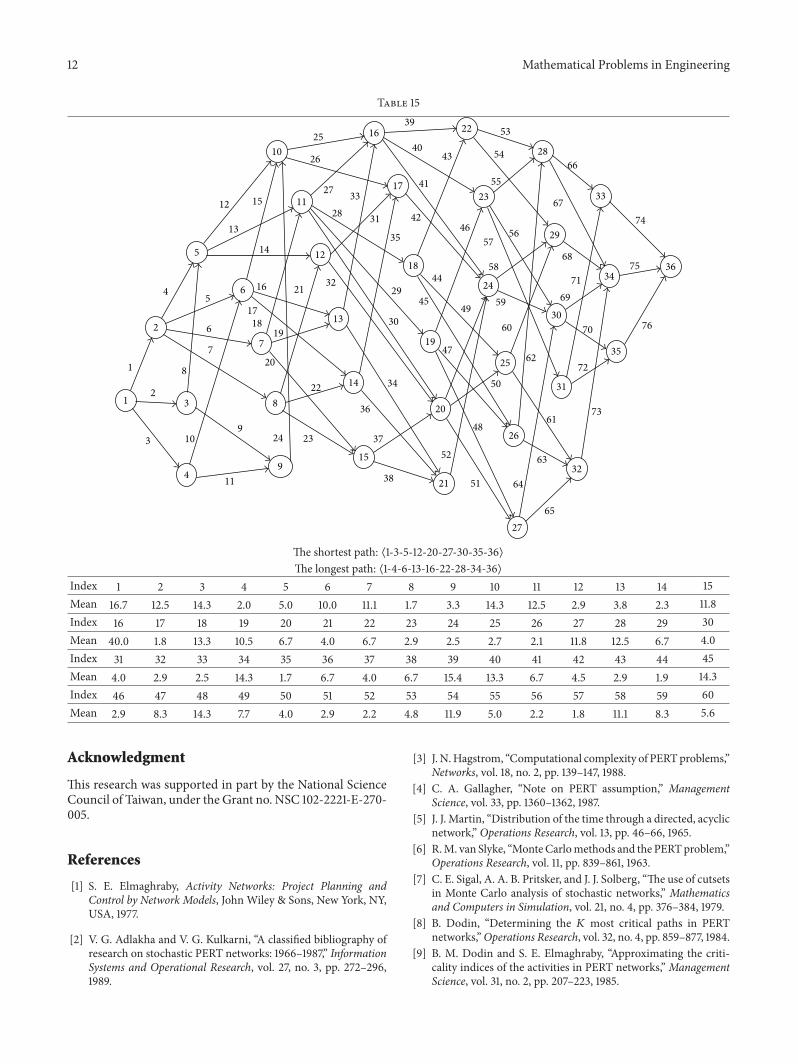