Embed Size (px)
Citation preview
Research ArticleComparative Metagenomic Analysis of Human Gut MicrobiomeComposition Using Two Different Bioinformatic Pipelines
Valeria D’Argenio,1,2 Giorgio Casaburi,1,2 Vincenza Precone,1,2 and Francesco Salvatore1,2,3
1 CEINGE-Biotecnologie Avanzate, Via G. Salvatore, 80145 Naples, Italy2 Department of Molecular Medicine and Medical Biotechnologies, University of Naples Federico II, Via S. Pansini, 80131 Naples, Italy3 IRCCS-Fondazione SDN, Via Gianturco, 80143 Naples, Italy
Correspondence should be addressed to Francesco Salvatore; [email protected]
Received 5 October 2013; Accepted 30 December 2013; Published 25 February 2014
Academic Editor: Qaisar Mahmood
Copyright © 2014 Valeria D’Argenio et al. This is an open access article distributed under the Creative Commons AttributionLicense, which permits unrestricted use, distribution, and reproduction in any medium, provided the original work is properlycited.
Technological advances in next-generation sequencing-based approaches have greatly impacted the analysis of microbialcommunity composition. In particular, 16S rRNA-based methods have been widely used to analyze the whole set of bacteriapresent in a target environment. As a consequence, several specific bioinformatic pipelines have been developed to manage thesedata. MetaGenome Rapid Annotation using Subsystem Technology (MG-RAST) and Quantitative Insights Into Microbial Ecology(QIIME) are two freely available tools for metagenomic analyses that have been used in a wide range of studies. Here, we reportthe comparative analysis of the same dataset with both QIIME and MG-RAST in order to evaluate their accuracy in taxonomicassignment and in diversity analysis. We found that taxonomic assignment was more accurate with QIIME which, at family level,assigned a significantly higher number of reads. Thus, QIIME generated a more accurate BIOM file, which in turn improved thediversity analysis output. Finally, although informatics skills are needed to install QIIME, it offers a wide range of metrics that areuseful for downstream applications and, not less important, it is not dependent on server times.
1. Introduction
Microbes play an important role in virtually all ecosystemsranging from those in the sea or the soil [1, 2] to those inhuman body environments like the skin or the gut [3–5].The link with human body environments generated manystudies of microbial community composition designed toassess its role in variousmetabolic pathways and to determinewhether it is involved in inducing and/or preventing specificpathological conditions. Such investigations could help toclarify the pathogenesis of specific diseases and could alsolead to novel disease-markers and/or to the development ofnovel therapeutic strategies. To date, several human diseaseshave been significantly correlated with dysbiosis of specificmicrobial communities [6–9].
Thanks to technological improvements in sequencingmethods, virtually all themicrobes from a given environmentcan be analyzed in a single run, avoiding cultivation steps.In particular, procedures based on 16S rRNA next-generation
sequencing, which allow the high throughputmicrobial iden-tification within a specific metagenome, represent a powerfulmeans to investigate the composition and the biodiversity ofmicrobial communities [10]. The enormous amount of next-generation metagenomic data generated by such proceduresnecessitates bioinformatic tools able to analyze them. In fact,an accurate taxonomic assignment of each microbe in atarget environment is required to evaluate the structure, thebiodiversity, the richness, and the role of the communityresident in a given environment [11, 12].
MetaGenome Rapid Annotation using SubsystemTechnology (MG-RAST) is a freely available (http://metagenomics.nmpdr.org), fully automated system able toprocess metagenome sequence data by performing sequencealignment, sequence functional and phylogenetic assign-ments, and comparative metagenomics [13]. QuantitativeInsights Into Microbial Ecology (QIIME) is an open-sourcesoftware pipeline (http://qiime.sourceforge.net/) able toperform, starting from raw sequence data, a wide range
Hindawi Publishing CorporationBioMed Research InternationalVolume 2014, Article ID 325340, 10 pageshttp://dx.doi.org/10.1155/2014/325340
2 BioMed Research International
Table 1: Summary of the taxonomic assignment data and of the algorithms available to obtain them in the MG-RAST and QIIME tools.
Postfilteringreads∗
Total distinctbacteria Families§
Bacteria families with>100 sequences†
Available taxonomicassignment algorithms‡
Default available 16S rRNAdatabases±
MG-RAST 35,232 70 27 BLAT Greengenes, LSU, SSU, M5RNA,RDP, no custom databases
QIIME 38,813 123 30 Rdp, Blast, Mothur, Rtax Greengenes, custom databases∗Number of reads obtained after the quality filtering step by the two bioinformatic pipelines; §number of distinct bacteria Families identified, as total numberand †as themost represented Families withmore than 100 sequences; ‡taxonomy assignment algorithms available for both tools; ±16S rRNA databases availablefor both tools.
of analyses on microbial communities, that is, sequencealignment, identification of operational taxonomic units(OTUs), elaboration of phylogenetic trees, and phylogeneticand taxon-based analysis of diversity within and betweensamples [14]. Both tools have been successfully used toanalyze a large number of metagenomic 16S ribosomal RNAdatasets by assessing their ability in the management of thesekinds of data [15, 16].
We have performed a comparative bioinformatic analysisof the same dataset using both QIIME and MG-RAST toevaluate their accuracy in taxonomic assignment. Here, wereport the efficacy of these two well established methods inassigning sequence reads to microbes at different phyloge-netic levels and in analyzing the diversity and richness ofmicrobial communities.
2. Materials and Methods
2.1. 16S rRNA Sequence Dataset. We constructed a datasetcontaining the 16S rRNA sequence data obtained from theanalysis of the ileum mucosa samples of four unrelated chil-dren: two patients with inflammatory bowel disease and twosex- and age-matched healthy controls. The next generationsequencing evaluation of their gut microbial communitieswas carried out as previously described [8].
2.2. Bioinformatics Analysis
2.2.1. Preanalysis Step. The following parameters were setfor both QIIME and MG-RAST: (i) a minimum averagequality Phred score of 25 allowed in reads; (ii) a minimumand maximum sequence length in the range of 200–1000nucleotides; and (iii) amaximumnumber of ambiguous basesand length of homopolymers equal to 6. In addition, to be asstringent as possible, we did not allow any primermismatches(setting the parameter “primermismatches” = 0) and allowedonly a 1.5 maximum number of errors in barcodes.
2.2.2. 16S rRNAs Detection, Clustering, and Identification.16S bacterial rRNAs identification was performed by thetwo tools using two distinct strategies. MG-RAST computesthe 16S rRNAs search with the Blast-Like-Alignment Tool(BLAT) [17] against a reduced rRNAs database. This reduceddatabase is obtained from a 90% identity clustered versionof the SILVA [18] database and is used to increase therate of identification of the sequences similar to specificrRNAs,thereby reducing the computing time. The selected
rRNA reads are then clustered at 97% identity by picking thelongest sequence within each cluster as representative of thatcluster. An additional similarity search with BLAT is thenperformed using only the obtained representative cluster-sequences against different 16S rRNA databases which can beselected by the user (seeTaxonomic classification and Table 1).We used MG-RAST default clustering parameters within theBLAT algorithm.
In QIIME, the 16S rRNAs detection is performed withan OTU-picking approach. The OTU-picking procedureconsists in assigning sequences to OTUs by clustering thesequences on the basis of a threshold that the user may mod-ify. When a sequence shows a similarity level near or abovethe chosen threshold, it is taken in a sequence collectionthat represents the presence of a taxonomic unit. QIIMEimplements several clustering methods to perform this oper-ation.We used the default clustering algorithmUCLUST [19],which creates sequence clusters based on percent identity(default identity = 97%). After the OTU picking step, therepresentative sequence for each OTU, namely, the mostabundant sequences in that OTU, is chosen for subsequentanalyses in order to reduce the computational power and theanalysis time, without losing the frequency information.
2.2.3. Taxonomic Classification. InMG-RAST, the taxonomicclassification was performed with BLAT [17] and, for com-parison purposes, we selected, among the available 16S rRNAdatabases, the Greengenes database (2012 release, available athttp://greengenes.lbl.gov/) [20], setting theMax e-Value Cut-off to 1 × 10⁵ and the Min% Identity Cutoff to 80% (Table 1).Reads assigned to the Bacteria root but not attaining thethreshold at the chosen taxonomic level fell in the category“Unclassified”, while sequences not assigned to the Bacteriaroot were classified as “No Hits”. To compare the power oftaxonomic assignment of the two pipelines, we extracted theobtained results at amily level. After taxonomic assignment,MG-RAST generates a web page for results visualization andhandling, and it can also generate a Biological ObservationMatrix (BIOM) file useful to transfer the obtained data toother tools for comparison purposes [21].
QIIME can perform the taxonomy assignmentusing different methods (Table 1) [22]. We used theRibosomal Database Project (RDP) classifier 2.2 [23]against the Greengenes database (2012 release, available athttp://greengenes.lbl.gov/) [20] using the same thresholdswe used for MG-RAST. After taxonomic assignment, QIIMEgenerates a BIOM file that can be used for a wide range ofanalyses [21].
BioMed Research International 3
Table 2: Overview of all diversity analysis metrics and statistical tests available in MG-RAST and QIIME.
Alpha diversity metrics∗ Beta diversity metrics§ Statistical tests†
MG-RAST Shannon Bray-Curtis
Unpaired 𝑡 testANOVAMann-Whitney testKruskal-Wallis test
Nonphylogeny based metrics Non-phylogeny based metrics
QIIME
berger parker dbrillouin dchao1chao1 confidencedominancedoublesequitabilityfisher alphagini indexgoods coverageheip ekempton taylor qmargalefmcintosh dmcintosh emenhinickmichaelis menten fitobserved speciesosdrobbinsShannonsimpson (1-Dominance)simpson reciprocal(1/Dominance)simpson esinglesstrong
abund jaccardbinary chisqbinary chordbinary euclideanbinary hammingbinary jaccardbinary lennonbinary ochiaibinary otu gainbinary pearsonbinary sorensen dicebray curtisbray curtis faithbray curtis magurrancanberrachisqchordeuclideangowerhellingerkulczynskimanhattanmorisita hornpearsonsoergelspearman approxspecprof
ANOVAG-testPaired 𝑡 testLongitudinal correlationtwo sample 𝑡 testadonisANOSIMBESTMoran’s IMRPPPERMANOVAPERMDISPdb-RDAMantel test
Phylogeny based metrics Phylogeny based metrics
PD whole tree
unifracunifrac gunifrac g full treeunweighted unifracunweighted unifrac full treeweighted normalized unifracweighted unifrac
∗Alpha diversity metrics for both the tools; §beta diversity available metrics; †parametric and non-parametric statistical tests available by default in the twotools.
2.2.4. Diversity Analysis. To obtain an overall diversity anal-ysis for subsequent comparative and statistical evaluations,we merged the BIOM tables generated by both MG-RASTand QIIME in a unique biom table, using a script includedin QIIME (merge otu tables.py). Thus, we obtained a uniquematrix table that reports all the taxonomic assignmentsand their frequencies obtained by each of the two tools.Subsequently, the diversity analysis was computed on themerged biom table using the related scripts included inQIIME.
QIIME alpha diversity analysis script (alpha rarefaction.py) performs the rarefaction analysis by subsampling theOTUs biom table on the basis of aminimumrarefaction depthvalue that is chosen by the user depending on the minimum
number of sequences/sample obtained. For our subset, thisvalue was 1,195.Then, using differentmetrics, the alpha diver-sity was computed for each rarefied OTUs table (Table 2).We used three “non-phylogeny-based” metrics, namely, theobserved species, chao 1 [24], and the Shannon index [25].Finally, all the results obtained from each rarefiedOTUs tableare joined in three global alpha diversity measures, one foreach metric used, and converted in .html plots in order tohandle and visualize the data.
QIIME beta diversity analysis script (beta diversitythrough plots.py), after the rarefaction evaluation (this stepcorresponds to the first step of the alpha diversity workflow),computes the beta diversity on the rarefiedOTUs tables usingdifferent metrics (Table 2). We used the Bray-Curtismetric
4 BioMed Research International
02468
101214
MG-RASTQIIME
Actin
obacteria
Firm
icutes
Fusobacteria
Proteobacteria
Teneric
utes
Num
ber o
f16
S O
TUs (×103)
Bacteroidetes
(a)
1
10
100
1,000
10,000
MG-RASTQIIME
Actin
obacteria
Firm
icutes
Fusobacteria
Proteobacteria
Teneric
utes
Num
ber o
f16
S O
TUs
Bacteroidetes
(b)
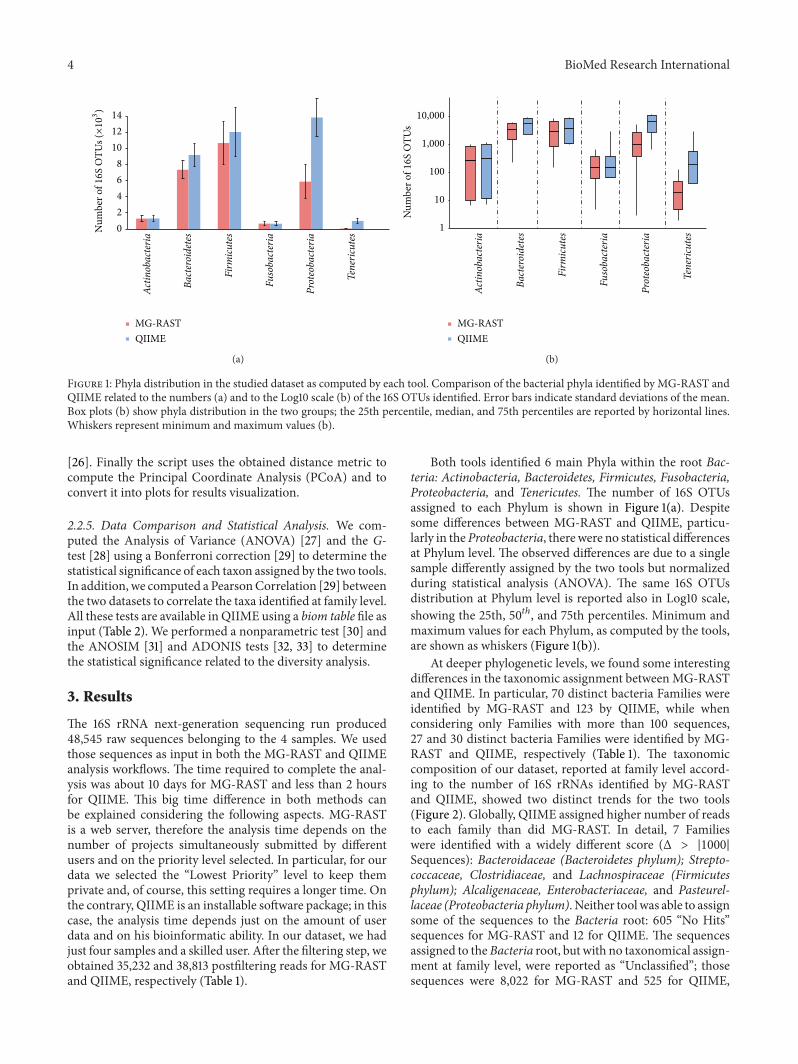
Figure 1: Phyla distribution in the studied dataset as computed by each tool. Comparison of the bacterial phyla identified by MG-RAST andQIIME related to the numbers (a) and to the Log10 scale (b) of the 16S OTUs identified. Error bars indicate standard deviations of the mean.Box plots (b) show phyla distribution in the two groups; the 25th percentile, median, and 75th percentiles are reported by horizontal lines.Whiskers represent minimum and maximum values (b).
[26]. Finally the script uses the obtained distance metric tocompute the Principal Coordinate Analysis (PCoA) and toconvert it into plots for results visualization.
2.2.5. Data Comparison and Statistical Analysis. We com-puted the Analysis of Variance (ANOVA) [27] and the G-test [28] using a Bonferroni correction [29] to determine thestatistical significance of each taxon assigned by the two tools.In addition, we computed a PearsonCorrelation [29] betweenthe two datasets to correlate the taxa identified at family level.All these tests are available in QIIME using a biom table file asinput (Table 2). We performed a nonparametric test [30] andthe ANOSIM [31] and ADONIS tests [32, 33] to determinethe statistical significance related to the diversity analysis.
3. Results
The 16S rRNA next-generation sequencing run produced48,545 raw sequences belonging to the 4 samples. We usedthose sequences as input in both the MG-RAST and QIIMEanalysis workflows. The time required to complete the anal-ysis was about 10 days for MG-RAST and less than 2 hoursfor QIIME. This big time difference in both methods canbe explained considering the following aspects. MG-RASTis a web server, therefore the analysis time depends on thenumber of projects simultaneously submitted by differentusers and on the priority level selected. In particular, for ourdata we selected the “Lowest Priority” level to keep themprivate and, of course, this setting requires a longer time. Onthe contrary, QIIME is an installable software package; in thiscase, the analysis time depends just on the amount of userdata and on his bioinformatic ability. In our dataset, we hadjust four samples and a skilled user. After the filtering step, weobtained 35,232 and 38,813 postfiltering reads for MG-RASTand QIIME, respectively (Table 1).
Both tools identified 6 main Phyla within the root Bac-teria: Actinobacteria, Bacteroidetes, Firmicutes, Fusobacteria,Proteobacteria, and Tenericutes. The number of 16S OTUsassigned to each Phylum is shown in Figure 1(a). Despitesome differences between MG-RAST and QIIME, particu-larly in theProteobacteria, therewere no statistical differencesat Phylum level. The observed differences are due to a singlesample differently assigned by the two tools but normalizedduring statistical analysis (ANOVA). The same 16S OTUsdistribution at Phylum level is reported also in Log10 scale,showing the 25th, 50𝑡ℎ, and 75th percentiles. Minimum andmaximum values for each Phylum, as computed by the tools,are shown as whiskers (Figure 1(b)).
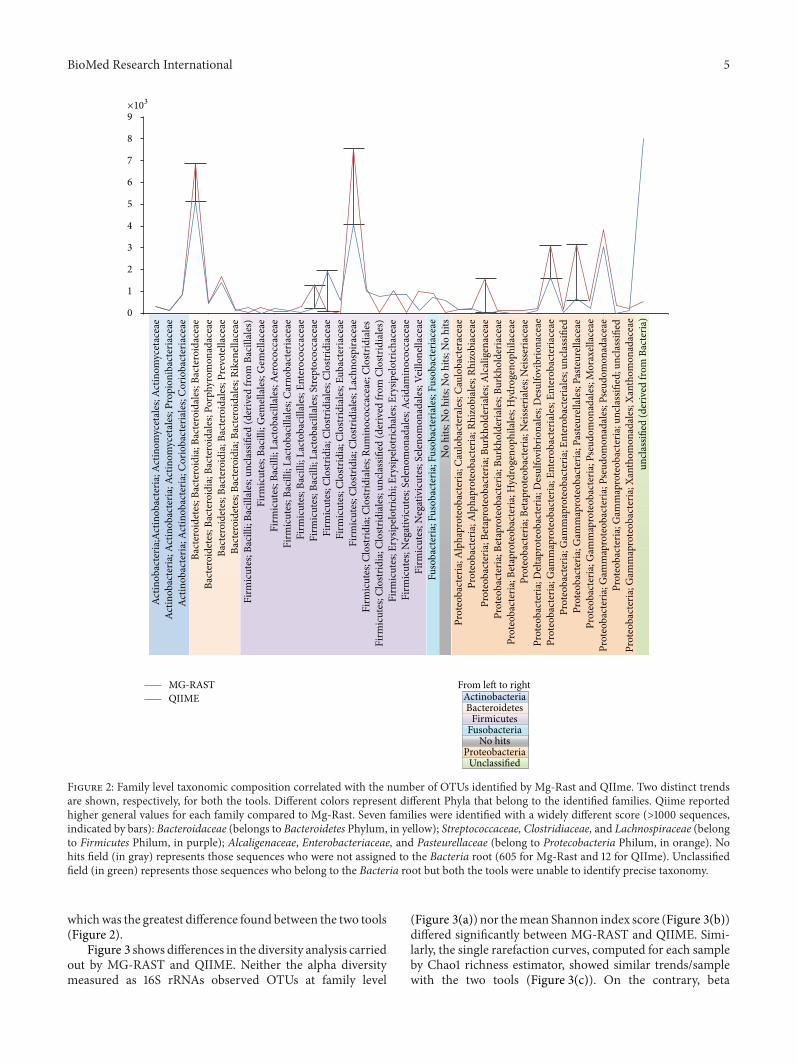
At deeper phylogenetic levels, we found some interestingdifferences in the taxonomic assignment betweenMG-RASTand QIIME. In particular, 70 distinct bacteria Families wereidentified by MG-RAST and 123 by QIIME, while whenconsidering only Families with more than 100 sequences,27 and 30 distinct bacteria Families were identified by MG-RAST and QIIME, respectively (Table 1). The taxonomiccomposition of our dataset, reported at family level accord-ing to the number of 16S rRNAs identified by MG-RASTand QIIME, showed two distinct trends for the two tools(Figure 2). Globally, QIIME assigned higher number of readsto each family than did MG-RAST. In detail, 7 Familieswere identified with a widely different score (Δ > |1000|Sequences): Bacteroidaceae (Bacteroidetes phylum); Strepto-coccaceae, Clostridiaceae, and Lachnospiraceae (Firmicutesphylum); Alcaligenaceae, Enterobacteriaceae, and Pasteurel-laceae (Proteobacteria phylum). Neither toolwas able to assignsome of the sequences to the Bacteria root: 605 “No Hits”sequences for MG-RAST and 12 for QIIME. The sequencesassigned to theBacteria root, but with no taxonomical assign-ment at family level, were reported as “Unclassified”; thosesequences were 8,022 for MG-RAST and 525 for QIIME,
BioMed Research International 5
Act
inob
acte
ria;
Act
inob
acte
ria;
Act
inom
ycet
ales
; Act
inom
ycet
acea
e A
ctin
obac
teri
a; A
ctin
obac
teri
a; A
ctin
omyc
etal
es; P
ropi
onib
acte
riac
eae
Act
inob
acte
ria;
Act
inob
acte
ria;
Cor
ioba
cter
iale
s; C
orio
bact
eria
ceae
Ba
cter
oide
tes;
Bact
eroi
dia;
Bac
tero
idal
es; B
acte
roid
acea
e Ba
cter
oide
tes;
Bact
eroi
dia;
Bac
tero
idal
es; P
orph
yrom
onad
acea
e Ba
cter
oide
tes;
Bact
eroi
dia;
Bac
tero
idal
es; P
revo
tella
ceae
Ba
cter
oide
tes;
Bact
eroi
dia;
Bac
tero
idal
es; R
iken
ella
ceae
Fi
rmic
utes
; Bac
illi;
Baci
llale
s; un
clas
sified
(der
ived
from
Bac
illal
es)
Fuso
bact
eria
; Fus
obac
teri
a; F
usob
acte
rial
es; F
usob
acte
riac
eae
Firm
icut
es; B
acill
i; G
emel
lale
s; G
emel
lace
ae
Firm
icut
es; B
acill
i; La
ctob
acill
ales
; Aer
ococ
cace
ae
Firm
icut
es; B
acill
i; La
ctob
acill
ales
; Ent
eroc
occa
ceae
Fi
rmic
utes
; Bac
illi;
Lact
obac
illal
es; C
arno
bact
eria
ceae
Firm
icut
es; B
acill
i; La
ctob
acill
ales
; Str
epto
cocc
acea
e Fi
rmic
utes
; Clo
stri
dia;
Clo
stri
dial
es; C
lost
ridi
acea
e Fi
rmic
utes
; Clo
stri
dia;
Clo
stri
dial
es; E
ubac
teri
acea
e Fi
rmic
utes
; Clo
stri
dia;
Clo
stri
dial
es; L
achn
ospi
race
ae
Firm
icut
es; C
lost
ridi
a; C
lost
ridi
ales
; Rum
inoc
occa
ceae
; Clo
stri
dial
esFi
rmic
utes
; Clo
stri
dia;
Clo
stri
dial
es; u
ncla
ssifi
ed (d
eriv
ed fr
om C
lost
ridi
ales
) Fi
rmic
utes
; Ery
sipel
otric
hi; E
rysip
elot
richa
les;
Erys
ipel
otric
hace
ae
Firm
icut
es; N
egat
ivic
utes
; Sel
enom
onad
ales
; Aci
dam
inoc
occa
ceae
Fi
rmic
utes
; Neg
ativ
icut
es; S
elen
omon
adal
es; V
eillo
nella
ceae
No
hits
; No
hits
; No
hits
; No
hits
Pr
oteo
bact
eria
; Alp
hapr
oteo
bact
eria
; Cau
loba
cter
ales
; Cau
loba
cter
acea
e Pr
oteo
bact
eria
; Alp
hapr
oteo
bact
eria
; Rhi
zobi
ales
; Rhi
zobi
acea
e Pr
oteo
bact
eria
; Bet
apro
teob
acte
ria;
Bur
khol
deri
ales
; Alc
alig
enac
eae
Prot
eoba
cter
ia; B
etap
rote
obac
teri
a; B
urkh
olde
rial
es; B
urkh
olde
riac
eae
Prot
eoba
cter
ia; B
etap
rote
obac
teria
; Hyd
roge
noph
ilale
s; H
ydro
geno
phila
ceae
Pr
oteo
bact
eria
; Bet
apro
teob
acte
ria;
Nei
sser
iale
s; N
eiss
eria
ceae
Pr
oteo
bact
eria
; Del
tapr
oteo
bact
eria
; Des
ulfo
vibr
iona
les;
Des
ulfo
vibr
iona
ceae
Prot
eoba
cter
ia; G
amm
apro
teob
acte
ria;
Ent
erob
acte
rial
es; E
nter
obac
teri
acea
e Pr
oteo
bact
eria
; Gam
map
rote
obac
teri
a; E
nter
obac
teria
les;
uncl
assifi
ed
Prot
eoba
cter
ia; G
amm
apro
teob
acte
ria;
Pas
teur
ella
les;
Past
eure
llace
ae
Prot
eoba
cter
ia; G
amm
apro
teob
acte
ria;
Pse
udom
onad
ales
; Mor
axel
lace
ae
Prot
eoba
cter
ia; G
amm
apro
teob
acte
ria;
Pse
udom
onad
ales
; Pse
udom
onad
acea
e
Prot
eoba
cter
ia; G
amm
apro
teob
acte
ria;
unc
lass
ified
; unc
lass
ified
Pr
oteo
bact
eria
; Gam
map
rote
obac
teri
a; X
anth
omon
adal
es; X
anth
omon
adac
eae
un
clas
sified
(der
ived
from
Bac
teria
)0
1
2
3
4
5
6
7
8
9
MG-RASTQIIME Actinobacteria
BacteroidetesFirmicutes
FusobacteriaNo hits
ProteobacteriaUnclassified
From le to right
×103
Figure 2: Family level taxonomic composition correlated with the number of OTUs identified by Mg-Rast and QIIme. Two distinct trendsare shown, respectively, for both the tools. Different colors represent different Phyla that belong to the identified families. Qiime reportedhigher general values for each family compared to Mg-Rast. Seven families were identified with a widely different score (>1000 sequences,indicated by bars): Bacteroidaceae (belongs to Bacteroidetes Phylum, in yellow); Streptococcaceae, Clostridiaceae, and Lachnospiraceae (belongto Firmicutes Philum, in purple); Alcaligenaceae, Enterobacteriaceae, and Pasteurellaceae (belong to Protecobacteria Philum, in orange). Nohits field (in gray) represents those sequences who were not assigned to the Bacteria root (605 for Mg-Rast and 12 for QIIme). Unclassifiedfield (in green) represents those sequences who belong to the Bacteria root but both the tools were unable to identify precise taxonomy.
whichwas the greatest difference found between the two tools(Figure 2).
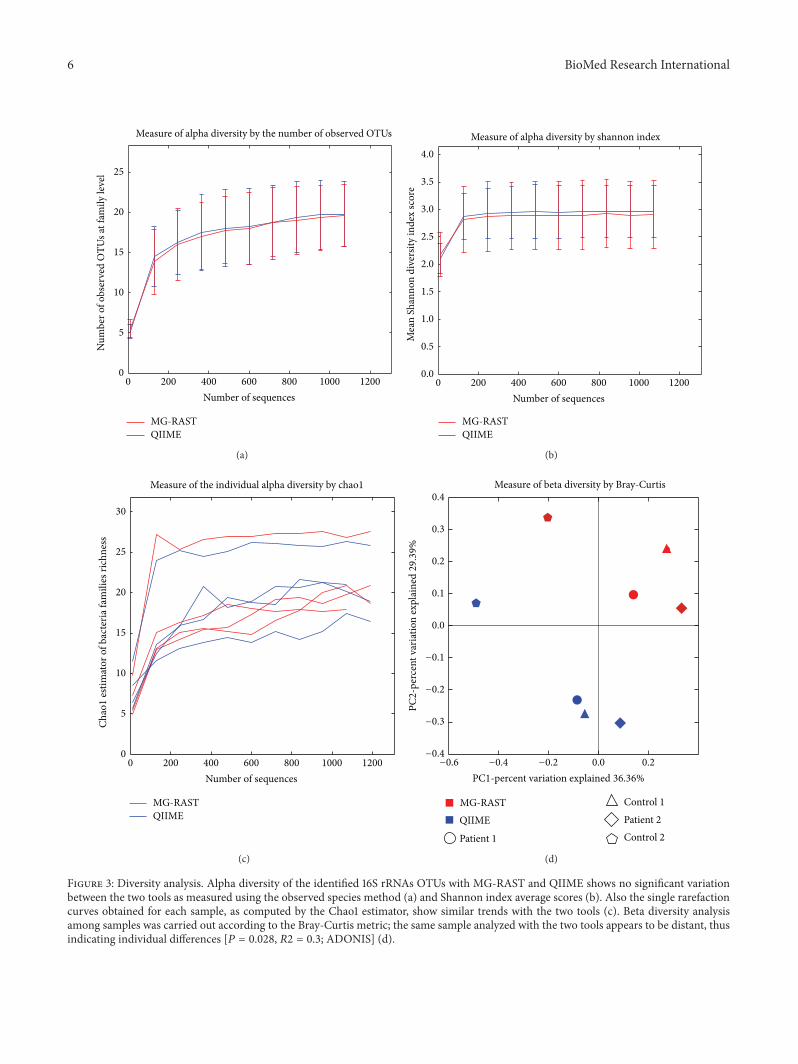
Figure 3 shows differences in the diversity analysis carriedout by MG-RAST and QIIME. Neither the alpha diversitymeasured as 16S rRNAs observed OTUs at family level
(Figure 3(a)) nor themean Shannon index score (Figure 3(b))differed significantly between MG-RAST and QIIME. Simi-larly, the single rarefaction curves, computed for each sampleby Chao1 richness estimator, showed similar trends/samplewith the two tools (Figure 3(c)). On the contrary, beta
6 BioMed Research International
Num
ber o
f obs
erve
d O
TUs a
t fam
ily le
vel
0
5
10
15
20
25
0
200 400 600 800 1000 1200
Number of sequences
Measure of alpha diversity by the number of observed OTUs
MG-RASTQIIME
(a)
0 200 400 600 800 1000 1200
Number of sequences
Measure of alpha diversity by shannon index
MG-RASTQIIME
4.0
3.5
3.0
2.5
2.0
1.5
1.0
0.5
0.0
Mea
n Sh
anno
n di
vers
ity in
dex
scor
e
(b)
Measure of the individual alpha diversity by chao1
0 200 400 600 800 1000 1200
Number of sequences
MG-RASTQIIME
30
25
20
15
10
5
0
Chao
1 es
timat
or o
f bac
teria
fam
ilies
rich
ness
(c)
Patient 1
Control 1
Measure of beta diversity by Bray-Curtis
Control 2Patient 2
MG-RASTQIIME
0.4
0.3
0.2
0.2
0.0
0.0
0.1
−0.1
−0.2
−0.2
−0.3
−0.4
−0.4−0.6
PC2
-per
cent
var
iatio
n ex
plai
ned29.39
%
PC1-percent variation explained 36.36%
(d)
Figure 3: Diversity analysis. Alpha diversity of the identified 16S rRNAs OTUs with MG-RAST and QIIME shows no significant variationbetween the two tools as measured using the observed species method (a) and Shannon index average scores (b). Also the single rarefactioncurves obtained for each sample, as computed by the Chao1 estimator, show similar trends with the two tools (c). Beta diversity analysisamong samples was carried out according to the Bray-Curtis metric; the same sample analyzed with the two tools appears to be distant, thusindicating individual differences [𝑃 = 0.028, 𝑅2 = 0.3; ADONIS] (d).
BioMed Research International 7
16S rRNA next generation sequencing data
Experienced user Less experienced user
QIIME pipeline MG-RAST pipeline
16S rRNAs detection,
clustering, andidentification
(OTUs picking)
16S rRNAs detection,
clustering, andidentification
(BlAT)
High resolutiontaxonomic classification(BIOM file generation)
Diversityanalysis
(alpha and beta diversity)
Statistical analysis
Low resolution taxonomic classification(BIOM file generation)
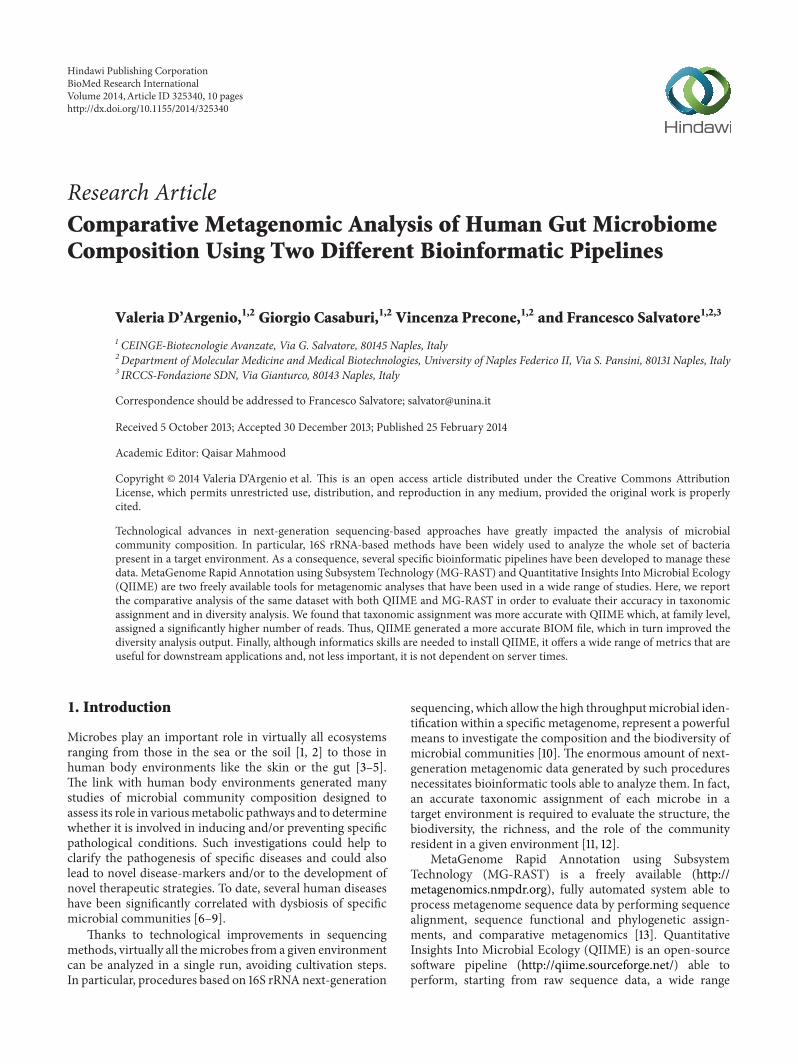
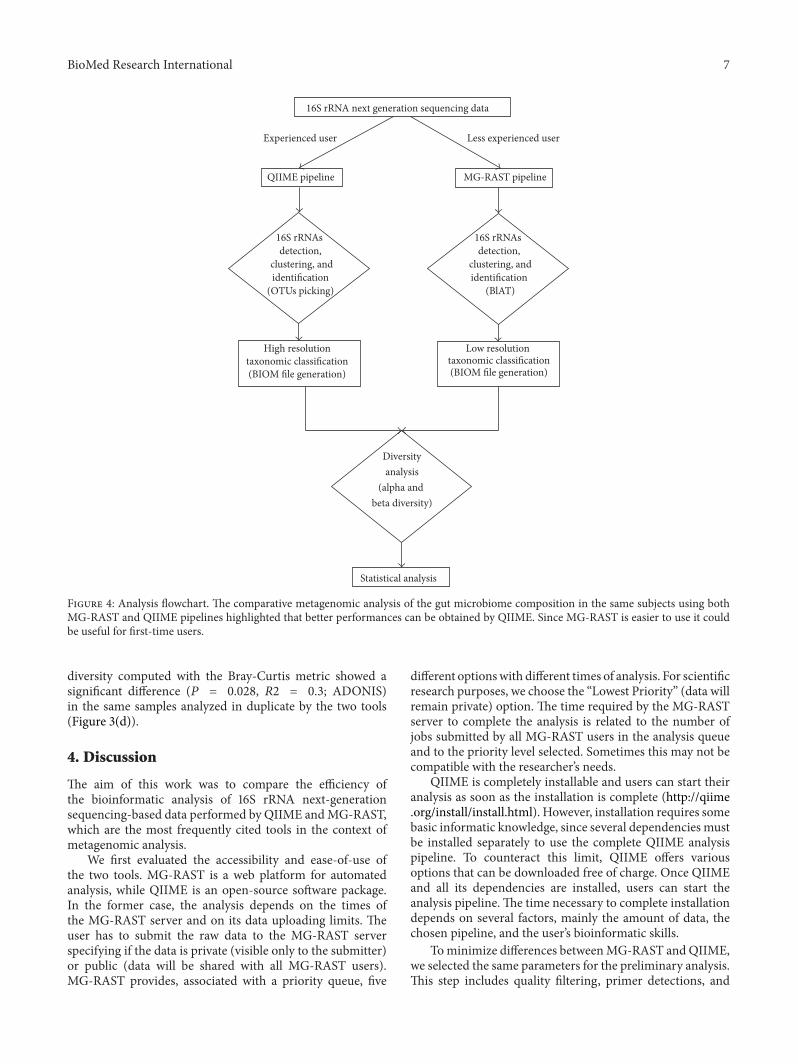
Figure 4: Analysis flowchart. The comparative metagenomic analysis of the gut microbiome composition in the same subjects using bothMG-RAST and QIIME pipelines highlighted that better performances can be obtained by QIIME. Since MG-RAST is easier to use it couldbe useful for first-time users.
diversity computed with the Bray-Curtis metric showed asignificant difference (𝑃 = 0.028, 𝑅2 = 0.3; ADONIS)in the same samples analyzed in duplicate by the two tools(Figure 3(d)).
4. Discussion
The aim of this work was to compare the efficiency ofthe bioinformatic analysis of 16S rRNA next-generationsequencing-based data performed by QIIME andMG-RAST,which are the most frequently cited tools in the context ofmetagenomic analysis.
We first evaluated the accessibility and ease-of-use ofthe two tools. MG-RAST is a web platform for automatedanalysis, while QIIME is an open-source software package.In the former case, the analysis depends on the times ofthe MG-RAST server and on its data uploading limits. Theuser has to submit the raw data to the MG-RAST serverspecifying if the data is private (visible only to the submitter)or public (data will be shared with all MG-RAST users).MG-RAST provides, associated with a priority queue, five
different optionswith different times of analysis. For scientificresearch purposes, we choose the “Lowest Priority” (data willremain private) option. The time required by the MG-RASTserver to complete the analysis is related to the number ofjobs submitted by all MG-RAST users in the analysis queueand to the priority level selected. Sometimes this may not becompatible with the researcher’s needs.
QIIME is completely installable and users can start theiranalysis as soon as the installation is complete (http://qiime.org/install/install.html). However, installation requires somebasic informatic knowledge, since several dependencies mustbe installed separately to use the complete QIIME analysispipeline. To counteract this limit, QIIME offers variousoptions that can be downloaded free of charge. Once QIIMEand all its dependencies are installed, users can start theanalysis pipeline.The time necessary to complete installationdepends on several factors, mainly the amount of data, thechosen pipeline, and the user’s bioinformatic skills.
Tominimize differences betweenMG-RAST andQIIME,we selected the same parameters for the preliminary analysis.This step includes quality filtering, primer detections, and
8 BioMed Research International
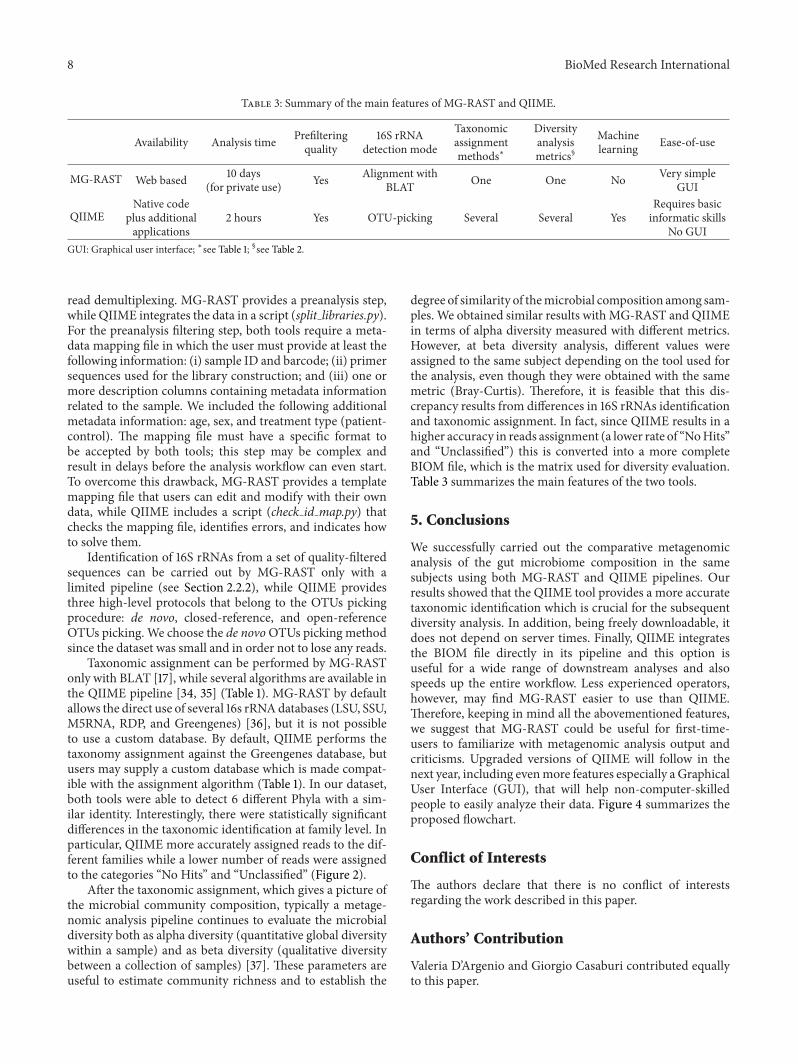
Table 3: Summary of the main features of MG-RAST and QIIME.
Availability Analysis time Prefilteringquality
16S rRNAdetection mode
Taxonomicassignmentmethods∗
Diversityanalysismetrics§
Machinelearning Ease-of-use
MG-RAST Web based 10 days(for private use) Yes Alignment with
BLAT One One No Very simpleGUI
QIIMENative code
plus additionalapplications
2 hours Yes OTU-picking Several Several YesRequires basicinformatic skills
No GUIGUI: Graphical user interface; ∗see Table 1; §see Table 2.
read demultiplexing. MG-RAST provides a preanalysis step,while QIIME integrates the data in a script (split libraries.py).For the preanalysis filtering step, both tools require a meta-data mapping file in which the user must provide at least thefollowing information: (i) sample ID and barcode; (ii) primersequences used for the library construction; and (iii) one ormore description columns containing metadata informationrelated to the sample. We included the following additionalmetadata information: age, sex, and treatment type (patient-control). The mapping file must have a specific format tobe accepted by both tools; this step may be complex andresult in delays before the analysis workflow can even start.To overcome this drawback, MG-RAST provides a templatemapping file that users can edit and modify with their owndata, while QIIME includes a script (check id map.py) thatchecks the mapping file, identifies errors, and indicates howto solve them.
Identification of 16S rRNAs from a set of quality-filteredsequences can be carried out by MG-RAST only with alimited pipeline (see Section 2.2.2), while QIIME providesthree high-level protocols that belong to the OTUs pickingprocedure: de novo, closed-reference, and open-referenceOTUs picking. We choose the de novoOTUs picking methodsince the dataset was small and in order not to lose any reads.
Taxonomic assignment can be performed by MG-RASTonly with BLAT [17], while several algorithms are available inthe QIIME pipeline [34, 35] (Table 1). MG-RAST by defaultallows the direct use of several 16s rRNAdatabases (LSU, SSU,M5RNA, RDP, and Greengenes) [36], but it is not possibleto use a custom database. By default, QIIME performs thetaxonomy assignment against the Greengenes database, butusers may supply a custom database which is made compat-ible with the assignment algorithm (Table 1). In our dataset,both tools were able to detect 6 different Phyla with a sim-ilar identity. Interestingly, there were statistically significantdifferences in the taxonomic identification at family level. Inparticular, QIIME more accurately assigned reads to the dif-ferent families while a lower number of reads were assignedto the categories “No Hits” and “Unclassified” (Figure 2).
After the taxonomic assignment, which gives a picture ofthe microbial community composition, typically a metage-nomic analysis pipeline continues to evaluate the microbialdiversity both as alpha diversity (quantitative global diversitywithin a sample) and as beta diversity (qualitative diversitybetween a collection of samples) [37]. These parameters areuseful to estimate community richness and to establish the
degree of similarity of themicrobial composition among sam-ples. We obtained similar results with MG-RAST and QIIMEin terms of alpha diversity measured with different metrics.However, at beta diversity analysis, different values wereassigned to the same subject depending on the tool used forthe analysis, even though they were obtained with the samemetric (Bray-Curtis). Therefore, it is feasible that this dis-crepancy results from differences in 16S rRNAs identificationand taxonomic assignment. In fact, since QIIME results in ahigher accuracy in reads assignment (a lower rate of “NoHits”and “Unclassified”) this is converted into a more completeBIOM file, which is the matrix used for diversity evaluation.Table 3 summarizes the main features of the two tools.
5. Conclusions
We successfully carried out the comparative metagenomicanalysis of the gut microbiome composition in the samesubjects using both MG-RAST and QIIME pipelines. Ourresults showed that the QIIME tool provides a more accuratetaxonomic identification which is crucial for the subsequentdiversity analysis. In addition, being freely downloadable, itdoes not depend on server times. Finally, QIIME integratesthe BIOM file directly in its pipeline and this option isuseful for a wide range of downstream analyses and alsospeeds up the entire workflow. Less experienced operators,however, may find MG-RAST easier to use than QIIME.Therefore, keeping in mind all the abovementioned features,we suggest that MG-RAST could be useful for first-time-users to familiarize with metagenomic analysis output andcriticisms. Upgraded versions of QIIME will follow in thenext year, including evenmore features especially a GraphicalUser Interface (GUI), that will help non-computer-skilledpeople to easily analyze their data. Figure 4 summarizes theproposed flowchart.
Conflict of Interests
The authors declare that there is no conflict of interestsregarding the work described in this paper.
Authors’ Contribution
Valeria D’Argenio and Giorgio Casaburi contributed equallyto this paper.
BioMed Research International 9
Acknowledgments
The authors thank Jean Ann Gilder (Scientific Communi-cation srl., Naples, Italy) for editing the text and VittorioLucignano, CEINGE-Biotecnologie Avanzate, for technicalassistance related to graphics. This work was supportedby Grant L.5/95 (to Francesco Salvatore) from RegioneCampania; Grant PS 35-126/Ind and Grant PON01 02589(MICROMAP) 2012 from the Ministry of University andResearch (both to Francesco Salvatore); and Grant RF-2010-2318372 from theMinistry ofHealth (to Francesco Salvatore).
References
[1] B. J. Baker, C. S. Sheik, C. A. Taylor et al., “Community trans-criptomic assembly reveals microbes that contribute to deep-sea carbon and nitrogen cycling,” The ISME Journal, vol. 7, pp.1962–1973, 2013.
[2] L. Philippot, J.M. Raaijmakers, P. Lemanceau, andW.H. van derPutten, “Going back to the roots: the microbial ecology of therhizosphere,”Nature Reviews Microbiology, vol. 11, pp. 789–799,2013.
[3] P. L. Zeeuwen, M. Kleerebezem, H. M. Timmerman, and J.Schalkwijk, “Microbiome and skin diseases,” Current Opinionin Allergy and Clinical Immunology, vol. 13, pp. 514–520, 2013.
[4] I. Cho and M. J. Blaser, “The human microbiome: at theinterface of health and disease,” Nature Reviews Genetics, vol.13, no. 4, pp. 260–270, 2012.
[5] S. Fang and R.M. Evans, “Microbiology: wealthmanagement inthe gut,” Nature, vol. 500, pp. 538–539, 2013.
[6] D. Knights, K. G. Lassen, and R. J. Xavier, “Advances in inflam-matory bowel disease pathogenesis: linking host genetics andthe microbiome,” Gut, vol. 62, pp. 1505–1510, 2013.
[7] N. Wu, X. Yang, R. Zhang et al., “Dysbiosis signature of fecalmicrobiota in colorectal cancer patients,”Microbial Ecology, vol.66, pp. 462–470, 2013.
[8] V. D’Argenio, V. Precone, G. Casaburi et al., “An altered gutmicrobiome profile in a child affected by Crohn’s diseasenormalized after nutritional therapy,” American Journal ofGastroenterology, vol. 108, pp. 851–852, 2013.
[9] E. S. Gollwitzer and B. J. Marsland, “Microbiota abnormalitiesin inflammatory airway diseases—potential for therapy,” Phar-macology &Therapeutics, vol. 141, no. 1, pp. 32–39, 2014.
[10] B. S. Kim, Y. S. Jeon, and J. Chun, “Current status and futurepromise of the humanmicrobiome,” Pediatric Gastroenterology,Hepatology & Nutrition, vol. 16, pp. 71–79, 2013.
[11] P. Ribeca and G. Valiente, “Computational challenges ofsequence classification in microbiomic data,” Briefings in Bioin-formatics, vol. 12, no. 6, pp. 614–625, 2011.
[12] C. De Filippo, M. Ramazzotti, P. Fontana, and D. Cavalieri,“Bioinformatic approaches for functional annotation and path-way inference in metagenomics data,” Briefings in Bioinformat-ics, vol. 13, pp. 696–710, 2012.
[13] F. Meyer, D. Paarmann, M. D’Souza et al., “The metagenomicsRAST server—a public resource for the automatic phylogeneticand functional analysis of metagenomes,” BMC Bioinformatics,vol. 9, article 386, 2008.
[14] J. G. Caporaso, J. Kuczynski, J. Stombaugh et al., “QIIMEallows analysis of high-throughput community sequencingdata,” Nature Methods, vol. 7, no. 5, pp. 335–336, 2010.
[15] H. Teeling and F. O. Glockner, “Current opportunities andchallenges in microbial metagenome analysis: a bioinformaticperspective,” Briefings in Bioinformatics, vol. 13, pp. 728–742,2012.
[16] J. A. Navas-Molina, J. M. Peralta-Sanchez, A. Gonzalez et al.,“Advancing our understanding of the humanmicrobiome usingQIIME,”Methods in Enzymology, vol. 531, pp. 371–444, 2013.
[17] W. J. Kent, “BLAT—the BLAST-like alignment tool,” GenomeResearch, vol. 12, no. 4, pp. 656–664, 2002.
[18] E. Pruesse, C. Quast, K. Knittel et al., “SILVA: a comprehensiveonline resource for quality checked and aligned ribosomal RNAsequence data compatible with ARB,” Nucleic Acids Research,vol. 35, no. 21, pp. 7188–7196, 2007.
[19] R. C. Edgar, “Search and clustering orders of magnitude fasterthan BLAST,” Bioinformatics, vol. 26, no. 19, pp. 2460–2461,2010.
[20] D. McDonald, M. N. Price, J. Goodrich et al., “An improvedGreengenes taxonomy with explicit ranks for ecological andevolutionary analyses of bacteria and archaea,” The ISMEJournal, vol. 6, no. 3, pp. 610–618, 2012.
[21] D.McDonald, J. C. Clemente, J. Kuczynski et al., “TheBiologicalObservation Matrix (BIOM) format or: how I learned to stopworrying and love the ome-ome,” GigaScience, vol. 1, no. 1,article 7, 2012.
[22] S. F. Altschul,W. Gish,W.Miller, E.W.Myers, and D. J. Lipman,“Basic local alignment search tool,” Journal ofMolecular Biology,vol. 215, no. 3, pp. 403–410, 1990.
[23] Q. Wang, G. M. Garrity, J. M. Tiedje, and J. R. Cole, “NaıveBayesian classifier for rapid assignment of rRNA sequencesinto the new bacterial taxonomy,” Applied and EnvironmentalMicrobiology, vol. 73, no. 16, pp. 5261–5267, 2007.
[24] T. C. J. Hill, K. A. Walsh, J. A. Harris, and B. F. Moffett, “Usingecological diversity measures with bacterial communities,”FEMS Microbiology Ecology, vol. 43, no. 1, pp. 1–11, 2003.
[25] I. F. Spellerberg and P. J. Fedor, “A tribute to Claude-Shannon(1916-2001) and a plea for more rigorous use of species richness,species diversity and the “Shannon-Wiener” Index,” GlobalEcology & Biogeography, vol. 12, no. 3, pp. 177–179, 2003.
[26] E. W. Beals, “Bray-Curtis ordination: an effective strategy foranalysis of multivariate ecological data,” Advances in EcologicalResearch, vol. 14, pp. 1–55, 1984.
[27] A. Field, “Analysis of variance (ANOVA),” in Encyclopedia ofMeasurement and Statistics, N. Salkind, Ed., SAGEPublications,Thousand Oaks, Calif, USA, 2007.
[28] R. R. Sokal and F. J. Rohlf, Biometry: The Principles and Practiceof Statistics in Biological Research, Freeman, New York, NY,USA, 1981.
[29] H. Abdi “Bonferroni and Sidak corrections for multiple com-parisons,” in Encyclopedia of Measurement and Statistics, N. J.Salkind, Ed., SAGE Publications, Thousand Oaks, Calif, USA,2007.
[30] V. Bagdonavicius, J. Kruopis, andM. S.Nikulin,Non-ParametricTests for Complete Data, JohnWiley & Sons, London, UK, 2011.
[31] P. G. N. Digby and R. A. Kempton, Multivariate Analysis ofEcological Communities, Chapman & Hall, London, UK, 1987.
[32] M. J. Anderson, “A new method for non-parametric multivari-ate analysis of variance,” Austral Ecology, vol. 26, no. 1, pp. 32–46, 2001.
[33] M. J. Crawley, Statistical Computing: An Introduction to DataAnalysis Using S-PLUS, John Wiley & Sons, 2002.
10 BioMed Research International
[34] P. D. Schloss, S. L. Westcott, T. Ryabin et al., “Introduc-ing mothur: open-source, platform-independent, community-supported software for describing and comparing microbialcommunities,”Applied and EnvironmentalMicrobiology, vol. 75,no. 23, pp. 7537–7541, 2009.
[35] D. A. W. Soergel, N. Dey, R. Knight, and S. E. Brenner, “Selec-tion of primers for optimal taxonomic classification of environ-mental 16S rRNA gene sequences,”The ISME Journal, vol. 6, pp.1440–1444, 2012.
[36] C. Quast, E. Pruesse, P. Yilmaz et al., “The SILVA ribosomalRNA gene database project: improved data processing andweb-based tools,” Nucleic Acids Research, vol. 41, pp. D590–D596,2013.
[37] R. H. Whittaker, “Evolution and measurement of species diver-sity,” Taxon, vol. 21, pp. 213–251, 1972.

Submit your manuscripts athttp://www.hindawi.com
Hindawi Publishing Corporationhttp://www.hindawi.com Volume 2014
Anatomy Research International
PeptidesInternational Journal of
Hindawi Publishing Corporationhttp://www.hindawi.com Volume 2014
Hindawi Publishing Corporation http://www.hindawi.com
International Journal of
Volume 2014
Zoology
Hindawi Publishing Corporationhttp://www.hindawi.com Volume 2014
Molecular Biology International
GenomicsInternational Journal of
Hindawi Publishing Corporationhttp://www.hindawi.com Volume 2014
The Scientific World JournalHindawi Publishing Corporation http://www.hindawi.com Volume 2014
Hindawi Publishing Corporationhttp://www.hindawi.com Volume 2014
BioinformaticsAdvances in
Marine BiologyJournal of
Hindawi Publishing Corporationhttp://www.hindawi.com Volume 2014
Hindawi Publishing Corporationhttp://www.hindawi.com Volume 2014
Signal TransductionJournal of
Hindawi Publishing Corporationhttp://www.hindawi.com Volume 2014
BioMed Research International
Evolutionary BiologyInternational Journal of
Hindawi Publishing Corporationhttp://www.hindawi.com Volume 2014
Hindawi Publishing Corporationhttp://www.hindawi.com Volume 2014
Biochemistry Research International
ArchaeaHindawi Publishing Corporationhttp://www.hindawi.com Volume 2014
Hindawi Publishing Corporationhttp://www.hindawi.com Volume 2014
Genetics Research International
Hindawi Publishing Corporationhttp://www.hindawi.com Volume 2014
Advances in
Virolog y
Hindawi Publishing Corporationhttp://www.hindawi.com
Nucleic AcidsJournal of
Volume 2014
Stem CellsInternational
Hindawi Publishing Corporationhttp://www.hindawi.com Volume 2014
Hindawi Publishing Corporationhttp://www.hindawi.com Volume 2014
Enzyme Research
Hindawi Publishing Corporationhttp://www.hindawi.com Volume 2014
International Journal of
Microbiology