Embed Size (px)
Citation preview

Research ArticleConjugate Heat Transfer Study of Combined Impingement andShowerhead Film Cooling Near NGV Leading Edge
Dileep Chandran and Bhamidi Prasad
Thermal Turbomachines Laboratory Department of Mechanical Engineering Indian Institute of Technology MadrasChennai 600036 India
Correspondence should be addressed to Bhamidi Prasad prasadiitmacin
Received 30 May 2014 Revised 20 September 2014 Accepted 4 October 2014
Academic Editor Giovanni Carlomagno
Copyright copy 2015 D Chandran and B Prasad This is an open access article distributed under the Creative Commons AttributionLicense which permits unrestricted use distribution and reproduction in any medium provided the original work is properlycited
A computational and experimental study is carried out on the leading edge region of a typical gas turbine NGV cooled by acombination of impingement and showerhead film cooling A detailed flow and conjugate heat transfer study has revealed thecomplex flow structure owing to the coolant-mainstream interaction and the influence of vane material thermal conductivity Thelocal effectiveness values obtained by the computations agreed well with the experimental data from IR thermographyThe effect ofblowing ratio on the overall effectiveness is found to be strongly dependent on the vane material conductivityThe effect of blowingratio is also found to be different towards the pressure and suction sides of the stagnation region However the overall effectivenessis found to decrease by about 12 and 6 for low and high conducting materials respectively with an increase in mainstreamReynolds number from Re = 48 times 105 to 144 times 105
1 Introduction
Heat transfer studies related to the leading edge coolingof a nozzle guide vane (NGV) are of great relevance andinterest for the design of modern gas turbines as it isthe part mostly exposed to the hot gases An improperunderstanding and design of cooling configuration in thisregionmay cause very high thermal stress andmay ultimatelylead to the failure of the blade Hence the effects of film holeconfiguration blowing ratio coolant to mainstream densityratio Reynolds number andmainstream turbulence intensityon heat transfer near the leading edge have been of immenseinterest to researchers
Most of the earlier investigations were reported by com-paring the adiabatic effectiveness (120578) on the leading edgesurface which is defined as follows
120578 =
119879119898minus 119879aw119879119898minus 119879119888
(1)
Here 119879119898 119879119888 and 119879aw are the mainstream coolant and the
adiabatic wall temperatures respectively Mehendale and Je-Chin [1] used a cylindrical model with two rows of filmholes for studying the effect of Reynolds number and film
hole spacing on the adiabatic effectiveness They found anincrease in effectiveness value with increase in Reynoldsnumber A similar study was conducted by Ou and Rivir[2 3] by adding an extra row of film holes at the stagnationregion and concluded that the Reynolds number effect issignificant at low blowing ratios and high turbulence Theeffect of mainstream turbulence was also investigated byFunazaki et al [4] for cylindrical as well as diffuser holesThey reported a reduction in spanwise effectiveness withincrease in turbulence for both holes Similar investigationswere conducted to find the effect of different hole shapes[5 6] inclinations and injection angles [7] on the adiabaticeffectiveness distribution
The emphasis on the conjugate heat transfer (CHT)technique is reported in recent studies where a wide variationwas found in the temperature distribution over a vane underadiabatic and conjugate conditions [8 9] Montomoli et al[10] carried out CHT calculations on a cylindrical leadingedge and prescribed the use of high conductivity materialfor turbine nozzles Their model contained two rows of filmholes on either side of the stagnation region and a row ofimpingement holes inside Moritz et al [11] used a CHT
Hindawi Publishing CorporationInternational Journal of Rotating MachineryVolume 2015 Article ID 315036 13 pageshttpdxdoiorg1011552015315036
2 International Journal of Rotating Machinery
Hub Tip
55∘ 45∘ 0∘
55∘ 30∘
30∘
45∘
SH SS2 PS2
SS1 PS2
(a)
Impingement insert
Interaction surface SH
SS1
SS2
PS2
PS1
(b)
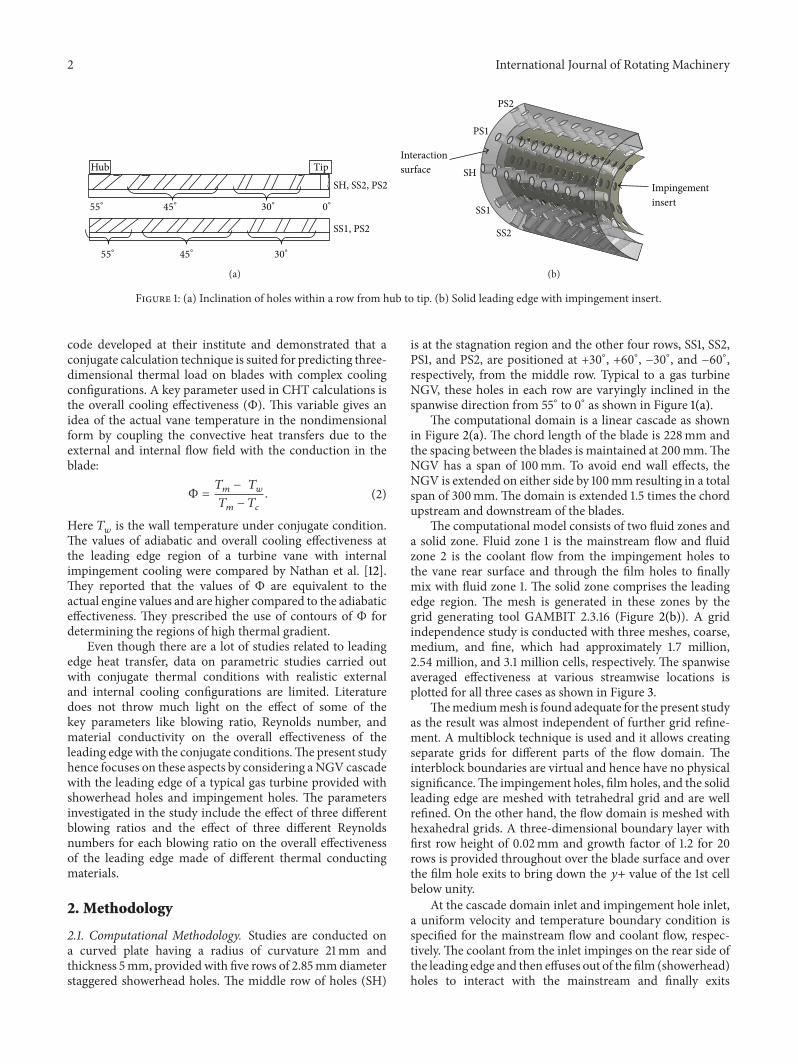
Figure 1 (a) Inclination of holes within a row from hub to tip (b) Solid leading edge with impingement insert
code developed at their institute and demonstrated that aconjugate calculation technique is suited for predicting three-dimensional thermal load on blades with complex coolingconfigurations A key parameter used in CHT calculations isthe overall cooling effectiveness (Φ) This variable gives anidea of the actual vane temperature in the nondimensionalform by coupling the convective heat transfers due to theexternal and internal flow field with the conduction in theblade
Φ =
119879119898minus 119879119908
119879119898minus 119879119888
(2)
Here 119879119908is the wall temperature under conjugate condition
The values of adiabatic and overall cooling effectiveness atthe leading edge region of a turbine vane with internalimpingement cooling were compared by Nathan et al [12]They reported that the values of Φ are equivalent to theactual engine values and are higher compared to the adiabaticeffectiveness They prescribed the use of contours of Φ fordetermining the regions of high thermal gradient
Even though there are a lot of studies related to leadingedge heat transfer data on parametric studies carried outwith conjugate thermal conditions with realistic externaland internal cooling configurations are limited Literaturedoes not throw much light on the effect of some of thekey parameters like blowing ratio Reynolds number andmaterial conductivity on the overall effectiveness of theleading edge with the conjugate conditionsThe present studyhence focuses on these aspects by considering aNGV cascadewith the leading edge of a typical gas turbine provided withshowerhead holes and impingement holes The parametersinvestigated in the study include the effect of three differentblowing ratios and the effect of three different Reynoldsnumbers for each blowing ratio on the overall effectivenessof the leading edge made of different thermal conductingmaterials
2 Methodology
21 Computational Methodology Studies are conducted ona curved plate having a radius of curvature 21mm andthickness 5mm provided with five rows of 285mmdiameterstaggered showerhead holes The middle row of holes (SH)
is at the stagnation region and the other four rows SS1 SS2PS1 and PS2 are positioned at +30∘ +60∘ minus30∘ and minus60∘respectively from the middle row Typical to a gas turbineNGV these holes in each row are varyingly inclined in thespanwise direction from 55∘ to 0∘ as shown in Figure 1(a)
The computational domain is a linear cascade as shownin Figure 2(a) The chord length of the blade is 228mm andthe spacing between the blades is maintained at 200mmTheNGV has a span of 100mm To avoid end wall effects theNGV is extended on either side by 100mm resulting in a totalspan of 300mmThe domain is extended 15 times the chordupstream and downstream of the blades
The computational model consists of two fluid zones anda solid zone Fluid zone 1 is the mainstream flow and fluidzone 2 is the coolant flow from the impingement holes tothe vane rear surface and through the film holes to finallymix with fluid zone 1 The solid zone comprises the leadingedge region The mesh is generated in these zones by thegrid generating tool GAMBIT 2316 (Figure 2(b)) A gridindependence study is conducted with three meshes coarsemedium and fine which had approximately 17 million254 million and 31 million cells respectively The spanwiseaveraged effectiveness at various streamwise locations isplotted for all three cases as shown in Figure 3
Themediummesh is found adequate for the present studyas the result was almost independent of further grid refine-ment A multiblock technique is used and it allows creatingseparate grids for different parts of the flow domain Theinterblock boundaries are virtual and hence have no physicalsignificanceThe impingement holes film holes and the solidleading edge are meshed with tetrahedral grid and are wellrefined On the other hand the flow domain is meshed withhexahedral grids A three-dimensional boundary layer withfirst row height of 002mm and growth factor of 12 for 20rows is provided throughout over the blade surface and overthe film hole exits to bring down the 119910+ value of the 1st cellbelow unity
At the cascade domain inlet and impingement hole inleta uniform velocity and temperature boundary condition isspecified for the mainstream flow and coolant flow respec-tively The coolant from the inlet impinges on the rear side ofthe leading edge and then effuses out of the film (showerhead)holes to interact with the mainstream and finally exits
International Journal of Rotating Machinery 3
Mainstream exit
Mainstreaminlet
Cool
ant i
nlet
(a) (b)
Figure 2 (a) Computational domain (b) Mesh generated in the domain
03
04
05
06
07
08
0 10 20 30 40 50 60 70
Coarse Medium Fine
minus70 minus60 minus50 minus40 minus30 minus20 minus10
120572
Φ
Figure 3 Grid independence study
the domain through a constant pressure outlet A turbulentintensity of 1 is imposed at the mainstream inlet and 5at the impingement inlet A periodic boundary condition isgiven at the top and bottom wall of the domain so as togenerate an infinite cascade model
Three-dimensional conjugate heat transfer problem isformulated with the following assumptions (i) the fluid isincompressible (ii) the fluid properties are constant (iii)radiation and natural convection are neglected (iv) viscousdissipation is absent and (v) the flow is steadyThe governingequations used for simulation are the Reynolds averagedcontinuity momentum and the energy equations along withthe equations for modeling the turbulence quantities
Boundary conditions used for the present study are asfollows
(i) no slip boundary condition at wall V119908= 0
(ii) mainstream velocity inlet (V119898) corresponding to dif-
ferent Reynolds numbers and 119879 = 308K
(iii) coolant inlet condition 119879 = 288K and V119888calculated
from blowing ratio (119872 = 120588119888V119888120588119898V119898)
(iv) outlet boundary condition 119875 = 119875amb at exit(v) conjugate boundary condition at solid plate
119879119904= 119879119891 119896119904
120597119879119904
120597119910
= 119896119891
120597119879119891
120597119910
at wall (3)
(vi) adiabatic condition at the other walls
120597119879119904
120597119910
= 0 at wall (4)
The governing equations are solved using the finite vol-ume based Fluent14 solver from the Ansys14 package The120581-120596 SST model is adopted for turbulence modeling Thismodel was recommended by Panda and Prasad [13] whoconducted a combined impingement-film cooling study ona flat plate where the 120581-120596 SST model is reported to havepredicted the flow interactions very well and matched withtheir experimental results A standard pressure interpolationscheme is used The SIMPLE algorithm is used for pressure-velocity coupling A second-order upwind scheme is usedfor momentum and energy and a first-order upwind schemefor 120581 and 120596 The solution is considered to be convergedwhen the maximum residual value is of the order of 10minus5for continuity momentum and turbulence equations and10minus6 for the energy equation Further the spanwise averagedeffectiveness values at various streamwise locations on theNGV are constantly monitored so that the variation will bewithin 01 for 500 consecutive iterations
For the present study two curved plates one with a lowerthermal conductivity (Material A with 119896 = 02WmK) and
4 International Journal of Rotating Machinery
1
2
3
4 5
76
8
9
10
11
12
1315
16141018
1119
1117
AITFITΦ800
Figure 4 Experimental test rig 1 DCmotor 75 kW 1500 rpm 2 centrifugal air blower 14m3s 3 diffuser 4 honeycomb 5 mesh 6 settlingchamber 7 converging duct 8 test section 9 cascade 10 rotameter 11 flow control valve 12 heat exchanger 13 condensing unit 14thermostatic expansion valve 15 condenser 16 refrigerant compressor 17 bypass 18 air dryer and 19 reciprocating air compressor
another with a higher thermal conductivity (Material B with119896 = 149WmK) are considered The effect of blowing ratiois studied at119872 = 1 15 and 2 by varying the coolant velocitymaintaining the mainstream velocity constant The effect ofReynolds number is studied at each blowing ratio by varyingboth mainstream and coolant velocity Reynolds number isvaried by Re
1= 48 times 105 Re
2= 96 times 105 and Re
3= 144 times
105 for each blowing ratio and its effect on the overalleffectiveness on the leading edge external surface is studied
22 Experimental Methodology The computational model isvalidated with the experimental results obtained from thestudy carried out on a five-vane cascade in the laboratorylinear cascade wind tunnel The center vane in the cascadeis instrumented for static pressure and temperature mea-surements The cascade and vane dimensions are exactly thesame as those of the computational model The experimentalsetup is shown in Figure 4 The mainstream air is suppliedby a centrifugal blower A uniform flow is ensured by thehoneycomb screens and meshes provided in the settlingchamber as shown in the figureThe secondary air is suppliedby a reciprocating air compressor and is cooled using atube-in-tube heat exchanger The coolant is fed into thetwo impingement inserts fitted inside the NGV The coolantimpinges on the rear side of the vane and effuses out of theshowerhead and film holes
The two-dimensionality and periodicity of the cascadeare established using flow measurements at the inlet and exitof the cascade A pitot probe is traversed at the inlet of thecascade and a calibrated five-hole pressure probe at the exitThe static pressure on the vane is measured using static tapsput at various streamwise locationsThe air is bled from thesestatic taps using 25mm brass tubes
The steady state temperature on the external surfaceof the NGV made of Material B is measured by infraredthermography using a FLIR A315 camera The entire leadingedge is mapped by placing the camera at three differentlocations (as shown in Figure 5(b)) so as to bring down themaximumviewing angle between the camera and the normalsurface below 35∘ This is done to avoid any variance indirectional emissivity as previous study [14] has reported that
the emissivity is nearly constant from the normal direction(0∘) to 45∘ Germanium IR windows are placed on thetunnel walls at all these locations The camera is connectedto the computer using a gigabit Ethernet cable and theFLIR Tools+ software enable triggering synchronizationand focus of the camera remotely Various corrections likeatmosphere transmission correction emissivity correctionreflected temperature correction external windows correc-tion and optics transmission correction are made beforetaking the image In situ calibration of the IR camera is doneby simultaneously recording the temperatures obtained fromcalibrated thermocouples that are stuck at various locationson the NGV The NGV along with the thermocouples arepainted with flat black to achieve uniform emissivity of about097 The emissivity is then corrected by comparing the IRand thermocouple readings even though the magnitude ofthis correction is as low as 001 Lines of equal length aredrawn at various streamwise locations on the vane surfaceThe weighted averages of temperature in all these lines areobtained
3 Data Reduction Planes
The lines drawn on the leading edge as in Figure 6 from120572 = minus70 to +70 at every 5-degree interval are used for datareduction The spanwise averaged effectiveness discussed inthe later sections is obtained by areaweighted average of theselines Wall-normal planes from the leading edge surface arealso generated with respect to these lines
4 Results and Discussion
41 Validation The computational model is validated bycomparing the static pressure and effectiveness distributionon the vane obtained computationally with experiments (Fig-ures 7 and 8)The NGV used in the experiment has the prop-erties of Material B The static pressure is measured at Re =29times10
5 For validation the coolant inlet condition is changedfrom velocity boundary condition at the impingement holeinlet to mass flow boundary condition at the impingementinsert inlet tomatch the experimental conditionThis coolant
International Journal of Rotating Machinery 5
From blowerMeasurement blade
Position 1
Position 2
Position 3 Position 4
Ge IR window
IR
270m
270m
930m
(a)
Position 3
(Maximum viewing angleon the pressure side)
(Maximum viewing angleon the suction side)
Position 4
Position 2
35∘
35∘
30∘
30∘
Lead
ing
edge
(b)
Figure 5 Surface temperature mapping using IR thermography (a) general cascade setup and (b) focusing the leading edge
120572 = 70
120572 = 0
120572 = minus70
Suction side
Pressureside surface
Hub Tip
surface
Figure 6 Data reduction planes
mass flow distributed to the showerhead holes as well asfour rows of film holes Hence the minimum blowing ratio(119872min) corresponds tominimummass flow rate at the inlet ofimpingement insert which is sufficient enough for the coolantto come out of all the showerhead and film holes This valueis found out computationally by trial and error Later whileconducting experiments at this minimum coolant mass flowit is ensured that the coolant comes out of all the film holesby traversing a thermocouple probe
Figures 7 and 8 show that a good correspondence existsbetween the experimental and computational results therebyvalidating the computational methodology including themesh and the turbulence model adopted for the computa-tions Figure 8 shows the IR image at the leading edge andcomparison of the experimental and computational values ofthe spanwise averaged effectiveness The comparison madefor three blowing ratios shows a good agreement between
the experimental and computational values with a maximumdifference of about 6 which is well within the acceptablerange
42 Flow and Temperature Patterns The flow and heattransfer characteristics are different on the pressure andsuction sides of the leading edge for different blowing ratiosFigure 9 shows the path lines coloured by nondimensionaltemperature emerging from all rows of holes
Figure 9 shows the coolant emerging out of the fiverows of showerhead holes located at the leading edge Thesestreamlines are coloured by nondimensional temperature120579 At low blowing ratio (119872 = 1) the coolant comingout of the stagnation row of showerhead holes is gettingequally distributed towards the pressure and suction sidesSymmetry is seen with respect to the stagnation row Butas the blowing ratio increases more coolant tends to flow
6 International Journal of Rotating Machinery
02
0 02 04 06 08 1 12
CFD Experiment
minus2
minus4
minus6
minus8
minus10
minus12
minus14
minus16
Re = 29 times 105
Cp
xCh
Figure 7 Comparison of static pressure
04
05
06
07
0 10 20 30 40 50 60 70
CFD
Suction sidePressure side
minus70 minus60 minus50 minus40 minus30 minus20 minus10
04
05
06
07
04
05
06
07
0 10 20 30 40 50 60 70minus70 minus60 minus50 minus40 minus30 minus20 minus10
0 10 20 30 40 50 60 70minus70 minus60 minus50 minus40 minus30 minus20 minus10
M=1timesM
min
Experiment
M=15timesM
min
M=2timesM
min
04
05
06
07
04
05
06
07
04
05
06
07
Streamwise angle 120572
Streamwise angle 120572
Streamwise angle 120572
Span
wise
aver
aged
ΦSp
anw
ise av
erag
edΦ
Span
wise
aver
aged
Φ
Φ
Φ
Φ
Figure 8 Comparison of spanwise averaged overall effectiveness and the IR images
towards the pressure side compared to the suction side Thisis prominent at the highest blowing ratio119872 = 2 The areasnot covered by the streamlines are the ones having the lowesteffectiveness Hence pressure side surface has better coolantspread at higher blowing ratios The reason behind this isexplained with the help of Figure 10
Figure 10 shows the streamlines coloured by nondimen-sional temperature (120579) drawn in wall-normal planes L1 L2and L3 (shown at the top) at different locations along thestagnation row Planes are drawn just after the first hole justbefore the second hole and through the second hole of the SHrow It can be seen that after hole 1 counter rotating vortexpair (CRVP) is formed for119872 = 15 and119872 = 2 In the case of119872 = 1 CRVP are not formed and this is characterized by anattached flowThe strength of the CRVP formed for119872 = 2 is
higher compared to119872 = 15 From the second plane which isjust before the second hole it is evident from the colour of thestreamlines that the coolant from the 1st hole is not reachingthe second hole for119872 = 1 case Hence it is not affecting thecoolant flow from the second hole As a result the coolantstreamlines from the 2nd hole are getting equally distributedto pressure and suction sides as shown in plane L3 But this isnot the case for higher blowing ratios where the coolant fromthe 1st hole is affecting that from the 2nd hole At119872 = 15even though the coolant from the 1st hole reaches the 2ndhole the strength of the CRVP developed from the 1st holedrastically reduces by the time it reaches the 2ndholeThoughweak there is a small current towards the pressure side as canbe seen from plane L2 Hence it can be noticed from plane L3that the coolant is flowing slightly more towards the pressure
International Journal of Rotating Machinery 7
M = 1M = 15 M = 2
Tip
Hub Suction Pressure
1
095
09
085
08
075
07
065
06
055
05
045
04
035
03
025
02
015
01
005
0
120579
Figure 9 Pathlines coloured by nondimensional temperature emerging out of the showerhead holes
M=1
M=15
M=2
Plane L1 Plane L2 Plane L3
1st hole 2nd hole
L1 L2 L3
1
095
09
085
08
075
07
065
06
055
05
045
04
035
03
025
02
015
01
005
0
120579
Suction Pressure
Figure 10 Stream lines coloured by 120579 drawn at wall-normal planes at various locations in the SH row of the leading edge
side as compared to suction side This phenomenon is evenmore prominent for the highest blowing ratio (119872 = 2) It canbe seen from plane L2 that for the flow approaching hole 2CRVPhas considerable strength A strong vortex formation is
seen on the pressure side and it induces a low pressure in thatregion This causes the coolant coming out of the 2nd hole toflow towards the pressure side as can be seen from plane L3This is the reason why the coolant effusing out of SH row is
8 International Journal of Rotating Machinery
Pressure side
Suction side
SH
PS1
PS2
SS1SS2
65∘
50∘
20∘
5∘
minus20∘
minus35∘
minus50∘
minus65∘
35∘
65∘ 50∘ 20∘ 5∘ minus20∘ minus35∘ minus50∘ minus65∘35∘
120572 = 5∘
10950908508075070650605505045040350302502015010050
10950908508075070650605505045040350302502015010050
10950908508075070650605505045040350302502015010050
minus5∘
65∘ 50∘ 20∘ 5∘ minus20∘ minus35∘ minus50∘ minus65∘35∘ minus5∘
65∘ 50∘ 20∘ 5∘ minus20∘ minus35∘ minus50∘ minus65∘35∘ minus5∘
Suction surface Pressure surface
M=1
M=15
M=2
Φ
Φ
Φ
Figure 11 Contours of nondimensional temperature (120579) plotted on wall-normal planes at different streamwise locations for various blowingratios at Re
1
distributed more towards the pressure side at higher blowingratios
Figure 11 shows the nondimensional temperature contourplotted at different wall-normal planes perpendicular to theleading edge (along the data reduction lines Figure 6) Asseen in the figure the contours at plusmn5∘ and plusmn20∘ depictthat the coolant coming out of SH spreads more on to thepressure side surface than the suction side The contour at35∘ and 50∘ on the suction surface shows the coolant flowdownstream of the SS1 row and vividly shows that with
increase in blowing ratio the coolant jet gets lifted off morefrom the surface and in turn entraps the hot mainstreambeneath it whereas on to the pressure side at 35∘ and 50∘plots depict an improvement in the concentration of coolantwith increase in blowing ratio and a denser and thicker coverof coolant is observed On the contrary downstream of SS2and PS2 rows a better spread and attachment of coolant onto the surface are seen for 119872 = 1 When the blowing ratioincreases the coolant is slightly getting detached and hotmainstream is seen penetrating the region between the film
International Journal of Rotating Machinery 9
1
095
09
085
08
075
07
065
06
055
05
045
04
035
03
025
02
015
01
005
0
M=1
M=15
M=2
Φ
Figure 12 Streamlines coloured by nondimensional temperature (120579) showing coolant-mainstream interaction at the leading edge stagnationregion (120572 = 0) for blowing ratios (a)119872 = 1 (b)119872 = 15 and (c)119872 = 2
holes Moreover at higher blowing ratios the coolant is seento be gathering near the tip region while a meager amountof coolant is present near the hub This is mainly due to thehigh spanwise inclination of showerhead holes near the hubAt higher blowing ratios the coolant effusing out of theseholes attains enough momentum to push the coolant comingout of adjacent holes towards the tip This phenomenon canbe better understood with the aid of Figure 12 which showsthe coolant-mainstream interaction at the stagnation region(120572 = 0) It is also observed that for all rows of holes thecoolant effusing out of the holes closer to the tip region whichare less inclined to the spanwise direction shows a highertendency to liftoff from the surface The tendency to liftoffalso decreases when moved towards the hub region as theholes gradually get more inclined to the spanwise direction
43 Effect of Blowing Ratio on Effectiveness The effect ofblowing ratio on the overall effectiveness is different forsuction and pressure side surface of the leading edge as canbe seen from Figure 13 Whilst the effectiveness appears toimprove with blowing ratio on the pressure side surface itis seen to decrease on the suction side surface The abovequalitative explanation can be justified with the spanwiseaveraged effectiveness plot at various streamwise angles fromthe stagnation region as shown in Figure 14
On the pressure side surface downstream of SH andPS1 holes the effectiveness is least for 119872 = 1 for allthree Reynolds numbersMoreover the effectiveness gradientbetween two rows of holes is also highest for119872 = 1 whereasit is least for119872 = 2 especially downstream of SH row Thisis due to the uniform and wide coverage of coolant in thatregion at 119872 = 2 as discussed from Figure 11 At 119872 = 15and119872 = 2 the effectiveness curves are almost overlappingdownstream of PS1 for all Reynolds numbers After PS2 onthe contrary effectiveness is seen decreasing with increase
in blowing ratio This is vivid from Re1 whereas for higher
Reynolds numbers the effectiveness curves in this region arealmost overlapping for119872 = 1 and 15
On the suction side surface the effectiveness is least for119872 = 2 throughout due to the coolant jet getting liftedoff from the surface as explained in the previous sectionThe effectiveness gradient between two rows of holes is alsofound highest for 119872 = 2 case and least for 119872 = 1Effectiveness distribution at 119872 = 1 and 119872 = 15 is almostoverlapping downstream of SH and SS1 holes for Re
1and
Re3cases For Re
2case the effectiveness values are slightly
reduced at 119872 = 15 and the distribution moves close to119872 = 2 Downstream of SS2 the effectiveness distributionis distinct and the trend is similar for all Reynolds numbersThe effectiveness is decreasing with increasing blowing ratioThe effectiveness distribution at119872 = 15 is in between thatof 119872 = 1 and 119872 = 2 at almost throughout the leadingedge region and at all Reynolds numbers Hence when areaweighted average of the whole surface is taken the overalleffectiveness is higher for 119872 = 15 But the gradient ineffectiveness between the pressure and suction side is least for119872 = 1 case
The averaged values of effectiveness are found quite highfor Material B because the effect of impingement cooling isfelt more due to the high conductivity of the material Fromthe effectiveness contours in Figure 13 it is very clear that thedistribution is uniform throughout the leading edge regioncompared to Material A Due to lateral conduction withinthe plate gradients in the effectiveness between rows of holesare very small Even though the variation is less zones ofrelatively higher effectiveness can be found in the pressureside surface of the leading edge compared to the suction sidesurface Further insight into this can be obtained from theplot of spanwise averaged effectiveness from Figure 14
The effect of blowing ratio though prevalent is consid-erably smaller compared to the low conductivity material
10 International Journal of Rotating Machinery
Material A Material B
Tip
1
2
M=1
M=15
M=2
Hub
06
07
010150202503
04
05
06
07
0808509
Suction Pressure Suction Pressure
Φ
Re1 = 48 times 105 Re2 = 96 times 105 Re3 = 144 times 105 Re1 = 48 times 105 Re2 = 96 times 105 Re3 = 144 times 105
035
045
055
065
075
010150202503
04
05
06
07
0808509
035
045
055
065
075
010150202503
04
05
06
07
0808509
Φ
Φ
Φ
035
045
055
065
075
058059
061062063064065066
068069
071072073074075076077
067
06
07
Φ
058059
061062063064065066
068069
071072073074075076077
067
06
07
Φ
058059
061062063064065066
068069
071072073074075076077
067
Figure 13 Overall effectiveness contours at all three blowing ratios and Reynolds numbers for Materials A and B
At 119872 = 15 the effectiveness values are relatively highcompared to other blowing ratios and this difference is moredistinct at Re
1 At higher Reynolds numbers this difference
in effectiveness values is found to be reduced On the suctionside surface downstream of the SH row the effectivenesscurves at all blowing ratios are overlapping at Re
2and Re
3
and the same is found in the downstream region of SS1 at Re3
Downstream of PS2 the effectiveness is highest at119872 = 15at all Reynolds numbers whereas downstream of SS2 thehighest effectiveness found at119872 = 15 gradually changes to119872 = 1 as the Reynolds number increases A close observation
of the plot reveals that the effectiveness values on the pressureside surface are least at 119872 = 1 and those on the suctionsurface are least at 119872 = 2 at all Reynolds numbers Henceeffectiveness at 119872 = 15 is comparatively more consistentand higher for119872 = 15 The same scenario was seen for lowconductivity material too
44 Effect of Reynolds Number on Effectiveness For MaterialA it can be seen from Figure 15 that effectiveness decreaseswith increase in Reynolds number for all blowing ratios at allregions of the leading edge except the region between SH and
International Journal of Rotating Machinery 11
Table 1 Area weighted averaged values of effectiveness at interac-tion and target surface
Material A Material Binteractionsurface
Targetsurface
interactionsurface
Targetsurface
Re1 0475 0923 0719 0737Re2 0442 0934 07 0725Re3 0405 094 0678 0709
0203040506070809
0203040506070809
0203040506070809
PS2 PS1 SH SS1 SS2
0 10 20 30 40 50 60 70minus70 minus60 minus50 minus40 minus30 minus20 minus10
0 10 20 30 40 50 60 70minus70 minus60 minus50 minus40 minus30 minus20 minus10
0 10 20 30 40 50 60 70minus70 minus60 minus50 minus40 minus30 minus20 minus10
Φ
Φ
Φ
Suction sidePressure side 120572
Suction sidePressure side 120572
Suction sidePressure side 120572
Re1 = 48 times 105
Re2 = 96 times 105
Re3 = 144 times 105
B M = 1
B M = 15
B M = 2
A M = 1
A M = 15
A M = 2
Figure 14 Spanwise averaged overall effectiveness at variousstreamwise angles 120572
PS1 In that region the value is higher for effectiveness at Re2
and this is later explained with Figures 16 and 17 ForMaterialB the effectiveness is decreasing with increase in Reynoldsnumber throughout the leading edge for all blowing ratios
Table 1 shows the area weighted average of effectivenessat the outer and inner surface of the leading edge Interactionsurface is where the coolant coming out of the film holesinteracts with the mainstream and target surface is wherethe coolant impinges It can be clearly seen that as Reynoldsnumber increases effectiveness decreases at the interaction
0203040506070809
0203040506070809
PS2 PS1 SS2SS1SH
0 10 20 30 40 50 60 70minus70 minus60 minus50 minus40 minus30 minus20 minus10
0 10 20 30 40 50 60 70minus70 minus60 minus50 minus40 minus30 minus20 minus10
0 10 20 30 40 50 60 70minus70 minus60 minus50 minus40 minus30 minus20 minus10
Φ
Φ
0203040506070809
Φ
M = 1
M = 15
Suction sidePressure side 120572
Suction sidePressure side 120572
Suction sidePressure side 120572
M = 2
BRe1BRe2BRe3
ARe1ARe2ARe3
Figure 15 Spanwise averaged overall effectiveness at variousstreamwise angles 120572
0200400600800
1000 PS2 PS1 SS2SS1SH
0 10 20 30 40 50 60 70minus70 minus60 minus50 minus40 minus30 minus20 minus10
Suction sidePressure side 120572
Nu
Re1 Re2 Re3
Figure 16 Spanwise averagedNusselt number distribution at119872 = 1for Material A
surface whereas it increases at the target surface for MaterialA This shows that with increase in Reynolds number theheat transfer at both interaction and target surfaces increasesThe values for Material B however show a decrease ineffectiveness at both the interaction and target surfaces withincrease in Reynolds number This shows that even thoughheat transfer rate increases at both the surfaces the increase inheat transfer at the interaction surface ismore dominantThis
12 International Journal of Rotating Machinery
10908070605040302010
120579
(a)
10908070605040302010
120579
(b)10908070605040302010
120579
(c)
10908070605040302010
120579
(d)
Figure 17 Streamlines coloured by nondimensional temperature at a wall-normal plane 5∘ downstream SH
increase in heat transfer with Reynolds number is evidentfrom the spanwise averaged Nusselt number plot shown inFigure 16
An overlapping is seen in the graph in the immediatedownstream region of SH row towards the pressure sidewhere the heat transfer is found low for Re
2 This is mainly
attributed to the cold spots as indicated in Figure 13 Flowbehavior in this region is studied for Re
1and Re
2by drawing
pathlines (Figure 17) in a plane drawn 5 degrees downstreamof SH row on the pressure side surface Figures 17(a) and17(b) correspond to the location of spot 1 of Figure 13 atRe1and Re
2 respectively Similarly Figures 17(c) and 17(d)
correspond to the location of spot 2 on Figure 13 at Re1and
Re2 respectively It can be seen that the region between the
two eddies is occupied by the mainstream in the cases ofRe1 whereas in the cases of Re
2 that region is filled by the
coolant effusing out of the adjacent hole and hence results inimproved effectiveness
5 Conclusions
A computational and experimental study is carried out onthe leading edge of a typical gas turbine nozzle guide vaneThe effect of blowing ratio and Reynolds number is studiedby considering two materials Material A (119896 = 02WmK)and Material B (119896 = 149WmK) of low and high ther-mal conductivity respectively The heat transfer and overalleffectiveness distributions at the leading edge are extensivelystudied and reported These results are explained with theaid of pathlines nondimensional temperature contours andNusselt number distributions describing the mainstream-coolant interaction at the exit of film holes The salientconclusions drawn from the study are as follows
(1) The computational turbine NGV cascade model isvalidated with the experimental data as a closeagreement in static pressure distribution and over-all effectiveness distribution on the vane surface isobtained
(2) The overall effectiveness value of Material B is higherand its distribution in streamwise and spanwise direc-tions is more uniform compared to Material A owing
to the high conductivity of the former The suddenpeaks and valleys appearing in the effectiveness distri-bution of Material A disappear in the case of MaterialB owing to the high lateral diffusion within the plate
(3) The effect of blowing ratio is different for the pressureside and suction side of the stagnation line Asthe blowing ratio increases the coolant tends todistribute more towards the pressure surface Hencewith increase in blowing ratio effectiveness increasedon the pressure side and decreased on the suctionside For Material A the effectiveness is higher on thepressure side at119872 = 2 and on the suction side at119872 =1When considering thewhole blade amore uniformdistribution of overall effectiveness between pressureand suction side was noticed at 119872 = 1 resultingin less thermal gradient whereas the averaged overalleffectiveness value is higher at119872 = 15 For MaterialB the overall effectiveness value is higher at119872 = 15throughout the leading edge For both Materials Aand B when blowing ratio was increased from119872 = 1to 119872 = 2 the region with higher effectiveness wasseen getting shifted from hub to tip
(4) An increase in Reynolds number has showed anincrease in heat transfer on both the external andinternal sides of the leading edge even though exter-nal heat transfer is more dominant An increase inReynolds number at a particular blowing ratio resultsin a decrease in the overall effectiveness throughoutthe leading edge forMaterial BWhileMaterial A alsoexhibits similar behavior at most of the leading edgea slight disagreement is seen in the region between SHand PS1 rows where the maximum effectiveness is atRe2owing to the formation of cold spots
Nomenclature
119862ℎ Chord length m119862119901 Coefficient of pressure (119901 minus 119901
119898)(05 lowast 120588 lowast V2
119898)
ℎ Heat transfer coefficient 11987610158401015840(119879aw minus 119879119908)Wm2-K119896 Thermal conductivity (Wm-K)119909 Streamwise direction m
International Journal of Rotating Machinery 13
119872 Blowing ratio (120588119888V119888120588119898V119898)
Nu Nusselt number ℎ119862ℎ119896
Nu Spanwise averaged Nu119901 Static pressure119876
10158401015840 Total surface heat flux Wm2Re Reynolds number (120588V
119890119862ℎ120583)
119879 Temperature (K)V Velocity magnitudeSST Shear stress transport
Greek120579 Nondimensional temperature (119879 minus 119879
119888)(119879119898minus 119879119888)
120578 Adiabatic effectiveness (119879119898minus 119879aw)(119879119898 minus 119879119888)
Φ Overall cooling effectiveness (119879119898minus 119879119908)(119879119898minus 119879119888)
Φ Spanwise averaged Φ120572 Streamwise angle with respect to stagnation line (∘)120588 Fluid density120581 Turbulent kinetic energy m2s2120596 Specific dissipation rate 1sec120583 Coefficient of viscosity Nsm2
Subscriptaw Adiabatic wallamb Ambient119888 Coolant119890 Exit of cascade119891 Fluid119898 Mainstreammin Minimum119904 Solid119908 Wall
Conflict of Interests
The authors declare that there is no conflict of interestsregarding the publication of this paper
Acknowledgment
The authors are grateful to Gas Turbine Research Establish-ment (GTRE) Bangalore for supporting this project throughGATET program
References
[1] A B Mehendale and H Je-Chin ldquoReynolds number effect onleading edge film effectiveness and heat transfer coefficientrdquoInternational Journal of Heat and Mass Transfer vol 36 no 15pp 3723ndash3730 1993
[2] S Ou and R Rivir ldquo90∘ skew leading edge film cooling effec-tiveness heat transfer and discharge coefficients for cylindricalfilm holes at high free stream turbulencerdquo in Proceedings of theRTO AVT Symposium on ldquoAdvanced Flow Management PartAmdashVortex Flows and High Angle of Attack for Military VehiclesRTO-MP-069(I) Loen Norway May 2001
[3] S Ou and R B Rivir ldquoLeading edge film cooling heat transferwith high free stream turbulence using a transient liquid crystal
image methodrdquo International Journal of Heat and Fluid Flowvol 22 no 6 pp 614ndash623 2001
[4] K Funazaki H Kawabata D Takahashi and Y Okita ldquoExper-imental and numerical studies on leading edge film coolingperformance effects of hole exit shape and freestream turbu-lencerdquo inProceedings of ASMETurbine Technical Conference andExposition GT2012-68217 Copenhagen Denmark 2012
[5] H Reiss and A Bolcs ldquoExperimental study of showerheadcooling on a cylinder comparing several configurations usingcylindrical and shaped holesrdquo Journal of Turbomachinery vol122 no 1 pp 161ndash169 2000
[6] W D York and J H Leylek ldquoLeading-edge film-colling physicsPart III Diffused hole effectivenessrdquoASME Journal of Turboma-chinery vol 125 no 2 pp 252ndash259 2003
[7] Y Lu D Allison and S V Ekkad ldquoTurbine blade showerheadfilm cooling Influence of hole angle and shapingrdquo InternationalJournal of Heat and Fluid Flow vol 28 no 5 pp 922ndash931 2007
[8] A Kassab E Divo J Heidmann E Steinthorsson and FRodriguez ldquoBEMFVM conjugate heat transfer analysis ofa three-dimensional film cooled turbine bladerdquo InternationalJournal of Numerical Methods for Heat and Fluid Flow vol 13no 5-6 pp 581ndash610 2003
[9] L Zhao andTWang ldquoAn investigation of treating adiabaticwalltemperature as the driving temperature in film cooling studiesrdquoASME Journal of Turbomachinery vol 134 Article ID 061032pp 1ndash9 2012
[10] F Montomoli M Massini H Yang and J C Han ldquoThe benefitof high-conductivity materials in film cooled turbine nozzlesrdquoInternational Journal of Heat and Fluid Flow vol 34 pp 107ndash1162012
[11] N Moritz K Kusterer D Bohn T Sugimoto R Tanaka andT Taniguchi ldquoConjugate calculation of a film-cooled bladefor improvement of the leading edge cooling configurationrdquoPropulsion and Power Research vol 2 pp 1ndash9 2013
[12] M L Nathan T E Dyson D G Bogard and S D BradshawldquoAdiabatic and overall effectiveness for the showerhead filmcooling of a turbine vanerdquo in Proceedings of the ASME TurboExpo Turbine Technical Conference and Exposition (GT rsquo12) pp1537ndash1547 Copenhagen Denmark June 2012
[13] R K Panda and B V S S S Prasad ldquoConjugate heat transferfrom a flat plate with combined impingement and film coolingrdquoin Proceedings of the ASME Turbo Expo Turbine TechnicalConference and Exposition (GT rsquo12) pp 347ndash356 CopenhagenDenmark June 2012
[14] M Vollmer and K P Mollmann Infrared Thermal ImagingFundamentals Research and Applications Wiley-VCH 2010
International Journal of
AerospaceEngineeringHindawi Publishing Corporationhttpwwwhindawicom Volume 2014
RoboticsJournal of
Hindawi Publishing Corporationhttpwwwhindawicom Volume 2014
Hindawi Publishing Corporationhttpwwwhindawicom Volume 2014
Active and Passive Electronic Components
Control Scienceand Engineering
Journal of
Hindawi Publishing Corporationhttpwwwhindawicom Volume 2014
International Journal of
RotatingMachinery
Hindawi Publishing Corporationhttpwwwhindawicom Volume 2014
Hindawi Publishing Corporation httpwwwhindawicom
Journal ofEngineeringVolume 2014
Submit your manuscripts athttpwwwhindawicom
VLSI Design
Hindawi Publishing Corporationhttpwwwhindawicom Volume 2014
Hindawi Publishing Corporationhttpwwwhindawicom Volume 2014
Shock and Vibration
Hindawi Publishing Corporationhttpwwwhindawicom Volume 2014
Civil EngineeringAdvances in
Acoustics and VibrationAdvances in
Hindawi Publishing Corporationhttpwwwhindawicom Volume 2014
Hindawi Publishing Corporationhttpwwwhindawicom Volume 2014
Electrical and Computer Engineering
Journal of
Advances inOptoElectronics
Hindawi Publishing Corporation httpwwwhindawicom
Volume 2014
The Scientific World JournalHindawi Publishing Corporation httpwwwhindawicom Volume 2014
SensorsJournal of
Hindawi Publishing Corporationhttpwwwhindawicom Volume 2014
Modelling amp Simulation in EngineeringHindawi Publishing Corporation httpwwwhindawicom Volume 2014
Hindawi Publishing Corporationhttpwwwhindawicom Volume 2014
Chemical EngineeringInternational Journal of Antennas and
Propagation
International Journal of
Hindawi Publishing Corporationhttpwwwhindawicom Volume 2014
Hindawi Publishing Corporationhttpwwwhindawicom Volume 2014
Navigation and Observation
International Journal of
Hindawi Publishing Corporationhttpwwwhindawicom Volume 2014
DistributedSensor Networks
International Journal of
2 International Journal of Rotating Machinery
Hub Tip
55∘ 45∘ 0∘
55∘ 30∘
30∘
45∘
SH SS2 PS2
SS1 PS2
(a)
Impingement insert
Interaction surface SH
SS1
SS2
PS2
PS1
(b)
Figure 1 (a) Inclination of holes within a row from hub to tip (b) Solid leading edge with impingement insert
code developed at their institute and demonstrated that aconjugate calculation technique is suited for predicting three-dimensional thermal load on blades with complex coolingconfigurations A key parameter used in CHT calculations isthe overall cooling effectiveness (Φ) This variable gives anidea of the actual vane temperature in the nondimensionalform by coupling the convective heat transfers due to theexternal and internal flow field with the conduction in theblade
Φ =
119879119898minus 119879119908
119879119898minus 119879119888
(2)
Here 119879119908is the wall temperature under conjugate condition
The values of adiabatic and overall cooling effectiveness atthe leading edge region of a turbine vane with internalimpingement cooling were compared by Nathan et al [12]They reported that the values of Φ are equivalent to theactual engine values and are higher compared to the adiabaticeffectiveness They prescribed the use of contours of Φ fordetermining the regions of high thermal gradient
Even though there are a lot of studies related to leadingedge heat transfer data on parametric studies carried outwith conjugate thermal conditions with realistic externaland internal cooling configurations are limited Literaturedoes not throw much light on the effect of some of thekey parameters like blowing ratio Reynolds number andmaterial conductivity on the overall effectiveness of theleading edge with the conjugate conditionsThe present studyhence focuses on these aspects by considering aNGV cascadewith the leading edge of a typical gas turbine provided withshowerhead holes and impingement holes The parametersinvestigated in the study include the effect of three differentblowing ratios and the effect of three different Reynoldsnumbers for each blowing ratio on the overall effectivenessof the leading edge made of different thermal conductingmaterials
2 Methodology
21 Computational Methodology Studies are conducted ona curved plate having a radius of curvature 21mm andthickness 5mm provided with five rows of 285mmdiameterstaggered showerhead holes The middle row of holes (SH)
is at the stagnation region and the other four rows SS1 SS2PS1 and PS2 are positioned at +30∘ +60∘ minus30∘ and minus60∘respectively from the middle row Typical to a gas turbineNGV these holes in each row are varyingly inclined in thespanwise direction from 55∘ to 0∘ as shown in Figure 1(a)
The computational domain is a linear cascade as shownin Figure 2(a) The chord length of the blade is 228mm andthe spacing between the blades is maintained at 200mmTheNGV has a span of 100mm To avoid end wall effects theNGV is extended on either side by 100mm resulting in a totalspan of 300mmThe domain is extended 15 times the chordupstream and downstream of the blades
The computational model consists of two fluid zones anda solid zone Fluid zone 1 is the mainstream flow and fluidzone 2 is the coolant flow from the impingement holes tothe vane rear surface and through the film holes to finallymix with fluid zone 1 The solid zone comprises the leadingedge region The mesh is generated in these zones by thegrid generating tool GAMBIT 2316 (Figure 2(b)) A gridindependence study is conducted with three meshes coarsemedium and fine which had approximately 17 million254 million and 31 million cells respectively The spanwiseaveraged effectiveness at various streamwise locations isplotted for all three cases as shown in Figure 3
Themediummesh is found adequate for the present studyas the result was almost independent of further grid refine-ment A multiblock technique is used and it allows creatingseparate grids for different parts of the flow domain Theinterblock boundaries are virtual and hence have no physicalsignificanceThe impingement holes film holes and the solidleading edge are meshed with tetrahedral grid and are wellrefined On the other hand the flow domain is meshed withhexahedral grids A three-dimensional boundary layer withfirst row height of 002mm and growth factor of 12 for 20rows is provided throughout over the blade surface and overthe film hole exits to bring down the 119910+ value of the 1st cellbelow unity
At the cascade domain inlet and impingement hole inleta uniform velocity and temperature boundary condition isspecified for the mainstream flow and coolant flow respec-tively The coolant from the inlet impinges on the rear side ofthe leading edge and then effuses out of the film (showerhead)holes to interact with the mainstream and finally exits
International Journal of Rotating Machinery 3
Mainstream exit
Mainstreaminlet
Cool
ant i
nlet
(a) (b)
Figure 2 (a) Computational domain (b) Mesh generated in the domain
03
04
05
06
07
08
0 10 20 30 40 50 60 70
Coarse Medium Fine
minus70 minus60 minus50 minus40 minus30 minus20 minus10
120572
Φ
Figure 3 Grid independence study
the domain through a constant pressure outlet A turbulentintensity of 1 is imposed at the mainstream inlet and 5at the impingement inlet A periodic boundary condition isgiven at the top and bottom wall of the domain so as togenerate an infinite cascade model
Three-dimensional conjugate heat transfer problem isformulated with the following assumptions (i) the fluid isincompressible (ii) the fluid properties are constant (iii)radiation and natural convection are neglected (iv) viscousdissipation is absent and (v) the flow is steadyThe governingequations used for simulation are the Reynolds averagedcontinuity momentum and the energy equations along withthe equations for modeling the turbulence quantities
Boundary conditions used for the present study are asfollows
(i) no slip boundary condition at wall V119908= 0
(ii) mainstream velocity inlet (V119898) corresponding to dif-
ferent Reynolds numbers and 119879 = 308K
(iii) coolant inlet condition 119879 = 288K and V119888calculated
from blowing ratio (119872 = 120588119888V119888120588119898V119898)
(iv) outlet boundary condition 119875 = 119875amb at exit(v) conjugate boundary condition at solid plate
119879119904= 119879119891 119896119904
120597119879119904
120597119910
= 119896119891
120597119879119891
120597119910
at wall (3)
(vi) adiabatic condition at the other walls
120597119879119904
120597119910
= 0 at wall (4)
The governing equations are solved using the finite vol-ume based Fluent14 solver from the Ansys14 package The120581-120596 SST model is adopted for turbulence modeling Thismodel was recommended by Panda and Prasad [13] whoconducted a combined impingement-film cooling study ona flat plate where the 120581-120596 SST model is reported to havepredicted the flow interactions very well and matched withtheir experimental results A standard pressure interpolationscheme is used The SIMPLE algorithm is used for pressure-velocity coupling A second-order upwind scheme is usedfor momentum and energy and a first-order upwind schemefor 120581 and 120596 The solution is considered to be convergedwhen the maximum residual value is of the order of 10minus5for continuity momentum and turbulence equations and10minus6 for the energy equation Further the spanwise averagedeffectiveness values at various streamwise locations on theNGV are constantly monitored so that the variation will bewithin 01 for 500 consecutive iterations
For the present study two curved plates one with a lowerthermal conductivity (Material A with 119896 = 02WmK) and
4 International Journal of Rotating Machinery
1
2
3
4 5
76
8
9
10
11
12
1315
16141018
1119
1117
AITFITΦ800
Figure 4 Experimental test rig 1 DCmotor 75 kW 1500 rpm 2 centrifugal air blower 14m3s 3 diffuser 4 honeycomb 5 mesh 6 settlingchamber 7 converging duct 8 test section 9 cascade 10 rotameter 11 flow control valve 12 heat exchanger 13 condensing unit 14thermostatic expansion valve 15 condenser 16 refrigerant compressor 17 bypass 18 air dryer and 19 reciprocating air compressor
another with a higher thermal conductivity (Material B with119896 = 149WmK) are considered The effect of blowing ratiois studied at119872 = 1 15 and 2 by varying the coolant velocitymaintaining the mainstream velocity constant The effect ofReynolds number is studied at each blowing ratio by varyingboth mainstream and coolant velocity Reynolds number isvaried by Re
1= 48 times 105 Re
2= 96 times 105 and Re
3= 144 times
105 for each blowing ratio and its effect on the overalleffectiveness on the leading edge external surface is studied
22 Experimental Methodology The computational model isvalidated with the experimental results obtained from thestudy carried out on a five-vane cascade in the laboratorylinear cascade wind tunnel The center vane in the cascadeis instrumented for static pressure and temperature mea-surements The cascade and vane dimensions are exactly thesame as those of the computational model The experimentalsetup is shown in Figure 4 The mainstream air is suppliedby a centrifugal blower A uniform flow is ensured by thehoneycomb screens and meshes provided in the settlingchamber as shown in the figureThe secondary air is suppliedby a reciprocating air compressor and is cooled using atube-in-tube heat exchanger The coolant is fed into thetwo impingement inserts fitted inside the NGV The coolantimpinges on the rear side of the vane and effuses out of theshowerhead and film holes
The two-dimensionality and periodicity of the cascadeare established using flow measurements at the inlet and exitof the cascade A pitot probe is traversed at the inlet of thecascade and a calibrated five-hole pressure probe at the exitThe static pressure on the vane is measured using static tapsput at various streamwise locationsThe air is bled from thesestatic taps using 25mm brass tubes
The steady state temperature on the external surfaceof the NGV made of Material B is measured by infraredthermography using a FLIR A315 camera The entire leadingedge is mapped by placing the camera at three differentlocations (as shown in Figure 5(b)) so as to bring down themaximumviewing angle between the camera and the normalsurface below 35∘ This is done to avoid any variance indirectional emissivity as previous study [14] has reported that
the emissivity is nearly constant from the normal direction(0∘) to 45∘ Germanium IR windows are placed on thetunnel walls at all these locations The camera is connectedto the computer using a gigabit Ethernet cable and theFLIR Tools+ software enable triggering synchronizationand focus of the camera remotely Various corrections likeatmosphere transmission correction emissivity correctionreflected temperature correction external windows correc-tion and optics transmission correction are made beforetaking the image In situ calibration of the IR camera is doneby simultaneously recording the temperatures obtained fromcalibrated thermocouples that are stuck at various locationson the NGV The NGV along with the thermocouples arepainted with flat black to achieve uniform emissivity of about097 The emissivity is then corrected by comparing the IRand thermocouple readings even though the magnitude ofthis correction is as low as 001 Lines of equal length aredrawn at various streamwise locations on the vane surfaceThe weighted averages of temperature in all these lines areobtained
3 Data Reduction Planes
The lines drawn on the leading edge as in Figure 6 from120572 = minus70 to +70 at every 5-degree interval are used for datareduction The spanwise averaged effectiveness discussed inthe later sections is obtained by areaweighted average of theselines Wall-normal planes from the leading edge surface arealso generated with respect to these lines
4 Results and Discussion
41 Validation The computational model is validated bycomparing the static pressure and effectiveness distributionon the vane obtained computationally with experiments (Fig-ures 7 and 8)The NGV used in the experiment has the prop-erties of Material B The static pressure is measured at Re =29times10
5 For validation the coolant inlet condition is changedfrom velocity boundary condition at the impingement holeinlet to mass flow boundary condition at the impingementinsert inlet tomatch the experimental conditionThis coolant
International Journal of Rotating Machinery 5
From blowerMeasurement blade
Position 1
Position 2
Position 3 Position 4
Ge IR window
IR
270m
270m
930m
(a)
Position 3
(Maximum viewing angleon the pressure side)
(Maximum viewing angleon the suction side)
Position 4
Position 2
35∘
35∘
30∘
30∘
Lead
ing
edge
(b)
Figure 5 Surface temperature mapping using IR thermography (a) general cascade setup and (b) focusing the leading edge
120572 = 70
120572 = 0
120572 = minus70
Suction side
Pressureside surface
Hub Tip
surface
Figure 6 Data reduction planes
mass flow distributed to the showerhead holes as well asfour rows of film holes Hence the minimum blowing ratio(119872min) corresponds tominimummass flow rate at the inlet ofimpingement insert which is sufficient enough for the coolantto come out of all the showerhead and film holes This valueis found out computationally by trial and error Later whileconducting experiments at this minimum coolant mass flowit is ensured that the coolant comes out of all the film holesby traversing a thermocouple probe
Figures 7 and 8 show that a good correspondence existsbetween the experimental and computational results therebyvalidating the computational methodology including themesh and the turbulence model adopted for the computa-tions Figure 8 shows the IR image at the leading edge andcomparison of the experimental and computational values ofthe spanwise averaged effectiveness The comparison madefor three blowing ratios shows a good agreement between
the experimental and computational values with a maximumdifference of about 6 which is well within the acceptablerange
42 Flow and Temperature Patterns The flow and heattransfer characteristics are different on the pressure andsuction sides of the leading edge for different blowing ratiosFigure 9 shows the path lines coloured by nondimensionaltemperature emerging from all rows of holes
Figure 9 shows the coolant emerging out of the fiverows of showerhead holes located at the leading edge Thesestreamlines are coloured by nondimensional temperature120579 At low blowing ratio (119872 = 1) the coolant comingout of the stagnation row of showerhead holes is gettingequally distributed towards the pressure and suction sidesSymmetry is seen with respect to the stagnation row Butas the blowing ratio increases more coolant tends to flow
6 International Journal of Rotating Machinery
02
0 02 04 06 08 1 12
CFD Experiment
minus2
minus4
minus6
minus8
minus10
minus12
minus14
minus16
Re = 29 times 105
Cp
xCh
Figure 7 Comparison of static pressure
04
05
06
07
0 10 20 30 40 50 60 70
CFD
Suction sidePressure side
minus70 minus60 minus50 minus40 minus30 minus20 minus10
04
05
06
07
04
05
06
07
0 10 20 30 40 50 60 70minus70 minus60 minus50 minus40 minus30 minus20 minus10
0 10 20 30 40 50 60 70minus70 minus60 minus50 minus40 minus30 minus20 minus10
M=1timesM
min
Experiment
M=15timesM
min
M=2timesM
min
04
05
06
07
04
05
06
07
04
05
06
07
Streamwise angle 120572
Streamwise angle 120572
Streamwise angle 120572
Span
wise
aver
aged
ΦSp
anw
ise av
erag
edΦ
Span
wise
aver
aged
Φ
Φ
Φ
Φ
Figure 8 Comparison of spanwise averaged overall effectiveness and the IR images
towards the pressure side compared to the suction side Thisis prominent at the highest blowing ratio119872 = 2 The areasnot covered by the streamlines are the ones having the lowesteffectiveness Hence pressure side surface has better coolantspread at higher blowing ratios The reason behind this isexplained with the help of Figure 10
Figure 10 shows the streamlines coloured by nondimen-sional temperature (120579) drawn in wall-normal planes L1 L2and L3 (shown at the top) at different locations along thestagnation row Planes are drawn just after the first hole justbefore the second hole and through the second hole of the SHrow It can be seen that after hole 1 counter rotating vortexpair (CRVP) is formed for119872 = 15 and119872 = 2 In the case of119872 = 1 CRVP are not formed and this is characterized by anattached flowThe strength of the CRVP formed for119872 = 2 is
higher compared to119872 = 15 From the second plane which isjust before the second hole it is evident from the colour of thestreamlines that the coolant from the 1st hole is not reachingthe second hole for119872 = 1 case Hence it is not affecting thecoolant flow from the second hole As a result the coolantstreamlines from the 2nd hole are getting equally distributedto pressure and suction sides as shown in plane L3 But this isnot the case for higher blowing ratios where the coolant fromthe 1st hole is affecting that from the 2nd hole At119872 = 15even though the coolant from the 1st hole reaches the 2ndhole the strength of the CRVP developed from the 1st holedrastically reduces by the time it reaches the 2ndholeThoughweak there is a small current towards the pressure side as canbe seen from plane L2 Hence it can be noticed from plane L3that the coolant is flowing slightly more towards the pressure
International Journal of Rotating Machinery 7
M = 1M = 15 M = 2
Tip
Hub Suction Pressure
1
095
09
085
08
075
07
065
06
055
05
045
04
035
03
025
02
015
01
005
0
120579
Figure 9 Pathlines coloured by nondimensional temperature emerging out of the showerhead holes
M=1
M=15
M=2
Plane L1 Plane L2 Plane L3
1st hole 2nd hole
L1 L2 L3
1
095
09
085
08
075
07
065
06
055
05
045
04
035
03
025
02
015
01
005
0
120579
Suction Pressure
Figure 10 Stream lines coloured by 120579 drawn at wall-normal planes at various locations in the SH row of the leading edge
side as compared to suction side This phenomenon is evenmore prominent for the highest blowing ratio (119872 = 2) It canbe seen from plane L2 that for the flow approaching hole 2CRVPhas considerable strength A strong vortex formation is
seen on the pressure side and it induces a low pressure in thatregion This causes the coolant coming out of the 2nd hole toflow towards the pressure side as can be seen from plane L3This is the reason why the coolant effusing out of SH row is
8 International Journal of Rotating Machinery
Pressure side
Suction side
SH
PS1
PS2
SS1SS2
65∘
50∘
20∘
5∘
minus20∘
minus35∘
minus50∘
minus65∘
35∘
65∘ 50∘ 20∘ 5∘ minus20∘ minus35∘ minus50∘ minus65∘35∘
120572 = 5∘
10950908508075070650605505045040350302502015010050
10950908508075070650605505045040350302502015010050
10950908508075070650605505045040350302502015010050
minus5∘
65∘ 50∘ 20∘ 5∘ minus20∘ minus35∘ minus50∘ minus65∘35∘ minus5∘
65∘ 50∘ 20∘ 5∘ minus20∘ minus35∘ minus50∘ minus65∘35∘ minus5∘
Suction surface Pressure surface
M=1
M=15
M=2
Φ
Φ
Φ
Figure 11 Contours of nondimensional temperature (120579) plotted on wall-normal planes at different streamwise locations for various blowingratios at Re
1
distributed more towards the pressure side at higher blowingratios
Figure 11 shows the nondimensional temperature contourplotted at different wall-normal planes perpendicular to theleading edge (along the data reduction lines Figure 6) Asseen in the figure the contours at plusmn5∘ and plusmn20∘ depictthat the coolant coming out of SH spreads more on to thepressure side surface than the suction side The contour at35∘ and 50∘ on the suction surface shows the coolant flowdownstream of the SS1 row and vividly shows that with
increase in blowing ratio the coolant jet gets lifted off morefrom the surface and in turn entraps the hot mainstreambeneath it whereas on to the pressure side at 35∘ and 50∘plots depict an improvement in the concentration of coolantwith increase in blowing ratio and a denser and thicker coverof coolant is observed On the contrary downstream of SS2and PS2 rows a better spread and attachment of coolant onto the surface are seen for 119872 = 1 When the blowing ratioincreases the coolant is slightly getting detached and hotmainstream is seen penetrating the region between the film
International Journal of Rotating Machinery 9
1
095
09
085
08
075
07
065
06
055
05
045
04
035
03
025
02
015
01
005
0
M=1
M=15
M=2
Φ
Figure 12 Streamlines coloured by nondimensional temperature (120579) showing coolant-mainstream interaction at the leading edge stagnationregion (120572 = 0) for blowing ratios (a)119872 = 1 (b)119872 = 15 and (c)119872 = 2
holes Moreover at higher blowing ratios the coolant is seento be gathering near the tip region while a meager amountof coolant is present near the hub This is mainly due to thehigh spanwise inclination of showerhead holes near the hubAt higher blowing ratios the coolant effusing out of theseholes attains enough momentum to push the coolant comingout of adjacent holes towards the tip This phenomenon canbe better understood with the aid of Figure 12 which showsthe coolant-mainstream interaction at the stagnation region(120572 = 0) It is also observed that for all rows of holes thecoolant effusing out of the holes closer to the tip region whichare less inclined to the spanwise direction shows a highertendency to liftoff from the surface The tendency to liftoffalso decreases when moved towards the hub region as theholes gradually get more inclined to the spanwise direction
43 Effect of Blowing Ratio on Effectiveness The effect ofblowing ratio on the overall effectiveness is different forsuction and pressure side surface of the leading edge as canbe seen from Figure 13 Whilst the effectiveness appears toimprove with blowing ratio on the pressure side surface itis seen to decrease on the suction side surface The abovequalitative explanation can be justified with the spanwiseaveraged effectiveness plot at various streamwise angles fromthe stagnation region as shown in Figure 14
On the pressure side surface downstream of SH andPS1 holes the effectiveness is least for 119872 = 1 for allthree Reynolds numbersMoreover the effectiveness gradientbetween two rows of holes is also highest for119872 = 1 whereasit is least for119872 = 2 especially downstream of SH row Thisis due to the uniform and wide coverage of coolant in thatregion at 119872 = 2 as discussed from Figure 11 At 119872 = 15and119872 = 2 the effectiveness curves are almost overlappingdownstream of PS1 for all Reynolds numbers After PS2 onthe contrary effectiveness is seen decreasing with increase
in blowing ratio This is vivid from Re1 whereas for higher
Reynolds numbers the effectiveness curves in this region arealmost overlapping for119872 = 1 and 15
On the suction side surface the effectiveness is least for119872 = 2 throughout due to the coolant jet getting liftedoff from the surface as explained in the previous sectionThe effectiveness gradient between two rows of holes is alsofound highest for 119872 = 2 case and least for 119872 = 1Effectiveness distribution at 119872 = 1 and 119872 = 15 is almostoverlapping downstream of SH and SS1 holes for Re
1and
Re3cases For Re
2case the effectiveness values are slightly
reduced at 119872 = 15 and the distribution moves close to119872 = 2 Downstream of SS2 the effectiveness distributionis distinct and the trend is similar for all Reynolds numbersThe effectiveness is decreasing with increasing blowing ratioThe effectiveness distribution at119872 = 15 is in between thatof 119872 = 1 and 119872 = 2 at almost throughout the leadingedge region and at all Reynolds numbers Hence when areaweighted average of the whole surface is taken the overalleffectiveness is higher for 119872 = 15 But the gradient ineffectiveness between the pressure and suction side is least for119872 = 1 case
The averaged values of effectiveness are found quite highfor Material B because the effect of impingement cooling isfelt more due to the high conductivity of the material Fromthe effectiveness contours in Figure 13 it is very clear that thedistribution is uniform throughout the leading edge regioncompared to Material A Due to lateral conduction withinthe plate gradients in the effectiveness between rows of holesare very small Even though the variation is less zones ofrelatively higher effectiveness can be found in the pressureside surface of the leading edge compared to the suction sidesurface Further insight into this can be obtained from theplot of spanwise averaged effectiveness from Figure 14
The effect of blowing ratio though prevalent is consid-erably smaller compared to the low conductivity material
10 International Journal of Rotating Machinery
Material A Material B
Tip
1
2
M=1
M=15
M=2
Hub
06
07
010150202503
04
05
06
07
0808509
Suction Pressure Suction Pressure
Φ
Re1 = 48 times 105 Re2 = 96 times 105 Re3 = 144 times 105 Re1 = 48 times 105 Re2 = 96 times 105 Re3 = 144 times 105
035
045
055
065
075
010150202503
04
05
06
07
0808509
035
045
055
065
075
010150202503
04
05
06
07
0808509
Φ
Φ
Φ
035
045
055
065
075
058059
061062063064065066
068069
071072073074075076077
067
06
07
Φ
058059
061062063064065066
068069
071072073074075076077
067
06
07
Φ
058059
061062063064065066
068069
071072073074075076077
067
Figure 13 Overall effectiveness contours at all three blowing ratios and Reynolds numbers for Materials A and B
At 119872 = 15 the effectiveness values are relatively highcompared to other blowing ratios and this difference is moredistinct at Re
1 At higher Reynolds numbers this difference
in effectiveness values is found to be reduced On the suctionside surface downstream of the SH row the effectivenesscurves at all blowing ratios are overlapping at Re
2and Re
3
and the same is found in the downstream region of SS1 at Re3
Downstream of PS2 the effectiveness is highest at119872 = 15at all Reynolds numbers whereas downstream of SS2 thehighest effectiveness found at119872 = 15 gradually changes to119872 = 1 as the Reynolds number increases A close observation
of the plot reveals that the effectiveness values on the pressureside surface are least at 119872 = 1 and those on the suctionsurface are least at 119872 = 2 at all Reynolds numbers Henceeffectiveness at 119872 = 15 is comparatively more consistentand higher for119872 = 15 The same scenario was seen for lowconductivity material too
44 Effect of Reynolds Number on Effectiveness For MaterialA it can be seen from Figure 15 that effectiveness decreaseswith increase in Reynolds number for all blowing ratios at allregions of the leading edge except the region between SH and
International Journal of Rotating Machinery 11
Table 1 Area weighted averaged values of effectiveness at interac-tion and target surface
Material A Material Binteractionsurface
Targetsurface
interactionsurface
Targetsurface
Re1 0475 0923 0719 0737Re2 0442 0934 07 0725Re3 0405 094 0678 0709
0203040506070809
0203040506070809
0203040506070809
PS2 PS1 SH SS1 SS2
0 10 20 30 40 50 60 70minus70 minus60 minus50 minus40 minus30 minus20 minus10
0 10 20 30 40 50 60 70minus70 minus60 minus50 minus40 minus30 minus20 minus10
0 10 20 30 40 50 60 70minus70 minus60 minus50 minus40 minus30 minus20 minus10
Φ
Φ
Φ
Suction sidePressure side 120572
Suction sidePressure side 120572
Suction sidePressure side 120572
Re1 = 48 times 105
Re2 = 96 times 105
Re3 = 144 times 105
B M = 1
B M = 15
B M = 2
A M = 1
A M = 15
A M = 2
Figure 14 Spanwise averaged overall effectiveness at variousstreamwise angles 120572
PS1 In that region the value is higher for effectiveness at Re2
and this is later explained with Figures 16 and 17 ForMaterialB the effectiveness is decreasing with increase in Reynoldsnumber throughout the leading edge for all blowing ratios
Table 1 shows the area weighted average of effectivenessat the outer and inner surface of the leading edge Interactionsurface is where the coolant coming out of the film holesinteracts with the mainstream and target surface is wherethe coolant impinges It can be clearly seen that as Reynoldsnumber increases effectiveness decreases at the interaction
0203040506070809
0203040506070809
PS2 PS1 SS2SS1SH
0 10 20 30 40 50 60 70minus70 minus60 minus50 minus40 minus30 minus20 minus10
0 10 20 30 40 50 60 70minus70 minus60 minus50 minus40 minus30 minus20 minus10
0 10 20 30 40 50 60 70minus70 minus60 minus50 minus40 minus30 minus20 minus10
Φ
Φ
0203040506070809
Φ
M = 1
M = 15
Suction sidePressure side 120572
Suction sidePressure side 120572
Suction sidePressure side 120572
M = 2
BRe1BRe2BRe3
ARe1ARe2ARe3
Figure 15 Spanwise averaged overall effectiveness at variousstreamwise angles 120572
0200400600800
1000 PS2 PS1 SS2SS1SH
0 10 20 30 40 50 60 70minus70 minus60 minus50 minus40 minus30 minus20 minus10
Suction sidePressure side 120572
Nu
Re1 Re2 Re3
Figure 16 Spanwise averagedNusselt number distribution at119872 = 1for Material A
surface whereas it increases at the target surface for MaterialA This shows that with increase in Reynolds number theheat transfer at both interaction and target surfaces increasesThe values for Material B however show a decrease ineffectiveness at both the interaction and target surfaces withincrease in Reynolds number This shows that even thoughheat transfer rate increases at both the surfaces the increase inheat transfer at the interaction surface ismore dominantThis
12 International Journal of Rotating Machinery
10908070605040302010
120579
(a)
10908070605040302010
120579
(b)10908070605040302010
120579
(c)
10908070605040302010
120579
(d)
Figure 17 Streamlines coloured by nondimensional temperature at a wall-normal plane 5∘ downstream SH
increase in heat transfer with Reynolds number is evidentfrom the spanwise averaged Nusselt number plot shown inFigure 16
An overlapping is seen in the graph in the immediatedownstream region of SH row towards the pressure sidewhere the heat transfer is found low for Re
2 This is mainly
attributed to the cold spots as indicated in Figure 13 Flowbehavior in this region is studied for Re
1and Re
2by drawing
pathlines (Figure 17) in a plane drawn 5 degrees downstreamof SH row on the pressure side surface Figures 17(a) and17(b) correspond to the location of spot 1 of Figure 13 atRe1and Re
2 respectively Similarly Figures 17(c) and 17(d)
correspond to the location of spot 2 on Figure 13 at Re1and
Re2 respectively It can be seen that the region between the
two eddies is occupied by the mainstream in the cases ofRe1 whereas in the cases of Re
2 that region is filled by the
coolant effusing out of the adjacent hole and hence results inimproved effectiveness
5 Conclusions
A computational and experimental study is carried out onthe leading edge of a typical gas turbine nozzle guide vaneThe effect of blowing ratio and Reynolds number is studiedby considering two materials Material A (119896 = 02WmK)and Material B (119896 = 149WmK) of low and high ther-mal conductivity respectively The heat transfer and overalleffectiveness distributions at the leading edge are extensivelystudied and reported These results are explained with theaid of pathlines nondimensional temperature contours andNusselt number distributions describing the mainstream-coolant interaction at the exit of film holes The salientconclusions drawn from the study are as follows
(1) The computational turbine NGV cascade model isvalidated with the experimental data as a closeagreement in static pressure distribution and over-all effectiveness distribution on the vane surface isobtained
(2) The overall effectiveness value of Material B is higherand its distribution in streamwise and spanwise direc-tions is more uniform compared to Material A owing
to the high conductivity of the former The suddenpeaks and valleys appearing in the effectiveness distri-bution of Material A disappear in the case of MaterialB owing to the high lateral diffusion within the plate
(3) The effect of blowing ratio is different for the pressureside and suction side of the stagnation line Asthe blowing ratio increases the coolant tends todistribute more towards the pressure surface Hencewith increase in blowing ratio effectiveness increasedon the pressure side and decreased on the suctionside For Material A the effectiveness is higher on thepressure side at119872 = 2 and on the suction side at119872 =1When considering thewhole blade amore uniformdistribution of overall effectiveness between pressureand suction side was noticed at 119872 = 1 resultingin less thermal gradient whereas the averaged overalleffectiveness value is higher at119872 = 15 For MaterialB the overall effectiveness value is higher at119872 = 15throughout the leading edge For both Materials Aand B when blowing ratio was increased from119872 = 1to 119872 = 2 the region with higher effectiveness wasseen getting shifted from hub to tip
(4) An increase in Reynolds number has showed anincrease in heat transfer on both the external andinternal sides of the leading edge even though exter-nal heat transfer is more dominant An increase inReynolds number at a particular blowing ratio resultsin a decrease in the overall effectiveness throughoutthe leading edge forMaterial BWhileMaterial A alsoexhibits similar behavior at most of the leading edgea slight disagreement is seen in the region between SHand PS1 rows where the maximum effectiveness is atRe2owing to the formation of cold spots
Nomenclature
119862ℎ Chord length m119862119901 Coefficient of pressure (119901 minus 119901
119898)(05 lowast 120588 lowast V2
119898)
ℎ Heat transfer coefficient 11987610158401015840(119879aw minus 119879119908)Wm2-K119896 Thermal conductivity (Wm-K)119909 Streamwise direction m
International Journal of Rotating Machinery 13
119872 Blowing ratio (120588119888V119888120588119898V119898)
Nu Nusselt number ℎ119862ℎ119896
Nu Spanwise averaged Nu119901 Static pressure119876
10158401015840 Total surface heat flux Wm2Re Reynolds number (120588V
119890119862ℎ120583)
119879 Temperature (K)V Velocity magnitudeSST Shear stress transport
Greek120579 Nondimensional temperature (119879 minus 119879
119888)(119879119898minus 119879119888)
120578 Adiabatic effectiveness (119879119898minus 119879aw)(119879119898 minus 119879119888)
Φ Overall cooling effectiveness (119879119898minus 119879119908)(119879119898minus 119879119888)
Φ Spanwise averaged Φ120572 Streamwise angle with respect to stagnation line (∘)120588 Fluid density120581 Turbulent kinetic energy m2s2120596 Specific dissipation rate 1sec120583 Coefficient of viscosity Nsm2
Subscriptaw Adiabatic wallamb Ambient119888 Coolant119890 Exit of cascade119891 Fluid119898 Mainstreammin Minimum119904 Solid119908 Wall
Conflict of Interests
The authors declare that there is no conflict of interestsregarding the publication of this paper
Acknowledgment
The authors are grateful to Gas Turbine Research Establish-ment (GTRE) Bangalore for supporting this project throughGATET program
References
[1] A B Mehendale and H Je-Chin ldquoReynolds number effect onleading edge film effectiveness and heat transfer coefficientrdquoInternational Journal of Heat and Mass Transfer vol 36 no 15pp 3723ndash3730 1993
[2] S Ou and R Rivir ldquo90∘ skew leading edge film cooling effec-tiveness heat transfer and discharge coefficients for cylindricalfilm holes at high free stream turbulencerdquo in Proceedings of theRTO AVT Symposium on ldquoAdvanced Flow Management PartAmdashVortex Flows and High Angle of Attack for Military VehiclesRTO-MP-069(I) Loen Norway May 2001
[3] S Ou and R B Rivir ldquoLeading edge film cooling heat transferwith high free stream turbulence using a transient liquid crystal
image methodrdquo International Journal of Heat and Fluid Flowvol 22 no 6 pp 614ndash623 2001
[4] K Funazaki H Kawabata D Takahashi and Y Okita ldquoExper-imental and numerical studies on leading edge film coolingperformance effects of hole exit shape and freestream turbu-lencerdquo inProceedings of ASMETurbine Technical Conference andExposition GT2012-68217 Copenhagen Denmark 2012
[5] H Reiss and A Bolcs ldquoExperimental study of showerheadcooling on a cylinder comparing several configurations usingcylindrical and shaped holesrdquo Journal of Turbomachinery vol122 no 1 pp 161ndash169 2000
[6] W D York and J H Leylek ldquoLeading-edge film-colling physicsPart III Diffused hole effectivenessrdquoASME Journal of Turboma-chinery vol 125 no 2 pp 252ndash259 2003
[7] Y Lu D Allison and S V Ekkad ldquoTurbine blade showerheadfilm cooling Influence of hole angle and shapingrdquo InternationalJournal of Heat and Fluid Flow vol 28 no 5 pp 922ndash931 2007
[8] A Kassab E Divo J Heidmann E Steinthorsson and FRodriguez ldquoBEMFVM conjugate heat transfer analysis ofa three-dimensional film cooled turbine bladerdquo InternationalJournal of Numerical Methods for Heat and Fluid Flow vol 13no 5-6 pp 581ndash610 2003
[9] L Zhao andTWang ldquoAn investigation of treating adiabaticwalltemperature as the driving temperature in film cooling studiesrdquoASME Journal of Turbomachinery vol 134 Article ID 061032pp 1ndash9 2012
[10] F Montomoli M Massini H Yang and J C Han ldquoThe benefitof high-conductivity materials in film cooled turbine nozzlesrdquoInternational Journal of Heat and Fluid Flow vol 34 pp 107ndash1162012
[11] N Moritz K Kusterer D Bohn T Sugimoto R Tanaka andT Taniguchi ldquoConjugate calculation of a film-cooled bladefor improvement of the leading edge cooling configurationrdquoPropulsion and Power Research vol 2 pp 1ndash9 2013
[12] M L Nathan T E Dyson D G Bogard and S D BradshawldquoAdiabatic and overall effectiveness for the showerhead filmcooling of a turbine vanerdquo in Proceedings of the ASME TurboExpo Turbine Technical Conference and Exposition (GT rsquo12) pp1537ndash1547 Copenhagen Denmark June 2012
[13] R K Panda and B V S S S Prasad ldquoConjugate heat transferfrom a flat plate with combined impingement and film coolingrdquoin Proceedings of the ASME Turbo Expo Turbine TechnicalConference and Exposition (GT rsquo12) pp 347ndash356 CopenhagenDenmark June 2012
[14] M Vollmer and K P Mollmann Infrared Thermal ImagingFundamentals Research and Applications Wiley-VCH 2010
International Journal of
AerospaceEngineeringHindawi Publishing Corporationhttpwwwhindawicom Volume 2014
RoboticsJournal of
Hindawi Publishing Corporationhttpwwwhindawicom Volume 2014
Hindawi Publishing Corporationhttpwwwhindawicom Volume 2014
Active and Passive Electronic Components
Control Scienceand Engineering
Journal of
Hindawi Publishing Corporationhttpwwwhindawicom Volume 2014
International Journal of
RotatingMachinery
Hindawi Publishing Corporationhttpwwwhindawicom Volume 2014
Hindawi Publishing Corporation httpwwwhindawicom
Journal ofEngineeringVolume 2014
Submit your manuscripts athttpwwwhindawicom
VLSI Design
Hindawi Publishing Corporationhttpwwwhindawicom Volume 2014
Hindawi Publishing Corporationhttpwwwhindawicom Volume 2014
Shock and Vibration
Hindawi Publishing Corporationhttpwwwhindawicom Volume 2014
Civil EngineeringAdvances in
Acoustics and VibrationAdvances in
Hindawi Publishing Corporationhttpwwwhindawicom Volume 2014
Hindawi Publishing Corporationhttpwwwhindawicom Volume 2014
Electrical and Computer Engineering
Journal of
Advances inOptoElectronics
Hindawi Publishing Corporation httpwwwhindawicom
Volume 2014
The Scientific World JournalHindawi Publishing Corporation httpwwwhindawicom Volume 2014
SensorsJournal of
Hindawi Publishing Corporationhttpwwwhindawicom Volume 2014
Modelling amp Simulation in EngineeringHindawi Publishing Corporation httpwwwhindawicom Volume 2014
Hindawi Publishing Corporationhttpwwwhindawicom Volume 2014
Chemical EngineeringInternational Journal of Antennas and
Propagation
International Journal of
Hindawi Publishing Corporationhttpwwwhindawicom Volume 2014
Hindawi Publishing Corporationhttpwwwhindawicom Volume 2014
Navigation and Observation
International Journal of
Hindawi Publishing Corporationhttpwwwhindawicom Volume 2014
DistributedSensor Networks
International Journal of
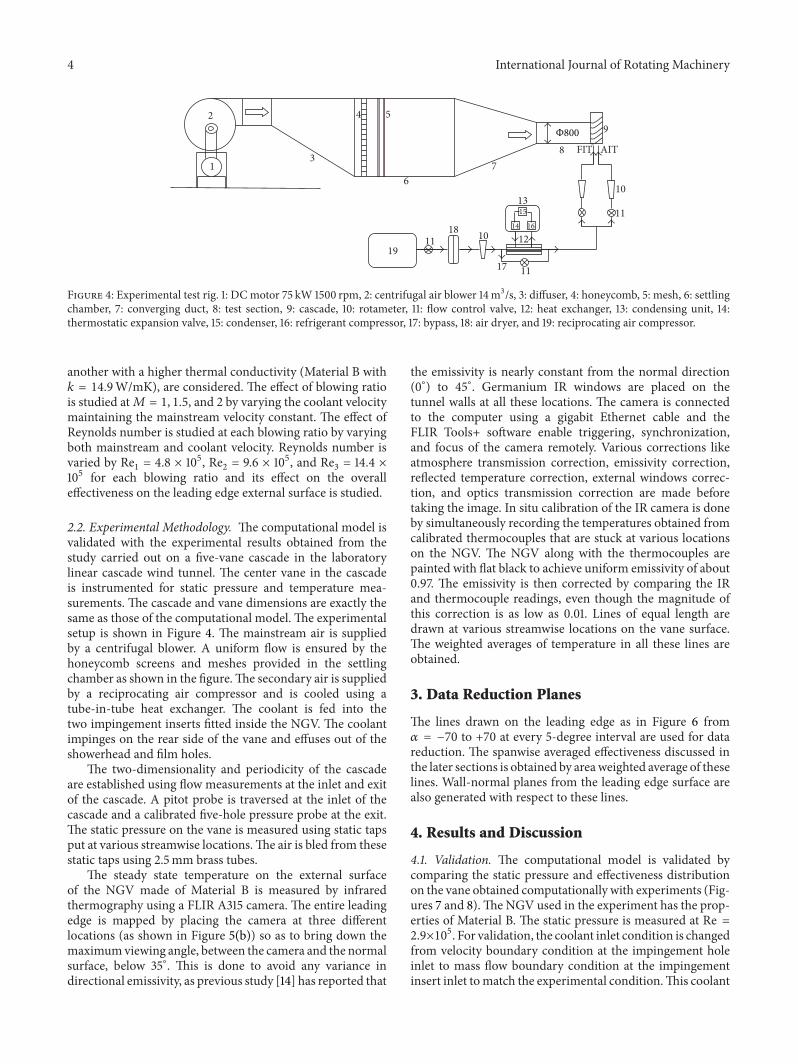
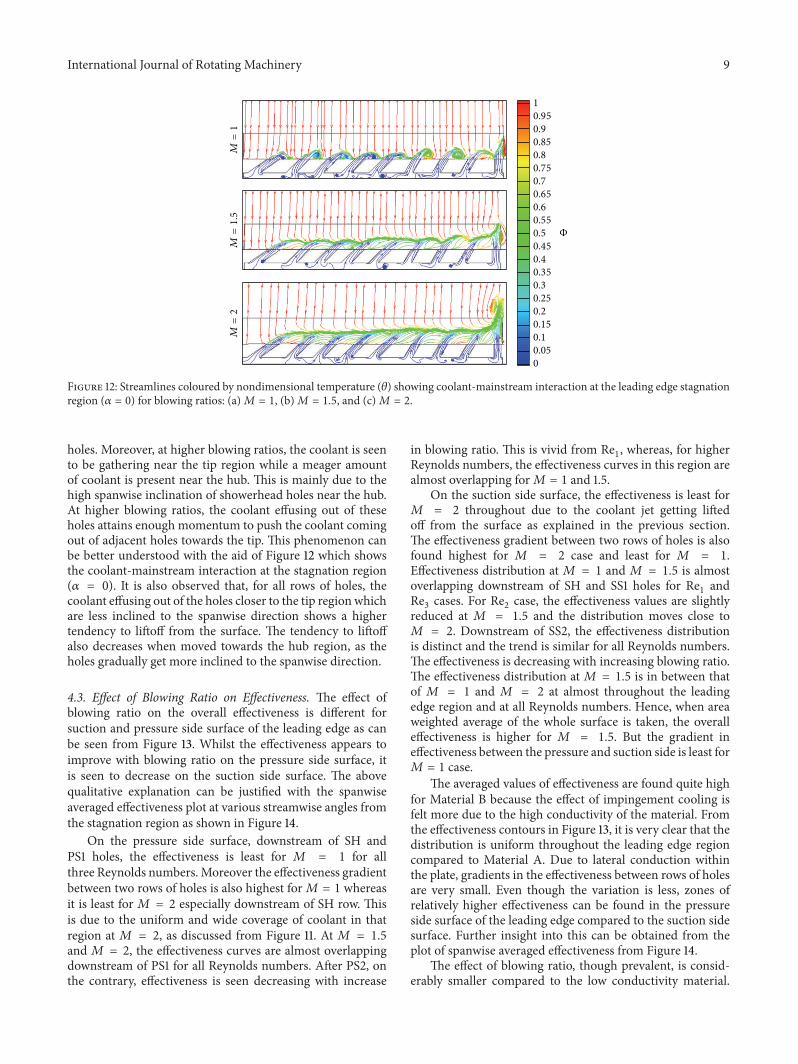

International Journal of
AerospaceEngineeringHindawi Publishing Corporationhttpwwwhindawicom Volume 2014
RoboticsJournal of
Hindawi Publishing Corporationhttpwwwhindawicom Volume 2014
Hindawi Publishing Corporationhttpwwwhindawicom Volume 2014
Active and Passive Electronic Components
Control Scienceand Engineering
Journal of
Hindawi Publishing Corporationhttpwwwhindawicom Volume 2014
International Journal of
RotatingMachinery
Hindawi Publishing Corporationhttpwwwhindawicom Volume 2014
Hindawi Publishing Corporation httpwwwhindawicom
Journal ofEngineeringVolume 2014
Submit your manuscripts athttpwwwhindawicom
VLSI Design
Hindawi Publishing Corporationhttpwwwhindawicom Volume 2014
Hindawi Publishing Corporationhttpwwwhindawicom Volume 2014
Shock and Vibration
Hindawi Publishing Corporationhttpwwwhindawicom Volume 2014
Civil EngineeringAdvances in
Acoustics and VibrationAdvances in
Hindawi Publishing Corporationhttpwwwhindawicom Volume 2014
Hindawi Publishing Corporationhttpwwwhindawicom Volume 2014
Electrical and Computer Engineering
Journal of
Advances inOptoElectronics
Hindawi Publishing Corporation httpwwwhindawicom
Volume 2014
The Scientific World JournalHindawi Publishing Corporation httpwwwhindawicom Volume 2014
SensorsJournal of
Hindawi Publishing Corporationhttpwwwhindawicom Volume 2014
Modelling amp Simulation in EngineeringHindawi Publishing Corporation httpwwwhindawicom Volume 2014
Hindawi Publishing Corporationhttpwwwhindawicom Volume 2014
Chemical EngineeringInternational Journal of Antennas and
Propagation
International Journal of
Hindawi Publishing Corporationhttpwwwhindawicom Volume 2014
Hindawi Publishing Corporationhttpwwwhindawicom Volume 2014
Navigation and Observation
International Journal of
Hindawi Publishing Corporationhttpwwwhindawicom Volume 2014
DistributedSensor Networks
International Journal of


![Koha's Web Installer, Crontab, and Other Server Confi gurations · Koha's Web Installer, Crontab, and Other Server Confi gurations [56 ] Sample Label and Patron Card Data: A set](https://img.pdfslide.net/doc/110x75/5f9f1a158997305ed46aad41/kohas-web-installer-crontab-and-other-server-coni-gurations-kohas-web-installer.jpg)