Embed Size (px)
Citation preview
Hindawi Publishing CorporationThe Scientific World JournalVolume 2013 Article ID 823603 13 pageshttpdxdoiorg1011552013823603
Research ArticleCrack Propagation Analysis Using Acoustic Emission Sensors forStructural Health Monitoring Systems
Zachary Kral12 Walter Horn12 and James Steck12
1 Wichita State University Wichita KS 67260 USA2Department of Aerospace Engineering 1845 Fairmount Wichita KS 67226 USA
Correspondence should be addressed to Zachary Kral ztkralwichitaedu
Received 14 March 2013 Accepted 19 June 2013
Academic Editors T E Matikas and M R Woike
Copyright copy 2013 Zachary Kral et al This is an open access article distributed under the Creative Commons Attribution Licensewhich permits unrestricted use distribution and reproduction in any medium provided the original work is properly cited
Aerospace systems are expected to remain in service well beyond their designed life Consequently maintenance is an importantissue A novel method of implementing artificial neural networks and acoustic emission sensors to form a structural healthmonitoring (SHM) system for aerospace inspection routines was the focus of this research Simple structural elements consistingof flat aluminum plates of AL 2024-T3 were subjected to increasing static tensile loading As the loading increased designed cracksextended in length releasing strain waves in the process Strain wave signals measured by acoustic emission sensors were furtheranalyzed in post-processing by artificial neural networks (ANN) Several experiments were performed to determine the severityand location of the crack extensions in the structure ANNs were trained on a portion of the data acquired by the sensors and theANNs were then validated with the remaining data The combination of a system of acoustic emission sensors and an ANN coulddetermine crack extension accuratelyThe difference between predicted and actual crack extensions was determined to be between0004 in and 0015 in with 95 confidenceThese ANNs coupled with acoustic emission sensors showed promise for the creationof an SHM system for aerospace systems
1 Introduction
Even though the current method of inspecting aircraft con-sisting of ground inspections for damage after a set numberof flight hours works well from an aircraft safety point ofview it can be improved upon for greater productivity Anin-flight structural health monitoring (SHM) system wouldallow for better use of components as specific lifetimescould be determined Maintenance cost might be reducedsince an SHM system could be embedded into the aircraftstructure thereby reducing or eliminating the need to removethe aircraft from service to scan for damage during theground inspection Ground inspections of aircraft even usingsimple nondestructive testing techniques generally requirethe aircraft be pulled from service so that its components canbe inspected for damage Structural components are replacedif sufficient damage is found Research is underway to developa structural health monitoring (SHM) system as a meansto improve current maintenance procedures This system
would consist of an array of sensors and associated analysiswhich would scan for damage in-flight and perform real-timedamage analysis of an aircraftrsquos structure If damage is recog-nized long before failure occurs then a damage tolerance andprognostic assessment could be implemented allowing for adetermination of the remaining life of components
This paper contains the results of an investigation of theabilities of a passive ultrasonic scanning system called anacoustic emission system The focus of this research effortwas on the development of a quick accurate and precisemethod of automating a structural health monitoring (SHM)system to optimize the analysis capabilities of an acousticemission system in order to locate and assess damage in astructural component The basic acoustic emission systemwas augmented with an artificial neural network analysisto provide near real-time analysis of acoustic emissiondata measured from aircraft structural components duringroutine service operations
2 The Scientific World Journal
11 Acoustic Emission As a crack propagates in a materialmolecular bonds are broken releasing small amounts ofenergy The energy released spreads throughout the sur-rounding material in the form of strain waves These wavesare minute deformations in the material with wave fre-quencies in the ultrasonic range from 500 kHz to 3MHzGenerally all structural deformations transmit some form ofenergy into the material resulting in waves similar to thoseof crack growth The acoustic emission system of the studyconsisted of piezoelectric sensors which were configuredto receive waves generated by other sources such as crackextensions or impact events within the structural componentunder investigationHowever the detectedwaves can be quitecomplex due to how strain waves travel in solid structuresbased on wave dispersion and effects of geometry boundaries[1ndash3] The recorded voltage time histories were broken downinto characteristics of the waves such as amplitude rise timeand duration using software provided by Physical AcousticsCorporation [4] These characteristics of the waves wererecorded with a network of sensors and analyzed via differentsoftware methods through MATLAB [5] and NeuralWorks[6] to determine if cracks were present and growing andwhether the structural component should be replaced Acustom designed artificial neural network was used for thepost-processing analysis of the detected waves
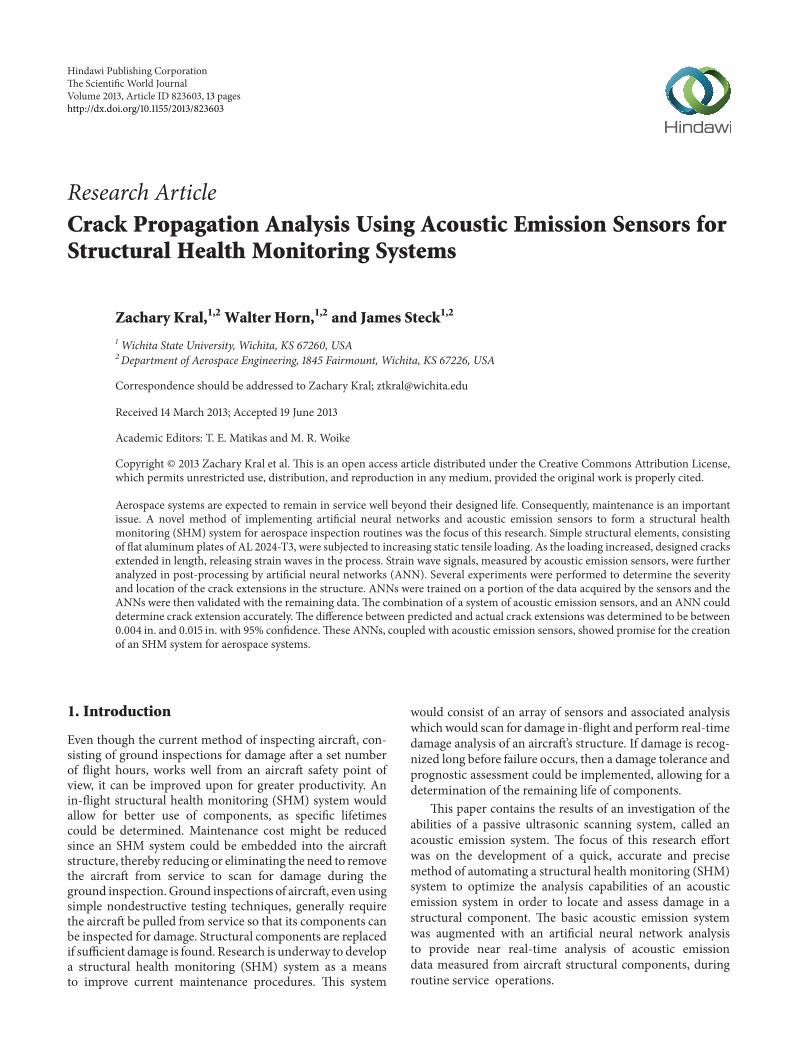
The energy released during the deformation of a materialoccurs at two stages of the deformation One is at the onsetof plastic deformation and the other when fracture occursThis can be illustrated using the results of a simple testperformed at the National Institute for Aviation Research(NIAR) at Wichita State University A metallic coupon wassubjected to amonotonically increasing pseudo-static tensileload with one acoustic emission sensor attached The resultsof the test to failure are presented in Figure 1 The load-displacement curve illustrated as the solid line in the figurefollows the normal convention of being linear to the yieldpoint and nonlinear thereafter Each of the discrete pointson the plot is a measurement of the hit count of each strainwave detected during the test The strain wave was detectedif the voltage received by the sensors was above 00178VThe hit count is the number of signal excursions over thisdefined threshold Other waveform characteristics can beobtained and used as a description of a strain wave Otherresearchers have used the rise time [7] or energy of a waveto describe a signal obtained The hit count property hasa linear correlation with the energy of the signal as wellAlthoughmore signal properties could aid in a better damagedetection system these initial experiments focused on thehit count as the sole wave property At the yield strengthof around 1700 lb and displacement of 0133 in some strainwaves were detected and recorded At the point of fracturemore strain waves were detected with similar levels of energyAt the instant of final fracture two strain waves with largeenergy were measured Thus the two main states associatedwith released strain waves detectable by an acoustic emissionsystem are at the onset of plastic deformation and at the pointof fracture The research reported in this paper involved anexamination of the energy of strain waves produced at a cracktip at the instant of extension to determine the severity of the
0
500
1000
1500
2000
2500
0 005 01 015 02 025Displacement (in)
Load
(lb)
1
10
100
1000
10000
100000
Hit
coun
t
Load (lb)YieldfractureWave detections
Figure 1 Correlation of the detected strain waves and the load-displacement curve of a uniaxially loaded metal sample withsingle acoustic emission sensor Individual points are the energiesassociated with individual strain waves detected by sensor
fracture A second theory was proposed and observed thatmight provide a method to better locate growing cracks instructures by accounting for the presence of the plastic zonein the vicinity of the crack tip
Energy is released within a material for two differenttransition events when the deformation of the materialchanges from pure elastic deformation to a combination ofelastic and plastic deformation and at the point of crackextension associated with fracture This energy is detectableby the piezoelectric sensors of the acoustic emission systemThe amount of energy released by a fracture is generally fargreater than the amount accompanying plastic deformationHowever both instances occur for growing cracks The tipof a crack is the site for very large stresses Before the crackextends a region or zone of plastic deformation is achievedin the vicinity of the crack tip This plastic region can beapproximated using Von Mises criterion to determine theboundaries of the plastic zone For the thin-walled structuresof this research the plastic zone covered a very small regionnear the crack tip while the major portion of the structureunderwent purely elastic deformation
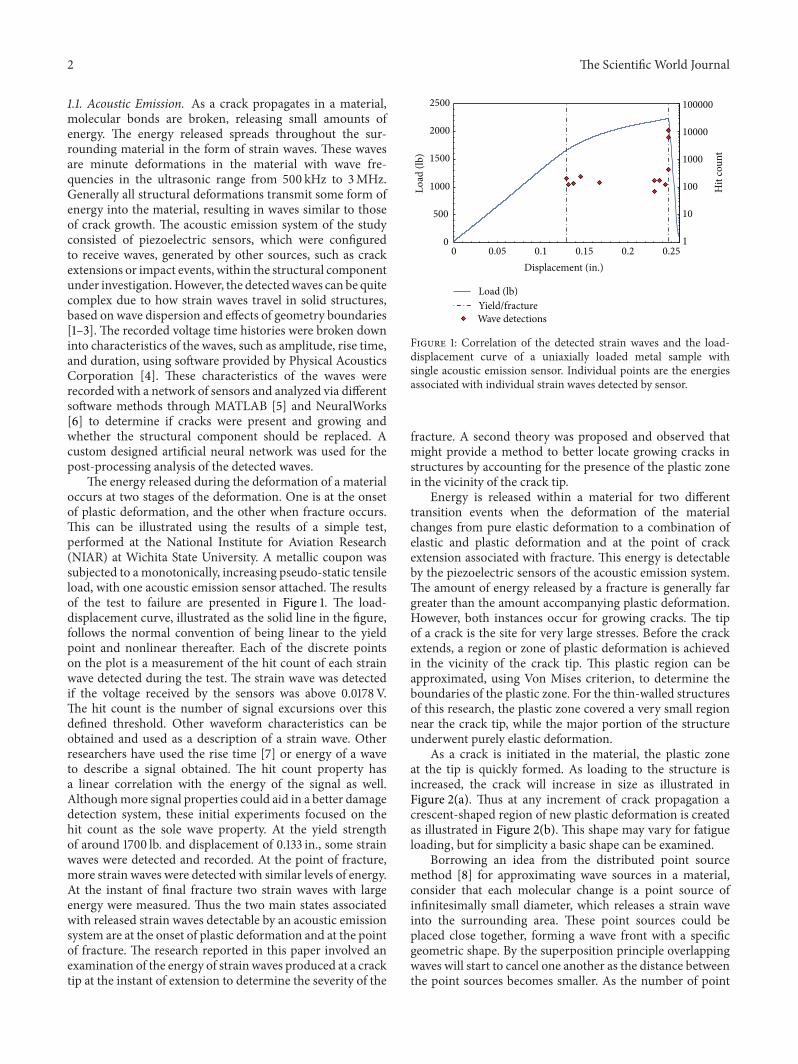
As a crack is initiated in the material the plastic zoneat the tip is quickly formed As loading to the structure isincreased the crack will increase in size as illustrated inFigure 2(a) Thus at any increment of crack propagation acrescent-shaped region of new plastic deformation is createdas illustrated in Figure 2(b) This shape may vary for fatigueloading but for simplicity a basic shape can be examined
Borrowing an idea from the distributed point sourcemethod [8] for approximating wave sources in a materialconsider that each molecular change is a point source ofinfinitesimally small diameter which releases a strain waveinto the surrounding area These point sources could beplaced close together forming a wave front with a specificgeometric shape By the superposition principle overlappingwaves will start to cancel one another as the distance betweenthe point sources becomes smaller As the number of point
The Scientific World Journal 3
InitialFinalCrack tip
Initial plastic zone
Finalplastic zone
(a) Crack and plastic zone growth
PlasticCrack tip
(b) Region of new plastic deformation
Figure 2 Crack tip and plastic zone for a thin plate
sources increases to infinity and the distance between pointsapproaches zero the geometric shape of the wave becomescontinuous and smooth Waves will travel outward with thissmooth shape in a direction normal to the boundary of theshape This idea is illustrated in Figure 3 using a straight lineas an example This idea was originally used for generatingwave shapes by piezoelectric actuators However this ideamay also be applied to a collection of point sources generatedby the crescent shape of the new plastic region formed duringcrack growth rather than a series of actuators The widerregion of the crescent shape near the horizontal axis inFigure 2(b) contains more energy than at the sharp pointedtips of the new plastic zone Thus acoustic emission sensorsahead of the tip of the growing crack will detect strain wavesof higher magnitude of energy when compared to sensorsdetecting the same wave above or behind the direction ofa growing crack (see Figure 4) For example in the figureenergy from a strain wave received by sensor (b) would begreater than the energy of the same wave received by sensor(a) Based on the direction of the growing crack a wedgeshape of intensity or magnitude of energy can be drawnprotruding outward from the crack tip In other words thedetected wave energy increases as 120579 approaches 0This allowsfor a line-of-sight principle to be applied to triangulationmethods to compare detections at multiple sensors resultingfrom the same wave This effect is observed in a followingexperiment using aluminum material to confirm the notionof directional strain waves propagating from a crack tipduring crack extension
12 Artificial Neural Network Thenervous system of humansconsists of a network of passive sensors capable of detectingchanges within the body If a change is detected the systemreacts by sending a signal to the brain for further analysis of
(a) (b) (c)
Figure 3 Distributed point source method idea illustrated (a)Single source (b) multiple sources and (c) infinite sources
Plastic zoneAdded plastic deformation
Crack tipSensors
(b)(a)
(c) (d)
120579
Figure 4 Sensor placement regions around a crack tip (a) receiveslowest energy waves (b) receives highest energy waves and (c)receives lower energy waves compared to (d)
4 The Scientific World Journal
the situation More intense signals are generated for largeranomalies that identify the specific location of the anomalyA similar idea for a passively scanning SHM system for anaircraft has been studied for this paper That is as a crackgrows in a structural component the amount of energyreleased as strain waves is linked to the size of the crackpropagation For large crack growth more energy is releasedand thusmore intense strainwaves are detected by an acousticemission system
An artificial neural network (ANN) is an analysis systemthat emulates the process of the brain of humans in that a setof inputs is analyzed to obtain a desired output set This pro-cess allows for approximate but quick analysis of complexproblems and systems An ANN utilizes pattern recognitionand rapid analysis for approximations of varying datasetsIt is fault and noise tolerant and can account for someunknown variables and errors in the data and still achievea desired output The ANN was an attractive candidatesystem to analyze the complex ultrasonic waves travelingthrough the material due to the presence of nonrelatednoise and other unaccounted or unknown variables [1] AnANN was sought to mimic the ability of the human nervoussystem to determine the location and extent of damagePrevious research has found damage detection to be a suitableapplication for ANN as well [8]
Artificial neural networks were first created around thesame time as serial computers were introduced These net-works were composed of algorithms to mimic the thoughtprocesses of an organic brain to analyze a set of inputs in orderto obtain a desired output set Through a fuzzy logic systemthe human thought process was emulated mathematicallywith a network of connected nodes and adjustable weightedvalues on the paths connecting the nodes which can establisha relationship of a set of input variables to a set of outputvariables Similar to a human brain this network can beldquotaughtrdquo the relationship of inputs to outputs using examplesets of inputs and outputs After a sufficient number ofexamples have been introduced the network can then beused to determine a trained approximation for the outputassociated with a new input set within the range of theexamples used for training This process approximates theoutput set using ldquofuzzyrdquo logic The true power of a neuralnetwork is demonstrated when used to evaluate complexproblems Because of the training process of neural net-works a complex relationship of inputs to outputs can befound quickly accurately and precisely if taught well Theadvantages offered by the neural network when applied toa structural health monitoring system of ultrasonic sensorsallow for quick assessment of the complex strain wave signalsgenerated by the piezoelectric signals This could result in anaccurate almost real-time damage assessment of structuralcomponents whichmay occur while the aircraft is in-serviceDue to the constraints of strain waves travelling through thematerial received by the acoustic emission sensor travel bywire to a computer and finally analyzed to obtain usableresults no SHM system will be truly instantaneous in realtime The efforts of the research presented in this paper wereto develop a system which will be as fast as possible allowingfor almost real-time sensing and analyzing
Other researchers have investigated the integration ofartificial neural networks in structural health monitoringsystems Lee et al have developed a structural neural systemwhich utilizes acoustic emissions and a specialized datacollection process to determine damage location in a flatstructure [9] A similar research investigated the potentialof artificial neural networks as a means to postprocesscomplicated ultrasonic signals Strain waves from a pointsource were detected by a series of piezoelectric strips Thesignals from these strips were used in a feed-forward artificialneural network to determine locationThe systemwas provento locate point sources within the area of interest on thestructure This research demonstrated that there is a possibleuse of artificial neural networks coupled with nondestructiveevaluation techniques to identify damagewithin the structure[10] Another example is the research work performed byCrupi et al An artificial neural network was trained to knowwhat the normal operating conditions were Any deviationto this would be from the result of damage The outlierin data would be a signal that damage was present withinthe system and further investigation would be required[11] Artificial neural networks have also been employed tobuilding structures By analyzing the natural frequencies of abuildingrsquos frame an artificial neural network had learned toestimate damage severity on a scale from 0 to 1 The networkwas proven to predict the presence with low error [12]Previous research studies have demonstrated that artificialneural networks are applicable in the field of nondestructivetesting
The concept of an artificial neural network was intro-duced by McCulloch and Pitts in the 1940s RumelhartHinton and Williams provided significant improvements ofthe procedure by including increased learning and solvingabilities for complex problems during their work in the 1980s[13] Through these studies a neural network process wasdeveloped that was suitable for application in the ultrasonictesting addressed in this research
An ANN is a system of connected nodes activated whensufficient incoming signals are received Each node has abinary activation of active or not that is 1 or 0 alongwith partial activations between 0 and 1 to account forapproximations or ldquofuzzy logicrdquo If a node is activated itsends a signal to the next set of nodes Each connectionbetween a node and the next layer of nodes has a weightedvalue as well affecting how the outputs of each node affectthe next receiving node The system then ldquolearnsrdquo fromtraining examples by optimizing these internodal weights toobtain an ideal input-to-output operation The architectureof the networks used in this investigation was a simple one-way network consisting of layers of nodes which affect thenext layer Similar to control theory the network createdwas called a feed-forward network where all connectionsbetween nodes are one directional as illustrated in Figure 5No signals were sent backward through the network so thatthe process is not time dependant and thus most suitable forthis problem The input variables form their own first setor layer of nodes in the network and then several sets ofnodes called hidden layers follow The network illustratedin Figure 5 is a feed-forward network with only one hidden
The Scientific World Journal 5
X1
Xi
Xm
Z1
Zj
Zn
w1111
vi1
vij
v
vm1
vmj
v1nvin
v1j
vmn
wj1
wn1
w1kwjk
wnk
w1p
wjp
wnp
O1
Ok
Op
Y1
Yk
Hidden layer Output layerInput layer
Yp
Figure 5 Feed-forward artificial neural network adapted from [9]
layer however multiple hidden layers may be added as wellThe final layer of nodes is the output set representing theoutput of the entire network
ANNs optimize these internodal weights by ldquolearningrdquoa dataset of inputs to outputs using a training datasetThis is usually a general sweep of combinations of inputsto outputs that the network would encounter in operationOnce taught a set of inputs to outputs the neural networkcan be used to analyze new spontaneous datasets whichfall within the range of the data contained in the learningdataset The advantage of the neural network lies in itsability to use this learning procedure to approximate outputsassociated with approximate inputs which would otherwiserequire strenuous time-consuming methods to determinethe appropriate inputoutput relationship Crack detection inan aircraft SHM system requires fast accurate detection andanalysis of the condition of structural components in flightto assure that damage is recognized before structural failureoccurs
Each node of the network follows a mathematical modelrepresented by (1) where function 119891 is a sigmoid functionand the notation is taken from that of Figure 5
119874119896 = 119891(
119899
sum
119895=1
119908119895119896 sdot 119885119895) (1)
Here the sum of the weighted outputs of the hiddenlayer 119885119895 which are connected to node 119896 in the output layergoes into an activation function which then becomes theoutput for node 119896 in the output layer119874119896 This equation is themathematical model for a node in the output layer but it alsoapplies to all other nodes in previous layers as well Unlikeserial or digital computers where the activation function islimited to a hard threshold of on or off (1 or 0 resp) neuralnetworks allow for smooth transitions resulting in betterapproximations of similar functions
Adjustment of the weights between the nodes comesabout through a method presented by Rumelhart HintonandWilliams [13] which involves using the error between thedesired outputs 119905119896 and the output obtained by the network
119874119896 to adjust the weights 119908119895119896 of Figure 5 and (1) using (2)below
Δ119908119895119896 = 120572 sdot 119885119895[
[
(119905119896 minus 119874119896) sdot 1198911015840(
119899
sum
119895=1
119908119895119896 sdot 119885119895)]
]
119908new119895119896= 119908
old119895119896+ Δ119908119895119896
(2)
This process based upon an optimization method ofadjustment by way of greatest descent uses a learning curverate designated as 120572 in (2) to adjust the weights slowlyThe error values for the output layer shown in the bracketsin (2) are transmitted backwards through the network ina similar way as described in (1) to determine the errorvalues for the hidden layer Once the error values have beendetermined theweight adjustments can be obtained for otherconnections within the network Through many iterations ofthe training dataset the weights within the neural networkcan be optimized
For the purposes of this study the trainingwas conductedby repeatedly introducing a training set of input-to-outputdata to the neural network until an RMS error 119864 reached aminimum value Using 119902 datasets within the training routinethe error was found using the following equation
119864 = radic1
119902
119902
sum
119894=1
119901
sum
119896=1
(119905119896 minus 119874119896)2
119894 (3)
After the entire collection of training sets was used inadjusting the weights once called an epoch an RMS errorwas computed The network was then constrained to learnfor a specific number of epochs before ending the trainingprocess The number of epochs required was large enough tofind a minimum RMS error point for the training sets
2 Experiment
Several experimentswere performed onflat aluminumpanels(Al 2024-T3) to determine the ability of an artificial neuralnetwork to analyze damage within a structural element Twodifferent panels were designed and used one with a width of6 in and a thickness of 0032 in and another with dimensionsof 4 in wide and 005 in thickness Detailed dimensions ofthe panels are illustrated in Figure 6 Flat thin panels wereused to simplify the experiments Two different methodswere investigated to utilize a neural network to determinethe severity or extension length of the crack growth and theposition of a crack tip These experiments are reported on inSections 21 and 22 respectively
21 Magnitude of Crack Extension The first series of experi-ments focused on determining the extension of a crack overa short period of time using an acoustic emission system Inthe case of stable crack growth further extension will ceaseafter a specific crack length is obtained The crack will notextend further until a certain load condition is appliedThesesmall crack extensions consist of rapid increasing bursts that
6 The Scientific World Journal
600
075
075
075
075050
8375
123754375
400
400
200
R250
53∘100
050
150
050
(a) Panel used for severity analysis thickness of0050 in
800
400
075
075075
075
050050
050
1593 1193 600
200
R250
53∘
100
100
150
120601025
(b) Panel used for location analysis thickness of0032 in
Figure 6 Dimensions of test panels used for experiment Panels consisted of Al 2024-T3
(a) Setup for test panel Panel is seen in pin clevis setup to be mounted into MTS Sintech 5G machine
Acoustic emission sensors
Double shear fixture
Clevis
Test panel
Acoustic emission sensors
Applied load
Edge crack
(b) Sensor placement for crack severity Acoustic emission sensors mounted in
(c) Sensor placement for plastic zone location trends Acoustic emission sensors mounted in a line parallel to
a line perpendicular to crack plane of the edge crack the crack plane of the edge crack
Figure 7 Test panel setup for detecting strain waves from crack propagation Setup for test panel in pin clevis setup to be mounted intoMTSSintech 5G machine
The Scientific World Journal 7
are close to instantaneous The purpose of these experimentswas to use the detections of an acoustic emission system for aknown crack extension to train an artificial neural network tolink certain detections to specific crack length growths Thetrained ANN could later be used to determine the length of acrack from acoustic emission measurements
Figure 6 contains drawings that detail the dimensionsof the two different test panels used in the experimentsThe panel shown in Figure 6(a) was subjected to a uniaxialtensile load to initiate crack extension in order tomeasure themagnitude of an increment of crack growth An initial crackwas cut into the panel from one of the side edges in the testregion and then the panel was statically loaded with an MTSSintech 5G machine through a pin and clevis setup as illus-trated in Figure 7 The loading was gradually increased untilcrack extension occurred The crack length was measured atspecific load intervals by an observer using digital calipersThese measured crack lengths were used to create a learningdataset for an artificial neural network Likewise they wereused to compare the crack extension calculated with a neuralnetwork relative to the actual measured values The acousticemission sensors located as shown in Figure 7 continuouslymonitored for any crack growth during the increasing-loadprocess The recorded acoustic emission signals were laterused for analysis with an artificial neural network Only twosensors were used for this test since crack growth size wasdesired and not the position of the crack (see Figure 7(b))The sensors were placed at similar positions away from thecrack tip to avoid any effects of plastic zone deformation aswell as confirm that the sensors were functioning properly
A neural network analysis program could not be added tothe Physical Acoustics software [4] used tomeasure the strainwaves in the test samplesTherefore themeasured strainwavedata were exported and post-processed A dataset was createdwith the acoustic emission software the measured elapsedtime and the wave characteristics for analysis described inthe following paragraph The commercial software Neural-Works [6] was used to create the neural network to generatethe datasets AMATLAB [5] programwas created to simulatereceiving the strain waves over time This was performed torecreate the experiment in a controlled program allowingease of data manipulation During the performance of theactual experiment software constraints did not allow theability to link a neural network analysis feature to the acousticemission softwareThusMATLABprogrammingwas used topost-process the experimental data using ANNs
The strain wave data were received continuously overtime For an artificial neural network input dataset a smalltime interval was used for determining the increment ofcrack growth associatedwith the large number of strainwavesdetected over the short period of time of the crack extensionThe energy values from each detected wave were placed into a10 bin histogramThe output consisted of the change in crackgrowth or difference from initial size to final size over thattime step These input and output datasets were used in thenetwork architecture illustrated in Figure 8 Experimentingwith different network architectures two hidden layers werefound to increase precision and accuracy of the output valueswhile minimizing the processing time of the network This
Bin
Bin
Bin
1
2
10
10 nodes 5 nodes 5 nodes 1 node(input layer) (hidden layer) (hidden layer) (output layer)
da
Figure 8 Artificial neural network created to determine the extentof crack growth for a small time interval
neural network system proved to work well for predicting themagnitude of crack growth for a flat panel
22 Crack Positioning The next series of experimentsfocused on crack location and the effects of sensor placementrelative to a crack tip positionThe purpose of the experimentwas to develop an artificial neural network system whichcould relate to the detections acquired from nearby acousticemission sensors and determine the location of the cracktip from which the strain waves originated Although moreresearch will be required to develop an artificial neuralnetwork capable of this process the research described inthis paper concerns the theoretical aspectsThrough a simpleexperiment the relative detections of neighboring acousticemission sensors were compared by an observer Based uponexisting trends a neural network could be developed andtrained to find similar trends The inputs consisted of thesame detected wave over several acoustic emission sensorsin this case the maximum amplitude of each detected wavewas the characteristic usedThe output of the artificial neuralnetworkwas the position of the crack tip fromwhich thewaveoriginated
Four acoustic emission sensors were used for the crackpositioning experimentThesewere placed in a line parallel tothe plane of the edge crack (see Figure 7(c))This positioningallowed for sensors to lie ahead of the crack front andother sensors to be behind the crack front The purpose ofthis experiment was to determine the validity of the theorydescribed earlier relative to the influence of the plastic zoneon the characteristics of the strain waves in the structure
3 Results and Discussion
The crack extension calculated by an artificial neural network(ANN) using the measured acoustic emission strain wavedata was comparedwith the actualmeasured crack extensionfor both training and testing datasets The abilities of theANN were assessed using an RMS error in comparison tothe actual and values predicted by the ANNs The conceptof plastic zone interference on the release of strain waves inthe material was examined as well leading to possible future
8 The Scientific World Journal
0
500
1000
1500
2000
2500
3000
0 100 200 300 400 500
Elapsed time (s)
Load
(lb)
1
10
100
Hit
coun
t
LoadCh 1Ch 2
(a) Acoustic emission detections from the entire experiment
2000
2100
2200
2300
2400
2500
2600
2700
390 392 394 396 400398Elapsed time (s)
Load
(lb)
1
10
100
Hit
coun
t
LoadCh 1Ch 2
(b) Acoustic emission data during the crack extension
Figure 9 Example of test results for panel load to onset of crack extension Each point on the plot is a single strain wave detected by eithersensor 1 or 2 Although some measurements appear simultaneous in recording there are microseconds between recordings
Detected hit
middot middot middot
Time tt0 = [0 0 0 0 ]
t1 = [0 0 0 0]
t2 = [0 0 0 0]
Figure 10 Example of the sliding timewindow used for experiment
research The neural networks created for this research werecapable of detecting the actual crack extension of the test set
31 Magnitude of Crack Extension
311 Training Datasets TheMTSmachine was configured toincrease the tensile load necessary to produce a displacementin the test section at a rate of 001 inmin The instrumenta-tion of the MTS machine tracked the loading force appliedto the test specimen as well as the applied displacementof one end of the specimen with respect to the other as afunction of time At a specific applied load the crack increasedin size as evidenced by a sudden drop in the force appliedand a corresponding sudden increase in the number of strainwaves detected by the acoustic emission system In additionany crack extension greater than 005 in was audible to theobservers of the experiment As soon as these phenomenawere detected the MTSmachine was manually turned off sothat the displacement did not increase further and the applied
loadwent to zeroThe crack lengthwasmeasured using a dig-ital calipers and the displacement of the load heads was resetto the original position This process allowed for acousticemission detections for a series of finite increments of crackgrowth which could then be used for a training set for anartificial neural network to identify a crack extension event
The data contained in Figure 9 illustrate the resultsfor one of the experiments using the method describedabove For this case crack growth began around 396 secafter the initiation of the applied load Sudden decreasesin load indicate instances of crack extension As shown inFigure 9(b) a plot zoomed into the crack growth time periodthere were five different instances where increments of crackgrowth occurred (390 sec 393 sec 3952 sec 397 sec and398 sec) An accurate measurement of crack length growthwas only possible to be taken before and after applying loadto the panel The percentage of the total crack growth ateach instance was estimated such that the cumulative crackgrowth equaled the measured change of the crack length
Once increments of crack growth were estimated foreach intermediate time step the entire elapsed time fromthe beginning of loading was broken down into eight secondintervals of time or time windows A sliding time window forreal-time monitoring was created that stepped through timeat a step of 16 seconds This procedure allowed for multiplereadings from the samedetection (see Figure 10)Within eachtime window multiple detections could be observed Thesewere normalized into a histogram of the data within the timewindow thus removing any time dependence A histogramwas made of 10 bins grouping the values of the energyvalue of each strain wave between zero and a normalizedmaximum value of 100 The energy value had exponential
The Scientific World Journal 9
0
005
01
015
02
025
0 005 01 015 02 025Actual crack extension (in)
AN
N p
redi
cted
crac
k ex
tens
ion
(in)
(a) Training dataset
0
005
01
015
02
025
0 005 01 015 02 025Actual crack extension (in)
AN
N p
redi
cted
crac
k ex
tens
ion
(in)
(b) Testing dataset
Figure 11 Results of training an artificial neural network to determine the magnitude of crack growth These plots relate the target ormeasured size of crack growth in inches to the estimated ANN resultsThe correlation between the target values and ANN results was 09872for the training dataset and 09453 for the testing dataset
0200400600800
100012001400
0 100 200 300 400 500 600 700 800 900 1000Time (s)
Appl
ied
load
(lb)
1
10
100
1000
AE
hit c
ount
LoadCh 1Ch 2
Figure 12 Strain wave detections of acoustic emission sensorsfrom a panel under tensile loading Initial crack extension occurredaround 360 seconds and continued under displacement control
characteristics so a logarithmic scale was used Some strainwaves had an energy value of zero Thus the logarithmicvalue was not taken from these values Finally each timevalue was provided a crack growth amount and a groupingof either crack growth present or not Four examples of thefinal datasets are provided in Table 1
Two artificial neural networks were created for two sepa-rate purposes Both neural networks used the ten histogrambin values as input setsThe first network named the ldquoyes-nonetworkrdquo was a self-organizing map This network was usedto classify each time window into two groups ldquoyesrdquo crackgrowth was present or ldquonordquo crack growth present This wasaccomplished with a network with a Kohonen layer of 20nodes times 20 nodesThe neighborhood started at 15 nodes andwas decreased with each epoch until grouping was complete
Table 1 Example data sets of histogram values and respective crackgrowth sizes Time listed is for the start of the time window
Time (sec) Histogramvalues
Crack growthpresent (ldquoyesrdquo ldquonordquo)
Crack growthsize (in)
38180 0 0 0 1 0 0 1 0 0 0 0 1 038340 0 0 1 2 1 0 0 0 0 0 0 1 039140 16 7 4 7 0 1 0 0 0 0 1 0 0149539620 9 4 1 3 1 2 0 0 0 0 1 0 00299
These nine experiments were used to train this network intothe two groupsTheKohonen layerwas then connected to twooutput nodes each representing either ldquoyesrdquo or ldquonordquo to crackgrowthThe connections between the Kohonen layer and theoutput nodes were trained with the backpropagation usingthe NeuralWorks software Delta rule and used hyperbolictangent activation functionsThe purpose of this networkwasto filter out noise from the strain waves corresponding toactual crack growth
With this first network being completely trained a secondneural network called the ldquoseverity networkrdquo was con-structed This severity network used the histogram values todetermine the crack growth extension in inchesThe networkwas trained with the measured data of the nine experimentsusing only the timewindowswhere crack growthwas presentIt consisted of a backpropagation network with two hiddenlayers of five nodes each Again Delta rule training wasused along with hyperbolic tangent activation functions Theresults of the training process are presented in Figure 11From the nine experiments 106 datasets contained one of thedefined crack growth times From this 85 were used to trainthe neural network and the remaining 21 were used to initiallytest the abilities of the neural network The network wastrained for 50000 epochs or iterations through the datasets
10 The Scientific World Journal
0 100 200 300 400 500 600 700 800 9000
01
02
03
04
05
06
07
08
Elapsed time (s)
Crac
k le
ngth
(in
)
Ch 1 Ch 2Average
Ch 2
Ch 1
Average
(a) Individual sensor predictions
0
02
04
06
08
Crac
k le
ngth
(in
)
0
500
1000
1500
Load
(lb)
Load applied Crack length
0 100 200 300 400 500 600 700 800 900Elapsed time (s)
minus500
(b) Average crack length from both sensors Loading curve displayed aswell
Figure 13 Crack growth length over time approximated by neural networks
This number of iterations through the training data allowedfor the RMS error of the network to be minimized Figure 11shows the results for the trained and testing datasets used inthe neural networkThe graph on the left contains a display ofthe output relationship between the crack lengths measuredvalues and the length of the crack estimated by the artificialneural networkThe graph on the right shows the results fromthe testing datasetsThis figure shows the relation between themeasured size of the crack extension for each dataset in inchesand the output of the trained severity networkThe ideal casefor the graphs shown in the figure would be a straight linerepresenting a 1-to-1 ratio between actual measurements andthe ANN estimations Due to complexities these plots varyslightly but are close to the desired values with a resultingcorrelation of the plots of 09872 for the training datasetand 09453 for the testing dataset which are both close to avalue of 1 The predicted values of the ANN differed from theactual crack extensions by 0003 in and 0005 in with a 95confidence level For the testing set with the same confidencelevel the ANN differed the predictions from the actual crackextensions from0004 in to 0015 inThis showed promise forthe ability of a neural network to be a useful analysis tool ofa structural health monitoring system due to the very smalldifferences between the neural network estimated values ofcrack growth and the measured crack growth values
312 Testing Datasets Once the two artificial neural net-works were created and fully trained the next step was to usethese in a situation where datasets not previously presentedto the networks were used To accomplish this task a tenthexperiment was conducted However for this experimentthe MTS machine was not stopped at the initiation ofcrack growth but instead allowed to continue increasingdisplacement over an extended time The experiment wasfinally stopped around the 850 second mark The detections
of strain waves for this experiment are reported in Figure 12Only the initial and final crack lengths weremeasured for thisexperiment but some conclusions could be drawn from thedata The initial crack began to extend at around 360 sec Thecrack then slowly increased in size while the panel was loadedin displacement control until the loading was halted at about850 sec The total increase in crack size was measured to be0972 in
The measured AE data shown in Figure 12 indicate thatthere was a great deal of noise andmany strainwaves detectedafter the crack extension was initiated This dataset wasevaluated using the neural networks using the same timewindows as those of the training sets Histograms were madeof ten bins each with the same range as before This newdataset was first used in the yes-no network Here the outputsof the network categorized each histogram into either crackgrowth or noise present The datasets determined to be crackgrowth and not noise were then used in the severity networkThis network then determined the size of the increment ofcrack growth over the time window
This experiment used two separate sensors The datafrom each sensor were separated and run through the twoneural networks Figure 13(a) contains graphs of the resultsof the networks in terms of crack length As time increasedin the experiment the total crack length increased Finallyan average of the two signals was taken to determine anet crack length value This average crack growth length isillustrated again in Figure 13(b) along with the load historyThe crack length followed the trend predicted by the shapeof the loading curve A sudden increase in the length of thecrack occurred at the time crack extension began and thecrack slowly increased in size as the controlled displacementof the MTS machine continued The final length of thecumulative crack extension length computed using the resultsof the neural network predictions shown in Figure 13(b) was
The Scientific World Journal 11
0
051
152
25
Position (in)
Posit
ion
(in)
minus25minus2
minus15minus1
minus05
05 15 25 35 45 55 65minus05
CrackInitial PZ
Added PZPanel
(a) First loading
Posit
ion
(in)
0
051
152
25
minus25minus2
minus15minus1
minus05
Position (in)05 15 25 35 45 55 65minus05
CrackInitial PZ
Added PZPanel
(b) Second loading
Position (in)
Posit
ion
(in)
0
051
152
25
minus25minus2
minus15minus1
minus05
05 15 25 35 45 55 65minus05
CrackInitial PZ
Added PZPanel
(c) Third loading
Position (in)05 15 25 35 45 55 65
Posit
ion
(in)
0
051
152
25
minus25minus2
minus15minus1
minus05
minus05
Final PZPanelCrack
(d) Final condition
Figure 14 Crack location and sensor placement Plastic zone is shown around the propagating crack tip Sensors are labeled Channels 1 to 4from right to left
06805 in This measured value of the total crack extensionwas of 0810 in or a difference of 013 in Sensor 2 receivedmore acoustic emission signal detections than sensor 1Thussensor 2 reflectedmore reliable events andwas amore reliablesensor A weighted average with more emphasis on sensor 2resulted in an approximation of 0700 in or a difference of009 in This difference was considered to be an acceptableapproximation for the purposes of this experiment
32 Crack Location and Plastic Phenomenon Figure 14 illus-trates the location of four sensors relative to a crack duringcrack extension The plastic zone at the crack tip has beenshown to increase in size until the final crack length of 198 inFor each increment of crack growth a single detectable strainwave was produced and is shown in Figure 15 For this exper-iment the amplitude of the strain wave was the characteristicof the wave used for comparison As the crack grew thesingle strain wave was detected by each of the four sensorsFor crack growths before the final increment the detected
amplitudes of the strain waves at each sensor remained closeto one another However for the large extension of the cracktip the detected amplitudes of the strainwave became skewedAs shown in Figure 15(c) the sensors closest to the cracktip sensors 2 and 3 received the highest amplitude waveswith sensor 1 detecting the third largest amount The wavesdetected by sensor 4 had smaller amplitudes compared to theother three sensorsThesemeasured observations support thetheory presented earlier regarding the effects of location ofthe crack tip and growth direction relative to the position ofthe sensor
Further if this trend is recognizable to an observer of theexperiment then an artificial neural network should be ableto deduce a similar trend and be able to predict location of acrack by the amplitude of the detected wave With multiplesensors of known positions detecting the same waves acomparison between amplitudes of different sensors withknown locations might be used to determine the location ofthe crack tip in a structure
12 The Scientific World Journal
0
20
40
60
80
100
120
140
160
180
200
0Elapsed time (s)
Hit
coun
t
Ch 1Ch 2
Ch 3Ch 4
1E minus 05 2E minus 05 3E minus 05
(a) First loading
0
20
40
60
80
100
120
140
160
180
200
Hit
coun
t
0Elapsed time (s)
Ch 1Ch 2
Ch 3Ch 4
1E minus 05 2E minus 05 3E minus 05
(b) Second loading
Elapsed time (s)
1
10
100
1000
10000
0 05 1
Hit
coun
t
Ch 1Ch 2
Ch 3Ch 4
(c) Third loading
Figure 15 Strain wave detections from crack propagationThe panel was loaded and then unloaded after crack initiation Each crack ldquogrowthrdquoshown is the result of the crack becoming unstable and then stabilizing at a new length
The proof of concept was examined in this experimentDue to limited data and knowledge of the wave propertiesthis process will need to be explored in future studiesFurther testing and researchwill be performed by locating theposition of actual crack propagation Since energy is releasedat the crack tips these will be the positions located by theneural network allowing the entire crack to be determinedas the distance between the two close crack tipsThis networkwill then be coupled with a crack severity neural network todetermine the ability of neural networks to assess damagedetected by an acoustic emission system Future study willinvolve combining the severity artificial neural network anda new neural network to determine the location of the cracktip
4 Conclusion
A novel method of implementing artificial neural networksand acoustic emission sensors to form a structural healthmonitoring system for metallic structures was presentedFlat aluminum panels similar in thickness to those foundin many aerospace structures were subjected to increasingstatic loading during laboratory tests As the load increaseda crack in the panel increased in size releasing strain wavesinto the materialThese waves were then detected by acousticemission sensors and artificial neural networks were imple-mented to analyze the strain waves From a feed-forwardneural network the crack length could be approximatedwith reasonable precision Plastic zone influence on strainwaves released was also observed during the analysis of the
experimental data Through a second experiment sensorsplaced behind the crack front were found to detect waveswith smaller amplitudes than the sensors placed in otherlocations Future study will involve using this knowledgeto train or teach an artificial neural network to determinethe location of a growing crack based on this differencein amplitude These two artificial neural networks coupledwith acoustic emission sensors form the initial stages of thedevelopment of a structural health monitoring system foraerospace systems with the capability of determining damageseverity and locations within structures
Nomenclature
ANN Artificial neural networkNIAR National Institute for Aviation ResearchSHM Structural health monitoring119864 Root mean square error119874119895 Output from node 119895 in an artificial neural
network119905119896 Desired or target values for an output
dataset119908119894119895 V119894119895 Weight for path from node 119894 to node 119895 of
an artificial neural network119883119894 119884119894 119885119894 Node 119894 in row of input hidden or output
layers of an artificial neural networkrespectively
120572 Learning coefficient120579 Angle of deviation from the plane of a
crack
The Scientific World Journal 13
Acknowledgment
The authors thank the Department of Energy for its support(DOE DE-FG36-08GO88149)
References
[1] J L Rose ldquoDispersion curves in guided wave testingrdquoMaterialsEvaluation vol 61 no 1 pp 20ndash22 2003
[2] D Mateescu H Yong and A K Misra ldquoAnalysis ofsmart structures with piezoelectric strips subjected tounsteady aerodynamic loadsrdquo in Proceedings of the 48thAIAAASMEASCEAHSASC Structures Structural Dynamicsand Materials Conference pp 3662ndash3680 Honolulu HawaiiUSA April 2007
[3] T Kundu Ultrasonic Nondestructive Evaluation Engineeringand Biological Material Characterization CRC Press BocaRaton Fla USA 2004
[4] Physical Acoustics Corporation PCI-2 BaSedAE SyStemUSerrsquoSManual Rev 3 Princeton NJ USA 2007
[5] The MathWorks Inc ldquoMATLAB v6 5 0 180913a Release 13Manualrdquo Software Package 2002
[6] NeuralWare Inc ldquoNeuralWorks Professional IIPLUS UserrsquosManualrdquo Software Package 1997
[7] D G Aggelis E Z Kordatos and T E Matikas ldquoAcousticemission for fatigue damage characterization in metal platesrdquoMechanics Research Communications vol 38 no 2 pp 106ndash1102011
[8] D Placko and T Kundu DPSM For Modeling EngineeringProblems Wiley-Interscience Hoboken NJ USA 2007
[9] J Lee G Kirikera I Kang and M Schulz Structural HealthMonitoring Using Continuous Sensors andNeural Network Anal-ysis Institute of Physics Publishing Smart Material Structures15 University of Cincinnati Cincinnati Ohio USA 2006
[10] G R Kirikera J W Lee M J Schulz et al ldquoInitial evaluation ofan activepassive structural neural system for healthmonitoringof composite materialsrdquo Smart Materials and Structures vol 15no 5 p 1275 2006
[11] J W Lee G R Kirikera I Kang M J Schulz and V N ShanovldquoStructural health monitoring using continuous sensors andneural network analysisrdquo Smart Materials and Structures vol15 no 5 p 1266 2006
[12] V Crupi E Guglielmino and G Milazzo ldquoNeural-network-based system for novel fault detection in rotating machineryrdquoJVCJournal of Vibration and Control vol 10 no 8 pp 1137ndash1150 2004
[13] L Fausett Fundamentals of Neural Networks ArchitecturesAlgorithms andApplications PrenticeHall Upper Saddle RiverNJ USA 1994
International Journal of
AerospaceEngineeringHindawi Publishing Corporationhttpwwwhindawicom Volume 2014
RoboticsJournal of
Hindawi Publishing Corporationhttpwwwhindawicom Volume 2014
Hindawi Publishing Corporationhttpwwwhindawicom Volume 2014
Active and Passive Electronic Components
Control Scienceand Engineering
Journal of
Hindawi Publishing Corporationhttpwwwhindawicom Volume 2014
International Journal of
RotatingMachinery
Hindawi Publishing Corporationhttpwwwhindawicom Volume 2014
Hindawi Publishing Corporation httpwwwhindawicom
Journal ofEngineeringVolume 2014
Submit your manuscripts athttpwwwhindawicom
VLSI Design
Hindawi Publishing Corporationhttpwwwhindawicom Volume 2014
Hindawi Publishing Corporationhttpwwwhindawicom Volume 2014
Shock and Vibration
Hindawi Publishing Corporationhttpwwwhindawicom Volume 2014
Civil EngineeringAdvances in
Acoustics and VibrationAdvances in
Hindawi Publishing Corporationhttpwwwhindawicom Volume 2014
Hindawi Publishing Corporationhttpwwwhindawicom Volume 2014
Electrical and Computer Engineering
Journal of
Advances inOptoElectronics
Hindawi Publishing Corporation httpwwwhindawicom
Volume 2014
The Scientific World JournalHindawi Publishing Corporation httpwwwhindawicom Volume 2014
SensorsJournal of
Hindawi Publishing Corporationhttpwwwhindawicom Volume 2014
Modelling amp Simulation in EngineeringHindawi Publishing Corporation httpwwwhindawicom Volume 2014
Hindawi Publishing Corporationhttpwwwhindawicom Volume 2014
Chemical EngineeringInternational Journal of Antennas and
Propagation
International Journal of
Hindawi Publishing Corporationhttpwwwhindawicom Volume 2014
Hindawi Publishing Corporationhttpwwwhindawicom Volume 2014
Navigation and Observation
International Journal of
Hindawi Publishing Corporationhttpwwwhindawicom Volume 2014
DistributedSensor Networks
International Journal of
2 The Scientific World Journal
11 Acoustic Emission As a crack propagates in a materialmolecular bonds are broken releasing small amounts ofenergy The energy released spreads throughout the sur-rounding material in the form of strain waves These wavesare minute deformations in the material with wave fre-quencies in the ultrasonic range from 500 kHz to 3MHzGenerally all structural deformations transmit some form ofenergy into the material resulting in waves similar to thoseof crack growth The acoustic emission system of the studyconsisted of piezoelectric sensors which were configuredto receive waves generated by other sources such as crackextensions or impact events within the structural componentunder investigationHowever the detectedwaves can be quitecomplex due to how strain waves travel in solid structuresbased on wave dispersion and effects of geometry boundaries[1ndash3] The recorded voltage time histories were broken downinto characteristics of the waves such as amplitude rise timeand duration using software provided by Physical AcousticsCorporation [4] These characteristics of the waves wererecorded with a network of sensors and analyzed via differentsoftware methods through MATLAB [5] and NeuralWorks[6] to determine if cracks were present and growing andwhether the structural component should be replaced Acustom designed artificial neural network was used for thepost-processing analysis of the detected waves
The energy released during the deformation of a materialoccurs at two stages of the deformation One is at the onsetof plastic deformation and the other when fracture occursThis can be illustrated using the results of a simple testperformed at the National Institute for Aviation Research(NIAR) at Wichita State University A metallic coupon wassubjected to amonotonically increasing pseudo-static tensileload with one acoustic emission sensor attached The resultsof the test to failure are presented in Figure 1 The load-displacement curve illustrated as the solid line in the figurefollows the normal convention of being linear to the yieldpoint and nonlinear thereafter Each of the discrete pointson the plot is a measurement of the hit count of each strainwave detected during the test The strain wave was detectedif the voltage received by the sensors was above 00178VThe hit count is the number of signal excursions over thisdefined threshold Other waveform characteristics can beobtained and used as a description of a strain wave Otherresearchers have used the rise time [7] or energy of a waveto describe a signal obtained The hit count property hasa linear correlation with the energy of the signal as wellAlthoughmore signal properties could aid in a better damagedetection system these initial experiments focused on thehit count as the sole wave property At the yield strengthof around 1700 lb and displacement of 0133 in some strainwaves were detected and recorded At the point of fracturemore strain waves were detected with similar levels of energyAt the instant of final fracture two strain waves with largeenergy were measured Thus the two main states associatedwith released strain waves detectable by an acoustic emissionsystem are at the onset of plastic deformation and at the pointof fracture The research reported in this paper involved anexamination of the energy of strain waves produced at a cracktip at the instant of extension to determine the severity of the
0
500
1000
1500
2000
2500
0 005 01 015 02 025Displacement (in)
Load
(lb)
1
10
100
1000
10000
100000
Hit
coun
t
Load (lb)YieldfractureWave detections
Figure 1 Correlation of the detected strain waves and the load-displacement curve of a uniaxially loaded metal sample withsingle acoustic emission sensor Individual points are the energiesassociated with individual strain waves detected by sensor
fracture A second theory was proposed and observed thatmight provide a method to better locate growing cracks instructures by accounting for the presence of the plastic zonein the vicinity of the crack tip
Energy is released within a material for two differenttransition events when the deformation of the materialchanges from pure elastic deformation to a combination ofelastic and plastic deformation and at the point of crackextension associated with fracture This energy is detectableby the piezoelectric sensors of the acoustic emission systemThe amount of energy released by a fracture is generally fargreater than the amount accompanying plastic deformationHowever both instances occur for growing cracks The tipof a crack is the site for very large stresses Before the crackextends a region or zone of plastic deformation is achievedin the vicinity of the crack tip This plastic region can beapproximated using Von Mises criterion to determine theboundaries of the plastic zone For the thin-walled structuresof this research the plastic zone covered a very small regionnear the crack tip while the major portion of the structureunderwent purely elastic deformation
As a crack is initiated in the material the plastic zoneat the tip is quickly formed As loading to the structure isincreased the crack will increase in size as illustrated inFigure 2(a) Thus at any increment of crack propagation acrescent-shaped region of new plastic deformation is createdas illustrated in Figure 2(b) This shape may vary for fatigueloading but for simplicity a basic shape can be examined
Borrowing an idea from the distributed point sourcemethod [8] for approximating wave sources in a materialconsider that each molecular change is a point source ofinfinitesimally small diameter which releases a strain waveinto the surrounding area These point sources could beplaced close together forming a wave front with a specificgeometric shape By the superposition principle overlappingwaves will start to cancel one another as the distance betweenthe point sources becomes smaller As the number of point
The Scientific World Journal 3
InitialFinalCrack tip
Initial plastic zone
Finalplastic zone
(a) Crack and plastic zone growth
PlasticCrack tip
(b) Region of new plastic deformation
Figure 2 Crack tip and plastic zone for a thin plate
sources increases to infinity and the distance between pointsapproaches zero the geometric shape of the wave becomescontinuous and smooth Waves will travel outward with thissmooth shape in a direction normal to the boundary of theshape This idea is illustrated in Figure 3 using a straight lineas an example This idea was originally used for generatingwave shapes by piezoelectric actuators However this ideamay also be applied to a collection of point sources generatedby the crescent shape of the new plastic region formed duringcrack growth rather than a series of actuators The widerregion of the crescent shape near the horizontal axis inFigure 2(b) contains more energy than at the sharp pointedtips of the new plastic zone Thus acoustic emission sensorsahead of the tip of the growing crack will detect strain wavesof higher magnitude of energy when compared to sensorsdetecting the same wave above or behind the direction ofa growing crack (see Figure 4) For example in the figureenergy from a strain wave received by sensor (b) would begreater than the energy of the same wave received by sensor(a) Based on the direction of the growing crack a wedgeshape of intensity or magnitude of energy can be drawnprotruding outward from the crack tip In other words thedetected wave energy increases as 120579 approaches 0This allowsfor a line-of-sight principle to be applied to triangulationmethods to compare detections at multiple sensors resultingfrom the same wave This effect is observed in a followingexperiment using aluminum material to confirm the notionof directional strain waves propagating from a crack tipduring crack extension
12 Artificial Neural Network Thenervous system of humansconsists of a network of passive sensors capable of detectingchanges within the body If a change is detected the systemreacts by sending a signal to the brain for further analysis of
(a) (b) (c)
Figure 3 Distributed point source method idea illustrated (a)Single source (b) multiple sources and (c) infinite sources
Plastic zoneAdded plastic deformation
Crack tipSensors
(b)(a)
(c) (d)
120579
Figure 4 Sensor placement regions around a crack tip (a) receiveslowest energy waves (b) receives highest energy waves and (c)receives lower energy waves compared to (d)
4 The Scientific World Journal
the situation More intense signals are generated for largeranomalies that identify the specific location of the anomalyA similar idea for a passively scanning SHM system for anaircraft has been studied for this paper That is as a crackgrows in a structural component the amount of energyreleased as strain waves is linked to the size of the crackpropagation For large crack growth more energy is releasedand thusmore intense strainwaves are detected by an acousticemission system
An artificial neural network (ANN) is an analysis systemthat emulates the process of the brain of humans in that a setof inputs is analyzed to obtain a desired output set This pro-cess allows for approximate but quick analysis of complexproblems and systems An ANN utilizes pattern recognitionand rapid analysis for approximations of varying datasetsIt is fault and noise tolerant and can account for someunknown variables and errors in the data and still achievea desired output The ANN was an attractive candidatesystem to analyze the complex ultrasonic waves travelingthrough the material due to the presence of nonrelatednoise and other unaccounted or unknown variables [1] AnANN was sought to mimic the ability of the human nervoussystem to determine the location and extent of damagePrevious research has found damage detection to be a suitableapplication for ANN as well [8]
Artificial neural networks were first created around thesame time as serial computers were introduced These net-works were composed of algorithms to mimic the thoughtprocesses of an organic brain to analyze a set of inputs in orderto obtain a desired output set Through a fuzzy logic systemthe human thought process was emulated mathematicallywith a network of connected nodes and adjustable weightedvalues on the paths connecting the nodes which can establisha relationship of a set of input variables to a set of outputvariables Similar to a human brain this network can beldquotaughtrdquo the relationship of inputs to outputs using examplesets of inputs and outputs After a sufficient number ofexamples have been introduced the network can then beused to determine a trained approximation for the outputassociated with a new input set within the range of theexamples used for training This process approximates theoutput set using ldquofuzzyrdquo logic The true power of a neuralnetwork is demonstrated when used to evaluate complexproblems Because of the training process of neural net-works a complex relationship of inputs to outputs can befound quickly accurately and precisely if taught well Theadvantages offered by the neural network when applied toa structural health monitoring system of ultrasonic sensorsallow for quick assessment of the complex strain wave signalsgenerated by the piezoelectric signals This could result in anaccurate almost real-time damage assessment of structuralcomponents whichmay occur while the aircraft is in-serviceDue to the constraints of strain waves travelling through thematerial received by the acoustic emission sensor travel bywire to a computer and finally analyzed to obtain usableresults no SHM system will be truly instantaneous in realtime The efforts of the research presented in this paper wereto develop a system which will be as fast as possible allowingfor almost real-time sensing and analyzing
Other researchers have investigated the integration ofartificial neural networks in structural health monitoringsystems Lee et al have developed a structural neural systemwhich utilizes acoustic emissions and a specialized datacollection process to determine damage location in a flatstructure [9] A similar research investigated the potentialof artificial neural networks as a means to postprocesscomplicated ultrasonic signals Strain waves from a pointsource were detected by a series of piezoelectric strips Thesignals from these strips were used in a feed-forward artificialneural network to determine locationThe systemwas provento locate point sources within the area of interest on thestructure This research demonstrated that there is a possibleuse of artificial neural networks coupled with nondestructiveevaluation techniques to identify damagewithin the structure[10] Another example is the research work performed byCrupi et al An artificial neural network was trained to knowwhat the normal operating conditions were Any deviationto this would be from the result of damage The outlierin data would be a signal that damage was present withinthe system and further investigation would be required[11] Artificial neural networks have also been employed tobuilding structures By analyzing the natural frequencies of abuildingrsquos frame an artificial neural network had learned toestimate damage severity on a scale from 0 to 1 The networkwas proven to predict the presence with low error [12]Previous research studies have demonstrated that artificialneural networks are applicable in the field of nondestructivetesting
The concept of an artificial neural network was intro-duced by McCulloch and Pitts in the 1940s RumelhartHinton and Williams provided significant improvements ofthe procedure by including increased learning and solvingabilities for complex problems during their work in the 1980s[13] Through these studies a neural network process wasdeveloped that was suitable for application in the ultrasonictesting addressed in this research
An ANN is a system of connected nodes activated whensufficient incoming signals are received Each node has abinary activation of active or not that is 1 or 0 alongwith partial activations between 0 and 1 to account forapproximations or ldquofuzzy logicrdquo If a node is activated itsends a signal to the next set of nodes Each connectionbetween a node and the next layer of nodes has a weightedvalue as well affecting how the outputs of each node affectthe next receiving node The system then ldquolearnsrdquo fromtraining examples by optimizing these internodal weights toobtain an ideal input-to-output operation The architectureof the networks used in this investigation was a simple one-way network consisting of layers of nodes which affect thenext layer Similar to control theory the network createdwas called a feed-forward network where all connectionsbetween nodes are one directional as illustrated in Figure 5No signals were sent backward through the network so thatthe process is not time dependant and thus most suitable forthis problem The input variables form their own first setor layer of nodes in the network and then several sets ofnodes called hidden layers follow The network illustratedin Figure 5 is a feed-forward network with only one hidden
The Scientific World Journal 5
X1
Xi
Xm
Z1
Zj
Zn
w1111
vi1
vij
v
vm1
vmj
v1nvin
v1j
vmn
wj1
wn1
w1kwjk
wnk
w1p
wjp
wnp
O1
Ok
Op
Y1
Yk
Hidden layer Output layerInput layer
Yp
Figure 5 Feed-forward artificial neural network adapted from [9]
layer however multiple hidden layers may be added as wellThe final layer of nodes is the output set representing theoutput of the entire network
ANNs optimize these internodal weights by ldquolearningrdquoa dataset of inputs to outputs using a training datasetThis is usually a general sweep of combinations of inputsto outputs that the network would encounter in operationOnce taught a set of inputs to outputs the neural networkcan be used to analyze new spontaneous datasets whichfall within the range of the data contained in the learningdataset The advantage of the neural network lies in itsability to use this learning procedure to approximate outputsassociated with approximate inputs which would otherwiserequire strenuous time-consuming methods to determinethe appropriate inputoutput relationship Crack detection inan aircraft SHM system requires fast accurate detection andanalysis of the condition of structural components in flightto assure that damage is recognized before structural failureoccurs
Each node of the network follows a mathematical modelrepresented by (1) where function 119891 is a sigmoid functionand the notation is taken from that of Figure 5
119874119896 = 119891(
119899
sum
119895=1
119908119895119896 sdot 119885119895) (1)
Here the sum of the weighted outputs of the hiddenlayer 119885119895 which are connected to node 119896 in the output layergoes into an activation function which then becomes theoutput for node 119896 in the output layer119874119896 This equation is themathematical model for a node in the output layer but it alsoapplies to all other nodes in previous layers as well Unlikeserial or digital computers where the activation function islimited to a hard threshold of on or off (1 or 0 resp) neuralnetworks allow for smooth transitions resulting in betterapproximations of similar functions
Adjustment of the weights between the nodes comesabout through a method presented by Rumelhart HintonandWilliams [13] which involves using the error between thedesired outputs 119905119896 and the output obtained by the network
119874119896 to adjust the weights 119908119895119896 of Figure 5 and (1) using (2)below
Δ119908119895119896 = 120572 sdot 119885119895[
[
(119905119896 minus 119874119896) sdot 1198911015840(
119899
sum
119895=1
119908119895119896 sdot 119885119895)]
]
119908new119895119896= 119908
old119895119896+ Δ119908119895119896
(2)
This process based upon an optimization method ofadjustment by way of greatest descent uses a learning curverate designated as 120572 in (2) to adjust the weights slowlyThe error values for the output layer shown in the bracketsin (2) are transmitted backwards through the network ina similar way as described in (1) to determine the errorvalues for the hidden layer Once the error values have beendetermined theweight adjustments can be obtained for otherconnections within the network Through many iterations ofthe training dataset the weights within the neural networkcan be optimized
For the purposes of this study the trainingwas conductedby repeatedly introducing a training set of input-to-outputdata to the neural network until an RMS error 119864 reached aminimum value Using 119902 datasets within the training routinethe error was found using the following equation
119864 = radic1
119902
119902
sum
119894=1
119901
sum
119896=1
(119905119896 minus 119874119896)2
119894 (3)
After the entire collection of training sets was used inadjusting the weights once called an epoch an RMS errorwas computed The network was then constrained to learnfor a specific number of epochs before ending the trainingprocess The number of epochs required was large enough tofind a minimum RMS error point for the training sets
2 Experiment
Several experimentswere performed onflat aluminumpanels(Al 2024-T3) to determine the ability of an artificial neuralnetwork to analyze damage within a structural element Twodifferent panels were designed and used one with a width of6 in and a thickness of 0032 in and another with dimensionsof 4 in wide and 005 in thickness Detailed dimensions ofthe panels are illustrated in Figure 6 Flat thin panels wereused to simplify the experiments Two different methodswere investigated to utilize a neural network to determinethe severity or extension length of the crack growth and theposition of a crack tip These experiments are reported on inSections 21 and 22 respectively
21 Magnitude of Crack Extension The first series of experi-ments focused on determining the extension of a crack overa short period of time using an acoustic emission system Inthe case of stable crack growth further extension will ceaseafter a specific crack length is obtained The crack will notextend further until a certain load condition is appliedThesesmall crack extensions consist of rapid increasing bursts that
6 The Scientific World Journal
600
075
075
075
075050
8375
123754375
400
400
200
R250
53∘100
050
150
050
(a) Panel used for severity analysis thickness of0050 in
800
400
075
075075
075
050050
050
1593 1193 600
200
R250
53∘
100
100
150
120601025
(b) Panel used for location analysis thickness of0032 in
Figure 6 Dimensions of test panels used for experiment Panels consisted of Al 2024-T3
(a) Setup for test panel Panel is seen in pin clevis setup to be mounted into MTS Sintech 5G machine
Acoustic emission sensors
Double shear fixture
Clevis
Test panel
Acoustic emission sensors
Applied load
Edge crack
(b) Sensor placement for crack severity Acoustic emission sensors mounted in
(c) Sensor placement for plastic zone location trends Acoustic emission sensors mounted in a line parallel to
a line perpendicular to crack plane of the edge crack the crack plane of the edge crack
Figure 7 Test panel setup for detecting strain waves from crack propagation Setup for test panel in pin clevis setup to be mounted intoMTSSintech 5G machine
The Scientific World Journal 7
are close to instantaneous The purpose of these experimentswas to use the detections of an acoustic emission system for aknown crack extension to train an artificial neural network tolink certain detections to specific crack length growths Thetrained ANN could later be used to determine the length of acrack from acoustic emission measurements
Figure 6 contains drawings that detail the dimensionsof the two different test panels used in the experimentsThe panel shown in Figure 6(a) was subjected to a uniaxialtensile load to initiate crack extension in order tomeasure themagnitude of an increment of crack growth An initial crackwas cut into the panel from one of the side edges in the testregion and then the panel was statically loaded with an MTSSintech 5G machine through a pin and clevis setup as illus-trated in Figure 7 The loading was gradually increased untilcrack extension occurred The crack length was measured atspecific load intervals by an observer using digital calipersThese measured crack lengths were used to create a learningdataset for an artificial neural network Likewise they wereused to compare the crack extension calculated with a neuralnetwork relative to the actual measured values The acousticemission sensors located as shown in Figure 7 continuouslymonitored for any crack growth during the increasing-loadprocess The recorded acoustic emission signals were laterused for analysis with an artificial neural network Only twosensors were used for this test since crack growth size wasdesired and not the position of the crack (see Figure 7(b))The sensors were placed at similar positions away from thecrack tip to avoid any effects of plastic zone deformation aswell as confirm that the sensors were functioning properly
A neural network analysis program could not be added tothe Physical Acoustics software [4] used tomeasure the strainwaves in the test samplesTherefore themeasured strainwavedata were exported and post-processed A dataset was createdwith the acoustic emission software the measured elapsedtime and the wave characteristics for analysis described inthe following paragraph The commercial software Neural-Works [6] was used to create the neural network to generatethe datasets AMATLAB [5] programwas created to simulatereceiving the strain waves over time This was performed torecreate the experiment in a controlled program allowingease of data manipulation During the performance of theactual experiment software constraints did not allow theability to link a neural network analysis feature to the acousticemission softwareThusMATLABprogrammingwas used topost-process the experimental data using ANNs
The strain wave data were received continuously overtime For an artificial neural network input dataset a smalltime interval was used for determining the increment ofcrack growth associatedwith the large number of strainwavesdetected over the short period of time of the crack extensionThe energy values from each detected wave were placed into a10 bin histogramThe output consisted of the change in crackgrowth or difference from initial size to final size over thattime step These input and output datasets were used in thenetwork architecture illustrated in Figure 8 Experimentingwith different network architectures two hidden layers werefound to increase precision and accuracy of the output valueswhile minimizing the processing time of the network This
Bin
Bin
Bin
1
2
10
10 nodes 5 nodes 5 nodes 1 node(input layer) (hidden layer) (hidden layer) (output layer)
da
Figure 8 Artificial neural network created to determine the extentof crack growth for a small time interval
neural network system proved to work well for predicting themagnitude of crack growth for a flat panel
22 Crack Positioning The next series of experimentsfocused on crack location and the effects of sensor placementrelative to a crack tip positionThe purpose of the experimentwas to develop an artificial neural network system whichcould relate to the detections acquired from nearby acousticemission sensors and determine the location of the cracktip from which the strain waves originated Although moreresearch will be required to develop an artificial neuralnetwork capable of this process the research described inthis paper concerns the theoretical aspectsThrough a simpleexperiment the relative detections of neighboring acousticemission sensors were compared by an observer Based uponexisting trends a neural network could be developed andtrained to find similar trends The inputs consisted of thesame detected wave over several acoustic emission sensorsin this case the maximum amplitude of each detected wavewas the characteristic usedThe output of the artificial neuralnetworkwas the position of the crack tip fromwhich thewaveoriginated
Four acoustic emission sensors were used for the crackpositioning experimentThesewere placed in a line parallel tothe plane of the edge crack (see Figure 7(c))This positioningallowed for sensors to lie ahead of the crack front andother sensors to be behind the crack front The purpose ofthis experiment was to determine the validity of the theorydescribed earlier relative to the influence of the plastic zoneon the characteristics of the strain waves in the structure
3 Results and Discussion
The crack extension calculated by an artificial neural network(ANN) using the measured acoustic emission strain wavedata was comparedwith the actualmeasured crack extensionfor both training and testing datasets The abilities of theANN were assessed using an RMS error in comparison tothe actual and values predicted by the ANNs The conceptof plastic zone interference on the release of strain waves inthe material was examined as well leading to possible future
8 The Scientific World Journal
0
500
1000
1500
2000
2500
3000
0 100 200 300 400 500
Elapsed time (s)
Load
(lb)
1
10
100
Hit
coun
t
LoadCh 1Ch 2
(a) Acoustic emission detections from the entire experiment
2000
2100
2200
2300
2400
2500
2600
2700
390 392 394 396 400398Elapsed time (s)
Load
(lb)
1
10
100
Hit
coun
t
LoadCh 1Ch 2
(b) Acoustic emission data during the crack extension
Figure 9 Example of test results for panel load to onset of crack extension Each point on the plot is a single strain wave detected by eithersensor 1 or 2 Although some measurements appear simultaneous in recording there are microseconds between recordings
Detected hit
middot middot middot
Time tt0 = [0 0 0 0 ]
t1 = [0 0 0 0]
t2 = [0 0 0 0]
Figure 10 Example of the sliding timewindow used for experiment
research The neural networks created for this research werecapable of detecting the actual crack extension of the test set
31 Magnitude of Crack Extension
311 Training Datasets TheMTSmachine was configured toincrease the tensile load necessary to produce a displacementin the test section at a rate of 001 inmin The instrumenta-tion of the MTS machine tracked the loading force appliedto the test specimen as well as the applied displacementof one end of the specimen with respect to the other as afunction of time At a specific applied load the crack increasedin size as evidenced by a sudden drop in the force appliedand a corresponding sudden increase in the number of strainwaves detected by the acoustic emission system In additionany crack extension greater than 005 in was audible to theobservers of the experiment As soon as these phenomenawere detected the MTSmachine was manually turned off sothat the displacement did not increase further and the applied
loadwent to zeroThe crack lengthwasmeasured using a dig-ital calipers and the displacement of the load heads was resetto the original position This process allowed for acousticemission detections for a series of finite increments of crackgrowth which could then be used for a training set for anartificial neural network to identify a crack extension event
The data contained in Figure 9 illustrate the resultsfor one of the experiments using the method describedabove For this case crack growth began around 396 secafter the initiation of the applied load Sudden decreasesin load indicate instances of crack extension As shown inFigure 9(b) a plot zoomed into the crack growth time periodthere were five different instances where increments of crackgrowth occurred (390 sec 393 sec 3952 sec 397 sec and398 sec) An accurate measurement of crack length growthwas only possible to be taken before and after applying loadto the panel The percentage of the total crack growth ateach instance was estimated such that the cumulative crackgrowth equaled the measured change of the crack length
Once increments of crack growth were estimated foreach intermediate time step the entire elapsed time fromthe beginning of loading was broken down into eight secondintervals of time or time windows A sliding time window forreal-time monitoring was created that stepped through timeat a step of 16 seconds This procedure allowed for multiplereadings from the samedetection (see Figure 10)Within eachtime window multiple detections could be observed Thesewere normalized into a histogram of the data within the timewindow thus removing any time dependence A histogramwas made of 10 bins grouping the values of the energyvalue of each strain wave between zero and a normalizedmaximum value of 100 The energy value had exponential
The Scientific World Journal 9
0
005
01
015
02
025
0 005 01 015 02 025Actual crack extension (in)
AN
N p
redi
cted
crac
k ex
tens
ion
(in)
(a) Training dataset
0
005
01
015
02
025
0 005 01 015 02 025Actual crack extension (in)
AN
N p
redi
cted
crac
k ex
tens
ion
(in)
(b) Testing dataset
Figure 11 Results of training an artificial neural network to determine the magnitude of crack growth These plots relate the target ormeasured size of crack growth in inches to the estimated ANN resultsThe correlation between the target values and ANN results was 09872for the training dataset and 09453 for the testing dataset
0200400600800
100012001400
0 100 200 300 400 500 600 700 800 900 1000Time (s)
Appl
ied
load
(lb)
1
10
100
1000
AE
hit c
ount
LoadCh 1Ch 2
Figure 12 Strain wave detections of acoustic emission sensorsfrom a panel under tensile loading Initial crack extension occurredaround 360 seconds and continued under displacement control
characteristics so a logarithmic scale was used Some strainwaves had an energy value of zero Thus the logarithmicvalue was not taken from these values Finally each timevalue was provided a crack growth amount and a groupingof either crack growth present or not Four examples of thefinal datasets are provided in Table 1
Two artificial neural networks were created for two sepa-rate purposes Both neural networks used the ten histogrambin values as input setsThe first network named the ldquoyes-nonetworkrdquo was a self-organizing map This network was usedto classify each time window into two groups ldquoyesrdquo crackgrowth was present or ldquonordquo crack growth present This wasaccomplished with a network with a Kohonen layer of 20nodes times 20 nodesThe neighborhood started at 15 nodes andwas decreased with each epoch until grouping was complete
Table 1 Example data sets of histogram values and respective crackgrowth sizes Time listed is for the start of the time window
Time (sec) Histogramvalues
Crack growthpresent (ldquoyesrdquo ldquonordquo)
Crack growthsize (in)
38180 0 0 0 1 0 0 1 0 0 0 0 1 038340 0 0 1 2 1 0 0 0 0 0 0 1 039140 16 7 4 7 0 1 0 0 0 0 1 0 0149539620 9 4 1 3 1 2 0 0 0 0 1 0 00299
These nine experiments were used to train this network intothe two groupsTheKohonen layerwas then connected to twooutput nodes each representing either ldquoyesrdquo or ldquonordquo to crackgrowthThe connections between the Kohonen layer and theoutput nodes were trained with the backpropagation usingthe NeuralWorks software Delta rule and used hyperbolictangent activation functionsThe purpose of this networkwasto filter out noise from the strain waves corresponding toactual crack growth
With this first network being completely trained a secondneural network called the ldquoseverity networkrdquo was con-structed This severity network used the histogram values todetermine the crack growth extension in inchesThe networkwas trained with the measured data of the nine experimentsusing only the timewindowswhere crack growthwas presentIt consisted of a backpropagation network with two hiddenlayers of five nodes each Again Delta rule training wasused along with hyperbolic tangent activation functions Theresults of the training process are presented in Figure 11From the nine experiments 106 datasets contained one of thedefined crack growth times From this 85 were used to trainthe neural network and the remaining 21 were used to initiallytest the abilities of the neural network The network wastrained for 50000 epochs or iterations through the datasets
10 The Scientific World Journal
0 100 200 300 400 500 600 700 800 9000
01
02
03
04
05
06
07
08
Elapsed time (s)
Crac
k le
ngth
(in
)
Ch 1 Ch 2Average
Ch 2
Ch 1
Average
(a) Individual sensor predictions
0
02
04
06
08
Crac
k le
ngth
(in
)
0
500
1000
1500
Load
(lb)
Load applied Crack length
0 100 200 300 400 500 600 700 800 900Elapsed time (s)
minus500
(b) Average crack length from both sensors Loading curve displayed aswell
Figure 13 Crack growth length over time approximated by neural networks
This number of iterations through the training data allowedfor the RMS error of the network to be minimized Figure 11shows the results for the trained and testing datasets used inthe neural networkThe graph on the left contains a display ofthe output relationship between the crack lengths measuredvalues and the length of the crack estimated by the artificialneural networkThe graph on the right shows the results fromthe testing datasetsThis figure shows the relation between themeasured size of the crack extension for each dataset in inchesand the output of the trained severity networkThe ideal casefor the graphs shown in the figure would be a straight linerepresenting a 1-to-1 ratio between actual measurements andthe ANN estimations Due to complexities these plots varyslightly but are close to the desired values with a resultingcorrelation of the plots of 09872 for the training datasetand 09453 for the testing dataset which are both close to avalue of 1 The predicted values of the ANN differed from theactual crack extensions by 0003 in and 0005 in with a 95confidence level For the testing set with the same confidencelevel the ANN differed the predictions from the actual crackextensions from0004 in to 0015 inThis showed promise forthe ability of a neural network to be a useful analysis tool ofa structural health monitoring system due to the very smalldifferences between the neural network estimated values ofcrack growth and the measured crack growth values
312 Testing Datasets Once the two artificial neural net-works were created and fully trained the next step was to usethese in a situation where datasets not previously presentedto the networks were used To accomplish this task a tenthexperiment was conducted However for this experimentthe MTS machine was not stopped at the initiation ofcrack growth but instead allowed to continue increasingdisplacement over an extended time The experiment wasfinally stopped around the 850 second mark The detections
of strain waves for this experiment are reported in Figure 12Only the initial and final crack lengths weremeasured for thisexperiment but some conclusions could be drawn from thedata The initial crack began to extend at around 360 sec Thecrack then slowly increased in size while the panel was loadedin displacement control until the loading was halted at about850 sec The total increase in crack size was measured to be0972 in
The measured AE data shown in Figure 12 indicate thatthere was a great deal of noise andmany strainwaves detectedafter the crack extension was initiated This dataset wasevaluated using the neural networks using the same timewindows as those of the training sets Histograms were madeof ten bins each with the same range as before This newdataset was first used in the yes-no network Here the outputsof the network categorized each histogram into either crackgrowth or noise present The datasets determined to be crackgrowth and not noise were then used in the severity networkThis network then determined the size of the increment ofcrack growth over the time window
This experiment used two separate sensors The datafrom each sensor were separated and run through the twoneural networks Figure 13(a) contains graphs of the resultsof the networks in terms of crack length As time increasedin the experiment the total crack length increased Finallyan average of the two signals was taken to determine anet crack length value This average crack growth length isillustrated again in Figure 13(b) along with the load historyThe crack length followed the trend predicted by the shapeof the loading curve A sudden increase in the length of thecrack occurred at the time crack extension began and thecrack slowly increased in size as the controlled displacementof the MTS machine continued The final length of thecumulative crack extension length computed using the resultsof the neural network predictions shown in Figure 13(b) was
The Scientific World Journal 11
0
051
152
25
Position (in)
Posit
ion
(in)
minus25minus2
minus15minus1
minus05
05 15 25 35 45 55 65minus05
CrackInitial PZ
Added PZPanel
(a) First loading
Posit
ion
(in)
0
051
152
25
minus25minus2
minus15minus1
minus05
Position (in)05 15 25 35 45 55 65minus05
CrackInitial PZ
Added PZPanel
(b) Second loading
Position (in)
Posit
ion
(in)
0
051
152
25
minus25minus2
minus15minus1
minus05
05 15 25 35 45 55 65minus05
CrackInitial PZ
Added PZPanel
(c) Third loading
Position (in)05 15 25 35 45 55 65
Posit
ion
(in)
0
051
152
25
minus25minus2
minus15minus1
minus05
minus05
Final PZPanelCrack
(d) Final condition
Figure 14 Crack location and sensor placement Plastic zone is shown around the propagating crack tip Sensors are labeled Channels 1 to 4from right to left
06805 in This measured value of the total crack extensionwas of 0810 in or a difference of 013 in Sensor 2 receivedmore acoustic emission signal detections than sensor 1Thussensor 2 reflectedmore reliable events andwas amore reliablesensor A weighted average with more emphasis on sensor 2resulted in an approximation of 0700 in or a difference of009 in This difference was considered to be an acceptableapproximation for the purposes of this experiment
32 Crack Location and Plastic Phenomenon Figure 14 illus-trates the location of four sensors relative to a crack duringcrack extension The plastic zone at the crack tip has beenshown to increase in size until the final crack length of 198 inFor each increment of crack growth a single detectable strainwave was produced and is shown in Figure 15 For this exper-iment the amplitude of the strain wave was the characteristicof the wave used for comparison As the crack grew thesingle strain wave was detected by each of the four sensorsFor crack growths before the final increment the detected
amplitudes of the strain waves at each sensor remained closeto one another However for the large extension of the cracktip the detected amplitudes of the strainwave became skewedAs shown in Figure 15(c) the sensors closest to the cracktip sensors 2 and 3 received the highest amplitude waveswith sensor 1 detecting the third largest amount The wavesdetected by sensor 4 had smaller amplitudes compared to theother three sensorsThesemeasured observations support thetheory presented earlier regarding the effects of location ofthe crack tip and growth direction relative to the position ofthe sensor
Further if this trend is recognizable to an observer of theexperiment then an artificial neural network should be ableto deduce a similar trend and be able to predict location of acrack by the amplitude of the detected wave With multiplesensors of known positions detecting the same waves acomparison between amplitudes of different sensors withknown locations might be used to determine the location ofthe crack tip in a structure
12 The Scientific World Journal
0
20
40
60
80
100
120
140
160
180
200
0Elapsed time (s)
Hit
coun
t
Ch 1Ch 2
Ch 3Ch 4
1E minus 05 2E minus 05 3E minus 05
(a) First loading
0
20
40
60
80
100
120
140
160
180
200
Hit
coun
t
0Elapsed time (s)
Ch 1Ch 2
Ch 3Ch 4
1E minus 05 2E minus 05 3E minus 05
(b) Second loading
Elapsed time (s)
1
10
100
1000
10000
0 05 1
Hit
coun
t
Ch 1Ch 2
Ch 3Ch 4
(c) Third loading
Figure 15 Strain wave detections from crack propagationThe panel was loaded and then unloaded after crack initiation Each crack ldquogrowthrdquoshown is the result of the crack becoming unstable and then stabilizing at a new length
The proof of concept was examined in this experimentDue to limited data and knowledge of the wave propertiesthis process will need to be explored in future studiesFurther testing and researchwill be performed by locating theposition of actual crack propagation Since energy is releasedat the crack tips these will be the positions located by theneural network allowing the entire crack to be determinedas the distance between the two close crack tipsThis networkwill then be coupled with a crack severity neural network todetermine the ability of neural networks to assess damagedetected by an acoustic emission system Future study willinvolve combining the severity artificial neural network anda new neural network to determine the location of the cracktip
4 Conclusion
A novel method of implementing artificial neural networksand acoustic emission sensors to form a structural healthmonitoring system for metallic structures was presentedFlat aluminum panels similar in thickness to those foundin many aerospace structures were subjected to increasingstatic loading during laboratory tests As the load increaseda crack in the panel increased in size releasing strain wavesinto the materialThese waves were then detected by acousticemission sensors and artificial neural networks were imple-mented to analyze the strain waves From a feed-forwardneural network the crack length could be approximatedwith reasonable precision Plastic zone influence on strainwaves released was also observed during the analysis of the
experimental data Through a second experiment sensorsplaced behind the crack front were found to detect waveswith smaller amplitudes than the sensors placed in otherlocations Future study will involve using this knowledgeto train or teach an artificial neural network to determinethe location of a growing crack based on this differencein amplitude These two artificial neural networks coupledwith acoustic emission sensors form the initial stages of thedevelopment of a structural health monitoring system foraerospace systems with the capability of determining damageseverity and locations within structures
Nomenclature
ANN Artificial neural networkNIAR National Institute for Aviation ResearchSHM Structural health monitoring119864 Root mean square error119874119895 Output from node 119895 in an artificial neural
network119905119896 Desired or target values for an output
dataset119908119894119895 V119894119895 Weight for path from node 119894 to node 119895 of
an artificial neural network119883119894 119884119894 119885119894 Node 119894 in row of input hidden or output
layers of an artificial neural networkrespectively
120572 Learning coefficient120579 Angle of deviation from the plane of a
crack
The Scientific World Journal 13
Acknowledgment
The authors thank the Department of Energy for its support(DOE DE-FG36-08GO88149)
References
[1] J L Rose ldquoDispersion curves in guided wave testingrdquoMaterialsEvaluation vol 61 no 1 pp 20ndash22 2003
[2] D Mateescu H Yong and A K Misra ldquoAnalysis ofsmart structures with piezoelectric strips subjected tounsteady aerodynamic loadsrdquo in Proceedings of the 48thAIAAASMEASCEAHSASC Structures Structural Dynamicsand Materials Conference pp 3662ndash3680 Honolulu HawaiiUSA April 2007
[3] T Kundu Ultrasonic Nondestructive Evaluation Engineeringand Biological Material Characterization CRC Press BocaRaton Fla USA 2004
[4] Physical Acoustics Corporation PCI-2 BaSedAE SyStemUSerrsquoSManual Rev 3 Princeton NJ USA 2007
[5] The MathWorks Inc ldquoMATLAB v6 5 0 180913a Release 13Manualrdquo Software Package 2002
[6] NeuralWare Inc ldquoNeuralWorks Professional IIPLUS UserrsquosManualrdquo Software Package 1997
[7] D G Aggelis E Z Kordatos and T E Matikas ldquoAcousticemission for fatigue damage characterization in metal platesrdquoMechanics Research Communications vol 38 no 2 pp 106ndash1102011
[8] D Placko and T Kundu DPSM For Modeling EngineeringProblems Wiley-Interscience Hoboken NJ USA 2007
[9] J Lee G Kirikera I Kang and M Schulz Structural HealthMonitoring Using Continuous Sensors andNeural Network Anal-ysis Institute of Physics Publishing Smart Material Structures15 University of Cincinnati Cincinnati Ohio USA 2006
[10] G R Kirikera J W Lee M J Schulz et al ldquoInitial evaluation ofan activepassive structural neural system for healthmonitoringof composite materialsrdquo Smart Materials and Structures vol 15no 5 p 1275 2006
[11] J W Lee G R Kirikera I Kang M J Schulz and V N ShanovldquoStructural health monitoring using continuous sensors andneural network analysisrdquo Smart Materials and Structures vol15 no 5 p 1266 2006
[12] V Crupi E Guglielmino and G Milazzo ldquoNeural-network-based system for novel fault detection in rotating machineryrdquoJVCJournal of Vibration and Control vol 10 no 8 pp 1137ndash1150 2004
[13] L Fausett Fundamentals of Neural Networks ArchitecturesAlgorithms andApplications PrenticeHall Upper Saddle RiverNJ USA 1994
International Journal of
AerospaceEngineeringHindawi Publishing Corporationhttpwwwhindawicom Volume 2014
RoboticsJournal of
Hindawi Publishing Corporationhttpwwwhindawicom Volume 2014
Hindawi Publishing Corporationhttpwwwhindawicom Volume 2014
Active and Passive Electronic Components
Control Scienceand Engineering
Journal of
Hindawi Publishing Corporationhttpwwwhindawicom Volume 2014
International Journal of
RotatingMachinery
Hindawi Publishing Corporationhttpwwwhindawicom Volume 2014
Hindawi Publishing Corporation httpwwwhindawicom
Journal ofEngineeringVolume 2014
Submit your manuscripts athttpwwwhindawicom
VLSI Design
Hindawi Publishing Corporationhttpwwwhindawicom Volume 2014
Hindawi Publishing Corporationhttpwwwhindawicom Volume 2014
Shock and Vibration
Hindawi Publishing Corporationhttpwwwhindawicom Volume 2014
Civil EngineeringAdvances in
Acoustics and VibrationAdvances in
Hindawi Publishing Corporationhttpwwwhindawicom Volume 2014
Hindawi Publishing Corporationhttpwwwhindawicom Volume 2014
Electrical and Computer Engineering
Journal of
Advances inOptoElectronics
Hindawi Publishing Corporation httpwwwhindawicom
Volume 2014
The Scientific World JournalHindawi Publishing Corporation httpwwwhindawicom Volume 2014
SensorsJournal of
Hindawi Publishing Corporationhttpwwwhindawicom Volume 2014
Modelling amp Simulation in EngineeringHindawi Publishing Corporation httpwwwhindawicom Volume 2014
Hindawi Publishing Corporationhttpwwwhindawicom Volume 2014
Chemical EngineeringInternational Journal of Antennas and
Propagation
International Journal of
Hindawi Publishing Corporationhttpwwwhindawicom Volume 2014
Hindawi Publishing Corporationhttpwwwhindawicom Volume 2014
Navigation and Observation
International Journal of
Hindawi Publishing Corporationhttpwwwhindawicom Volume 2014
DistributedSensor Networks
International Journal of
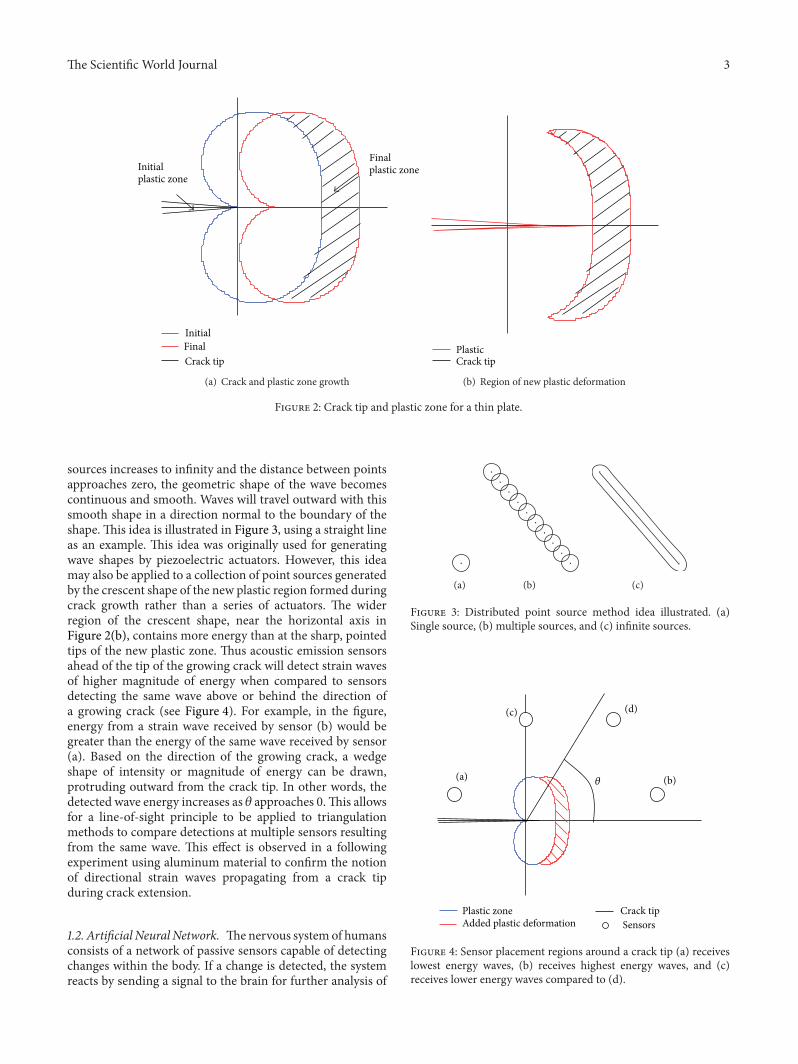
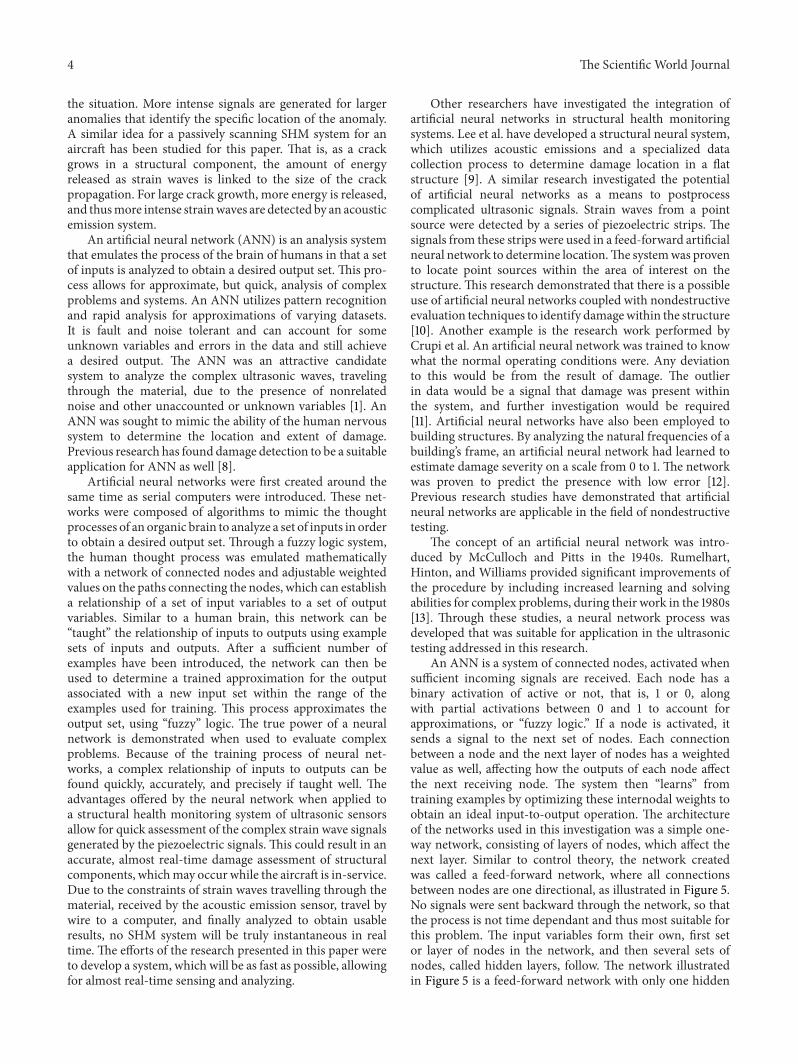
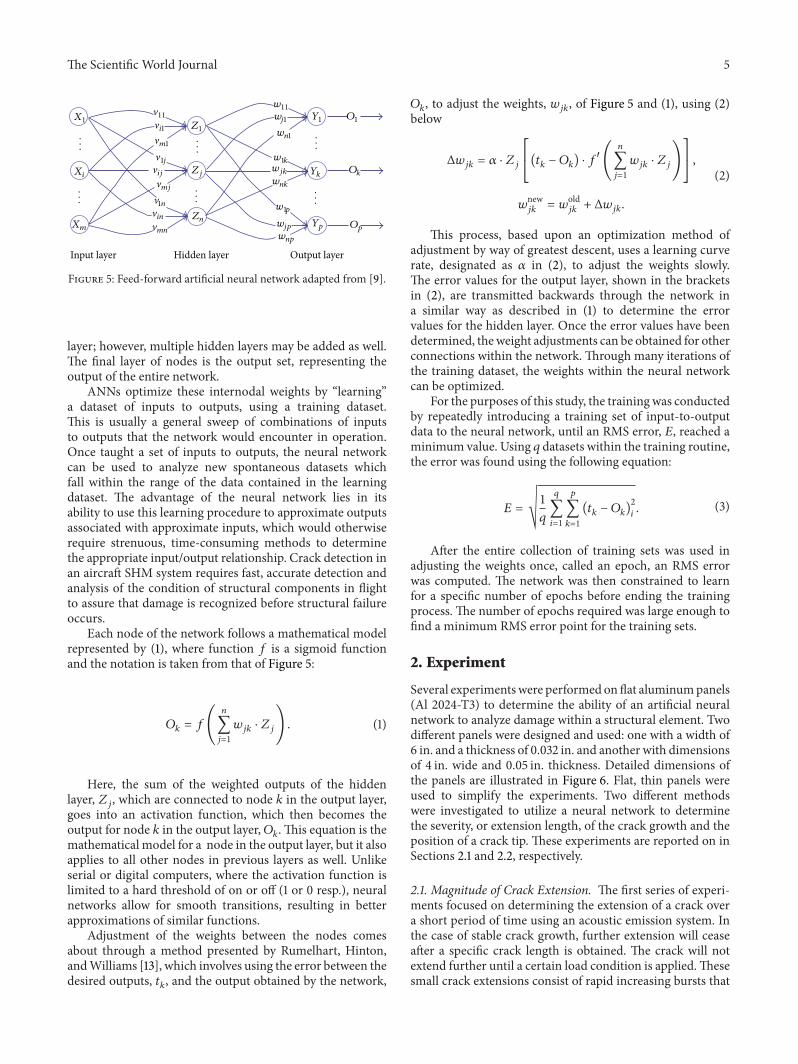
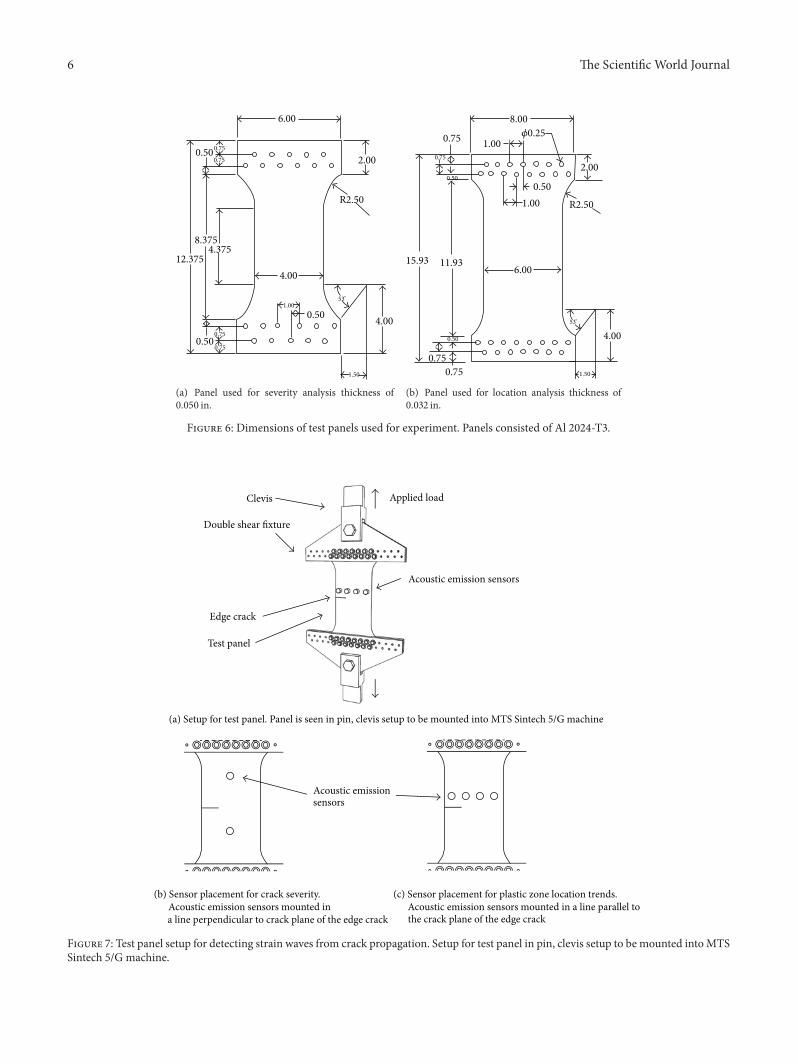
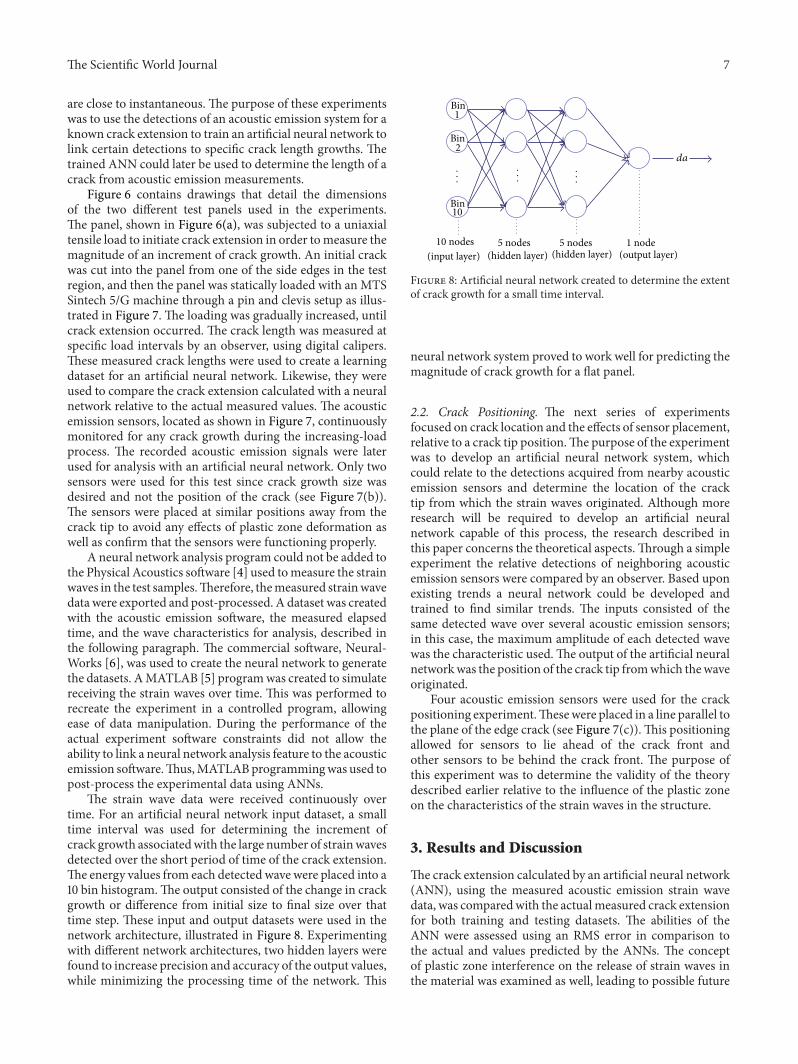
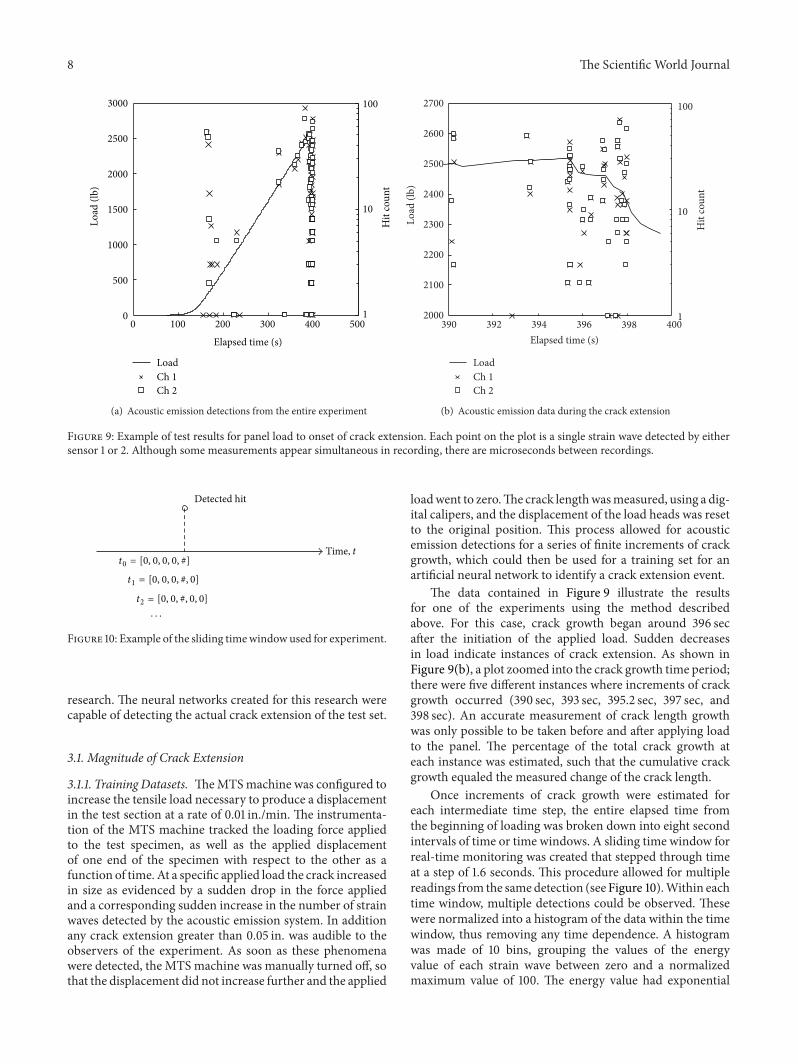
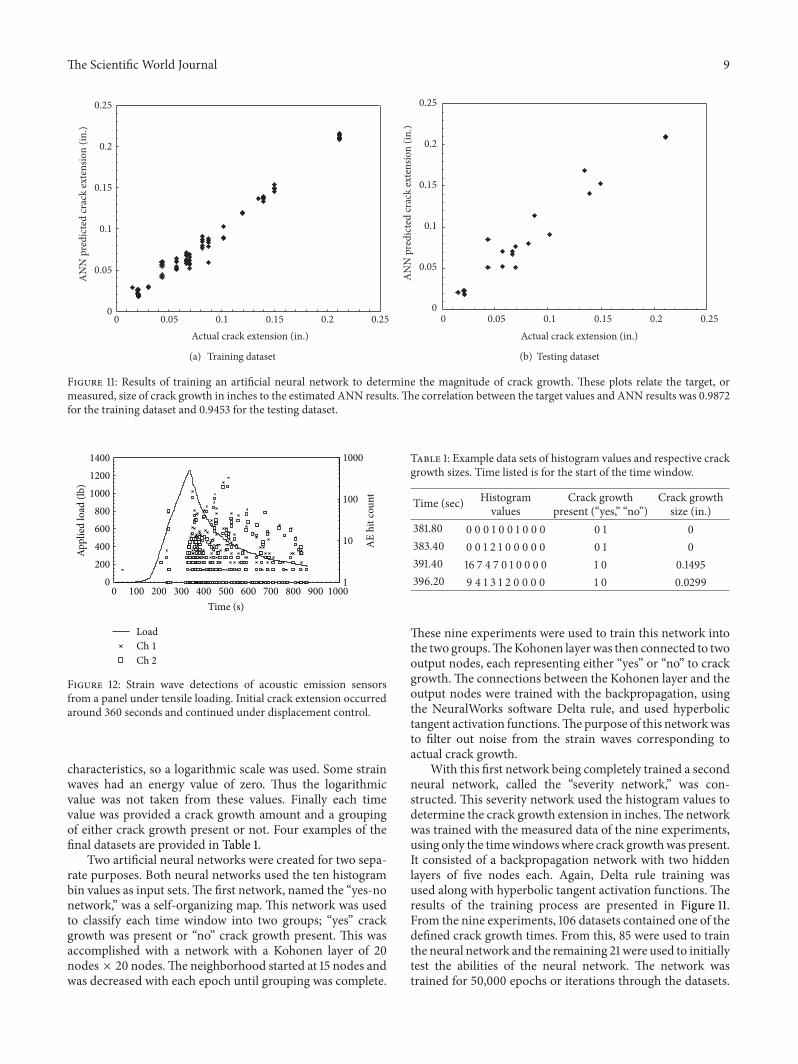
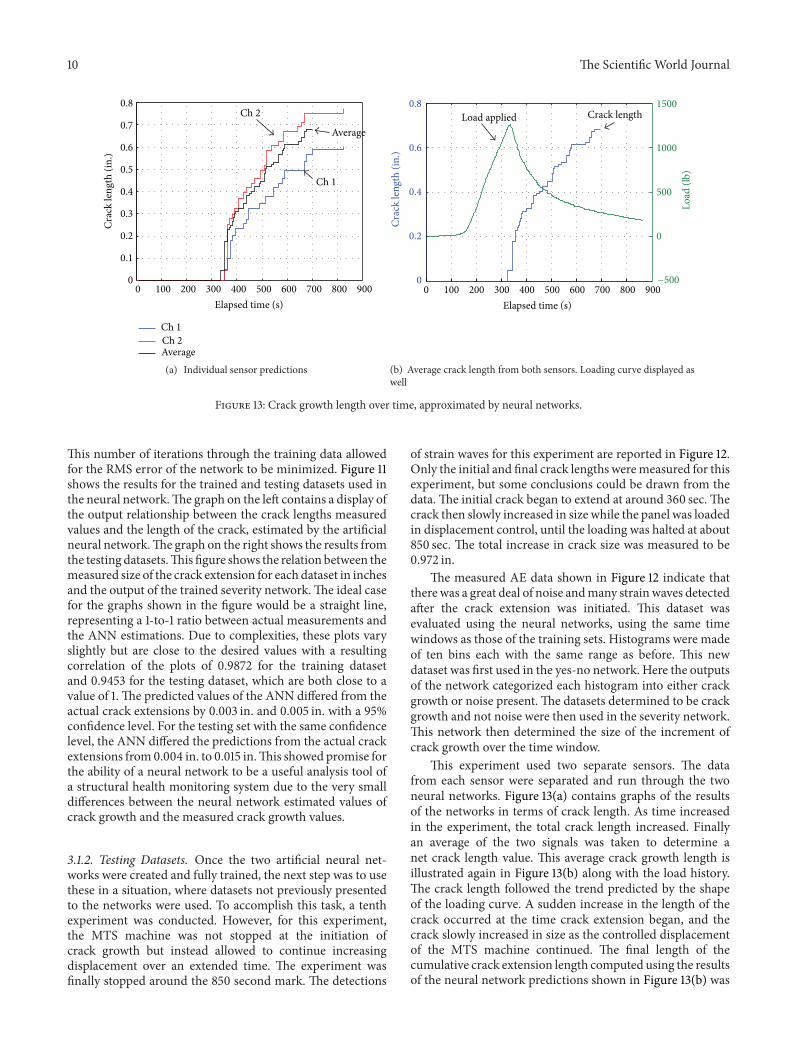
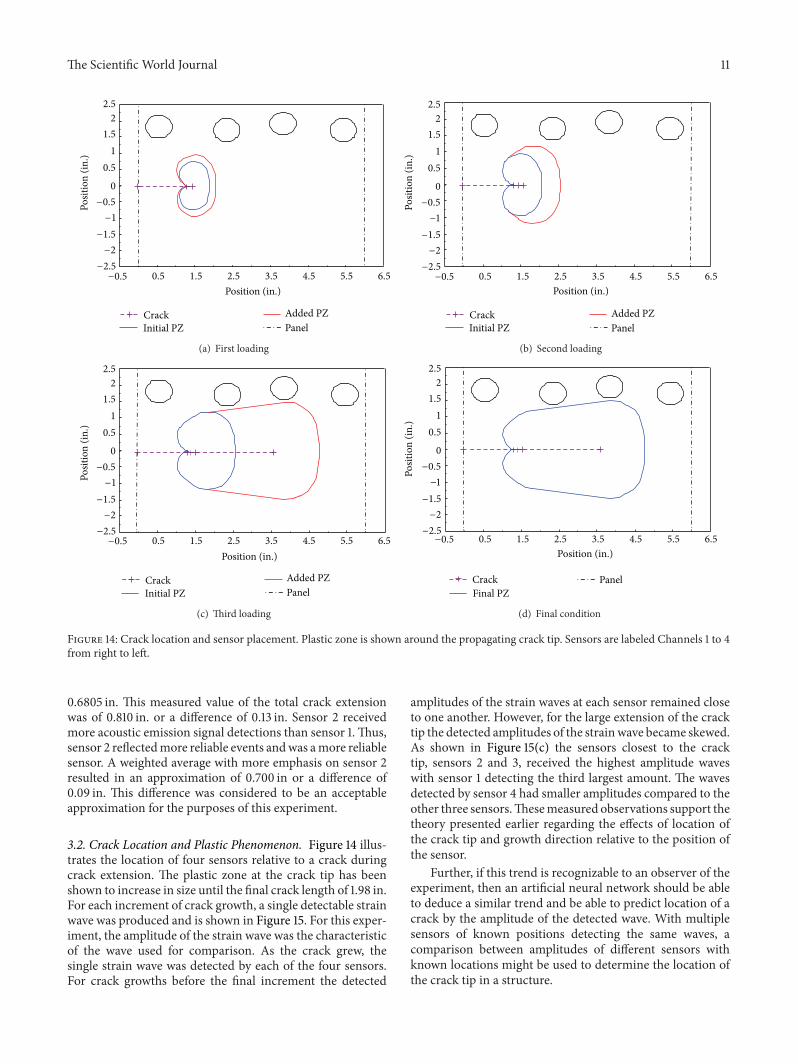
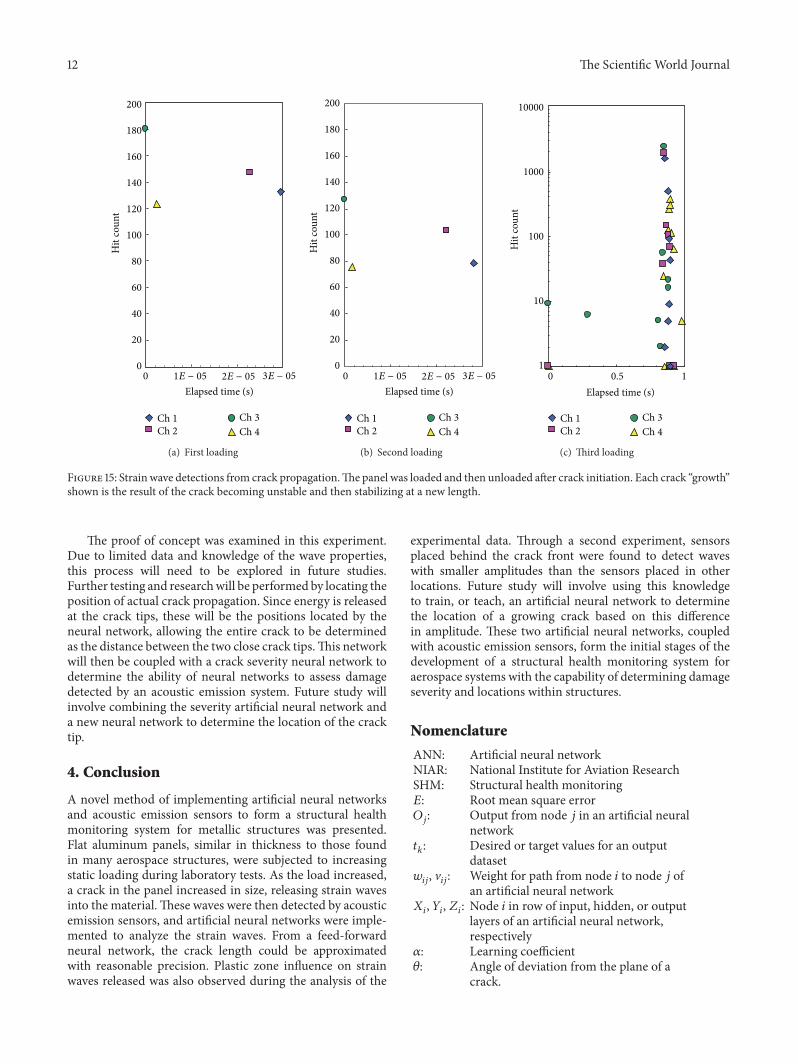

International Journal of
AerospaceEngineeringHindawi Publishing Corporationhttpwwwhindawicom Volume 2014
RoboticsJournal of
Hindawi Publishing Corporationhttpwwwhindawicom Volume 2014
Hindawi Publishing Corporationhttpwwwhindawicom Volume 2014
Active and Passive Electronic Components
Control Scienceand Engineering
Journal of
Hindawi Publishing Corporationhttpwwwhindawicom Volume 2014
International Journal of
RotatingMachinery
Hindawi Publishing Corporationhttpwwwhindawicom Volume 2014
Hindawi Publishing Corporation httpwwwhindawicom
Journal ofEngineeringVolume 2014
Submit your manuscripts athttpwwwhindawicom
VLSI Design
Hindawi Publishing Corporationhttpwwwhindawicom Volume 2014
Hindawi Publishing Corporationhttpwwwhindawicom Volume 2014
Shock and Vibration
Hindawi Publishing Corporationhttpwwwhindawicom Volume 2014
Civil EngineeringAdvances in
Acoustics and VibrationAdvances in
Hindawi Publishing Corporationhttpwwwhindawicom Volume 2014
Hindawi Publishing Corporationhttpwwwhindawicom Volume 2014
Electrical and Computer Engineering
Journal of
Advances inOptoElectronics
Hindawi Publishing Corporation httpwwwhindawicom
Volume 2014
The Scientific World JournalHindawi Publishing Corporation httpwwwhindawicom Volume 2014
SensorsJournal of
Hindawi Publishing Corporationhttpwwwhindawicom Volume 2014
Modelling amp Simulation in EngineeringHindawi Publishing Corporation httpwwwhindawicom Volume 2014
Hindawi Publishing Corporationhttpwwwhindawicom Volume 2014
Chemical EngineeringInternational Journal of Antennas and
Propagation
International Journal of
Hindawi Publishing Corporationhttpwwwhindawicom Volume 2014
Hindawi Publishing Corporationhttpwwwhindawicom Volume 2014
Navigation and Observation
International Journal of
Hindawi Publishing Corporationhttpwwwhindawicom Volume 2014
DistributedSensor Networks
International Journal of