Embed Size (px)
Citation preview
eCHOUPALS KUMAR
Science, Technology & Society Program MIT Cambridge, MA 02139
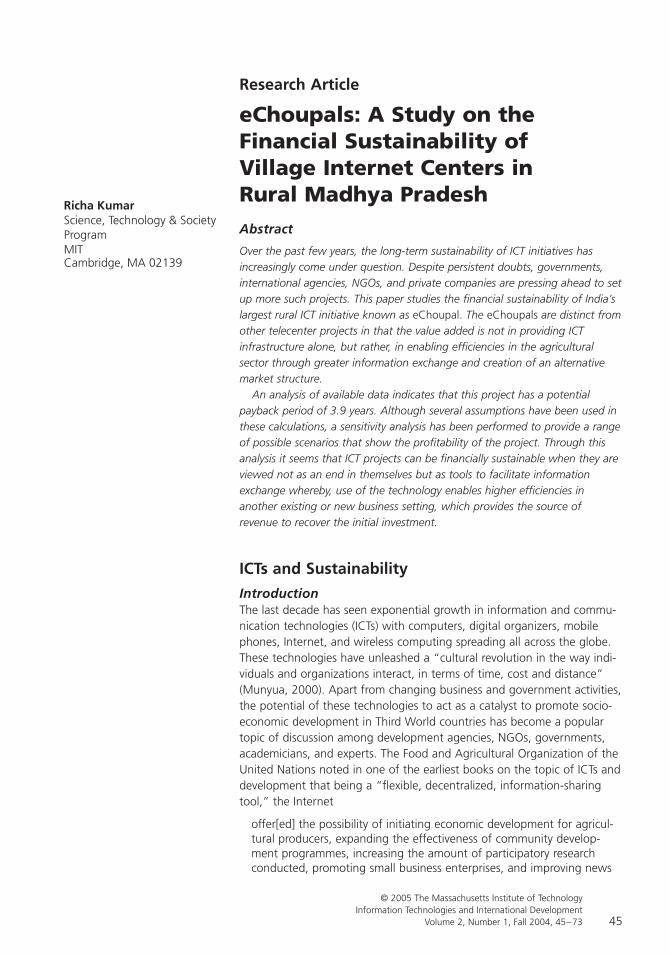
eChoupals: A Study on the Financial Sustainability of Village Internet Centers in Rural Madhya Pradesh
Over the past few years, the long-term sustainability of ICT initiatives has increasingly come under question. Despite persistent doubts, governments, international agencies, NGOs, and private companies are pressing ahead to set up more such projects. This paper studies the ªnancial sustainability of India’s largest rural ICT initiative known as eChoupal. The eChoupals are distinct from other telecenter projects in that the value added is not in providing ICT infrastructure alone, but rather, in enabling efªciencies in the agricultural sector through greater information exchange and creation of an alternative market structure.
An analysis of available data indicates that this project has a potential payback period of 3.9 years. Although several assumptions have been used in these calculations, a sensitivity analysis has been performed to provide a range of possible scenarios that show the proªtability of the project. Through this analysis it seems that ICT projects can be ªnancially sustainable when they are viewed not as an end in themselves but as tools to facilitate information exchange whereby, use of the technology enables higher efªciencies in another existing or new business setting, which provides the source of revenue to recover the initial investment.
The last decade has seen exponential growth in information and communication technologies (ICTs) with computers, digital organizers, mobile phones, Internet, and wireless computing spreading all across the globe. These technologies have unleashed a “cultural revolution in the way individuals and organizations interact, in terms of time, cost and distance” (Munyua, 2000). Apart from changing business and government activities, the potential of these technologies to act as a catalyst to promote socioeconomic development in Third World countries has become a popular topic of discussion among development agencies, NGOs, governments, academicians, and experts. The Food and Agricultural Organization of the United Nations noted in one of the earliest books on the topic of ICTs and development that being a “ºexible, decentralized, information-sharing tool,” the Internet
offer[ed] the possibility of initiating economic development for agricultural producers, expanding the effectiveness of community development programmes, increasing the amount of participatory research conducted, promoting small business enterprises, and improving news
© 2005 The Massachusetts Institute of Technology Information Technologies and International Development
Volume 2, Number 1, Fall 2004, 45–73 45
eCHOUPALS
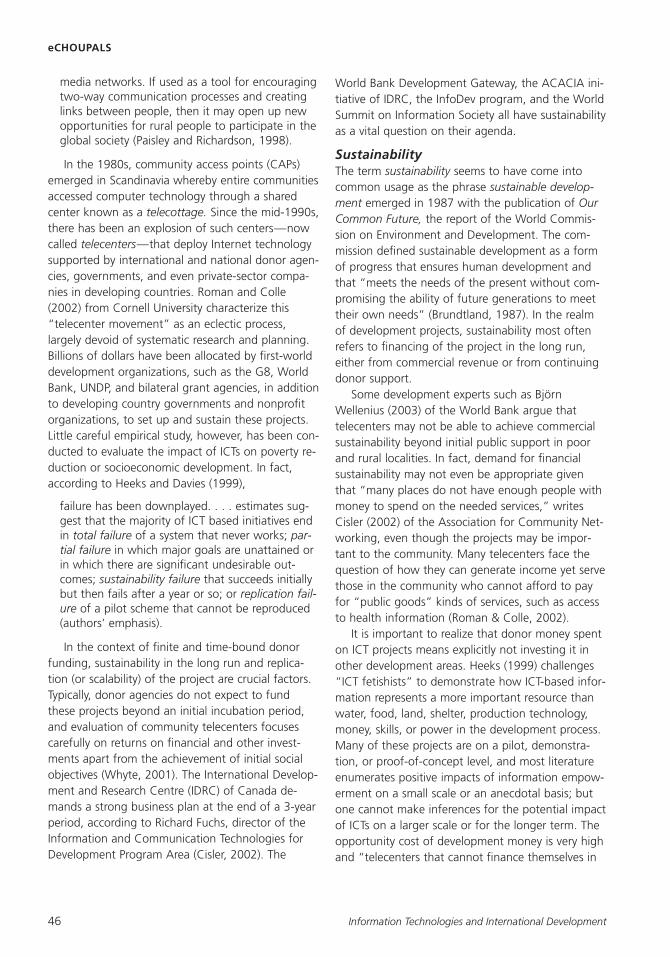
media networks. If used as a tool for encouraging two-way communication processes and creating links between people, then it may open up new opportunities for rural people to participate in the global society (Paisley and Richardson, 1998).
In the 1980s, community access points (CAPs) emerged in Scandinavia whereby entire communities accessed computer technology through a shared center known as a telecottage. Since the mid-1990s, there has been an explosion of such centers—now called telecenters—that deploy Internet technology supported by international and national donor agencies, governments, and even private-sector companies in developing countries. Roman and Colle (2002) from Cornell University characterize this “telecenter movement” as an eclectic process, largely devoid of systematic research and planning. Billions of dollars have been allocated by ªrst-world development organizations, such as the G8, World Bank, UNDP, and bilateral grant agencies, in addition to developing country governments and nonproªt organizations, to set up and sustain these projects. Little careful empirical study, however, has been conducted to evaluate the impact of ICTs on poverty reduction or socioeconomic development. In fact, according to Heeks and Davies (1999),
failure has been downplayed. . . . estimates suggest that the majority of ICT based initiatives end in total failure of a system that never works; partial failure in which major goals are unattained or in which there are signiªcant undesirable outcomes; sustainability failure that succeeds initially but then fails after a year or so; or replication failure of a pilot scheme that cannot be reproduced (authors’ emphasis).
In the context of ªnite and time-bound donor funding, sustainability in the long run and replication (or scalability) of the project are crucial factors. Typically, donor agencies do not expect to fund these projects beyond an initial incubation period, and evaluation of community telecenters focuses carefully on returns on ªnancial and other investments apart from the achievement of initial social objectives (Whyte, 2001). The International Development and Research Centre (IDRC) of Canada demands a strong business plan at the end of a 3-year period, according to Richard Fuchs, director of the Information and Communication Technologies for Development Program Area (Cisler, 2002). The
World Bank Development Gateway, the ACACIA initiative of IDRC, the InfoDev program, and the World Summit on Information Society all have sustainability as a vital question on their agenda.
The term sustainability seems to have come into common usage as the phrase sustainable development emerged in 1987 with the publication of Our Common Future, the report of the World Commission on Environment and Development. The commission deªned sustainable development as a form of progress that ensures human development and that “meets the needs of the present without compromising the ability of future generations to meet their own needs” (Brundtland, 1987). In the realm of development projects, sustainability most often refers to ªnancing of the project in the long run, either from commercial revenue or from continuing donor support.
Some development experts such as Björn Wellenius (2003) of the World Bank argue that telecenters may not be able to achieve commercial sustainability beyond initial public support in poor and rural localities. In fact, demand for ªnancial sustainability may not even be appropriate given that “many places do not have enough people with money to spend on the needed services,” writes Cisler (2002) of the Association for Community Networking, even though the projects may be important to the community. Many telecenters face the question of how they can generate income yet serve those in the community who cannot afford to pay for “public goods” kinds of services, such as access to health information (Roman & Colle, 2002).
It is important to realize that donor money spent on ICT projects means explicitly not investing it in other development areas. Heeks (1999) challenges “ICT fetishists” to demonstrate how ICT-based information represents a more important resource than water, food, land, shelter, production technology, money, skills, or power in the development process. Many of these projects are on a pilot, demonstration, or proof-of-concept level, and most literature enumerates positive impacts of information empowerment on a small scale or an anecdotal basis; but one cannot make inferences for the potential impact of ICTs on a larger scale or for the longer term. The opportunity cost of development money is very high and “telecenters that cannot ªnance themselves in
Information Technologies and International Development 46
the long run become a drain on public resources. [Moreover], telecenters not subject to market disciplines lack incentives to perform well and the ability to face competition when it arrives,” cautions Wellenius (2003). More signiªcantly, if a telecenter is doing well today, can it continue to provide those beneªts in the long term? What happens to the project when the funding runs out? If a telecenter does not generate enough revenue to cover operational and maintenance costs apart from generating a surplus to replace equipment, “inevitable equipment breakdowns and obsolescence will eventually force the telecentre to shut down,” warns Proenza of the UN’s Food and Agriculture Organization (2001).
In addition to ªnancial sustainability, the literature elaborates on social/cultural, political/institutional, and technological sustainability for long-term survival of telecenters. Batchelor and Norrish (2002) deªne social sustainability as minimizing social exclusion and maximizing social equity. This means ensuring access to the telecentre for heterogeneous groups of people in the community and responding to their different needs. Delgadillo et al. (2002) of the IDRC observe that “if people in the community feel themselves empowered by the telecentre, they will be more active in seeking ways to keep it running.”
Political sustainability stems from the recognition that one of the biggest threats to ICT-enabled projects is resistance to change, particularly from vested interests set to lose out in the process of information exchange (Tinio, 2002–2003). Gaining the cooperation of community leaders and policy makers is necessary to create an environment or a “regulatory framework that will protect, promote and support community telecentres and their activities” (Delgadillo et al., 2002).
Technological sustainability is fundamentally related to ªnancial sustainability since the most visible cost usually comprises equipment and technical maintenance. Various projects are trying to adopt modular techniques to make these components of sustainability an integral part of their functioning.
KUMAR
Nevertheless, Munyua (2000) notes that “most projects established with external funding face major challenges after the project period has ended. . . . There are as yet few examples of success in attaining such sustainability, and there is an urgent need for viable models to be developed and tested.
This paper is a study of a commercially motivated, rural ICT initiative in the state of Madhya Pradesh in India focusing on the question of ªnancial sustainability. It does not address the questions of social, political, technological, or institutional sustainability, which are perhaps more important. While recognizing this limitation of the paper, the author has chosen to focus on ªnancial sustainability because without it, the project will not survive. The concerns of sociopolitical impact (for instance, impact based on caste, class, gender, and occupation, and the relationship of the project to political and institutional forces in the village, etc.) will be addressed by the author in a forthcoming paper.
The software services export boom in India has been accompanied by another, parallel explosion of projects described by the Economic and Political Weekly as “one of the largest set of civil society experiments to use ICTs to empower as well as to increase the range of services to the marginalised at reduced costs” (Vijaybhaskar & Gayathri, 2003). Not only have several state governments and nonproªt institutions started ICT projects such as Gyandoot, Bhoomi, TARAhaat, and Jiva telecenters,1 but increasingly venture capitalists have entered the fray. A sound business plan, stressing market knowledge, economical use of resources, and revenue generating capacity (Delgadillo et al., 2002), has been the hallmark of these commercially-sponsored ventures, which aim to tap the potential market of 600–700 million Indians living in rural areas by using information technology to provide them with much-needed connectivity and ICT-based services.
This paper undertakes an evaluation of the ªnancial sustainability of India’s largest commercial ICT project, started by the India Tobacco Company’s
1. Gyandoot: an e-government project started in 2000 in Dhar district, Madhya Pradesh (www.gyandoot.nic.in); Bhoomi: an online land records available through kiosks set up by the government of Karnataka (http://www.revdept01.kar.nic.in); TARAhaat: an e-commerce portal and telecenters set up by the NGO Development Alternatives (www.tarahaat.com); Jiva Institute: telecenters known as Baatchit that provide education and other services (http:// www.jiva.org/enterprise/baatchit.asp).
Volume 2, Number 1, Fall 2004 47
eCHOUPALS
International Business Division (ITC-IBD),2 known as the eChoupals. The eChoupals are unique in conception and different from the usual telecenter project. Their actual value proposition is the provision of futures’ price information and the creation of an alternative buying infrastructure, which is supported by computers and connectivity. Financial sustainability of the eChoupals depends on the ability to recover the investment of the ICT infrastructure but the returns to this project are not from transactions related to the computer but rather from the larger re-engineering of the agricultural supply chain. Most ICT projects set up the infrastructure and then ªgure out how best to recover the cost of that investment. The struggle is to ªnd viable business propositions by providing information or services through the established network. In contrast, the eChoupals (also known as soyachoupals3 in the state of Madhya Pradesh where the primary rainy/ summer season crop is soybean) fundamentally differ from this approach. For the eChoupals, ICTs are not valuable in themselves, but generate value only when they enable the creation of an alternative agricultural infrastructure through the exchange of information, as will be evident from the analysis that follows.
Evaluation of available data on revenue and costs of the eChoupals suggests that this initiative has the potential to be ªnancially sustainable in the long run. The payback period for all capital investment and running costs is 3.9 years. This is exceptional given that most ICT projects are struggling even to recover daily operating costs. A sensitivity analysis shows both optimistic and pessimistic scenarios in Table 6, but in the worst case, payback (without depreciation) is 5.8 years, and in the best case, payback is 3.5 years and the project is able to pay for the replacement cost of the entire capital within 7 years. Several assumptions regarding the correct
measurement of capital and operating costs, as well as calculations of savings/revenue, are noted in the paper, which could make the conclusion vary to a certain extent. Despite these problems, it is hoped that this study will encourage further empirical research into the question of the long-term sustainability of ICTs for development.
In December 2002 and January 2003, the author spent 3 weeks studying the eChoupals,4 ªrst interviewing ITC-IBD personnel at the ªrm’s headquarters in Hyderabad for 5 days, then traveling to the soyachoupals near Bhopal and Indore in Madhya Pradesh for 14 days, speaking to choupal operators, to farmers, and to villagers using the choupals.5 Detailed questionnaires for operators, farmers, traders, villagers, and ITC-IBD personnel were developed and used as guides for conducting formal and informal interviews. Group discussions were conducted at tea shops, market places, and village congregation areas (Panchayat bhavans), as well as at the choupal premises themselves.
Financial data were obtained from the Hyderabad and Bhopal ofªces in raw form (from ITC-IBD’s online ªnancial management software and from data tables on eChoupal transactions maintained by the ªnancial team in Bhopal) and were amalgamated by the author. This was supported by interviews with ITC-IBD operations, ªnance, and technical managers, with personnel in two processing plants, and with other ªeld staff. For instance, ªgures for the average cost of an eChoupal were compared from different sources within the company (see Footnote 1 in Table 4) and also crosschecked with the cost of kiosks set up by other projects studied by the author. Similarly, data on operating costs were obtained from separate sources in Hyderabad and Bhopal and were re-checked in interviews with technical support staff. For revenue/
2. ITC-IBD stands for India Tobacco Company-International Business Division. ITC and ITC-IBD are used interchangeably in this paper to denote the same company. 3. eChoupals, choupals, and soyachoupals are used interchangeably in this paper to refer to ITC-IBD’s village Internet kiosks in Madhya Pradesh. 4. Prior to research on the eChoupals, the author spent some time working and researching in Uttar Pradesh (north India) at TARAhaat’s village Internet centres started by the NGO Development Alternatives. Following this, the author worked with n-Logue Communications, a company based out of the Indian Institute of Technology, Madras, to set up village Internet kiosks and conceptualize and implement Internet-based services in the south Indian state of Tamil Nadu. 5. See Appendix A for a list of the choupals visited and the characteristics of the villages they serviced.
Information Technologies and International Development 48
KUMAR
savings data, the output from ITC-IBD’s electronic transaction system, Entrest, was calculated at Bhopal by adding up total tons bought by ITC-IBD from all the choupals and using the daily futures’ price quoted by ITC. Individual choupals visited by the author were asked to verify the total amount of soybean they had supplied to the company in the last year to see if it tallied with the data in Entrest (Appendix A).
The ªnancial analysis was sent to managers in Hyderabad and Bhopal to verify the accuracy of the statistics and claims made in the paper. They suggested a number of corrections, which have been incorporated into the analysis.6 The data have been put through rigorous tests using conservative discounting rates for the opportunity cost of capital, the failure of monsoons (since the revenue is directly dependent on buying agricultural produce), and differing rates of depreciation. Six scenarios were analyzed, ranging from highly pessimistic to fairly optimistic, based on revenue data from soybean procurement. If other potential revenue streams using the existing infrastructure are added (savings from buying wheat and commission from rural distribution through the same choupals) then proªtability in all scenarios is fairly realistic.
The paper is organized as follows. Section two describes the soybean agricultural market structure in Madhya Pradesh followed by the changes brought through the eChoupals and analyzes the beneªts accruing to farmers and ITC-IBD (Table 1). The third section and Table 2 enumerate the total revenue for ITC-IBD over a 16-month period and discusses possible sources of revenue in the future. The fourth section presents ITC’s variation of the telecenter model and the ªfth section enumerates the capital costs and operating costs of the eChoupals (Tables 3, 4, and 5), which have been completely borne by ITC. This is followed by an analysis of the ªnancial data in Table 6 using standard measures of return on investment and payback period to ascertain the ªnancial sustainability of the project. In the last section, this paper provides a brief discussion of the social context of the eChoupals in the villages and reºects upon the potential of this large-
scale project to bring about signiªcant changes in rural India.
ITC-IBD is the 13-year-old agri-business division of the large Indian conglomerate, India Tobacco Company Ltd. ITC-IBD primarily procures and exports agricultural commodities in raw or processed form and is India’s largest overall agricultural exporter. With the opening up of Indian agricultural markets in 1996–97 under the World Trade Organization’s rules, ITC faced increasing competition from large, low-cost suppliers of agricultural products in the United States, Brazil, and other countries. ITC’s procurement costs were much higher due to gross inefªciencies in India’s markets, detailed in an inºuential report on the state of Indian agriculture released in 1997 by McKinsey and Company (FAIDA report; Confederation of Indian Industry and McKinsey and Company 1997). This report lamented India’s low productivity and wastage in production and distribution, particularly arising from the small size of landholdings in the country, as a source of higher costs to processors like ITC.
Let us take the example of soybean. ITC-IBD has a network of 130–140 commission agents (CAGs, or traders) in the state of Madhya Pradesh who coordinate the buying of soybean from wholesale market yards (mandis) and from a network of smaller traders. ITC-IBD arranges for the processing of all soybean it buys to produce soybean oil, which is sold domestically, and de-oiled cake, which is exported for cattle feed to the Middle East and Southeast Asia. Farmers bring their produce in trolleys, or small wagons, to the mandi, where it is auctioned to a group of traders, some of whom are agents for companies like ITC. These agents weigh and bag the material they purchase, settle the price for the farmer and send the produce to ITC’s warehouses for processing. ITC pays its agents a commission along with the cost of bagging and transportation over and above the price of soybean. Farmers, too, have to pay the agents for weighing the produce once it has been auctioned and for labor charges in
6. ITC-IBD was open and cooperative, both in providing the data and in checking the ªnancial analysis. However, any errors that remain and claims made in the conclusion are the sole responsibility of the author.
Volume 2, Number 1, Fall 2004 49
eCHOUPALS
volved in moving it to the agent’s warehouse. Many agents directly collect the produce of large farmers from the village itself (and get paid extra), while small and medium-sized farmers usually take their produce to the village trader who, in turn, goes to the mandi to sell to larger commission agents, such as ITC.
Given the lack of basic physical infrastructure in the Indian countryside, such as paved roads, cold storage facilities, warehouses, telecom connectivity, etc., and given the geographic dispersion of farmers and the small farm sizes, traders, commission agents, and local mandis have been seen as necessary to ensure the distribution of agricultural produce. These middlemen take the responsibility for quality and bear the ªnancial risk of trading with large numbers of farmers. Often, they are also the brokers of ªnancial capital for seeds and inputs (seed, fertilizer, and pesticides).
Local traders have the power to quote a given price to farmers, as well as the authority to downgrade the price according to their own estimation of the quality of the produce. Manohar Mandloi, an eChoupal entrepreneur from Kurana village, elaborates, “Traders change their prices all day. In the morning they will buy at a higher price, say, one truck for 1,300 Rs. a quintal and another for 1,000 Rs. Over the course of the day, they will keep reducing the price and ªnally buy several inferior quality lots just for 400–500 Rs.7 Then they mix it all and sell it for a proªt.” In this manner, ITC and other companies get a lower overall quality of soybean, which upon processing yields less oil and more contaminated de-oiled cake.
In the mandi, although the auction generally takes place in a competitive manner,8 prices ºuctuate at least 20 rupees per quintal in either direction on a daily basis. Ever since the soybean market in India was pegged to the world price in 1999, however, downward and upward trends have become
more difªcult to ascertain. Earlier, it was clear that if a farmer was able to hold on to the crop and sell after the season was over (i.e., after January or February rather than in September or October), he would get a better price. Today, with soybean from Brazil and the United States coming on the market at different times of the year, the ºuctuation in prices has become uncertain over the course of a year.9 Traders have information on these price ºuctuations through their contact with larger market yards and export companies like ITC, and are able to maximize their own proªt margins at the expense of farmers who are unable to predict price changes.
To lower its procurement cost and improve its quality of soybean, in 2000 ITC-IBD developed the concept of the eChoupal. eChoupals are village Internet kiosks run by local entrepreneurs who provide futures’ price information to farmers10 and enable them to sell their produce directly to ITC, bypassing the middlemen and wholesale market yards (mandis). Through the eChoupals, ITC spends less per ton of produce (since it is not paying commissions and transaction costs to middlemen) and farmers know the price they will receive for their produce if they sell the next day.
Best and Maclay (2002) have called into question the beneªts of the provision of market price information for the agricultural sector. They argue that other community characteristics including availability of transport, credit, and alternative markets are important factors that determine whether farmers can act upon the market price information they have obtained. The eChoupal concept has taken this into account by setting up a buying infrastructure parallel to the traditional mandi system. This includes four processing plants and nine warehouses in Madhya Pradesh (that were in operation as of January 2003) where farmers can come directly with their produce, reimbursement of transport costs to
7. One dollar was equal to approximately 50 rupees (Rs.) in 2003. 8. There are certain problems even with the mandi system where the high cost of entry for traders, a monopoly by an inºuential group of agents, and price ªxing are not unknown. Delving into these issues, however, is beyond the scope of this paper. 9. See http://www.cbot.com/cbot/pub/page/0,3181,1288,00.html for historical soybean price volatility at the Chicago Board of Trade. Accessed March 10, 2004. 10. ITC pegs the price for each day based on the previous day’s international market rate for soybean. ITC takes a risk in that, if the market plunges the next day, ITC still must honor its commitment to farmers at the quoted futures’ price, and incur a loss.
Information Technologies and International Development 50
KUMAR
farmers at a ªxed rate per quintal,11 and an entrepreneur (called a sanchalak)12 who runs the choupal in the village helps farmers analyze the price information, and arranges transportation. In many cases, sanchalaks transport the material at their own expense to compete against traders who come to the village and directly negotiate deals with large farmers, thus bypassing the mandi altogether.13
The main advantage of ITC’s price is that it is a quote for the future. Usually when a farmer sells at the mandi, he has already borne the expense of bringing his produce to market and is forced to sell at whatever rate he can get because it is too expensive to transport the material back to the village and back to market. He may have found out the prevailing rate from returning farmers along the highway or from local trading outposts or even from the local language newspaper in the region, but these prices are for earlier in the day or the prior day. Through the eChoupal, before leaving the village farmers know what price to expect based on a particular level of quality. Moreover, those choupals with
Internet access can provide access to world market trends in soybean from the Chicago Board of Trade.14
15
Once a farmer has decided to sell to ITC, the sanchalak gives him a sauda number (transaction slip) that is shown to the ofªcer at the processing plant or warehouse (to be able to track the amount of soybean coming from each choupal). At the plant, the crop is ªrst tested for quality using an electronic machine in the laboratory. Any farmer who contests the results can ask for resampling and retesting of their crop’s quality. If the quality is within the limits of 2% bad seed, 2% foreign matter, and 10% moisture, the farmer obtains the highest price advertised the night before. Inferior quality material is downgraded in price by ITC’s sampling ofªcer.16 Once a farmer accepts the price, the produce is weighed on a large, automated scale instead of on a manual scale. In other words, the entire loaded trolley is weighed, then emptied into the silo
11. ITC was setting up choupals in villages more than 100 km away from its four processing plants, making it difªcult for farmers to come all the way. So it started an incentive system to pay a certain amount per quintal as freight expenses for every kilometer farmers traveled to reach the plants. ITC also rented nine warehouses in areas away from the four processing plants so that the nearby choupal farmers could travel less to sell their produce to ITC. 12. There are no women operators/entrepreneurs because ITC’s selection criteria speciªcally call for a male operator of a medium-sized farm in the village. A discussion of the gender implications of this choice, while crucial for evaluating the claims of ICT projects to promote overall rural prosperity and socioeconomic development, is beyond the scope of this paper. This topic will be addressed in a forthcoming article by the author that examines the social aspects of the use and beneªts of the eChoupals. This paper refers to operators using the masculine gender to draw attention to this important issue. 13. In other cases, ITC’s commission agents organize for bulk transportation and get paid an extra commission from ITC. 14. ITC has been experimenting with a system known as Jhangad, where farmers “sell” their soybean to ITC as soon as they harvest it, and receive 10% of the total price quoted on that day. They also sign a futures’ bond whereby on a day of their choice within the next 6 months, the farmers can come back to ITC and collect the rest of the money based on the price prevailing that day. This way, ITC gets the soybean into its processing system and is able to maintain large buffer stocks to use during the lean season; and farmers lacking storage facilities have the option of getting a higher price sometime in the future by paying a nominal fee to ITC. 15. One of ITC’s processing plants was close to the Mandideep mandi (near Bhopal) and competed directly with the mandi for a share of the soybean from the surrounding areas. The largest trader at this mandi complained that they were losing margins and market share to ITC ever since the eChoupals were started. Moreover, ITC had employed an agent to exclusively buy soybean from this mandi for the processing plant. He could bid in the auction up to ITC’s quoted price for the day. This created a minimum price cushion under which no other trader could bid and get away with it unless the quality of the material was very poor. Thus, even at this particular mandi, farmers were assured of getting, at minimum, ITC’s price for their crop (albeit without the other beneªts of freight reimbursements, etc.). Farmers who came to sell speciªcally at the mandi would often inquire about ITC’s price to make sure they were getting the best possible deal. 16. While this may be better than a manipulative trader, there are margins of error in this system. both machine and human. The lab technician pegged the machine at about 3–4% margin of error but did not consider this to be signiªcantly large. Most farmers seemed to treat the lab’s analysis as “genuine” compared to the trader’s “sight” analysis. While in practice disputes may occur, the author did not have an opportunity to witness such a case.
Volume 2, Number 1, Fall 2004 51
eCHOUPALS
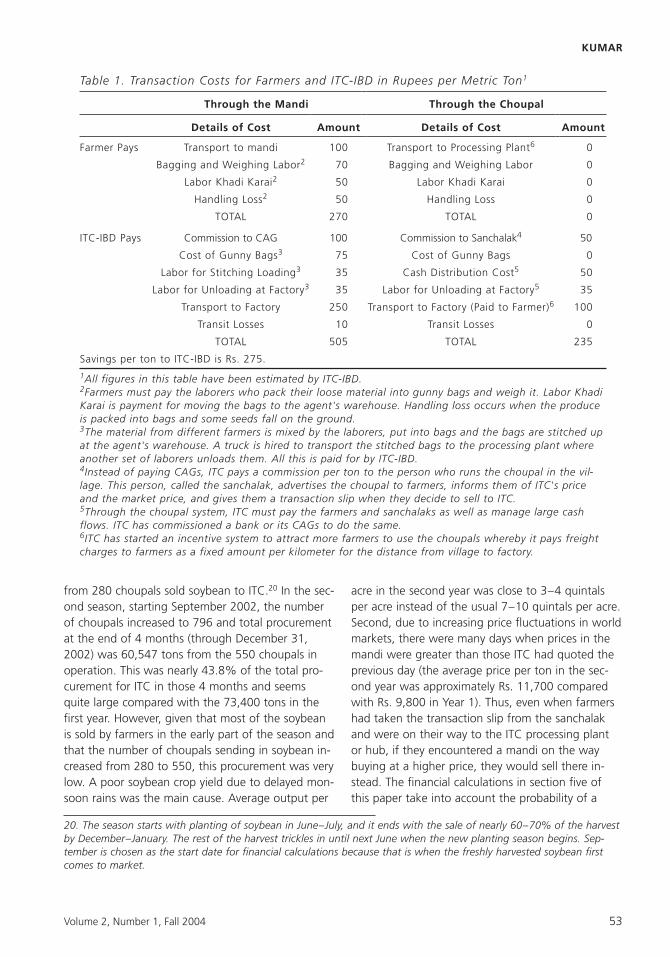
and reweighed to get the weight of the soybean delivered. In the manual process of the mandi, the material was packed into bags that were then weighed, leaving room for seeds to fall on the ground and excluded from the weighing. Furthermore, the mandi process gave the person balancing the scales an undue advantage to tip against the farmer. Many farmers complained that they would regularly lose 1–2 kilograms per bag (each bag holds approximately 90 kg of material) at the mandi compared with ITC’s electronic weigh-bridge. The farmer had to pay the trader in the mandi for tulai (labor charges for weighing) and hammali (labor charges for bagging and storing). In ITC’s case, these services are free, since the grain is directly stored in ITC’s silos, instead of being bagged. And ªnally, ITC gives farmers full payment for produce at the time of the transaction, unlike the mandi, the government-buying center (Tilansangh), or even many traders who pay in installments or pay after some amount of time ranging from a few days to a few months. The farmer’s cost of selling to ITC is reduced to nearly zero since there is no payment for bagging or weighing, and freight is paid by ITC.17 ITC-IBD estimates that on average it saves Rs. 275 per ton of soybean purchased through the choupals, while farmers save Rs. 270 per ton. Table 1 shows the average transaction costs incurred both by ITC and the farmer in the traditional system and through the choupals.
Soybean procurement is only one aspect of the larger project of ITC’s eChoupal network. ITC also provides updates on the weather and access to lower-priced inputs through pooled purchasing at wholesale prices. Further, ITC has plans over the
next several years to use the choupal network to connect farmers to agricultural scientists and to information on best practices to encourage higher productivity. With improving rural incomes, ITC hopes to convert the buying process into a cost-effective rural distribution network selling consumer products, to villagers, such as motorbikes and televisions, and services, such as insurance.
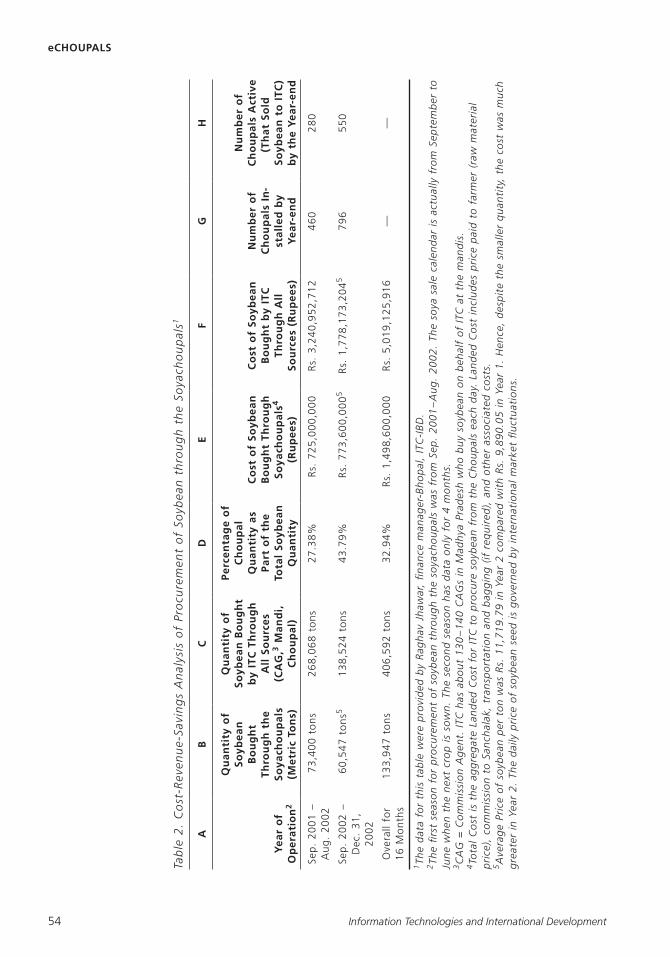
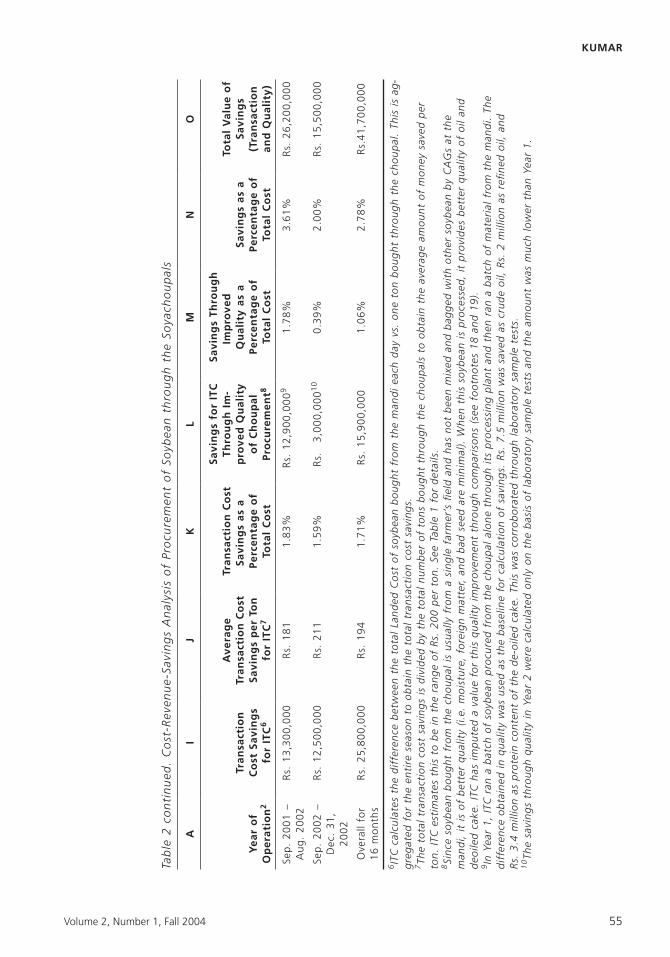
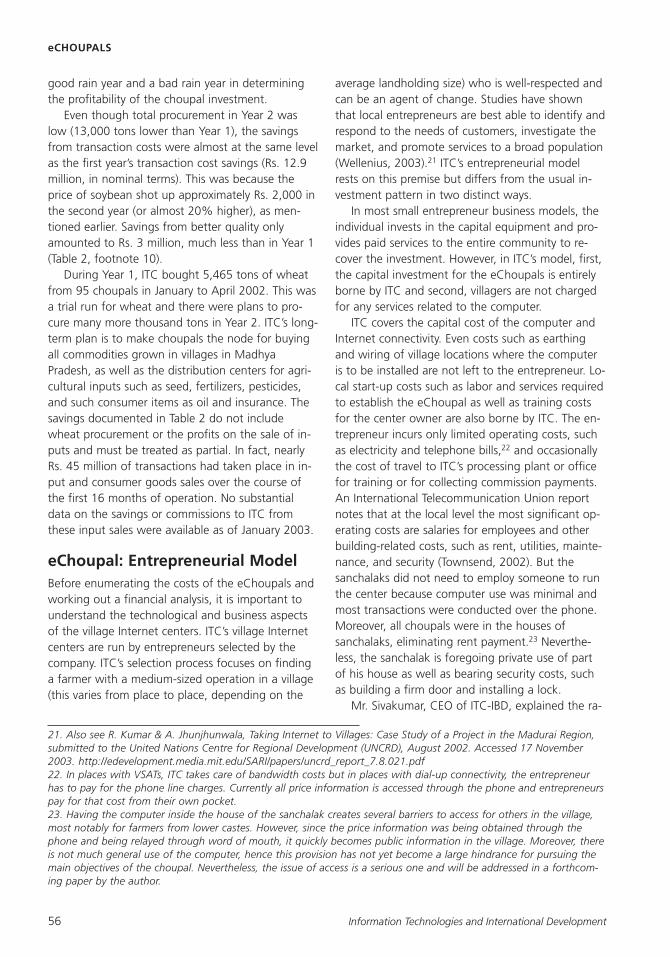
Table 2 calculates the savings accruing to ITC over the ªrst 16 months of operation of the eChoupals to December 2002. The data for Year 1 is for the entire year, while the data for Year 2 is for the ªrst 4 months of the season.
From the nearly 73,400 tons of soybean purchased through the eChoupals in the ªrst season (over and above the regular procurement of soybean through ITC’s commission agents in the mandis— nearly 30% of all soybean bought by ITC that year), ITC calculated that it saved Rs. 13.3 million in transaction costs or almost 2% of the total value of the produce (Table 2). Moreover, through the choupal system, the produce comes loose in trolleys (usually from a single farm) without being mixed and bagged at the mandi, and is of better quality compared with mandi-procured soybean.18 Consequently, ITC-IBD estimates saving Rs. 12.9 million in the ªrst year of operation through better quality of oil and de-oiled cake after processing the choupal soybean (Table 2).19
Of a total 460 choupals in operation during the ªrst year (September 2001 to June 2002), farmers
17. At certain ITC warehouses where electronic weighing machines are not available, farmers have to pay for manual weighing at the rate of Rs. 3–5 per quintal up to 10–15 Rs. per quintal. Also, at the Indore processing plant, payment for freight was discontinued due to irregularities. Instead, the price per ton was increased by Rs. 20–30 across the board. Many large farmers do not even travel to the mandi to sell their produce since traders negotiate the deal at the village and pick up the material as soon as it is threshed. For these farmers, the opportunity cost of the time they spend transporting the produce is an important component of the cost. Thus, transaction costs for farmers would not be zero in all cases. 18. The choupal material usually comes directly on trolleys and is not mixed or bagged, and is directly unloaded into the silos. Material from CAGs usually comes bagged in trucks, which are then unloaded into huge storage areas covered by tarpaulin. 19. In the ªrst year, ITC ran a separate batch of soybean procured from the choupal through its processing plant and then ran a batch of material from the mandi. The difference obtained in quality was used as the baseline for calculating savings of approximately Rs. 200 per ton. In all, Rs. 7.5 million were saved as crude oil, Rs. 2 million as reªned oil, and Rs. 3.4 million as protein content of the de-oiled cake, or a total of Rs. 12.9 million. This data was provided by Raghav Jhawar, ªnance manager, ITC-IBD Bhopal.
Information Technologies and International Development 52
KUMAR
Table 1. Transaction Costs for Farmers and ITC-IBD in Rupees per Metric Ton1
Farmer Pays Transport to mandi 100 Transport to Processing Plant6 0
Bagging and Weighing Labor2 70 Bagging and Weighing Labor 0
Labor Khadi Karai2 50 Labor Khadi Karai 0
Handling Loss2 50 Handling Loss 0
TOTAL 270 TOTAL 0
ITC-IBD Pays Commission to CAG 100 Commission to Sanchalak4 50
Cost of Gunny Bags3 75 Cost of Gunny Bags 0
Labor for Stitching Loading3 35 Cash Distribution Cost5 50
Labor for Unloading at Factory3 35 Labor for Unloading at Factory5 35
Transport to Factory 250 Transport to Factory (Paid to Farmer)6 100
Transit Losses 10 Transit Losses 0
TOTAL 505 TOTAL 235
Savings per ton to ITC-IBD is Rs. 275.
1All figures in this table have been estimated by ITC-IBD. 2Farmers must pay the laborers who pack their loose material into gunny bags and weigh it. Labor Khadi Karai is payment for moving the bags to the agent's warehouse. Handling loss occurs when the produce is packed into bags and some seeds fall on the ground. 3The material from different farmers is mixed by the laborers, put into bags and the bags are stitched up at the agent's warehouse. A truck is hired to transport the stitched bags to the processing plant where another set of laborers unloads them. All this is paid for by ITC-IBD. 4Instead of paying CAGs, ITC pays a commission per ton to the person who runs the choupal in the village. This person, called the sanchalak, advertises the choupal to farmers, informs them of ITC's price and the market price, and gives them a transaction slip when they decide to sell to ITC. 5Through the choupal system, ITC must pay the farmers and sanchalaks as well as manage large cash flows. ITC has commissioned a bank or its CAGs to do the same. 6ITC has started an incentive system to attract more farmers to use the choupals whereby it pays freight charges to farmers as a fixed amount per kilometer for the distance from village to factory.
from 280 choupals sold soybean to ITC.20 In the sec- acre in the second year was close to 3–4 quintals ond season, starting September 2002, the number per acre instead of the usual 7–10 quintals per acre. of choupals increased to 796 and total procurement Second, due to increasing price ºuctuations in world at the end of 4 months (through December 31, markets, there were many days when prices in the 2002) was 60,547 tons from the 550 choupals in mandi were greater than those ITC had quoted the operation. This was nearly 43.8% of the total pro- previous day (the average price per ton in the seccurement for ITC in those 4 months and seems ond year was approximately Rs. 11,700 compared quite large compared with the 73,400 tons in the with Rs. 9,800 in Year 1). Thus, even when farmers ªrst year. However, given that most of the soybean had taken the transaction slip from the sanchalak is sold by farmers in the early part of the season and and were on their way to the ITC processing plant that the number of choupals sending in soybean in- or hub, if they encountered a mandi on the way creased from 280 to 550, this procurement was very buying at a higher price, they would sell there in-low. A poor soybean crop yield due to delayed mon- stead. The ªnancial calculations in section ªve of soon rains was the main cause. Average output per this paper take into account the probability of a
20. The season starts with planting of soybean in June–July, and it ends with the sale of nearly 60–70% of the harvest by December–January. The rest of the harvest trickles in until next June when the new planting season begins. September is chosen as the start date for ªnancial calculations because that is when the freshly harvested soybean ªrst comes to market.
Volume 2, Number 1, Fall 2004 53
eCHOUPALS
1So
yach
ou
pal
sth
eth
rou
gh
Soyb
ean
of
Pro
cure
men
to
fA
nal
ysis
Co
st-R
even
ue-
Savi
ng
s2
.Ta
ble
54 Information Technologies and International Development
–2
00
22
00
1Se
p.
Au
g.
ton
s7
3,4
00
ton
s2
68
,06
82
7.3
8%
72
5,0
00
,00
0R
s.3
,24
0,9
52
,71
2R
s.4
60
28
0
55
0
—
79
6
—
51
,77
8,1
73
,20
4
5,0
19
,12
5,9
16
Rs. Rs.
57
73
,60
0,0
00
Rs. 1
,49
8,6
00
,00
0R
s.
43
.79
%
32
.94
%
ton
s
ton
s
13
8,5
24
40
6,5
92
5to
ns
ton
s
60
,54
7
13
3,9
47
–
for
20
02
31
,2
00
2
Mo
nth
s
Dec
.Se
p.
Ove
rall
16
toSe
pte
mb
er mu
ch
mat
eria
l
was
cost
fro
m
(raw
the
actu
ally
farm
erto
is qu
anti
ty,
cale
nd
ar pai
dm
and
is.
smal
ler
pri
ce
the
sale
the
soya at
ITC in
clu
des
des
pit
e
The
of
Co
st
Hen
ce,
20
02
.
beh
alf
Lan
ded
20
01
–A
ug
.
on . cost
s. 1.
ear
soyb
ean day
ITC
-IB
D.
bu
y asso
ciat
edY
in
each
ºu
ctu
atio
ns.
Sep
.
9,8
90
.05
wh
oC
ho
up
als
oth
erR
s.m
arke
t
-Bh
op
al,
fro
m
Prad
esh
and
man
ager w
as mo
nth
s.
the
wit
h
soya
cho
up
als 4
for fro
m
on
ly
req
uir
ed),
Mad
hya
com
par
edin
tern
atio
nal
ªn
ance
inso
ybea
n
by
(if
dat
a 2
,Jh
awar th
eh
asC
AG
sp
rocu
reb
agg
ing
ear
Yin
go
vern
ed
thro
ug
hse
aso
n
Rag
hav
13
0–
14
0to an
dIT
C
seco
nd
for 11
,71
9.7
9is
by
soyb
ean
abo
ut
Rs.
Co
st
pro
vid
edo
f The
was
pro
cure
men
t has tr
ansp
ort
atio
n seed
soyb
ean
sow
n.
Lan
ded o
f
San
chal
ak, ton
ITC
pri
ce
wer
e
iscr
op
Ag
ent.
tab
lefo
rn
ext ag
gre
gat
e per
soyb
ean
dai
ly
Co
mm
issi
on to Th
e
this
seas
on
the
com
mis
sio
no
f 2.
the
Pric
eea
r
for is Y
dat
aª
rst
wh
en in
= Co
st
The
The
CA
Go
tal
2 Jun
e3 4 p
rice
),A
vera
ge
T
1 5 gre
ater
KUMAR
Soya
cho
up
als
the
thro
ug
hSo
ybea
no
fPr
ocu
rem
ent
of
An
alys
isC
ost
-Rev
enu
e-Sa
vin
gs
con
tin
ued
.2
Tab
le
Volume 2, Number 1, Fall 2004 55
–2
00
22
00
1Se
p.
Au
g.
13
,30
0,0
00
Rs.
18
1R
s.1
.83
%9
12
,90
0,0
00
Rs.
1.7
8%
3.6
1%
26
,20
0,0
00
15
,50
0,0
00
Rs.
Rs. Rs.
41
,70
0,0
00
2.0
0%
2.7
8%
0.3
9%
1.0
6%
10
3,0
00
,00
0
15
,90
0,0
00
Rs. Rs.
1.5
9%
1.7
1%
21
1
19
4
Rs.
Rs.
12
,50
0,0
00
25
,80
0,0
00
Rs.
Rs.
–
for
20
02
31
,2
00
2
mo
nth
s
Dec
.Se
p.
Ove
rall
16
-ag
is
per an
d
The
This
the nd
save
d oil
a
cho
up
al.
at of
man
di.
oil, 1.
mo
ney
CA
Gs
qu
alit
y
the
reª
ned ea
rY
the by
of fro
m
than
bet
ter
thro
ug
h
amo
un
t
soyb
ean
mat
eria
l asm
illio
n
low
er
oth
erp
rovi
des
bo
ug
ht
aver
age of 2
mu
ch
wit
h it
bat
ch Rs.
oil, was
ton
the
bag
ged 19
). a
on
e
ob
tain
pro
cess
ed,
ran
cru
de
vs. an
d
as amo
un
t
is then
test
s.
and
day
save
d the
each
soyb
ean 18
toch
ou
pal
s and
mix
ed and
this
foo
tno
tes
pla
nt
was sa
mp
le
man
di
bee
n y test
s
the
(see
mill
ion
Wh
en
pro
cess
ing
lab
ora
tor
thro
ug
h no
t
the sam
ple
7.5
has
min
imal
).
its Rs.
thro
ug
h y
fro
m
det
ails
.an
d
lab
ora
tor
bo
ug
ht
bo
ug
ht
for
ªel
d com
par
iso
ns
savi
ng
s.
1 thro
ug
hsa
vin
gs.
of
soyb
ean
ton
s
farm
er’s
are
seed
alo
ne of
bas
is
of ab
le
thro
ug
h
T
bad th
e
of co
st
See co
rro
bo
rate
d
sin
gle
Co
st
nu
mb
er
imp
rove
men
tch
ou
pal
calc
ula
tio
n
Lan
ded
tran
sact
ion w
as on
and
ton
.a
This
on
ly
tota
lp
er
mat
ter,
for
fro
m the
20
0
tota
l
qu
alit
yfr
om
bas
elin
eca
ke.
the
tota
l
by
Rs.
usu
ally
the
the of fo
reig
n
calc
ula
ted
the
div
ided is th
is
ran
ge as d
e-o
iled
mo
istu
re,
wer
e
ob
tain
cho
up
al for
pro
cure
d
bet
wee
n
is
soyb
ean
use
dth
e 2
the va
lue
of
ear
savi
ng
s
was Y
to
the
(i.e
. a in
dif
fere
nce
seas
on in
to fro
mq
ual
ity o
f
be
con
ten
t
cost
imp
ute
d
qu
alit
y
qu
alit
y
bat
ch
enti
retr
ansa
ctio
nth
is
has
the
bo
ug
ht
inp
rote
in
ran
the bet
ter a
ITC
for ob
tain
edas th
rou
gh
esti
mat
es
calc
ula
tes
soyb
ean
of
isca
ke. ITC
mill
ion
savi
ng
s
ITC
6 gre
gat
ed tota
l 1,
it
ITC
ear
ton
.Si
nce
man
di,
deo
iled
YIn
8 dif
fere
nce
3.4
The
The
7 9 Rs.
10
eCHOUPALS
good rain year and a bad rain year in determining the proªtability of the choupal investment.
Even though total procurement in Year 2 was low (13,000 tons lower than Year 1), the savings from transaction costs were almost at the same level as the ªrst year’s transaction cost savings (Rs. 12.9 million, in nominal terms). This was because the price of soybean shot up approximately Rs. 2,000 in the second year (or almost 20% higher), as mentioned earlier. Savings from better quality only amounted to Rs. 3 million, much less than in Year 1 (Table 2, footnote 10).
During Year 1, ITC bought 5,465 tons of wheat from 95 choupals in January to April 2002. This was a trial run for wheat and there were plans to procure many more thousand tons in Year 2. ITC’s long-term plan is to make choupals the node for buying all commodities grown in villages in Madhya Pradesh, as well as the distribution centers for agricultural inputs such as seed, fertilizers, pesticides, and such consumer items as oil and insurance. The savings documented in Table 2 do not include wheat procurement or the proªts on the sale of inputs and must be treated as partial. In fact, nearly Rs. 45 million of transactions had taken place in input and consumer goods sales over the course of the ªrst 16 months of operation. No substantial data on the savings or commissions to ITC from these input sales were available as of January 2003.
Before enumerating the costs of the eChoupals and working out a ªnancial analysis, it is important to understand the technological and business aspects of the village Internet centers. ITC’s village Internet centers are run by entrepreneurs selected by the company. ITC’s selection process focuses on ªnding a farmer with a medium-sized operation in a village (this varies from place to place, depending on the
average landholding size) who is well-respected and can be an agent of change. Studies have shown that local entrepreneurs are best able to identify and respond to the needs of customers, investigate the market, and promote services to a broad population (Wellenius, 2003).21 ITC’s entrepreneurial model rests on this premise but differs from the usual investment pattern in two distinct ways.
In most small entrepreneur business models, the individual invests in the capital equipment and provides paid services to the entire community to recover the investment. However, in ITC’s model, ªrst, the capital investment for the eChoupals is entirely borne by ITC and second, villagers are not charged for any services related to the computer.
ITC covers the capital cost of the computer and Internet connectivity. Even costs such as earthing and wiring of village locations where the computer is to be installed are not left to the entrepreneur. Local start-up costs such as labor and services required to establish the eChoupal as well as training costs for the center owner are also borne by ITC. The entrepreneur incurs only limited operating costs, such as electricity and telephone bills,22 and occasionally the cost of travel to ITC’s processing plant or ofªce for training or for collecting commission payments. An International Telecommunication Union report notes that at the local level the most signiªcant operating costs are salaries for employees and other building-related costs, such as rent, utilities, maintenance, and security (Townsend, 2002). But the sanchalaks did not need to employ someone to run the center because computer use was minimal and most transactions were conducted over the phone. Moreover, all choupals were in the houses of sanchalaks, eliminating rent payment.23 Nevertheless, the sanchalak is foregoing private use of part of his house as well as bearing security costs, such as building a ªrm door and installing a lock.
Mr. Sivakumar, CEO of ITC-IBD, explained the ra
21. Also see R. Kumar & A. Jhunjhunwala, Taking Internet to Villages: Case Study of a Project in the Madurai Region, submitted to the United Nations Centre for Regional Development (UNCRD), August 2002. Accessed 17 November 2003. http://edevelopment.media.mit.edu/SARI/papers/uncrd_report_7.8.021.pdf 22. In places with VSATs, ITC takes care of bandwidth costs but in places with dial-up connectivity, the entrepreneur has to pay for the phone line charges. Currently all price information is accessed through the phone and entrepreneurs pay for that cost from their own pocket. 23. Having the computer inside the house of the sanchalak creates several barriers to access for others in the village, most notably for farmers from lower castes. However, since the price information was being obtained through the phone and being relayed through word of mouth, it quickly becomes public information in the village. Moreover, there is not much general use of the computer, hence this provision has not yet become a large hindrance for pursuing the main objectives of the choupal. Nevertheless, the issue of access is a serious one and will be addressed in a forthcoming paper by the author.
Information Technologies and International Development 56
KUMAR
tionale behind this model. First, if an entrepreneur in the village invests his own capital, he expects returns in the short term and on a daily basis. If the stream of income is very small, the entrepreneur is averse to taking further risk. ITC would like the entrepreneurs to “think strategically as a group for long-term prospects such as increasing agricultural productivity and enhancing competitiveness instead of being concerned with short-term returns.” In other words, by relieving short-term ªnancial pressures on the sanchalaks, ITC hopes to encourage their deeper involvement in the project of learning how to use ITC-IBD’s capital infrastructure and alliances with other organizations to best serve the needs of villagers. Given that sanchalaks as a group are themselves leading farmers in their villages, they are close to ITC’s customers and have a good understanding of local market dynamics.24
Second, all use of the eChoupal is free for the community and there is no payment to ªnd out prices, weather, or information on best practices in agriculture. The revenue for ITC-IBD is through the transaction and quality savings outlined above, while the revenue for the entrepreneur (sanchalak) comes from a 0.5% commission that ITC-IBD gives him on every rupee of produce sold through his choupal. Charging villagers for accessing prices, best practices, e-mail, etc., would lead to a “transactionoriented, low-equilibrium approach to ICTs,” emphasizes Sivakumar. “The minute you charge, the number of people accessing [the information] will become restricted and eventually you cannot develop customized solutions for all,” he argues.
Stoll & Menou assert that a “business model” based on the provision of ICT and related services, on its own, is often not a sufªcient basis for achieving ªnancial sustainability. This is even more likely to be the case if the aim is “the development of a community whose members have initially limited requirements for telecommunications and a very low purchasing power, if at all” (2003). ITC-IBD’s aim is to provide information for free and thus encourage a change in transaction behavior. In other words, it hopes that farmers will learn about better quality
agricultural inputs and order them through the eChoupal, consequently producing a higher quality crop. This way, ITC would obtain further savings through the buying of better quality agricultural commodities as well as commission from the sale of certiªed agricultural inputs.
It is clear, then, that the revenue for the eChoupal project is not dependent on transactions stemming from the direct use of the computer but rather from a business proposition that has been enabled through the exchange of information. Savings from improved market efªciencies accrue to ITC and are used to defray the cost of capital investment. If the sanchalaks’s commission of 0.5% were to be the only source of revenue used in the model, then the sustainability of the entire operation would become questionable.
This section, including Tables 3, 4, and 5, outlines the overall investment made by ITC-IBD to set up the choupals. Each choupal consists of a multimedia computer, a printer, and an uninterrupted power supply with solar backup. Connectivity to some places is provided through VSATs (Very Small Aperture Terminals). Research suggests that for both power and Internet charges, costs for solar photovoltaic (PV) power and wireless connectivity will incur lower recurring operating costs as compared to grid power sources and wire line connectivity. Best and Maclay (2002) argue that the savings in operating costs will make up for the added capital costs when amortized over a period of years. ITC seems to have adopted this strategy in pursuing the installation of solar panels and VSATs for power and Internet connectivity. While current capital and operating cost estimates cannot demonstrate reduced overall costs, given that wire line connectivity and grid power are highly unreliable in the region, ITC’s proposition seems to make good business sense.25
The company estimates the average cost of the en
24. The sanchalak acts as a bridge between the farmer and the technology: he provides information to farmers, sends their queries and concerns to ITC, aggregates their requirements for the purchase of agricultural inputs and consumer products, and physically handles goods through the choupal, that is, stores and distributes these goods. Many sanchalaks go along with farmers to the processing plants to ensure a smooth experience for ªrst-timers. 25. Using wire line connectivity and grid power sources would reduce initial capital costs, but the downtime of these sources would be much greater in the long run. This would increase the downtime of the eChoupal (thus causing loss of potential revenue) and adding costs such as the use of a portable generator.
Volume 2, Number 1, Fall 2004 57
eCHOUPALS
Table 3. Hardware and Installation Cost of a Soyachoupal1
Computer with Multimedia 42,000
Dot Matrix Printer 7,000
UPS with Battery2 8,000
Solar Charger Panels2 9,600
Earthing3 4,500
Painting the Choupal Wall4 1,000
Insurance and Warranty 3,500
Plaque, Mousepad, Wiring, Miscellaneous 2,000
Keyboard 1,500
Total 79,100
Basic Cost of Choupal 79,100
VSAT 90,000
UPS with Battery 8,000
Solar Charger Panel 9,600
Total 186,700
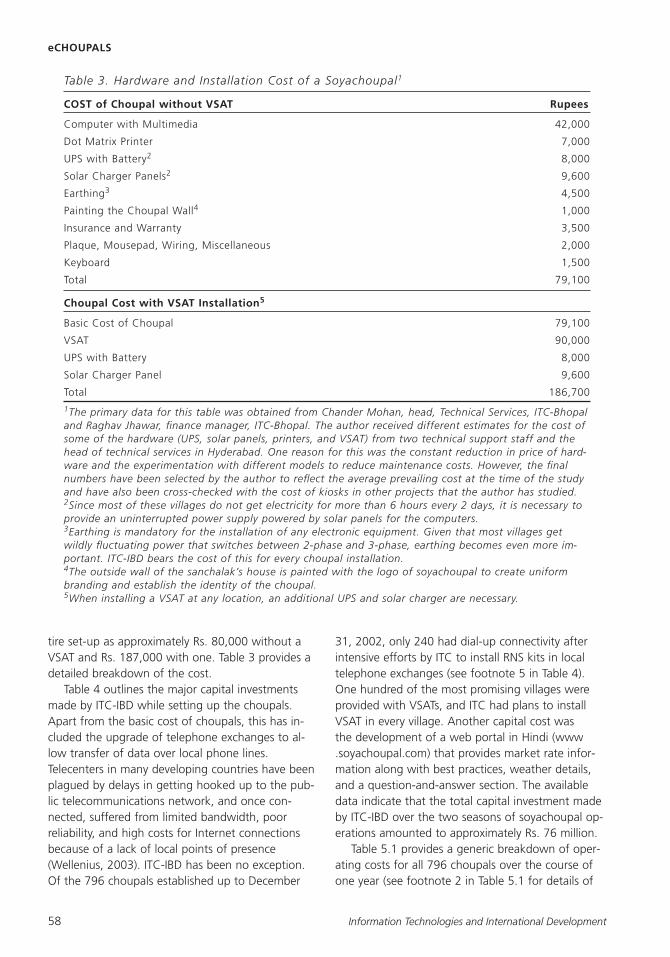
1The primary data for this table was obtained from Chander Mohan, head, Technical Services, ITC-Bhopal and Raghav Jhawar, ªnance manager, ITC-Bhopal. The author received different estimates for the cost of some of the hardware (UPS, solar panels, printers, and VSAT) from two technical support staff and the head of technical services in Hyderabad. One reason for this was the constant reduction in price of hardware and the experimentation with different models to reduce maintenance costs. However, the ªnal numbers have been selected by the author to reºect the average prevailing cost at the time of the study and have also been cross-checked with the cost of kiosks in other projects that the author has studied. 2Since most of these villages do not get electricity for more than 6 hours every 2 days, it is necessary to provide an uninterrupted power supply powered by solar panels for the computers. 3Earthing is mandatory for the installation of any electronic equipment. Given that most villages get wildly ºuctuating power that switches between 2-phase and 3-phase, earthing becomes even more important. ITC-IBD bears the cost of this for every choupal installation. 4The outside wall of the sanchalak’s house is painted with the logo of soyachoupal to create uniform branding and establish the identity of the choupal. 5When installing a VSAT at any location, an additional UPS and solar charger are necessary.
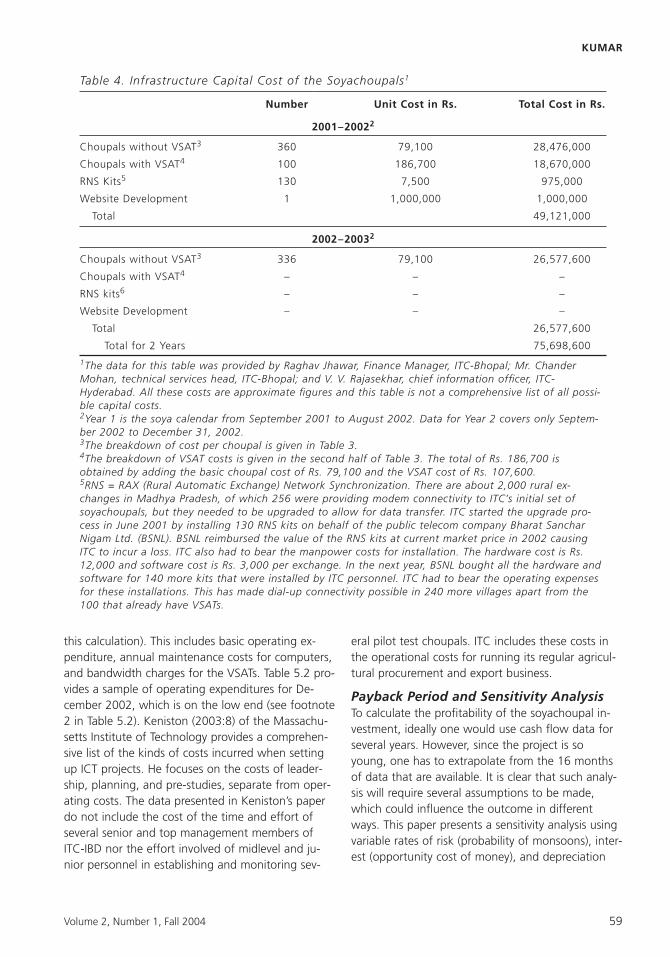
tire set-up as approximately Rs. 80,000 without a 31, 2002, only 240 had dial-up connectivity after VSAT and Rs. 187,000 with one. Table 3 provides a intensive efforts by ITC to install RNS kits in local detailed breakdown of the cost. telephone exchanges (see footnote 5 in Table 4).
Table 4 outlines the major capital investments One hundred of the most promising villages were made by ITC-IBD while setting up the choupals. provided with VSATs, and ITC had plans to install Apart from the basic cost of choupals, this has in- VSAT in every village. Another capital cost was cluded the upgrade of telephone exchanges to al- the development of a web portal in Hindi (www low transfer of data over local phone lines. .soyachoupal.com) that provides market rate infor-Telecenters in many developing countries have been mation along with best practices, weather details, plagued by delays in getting hooked up to the pub- and a question-and-answer section. The available lic telecommunications network, and once con- data indicate that the total capital investment made nected, suffered from limited bandwidth, poor by ITC-IBD over the two seasons of soyachoupal opreliability, and high costs for Internet connections erations amounted to approximately Rs. 76 million. because of a lack of local points of presence Table 5.1 provides a generic breakdown of oper(Wellenius, 2003). ITC-IBD has been no exception. ating costs for all 796 choupals over the course of Of the 796 choupals established up to December one year (see footnote 2 in Table 5.1 for details of
Information Technologies and International Development 58
KUMAR
Table 4. Infrastructure Capital Cost of the Soyachoupals1
Choupals without VSAT 360 79,100 28,476,000
Choupals with VSAT 100 186,700 18,670,000
RNS Kits 130 7,500 975,000
Website Development 1 1,000,000 1,000,000
Total 49,121,000
Choupals without VSAT 336 79,100 26,577,600
Choupals with VSAT – – –
RNS kits – – –
Website Development – – –
Total 26,577,600
Total for 2 Years 75,698,600
1The data for this table was provided by Raghav Jhawar, Finance Manager, ITC-Bhopal; Mr. Chander Mohan, technical services head, ITC-Bhopal; and V. V. Rajasekhar, chief information ofªcer, ITC-Hyderabad. All these costs are approximate ªgures and this table is not a comprehensive list of all possible capital costs. 2Year 1 is the soya calendar from September 2001 to August 2002. Data for Year 2 covers only September 2002 to December 31, 2002. 3The breakdown of cost per choupal is given in Table 3. 4The breakdown of VSAT costs is given in the second half of Table 3. The total of Rs. 186,700 is obtained by adding the basic choupal cost of Rs. 79,100 and the VSAT cost of Rs. 107,600. 5RNS = RAX (Rural Automatic Exchange) Network Synchronization. There are about 2,000 rural exchanges in Madhya Pradesh, of which 256 were providing modem connectivity to ITC’s initial set of soyachoupals, but they needed to be upgraded to allow for data transfer. ITC started the upgrade process in June 2001 by installing 130 RNS kits on behalf of the public telecom company Bharat Sanchar Nigam Ltd. (BSNL). BSNL reimbursed the value of the RNS kits at current market price in 2002 causing ITC to incur a loss. ITC also had to bear the manpower costs for installation. The hardware cost is Rs. 12,000 and software cost is Rs. 3,000 per exchange. In the next year, BSNL bought all the hardware and software for 140 more kits that were installed by ITC personnel. ITC had to bear the operating expenses for these installations. This has made dial-up connectivity possible in 240 more villages apart from the 100 that already have VSATs.
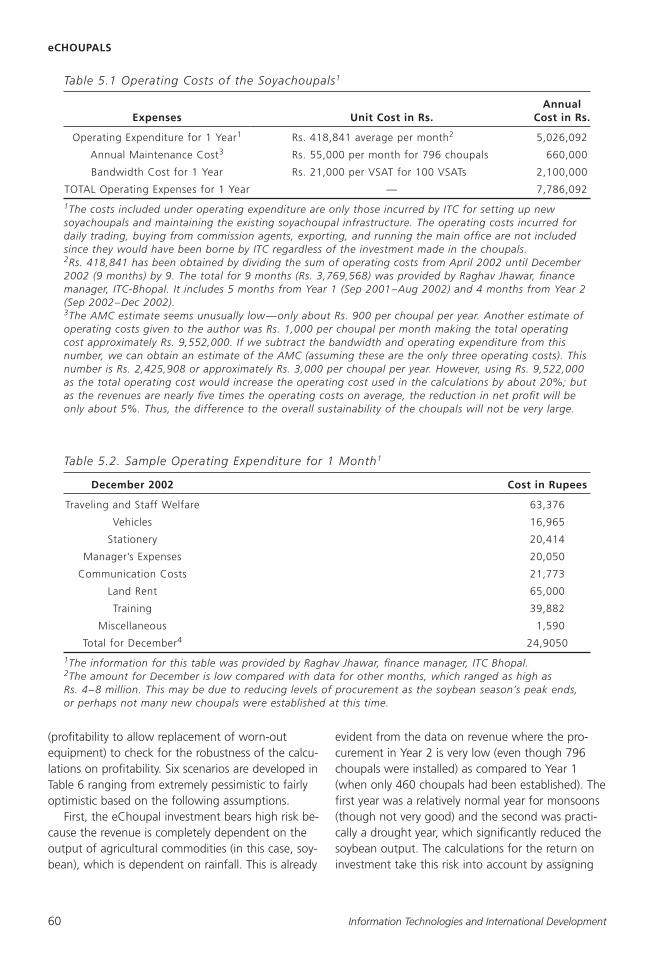
this calculation). This includes basic operating ex- eral pilot test choupals. ITC includes these costs in penditure, annual maintenance costs for computers, the operational costs for running its regular agriculand bandwidth charges for the VSATs. Table 5.2 pro- tural procurement and export business. vides a sample of operating expenditures for December 2002, which is on the low end (see footnote
To calculate the proªtability of the soyachoupal in2 in Table 5.2). Keniston (2003:8) of the Massachu
vestment, ideally one would use cash ºow data for setts Institute of Technology provides a comprehen
several years. However, since the project is so sive list of the kinds of costs incurred when setting
young, one has to extrapolate from the 16 months up ICT projects. He focuses on the costs of leader-
of data that are available. It is clear that such analyship, planning, and pre-studies, separate from oper
sis will require several assumptions to be made, ating costs. The data presented in Keniston’s paper
which could inºuence the outcome in different do not include the cost of the time and effort of
ways. This paper presents a sensitivity analysis using several senior and top management members of
variable rates of risk (probability of monsoons), inter-ITC-IBD nor the effort involved of midlevel and ju
est (opportunity cost of money), and depreciation nior personnel in establishing and monitoring sev-
Volume 2, Number 1, Fall 2004 59
eCHOUPALS
Table 5.1 Operating Costs of the Soyachoupals1
Operating Expenditure for 1 Year Rs. 418,841 average per month2 5,026,092
Annual Maintenance Cost Rs. 55,000 per month for 796 choupals 660,000
Bandwidth Cost for 1 Year Rs. 21,000 per VSAT for 100 VSATs 2,100,000
TOTAL Operating Expenses for 1 Year — 7,786,092
1The costs included under operating expenditure are only those incurred by ITC for setting up new soyachoupals and maintaining the existing soyachoupal infrastructure. The operating costs incurred for daily trading, buying from commission agents, exporting, and running the main ofªce are not included since they would have been borne by ITC regardless of the investment made in the choupals. 2Rs. 418,841 has been obtained by dividing the sum of operating costs from April 2002 until December 2002 (9 months) by 9. The total for 9 months (Rs. 3,769,568) was provided by Raghav Jhawar, ªnance manager, ITC-Bhopal. It includes 5 months from Year 1 (Sep 2001–Aug 2002) and 4 months from Year 2 (Sep 2002–Dec 2002). 3The AMC estimate seems unusually low—only about Rs. 900 per choupal per year. Another estimate of operating costs given to the author was Rs. 1,000 per choupal per month making the total operating cost approximately Rs. 9,552,000. If we subtract the bandwidth and operating expenditure from this number, we can obtain an estimate of the AMC (assuming these are the only three operating costs). This number is Rs. 2,425,908 or approximately Rs. 3,000 per choupal per year. However, using Rs. 9,522,000 as the total operating cost would increase the operating cost used in the calculations by about 20%; but as the revenues are nearly ªve times the operating costs on average, the reduction in net proªt will be only about 5%. Thus, the difference to the overall sustainability of the choupals will not be very large.
Traveling and Staff Welfare 63,376
Vehicles 16,965
Stationery 20,414
Manager’s Expenses 20,050
Communication Costs 21,773
Land Rent 65,000
Training 39,882
Miscellaneous 1,590
Total for December 24,9050
1The information for this table was provided by Raghav Jhawar, ªnance manager, ITC Bhopal. 2The amount for December is low compared with data for other months, which ranged as high as Rs. 4–8 million. This may be due to reducing levels of procurement as the soybean season’s peak ends, or perhaps not many new choupals were established at this time.
(proªtability to allow replacement of worn-out equipment) to check for the robustness of the calculations on proªtability. Six scenarios are developed in Table 6 ranging from extremely pessimistic to fairly optimistic based on the following assumptions.
First, the eChoupal investment bears high risk because the revenue is completely dependent on the output of agricultural commodities (in this case, soybean), which is dependent on rainfall. This is already
evident from the data on revenue where the procurement in Year 2 is very low (even though 796 choupals were installed) as compared to Year 1 (when only 460 choupals had been established). The ªrst year was a relatively normal year for monsoons (though not very good) and the second was practically a drought year, which signiªcantly reduced the soybean output. The calculations for the return on investment take this risk into account by assigning
Information Technologies and International Development 60
probabilities to rainfall failure. Two scenarios are analyzed: one with a 50% probability of rainfall failure over the course of the project and one with a 20% probability of failure. The 50% probability, which is an extremely pessimistic and highly conservative choice, has been used to see whether ITC’s investment turns out to have a reasonable payback period even under such adverse conditions. If yes, then the potential for proªtability is much greater.
Second, the opportunity cost of the money invested in the eChoupals must be accounted for in this analysis. Usually the opportunity cost of capital (OCC) is the amount (or percentage) of interest that will be foregone if the capital had been invested in a bank deposit or treasury bonds or even the stock market. Each of these OCC values depends on the interest rate given by the bank or the Treasury but it also includes a risk rate. In other words, while a ªxed deposit might give an interest rate of 6%, the stock market will usually give returns around 15% because of the inherent risks of the venture. Thus, the OCC is a cumulative interest rate that includes a savings rate as well as a risk rate. Since this project is quite risky (because of its dependence on the monsoon), we assume at least 10% (6% savings rate plus a 4% risk rate) as a realistic opportunity cost of capital. The value of any proªt obtained on this investment has to be discounted by the OCC rate to account for this foregone interest. However, to perform a sensitivity analysis to incorporate lower and higher risk than 10%, two other values of OCC—6% (very safe investment) and 20% (very risky investment)—have also been used in calculations.
Third, it is important to keep enough money aside from the revenue that comes in to replace computers and VSATs once they reach their life span. It is acknowledged that due to pressures within the technology industry to innovate, change products and speciªcations, and sell new technologies, ICT equipment changes rapidly. Generally, the needs and demands of users of ICT equipment change much more slowly (Cisler, 2002). Thus, it is unknown whether this equipment will have to be replaced over the course of 5 years or 10 years, and
KUMAR
depending on which depreciation period is chosen, the proªtability of the investment differs signiªcantly. While the percentage recommended by Indian government authorities for tax write-off purposes for computer equipment is 60% per annum from October 2002 onward,26 this paper conducts an analysis based on two variables of 15% (7-year depreciation) and 20% (5-year depreciation) as a conservative estimate, as we are trying to assess actual replacement needs over time.
Tables 6.1 through 6.6 provide a comprehensive ªnancial analysis of the data on revenue and costs. Table 6.1 calculates net income (proªt) and two rates of return on investment. Table 6.2 includes the probability of monsoon failure and provides two weighted rates of return on investment that are used to calculate future streams of proªt in Table 6.3. Table 6.4a and 6.4b calculate the present values of investment and proªt after each year (for a total of 7 years) using three rates of the opportunity cost of capital to enable comparison for the ªnal calculation of net present value of the investment and the payback period.
Table 6.5 provides the calculations of the net present value (NPV) of the investment from Year 4 to Year 7 to see how long it takes to recover the initial investment (net present value becomes positive) using the three OCC rates. At the point where the NPV is zero, the project has completely paid for itself. The amount of time taken for this is known as the payback period. As the OCC rate rises (from 6% to 10% to 20%), it takes longer for the project to achieve a positive NPV and the payback period increases. Similarly, using the 50% rainfall failure scenario, the payback period is much longer as compared with using the 20% failure rate.
The most realistic scenario is a payback period of 3.9 years with an OCC of 10% and probability of monsoon failure at 20%. However, even in the worst case scenario with an OCC rate of 20% and a 50% rainfall failure probability, the payback period is 5.8 years. The project does seem to be ªnancially sustainable, but the analysis so far has not included the cost of depreciation. The project will have to replace capital equipment (computers and other
26. Visit http://www.ªnancialexpress.com/fe/daily/19991020/fec20001.html which lists the depreciation rate for computers under the “Plants and Machinery” category at 25% (for tax write-off purposes). Visit http:// www.helplinelaw.com/news/1002/d_deprate1002.php for the amendment to the Income Tax Act, which states that computers as a separate category are entitled to depreciation at 60% per annum since October 2002.
Volume 2, Number 1, Fall 2004 61
eCHOUPALS
hardware) as it gets obsolete or breaks down over the course of the 7-year period. Can the proªts sustain this new investment at repeated intervals? Table 6.6 compares the cost of re-investment at the end of 5 years and 7 years with the NPV of the project. At the end of a given number of years, the value of the NPV is the amount available to be re-invested in replacing equipment at that time. It is clear that only in the most optimistic scenario using 6% OCC and 20% monsoon failure is there sufªcient money left over at the end of 7 years to pay for replacement costs entirely. In the realistic scenario of 10% OCC and 20% monsoon failure, about 83% of replacement costs can be covered at the end of 7 years but only 31.5% can be covered at the end of 5 years. While this means that the overall proªtability of the project is reduced, the discussion in the next section analyzes other sources of revenue that could help the project achieve long-term sustainability.
The calculations in Tables 6.1–6.6 give us a static ªnancial picture at the end of December 2002, whereby ITC-IBD, with no further investment and no changes in operations over time, would recover its costs within 3.9 to 5.8 years, depending on the assumptions used. However, the proªtability of the project in the calculations has only used revenue ªgures from soybean procurement. ITC-IBD had already initiated the procurement of wheat from the choupals in Year 1 and was gearing up for massive buying in the months from January to April 2002.27
The addition of revenue from wheat would change the calculations signiªcantly, given that wheat is a larger tonnage crop in Madhya Pradesh compared to soybean.28 Even more important, the choupals had become distribution centers for a variety of agricultural and consumer products like seeds, pesticides, fertilizers, soybean oil, and even insurance. The commission accruing to ITC-IBD from these sales is potentially signiªcant, but it is unknown and therefore has not been included in the calculations.
Clearly, since the eChoupals have only been in full operation for less than 2 years, and since potential revenue from wheat procurement and input sales could be substantial, the possibility for payback in 3.9 years using the soybean data alone gives conªdence that the choupals are well on their way to ªnancial sustainability.
Several cautionary notes are in order. ITC-IBD itself suggests that the savings from transaction costs and quality improvement will decrease over time and die out in a few years because of increased efªciencies in the market and greater competition from middlemen and other companies.29 Instead, ITC’s expectation of a long-term source of revenue is not primarily from procurement but from the sale of consumer goods and agricultural inputs. Since this evaluation of sustainability is based on a linear extrapolation for 7 years, if these transaction savings go down, sustainability will be negatively impacted. And since there is no data yet available for commission revenues from rural distribution of agricultural inputs and consumer goods, it cannot be said for certain how the project will shape up in the future.
Next, there are questions with the quality data used as part of the savings calculations in Table 2. In the ªrst year, apart from conducting laboratory sample tests, ITC ran a batch of eChoupal soybean and regular soybean through its processing plant in Indore. Data on the quantity of soybean tested, detailed percentage breakdown of quality improvement, margins of error, and the method used to obtain numerical values for savings are not available. The data for Year 2 are signiªcantly lower and are based only on laboratory sample testing. Using the ªrst year’s percentage of 1.78% savings, the savings from quality in Year 2 increased by 4 times compared with the actual value of Rs. 3 million. While there have been improvements in quality, they could fall within the range of 0.5% to 2.0% of the price of soybean bought. This is a very large range, and unfortunately, more precise data were not available.
Finally, and this is the most important, most of
27. January is the start of the wheat harvest and most farmers sell their produce within 4 months of the harvest. 28. See http://www.kisanwatch.org/eng/statistics/aug.02/stat_area_prd_soyabean.htm and http://www.kisanwatch.org/ eng/statistics/aug.02/stat_area_prd_Wheat.htm Accessed April 13, 2003. 29. Already ITC’s competitor companies like Ruchi Soya and Savariya Soya have set up their own computer centers in some villages and are on a massive advertising campaign to attract farmers with higher prices and value-added services like pick-up from home. Local traders in small towns have also responded by opening branches closer to villages and village traders have been forced to quote a higher price even to very small farmers lest the latter go to the choupal and sell the material to the sanchalak (who amalgamates these 1–2 bag sales and takes them together to ITC).
Information Technologies and International Development 62
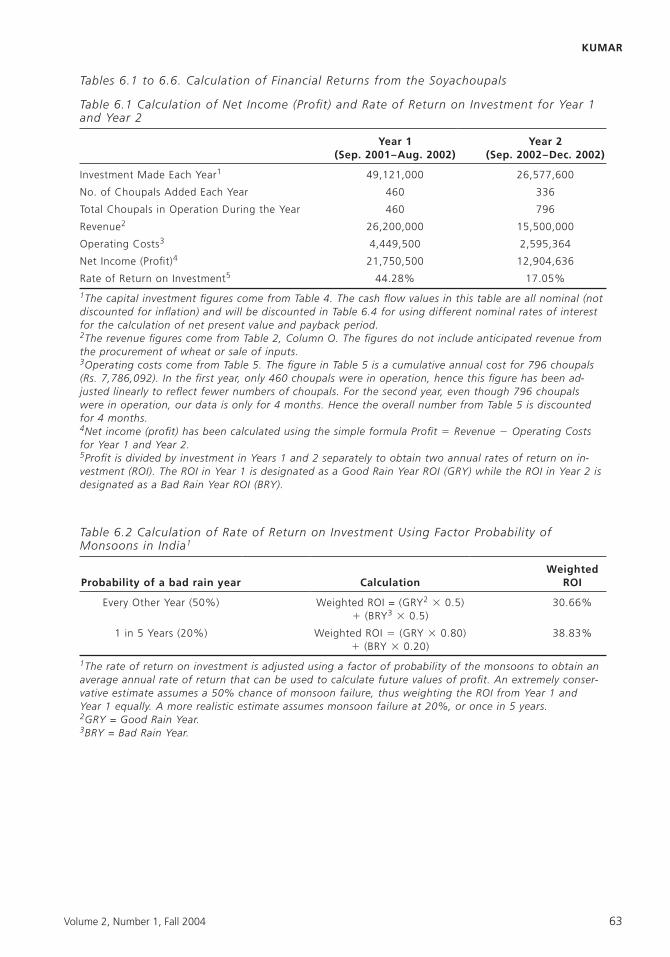
KUMAR
Tables 6.1 to 6.6. Calculation of Financial Returns from the Soyachoupals
Table 6.1 Calculation of Net Income (Proªt) and Rate of Return on Investment for Year 1 and Year 2
Investment Made Each Year 49,121,000 26,577,600
No. of Choupals Added Each Year 460 336
Total Choupals in Operation During the Year 460 796
Revenue 26,200,000 15,500,000
Operating Costs 4,449,500 2,595,364
Net Income (Proªt) 21,750,500 12,904,636
Rate of Return on Investment 44.28% 17.05%
1The capital investment ªgures come from Table 4. The cash ºow values in this table are all nominal (not discounted for inºation) and will be discounted in Table 6.4 for using different nominal rates of interest for the calculation of net present value and payback period. 2The revenue ªgures come from Table 2, Column O. The ªgures do not include anticipated revenue from the procurement of wheat or sale of inputs. 3Operating costs come from Table 5. The ªgure in Table 5 is a cumulative annual cost for 796 choupals (Rs. 7,786,092). In the ªrst year, only 460 choupals were in operation, hence this ªgure has been adjusted linearly to reºect fewer numbers of choupals. For the second year, even though 796 choupals were in operation, our data is only for 4 months. Hence the overall number from Table 5 is discounted for 4 months. 4Net income (proªt) has been calculated using the simple formula Proªt � Revenue � Operating Costs for Year 1 and Year 2. 5Proªt is divided by investment in Years 1 and 2 separately to obtain two annual rates of return on investment (ROI). The ROI in Year 1 is designated as a Good Rain Year ROI (GRY) while the ROI in Year 2 is designated as a Bad Rain Year ROI (BRY).
Table 6.2 Calculation of Rate of Return on Investment Using Factor Probability of Monsoons in India1
Every Other Year (50%) Weighted ROI = (GRY2 � 0.5) 30.66% � (BRY3 � 0.5)
1 in 5 Years (20%) Weighted ROI � (GRY � 0.80) 38.83% � (BRY � 0.20)
1The rate of return on investment is adjusted using a factor of probability of the monsoons to obtain anaverage annual rate of return that can be used to calculate future values of proªt. An extremely conservative estimate assumes a 50% chance of monsoon failure, thus weighting the ROI from Year 1 andYear 1 equally. A more realistic estimate assumes monsoon failure at 20%, or once in 5 years.2GRY = Good Rain Year.3BRY = Bad Rain Year.
Volume 2, Number 1, Fall 2004 63
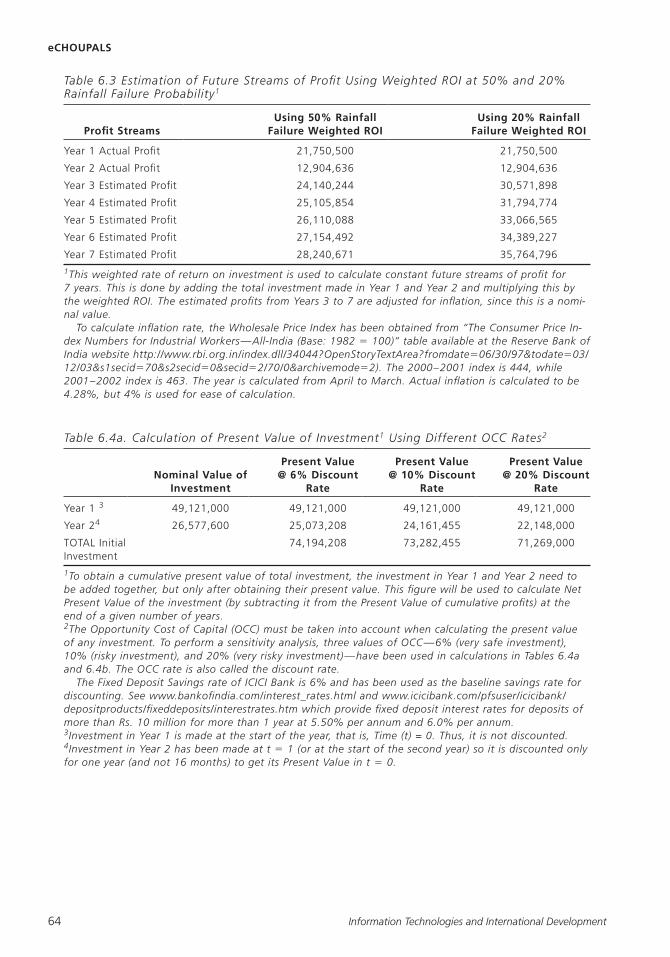
eCHOUPALS
64 Information Technologies and International Development
Year 1 Actual Proªt 21,750,500 21,750,500
Year 2 Actual Proªt 12,904,636 12,904,636
Year 3 Estimated Proªt 24,140,244 30,571,898
Year 4 Estimated Proªt 25,105,854 31,794,774
26,110,088 33,066,565
27,154,492 34,389,227
28,240,671 35,764,796
1This weighted rate of return on investment is used to calculate constant future streams of proªt for7 years. This is done by adding the total investment made in Year 1 and Year 2 and multiplying this bythe weighted ROI. The estimated proªts from Years 3 to 7 are adjusted for inºation, since this is a nomi-nal value.
To calculate inºation rate, the Wholesale Price Index has been obtained from “The Consumer Price In-dex Numbers for Industrial Workers—All-India (Base: 1982 � 100)” table available at the Reserve Bank ofIndia website http://www.rbi.org.in/index.dll/34044?OpenStoryTextArea?fromdate 06/30/97&todate 03/12/03&s1secid 70&s2secid 0&secid 2/70/0&archivemode 2). The 2000–2001 index is 444, while2001–2002 index is 463. The year is calculated from April to March. Actual inºation is calculated to be4.28%, but 4% is used for ease of calculation.
Year 1 49,121,000 49,121,000 49,121,000 49,121,000
Year 2 26,577,600 25,073,208 24,161,455 22,148,000
TOTAL Initial 74,194,208 73,282,455 71,269,000Investment
1To obtain a cumulative present value of total investment, the investment in Year 1 and Year 2 need tobe added together, but only after obtaining their present value. This ªgure will be used to calculate NetPresent Value of the investment (by subtracting it from the Present Value of cumulative proªts) at theend of a given number of years.2The Opportunity Cost of Capital (OCC) must be taken into account when calculating the present valueof any investment. To perform a sensitivity analysis, three values of OCC—6% (very safe investment),10% (risky investment), and 20% (very risky investment)—have been used in calculations in Tables 6.4aand 6.4b. The OCC rate is also called the discount rate.
The Fixed Deposit Savings rate of ICICI Bank is 6% and has been used as the baseline savings rate fordiscounting. See www.bankoªndia.com/interest_rates.html and www.icicibank.com/pfsuser/icicibank/depositproducts/ªxeddeposits/interestrates.htm which provide ªxed deposit interest rates for deposits ofmore than Rs. 10 million for more than 1 year at 5.50% per annum and 6.0% per annum.3Investment in Year 1 is made at the start of the year, that is, Time (t) = 0. Thus, it is not discounted.4Investment in Year 2 has been made at t 1 (or at the start of the second year) so it is discounted onlyfor one year (and not 16 months) to get its Present Value in t 0.
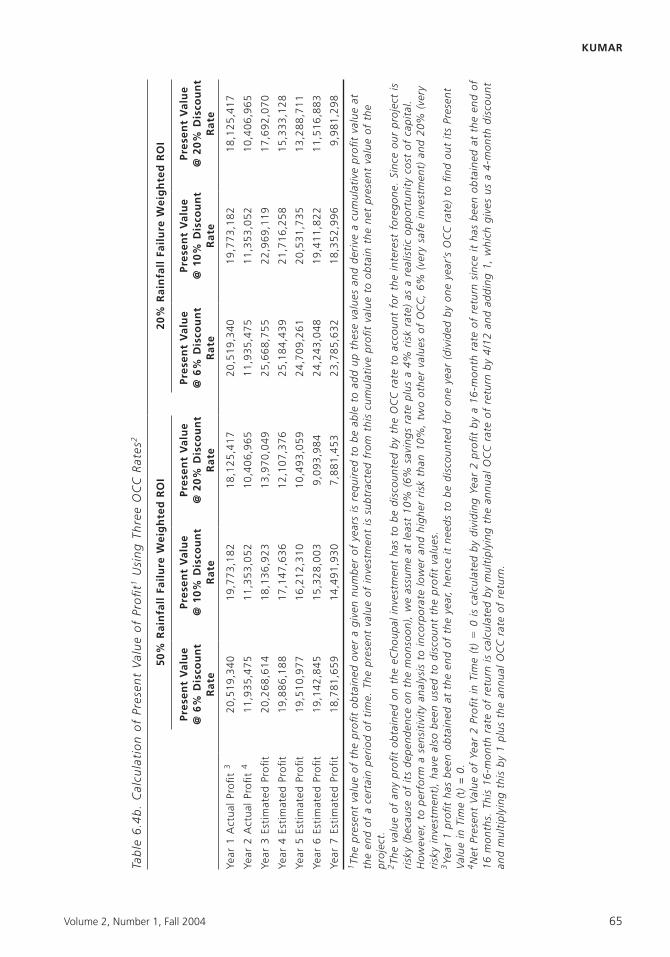
Volume 2, Number 1, Fall 2004 65
KU
oª
tPr
Act
ual
1ea
rY
20
,51
9,3
40
19
,77
3,1
82
18
,12
5,4
17
20
,51
9,3
40
19
,77
3,1
82
18
,12
5,4
17
oª
tPr
Act
ual
2ea
rY
10
,40
6,9
65
17
,69
2,0
70
15
,33
3,1
28
13
,28
8,7
11
11
,51
6,8
83
11
,35
3,0
52
22
,96
9,1
19
21
,71
6,2
58
20
,53
1,7
35
19
,41
1,8
22
11
,93
5,4
75
25
,66
8,7
55
25
,18
4,4
39
24
,70
9,2
61
24
,24
3,0
48
10
,40
6,9
65
13
,97
0,0
49
12
,10
7,3
76
10
,49
3,0
59
9,0
93
,98
4
11
,35
3,0
52
18
,13
6,9
23
17
,14
7,6
36
16
,21
2,3
10
15
,32
8,0
03
11
,93
5,4
75
20
,26
8,6
14
19
,88
6,1
88
19
,51
0,9
77
19
,14
2,8
45
oª
t
oª
t
oª
t
oª
t
Pr Pr Pr Pr
Esti
mat
ed
Esti
mat
ed
Esti
mat
ed
Esti
mat
ed
3 4 5 6
ear
ear
ear
ear
Y Y Y Y
9,9
81
,29
81
8,3
52
,99
62
3,7
85
,63
27
,88
1,4
53
14
,49
1,9
30
18
,78
1,6
59
is ry
atth
e
Pres
ent
valu
eo
f pro
ject
cap
ital
. (ve
20
%
its
pro
ªt
valu
e ou
ro
fan
d
ou
t
Sin
ceco
st
cum
ula
tive
pre
sen
t
inve
stm
ent)
ªn
d
fore
go
ne.
op
po
rtu
nit
y
to
net rate
)
a
safe
der
ive th
e
inte
rest OC
C
(ver s
and ob
tain
real
isti
cy
year
’
the a 6
%
valu
esto
as on
e
valu
e for
OC
C,
acco
un
tra
te)
by
thes
ep
roª
t of
risk
up
cum
ula
tive to 4
%va
lues
(div
ided
add
rate a
year
to plu
so
ther
OC
C
on
e
able
rate tw
o
this fo
r
the
be
by
to fro
m
savi
ng
s1
0%
,
req
uir
edsu
btr
acte
d
dis
cou
nte
d
than
(6% dis
cou
nte
d
risk
10
% be
isis
hig
her to
year
s be
nee
ds
inve
stm
ent to leas
t
of
has at an
dva
lues
.it
nu
mb
ero
f
inve
stm
ent
assu
me
low
er
hen
cep
roª
t,
giv
enva
lue we
the
year
a
inco
rpo
rate
ove
rp
rese
nt
eCh
ou
pal
mo
nso
on
),
the
of
(t)
to dis
cou
nt
end
ob
tain
ed
the to im
e
The
the
the T
in
tim
e. on
on an
alys
isu
sed
at
of
ob
tain
ed
bee
n
of
pro
ªt
dep
end
ence
sen
siti
vity
per
iod
also
ob
tain
ed Pro
ªt
pro
ªt
2ea
r
the
ah
ave
bee
n Y.
)=
0 of
valu
ece
rtai
n
its
any
of
per
form
has t( alu
eV
pre
sen
t a of
pro
ªt
ime
of
valu
e(b
ecau
seto
,in
vest
men
t),
T
end 1 in Pres
ent
The
pro
ject
.Th
e
ear
Y alu
e
1 the
2 risk
yH
ow
ever
risk
y
Net
3 V 4o
fen
dth
e dis
cou
nt
at4
-mo
nth
ob
tain
eda
us
bee
ng
ives
has
it wh
ich
sin
ce 1,
retu
rnad
din
go
fan
dra
te4
/12
16
-mo
nth by
retu
rna of
by
rate
pro
ªt
2 OC
Cea
rY
ann
ual
div
idin
gth
eb
ym
ult
iply
ing
calc
ula
ted
by
retu
rn.
of
is0
calc
ula
ted
rate
is OC
Cre
turn
ann
ual
of
the
rate
plu
s1
6-m
on
th 1b
yth
isTh
ism
on
ths.
mu
ltip
lyin
g1
6an
d
MAR
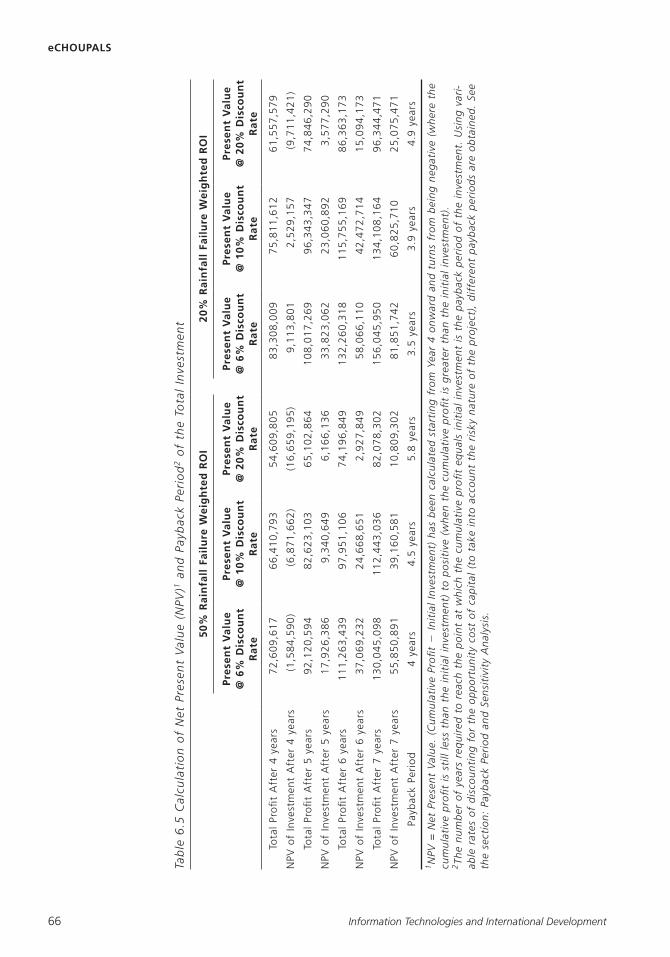
eCHOUPALS
Inve
stm
ent
ota
lT
the
of
2Pe
rio
dPa
ybac
kan
d1
(NPV
)al
ue
VPr
esen
tN
eto
fC
alcu
lati
on
6.5
Tab
le
66 Information Technologies and International Development
year
s4
Aft
ero
ªt
PrTo
tal
72
,60
9,6
17
66
,41
0,7
93
54
,60
9,8
05
83
,30
8,0
09
75
,81
1,6
12
61
,55
7,5
79
(9,7
11
,42
1)
74
,84
6,2
90
3,5
77
,29
0
86
,36
3,1
73
15
,09
4,1
73
96
,34
4,4
71
25
,07
5,4
71
year
s4
.9
2,5
29
,15
7
96
,34
3,3
47
23
,06
0,8
92
11
5,7
55
,16
9
42
,47
2,7
14
13
4,1
08
,16
4
60
,82
5,7
10
year
s3
.9
9,1
13
,80
1
10
8,0
17
,26
9
33
,82
3,0
62
13
2,2
60
,31
8
58
,06
6,1
10
15
6,0
45
,95
0
81
,85
1,7
42
year
s3
.5
(16
,65
9,1
95
)
65
,10
2,8
64
6,1
66
,13
6
74
,19
6,8
49
2,9
27
,84
9
82
,07
8,3
02
10
,80
9,3
02
year
s5
.8
(6,8
71
,66
2)
82
,62
3,1
03
9,3
40
,64
9
97
,95
1,1
06
24
,66
8,6
51
11
2,4
43
,03
6
39
,16
0,5
81
year
s4
.5
(1,5
84
,59
0)
92
,12
0,5
94
17
,92
6,3
86
11
1,2
63
,43
9
37
,06
9,2
32
13
0,0
45
,09
8
55
,85
0,8
91
year
s4
year
s
year
s
year
s
year
s
4
year
s
5
year
s
6
year
s
7
Aft
er 5
Aft
er 6
Aft
er 7
Aft
er
Peri
od
Inve
stm
ent
Aft
er
Inve
stm
ent
Aft
ero
ªt
Pr
Inve
stm
ent
Aft
er
oª
t
oª
t
Pr Pr
Inve
stm
ent
Payb
ack
of
ota
l
of
ota
l
of
NPV
T
NPV
T
NPV
Tota
l
of
NPV
Pro
ªt
(Cu
mu
lati
veal
ue.
VPr
esen
tN
et=
NPV
1th
e -ar
iSe
e
(wh
ere v
Usi
ng
ain
ed.
neg
ativ
e
inve
stm
ent. ob
tar
e
bei
ng
the per
iod
s
fro
m of
pay
bac
k
turn
sin
vest
men
t).
per
iod
and
init
ial
dif
fere
nt
on
war
dth
e pay
bac
kth
e
4 than
is pro
ject
),
ear
Yg
reat
erfr
om
is inve
stm
ent
the
of
nat
ure
star
tin
gp
roª
tin
itia
lcu
mu
lati
ve risk
y
calc
ula
ted
equ
als
the
the pro
ªt
acco
un
t
bee
nh
as (wh
encu
mu
lati
vein
to
Inve
stm
ent)
po
siti
ve take
the
(to
tow
hic
hca
pit
al
Init
ial
inve
stm
ent)
at of
po
int
cost
An
alys
is.
init
ial
the
the
reac
ho
pp
ort
un
ity
than to Se
nsi
tivi
tyth
e
less
req
uir
ed and
for
still
is year
sp
roª
to
fd
isco
un
tin
gPe
rio
d
cum
ula
tive
nu
mb
er of Pa
ybac
kra
tes
sect
ion
:
The
2 able
the
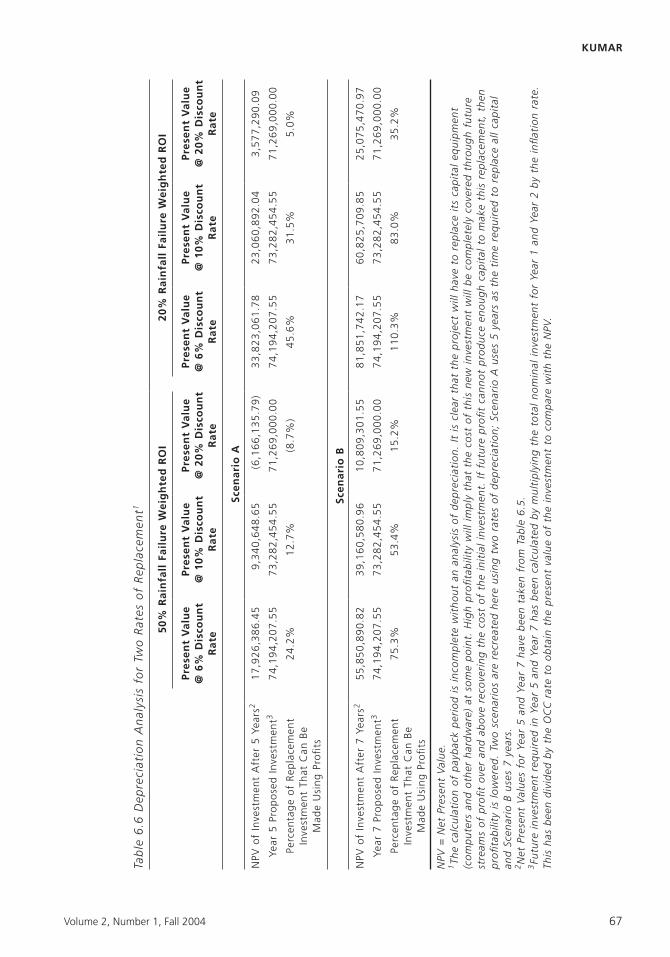
KUMAR
Volume 2, Number 1, Fall 2004 67
ears
Y5
Aft
erIn
vest
men
to
fN
PV1
7,9
26
,38
6.4
59
,34
0,6
48
.65
(6,1
66
,13
5.7
9)
33
,82
3,0
61
.78
23
,06
0,8
92
.04
3,5
77
,29
0.0
9
Inve
stm
ent
op
ose
dPr
5ea
rY
71
,26
9,0
00
.00
5.0
%
73
,28
2,4
54
.55
31
.5%
74
,19
4,2
07
.55
45
.6%
71
,26
9,0
00
.00
(8.7
%)
73
,28
2,4
54
.55
12
.7%
74
,19
4,2
07
.55
24
.2%
Rep
lace
men
tB
eC
an oª
tsPr
That
of
Usi
ng
cen
tag
ePe
r Inve
stm
ent
Mad
e
ears
Y7
Aft
erIn
vest
men
to
fN
PV5
5,8
50
,89
0.8
23
9,1
60
,58
0.9
61
0,8
09
,30
1.5
58
1,8
51
,74
2.1
76
0,8
25
,70
9.8
52
5,0
75
,47
0.9
7
Inve
stm
ent
op
ose
dPr
7ea
rY
71
,26
9,0
00
.00
35
.2%
73
,28
2,4
54
.55
83
.0%
74
,19
4,2
07
.55
11
0.3
%
71
,26
9,0
00
.00
15
.2%
73
,28
2,4
54
.55
53
.4%
74
,19
4,2
07
.55
75
.3%
Rep
lace
men
tB
eC
an oª
tsPr
That
of
Usi
ng
cen
tag
ePe
r Inve
stm
ent
Mad
e
then
.
ure ra
te
fut
cap
ital
pm
ent
equ
i
inº
atio
n
thro
ug
hre
pla
cem
ent,
all
rep
lace
cap
ital th
eb
y2
its
cove
red
this
to
ear
rep
lace
req
uir
ed
to com
ple
tely
mak
e
Y
to and
1ea
r
hav
eb
e cap
ital
tim
eth
e Y
will
will
eno
ug
has fo
r
inve
stm
ent
year
s
pro
ject .
the
pro
du
ce 5
inve
stm
ent
NPV
use
s
the
new
A
that
no
min
alw
ith
clea
rth
is can
no
to
f Scen
ario
is pro
ªt
tota
lco
mp
are
It cost
dep
reci
atio
n;
to
dep
reci
atio
n. th
e
the
futu
reth
at Ifo
f
mu
ltip
lyin
gb
y
of im
ply
will
inve
stm
ent.
6.5
. inve
stm
ent
rate
s
the
anal
ysis of
pro
ªta
bili
ty two
init
ial Ta
ble
fro
m
valu
e
an
the usi
ng
calc
ula
ted
wit
ho
ut
of
her
e
take
nb
een
pre
sen
t
Hig
hco
st has
the
inco
mp
lete 7
po
int.
the
recr
eate
d
bee
nh
ave
ear
Y ob
tain
som
ere
cove
rin
gar
e 7an
dto
scen
ario
s ear
5is Y rate
per
iod at
har
dw
are) an
d ear
abo
ve Y5 in O
CC
pay
bac
k
wo
ear
the
and T year
s.
alu
e. Y
ove
rlo
wer
ed. b
y
oth
er 7 for
V req
uir
ed
Pres
ent of
use
sB al
ues
div
ided
Net
calc
ula
tio
nan
dp
roª
t
Vis
inve
stm
ent
Pres
ent
and
Net
Futu
re has
The
1 (co
mp
ute
rs of
pro
ªta
bili
tySc
enar
io
bee
n
=N
PV
stre
ams
2 3 This
eCHOUPALS
the transactions and information exchanges for prices and setting up sales (transaction slips) were not being conducted via the computer and Internet. In fact, in places where the choupal was functioning, most data transmission (information exchange) took place through the telephone owned by the eChoupal operator himself. Thus, the savings calculated do not reºect the returns on investment from ICTs.30 In this project, ICTs are a catalyst for (or an instrument of) the process of improving transaction ºows by disintermediating and bringing efªciencies into the agricultural value chain. The resultant savings are not a direct result of the technology, which was not in general use at all. Rather, efªciencies improved because the process of information exchange resulting from introducing the technology led to the rationalization of production ºows. Thus, it is not the computers, email, and Internet that are generating these savings but the elimination of inefªciencies from the market. Technology is a catalyst for another process, which is social and economic, and to argue that all this has been because of computers would not be accurate.31
This paper has not attempted to outline or evaluate the impact of the soyachoupals on their primary users, namely the farmers in rural Madhya Pradesh. In the author’s interviews at the village level, it became apparent that caste afªliations, political alignments, and even the size of one’s farm were important issues that inºuenced access to the eChoupals and determined to what extent farmer incomes were changing. Moreover, eChoupals had only been established in larger and more prosperous villages so their reach into the poorer and remoter parts of rural India is still an open question. Concerns were
also raised regarding the possible market monopoly by ITC-IBD in the future, given that the alternative mandi system and local traders were losing market share and their business was being greatly threatened.32 While recognizing the limitations of this paper in leaving out these important social, economic, political, and cultural issues, the author concentrates on ªnancial sustainability because without it, the project would close down and there would be no question of studying impact on the people.
ITC-IBD is itself convinced of the sustainability and scalability of the eChoupal model. It recently adopted an ambitious 5-year plan to establish 20,000 choupals in the country. It seeks to modify and reªne the eChoupal model as it expands into other states and starts buying other crops. There are several challenges. First, ITC itself believes that the proªtability of the choupals will diminish over time because the information revolution of the eChoupals cannot be conªned to the choupals alone. Other companies have already picked up the process of rationalization and disintermediation, but ITC is prepared for continuous changes of its system of information delivery and potential competition is part of company planning. Second, despite a sensitivity analysis and obtaining a range of payback periods, the analysis of ªnancial sustainability in this paper is based on limited availability of data and contains a signiªcant amount of extrapolation to the future. This needs to be taken into consideration when one examines the results. Third, the project is running on the basis of enthusiastic, talented people who have taken it upon themselves to ensure its success. The cost of their time and energy, especially since the choupal responsibility is in addition to their regular work of export trading and procurement, is not included in these calculations. This omission becomes crucial as the company expands and more
30. ITC argues that transactions have been higher from eChoupals with satellite connectivity compared with eChoupals without satellite connectivity (or no connectivity at all), implying that the presence of a connected computer made a signiªcant difference in encouraging farmers to try out the new system. However, several factors are involved in determining activity levels of choupals, including the distance from processing plants, choice of operator (sanchalak) and his entrepreneurial ability, level of soybean harvest, etc., making it difªcult to isolate the impact of connectivity alone. 31. This brings up an interesting question: Is the telephone sufªcient to produce these kinds of market efªciencies? In other words, would investment in call centers be more “appropriate” on the part of ITC rather than expensive computers and VSATs? Most of the interviewees at ITC-IBD pointed out the unique ability of transmitting volumes of information to a number of places through computers and the Internet, especially when it came to providing information on best practices and setting up consultancy with remote agricultural scientists. Further research into the costs and beneªts of both these technologies (it has not been undertaken as part of this study) will be useful to explore the value-added by high-end ICTs and perhaps justify the popular deployment of computers as the technology of choice. 32. These are critical questions and the author hopes to address them in a forthcoming paper.
Information Technologies and International Development 68
KUMAR
people are recruited to handle larger numbers of eChoupals. ITC is aware of the challenge to maintain the initial level of enthusiasm and to train new people to align with their vision as they move toward 20,000 choupals. Internal training sessions and a knowledge management system, while in place, are yet to be fully implemented at the ªeld level to collectively pool the learning of many ªeld workers in the expansion process.
Despite all these challenges, what is impressive is that after 16 months of operation, the eChoupal project seems to be not only self-sustaining, but in fact, proªtable. A number of factors promise to keep it self-sustaining. Already, there are ongoing efforts to use the choupals to procure additional crops in the yearly crop cycle and for bulk sale of cheaper agricultural inputs. Both activities propose to beneªt farmers and to help ensure year-round transactions and commissions for ITC and the operators. Second, with additional training and by removing connectivity hurdles, the computers installed in the villages will be used to conduct these transactions, thus introducing new economies of scale. Moreover, ITC believes that computers will play a vital role in disseminating agricultural best practice information and connecting farmers to agricultural scientists for consultancy—an ambitious aim to encourage higher farm productivity and improve the overall competitiveness of Indian agriculture. Third, ITC has long-term plans to use this network for the sale of other products, such as motorbikes and insurance, which entails a commission to the company. And ªnally, given a computer network of 20,000 nodes, there are possibilities of using this infrastructure to disseminate noncommercial information to rural areas more effectively. All these are positive elements on the side of ITC that will strengthen the sustainability of the eChoupals.
The data presented here and the promise of the future have prompted India’s largest agri-exporter to make a huge investment in this previously untried and untested domain. With dedicated and enthusiastic personnel, with a desire to learn from mistakes, and with a clear vision, the eChoupals may become the largest successful ICT initiative in India. It is essential, however, that this research is placed within the context of the larger debate on ICTs and development. For that, further studies are required to understand the impact of the eChoupals on the lives of rural women, small and medium-sized farms, ag
ricultural laborers, lower castes, and the destitute, especially as the eChoupals expand to cover much of India. Only then will it be possible to understand to what extent ICTs can contribute to changing the life of the rural poor in the long run. ■
I am grateful for the openness and cooperation of S. Sivakumar and his team in Hyderabad—V. V. Rajasekhar, Rajnikant Rai, and K. T. Prasad—and I profusely thank them for taking valuable time to discuss the eChoupal model and for encouraging me in my research. I would also like to thank G. N. Murthy and his team in ITC-Bhopal—D. V. Ramkumar, Chander Mohan, and Prashant Mishra—for organizing my ªeld visits and for their willingness to make available local data. Their conversations with me were frank and forthcoming, both in their discussion of the learning process behind the implementation of such a large ICT initiative, as well as in their acknowledgement of the many challenges and problems that lie ahead in scaling up and making the centers work in the long run. I am indebted to Raghav Jhawar of ITC-Bhopal for spending several hours patiently explaining to me the ªnancial model of the eChoupals and for corresponding with me to clarify the numbers. Finally, without the welcoming reception by choupal operators and villagers, as well as the support of several ITC staff members, this study would not have happened.
The Kelly Douglas Fund and the Department of Science, Technology and Society at MIT provided partial funding for my research and I express my thanks to them. The meticulous and detailed comments of an anonymous reviewer for ITID contributed to strengthening the ªnancial analysis as well as the argument in this paper and I express my heartfelt gratitude. Finally, this paper would not have been written without the enthusiastic support, encouragement, and critical suggestions and guidance of Prof. Kenneth Keniston, to whom I remain grateful as ever.
Batchelor, S., & Norrish, P. (2002, April). Sustainable information and communication technology (ICT), Sustainable Initiatives, Working Paper in the Research Program on ICT Sustainability
Volume 2, Number 1, Fall 2004 69
eCHOUPALS
Factors. Accessed November 13, 2003. www .sustainableicts.org/Sustainable.htm.
Best, M. L., & Maclay, C. M. (2002.) Community Internet access in rural areas: Solving the economic sustainability puzzle. In G. Kirkman, J. Sachs, K. Schwab, & P. Cornelius (Eds.), The global information technology report 2001– 2002: Readiness for the networked world, GITR Press Reports. Accessed October 28, 2003. http:// www.cid.harvard.edu/cr/pdf/gitrr2002_ch08.pdf.
Brundtland, G. (Ed.). (1987). Our common future: The world commission on environment and development. Oxford: Oxford University Press.
Cisler, S. (2002). Schools Online: Planning for sustainability. Schools Online. Accessed November 16, 2003. http://www.schoolsonline.org/ resources/Sustainability-booklet.pdf.
Confederation of Indian Industry and McKinsey and Company. (1997, January) Food and agriculture integrated development action: Modernizing the Indian food chain. New Delhi: McKinsey and Company.
Delgadillo, K., Gomez, R., & Stoll, K. (2002, November). Community telecentres for development: Lessons from community telecentres in Latin America and the Caribbean. Ottawa: IDRC Canada. Accessed November 12, 2003. http:// web.idrc.ca/ev_en.php?ID?11917_201&ID2� DO_TOPIC.
Heeks, R., & Davies, A. (1999.) Different approaches to information age reform. In R. B. Heeks, (Ed.), Reinventing government in the information age. London: Routledge.
Heeks, Richard. (1999, June). Information and communication technologies, poverty and development, Development Informatics: Working Paper Series, Paper No. 5, Institute for Development Policy and Management, University of Manchester. Accessed 12 November 2003. http:// idpm.man.ac.uk/publications/wp/di/di_wp05.pdf.
Keniston, K. (2003, May). Notes on sustainability, Mimeo, Massachusetts Institute of Technology.
Kumar, R., & Jhunjhunwala, A. (2002, August). Taking Internet to villages: Case study of a proj
ect in the Madurai region. Submitted to the United Nations Centre for Regional Development (UNCRD). Accessed November 17, 2003.http:// edevelopment.media.mit.edu/SARI/papers/ uncrd_report_7.8.021.pdf.
Munyua, H. (2000, November). Information and communication technologies for rural development and food security: Lessons from ªeld experiences in developing countries. SD Dimensions, Sustainable Development Department, Food and Agricultural Organisation of the United Nations. Accessed November 12, 2003. http:// www.fao.org/sd/CDdirect/CDre0055b.htm.
Paisley, L., & Richardson, D. (Eds.), (1998). Why the first mile and not the last. In The first mile of connectivity, Food and Agricultural Organisation of the United Nations. Accessed November 13, 2003. http://www.fao.org/docrep/x0295e/ x0295e03.htm.
Proenza, F. J. (2001). Telecentre sustainability–Myths and opportunities, Journal of Development Communication, 12, 3. Available from http://www .fao.org/ag/ags/AGSP/pdf/ProenzaTelecenter.pdf.
Roman, R., & Colle, R. D. (2002, January) Themes and issues in telecentre sustainability, Development Informatics: Working Paper Series, Paper No. 10, Institute for Development Policy and Management, University of Manchester. Accessed November 10, 2003. http://idpm.man.ac.uk/ publications/wp/di/di_wp10.pdf.
Stoll, K. & Menou, M. (2003, June 30–July 2). Basic principles of community public internet access point’s sustainability. In M. Gurstein, M. Menou, S. Stafeev, (Eds.), Community networking and community informatics: Prospects, approaches and instruments, Preparatory process to the International Conference “Building the Information Commonwealth: Information Technologies and Prospects for the Development of Civil Society Institutions in the CIS Countries,” Saint Petersburg, Russia. Accessed November 12, 2003. http:// www.communities.org.ru/ci-text/ts3.doc.
Tinio, V. L. (2002–2003). ICT in education, e-primers for the information economy, society and polity, e-Asean Task Force and UNDP-APDIP. Accessed
Information Technologies and International Development 70
November 16, 2003. http://www .eprimers.org/ ict/page25.asp.
Townsend, D. N. (2002, December 7–8). Model universal service/access—Policies, regulations and procedures, Part III: Telecentre options and strategies, “Draft”, November 26, 2002, International Telecommunication Union and Commonwealth Telecommunications Organisation, Telecommunication Development Bureau, Document: 9, Global Symposium for Regulators, Hong Kong, SAR, China. Accessed November 17, 2003. http:/ /www.itu.int/ITU-D/treg/Events/Seminars/2002/ GSR/Documents/09-USModel_part3_doc.pdf.
Vijaybhaskar M., & Gayathri V. (2003, June 14). ICT and Indian development, EPW Commentary, Economic and Political Weekly, Accessed November
KUMAR
17, 2003. http://www.epw.org.in/showArticles .php?root�2003&leaf�06&ªlename�5922& ªletype�html.
Wellenius, B. (2003, January). Sustainable telecenters: A guide for government policy, Public Policy for the Private Sector: Note Number 251, Private Sector and Infrastructure Network, The World Bank Group. Accessed November 16, 2003. http://rru.worldbank.org/Viewpoint/ HTMLNotes/251/251Welle-121302.pdf.
Whyte, A. (2001). Assessing community telecentres: Guidelines for researchers. The Telecentre Evaluation Plan, The Acacia Initiative, International Development Research Centre, Canada. Accessed November 12, 2003. http://web.idrc.ca/ ev.php?ID�28310_201&ID2�DO_TOPIC.
Volume 2, Number 1, Fall 2004 71
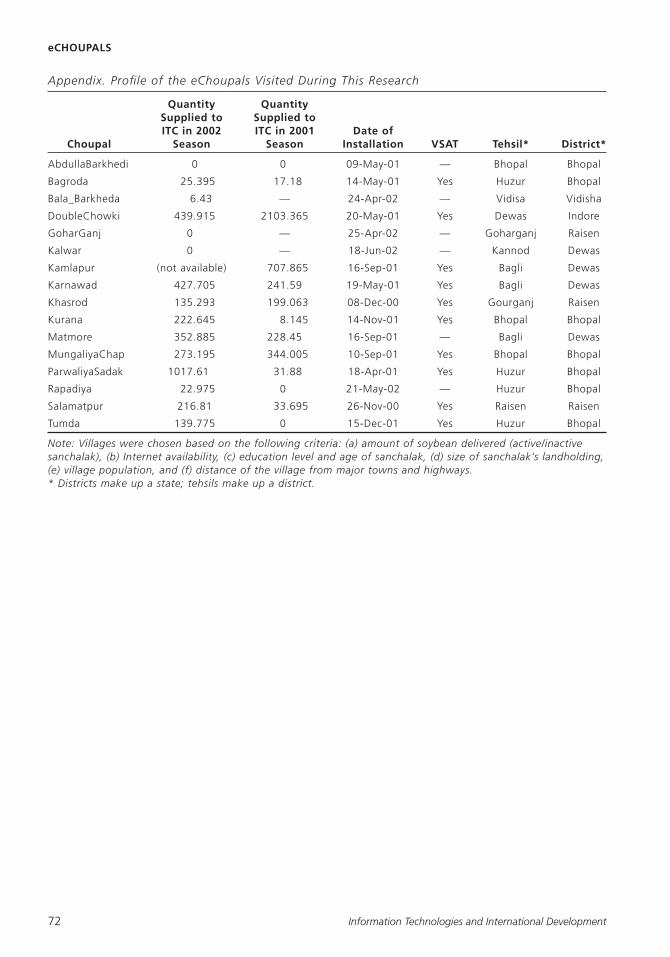
eCHOUPALS
Appendix. Proªle of the eChoupals Visited During This Research
AbdullaBarkhedi 0 0 09-May-01 — Bhopal Bhopal
Bagroda 25.395 17.18 14-May-01 Yes Huzur Bhopal
Bala_Barkheda 6.43 — 24-Apr-02 — Vidisa Vidisha
DoubleChowki 439.915 2103.365 20-May-01 Yes Dewas Indore
GoharGanj 0 — 25-Apr-02 — Goharganj Raisen
Kalwar 0 — 18-Jun-02 — Kannod Dewas
Kamlapur (not available) 707.865 16-Sep-01 Yes Bagli Dewas
Karnawad 427.705 241.59 19-May-01 Yes Bagli Dewas
Khasrod 135.293 199.063 08-Dec-00 Yes Gourganj Raisen
Kurana 222.645 8.145 14-Nov-01 Yes Bhopal Bhopal
Matmore 352.885 228.45 16-Sep-01 — Bagli Dewas
MungaliyaChap 273.195 344.005 10-Sep-01 Yes Bhopal Bhopal
ParwaliyaSadak 1017.61 31.88 18-Apr-01 Yes Huzur Bhopal
Rapadiya 22.975 0 21-May-02 — Huzur Bhopal
Salamatpur 216.81 33.695 26-Nov-00 Yes Raisen Raisen
Tumda 139.775 0 15-Dec-01 Yes Huzur Bhopal
Note: Villages were chosen based on the following criteria: (a) amount of soybean delivered (active/inactive sanchalak), (b) Internet availability, (c) education level and age of sanchalak, (d) size of sanchalak’s landholding, (e) village population, and (f) distance of the village from major towns and highways. * Districts make up a state; tehsils make up a district.
Information Technologies and International Development 72
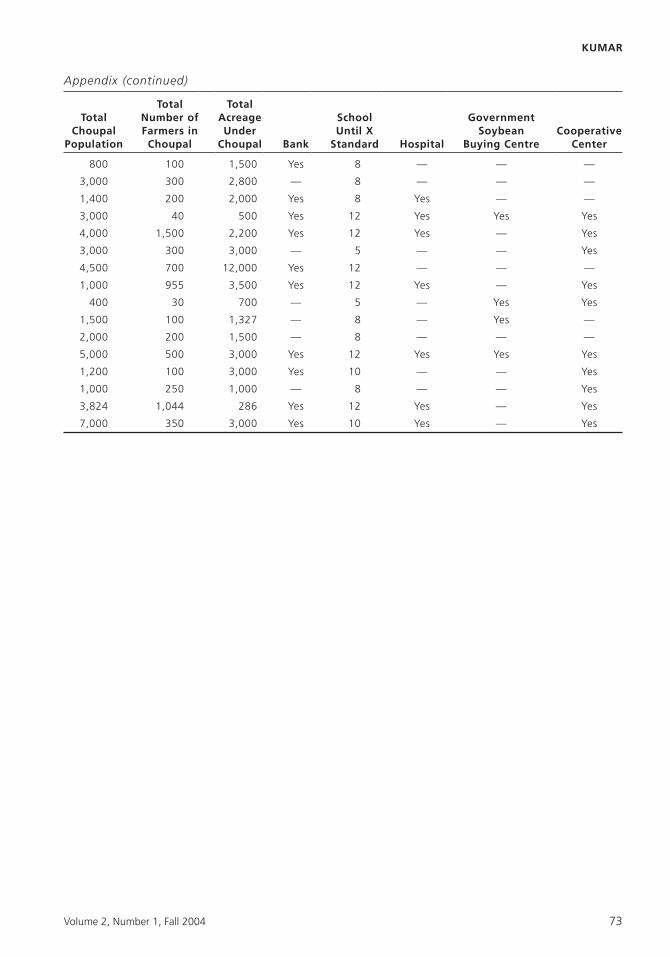
KUMAR
Appendix (continued)
800 100 1,500 Yes 8 — — —
3,000 300 2,800 — 8 — — —
1,400 200 2,000 Yes 8 Yes — —
3,000 40 500 Yes 12 Yes Yes Yes
4,000 1,500 2,200 Yes 12 Yes — Yes
3,000 300 3,000 — 5 — — Yes
4,500 700 12,000 Yes 12 — — —
1,000 955 3,500 Yes 12 Yes — Yes
400 30 700 — 5 — Yes Yes
1,500 100 1,327 — 8 — Yes —
2,000 200 1,500 — 8 — — —
5,000 500 3,000 Yes 12 Yes Yes Yes
1,200 100 3,000 Yes 10 — — Yes
1,000 250 1,000 — 8 — — Yes
3,824 1,044 286 Yes 12 Yes — Yes
7,000 350 3,000 Yes 10 Yes — Yes
Volume 2, Number 1, Fall 2004 73

MIT OpenCourseWarehttp://ocw.mit.edu
MAS.965 / 6.976 / EC.S06 NextLab I: Designing Mobile Technologies for theNext Billion UsersFall 2008
For information about citing these materials or our Terms of Use, visit: http://ocw.mit.edu/terms.