Embed Size (px)
Citation preview
Research ArticleEconomic Transition in the City of Paterson, New Jersey(America’s First Planned Industrial City): Causes, Impacts,and Urban Policy Implications
Thomas Y. Owusu
Department of Geography & Urban Studies, William Paterson University, Wayne, NJ 07470, USA
Correspondence should be addressed toThomas Y. Owusu; [email protected]
Received 7 May 2014; Revised 13 August 2014; Accepted 14 August 2014; Published 3 September 2014
Academic Editor: David Wong
Copyright © 2014 Thomas Y. Owusu. This is an open access article distributed under the Creative Commons Attribution License,which permits unrestricted use, distribution, and reproduction in any medium, provided the original work is properly cited.
This paper examines the dynamics of economic change in the City of Paterson, New Jersey, from the time of its founding in thelate eighteenth century to 1990, with emphasis on the post-1945 era. Analysis shows that from the time of its founding to thefirst half of the twentieth century, Paterson experienced a period of economic growth followed by economic decline in the 1960s,characterized by major changes in its principal industries of cotton, locomotives, and silk. Economic growth in Paterson up tothe early part of the twentieth century is attributable to several locational factors, including the availability of water resources,transportation, labor supply, and markets. Its decline in the post-1945 era is attributable to a combination of local, national,and global economic factors including periods of depression, labor discord, product substitution, decentralization of economicactivities, and deindustrialization. Economic decline resulted in a high rate of unemployment, poverty, and urban decay. The mostsignificant effort to reverse urban decline in the city is the urban enterprise zone (UEZ) program. The impacts of this program oneconomic growth in the city, however, remain inconclusive.
1. Introduction
Historically, American cities have been characterized byperiodic changes in their economic base. Changes in theeconomic base of cities have been especially pronouncedsince 1945. The nature, scope, and outcome of these changes,however, have not been the same for every city. While somecities have experienced growth, others have declined or stag-nated. These changes have caused differential urban growthand resulted in hierarchical changes in the US urban system.Economic change in American cities has resulted from theinterplay of a range of local, regional, national, and globalforces [1–7]. In the post-1945 period in particular, the forcesof globalization, economic internationalization, mobility ofcapital, technological change, and changing internationalmigration patterns have significantly shaped American cities[8].
One of themost dramatic economic changes inUSA sincethe 1960s has been the decline of manufacturing employment[9]. This process, called by Bluestone and Harrison [10] as
“deindustrialization,” has been defined as “the systematicdisinvestment in a nation’s core manufacturing industries.”Deindustrialization is generally attributed to a range of fac-tors including economic globalization, the growing challengeto American global economic dominance, the ability oflarge corporations to shift capital from one area to anotherwith growing ease, declining corporate profits, antiunionmanagement, the avoidance of taxation and welfare respon-sibilities, shifting power relations between capital and labor,andpolicies of the federal government [8, 9].Urban economicrestructuring itself, in response to these forces, has ledto locational repercussions involving metropolitan growth,decline, or stagnation, as well as intrametropolitan plantand employment shifts involving primarily decentralizationto suburban areas or nonmetropolitan locations. Economictransitions since the 1960s have altered the socioeconomicstructure of American cities [3, 11]. The effects of deindus-trialization on traditional industrial cities in USA includefactory closure, urban fiscal crisis, unemployment, poverty,economic despair, and social decay.
Hindawi Publishing CorporationUrban Studies ResearchVolume 2014, Article ID 672794, 9 pageshttp://dx.doi.org/10.1155/2014/672794
2 Urban Studies Research
Table 1: Types and characteristics of metropolises in USA.
Metropolis Key trends/characteristics
Classicdeindustrializingmetropolis
Loss of manufacturing employmentDisinvestment in manufacturingPopulation decreasesLittle immigration
Stable urban areasin transition
Decline in manufacturingPopulation growthMore diverse economyGains in services and othernonagricultural activities
Slow growth urbanareas
Manufacturing employment grewquite quicklyPopulation grew at a much slower rateHigh rate of growth in the servicessector
Growing servicecenters
Decline in manufacturingRapid population growthGrowth in services activities
New centers ofmanufacturing
Increase in populationIncrease in manufacturingemploymentIncrease in services sector activities
Source: Negrey and Zickel [12].
Economic change has led to the emergence of differenttypes of cities in terms of their socioeconomic and demo-graphic structure. Based on an analysis of changes in employ-ment and population in 140 of the largest metropolitan areasin theUnited States between 1970 and 1990,Negrey andZickel[12] identified five groups of metropolitan areas, namely,classic deindustrializing metropolises, stable urban areas intransition, slow-growth urban areas, growing service centers,and new manufacturing centers. The five categories of citiesand their key characteristics are presented in Table 1. It isworth noting that most of the classic deindustrializing areas,stable urban areas in transition, and slow growth areas arelocated in the Northeast of Midwest. In contrast, the growingservice centers and new centers of manufacturing are locatedprimarily in the Southern or Western parts of USA.
The preceding observations highlight many theoreticaland empirical questions about the dynamics of economicand demographic transition in US cities that warrant furtherexamination: what is the nature and scope of these economicchanges? What are the causes of these changes? What are thesocial, economic, and demographic outcomes and impactsof these changes? How do the underlying causes and thechanges they effect vary from city to city? What are theurban policy implications of these impacts? This paper seeksto address these questions, using the City of Paterson, NJ,as a case study. Paterson provides a good case for studyingeconomic and demographic transition in urbanAmerica, dueto several reasons. First, it has the distinction of being thefirst planned industrial city in USA and, therefore, providesa good case for exploring and understanding the factors thatshaped early industrial development in USA. Second, unlikeother early industrial cities, economic decline in Patersondid not lead to population decline in the city. Third, since
the 1960s, despite a period of economic decline, the city hasexperienced a continuous inflow of immigrants especiallyfrom Latin America, Asia, and Africa, leading to a change inthe ethnic and racial composition of its population. Fourth,the city was designated as an urban enterprise zone in1993 and has since been the recipient of several financialand economic incentives from the state aimed at promotingeconomic growth. Based on review of the literature andfactors specific to Paterson, I hypothesize that (a) local andregional economic forces were just as important as nationaland global forces in causing economic decline in Paterson,(b) locational advantages, including proximity to New YorkCity, and immigration contributed to Paterson’s populationstability, even during a period of economic decline, and(c) population stability primarily through continued flowof immigrants may have contributed to the persistence ofeconomic decline in the city.
This paper focuses on the dynamics of economic changein the city from the time of its founding in the late eighteenthcentury until 1990, with emphasis on the post-1945 era. Theanalysis here deliberately stops in 1990, because, by this time,the main economic and demographic trends had bottomedout. Although emphasis is placed on the post-1945 period,key developments from the turn of the turn of the century arediscussed to provide a historical context for understandingrecent changes. Data for this study were drawn from varioussources including US population censuses and from reportspublished by various city and state agencies and departmentsincluding The Greater Paterson Chamber of Commerce,Division of Economic Development, Division of CommunityDevelopment, and the New Jersey Department of Labor.
2. The Development and Growth of Paterson:A Historical Overview
The City of Paterson is located within the highly urbanizedNew York-New Jersey Metropolitan Area. It is the thirdlargest city in New Jersey, with a population of approximately150,000. Established in 1792, Paterson is recognized as the firstplanned industrial city in America. After the RevolutionaryWar of 1765, Alexander Hamilton (America’s first TreasurySecretary) and his associates concluded that while the warhad established the political independence of USA, there wasthe need to establish its independence from a commercial andmanufacturing viewpoint. With this in mind they set out tolay the foundation of a system of domestic manufacturers.After examining several locations on the eastern cost of thecountry, including locations in Rhode Island, Connecticut,Massachusetts, Maryland, and Pennsylvania, the site thatwill late become known as Paterson was selected because,as is discussed in the following section, it offered morelocational advantages than any of the other sites examined.In 1791, therefore, Hamilton and his associates formed theSociety for Useful Manufacturers (SUM). A charter from theState Legislature exempted the company from taxation bythe county and city and gave it the right to hold property,improve rivers, and build dams and canals. In July 4, 1792, thedirectors of SUM bought 700 acres of land above and below
Urban Studies Research 3
the Passaic Falls and proposed to build a mill and a dam todivert the Passaic River onto their property and return it tothe river below the falls. Two days later, a six-square milearea surrounding the falls was created as a town and calledPaterson, in honor of William Paterson, the then Governorof New Jersey and one of the framers of the US Constitution[13].
2.1. Paterson’s Locational Advantages. Paterson was selectedamong several other sites because it was seen as offeringmore locational advantages for manufacturing than any ofthe other places considered. These advantages are derivedfrom Paterson’s site characteristics (the physical features thatmake up the immediate environment of a place’s location) andsituation characteristics (a place’s relative location to otherplaces and activities in the surrounding region). Paterson’ssite offered unique physical advantages for manufacturingincluding the availability of waterpower source, abundantnatural resources, and a natural riverway. The Passaic GreatFalls afforded waterpower not equaled with any of the statesin the eastern portion of USA. In Paterson, the Passaic Riverplunges over the Great Falls which, at 77 feet high, is thesecond highest waterfall east of the Mississippi river, afterNiagara Falls. Also the Passaic River, although not navigable,was excellent for silk dying purposes because of the uniquequality of its water. In selecting this place, they also tookinto consideration the fact that artificial reservoirs of watermay be easily formed at the different lakes and ponds onthe headwaters of the streams tributary to the Passaic River,thereby keeping up the supply of water in dry seasons of theyear.The location of manufacturing plants in the early periodattests to the initial influence of the river.
Paterson’s situation was an equally important locationalconsideration. The lack of accessible waterways was ade-quately compensated by good land transportation facilities,including access to many interstate roads. Its proximity tomajor markets in the Northeast, particularly its positionbetween New York and Philadelphia, with their mercantileinterests, and proximity to raw materials also contributed toPaterson’s growth. Although it was near New York City (thelargestmarket inUSA), Patersonwas far enough to avoid highmetropolitan taxes and land prices. While lower taxes andland pricesmade Paterson a desirable place for industries, therelatively low cost of living attracted labor. The availabilityof labor in the city, in turn, attracted more manufacturingactivities. Massive immigration to Paterson provided labor ofall types, both skilled and unskilled. Most of the immigrantswho came were an overflow of immigrants who came to NewYork City [14].
2.2. Paterson’s Economic Base, Pre-1945. By 1900 Petersonwasnot only among the top five purely industrial cities in thenation, but also the fastest growing city on the East Coast[14]. From the time of its founding to the first half of thetwentieth century, Paterson experienced a period of eco-nomic growth, followed by a period of decline, characterizedby major changes in its principal industries, namely, cotton,locomotives, and silk. From 1792 to 1840, the manufacture
Table 2: Population growth in Paterson, 1810–1950.
Census year Population Change (%)1810 2023 —1820 3338 +65.01830 7710 +131.01840 7596 −1.51850 11,341 +49.01860 19,588 +22.71870 33,579 +71.41880 51,031 +52.01890 78,347 +53.51900 105,171 +34.21910 125,600 +19.41920 135,875 +8.21930 138,513 +1.91940 139,656 +0.81950 139,135 −0.4Source: Job and Bakal [16].
of cotton was the most important industrial activity inPaterson. However, it experienced a rapid decline during andimmediately after the Civil War. During the same period,however, the iron and locomotive industries developed andprospered to become Paterson’s leading industry. Indeed,by 1860, the value of locomotive products alone had farsurpassed that of cotton products.
What made Paterson the center of cotton manufacturingin New Jersey? An important factor was the abundanceof water power developed by the SUM. No city in NewJersey had such supply, and, in the years before the adoptionof stem power in textile manufacturing, water power wasa prime requisite for any industrial operation. The nextimportant industry established in the 1840s was that of silk[15]. The production of silk soon surpassed that of cotton,offering better wages and greater profit. Paterson dominatedthe silk industry in USA and became known as the SilkCity of the world. By the end of the first decade of the20th century, Paterson had 300 factories with over 18,000workers, doing business worth about $40 million a year. Theearly part of the twentieth century witnessed a heavy fluxof mercantile establishments, clothiers, apparel shops, andvarious businesses to Paterson.This was a period of economicgrowth and prosperity in Paterson, as evidenced by the factthat its per capita debt was less than any other large city inNew Jersey. As expected, economic growth was accompaniedby population growth. As Table 2 shows, pre-1900 growthrates were very high, averaging over 60% per each censusperiod, with the exception of a slight drop (−1.5%) from 1830to 1840. Population growth continued after 1900, but at adeclining rate Bakal and Job [16].
Industrial growth in Paterson in the second half ofthe nineteenth century was adversely affected by periodsof depression and nationwide monetary failure. The 1857depression, for instance, caused the closure of many factoriesin the city and led to the retrenchment of about 5,000workers.
4 Urban Studies Research
Further economic difficulties were experienced around theturn of the century, notably the great silk strike of 1913,which was caused in part by wage cuts. The other eventwhich contributed to the demise of the silk industry inPaterson was the introduction of artificial silk (or rayon) in1910. Paterson failed to keep pace with developments in thetextile field. As a result, Paterson lost its initial advantages toother regions, particularly Pennsylvania.The 1929 depressionmarked the final demise of the silk and locomotive industriesand led to a high rate of unemployment. World War IIbrought full employment temporarily back to the city, asCurtiss-Wright became the War’s largest airplane enginemanufacturer, employing as many as 17,000 workers. At theend of the war in 1945, however, Curtiss-Wright moved out ofPaterson, causing significant job losses [17].
3. Economic Transition after 1945
As in other parts of USA, the post-WorldWar II era witnessedthe establishment of a diversified economic base in NorthJersey. At the same time, various manufacturing establish-ments either relocated from the region’s core or were newlyestablished. In Passaic County,most of this development tookplace on vacant land in places such as Clifton and Wayne,leaving the older City of Paterson faced with decline inmanufacturing and in need of new economic base. Changesin Paterson’s economic base in the post-World War II era areshown in Table 3. Textiles and apparel remained the mostimportant industries in terms of their share of manufacturingemployment, accounting for over 60% of manufacturingemployment between 1950 and 1970. Paterson’s regional andnational dominance in these industries are reflected in thelocation quotient (source: [18]) presented in Table 3.
While still dominant in terms of its share of employment,textile mills manufacturing experienced an almost consistentdecline in employment between 1950 and 1970. The declinewas caused in part by a shift of this industry out of theNortheast region to other parts of the nation, particularlythe South and even to other parts of the world partly inresponse to lower labor costs. In addition, there was a productsubstitution in the Northeast area in which the demandfor the raw material textiles was replaced by a demand forthe end-product derived from it, namely, apparel. As anindustrial city, the loss of manufacturing jobs dealt a severeblow to the semiskilled and unskilled workforce.
3.1. Decentralization of Economic Activities and Shifts in Eco-nomic Base. After 1945, the suburbanization of manufactur-ing employment inmetropolitan areas in theUSA intensified.The dispersal of manufacturing employment occurred inresponse to a variety of push and pull factors pertainingto cities and suburbs, including space, taxes, congestion,pollution, cost of land, land-use controls, transportationneed, and access to new infrastructure [7]. Until the early1950s, manufacturing employment in core areas continuedto grow, albeit at rates significantly below those of suburbanareas. From the turn of the century, however, the share ofmetropolitan manufacturing employment held by central
Table 3: Employment inmanufacturing industries, City of Paterson,1950–1970.
Location quotient1950 1960 1970 1950 1960 1970
Textile 14,384 7,358 5,887 5.15 4.46 4.05Apparel 7,133 5,546 6,085 2.67 2.52 2.98Fabric metal 2,332 2384 2452 0.81 1.18 1.19Furniture 505 745 594 0.62 1.32 0.87Paper 810 878 702 0.75 0.82 0.67Printing 952 1243 1236 0.57 0.77 0.75Chemical 825 689 1203 0.58 0.47 0.77Rubber 16 443 1209 0.02 0.65 1.40Leather 603 664 707 0.69 1.02 1.48Stone/glass 269 161 171 0.49 0.15 0.18Food 1,301 1,386 1,694 0.33 0.43 0.64Primary metal 546 800 518 0.10 0.36 0.34Machinery 2313 2,173 2,401 0.78 0.82 0.82Electrical 1352 2384 2177 0.61 0.91 0.86Instruments 110 677 133 0.20 1.07 0.20Misc. small Gds 942 1,276 760 0.06 1.83 1.02Total 33,845 29554 28,442Source: Paterson Division of Planning and Zoning, 1975 [18].
cities in USA started to decline, and growth rates weresignificantly below those of suburban areas. Suburban growthin producer services, particularly finance, insurance, and realestate (FIRE), have also overshadowed that of central cities inmost metropolitan areas in the US since the mid-1970s [7].
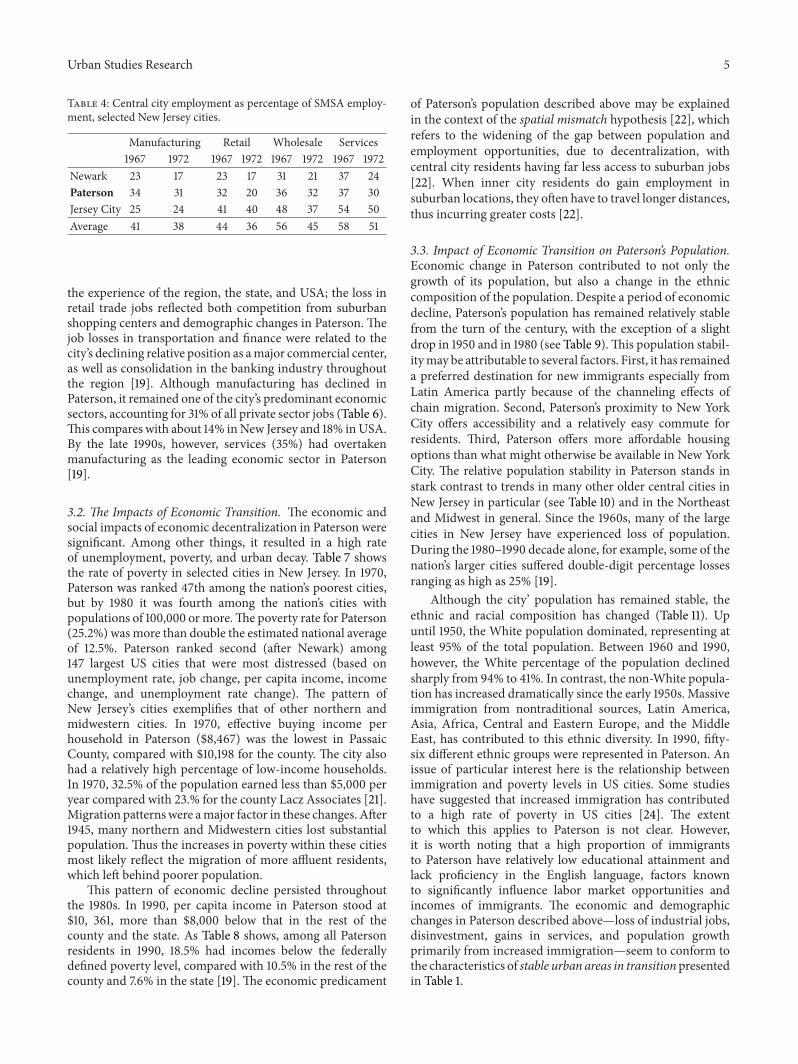
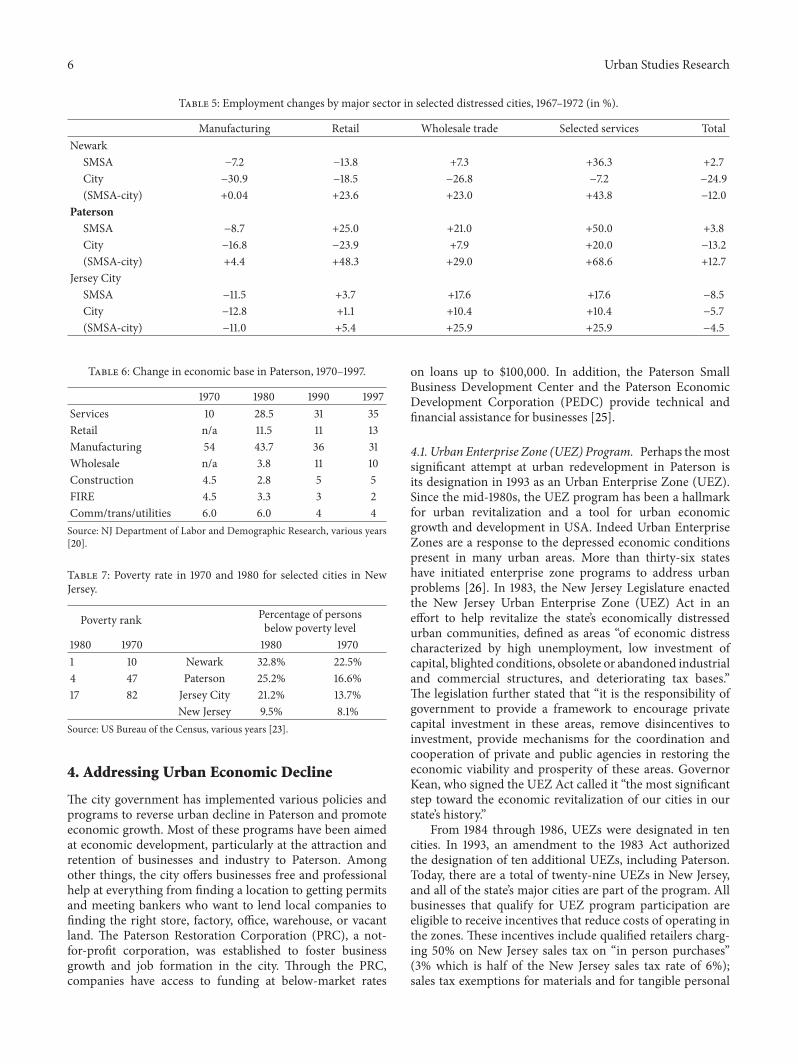
Economic trends in Paterson mirrored the national andregional trends described above. Beginning in the 1960s,manymanufacturing companies in Paterson left for suburbanlocations.The development of shoppingmalls in surroundingsuburbs also forced the closure or relocation of many down-town retail businesses. The decentralization of economicactivities in Paterson and other major cities in New Jerseyis presented in Tables 4 and 5. Central city employmentas a percentage of total employment in metropolitan areasdeclined between 1967 and 1972 in all sectors includingmanufacturing, retail, wholesale, and services. In Paterson,metropolitan area lost manufacturing employment (−8.7%)but gained employment in the retail (+25%), wholesale(+21%), and services (+50%) sectors. As Table 5 shows, thesegains in employment occurred in the suburbs rather thanin the cities, a further evidence of the decentralization ofeconomic activities, noted earlier. In Paterson, there was a netgain in employment (+3.8%) in all sectors combined, but anemployment loss (−13%) in the city and a gain (12%) in therest of the city.
In 1950, manufacturing employment in Paterson stood at33, 845, accounting for 75% of private sector jobs. Between1950 and 1975, the city lost 40% of its manufacturing jobsand more than half of the 1975 base between 1975 and1997. The transportation, finance, retail, and trade sectorsalso showed significant declines between 1975 and 1997. Thedecrease in manufacturing employment in the city reflected
Urban Studies Research 5
Table 4: Central city employment as percentage of SMSA employ-ment, selected New Jersey cities.
Manufacturing Retail Wholesale Services1967 1972 1967 1972 1967 1972 1967 1972
Newark 23 17 23 17 31 21 37 24Paterson 34 31 32 20 36 32 37 30Jersey City 25 24 41 40 48 37 54 50Average 41 38 44 36 56 45 58 51
the experience of the region, the state, and USA; the loss inretail trade jobs reflected both competition from suburbanshopping centers and demographic changes in Paterson. Thejob losses in transportation and finance were related to thecity’s declining relative position as amajor commercial center,as well as consolidation in the banking industry throughoutthe region [19]. Although manufacturing has declined inPaterson, it remained one of the city’s predominant economicsectors, accounting for 31% of all private sector jobs (Table 6).This compares with about 14% inNew Jersey and 18% inUSA.By the late 1990s, however, services (35%) had overtakenmanufacturing as the leading economic sector in Paterson[19].
3.2. The Impacts of Economic Transition. The economic andsocial impacts of economic decentralization in Paterson weresignificant. Among other things, it resulted in a high rateof unemployment, poverty, and urban decay. Table 7 showsthe rate of poverty in selected cities in New Jersey. In 1970,Paterson was ranked 47th among the nation’s poorest cities,but by 1980 it was fourth among the nation’s cities withpopulations of 100,000 ormore.The poverty rate for Paterson(25.2%) wasmore than double the estimated national averageof 12.5%. Paterson ranked second (after Newark) among147 largest US cities that were most distressed (based onunemployment rate, job change, per capita income, incomechange, and unemployment rate change). The pattern ofNew Jersey’s cities exemplifies that of other northern andmidwestern cities. In 1970, effective buying income perhousehold in Paterson ($8,467) was the lowest in PassaicCounty, compared with $10,198 for the county. The city alsohad a relatively high percentage of low-income households.In 1970, 32.5% of the population earned less than $5,000 peryear compared with 23.% for the county Lacz Associates [21].Migration patternswere amajor factor in these changes. After1945, many northern and Midwestern cities lost substantialpopulation. Thus the increases in poverty within these citiesmost likely reflect the migration of more affluent residents,which left behind poorer population.
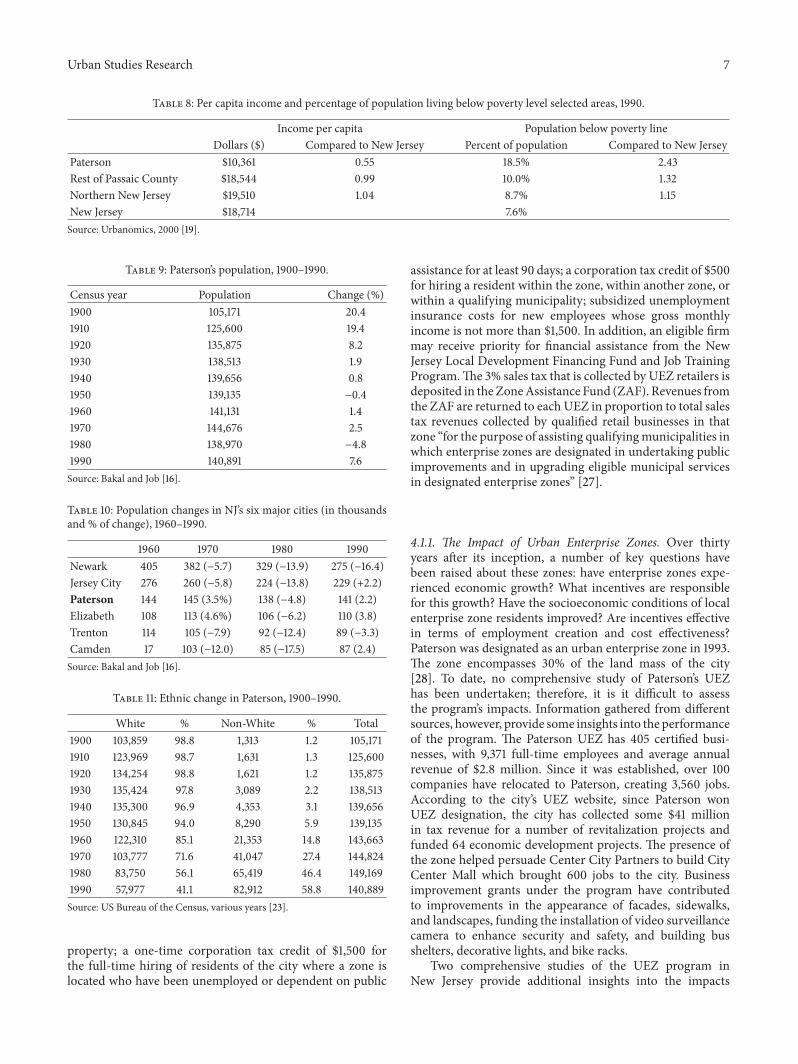
This pattern of economic decline persisted throughoutthe 1980s. In 1990, per capita income in Paterson stood at$10, 361, more than $8,000 below that in the rest of thecounty and the state. As Table 8 shows, among all Patersonresidents in 1990, 18.5% had incomes below the federallydefined poverty level, compared with 10.5% in the rest of thecounty and 7.6% in the state [19]. The economic predicament
of Paterson’s population described above may be explainedin the context of the spatial mismatch hypothesis [22], whichrefers to the widening of the gap between population andemployment opportunities, due to decentralization, withcentral city residents having far less access to suburban jobs[22]. When inner city residents do gain employment insuburban locations, they often have to travel longer distances,thus incurring greater costs [22].
3.3. Impact of Economic Transition on Paterson’s Population.Economic change in Paterson contributed to not only thegrowth of its population, but also a change in the ethniccomposition of the population. Despite a period of economicdecline, Paterson’s population has remained relatively stablefrom the turn of the century, with the exception of a slightdrop in 1950 and in 1980 (see Table 9).This population stabil-itymay be attributable to several factors. First, it has remaineda preferred destination for new immigrants especially fromLatin America partly because of the channeling effects ofchain migration. Second, Paterson’s proximity to New YorkCity offers accessibility and a relatively easy commute forresidents. Third, Paterson offers more affordable housingoptions than what might otherwise be available in New YorkCity. The relative population stability in Paterson stands instark contrast to trends in many other older central cities inNew Jersey in particular (see Table 10) and in the Northeastand Midwest in general. Since the 1960s, many of the largecities in New Jersey have experienced loss of population.During the 1980–1990 decade alone, for example, some of thenation’s larger cities suffered double-digit percentage lossesranging as high as 25% [19].
Although the city’ population has remained stable, theethnic and racial composition has changed (Table 11). Upuntil 1950, the White population dominated, representing atleast 95% of the total population. Between 1960 and 1990,however, the White percentage of the population declinedsharply from 94% to 41%. In contrast, the non-White popula-tion has increased dramatically since the early 1950s. Massiveimmigration from nontraditional sources, Latin America,Asia, Africa, Central and Eastern Europe, and the MiddleEast, has contributed to this ethnic diversity. In 1990, fifty-six different ethnic groups were represented in Paterson. Anissue of particular interest here is the relationship betweenimmigration and poverty levels in US cities. Some studieshave suggested that increased immigration has contributedto a high rate of poverty in US cities [24]. The extentto which this applies to Paterson is not clear. However,it is worth noting that a high proportion of immigrantsto Paterson have relatively low educational attainment andlack proficiency in the English language, factors knownto significantly influence labor market opportunities andincomes of immigrants. The economic and demographicchanges in Paterson described above—loss of industrial jobs,disinvestment, gains in services, and population growthprimarily from increased immigration—seem to conform tothe characteristics of stable urban areas in transitionpresentedin Table 1.
6 Urban Studies Research
Table 5: Employment changes by major sector in selected distressed cities, 1967–1972 (in %).
Manufacturing Retail Wholesale trade Selected services TotalNewark
SMSA −7.2 −13.8 +7.3 +36.3 +2.7City −30.9 −18.5 −26.8 −7.2 −24.9(SMSA-city) +0.04 +23.6 +23.0 +43.8 −12.0
PatersonSMSA −8.7 +25.0 +21.0 +50.0 +3.8City −16.8 −23.9 +7.9 +20.0 −13.2(SMSA-city) +4.4 +48.3 +29.0 +68.6 +12.7
Jersey CitySMSA −11.5 +3.7 +17.6 +17.6 −8.5City −12.8 +1.1 +10.4 +10.4 −5.7(SMSA-city) −11.0 +5.4 +25.9 +25.9 −4.5
Table 6: Change in economic base in Paterson, 1970–1997.
1970 1980 1990 1997Services 10 28.5 31 35Retail n/a 11.5 11 13Manufacturing 54 43.7 36 31Wholesale n/a 3.8 11 10Construction 4.5 2.8 5 5FIRE 4.5 3.3 3 2Comm/trans/utilities 6.0 6.0 4 4Source: NJ Department of Labor and Demographic Research, various years[20].
Table 7: Poverty rate in 1970 and 1980 for selected cities in NewJersey.
Poverty rank Percentage of personsbelow poverty level
1980 1970 1980 19701 10 Newark 32.8% 22.5%4 47 Paterson 25.2% 16.6%17 82 Jersey City 21.2% 13.7%
New Jersey 9.5% 8.1%Source: US Bureau of the Census, various years [23].
4. Addressing Urban Economic Decline
The city government has implemented various policies andprograms to reverse urban decline in Paterson and promoteeconomic growth. Most of these programs have been aimedat economic development, particularly at the attraction andretention of businesses and industry to Paterson. Amongother things, the city offers businesses free and professionalhelp at everything from finding a location to getting permitsand meeting bankers who want to lend local companies tofinding the right store, factory, office, warehouse, or vacantland. The Paterson Restoration Corporation (PRC), a not-for-profit corporation, was established to foster businessgrowth and job formation in the city. Through the PRC,companies have access to funding at below-market rates
on loans up to $100,000. In addition, the Paterson SmallBusiness Development Center and the Paterson EconomicDevelopment Corporation (PEDC) provide technical andfinancial assistance for businesses [25].
4.1. Urban Enterprise Zone (UEZ) Program. Perhaps themostsignificant attempt at urban redevelopment in Paterson isits designation in 1993 as an Urban Enterprise Zone (UEZ).Since the mid-1980s, the UEZ program has been a hallmarkfor urban revitalization and a tool for urban economicgrowth and development in USA. Indeed Urban EnterpriseZones are a response to the depressed economic conditionspresent in many urban areas. More than thirty-six stateshave initiated enterprise zone programs to address urbanproblems [26]. In 1983, the New Jersey Legislature enactedthe New Jersey Urban Enterprise Zone (UEZ) Act in aneffort to help revitalize the state’s economically distressedurban communities, defined as areas “of economic distresscharacterized by high unemployment, low investment ofcapital, blighted conditions, obsolete or abandoned industrialand commercial structures, and deteriorating tax bases.”The legislation further stated that “it is the responsibility ofgovernment to provide a framework to encourage privatecapital investment in these areas, remove disincentives toinvestment, provide mechanisms for the coordination andcooperation of private and public agencies in restoring theeconomic viability and prosperity of these areas. GovernorKean, who signed the UEZ Act called it “the most significantstep toward the economic revitalization of our cities in ourstate’s history.”
From 1984 through 1986, UEZs were designated in tencities. In 1993, an amendment to the 1983 Act authorizedthe designation of ten additional UEZs, including Paterson.Today, there are a total of twenty-nine UEZs in New Jersey,and all of the state’s major cities are part of the program. Allbusinesses that qualify for UEZ program participation areeligible to receive incentives that reduce costs of operating inthe zones. These incentives include qualified retailers charg-ing 50% on New Jersey sales tax on “in person purchases”(3% which is half of the New Jersey sales tax rate of 6%);sales tax exemptions for materials and for tangible personal
Urban Studies Research 7
Table 8: Per capita income and percentage of population living below poverty level selected areas, 1990.
Income per capita Population below poverty lineDollars ($) Compared to New Jersey Percent of population Compared to New Jersey
Paterson $10,361 0.55 18.5% 2.43Rest of Passaic County $18,544 0.99 10.0% 1.32Northern New Jersey $19,510 1.04 8.7% 1.15New Jersey $18,714 7.6%Source: Urbanomics, 2000 [19].
Table 9: Paterson’s population, 1900–1990.
Census year Population Change (%)1900 105,171 20.41910 125,600 19.41920 135,875 8.21930 138,513 1.91940 139,656 0.81950 139,135 −0.41960 141,131 1.41970 144,676 2.51980 138,970 −4.81990 140,891 7.6Source: Bakal and Job [16].
Table 10: Population changes in NJ’s six major cities (in thousandsand % of change), 1960–1990.
1960 1970 1980 1990Newark 405 382 (−5.7) 329 (−13.9) 275 (−16.4)Jersey City 276 260 (−5.8) 224 (−13.8) 229 (+2.2)Paterson 144 145 (3.5%) 138 (−4.8) 141 (2.2)Elizabeth 108 113 (4.6%) 106 (−6.2) 110 (3.8)Trenton 114 105 (−7.9) 92 (−12.4) 89 (−3.3)Camden 17 103 (−12.0) 85 (−17.5) 87 (2.4)Source: Bakal and Job [16].
Table 11: Ethnic change in Paterson, 1900–1990.
White % Non-White % Total1900 103,859 98.8 1,313 1.2 105,1711910 123,969 98.7 1,631 1.3 125,6001920 134,254 98.8 1,621 1.2 135,8751930 135,424 97.8 3,089 2.2 138,5131940 135,300 96.9 4,353 3.1 139,6561950 130,845 94.0 8,290 5.9 139,1351960 122,310 85.1 21,353 14.8 143,6631970 103,777 71.6 41,047 27.4 144,8241980 83,750 56.1 65,419 46.4 149,1691990 57,977 41.1 82,912 58.8 140,889Source: US Bureau of the Census, various years [23].
property; a one-time corporation tax credit of $1,500 forthe full-time hiring of residents of the city where a zone islocated who have been unemployed or dependent on public
assistance for at least 90 days; a corporation tax credit of $500for hiring a resident within the zone, within another zone, orwithin a qualifying municipality; subsidized unemploymentinsurance costs for new employees whose gross monthlyincome is not more than $1,500. In addition, an eligible firmmay receive priority for financial assistance from the NewJersey Local Development Financing Fund and Job TrainingProgram.The 3% sales tax that is collected by UEZ retailers isdeposited in the ZoneAssistance Fund (ZAF). Revenues fromthe ZAF are returned to each UEZ in proportion to total salestax revenues collected by qualified retail businesses in thatzone “for the purpose of assisting qualifyingmunicipalities inwhich enterprise zones are designated in undertaking publicimprovements and in upgrading eligible municipal servicesin designated enterprise zones” [27].
4.1.1. The Impact of Urban Enterprise Zones. Over thirtyyears after its inception, a number of key questions havebeen raised about these zones: have enterprise zones expe-rienced economic growth? What incentives are responsiblefor this growth? Have the socioeconomic conditions of localenterprise zone residents improved? Are incentives effectivein terms of employment creation and cost effectiveness?Paterson was designated as an urban enterprise zone in 1993.The zone encompasses 30% of the land mass of the city[28]. To date, no comprehensive study of Paterson’s UEZhas been undertaken; therefore, it is it difficult to assessthe program’s impacts. Information gathered from differentsources, however, provide some insights into the performanceof the program. The Paterson UEZ has 405 certified busi-nesses, with 9,371 full-time employees and average annualrevenue of $2.8 million. Since it was established, over 100companies have relocated to Paterson, creating 3,560 jobs.According to the city’s UEZ website, since Paterson wonUEZ designation, the city has collected some $41 millionin tax revenue for a number of revitalization projects andfunded 64 economic development projects. The presence ofthe zone helped persuade Center City Partners to build CityCenter Mall which brought 600 jobs to the city. Businessimprovement grants under the program have contributedto improvements in the appearance of facades, sidewalks,and landscapes, funding the installation of video surveillancecamera to enhance security and safety, and building busshelters, decorative lights, and bike racks.
Two comprehensive studies of the UEZ program inNew Jersey provide additional insights into the impacts
8 Urban Studies Research
of the program. In 1998, the Response Analysis Corpora-tion conducted an independent evaluation of the program.The evaluation, which covered 20 UEZs in the programprior to 1996, including Paterson, had a generally favorableimpression of the performance of the UEZs, including thefollowing. In addition to investing in New Jersey’s distressedurban communities, companies participating in the UEZprogram also created jobs and generated state and local taxrevenues. Part of the UEZ program’s job impact was achievedby encouraging firms that were relocating to consider andchoose locations in the state’s urban areas. From 1984 to 1997,UEZ companies in the 20 zones invested over $4 billion intheir zone businesses and created over 46,000 new jobs inthe 20 zones. A substantial proportion of the jobs created inthe UEZs came from start-up andmove-up companies. Start-up firms generated 26% of all new UEZs jobs among activebusinesses and move-ins were responsible for generating33% of all new UEZ jobs. Overall, UEZ incentives werecited as the only, primary, or secondary factor in expansion,relocation, or start-up decisions for businesses that created74% of all new jobs in 20 UEZs studied. The study foundthat the UEZ program helped to restore economic viabilityin distressed cities and helped to keep property rates down.The study found that from 1994 to 1996, 56% of the newemployees hired byUEZbusinesseswere residents of theUEZcommunities studied. On the average, the employment grewin the UEZ municipalities at a faster rate after the programimplementation compared to other cities that met the samedistrict criteria for program participation, but not selected.By using ZAF monies to make public improvements and toupgrade municipal services, UEZ municipalities saved over$144 million in local property taxes from 1987 to 1997 [27].
Findings from a more recent comprehensive study of theperformance of all UEZs in New Jersey including Paterson,from 2002 to 2008, however, have raised questions aboutthe effectiveness of the program and even recommended itstermination as it currently functions, and its replacementwith a new place-based community and economic develop-ment program. The report indicated that, since 1983, UEZshave attracted private investment estimated at $32 billionand generated 133,000 full-time jobs. In addition, since theprogram started, 30,000 businesses have benefited from it,and sales tax revenues generated by UEZ businesses have ledto 2,620 economic development projects [29].
Although theNew JerseyUEZprogramhas some tangiblesigns of success, the report criticized it on several grounds.The principal findings of the study are as follows: (a) only20% of eligible businesses participated in the program, and$238 million in zone assistance funds were unspent from2002 to 2008; (b) the zones generated 83 cents in “rippleeffect” economic activity for every $1 in forgone tax revenue,and another 8 cents in state and local revenue; (c) over$34 million which accrued to Zone Assistance Funds areleft unspent each year; (d) less than 5% of investment isspent for construction/renovation; (e) increase in overallemployment in all businesses in UEZs, but largely due tofactors other than UEZ investment; (f) net loss of over2,200 jobs in participating UEZ businesses; (g) relativedecrease in household income, widening gap between UEZ
and New Jersey household incomes; (h) increase in housingvacancy rate; relative decrease in home values, widening gapbetween UEZ and New Jersey home values; (i) there is nodocumentation of private investment by UEZ businesses, andthe program offers no certain quantifiable results relativeto the original legislative intent for local businesses andexpansion as well as job creation; (j) there is a strikinggap between UEZ businesses’ job losses and New Jersey’semployment gain as a whole; (k) persistent blight remainsin many areas throughout New Jersey. The report notedthat while other states have streamlined their program, theNew Jersey UEZ remained bureaucratically cumbersome andcostly to operate, with results that are inconsistent and hardto quantify. For example, it took 135 people statewide to run32 zones; across the border in Pennsylvania, 27 people run 23zones [30].
The primary issue is whether the program stimulates localeconomies enough to justify the lower tax rate. Critics suggestthat the benefits go to companies that would have movedinto urban areas anyway. A review of the program by theStar Ledger newspaper showed that spending has deviatedwidely from the initial UEZ plan, expanding the definition ofeconomic development beyond what was envisioned in 1983.The review showed that local officials often used UEZ dollarsas just another form of municipal aid, paying for everythingfrom firefighter salaries to buying jaws of life, things that mayhave benefited the cities but did not necessarily help the zonesthemselves. The sales tax benefit has spurred many, perhapsmost, of the zones to concentrate on retail business (80% inJersey City). While this generates the funds for the ZAF, itgenerates service jobs, frequently low wage, and low mobilityas opposed to high wage industrial or professional positions.The zones were designed to end and cities were supposed tograduate from the program after downtowns improved, but,in nearly 30 years, none of the cities has [31].
5. Conclusion
This paper has examined the dynamics of economic changein the City of Paterson, with emphasis on the post-1945 era.The analysis has shown that, from the time of its founding tothe first half of the twentieth century, Paterson experienceda period of economic growth followed by economic decline,characterized by major changes in its principal industries.Economic growth in Paterson up to the early part of thetwentieth century is attributable to several locational factors,including the availability of water resources, transportation,labor supply, and markets. Its decline in the post-1945 era isattributable to a combination of local, national, and globaleconomic factors including periods of depression, labordiscord, product substitution, decentralization of economicactivities, and deindustrialization. Economic decline resultedin a high rate of unemployment, poverty, and urban decay.However, unlike other urban areas, economic decline did notlead to population decline. Indeed the population of Patersonhas remained relatively stable. This stability is attributable tothe impact of immigration from Latin America. Paterson’s
Urban Studies Research 9
proximity to New York City provides accessibility for com-muters. In addition, it is an appealing location especially fornew immigrants because it offers more affordable housingoptions than New York City.
To address economic decline in the city, Paterson wasdesignated as an urban enterprise zone in 1993. Evaluation ofthe impact of this program from rather limited informationyields inconclusive results. On the one hand, the programhas provided much needed economic boost to the city. Thezone has been able to attract firms and jobs; it has morecompanies and jobs now than it did when it was designated.Like other UEZs, it also performed better than the economiccontext within which it was located.The enterprise zone mayalso have helped adjacent areas by employing their residentsor producing multiplier effects from the companies locatingor expanding within the zone. In addition, the program hascontributed to improvements in the appearance of facades,sidewalks, and landscapes and enhanced security and safety.A recent andmore comprehensive study, however, shows thatthe New Jersey UEZs including Paterson have not achievedtheir intended results in terms of economic growth, jobcreation, unemployment and poverty reduction, economicinvestment, and reduction in urban blight. The findings andrecommendations of this study may be used to revamp theUEZ program to make it more effective. Perhaps it is time forPaterson and other distressed cities in New Jersey to considerimplementing different urban and economic developmentprograms.
Conflict of Interests
The author declares that there is no conflict of interestsregarding the publication of this paper.
References
[1] L. Benton-Short, Ed., Cities of North America: ContemporaryChallenges in U.S. and Canadian Cities, Rowman and Littlefield,Lanham, Md, USA, 2014.
[2] M. Abrahamson, Global Cities, Oxford University Press, NewYork, NY, USA, 2004.
[3] T. Rieniets, “Shrinking cities: causes and effects of urbanpopulation losses in the twentieth century,”Nature and Culture,vol. 4, no. 3, pp. 231–254, 2009.
[4] D. Rigby, Urban and Regional Structuring in the Second Halfof the Twentieth Century, edited by J. Agnew, J. M. Smith,American Space/American Place, New York, NY, USA, 2002.
[5] P. L. Knox, “Globalization and urban change,”UrbanGeography,vol. 17, no. 1, pp. 115–117, 1996.
[6] B. Warf and R. Erickson, “Introduction: globalization and theU.S. city system,” Urban Geography, vol. 17, no. 1, pp. 1–4, 1996.
[7] E.Wyly, N. J. Glickman, andM. L. Lahr, “The top 10 list of thingsto know about American cities,” Cityscape: A Journal of PolicyDevelopment and Research, vol. 3, no. 3, 27 pages, 1998.
[8] D. Wilson and M. Anderson, “Urban economic restructuring,”inCities of North America: Contemporary Challenges in U.S. andCanadian Cities, L. Benton-Short, Ed., Roman and Littlefield,Lanham, Md, USA, 2014.
[9] D. Brady and R. Denniston, “Economic globalization, indus-trialization and deindustrialization in affluent democracies,”Social Forces, vol. 85, no. 1, pp. 297–329, 2006.
[10] B. Bluestone and B. Harrison, Deindustrialization in America,Basic Books, New York, NY, USA, 1982.
[11] W. J. Wilson, When Work Disappears: The World of the NewUrban Poor, Vintage, 1996.
[12] C. Negrey andM. B. Zickel, “Industrial shifts and uneven devel-opment: patterns of growth and decline in US metropolitanareas,” Urban Affairs Quarterly, vol. 30, no. 1, pp. 27–47, 1994.
[13] J. A. Carpenter,The Industrial Development of Paterson: 1792—1913, Columbia University, New York, NY, USA, 1947, TheIndustrial Development of Paterson,.
[14] C. Norwood, About Paterson: The Making and Unmaking of anAmerican City, Saturday Review Press, New York, NY, USA,1974.
[15] C. Shiner, Paterson, New Jersey: Its Advantages for Manufactur-ing and Residence, The Printing and Publishing, Paterson, NJ,USA, 1890.
[16] M. Bakal and K. Job, A Study of Paterson’s Population ResearchPaper, Wayne, New Jersey, NJ, USA, 1990.
[17] Senior Class of the StateNormal School of Paterson; New Jersey,Hudson Dispatch Printer, Union City, NJ, USA, 1932.
[18] Paterson Division of Planning and Zoning, Employment Trendsin Industry, Paterson and Environs, 1950–1972, Paterson Divi-sion of Planning and Zoning, Paterson, NJ, USA, 1975.
[19] Urbanomics, City of Paterson Urban Enterprise Zone StrategicEconomic Plan, Urbanomics, Paterson, NJ, USA, 2000.
[20] New Jersey Department of Labor and Demographic ResearchEconomic and Demographic Report Trenton: New Jersey,various years.
[21] Lacz Associates, Community Renewal Program, City of Pater-son: Economic Base Study, Paterson, NJ, USA, 1975.
[22] H. J. Holzer, “The spatial mismatch hypothesis: what has theevidence shown?”Urban Studies, vol. 28, no. 1, pp. 105–122, 1991.
[23] U.S. Bureau of the Census, “Census of Population and Hous-ing,” Washington, DC, USA, U.S. Government Printing Office,various years.
[24] S. Cammarato, Importing Poverty, Center of Migration Studies,Washington, DC, USA, 2000.
[25] City of Paterson, Paterson: Special Advertising Supplement,Office of the Mayor, Paterson, NJ, USA, 1998.
[26] F. D. Beck, Do State-Designated Enterprise Zones Work? IllinoisState University, Chicago, Ill, USA, 1997.
[27] Analysis Response Corporation, New Jersey Urban EnterpriseZone Fiscal Impact Study, Response Analysis Corporation,Princeton, NJ, USA, 1998.
[28] P. Carney and A. Pereira, National Survey of Urban Economicand Community Development Models.
[29] J. Renshaw, NJ Consultant Call for Elimination of Urbanenterprise Zone Program, 2011.
[30] Delta Development Corp, New Jersey Urban enterprise ZoneProgram Assessment 2011 Trenton: NJEDA State of New JerseyDepartment of Community Affairs, 2011.
[31] C. O'Dea, “Restoring the State's Urban Enterprise Zone Pro-gram,” NJ Spotlight News, 2011.

Submit your manuscripts athttp://www.hindawi.com
Child Development Research
Hindawi Publishing Corporationhttp://www.hindawi.com Volume 2014
Education Research International
Hindawi Publishing Corporationhttp://www.hindawi.com Volume 2014
Biomedical EducationJournal of
Hindawi Publishing Corporationhttp://www.hindawi.com Volume 2014
Hindawi Publishing Corporationhttp://www.hindawi.com Volume 2014
Psychiatry Journal
ArchaeologyJournal of
Hindawi Publishing Corporationhttp://www.hindawi.com Volume 2014
Hindawi Publishing Corporationhttp://www.hindawi.com Volume 2014
AnthropologyJournal of
Hindawi Publishing Corporationhttp://www.hindawi.com Volume 2014
Research and TreatmentSchizophrenia
Hindawi Publishing Corporationhttp://www.hindawi.com Volume 2014
Urban Studies Research
Population ResearchInternational Journal of
Hindawi Publishing Corporationhttp://www.hindawi.com Volume 2014
CriminologyJournal of
Hindawi Publishing Corporationhttp://www.hindawi.com Volume 2014
Aging ResearchJournal of
Hindawi Publishing Corporationhttp://www.hindawi.com Volume 2014
Hindawi Publishing Corporationhttp://www.hindawi.com Volume 2014
NursingResearch and Practice
Current Gerontology& Geriatrics Research
Hindawi Publishing Corporationhttp://www.hindawi.com
Volume 2014
Sleep DisordersHindawi Publishing Corporationhttp://www.hindawi.com Volume 2014
AddictionJournal of
Hindawi Publishing Corporationhttp://www.hindawi.com Volume 2014
Depression Research and TreatmentHindawi Publishing Corporationhttp://www.hindawi.com Volume 2014
Hindawi Publishing Corporationhttp://www.hindawi.com Volume 2014
Geography Journal
Hindawi Publishing Corporationhttp://www.hindawi.com Volume 2014
Research and TreatmentAutism
Hindawi Publishing Corporationhttp://www.hindawi.com Volume 2014
Economics Research International


![4[1].1 Economic Transition](https://img.pdfslide.net/doc/110x75/577cde7e1a28ab9e78af40c5/411-economic-transition.jpg)