Embed Size (px)
Citation preview
Research ArticleEstablishment and Application ofthe Wind and Structural Health Monitoring System forthe Runyang Yangtze River Bridge
Hao Wang12 Aiqun Li12 Tong Guo12 and Tianyou Tao12
1 Key Laboratory of CampPC Structures of Ministry of Education Southeast University Nanjing 210096 China2 School of Civil Engineering Southeast University Nanjing 210096 China
Correspondence should be addressed to Hao Wang wanghao1980seueducn and Aiqun Li aiqunliseueducn
Received 16 June 2014 Accepted 11 August 2014 Published 27 August 2014
Academic Editor Bo Chen
Copyright copy 2014 Hao Wang et al This is an open access article distributed under the Creative Commons Attribution Licensewhich permits unrestricted use distribution and reproduction in any medium provided the original work is properly cited
Structural health monitoring can provide a practical platform for detecting the evolution of structural damage or performancedeterioration of engineering structures The final objective is to provide reasonable suggestions for structural maintenance andmanagement and therefore ensure the structural safety according to the real-time recorded data In this paper the establishment ofthewind and structural healthmonitoring system (WSHMS) implemented on theRunyangYangtzeRiver Bridge (RYRB) inChina isintroducedThe composition and functions of theWSHMS are presentedThereinto the sensory subsystem utilized to measure theinput actions and structural output responses is introduced And the core functions of the datamanagement and analysis subsystem(DMAS) includingmodel updating structural condition identification and structural condition assessment are illustrated in detailA three-stage strategy is applied into the FE model updating of RYRB and a two-phase strategy is proposed to adapt to structuralhealth diagnosis and damage identification Considering the structural integral security and the fatigue characteristic of steelmaterial the condition assessment of RYRB is divided into structural reliability assessment and structural fatigue assessment whichare equipped with specific and elaborate module for effective operation This research can provide references for the establishmentof the similar structural health monitoring systems on other cable-supported bridges
1 Introduction
Bridges represent a key element in terms of the safety andfunctionality of the entire transportation system With theworldwide development of transportation numerous long-span bridges have been constructed to cross wide riversseas or canyons Due to its prominent spanning capacity andexplicit mechanical behaviors the cable-supported bridgeexhibits as one of the most suitable selections among long-span bridges There are a lot of famous cable-supportedbridges implemented all over the world such as the AkashiKaikyo Suspension Bridge (1991m) in Japan the Great BeltSuspension Bridge (1624m) in Denmark and the RusskyIsland Cable-Stayed Bridge (1104m) in Russia In Chinaa great many long-span cable-supported bridges have alsobeen in operation over the Yangtze River canyons in thewestern area and seas in the eastern region such as Runyang
Suspension Bridge (1490m) Sutong Cable-Stayed Bridge(1088m) Jiangyin Suspension Bridge (1385m) and AizhaiSuspension Bridge (1176m)
In their long service periods of several decades or over100 years the long-span bridges are inevitable to encounterthe long-term loads fatigue effects material aging cou-pling effects with extreme loads environmental corrosionand so forth [1ndash3] Subjected to natural actions includingserious environmental corrosion earthquakes typhoonsthunderstorms tornados and so forth the cable-supportedbridge with flexible characteristics may suffer from slowperformance deteriorations severe structural damage andeven collapse in different scales In addition the structuralperformance deterioration will be further aggravated by thecontinuous increase of traffic loads All of these factors canlead to the decrease of load bearing capacity and durability ofthe bridges and therefore influence the safety of structures
Hindawi Publishing CorporationShock and VibrationVolume 2014 Article ID 421038 15 pageshttpdxdoiorg1011552014421038
2 Shock and Vibration
RYRB The Yellow Sea
32∘15
998400N 119∘22
998400E
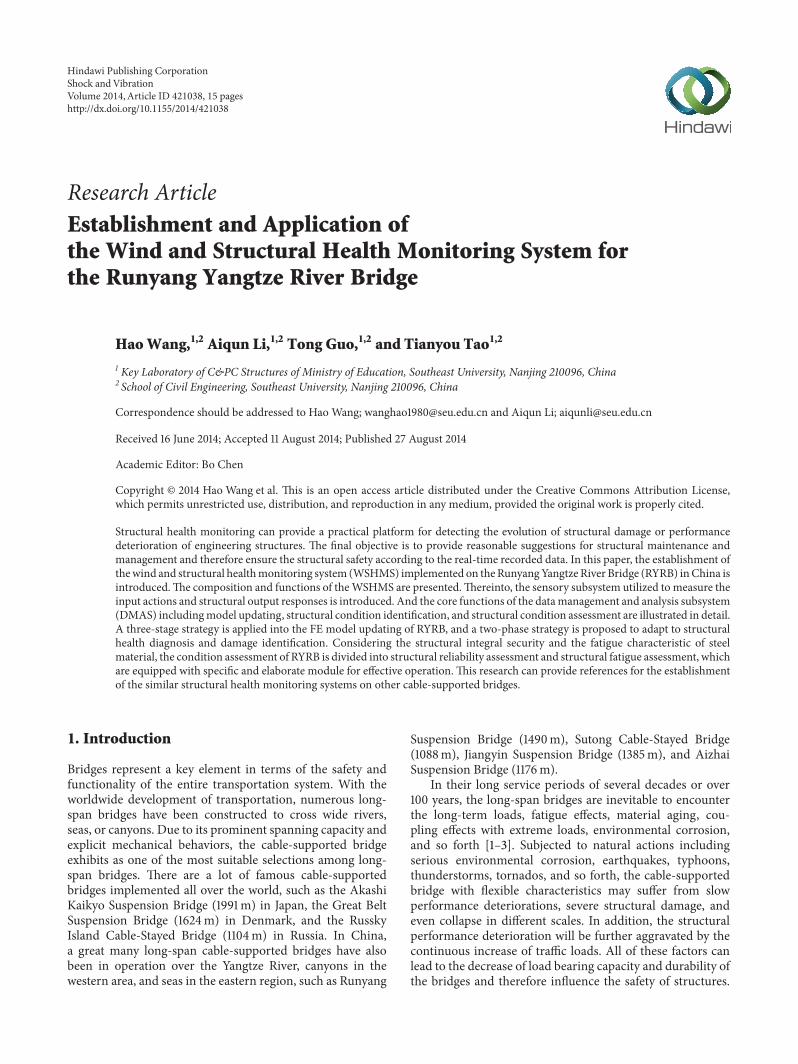
Figure 1 Geographical location of RYRB
As a result the health status durability and safety of thecable-supported bridges in their long-term service periodsattract intensive attentions from the government and civilengineers
In order to ensure the structural serviceability and sus-tainability the structural health monitoring system (SHMS)provides an efficient approach to evaluate the safety anddurability of a structure during its service life [2ndash8] TheSHMS usually contains a sensor system a data acquisitionsystem a data transmission system and a data managementsystem And the SHMS is equipped with two main functionsin general Firstly a structure installed with a SHMS canbe considered as a full-scale experimental platform Themeasured environmental loads such as earthquake groundmotions wind speed wind pressure vehicles temperatureand humidity would help understand the environmentaround the cable-supported bridges and enhance the struc-tural response prediction capabilities Secondly the modelupdating condition identification condition assessment anddecision making of long-span cable-supported bridges canbe further conducted based on the measured structuralresponsesTherefore the SHMSof cable-supported bridges inreal time offers the potential to reduce inspection and repaircosts as well as the associated downtime all while providingincreased public safety [9]
Among the various kinds of environmental loads windearthquake and vehicles play dominant roles on the cable-supported bridges which may result in severe structuraldamage or even collapse For cable-supported bridges con-structed in the eastern coastal area of China wind loadsplay an important role in their whole-life design due to thedistinctive alternate typhoon and strong north wind climateevery year Compared with the comparatively infrequentearthquakes typhoons in summer and strong north windin winter will act on these wind-sensitive cable-supportedbridges in the eastern costal region frequently Thereforethe wind environment around the bridge site needs to beemphatically monitored by the wind and structural healthmonitoring system (WSHMS) to assure the structural func-tion properly during their long service lives and to preventthem from sudden failure or fatal disaster during strongwinds [10 11]
This paper presents a study on the establishment of theWSHMS for the super-long-span cable-supported bridgesexisting in hostile environment where typhoon hurricane orother strongwinds occur frequently TakingRunyangYangtzeRiver Bridge (RYRB) as a research object the contents andfunctions of WSHMS implemented on RYRB are introducedin detail The sensory subsystem and the core functionsof WSHMS are specifically illustrated Thereinto the corefunctions contain the finite element (FE) model updatingstructural condition identification and structural conditionassessment The research and establishment of WSHMSfor RYRB can provide references for the structural healthmonitoring of other cable-supported bridges located at thesimilar geographical regions and environment
2 Engineering Background
21 Descriptions of RYRB Located in the eastern area ofChina RYRB is near the entrance of the Yangtze River to theYellow Sea as shown in Figure 1 According to the longitudeand latitude the bridge site belongs to the southeastern partsof the Asian continent Taking account of the adaption oftransportation to the development of economy a super-hugeand complicated engineering (RYRB) is put into constructionin October 2000 After nearly five yearsrsquo harsh constructionRYRBwas finally completed and open to traffic inApril 2005
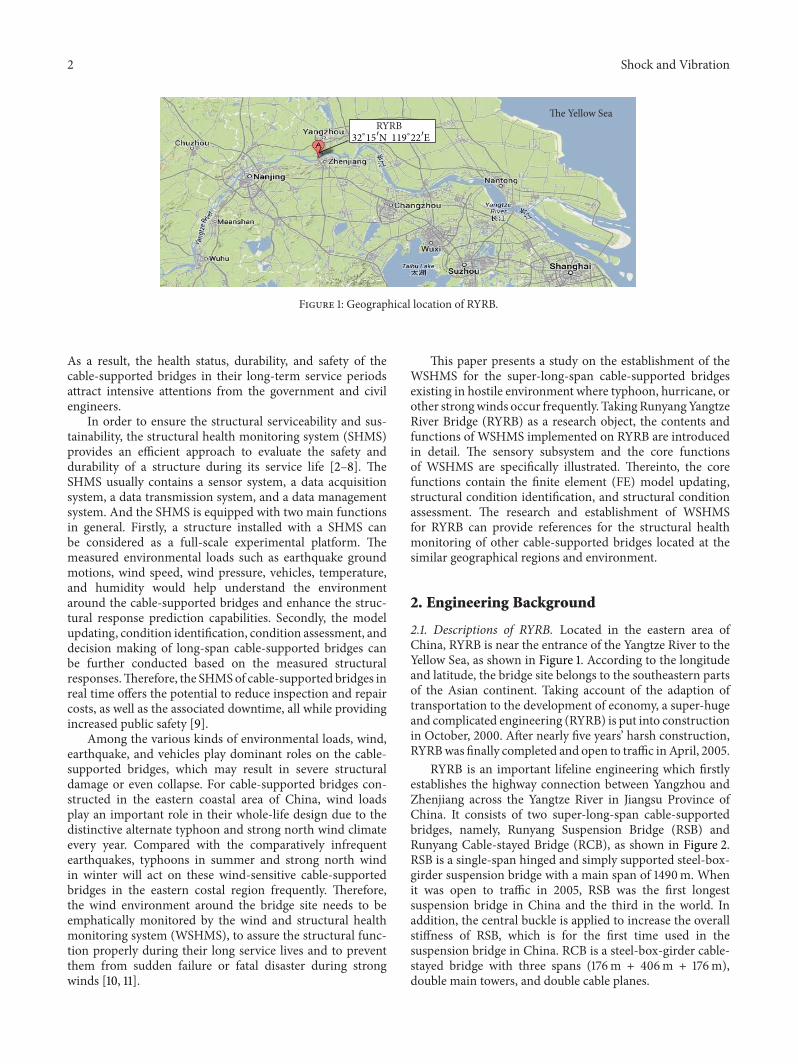
RYRB is an important lifeline engineering which firstlyestablishes the highway connection between Yangzhou andZhenjiang across the Yangtze River in Jiangsu Province ofChina It consists of two super-long-span cable-supportedbridges namely Runyang Suspension Bridge (RSB) andRunyang Cable-stayed Bridge (RCB) as shown in Figure 2RSB is a single-span hinged and simply supported steel-box-girder suspension bridge with a main span of 1490m Whenit was open to traffic in 2005 RSB was the first longestsuspension bridge in China and the third in the world Inaddition the central buckle is applied to increase the overallstiffness of RSB which is for the first time used in thesuspension bridge in China RCB is a steel-box-girder cable-stayed bridge with three spans (176m + 406m + 176m)double main towers and double cable planes
Shock and Vibration 3
(1) RSB (2) RCB
Figure 2 View of Runyang Yangtze River Bridge (RYRB)
121620242832
0 1 2 3 4Time (hour)
Win
d sp
eed
(ms
)
(a) Sample of Typhoon Haikui (2012-8-8T1200-2012-8-8T1600)
Time (hour)W
ind
spee
d (m
s)
0 1 2 3 405
10152025
(b) Sample of strong north wind (2009-12-03T0000-2009-12-03T0400)
Figure 3 Typical wind samples fromWSHMS on RYRB
Sensorysubsystem
Data acquisition subsystem
Data measurement system
Data transmission subsystem
Data management and analysis subsystem
Figure 4 The structure of WSHMS of RYRB
Fundamentalfunction
Data management and
analysis subsystem
Core function
Data processing
Data storage
Graphic display Conditionassessment
Condition
identification
FE model calibration
Figure 5 Structure of the functions of data management andanalysis subsystem
22 Wind Climate at the Bridge Site The RYRB site belongsto the mid-latitude zone According to the meteorologicalsurvey the bridge site is dominated by the humid southern
subtropical monsoon climate Monsoon circulation has asignificant influence on the seasonal changes of local weatherpatterns of RYRB site The monsoon circulation usuallyleads to obvious seasonal climate especially typhoon climatefrom eastern ocean in summer and the north wind fromSiberia in the northwest of China in winter Consideringthe performance of flexible structures in a strong windenvironment the wind-resistant stability of RYRB needs tobe paid intensive attention to during typhoons and strongwinds As a typical example Figure 3 shows the recordedwind samples of Typhoon Haikui in 2012 and strong northwind in 2009 from the WSHMS on RYRB
3 The Structure and Function ofWSHMS on RYRB
The WSHMS of RYRB contains four subsystems includ-ing sensory subsystem data acquisition subsystem datatransmission subsystem and data management and analysissubsystem (DMAS) as can be seen in Figure 4
The fundamental function of WSHMS on RYRB is real-ized by sensory subsystem which contains various trans-ducers to better understand the input loads and measureoutput structural responses In order to realize the recording
4 Shock and Vibration
AneGPS
GPSStr T Acc
Acc Str
Acc
Str
T
Acc GPS
GPSAcc
Acc
(1) Acc accelerometer (85) (2) Str stress gauge (72)(4) T temperature sensor (28)(3) Ane anemometer (2)
(5) GPS GPS receiver (8)
Lower reach
Upper reach
TStr
Acc
AccYangzhou GPS ZhenjiangAneAccGPSAcc
1490000Acc
GPS
Figure 6 Layout of sensor system of RSB (dimension unit mm)
StrAcc Str
Acc
Yangzhou Zhenjiang
Str
TAcc Str Str
StrTAcc
Str T
Acc
Acc
T
175400 406000 175400
Lower reaches
Upper reaches
(1) Acc accelerometer (15) (2) Str strain gauge (94)(3) T temperature sensor (24)
Figure 7 Layout of sensor system of RCB (dimension unit mm)
transformation and quantification of multifarious signalsources data acquisition subsystem has the functions tocollect measured data from sensory subsystem and conductadjustment and conversion of digital signals The measureddata will be transmitted to DMAS via data transmissionsubsystem which is constituted by web server optical switchmonitoring workstation and optical fiber network
As the most important part of theWSHMS on RYRB thefunctions of DMAS contain the data processing and storagegraphic display of detected signals progressive FE modelupdating condition identification and condition assessmentbased on the acquired data The first three functions arecomposed of the fundamental function of DMAS while theothers perform as the core function for structural healthassessment and decisionmakingThedetailed function struc-ture of DMAS can be seen in Figure 5
4 Sensory Subsystem of WSHMS on RYRB
The WSHMS is a technique which can provide struc-tural health conditions for decision making Based on theWSHMS the bridge supervisors can reasonably draw up
plans for bridge inspection and maintenance The maincontents and sensors layout of the WSHMS on RYRB aredeterminedmainly by the structural static and dynamic anal-yses the importance and durability of structural componentsthe structural characteristics the requirements of the systemfunctions and construction expenditure Figures 6 and 7show the sensor layout of RSB and RCB respectively Thenumber in the bracket represents the quantity of sensors
41 Sensors Layout of RSB
411 Main Cable and Suspender Monitoring The main cableis one of the most important components related to the safetyoperation of a suspension bridge Therefore 32 accelerom-eters were installed at 4 anchor rooms (8 accelerometersin each anchor room) to monitor the vibrations and fre-quencies of the typical cables and likewise the forces ofthe cables can be achieved based on the relation betweenthe cable tension and the vibration frequency The verticaland lateral vibration responses of the main cable weremonitored by 12 low-frequency single-axis accelerometersas shown in Figure 8 Considering the large quantity of thesuspenders the suspenders of RSB were periodically tested
Shock and Vibration 5
Yangzhou
12000 1200037500 37500
Zhenjiang
Downstream
Upstream
VerticalLateral
LZD2-4 LZD3-4LZD1-2 LZD2-3 LZD3-3 LZD4-2
LZD1-1
LZD2-2 LZD3-2
LZD3-1 LZD4-1LZD2-1
Figure 8 Layout of anemometers on the main cable of RSB
with additional field tests and the measurement results arebrought into the whole structural assessment system
412 Main Girder Monitoring Considering both of thestructural characteristics of the main girder the girdermonitoring mainly focuses on the overall line type stresstemperature and vibration The Global Positioning System(GPS) is demonstrated with an ability to accurately extractstatic and quasistatic displacements of the bridge inducedby ambient effects [12ndash15] thus 6GPS measuring points aresettled at 3 quartered sections to monitor the line type of themain girder as shown in Figure 6 The monitoring stationis set up near the GPS bench marks of China In order tomonitor the longitudinal displacement 4 linear displacementsensors are installed at two ends of the girder (two ineach end) Considering the optimization results of geneticalgorithm and the requirements of real-time modal analysis29 low-frequency single-axis accelerometers are installed at 9sections of the girder to monitor the vibration responses
Considering many factors such as structural deformationand stress layout under static loads symmetry of the struc-ture special design of the central buckle and optimizationanalysiswith the genetic algorithm 72 strain gauges includingfiber sensors vibrational chord strain gauges and weldingstrain gauges are installed at 5 sections of the main girderto monitor the structural stress status Since the temperaturehas a significant effect on the fatigue property of weldingsteel box girder [16] 28 temperature sensors were installedat 3 sections of the main girder to monitor the temperaturedistribution and changes Thereinto 12 temperature sensorsare installed on the 1198712 (119871 is the span of the RSB) sectionof RSB and 8 temperature sensors are installed on the sidesection individually
413 Main Tower Monitoring The main tower is the mostimportant element of a suspension bridge In order to moni-tor the vibration response of the two towers 6 accelerometersare uniformly installed at the upper crossing girder andthe mid crossing girder of each tower which is detailed inFigure 9 In addition 2GPS measuring points are settled at
Upstream Downstream
1400
056
050
1010
80
2035
80
3245
0
TZ1-2
TZ1-3
TZ1-5
TZ1-6
TZ1-1
TZ1-4
Lateral
Longitudinal
Figure 9 Layout of the accelerometers on the main tower of RSB(dimension unit mm)
6 Shock and Vibration
(a) WA15 (b) 1590-PK-020
Figure 10 Anemometers installed on RSB
the top of the two towers to monitor the displacements of thetowers
414 Wind Environment Monitoring Considering the typ-ical wind environment at the bridge site two kinds ofanemometers are installed on RSB to monitor the windvelocity and wind direction the WA15 anemometer fromthe Vaisala Company (Finland) and the 1590-PK-020 3Dultrasonic anemometer from the Gill Instruments Limited(England) TwoWA15 anemometers are used in theWSHMSof the RSB (Figure 10(a)) and three 1590-PK-020 3D ultra-sonic anemometers are installed only during strong winds(Figure 10(b)) All the anemometers can be utilized to analyzethe wind effects acting on RSB [17] One of the WA15anemometers is deployed on the top of the south tower(downstream) and the other in the middle of the main span(downstream) North wind is defined as 0∘ for anemome-ters data and clockwise rotation is defined as the positivedirection Long-term successful applications in meteorolog-ical studies have shown that the WA15 anemometers canwork effectively under all kinds of bad weather and acquireaccurate information about wind environment
The WA15 anemometers in WSHMS collect time historyof wind speed and direction with the frequency of 1Hz so itcan only provide average ormaximumdata about wind speedand direction Because of this limitation three 1590-PK-0203D ultrasonic anemometers are used in the field test duringthe strong winds The 1590-PK-020 anemometer has lightweight and small volumeThemaximum sampling frequencycan reach 32Hz Owing to the above features it is usedwidely in the wind testing of engineering structures Thesethree anemometers can be installed in other key positionsof the RSB during strong wind periods so that the windenvironment characteristics of strong winds can bemeasuredmore accurately and comprehensively
415 Traffic Loads Monitoring Due to the low precisionand high price of current vehicle load and vehicle velocitydynamic measurement system the system was not applied intheWSHMS of RSB Based on the data provided by the trafficsystem the vehicle loads and vehicle velocities on RSB weredetermined mainly by the traffic loads model which is builtby use of the statistical method
42 Sensors Layout of RCB
421 Cable Monitoring The stay cable is one of the mostimportant components in a cable-stayed bridge and its work-ing performance is closely related to the health status of theoverall structure Therefore the distribution and fluctuationof cable forces must be acquired accurately in order toanalyze the working condition of the cables and determinethe cable forces in FEmodel accordingly Like the suspendersof RSB the cable monitoring of RCB is complemented withadditional periodical field tests and then the measurementswill be integrated into the WSHMS afterwards
422 Main Girder Monitoring The main girder monitoringof RCBmainly contains the monitoring of stress distributionvibration status and temperature distribution and fluctua-tion As shown in Figure 7 15 low-frequency accelerometersare installed at 5 sections of the main girder to monitorthe vertical and lateral vibration responses 94 strain gaugesincluding fiber sensors vibrational chord strain gauges andwelding strain gauges are installed at 5 key sections tomonitorthe stress distribution on the steel box girder Consideringthe symmetry of RCB 24 temperature sensors are installedat 2 sections (1198712 section and side section near Zhenjiang) ofthe main girder to monitor the temperature distribution andfluctuation all year round
5 Progressive Finite ElementModel Updating of RYRB
An accurate and reliable FE model is essential for thestudies on wind resistance structural health monitoring andcondition assessment [18] Therefore establishing a baselineFE model is the research basis for any kind of numericalanalysis Many FE model updating techniques have beenproposed based on measured data in order to achieve an FEbaseline model suitable for the analysis object In most ofthe model updating approaches the FE baseline model of thestructure is obtained by reducing the error between the mea-sured structural response and the calculated response froma numerical model During the model updating procedurethe corresponding design parameters should be updatedsimultaneously Obviously too many design parameters may
Shock and Vibration 7
River wave
Ambient excitation
The free standing tower
Vibration responses
Design parameters
FE model
Modal analysis
Yes
No
Objective functionPenalty function
Boundary conditions
Updated parameters of the free standing tower
WindThe free standingtower stage
Microtremor
PP method
The first optimization method
SSI methodCheck
WSHMS
Modal identification
Additional sensors
middot middot middot
frequenciesCalculated n-order modal
frequenciesMeasured n-order modal
Error lt5
Figure 11 FE model updating of the free standing tower stage
decrease the updating efficiency and increase the complexityof model updating However a more accurate FE model willbe acquiredwhen takingmore input parameters into accountHence a tradeoff between the complicity of the optimizationand the accuracy of the numerical model has to be made
Being aware of the aforementioned limitations of modelupdating technique a three-stage model updating strategyis proposed for the application in the progressive FE modelupdating of RYRB Among the three-stage model updatingstrategy the first two stages will provide an initial baseline FEmodel for the operation stage [18]
51 The Free Standing Tower Stage When the main towerof RYRB is completed a field test is conducted to examinethe structural status The accelerometers in WSHMS and theadditional sensors can record its vibration responses from
ambient excitation such as river waves wind and groundmicrotremor Based on the measured structural vibrationresponses the structural modal parameters are identified bythe peak picking (PP) method The identification results arethen validated and complemented by the stochastic subspaceidentification (SSI) method Considering the importance oflow order modes the first 119899 modal frequencies are takeninto the model updating process Other acquired modalfrequencies will be used to validate the updated FE modelafterwards
With the initial structural parameters a FE model of thefree standing tower can be establishedThe cross-section areamoment of inertia material density and elastic modulus aretaken as the updating parameters based on the parametersensitivity analysis The first 119899 modal frequencies of thetower can be calculated by modal analysis and the error
8 Shock and Vibration
Temperature
Ambient excitation
Full bridge
Vibration responses
Design parameters
FE model
Modal analysis
Objective functionBoundary conditionsPenalty function
Updated parameters of the main girder and cable
Updated parameters of
No
Yes
the free standing tower
WindFull-bridge stage Microtremor
Updated FE model
WSHMSAdditionalsensors
PP method SSI methodCheck
Modal identification
The first optimization method
middot middot middot
Measured n-order modalfrequencies
Calculated n-order modalfrequencies
Error lt5
Figure 12 FE model updating of full-bridge stage
between each corresponding calculated andmeasuredmodalfrequency is defined as a state variable specified as
Error =1003816100381610038161003816119891119888 minus 119891119898
1003816100381610038161003816
119891119898
(1)
where 119891119888is the calculated modal frequency and 119891
119898is the
measured modal frequencyIf each error between calculated and measured modal
frequency is below the acceptable level 5 the structuralparameters would be permitted for the updated FE modelotherwise a parameter optimization procedure will be carriedout In the procedure the model updating problem is trans-formed into amultiobjective nonlinear optimization problem
under constraints of equality and inequality An objectivefunction is proposed as the sum of the square of errorsbetween the calculated and measured frequencies multipliedby corresponding weighing factors detailed as
119869 =
119899
sum
119894=1
1205931198941198642
119894
(119894 = 1 2 119899)
120593119894=1198642
119894
sum119899
119894=1
1198642
119894
(119894 = 1 2 119899)
(2)
where 119869 is the objective function 120593119894is the weighing factor
119864119894is the error between calculated and measured value of the119894th modal frequency Taking the boundary conditions into
Shock and Vibration 9
Temperature WindAmbient excitation
MicrotremorVehicle
Full bridge
WSHMS
PP method SSI methodCheck
Modal identification
Vibration responses
Updated parameters
Updated FE model
Modal analysis
Objective function Boundary
The first optimization method
conditions
Penalty function
Updated parameters of the main tower
FE modelReal-time updated
Updated parameters of the main girder and cable
No
Yes Yes
Operation stage middot middot middot
Error lt5
Measured n-order modalfrequencies
Calculated n-order modalfrequencies
Figure 13 FE model updating of the operation stage
the objective function with penalty function the updatedstructural parameters of the free standing tower can beacquired by the first optimization method [18] The detailedcalibration process can be seen in Figure 11
52 Full-Bridge Stage In the second stage structural parame-ters of the steel girder and themain cable will be updated afterthe construction of RYRB is finished The model updatingprocedure is similar to that of the free standing tower Basedon the parameter sensitivity analysis the selected updatingparameters contain the material density elastic modulusand moment of inertia of the steel girder as well as thematerial density and elastic modulus of the main cable Inthe establishment of the FE model of full bridge the updatedstructural parameters of the free standing tower are employedand they are kept constant during the calibration procedureIn the stage the first 119899modes contain vertical bending lateralbending and torsionalmodes of themain girder as well as thelongitudinal bending lateral bending and torsional modesof the main tower After the process in Figure 12 the updatedparameters of the main girder and cable can be obtained andan initial FE model with the updated parameters of the fullbridge will be finally established
Before RYRB was open to the traffic a field load testis conducted and the corresponding static responses can beaccurately recorded by WSHMS Taking the same loadingscheme the structural deformation and stress distributionunder the static and dynamic loads can be calculated withthe FE model The measured structural responses during thefield load test can be employed to validate the reliability of theacquired FE model so that an initial baseline FE model canbe provided to the operation stage
53 Operation Stage Compared to construction stage RYRBsuffers from additional vehicle actions and continuous envi-ronmental loads in its long service period Hence theperformance deterioration and partial damage will inevitablyoccur in some structural components which may causethe variation of structural dynamic characteristics A real-time FE model which can reflect the structural materialand performance deterioration really needs to be establishedfor structural condition assessment To make the FE modelaccurate and reliable during its whole life cycle the real-timerecorded data fromWSHMS are employed for validating thereal-time updated FE model Similar to construction stagethe FE model updating of RYRB in operation stage is shownin Figure 13
10 Shock and Vibration
RYRB and WSHMS
Data acquisition
Primary diagnosis
Eigenvector extraction(modal parameters)
Going normal
Identifying damage location
Evaluating damage grade
Further diagnosis
Serious
Partial maintenance
Maintenance
Yes No
Yes
No
Stop operating
Figure 14 Condition identification strategy of RYRB
6 Condition Identification of RYRB
One of the most important objectives of the WSHMS isto diagnose the damage and health condition of structuresduring service period Large quantities of real-time data canbe acquired from the WSHMS which makes the existingproblem for structural condition identification is how toconvert the structural responses into the structural healthinformation Condition identification theory or method isjust the way to diagnose structural abnormal state or damageMany researches on structural condition identification usingthe field tests have been conducted and the efficiencyof structural condition identification based on static anddynamic responses has been validated by experiments [19ndash23]
The structural condition identification strategy inWSHMS of RYRB is shown in Figure 14 Based on theWSHMS the structural responses will be recorded andtransmitted to DMAS [24] Some eigenvectors which candescribe structural damage status will be extracted from theacquired data Hereinto modal parameters including modefrequencies mode shapes and damping ratios are selected asthe eigenvectors Furthermore the modal assurance criteria(MAC) are adopted as the damage indicator to increasethe sensitivity of modal parameters to structural damageThe structural condition identification is classified into twoordinal phases one is primary diagnosis with statisticalanalysis technique and the other is further diagnosis withneural networkThe primary phase only briefly distinguisheswhether the modal parameters are abnormal or not whilethe further phase will determine the damage location andevaluate the damage grade Finally whether a practical
Measured data
Compare Eigenvector extraction(modal parameters)Primary diagnosis
Eigenvectordatabase
Figure 15 Primary damage diagnosis of RYRB
maintenance is needed would be determined by the struc-tural damage degree
61 PrimaryDiagnosis Based on Statistical Analysis TechniqueThe efficiency of primary diagnosis relies on two factors theextracted eigenvectors and the eigenvector database Sincethe completion of RYRB modal parameters of normallyoperated structure have been gradually accumulated fromWSHMS And an eigenvector database is set up with thestatistical analysis result of accumulated modal parametersTherefore the primary diagnosis will depend on the compar-ison between the real-time extracted modal parameters andthe eigenvector database The primary diagnosis process canbe seen in Figure 15
62 Further Diagnosis Based on Neural Network Due to thelarge scale of engineering structure and the randomness ofinfluence factor it is difficult to accurately acquire all theeffective data related to local damage Hence many conditionidentification methods lose their own efficacies But neuralnetwork accompanied by genetic algorithm can effectively
Shock and Vibration 11
Baseline FE model Representative damage pattern
Simulated damage
FE Model analysis and data preprocess
parametersMeasured damage
parameters
Satisfied
Network training and testing
Damage location
Trained network
Damage grade
WSHMS
Damage State
Measured parameters
Damage database
No
(training data)
Yes
Prep
are s
tage
for
trai
ning
dat
a
Con
struc
tion
stage
of
net
wor
kC
ondi
tion
iden
tifica
tion
stag
e
Additional field test
Figure 16 Further damage diagnosis based on neural networks
explain the variation of structural state no matter fromintuitive thinking or from uncertain reasoning on accountof its strong fault tolerance robustness and generalizationability Meanwhile the development of computer techniquesmakes the computational efficiency rapidly increased whichmakes it feasible to diagnose the health status of engineeringstructures
In the further condition identification of RYRB BPneural network is utilized to reflect the relationship betweenstructural damage pattern and its characteristics and furtheridentify the damage location combined with the analyses of
structural damage status The further damage diagnosis ofRYRB is divided into three stages as shown in Figure 16
The first stage aims to prepare training data for the neuralnetwork with the combination of FE analyses and field mea-surements With the real-time baseline FE model providedby the model updating and representative damage patternsthe structural parameters embodying partially damage canbe well simulated Based on the measured parameters fromthe WSHMS a damage database which stores the trainingdata for neural network would be established During thesecond stage the topological structure of BP neural network
12 Shock and Vibration
MC simulationSensitivities
Correlations
RS simulation
100000 times Fit the failure MC simulationStructural reliability
The first step The second step
The third step
variablesDecide significant
Get the sampling points needed
response surface
N times
50sim200 times
Figure 17 The flow chart of the combined simulation method
is constructed and the network is trained with the sample setfrom the damage database If the trained network satisfieswith the accuracy requirement it can be employed to servefor the third stage The third stage is to assess the damagestate of RYRB Structural damage location and grade canbe achieved by inputting the measured modal parametersinto the trained BP neural network model In order toaccurately and reliably recognize the real structural damagestate including damage location and damage grade someadditional field tests should be conducted near the possibledamage locations
7 Condition Assessment of RYRB
Safe and reliable operation of bridges has become a majorconcentration of both civil engineers and the governmentHowever whether current technologies and operational pro-cedures can ensure the necessary serviceability the cost-effective maintenance and management of bridges still lackan explicit evaluating criterion These limitations in currentpractice can be overcome by emerging concepts and toolsfor accurate condition assessment of civil infrastructures[25] Conventional bridge condition assessment is gener-ally conducted with measured data from visual inspectionwhich has been proved to be limited and subjective Thedevelopment of structural health monitoring provides a newvaluable practice into structural condition assessment Withplentiful data acquired from the SHMS the condition of in-service bridge structures and insights into actual behavior ofbridges under in-service environment can be well recognizedbased on reliability condition assessment methods [26 27]Considering integral security and the fatigue characteristic ofsteelmaterial the condition assessment of RYRB is composedof structural reliability assessment and structural fatigueassessment [24]
71 Structural Reliability Assessment In the structural reli-ability assessment of RYRB the core part is a combinednumerical simulation method which has the advantages oftheMonte Carlo (MC)method and the response surface (RS)method The main procedure can be seen in Figure 17
The combined method mainly contains the followingsteps Firstly the MC method is used to compute the prob-abilistic sensitivities and the correlations between randomvariables (input variables) with 50sim200 times of samplingsIn this way the variables that have more significant effect on
the output index can be determined according to probabilisticsensitivity analysis The comparatively important input vari-ableswill be kept for following processwhile the otherswill beomittedThen the failure response surface of different outputvariables can be fitted through RS simulation Finally theMCmethod (100000 times of samplings) will be used again to getthe structural probability of eachmain failure mode based onthis response surface
Combined with monitored data from WSHMS thedetailed reliability assessment of RYRB is shown in Figure 18The whole procedure is mainly divided into three specificparts In the input module the environment information andvehicle loads will be processed with statisticalmethod so thatthe statistical value of external actions can be input to theevaluating model afterwards If some structural damage hasoccurred and been examined by the monitoring system thedamage information can be delivered to the evaluatingmodelas well In the simulation module the combined simulationmethod aforementioned and the updated FE model will beutilized to calculate the reliability of each main failure modeIn the output module the max stress of girder cable andcentral buckle themax vertical and horizontal displacementsof girder and the max horizontal displacements of the towerwill be displayed The reliability of the member with extremeresponses will be evaluated and the serial number of theperilous member will be recorded with a label According tothe probability index the structural reliability state and thesuggested maintenance action can be given
72 Structural Fatigue Assessment Fatigue is a prominentproblem that exists in steel structures [28 29] If the stressfluctuates obviously stress far less than yield strength cancause the failure of steel members In the fabrication ofsteel structures welding is one of the most frequently usedapproaches but welded joints in steel structures are vulnera-ble to failure by fatigue for the inner flaws or discontinuities[16 30] Considering the fatigue accumulation in weldedjoints of the steel box girder the structural fatigue assessmentof RYRB mainly focuses on the plentiful welded jointsbetween each segment of the deck The structural fatigueassessment can be seen in Figure 19
Based on the online original data of strain acquiredfrom WSHMS of RYRB the recorded data in time domaincan be transformed into statistical information at frequencydomain with FFT technique Usingmultiple linear regressionmethod a representative sample of strain time-history can be
Shock and Vibration 13
Wind Vehicles Temperature Girder Cable Others
Monitoring damageExternal actions
Probability analysis FE model
girderMax stress of
cableMax stress of
Numerical simulation based on the combined simulation method
Max stress of central buckle
Max vertical and horizontal displacements of girder
Max horizontal displacement of tower
Reliability of the member with extreme response
Input Input
Serial number of the perilous member
Statistical value of external actions
Monitoreddamage
Stress
Displacement
Reliability
Output
Input
Simulation
Output
Figure 18 Reliability assessment of RYRB
obtained Then the rain-flow counting method is utilized todetermine the stress spectrum of the representative sampleSince the measured stress is the nominal stress at the locationof the gauge it should be modified with coefficient to obtainthe hot-spot stress at the toe of weldThe primary assessmentof fatigue life is undertaken based on BS5400 [31] and amodified probability model is proposed as well Combinedwith continuumdamagemechanics (CDM)model andminermodel the reliability assessment of fatigue life on RYRB willbe conducted comprehensively Hence the periodic inspec-tion and maintenance scheme for RYRB can be formulatedreasonably
8 Summary and Conclusion
This paper introduces the establishment of a WSHMS forRYRB in China and the composition and functions of theWSHMS are presented The WSHMS of RYRB contains foursubsystems including sensory subsystem data acquisitionsubsystem data transmission subsystem andDMAS Specifi-cally the sensory subsystem which is utilized to measure theinput actions and structural output responses and the corefunctions of the DMAS including model updating structuralcondition identification and structural condition assessmentare illustrated in detail
A three-stage model updating strategy is proposed forthe progressive FE model updating of RYRB Thereintothe measured structural static and dynamic responses areadopted to acquire the target benchmarks of RYRB andthe first-order optimization method is used to enhance thecomputing rate of convergence Among the proposed three-stagemodel updating strategy the first two stages can providean initial baseline FE model for the operation stage and theoperation stage offers a real-time FE model for structuralcondition identification and assessment
In the WSHMS of RYRB a two-phase strategy is pro-posed to carry out the structural damage diagnosis anddamage location identification The primary diagnosis phasebriefly distinguishes whether the measured parameters andresponses are abnormal or not while the further diagnosisphase will determine the damage location and evaluate thedamage grade On the basis of structural damage degreewhether a practical maintenance is needed or not can bedecided
Considering the integral security and the fatigue charac-teristic of steel structures the condition assessment of RYRBis composed of structural reliability assessment and structuralfatigue assessment Structural reliability assessment serveswith a combined numerical simulation method taking theadvantages of both theMonte Carlomethod and the response
14 Shock and Vibration
Original strain data recorded bystrain gauge
Time history curves of strain
Statistical information attime domain
Statistical information at frequency domain
Daily stress spectrum by rain-flow counting method
Representative sample of strain time-history
Hot-spot stress history at the toe of weld
Hot-spot stress spectrum at the toe of weldPrimary assessment of fatigue life
based on BS5400
Modified probability modelCDM model Miner model
Comprehensive reliability assessment of fatigue life
Figure 19 Structural fatigue assessment of RYRB
surface method while structural fatigue assessment is a com-prehensive evaluation with empirical and modified modelbased on real-time measurements fromWSHMS
Conflict of Interests
The authors declare that there is no conflict of interestsregarding the publication of this paper
Acknowledgment
The supports from the National Science Foundation ofChina (Grant nos 51378111and 51438002) the Major StateBasic Research Development Program of China for YoungScientists (973 Program Grant no 2015CB060000) theProgram for New Century Excellent Talents in University ofMinistry of Education of China (Grant no NCET-13-0128)the FokYing-Tong Education Foundation for Young Teachersin the Higher Education Institutions of China (Grant no
142007) the Jiangsu TransportationDepartment (Grants nos2011Y09-2 and 2011Y03) the Natural Science Foundationof Jiangsu (Grant no BK2011611) and the FundamentalResearch Funds for the Central Universities (Grant no2242012R30002) are greatly acknowledged The authors alsowould like to acknowledge the Construction CommandingDepartment of Jiangsu Provincial Yangtze River HighwayBridge and the Structural Health Monitoring Institute ofSoutheast University
References
[1] A E Aktan F N Catbas K A Grimmelsman and C J TsikosldquoIssues in infrastructure health monitoring for managementrdquoJournal of Engineering Mechanics vol 126 no 7 pp 711ndash7242000
[2] J P Ou and H Li ldquoRecent advances of structural healthmonitoring in Mainland Chinardquo in Proceedings of the ANCERAnnual Meeting 2004
Shock and Vibration 15
[3] H Li J Ou X Zhao et al ldquoStructural healthmonitoring systemfor the Shandong Binzhou Yellow River Highway BridgerdquoComputer-AidedCivil and Infrastructure Engineering vol 21 no4 pp 306ndash317 2006
[4] A S Kiremidjian E G Straser T H Meng et al ldquoStructuraldamage monitoring for civil structuresrdquo in Proceedings of theInternational Workshop on Structural Health Monitoring pp371ndash382 1997
[5] J M Ko and Y Q Ni ldquoStructural health monitoring and intelli-gent vibration control of cable-supported bridges research andapplicationrdquo KSCE Journal of Civil Engineering vol 7 no 6 pp701ndash716 2003
[6] J P Ou ldquoSome recent advances of structural health monitoringsystems for civil infrastructure in mainland Chinardquo in Proceed-ings of the Symposium onNetwork and Center-based Research forSmart Structures Technologies and Earthquake Engineering pp131ndash144 Tokyo Japan 2003
[7] H N Li D S Li and G B Song ldquoRecent applications offiber optic sensors to health monitoring in civil engineeringrdquoEngineering Structures vol 26 no 11 pp 1647ndash1657 2004
[8] B Chen S L Zhao and P Y Li ldquoApplication of Hilbert-Huang transform in structural health monitoring a state-of-the-art reviewrdquoMathematical Problems in Engineering vol 2014Article ID 317954 22 pages 2014
[9] B F Spencer and S Cho ldquoWireless smart sensor technologyfor monitoring civil infrastructure technological developmentsand full-scale applicationsrdquo in Proceedings of theWorld Congresson Advances in Structural Engineering andMechanics pp 18ndash22Seoul Republic of Korea 2011
[10] Y L Xu and W S Chan ldquoWind and structural monitoring oflong span cable-supported bridges with GPSrdquo in Proceedings ofthe 7th Asia-Pacific Conference on Wind Engineering (APCWErsquo09) Taibei China November 2009
[11] B Chen Y L Xu and X Zhao ldquoIntegrated vibration controland health monitoring of building structures a time-domainapproachrdquo Smart Structures and Systems vol 6 no 7 pp 811ndash833 2010
[12] Y FujinoMMurata S Okano andM Takeguchi ldquoMonitoringsystem of the Akashi Kaikyo Bridge and displacementmeasure-ment using GPSrdquo in 4th Nondestructive Evaluation of HighwaysUtilities and Pipelines vol 3995 of Proceedings of SPIE pp 229ndash236 Newport Beach Calif USA March 2000
[13] S Nakamura ldquoGPS measurement of wind-induced suspensionbridge girder displacementsrdquo Journal of Structural Engineeringvol 126 no 12 pp 1413ndash1419 2000
[14] T H Yi H N Li and M Gu ldquoWavelet based multi-stepfiltering method for bridge health monitoring using GPS andaccelerometerrdquo Smart Structures and Systems vol 11 no 4 pp331ndash348 2013
[15] T H Yi H N Li and M Gu ldquoExperimental assessment ofhigh-rate GPS receivers for deformation monitoring of bridgerdquoMeasurement vol 46 no 1 pp 420ndash432 2013
[16] T Guo A Q Li and J H Li ldquoFatigue life prediction of weldedjoints in orthotropic steel decks considering temperature effectand increasing traffic flowrdquo Structural Health Monitoring vol 7no 3 pp 189ndash202 2008
[17] H Wang A Li J Niu Z Zong and J Li ldquoLong-term moni-toring of wind characteristics at Sutong Bridge siterdquo Journal ofWind Engineering and Industrial Aerodynamics vol 115 pp 39ndash47 2013
[18] H Wang A Li and J Li ldquoProgressive finite element modelcalibration of a long-span suspension bridge based on ambient
vibration and static measurementsrdquo Engineering Structures vol32 no 9 pp 2546ndash2556 2010
[19] KDHjelmstad and S Shin ldquoDamage detection and assessmentof structures from static responserdquo Journal of EngineeringMechanics vol 123 no 6 pp 568ndash576 1997
[20] B H Oh and B S Jung ldquoStructural damage assessment withcombined data of static and modal testsrdquo Journal of StructuralEngineering vol 124 no 8 pp 956ndash965 1998
[21] R Brincker L Zhang and P Andersen ldquoModal identification ofoutput-only systems using frequency domain decompositionrdquoSmart Materials and Structures vol 10 no 3 pp 441ndash445 2001
[22] L M Khoo P R Mantena and P Jadhav ldquoStructural damageassessment using vibration modal analysisrdquo Structural HealthMonitoring vol 3 no 2 pp 177ndash194 2004
[23] S H Sim B F Spencer and T Nagayama ldquoMultimetricsensing for structural damage detectionrdquo Journal of EngineeringMechanics vol 137 no 1 pp 22ndash30 2011
[24] A Q Li Y L Ding H Wang and T Guo ldquoAnalysis andassessment of bridge health monitoring mass datamdashprogressin researchdevelopment of ldquoStructural Health MonitoringrdquordquoScience China Technological Sciences vol 55 no 8 pp 2212ndash2224 2012
[25] A E Aktan D N Farhey D L Brown et al ldquoConditionassessment for bridge managementrdquo Journal of InfrastructureSystems vol 2 no 3 pp 108ndash117 1996
[26] M Liu D M Frangopol and S Kim ldquoBridge system perfor-mance assessment from structural health monitoring a casestudyrdquo Journal of Structural Engineering vol 135 no 6 pp 733ndash742 2009
[27] H W Xia Y Q Ni K Y Wong and J M Ko ldquoReliability-based condition assessment of in-service bridges using mixturedistribution modelsrdquo Computers amp Structures vol 106-107 pp204ndash213 2012
[28] Z W Chen Y L Xu Y Xia Q Li and K Y Wong ldquoFatigueanalysis of long-span suspension bridges under multiple load-ing case studyrdquo Engineering Structures vol 33 no 12 pp 3246ndash3256 2011
[29] Z W Chen Y L Xu and X M Wang ldquoSHMS-based fatiguereliability analysis of multiloading suspension bridgesrdquo Journalof Structural Engineering vol 138 no 3 pp 299ndash307 2012
[30] Z X Li T H T Chan and T Q Zhou ldquoAccumulativedamage near crack tip for welded bridge members fatigue lifedeterminationrdquoTheoretical andApplied FractureMechanics vol43 no 2 pp 245ndash260 2005
[31] BS5400 B S I Part 10 Code of Practice for Fatigue 1982
International Journal of
AerospaceEngineeringHindawi Publishing Corporationhttpwwwhindawicom Volume 2014
RoboticsJournal of
Hindawi Publishing Corporationhttpwwwhindawicom Volume 2014
Hindawi Publishing Corporationhttpwwwhindawicom Volume 2014
Active and Passive Electronic Components
Control Scienceand Engineering
Journal of
Hindawi Publishing Corporationhttpwwwhindawicom Volume 2014
International Journal of
RotatingMachinery
Hindawi Publishing Corporationhttpwwwhindawicom Volume 2014
Hindawi Publishing Corporation httpwwwhindawicom
Journal ofEngineeringVolume 2014
Submit your manuscripts athttpwwwhindawicom
VLSI Design
Hindawi Publishing Corporationhttpwwwhindawicom Volume 2014
Hindawi Publishing Corporationhttpwwwhindawicom Volume 2014
Shock and Vibration
Hindawi Publishing Corporationhttpwwwhindawicom Volume 2014
Civil EngineeringAdvances in
Acoustics and VibrationAdvances in
Hindawi Publishing Corporationhttpwwwhindawicom Volume 2014
Hindawi Publishing Corporationhttpwwwhindawicom Volume 2014
Electrical and Computer Engineering
Journal of
Advances inOptoElectronics
Hindawi Publishing Corporation httpwwwhindawicom
Volume 2014
The Scientific World JournalHindawi Publishing Corporation httpwwwhindawicom Volume 2014
SensorsJournal of
Hindawi Publishing Corporationhttpwwwhindawicom Volume 2014
Modelling amp Simulation in EngineeringHindawi Publishing Corporation httpwwwhindawicom Volume 2014
Hindawi Publishing Corporationhttpwwwhindawicom Volume 2014
Chemical EngineeringInternational Journal of Antennas and
Propagation
International Journal of
Hindawi Publishing Corporationhttpwwwhindawicom Volume 2014
Hindawi Publishing Corporationhttpwwwhindawicom Volume 2014
Navigation and Observation
International Journal of
Hindawi Publishing Corporationhttpwwwhindawicom Volume 2014
DistributedSensor Networks
International Journal of
2 Shock and Vibration
RYRB The Yellow Sea
32∘15
998400N 119∘22
998400E
Figure 1 Geographical location of RYRB
As a result the health status durability and safety of thecable-supported bridges in their long-term service periodsattract intensive attentions from the government and civilengineers
In order to ensure the structural serviceability and sus-tainability the structural health monitoring system (SHMS)provides an efficient approach to evaluate the safety anddurability of a structure during its service life [2ndash8] TheSHMS usually contains a sensor system a data acquisitionsystem a data transmission system and a data managementsystem And the SHMS is equipped with two main functionsin general Firstly a structure installed with a SHMS canbe considered as a full-scale experimental platform Themeasured environmental loads such as earthquake groundmotions wind speed wind pressure vehicles temperatureand humidity would help understand the environmentaround the cable-supported bridges and enhance the struc-tural response prediction capabilities Secondly the modelupdating condition identification condition assessment anddecision making of long-span cable-supported bridges canbe further conducted based on the measured structuralresponsesTherefore the SHMSof cable-supported bridges inreal time offers the potential to reduce inspection and repaircosts as well as the associated downtime all while providingincreased public safety [9]
Among the various kinds of environmental loads windearthquake and vehicles play dominant roles on the cable-supported bridges which may result in severe structuraldamage or even collapse For cable-supported bridges con-structed in the eastern coastal area of China wind loadsplay an important role in their whole-life design due to thedistinctive alternate typhoon and strong north wind climateevery year Compared with the comparatively infrequentearthquakes typhoons in summer and strong north windin winter will act on these wind-sensitive cable-supportedbridges in the eastern costal region frequently Thereforethe wind environment around the bridge site needs to beemphatically monitored by the wind and structural healthmonitoring system (WSHMS) to assure the structural func-tion properly during their long service lives and to preventthem from sudden failure or fatal disaster during strongwinds [10 11]
This paper presents a study on the establishment of theWSHMS for the super-long-span cable-supported bridgesexisting in hostile environment where typhoon hurricane orother strongwinds occur frequently TakingRunyangYangtzeRiver Bridge (RYRB) as a research object the contents andfunctions of WSHMS implemented on RYRB are introducedin detail The sensory subsystem and the core functionsof WSHMS are specifically illustrated Thereinto the corefunctions contain the finite element (FE) model updatingstructural condition identification and structural conditionassessment The research and establishment of WSHMSfor RYRB can provide references for the structural healthmonitoring of other cable-supported bridges located at thesimilar geographical regions and environment
2 Engineering Background
21 Descriptions of RYRB Located in the eastern area ofChina RYRB is near the entrance of the Yangtze River to theYellow Sea as shown in Figure 1 According to the longitudeand latitude the bridge site belongs to the southeastern partsof the Asian continent Taking account of the adaption oftransportation to the development of economy a super-hugeand complicated engineering (RYRB) is put into constructionin October 2000 After nearly five yearsrsquo harsh constructionRYRBwas finally completed and open to traffic inApril 2005
RYRB is an important lifeline engineering which firstlyestablishes the highway connection between Yangzhou andZhenjiang across the Yangtze River in Jiangsu Province ofChina It consists of two super-long-span cable-supportedbridges namely Runyang Suspension Bridge (RSB) andRunyang Cable-stayed Bridge (RCB) as shown in Figure 2RSB is a single-span hinged and simply supported steel-box-girder suspension bridge with a main span of 1490m Whenit was open to traffic in 2005 RSB was the first longestsuspension bridge in China and the third in the world Inaddition the central buckle is applied to increase the overallstiffness of RSB which is for the first time used in thesuspension bridge in China RCB is a steel-box-girder cable-stayed bridge with three spans (176m + 406m + 176m)double main towers and double cable planes
Shock and Vibration 3
(1) RSB (2) RCB
Figure 2 View of Runyang Yangtze River Bridge (RYRB)
121620242832
0 1 2 3 4Time (hour)
Win
d sp
eed
(ms
)
(a) Sample of Typhoon Haikui (2012-8-8T1200-2012-8-8T1600)
Time (hour)W
ind
spee
d (m
s)
0 1 2 3 405
10152025
(b) Sample of strong north wind (2009-12-03T0000-2009-12-03T0400)
Figure 3 Typical wind samples fromWSHMS on RYRB
Sensorysubsystem
Data acquisition subsystem
Data measurement system
Data transmission subsystem
Data management and analysis subsystem
Figure 4 The structure of WSHMS of RYRB
Fundamentalfunction
Data management and
analysis subsystem
Core function
Data processing
Data storage
Graphic display Conditionassessment
Condition
identification
FE model calibration
Figure 5 Structure of the functions of data management andanalysis subsystem
22 Wind Climate at the Bridge Site The RYRB site belongsto the mid-latitude zone According to the meteorologicalsurvey the bridge site is dominated by the humid southern
subtropical monsoon climate Monsoon circulation has asignificant influence on the seasonal changes of local weatherpatterns of RYRB site The monsoon circulation usuallyleads to obvious seasonal climate especially typhoon climatefrom eastern ocean in summer and the north wind fromSiberia in the northwest of China in winter Consideringthe performance of flexible structures in a strong windenvironment the wind-resistant stability of RYRB needs tobe paid intensive attention to during typhoons and strongwinds As a typical example Figure 3 shows the recordedwind samples of Typhoon Haikui in 2012 and strong northwind in 2009 from the WSHMS on RYRB
3 The Structure and Function ofWSHMS on RYRB
The WSHMS of RYRB contains four subsystems includ-ing sensory subsystem data acquisition subsystem datatransmission subsystem and data management and analysissubsystem (DMAS) as can be seen in Figure 4
The fundamental function of WSHMS on RYRB is real-ized by sensory subsystem which contains various trans-ducers to better understand the input loads and measureoutput structural responses In order to realize the recording
4 Shock and Vibration
AneGPS
GPSStr T Acc
Acc Str
Acc
Str
T
Acc GPS
GPSAcc
Acc
(1) Acc accelerometer (85) (2) Str stress gauge (72)(4) T temperature sensor (28)(3) Ane anemometer (2)
(5) GPS GPS receiver (8)
Lower reach
Upper reach
TStr
Acc
AccYangzhou GPS ZhenjiangAneAccGPSAcc
1490000Acc
GPS
Figure 6 Layout of sensor system of RSB (dimension unit mm)
StrAcc Str
Acc
Yangzhou Zhenjiang
Str
TAcc Str Str
StrTAcc
Str T
Acc
Acc
T
175400 406000 175400
Lower reaches
Upper reaches
(1) Acc accelerometer (15) (2) Str strain gauge (94)(3) T temperature sensor (24)
Figure 7 Layout of sensor system of RCB (dimension unit mm)
transformation and quantification of multifarious signalsources data acquisition subsystem has the functions tocollect measured data from sensory subsystem and conductadjustment and conversion of digital signals The measureddata will be transmitted to DMAS via data transmissionsubsystem which is constituted by web server optical switchmonitoring workstation and optical fiber network
As the most important part of theWSHMS on RYRB thefunctions of DMAS contain the data processing and storagegraphic display of detected signals progressive FE modelupdating condition identification and condition assessmentbased on the acquired data The first three functions arecomposed of the fundamental function of DMAS while theothers perform as the core function for structural healthassessment and decisionmakingThedetailed function struc-ture of DMAS can be seen in Figure 5
4 Sensory Subsystem of WSHMS on RYRB
The WSHMS is a technique which can provide struc-tural health conditions for decision making Based on theWSHMS the bridge supervisors can reasonably draw up
plans for bridge inspection and maintenance The maincontents and sensors layout of the WSHMS on RYRB aredeterminedmainly by the structural static and dynamic anal-yses the importance and durability of structural componentsthe structural characteristics the requirements of the systemfunctions and construction expenditure Figures 6 and 7show the sensor layout of RSB and RCB respectively Thenumber in the bracket represents the quantity of sensors
41 Sensors Layout of RSB
411 Main Cable and Suspender Monitoring The main cableis one of the most important components related to the safetyoperation of a suspension bridge Therefore 32 accelerom-eters were installed at 4 anchor rooms (8 accelerometersin each anchor room) to monitor the vibrations and fre-quencies of the typical cables and likewise the forces ofthe cables can be achieved based on the relation betweenthe cable tension and the vibration frequency The verticaland lateral vibration responses of the main cable weremonitored by 12 low-frequency single-axis accelerometersas shown in Figure 8 Considering the large quantity of thesuspenders the suspenders of RSB were periodically tested
Shock and Vibration 5
Yangzhou
12000 1200037500 37500
Zhenjiang
Downstream
Upstream
VerticalLateral
LZD2-4 LZD3-4LZD1-2 LZD2-3 LZD3-3 LZD4-2
LZD1-1
LZD2-2 LZD3-2
LZD3-1 LZD4-1LZD2-1
Figure 8 Layout of anemometers on the main cable of RSB
with additional field tests and the measurement results arebrought into the whole structural assessment system
412 Main Girder Monitoring Considering both of thestructural characteristics of the main girder the girdermonitoring mainly focuses on the overall line type stresstemperature and vibration The Global Positioning System(GPS) is demonstrated with an ability to accurately extractstatic and quasistatic displacements of the bridge inducedby ambient effects [12ndash15] thus 6GPS measuring points aresettled at 3 quartered sections to monitor the line type of themain girder as shown in Figure 6 The monitoring stationis set up near the GPS bench marks of China In order tomonitor the longitudinal displacement 4 linear displacementsensors are installed at two ends of the girder (two ineach end) Considering the optimization results of geneticalgorithm and the requirements of real-time modal analysis29 low-frequency single-axis accelerometers are installed at 9sections of the girder to monitor the vibration responses
Considering many factors such as structural deformationand stress layout under static loads symmetry of the struc-ture special design of the central buckle and optimizationanalysiswith the genetic algorithm 72 strain gauges includingfiber sensors vibrational chord strain gauges and weldingstrain gauges are installed at 5 sections of the main girderto monitor the structural stress status Since the temperaturehas a significant effect on the fatigue property of weldingsteel box girder [16] 28 temperature sensors were installedat 3 sections of the main girder to monitor the temperaturedistribution and changes Thereinto 12 temperature sensorsare installed on the 1198712 (119871 is the span of the RSB) sectionof RSB and 8 temperature sensors are installed on the sidesection individually
413 Main Tower Monitoring The main tower is the mostimportant element of a suspension bridge In order to moni-tor the vibration response of the two towers 6 accelerometersare uniformly installed at the upper crossing girder andthe mid crossing girder of each tower which is detailed inFigure 9 In addition 2GPS measuring points are settled at
Upstream Downstream
1400
056
050
1010
80
2035
80
3245
0
TZ1-2
TZ1-3
TZ1-5
TZ1-6
TZ1-1
TZ1-4
Lateral
Longitudinal
Figure 9 Layout of the accelerometers on the main tower of RSB(dimension unit mm)
6 Shock and Vibration
(a) WA15 (b) 1590-PK-020
Figure 10 Anemometers installed on RSB
the top of the two towers to monitor the displacements of thetowers
414 Wind Environment Monitoring Considering the typ-ical wind environment at the bridge site two kinds ofanemometers are installed on RSB to monitor the windvelocity and wind direction the WA15 anemometer fromthe Vaisala Company (Finland) and the 1590-PK-020 3Dultrasonic anemometer from the Gill Instruments Limited(England) TwoWA15 anemometers are used in theWSHMSof the RSB (Figure 10(a)) and three 1590-PK-020 3D ultra-sonic anemometers are installed only during strong winds(Figure 10(b)) All the anemometers can be utilized to analyzethe wind effects acting on RSB [17] One of the WA15anemometers is deployed on the top of the south tower(downstream) and the other in the middle of the main span(downstream) North wind is defined as 0∘ for anemome-ters data and clockwise rotation is defined as the positivedirection Long-term successful applications in meteorolog-ical studies have shown that the WA15 anemometers canwork effectively under all kinds of bad weather and acquireaccurate information about wind environment
The WA15 anemometers in WSHMS collect time historyof wind speed and direction with the frequency of 1Hz so itcan only provide average ormaximumdata about wind speedand direction Because of this limitation three 1590-PK-0203D ultrasonic anemometers are used in the field test duringthe strong winds The 1590-PK-020 anemometer has lightweight and small volumeThemaximum sampling frequencycan reach 32Hz Owing to the above features it is usedwidely in the wind testing of engineering structures Thesethree anemometers can be installed in other key positionsof the RSB during strong wind periods so that the windenvironment characteristics of strong winds can bemeasuredmore accurately and comprehensively
415 Traffic Loads Monitoring Due to the low precisionand high price of current vehicle load and vehicle velocitydynamic measurement system the system was not applied intheWSHMS of RSB Based on the data provided by the trafficsystem the vehicle loads and vehicle velocities on RSB weredetermined mainly by the traffic loads model which is builtby use of the statistical method
42 Sensors Layout of RCB
421 Cable Monitoring The stay cable is one of the mostimportant components in a cable-stayed bridge and its work-ing performance is closely related to the health status of theoverall structure Therefore the distribution and fluctuationof cable forces must be acquired accurately in order toanalyze the working condition of the cables and determinethe cable forces in FEmodel accordingly Like the suspendersof RSB the cable monitoring of RCB is complemented withadditional periodical field tests and then the measurementswill be integrated into the WSHMS afterwards
422 Main Girder Monitoring The main girder monitoringof RCBmainly contains the monitoring of stress distributionvibration status and temperature distribution and fluctua-tion As shown in Figure 7 15 low-frequency accelerometersare installed at 5 sections of the main girder to monitorthe vertical and lateral vibration responses 94 strain gaugesincluding fiber sensors vibrational chord strain gauges andwelding strain gauges are installed at 5 key sections tomonitorthe stress distribution on the steel box girder Consideringthe symmetry of RCB 24 temperature sensors are installedat 2 sections (1198712 section and side section near Zhenjiang) ofthe main girder to monitor the temperature distribution andfluctuation all year round
5 Progressive Finite ElementModel Updating of RYRB
An accurate and reliable FE model is essential for thestudies on wind resistance structural health monitoring andcondition assessment [18] Therefore establishing a baselineFE model is the research basis for any kind of numericalanalysis Many FE model updating techniques have beenproposed based on measured data in order to achieve an FEbaseline model suitable for the analysis object In most ofthe model updating approaches the FE baseline model of thestructure is obtained by reducing the error between the mea-sured structural response and the calculated response froma numerical model During the model updating procedurethe corresponding design parameters should be updatedsimultaneously Obviously too many design parameters may
Shock and Vibration 7
River wave
Ambient excitation
The free standing tower
Vibration responses
Design parameters
FE model
Modal analysis
Yes
No
Objective functionPenalty function
Boundary conditions
Updated parameters of the free standing tower
WindThe free standingtower stage
Microtremor
PP method
The first optimization method
SSI methodCheck
WSHMS
Modal identification
Additional sensors
middot middot middot
frequenciesCalculated n-order modal
frequenciesMeasured n-order modal
Error lt5
Figure 11 FE model updating of the free standing tower stage
decrease the updating efficiency and increase the complexityof model updating However a more accurate FE model willbe acquiredwhen takingmore input parameters into accountHence a tradeoff between the complicity of the optimizationand the accuracy of the numerical model has to be made
Being aware of the aforementioned limitations of modelupdating technique a three-stage model updating strategyis proposed for the application in the progressive FE modelupdating of RYRB Among the three-stage model updatingstrategy the first two stages will provide an initial baseline FEmodel for the operation stage [18]
51 The Free Standing Tower Stage When the main towerof RYRB is completed a field test is conducted to examinethe structural status The accelerometers in WSHMS and theadditional sensors can record its vibration responses from
ambient excitation such as river waves wind and groundmicrotremor Based on the measured structural vibrationresponses the structural modal parameters are identified bythe peak picking (PP) method The identification results arethen validated and complemented by the stochastic subspaceidentification (SSI) method Considering the importance oflow order modes the first 119899 modal frequencies are takeninto the model updating process Other acquired modalfrequencies will be used to validate the updated FE modelafterwards
With the initial structural parameters a FE model of thefree standing tower can be establishedThe cross-section areamoment of inertia material density and elastic modulus aretaken as the updating parameters based on the parametersensitivity analysis The first 119899 modal frequencies of thetower can be calculated by modal analysis and the error
8 Shock and Vibration
Temperature
Ambient excitation
Full bridge
Vibration responses
Design parameters
FE model
Modal analysis
Objective functionBoundary conditionsPenalty function
Updated parameters of the main girder and cable
Updated parameters of
No
Yes
the free standing tower
WindFull-bridge stage Microtremor
Updated FE model
WSHMSAdditionalsensors
PP method SSI methodCheck
Modal identification
The first optimization method
middot middot middot
Measured n-order modalfrequencies
Calculated n-order modalfrequencies
Error lt5
Figure 12 FE model updating of full-bridge stage
between each corresponding calculated andmeasuredmodalfrequency is defined as a state variable specified as
Error =1003816100381610038161003816119891119888 minus 119891119898
1003816100381610038161003816
119891119898
(1)
where 119891119888is the calculated modal frequency and 119891
119898is the
measured modal frequencyIf each error between calculated and measured modal
frequency is below the acceptable level 5 the structuralparameters would be permitted for the updated FE modelotherwise a parameter optimization procedure will be carriedout In the procedure the model updating problem is trans-formed into amultiobjective nonlinear optimization problem
under constraints of equality and inequality An objectivefunction is proposed as the sum of the square of errorsbetween the calculated and measured frequencies multipliedby corresponding weighing factors detailed as
119869 =
119899
sum
119894=1
1205931198941198642
119894
(119894 = 1 2 119899)
120593119894=1198642
119894
sum119899
119894=1
1198642
119894
(119894 = 1 2 119899)
(2)
where 119869 is the objective function 120593119894is the weighing factor
119864119894is the error between calculated and measured value of the119894th modal frequency Taking the boundary conditions into
Shock and Vibration 9
Temperature WindAmbient excitation
MicrotremorVehicle
Full bridge
WSHMS
PP method SSI methodCheck
Modal identification
Vibration responses
Updated parameters
Updated FE model
Modal analysis
Objective function Boundary
The first optimization method
conditions
Penalty function
Updated parameters of the main tower
FE modelReal-time updated
Updated parameters of the main girder and cable
No
Yes Yes
Operation stage middot middot middot
Error lt5
Measured n-order modalfrequencies
Calculated n-order modalfrequencies
Figure 13 FE model updating of the operation stage
the objective function with penalty function the updatedstructural parameters of the free standing tower can beacquired by the first optimization method [18] The detailedcalibration process can be seen in Figure 11
52 Full-Bridge Stage In the second stage structural parame-ters of the steel girder and themain cable will be updated afterthe construction of RYRB is finished The model updatingprocedure is similar to that of the free standing tower Basedon the parameter sensitivity analysis the selected updatingparameters contain the material density elastic modulusand moment of inertia of the steel girder as well as thematerial density and elastic modulus of the main cable Inthe establishment of the FE model of full bridge the updatedstructural parameters of the free standing tower are employedand they are kept constant during the calibration procedureIn the stage the first 119899modes contain vertical bending lateralbending and torsionalmodes of themain girder as well as thelongitudinal bending lateral bending and torsional modesof the main tower After the process in Figure 12 the updatedparameters of the main girder and cable can be obtained andan initial FE model with the updated parameters of the fullbridge will be finally established
Before RYRB was open to the traffic a field load testis conducted and the corresponding static responses can beaccurately recorded by WSHMS Taking the same loadingscheme the structural deformation and stress distributionunder the static and dynamic loads can be calculated withthe FE model The measured structural responses during thefield load test can be employed to validate the reliability of theacquired FE model so that an initial baseline FE model canbe provided to the operation stage
53 Operation Stage Compared to construction stage RYRBsuffers from additional vehicle actions and continuous envi-ronmental loads in its long service period Hence theperformance deterioration and partial damage will inevitablyoccur in some structural components which may causethe variation of structural dynamic characteristics A real-time FE model which can reflect the structural materialand performance deterioration really needs to be establishedfor structural condition assessment To make the FE modelaccurate and reliable during its whole life cycle the real-timerecorded data fromWSHMS are employed for validating thereal-time updated FE model Similar to construction stagethe FE model updating of RYRB in operation stage is shownin Figure 13
10 Shock and Vibration
RYRB and WSHMS
Data acquisition
Primary diagnosis
Eigenvector extraction(modal parameters)
Going normal
Identifying damage location
Evaluating damage grade
Further diagnosis
Serious
Partial maintenance
Maintenance
Yes No
Yes
No
Stop operating
Figure 14 Condition identification strategy of RYRB
6 Condition Identification of RYRB
One of the most important objectives of the WSHMS isto diagnose the damage and health condition of structuresduring service period Large quantities of real-time data canbe acquired from the WSHMS which makes the existingproblem for structural condition identification is how toconvert the structural responses into the structural healthinformation Condition identification theory or method isjust the way to diagnose structural abnormal state or damageMany researches on structural condition identification usingthe field tests have been conducted and the efficiencyof structural condition identification based on static anddynamic responses has been validated by experiments [19ndash23]
The structural condition identification strategy inWSHMS of RYRB is shown in Figure 14 Based on theWSHMS the structural responses will be recorded andtransmitted to DMAS [24] Some eigenvectors which candescribe structural damage status will be extracted from theacquired data Hereinto modal parameters including modefrequencies mode shapes and damping ratios are selected asthe eigenvectors Furthermore the modal assurance criteria(MAC) are adopted as the damage indicator to increasethe sensitivity of modal parameters to structural damageThe structural condition identification is classified into twoordinal phases one is primary diagnosis with statisticalanalysis technique and the other is further diagnosis withneural networkThe primary phase only briefly distinguisheswhether the modal parameters are abnormal or not whilethe further phase will determine the damage location andevaluate the damage grade Finally whether a practical
Measured data
Compare Eigenvector extraction(modal parameters)Primary diagnosis
Eigenvectordatabase
Figure 15 Primary damage diagnosis of RYRB
maintenance is needed would be determined by the struc-tural damage degree
61 PrimaryDiagnosis Based on Statistical Analysis TechniqueThe efficiency of primary diagnosis relies on two factors theextracted eigenvectors and the eigenvector database Sincethe completion of RYRB modal parameters of normallyoperated structure have been gradually accumulated fromWSHMS And an eigenvector database is set up with thestatistical analysis result of accumulated modal parametersTherefore the primary diagnosis will depend on the compar-ison between the real-time extracted modal parameters andthe eigenvector database The primary diagnosis process canbe seen in Figure 15
62 Further Diagnosis Based on Neural Network Due to thelarge scale of engineering structure and the randomness ofinfluence factor it is difficult to accurately acquire all theeffective data related to local damage Hence many conditionidentification methods lose their own efficacies But neuralnetwork accompanied by genetic algorithm can effectively
Shock and Vibration 11
Baseline FE model Representative damage pattern
Simulated damage
FE Model analysis and data preprocess
parametersMeasured damage
parameters
Satisfied
Network training and testing
Damage location
Trained network
Damage grade
WSHMS
Damage State
Measured parameters
Damage database
No
(training data)
Yes
Prep
are s
tage
for
trai
ning
dat
a
Con
struc
tion
stage
of
net
wor
kC
ondi
tion
iden
tifica
tion
stag
e
Additional field test
Figure 16 Further damage diagnosis based on neural networks
explain the variation of structural state no matter fromintuitive thinking or from uncertain reasoning on accountof its strong fault tolerance robustness and generalizationability Meanwhile the development of computer techniquesmakes the computational efficiency rapidly increased whichmakes it feasible to diagnose the health status of engineeringstructures
In the further condition identification of RYRB BPneural network is utilized to reflect the relationship betweenstructural damage pattern and its characteristics and furtheridentify the damage location combined with the analyses of
structural damage status The further damage diagnosis ofRYRB is divided into three stages as shown in Figure 16
The first stage aims to prepare training data for the neuralnetwork with the combination of FE analyses and field mea-surements With the real-time baseline FE model providedby the model updating and representative damage patternsthe structural parameters embodying partially damage canbe well simulated Based on the measured parameters fromthe WSHMS a damage database which stores the trainingdata for neural network would be established During thesecond stage the topological structure of BP neural network
12 Shock and Vibration
MC simulationSensitivities
Correlations
RS simulation
100000 times Fit the failure MC simulationStructural reliability
The first step The second step
The third step
variablesDecide significant
Get the sampling points needed
response surface
N times
50sim200 times
Figure 17 The flow chart of the combined simulation method
is constructed and the network is trained with the sample setfrom the damage database If the trained network satisfieswith the accuracy requirement it can be employed to servefor the third stage The third stage is to assess the damagestate of RYRB Structural damage location and grade canbe achieved by inputting the measured modal parametersinto the trained BP neural network model In order toaccurately and reliably recognize the real structural damagestate including damage location and damage grade someadditional field tests should be conducted near the possibledamage locations
7 Condition Assessment of RYRB
Safe and reliable operation of bridges has become a majorconcentration of both civil engineers and the governmentHowever whether current technologies and operational pro-cedures can ensure the necessary serviceability the cost-effective maintenance and management of bridges still lackan explicit evaluating criterion These limitations in currentpractice can be overcome by emerging concepts and toolsfor accurate condition assessment of civil infrastructures[25] Conventional bridge condition assessment is gener-ally conducted with measured data from visual inspectionwhich has been proved to be limited and subjective Thedevelopment of structural health monitoring provides a newvaluable practice into structural condition assessment Withplentiful data acquired from the SHMS the condition of in-service bridge structures and insights into actual behavior ofbridges under in-service environment can be well recognizedbased on reliability condition assessment methods [26 27]Considering integral security and the fatigue characteristic ofsteelmaterial the condition assessment of RYRB is composedof structural reliability assessment and structural fatigueassessment [24]
71 Structural Reliability Assessment In the structural reli-ability assessment of RYRB the core part is a combinednumerical simulation method which has the advantages oftheMonte Carlo (MC)method and the response surface (RS)method The main procedure can be seen in Figure 17
The combined method mainly contains the followingsteps Firstly the MC method is used to compute the prob-abilistic sensitivities and the correlations between randomvariables (input variables) with 50sim200 times of samplingsIn this way the variables that have more significant effect on
the output index can be determined according to probabilisticsensitivity analysis The comparatively important input vari-ableswill be kept for following processwhile the otherswill beomittedThen the failure response surface of different outputvariables can be fitted through RS simulation Finally theMCmethod (100000 times of samplings) will be used again to getthe structural probability of eachmain failure mode based onthis response surface
Combined with monitored data from WSHMS thedetailed reliability assessment of RYRB is shown in Figure 18The whole procedure is mainly divided into three specificparts In the input module the environment information andvehicle loads will be processed with statisticalmethod so thatthe statistical value of external actions can be input to theevaluating model afterwards If some structural damage hasoccurred and been examined by the monitoring system thedamage information can be delivered to the evaluatingmodelas well In the simulation module the combined simulationmethod aforementioned and the updated FE model will beutilized to calculate the reliability of each main failure modeIn the output module the max stress of girder cable andcentral buckle themax vertical and horizontal displacementsof girder and the max horizontal displacements of the towerwill be displayed The reliability of the member with extremeresponses will be evaluated and the serial number of theperilous member will be recorded with a label According tothe probability index the structural reliability state and thesuggested maintenance action can be given
72 Structural Fatigue Assessment Fatigue is a prominentproblem that exists in steel structures [28 29] If the stressfluctuates obviously stress far less than yield strength cancause the failure of steel members In the fabrication ofsteel structures welding is one of the most frequently usedapproaches but welded joints in steel structures are vulnera-ble to failure by fatigue for the inner flaws or discontinuities[16 30] Considering the fatigue accumulation in weldedjoints of the steel box girder the structural fatigue assessmentof RYRB mainly focuses on the plentiful welded jointsbetween each segment of the deck The structural fatigueassessment can be seen in Figure 19
Based on the online original data of strain acquiredfrom WSHMS of RYRB the recorded data in time domaincan be transformed into statistical information at frequencydomain with FFT technique Usingmultiple linear regressionmethod a representative sample of strain time-history can be
Shock and Vibration 13
Wind Vehicles Temperature Girder Cable Others
Monitoring damageExternal actions
Probability analysis FE model
girderMax stress of
cableMax stress of
Numerical simulation based on the combined simulation method
Max stress of central buckle
Max vertical and horizontal displacements of girder
Max horizontal displacement of tower
Reliability of the member with extreme response
Input Input
Serial number of the perilous member
Statistical value of external actions
Monitoreddamage
Stress
Displacement
Reliability
Output
Input
Simulation
Output
Figure 18 Reliability assessment of RYRB
obtained Then the rain-flow counting method is utilized todetermine the stress spectrum of the representative sampleSince the measured stress is the nominal stress at the locationof the gauge it should be modified with coefficient to obtainthe hot-spot stress at the toe of weldThe primary assessmentof fatigue life is undertaken based on BS5400 [31] and amodified probability model is proposed as well Combinedwith continuumdamagemechanics (CDM)model andminermodel the reliability assessment of fatigue life on RYRB willbe conducted comprehensively Hence the periodic inspec-tion and maintenance scheme for RYRB can be formulatedreasonably
8 Summary and Conclusion
This paper introduces the establishment of a WSHMS forRYRB in China and the composition and functions of theWSHMS are presented The WSHMS of RYRB contains foursubsystems including sensory subsystem data acquisitionsubsystem data transmission subsystem andDMAS Specifi-cally the sensory subsystem which is utilized to measure theinput actions and structural output responses and the corefunctions of the DMAS including model updating structuralcondition identification and structural condition assessmentare illustrated in detail
A three-stage model updating strategy is proposed forthe progressive FE model updating of RYRB Thereintothe measured structural static and dynamic responses areadopted to acquire the target benchmarks of RYRB andthe first-order optimization method is used to enhance thecomputing rate of convergence Among the proposed three-stagemodel updating strategy the first two stages can providean initial baseline FE model for the operation stage and theoperation stage offers a real-time FE model for structuralcondition identification and assessment
In the WSHMS of RYRB a two-phase strategy is pro-posed to carry out the structural damage diagnosis anddamage location identification The primary diagnosis phasebriefly distinguishes whether the measured parameters andresponses are abnormal or not while the further diagnosisphase will determine the damage location and evaluate thedamage grade On the basis of structural damage degreewhether a practical maintenance is needed or not can bedecided
Considering the integral security and the fatigue charac-teristic of steel structures the condition assessment of RYRBis composed of structural reliability assessment and structuralfatigue assessment Structural reliability assessment serveswith a combined numerical simulation method taking theadvantages of both theMonte Carlomethod and the response
14 Shock and Vibration
Original strain data recorded bystrain gauge
Time history curves of strain
Statistical information attime domain
Statistical information at frequency domain
Daily stress spectrum by rain-flow counting method
Representative sample of strain time-history
Hot-spot stress history at the toe of weld
Hot-spot stress spectrum at the toe of weldPrimary assessment of fatigue life
based on BS5400
Modified probability modelCDM model Miner model
Comprehensive reliability assessment of fatigue life
Figure 19 Structural fatigue assessment of RYRB
surface method while structural fatigue assessment is a com-prehensive evaluation with empirical and modified modelbased on real-time measurements fromWSHMS
Conflict of Interests
The authors declare that there is no conflict of interestsregarding the publication of this paper
Acknowledgment
The supports from the National Science Foundation ofChina (Grant nos 51378111and 51438002) the Major StateBasic Research Development Program of China for YoungScientists (973 Program Grant no 2015CB060000) theProgram for New Century Excellent Talents in University ofMinistry of Education of China (Grant no NCET-13-0128)the FokYing-Tong Education Foundation for Young Teachersin the Higher Education Institutions of China (Grant no
142007) the Jiangsu TransportationDepartment (Grants nos2011Y09-2 and 2011Y03) the Natural Science Foundationof Jiangsu (Grant no BK2011611) and the FundamentalResearch Funds for the Central Universities (Grant no2242012R30002) are greatly acknowledged The authors alsowould like to acknowledge the Construction CommandingDepartment of Jiangsu Provincial Yangtze River HighwayBridge and the Structural Health Monitoring Institute ofSoutheast University
References
[1] A E Aktan F N Catbas K A Grimmelsman and C J TsikosldquoIssues in infrastructure health monitoring for managementrdquoJournal of Engineering Mechanics vol 126 no 7 pp 711ndash7242000
[2] J P Ou and H Li ldquoRecent advances of structural healthmonitoring in Mainland Chinardquo in Proceedings of the ANCERAnnual Meeting 2004
Shock and Vibration 15
[3] H Li J Ou X Zhao et al ldquoStructural healthmonitoring systemfor the Shandong Binzhou Yellow River Highway BridgerdquoComputer-AidedCivil and Infrastructure Engineering vol 21 no4 pp 306ndash317 2006
[4] A S Kiremidjian E G Straser T H Meng et al ldquoStructuraldamage monitoring for civil structuresrdquo in Proceedings of theInternational Workshop on Structural Health Monitoring pp371ndash382 1997
[5] J M Ko and Y Q Ni ldquoStructural health monitoring and intelli-gent vibration control of cable-supported bridges research andapplicationrdquo KSCE Journal of Civil Engineering vol 7 no 6 pp701ndash716 2003
[6] J P Ou ldquoSome recent advances of structural health monitoringsystems for civil infrastructure in mainland Chinardquo in Proceed-ings of the Symposium onNetwork and Center-based Research forSmart Structures Technologies and Earthquake Engineering pp131ndash144 Tokyo Japan 2003
[7] H N Li D S Li and G B Song ldquoRecent applications offiber optic sensors to health monitoring in civil engineeringrdquoEngineering Structures vol 26 no 11 pp 1647ndash1657 2004
[8] B Chen S L Zhao and P Y Li ldquoApplication of Hilbert-Huang transform in structural health monitoring a state-of-the-art reviewrdquoMathematical Problems in Engineering vol 2014Article ID 317954 22 pages 2014
[9] B F Spencer and S Cho ldquoWireless smart sensor technologyfor monitoring civil infrastructure technological developmentsand full-scale applicationsrdquo in Proceedings of theWorld Congresson Advances in Structural Engineering andMechanics pp 18ndash22Seoul Republic of Korea 2011
[10] Y L Xu and W S Chan ldquoWind and structural monitoring oflong span cable-supported bridges with GPSrdquo in Proceedings ofthe 7th Asia-Pacific Conference on Wind Engineering (APCWErsquo09) Taibei China November 2009
[11] B Chen Y L Xu and X Zhao ldquoIntegrated vibration controland health monitoring of building structures a time-domainapproachrdquo Smart Structures and Systems vol 6 no 7 pp 811ndash833 2010
[12] Y FujinoMMurata S Okano andM Takeguchi ldquoMonitoringsystem of the Akashi Kaikyo Bridge and displacementmeasure-ment using GPSrdquo in 4th Nondestructive Evaluation of HighwaysUtilities and Pipelines vol 3995 of Proceedings of SPIE pp 229ndash236 Newport Beach Calif USA March 2000
[13] S Nakamura ldquoGPS measurement of wind-induced suspensionbridge girder displacementsrdquo Journal of Structural Engineeringvol 126 no 12 pp 1413ndash1419 2000
[14] T H Yi H N Li and M Gu ldquoWavelet based multi-stepfiltering method for bridge health monitoring using GPS andaccelerometerrdquo Smart Structures and Systems vol 11 no 4 pp331ndash348 2013
[15] T H Yi H N Li and M Gu ldquoExperimental assessment ofhigh-rate GPS receivers for deformation monitoring of bridgerdquoMeasurement vol 46 no 1 pp 420ndash432 2013
[16] T Guo A Q Li and J H Li ldquoFatigue life prediction of weldedjoints in orthotropic steel decks considering temperature effectand increasing traffic flowrdquo Structural Health Monitoring vol 7no 3 pp 189ndash202 2008
[17] H Wang A Li J Niu Z Zong and J Li ldquoLong-term moni-toring of wind characteristics at Sutong Bridge siterdquo Journal ofWind Engineering and Industrial Aerodynamics vol 115 pp 39ndash47 2013
[18] H Wang A Li and J Li ldquoProgressive finite element modelcalibration of a long-span suspension bridge based on ambient
vibration and static measurementsrdquo Engineering Structures vol32 no 9 pp 2546ndash2556 2010
[19] KDHjelmstad and S Shin ldquoDamage detection and assessmentof structures from static responserdquo Journal of EngineeringMechanics vol 123 no 6 pp 568ndash576 1997
[20] B H Oh and B S Jung ldquoStructural damage assessment withcombined data of static and modal testsrdquo Journal of StructuralEngineering vol 124 no 8 pp 956ndash965 1998
[21] R Brincker L Zhang and P Andersen ldquoModal identification ofoutput-only systems using frequency domain decompositionrdquoSmart Materials and Structures vol 10 no 3 pp 441ndash445 2001
[22] L M Khoo P R Mantena and P Jadhav ldquoStructural damageassessment using vibration modal analysisrdquo Structural HealthMonitoring vol 3 no 2 pp 177ndash194 2004
[23] S H Sim B F Spencer and T Nagayama ldquoMultimetricsensing for structural damage detectionrdquo Journal of EngineeringMechanics vol 137 no 1 pp 22ndash30 2011
[24] A Q Li Y L Ding H Wang and T Guo ldquoAnalysis andassessment of bridge health monitoring mass datamdashprogressin researchdevelopment of ldquoStructural Health MonitoringrdquordquoScience China Technological Sciences vol 55 no 8 pp 2212ndash2224 2012
[25] A E Aktan D N Farhey D L Brown et al ldquoConditionassessment for bridge managementrdquo Journal of InfrastructureSystems vol 2 no 3 pp 108ndash117 1996
[26] M Liu D M Frangopol and S Kim ldquoBridge system perfor-mance assessment from structural health monitoring a casestudyrdquo Journal of Structural Engineering vol 135 no 6 pp 733ndash742 2009
[27] H W Xia Y Q Ni K Y Wong and J M Ko ldquoReliability-based condition assessment of in-service bridges using mixturedistribution modelsrdquo Computers amp Structures vol 106-107 pp204ndash213 2012
[28] Z W Chen Y L Xu Y Xia Q Li and K Y Wong ldquoFatigueanalysis of long-span suspension bridges under multiple load-ing case studyrdquo Engineering Structures vol 33 no 12 pp 3246ndash3256 2011
[29] Z W Chen Y L Xu and X M Wang ldquoSHMS-based fatiguereliability analysis of multiloading suspension bridgesrdquo Journalof Structural Engineering vol 138 no 3 pp 299ndash307 2012
[30] Z X Li T H T Chan and T Q Zhou ldquoAccumulativedamage near crack tip for welded bridge members fatigue lifedeterminationrdquoTheoretical andApplied FractureMechanics vol43 no 2 pp 245ndash260 2005
[31] BS5400 B S I Part 10 Code of Practice for Fatigue 1982
International Journal of
AerospaceEngineeringHindawi Publishing Corporationhttpwwwhindawicom Volume 2014
RoboticsJournal of
Hindawi Publishing Corporationhttpwwwhindawicom Volume 2014
Hindawi Publishing Corporationhttpwwwhindawicom Volume 2014
Active and Passive Electronic Components
Control Scienceand Engineering
Journal of
Hindawi Publishing Corporationhttpwwwhindawicom Volume 2014
International Journal of
RotatingMachinery
Hindawi Publishing Corporationhttpwwwhindawicom Volume 2014
Hindawi Publishing Corporation httpwwwhindawicom
Journal ofEngineeringVolume 2014
Submit your manuscripts athttpwwwhindawicom
VLSI Design
Hindawi Publishing Corporationhttpwwwhindawicom Volume 2014
Hindawi Publishing Corporationhttpwwwhindawicom Volume 2014
Shock and Vibration
Hindawi Publishing Corporationhttpwwwhindawicom Volume 2014
Civil EngineeringAdvances in
Acoustics and VibrationAdvances in
Hindawi Publishing Corporationhttpwwwhindawicom Volume 2014
Hindawi Publishing Corporationhttpwwwhindawicom Volume 2014
Electrical and Computer Engineering
Journal of
Advances inOptoElectronics
Hindawi Publishing Corporation httpwwwhindawicom
Volume 2014
The Scientific World JournalHindawi Publishing Corporation httpwwwhindawicom Volume 2014
SensorsJournal of
Hindawi Publishing Corporationhttpwwwhindawicom Volume 2014
Modelling amp Simulation in EngineeringHindawi Publishing Corporation httpwwwhindawicom Volume 2014
Hindawi Publishing Corporationhttpwwwhindawicom Volume 2014
Chemical EngineeringInternational Journal of Antennas and
Propagation
International Journal of
Hindawi Publishing Corporationhttpwwwhindawicom Volume 2014
Hindawi Publishing Corporationhttpwwwhindawicom Volume 2014
Navigation and Observation
International Journal of
Hindawi Publishing Corporationhttpwwwhindawicom Volume 2014
DistributedSensor Networks
International Journal of
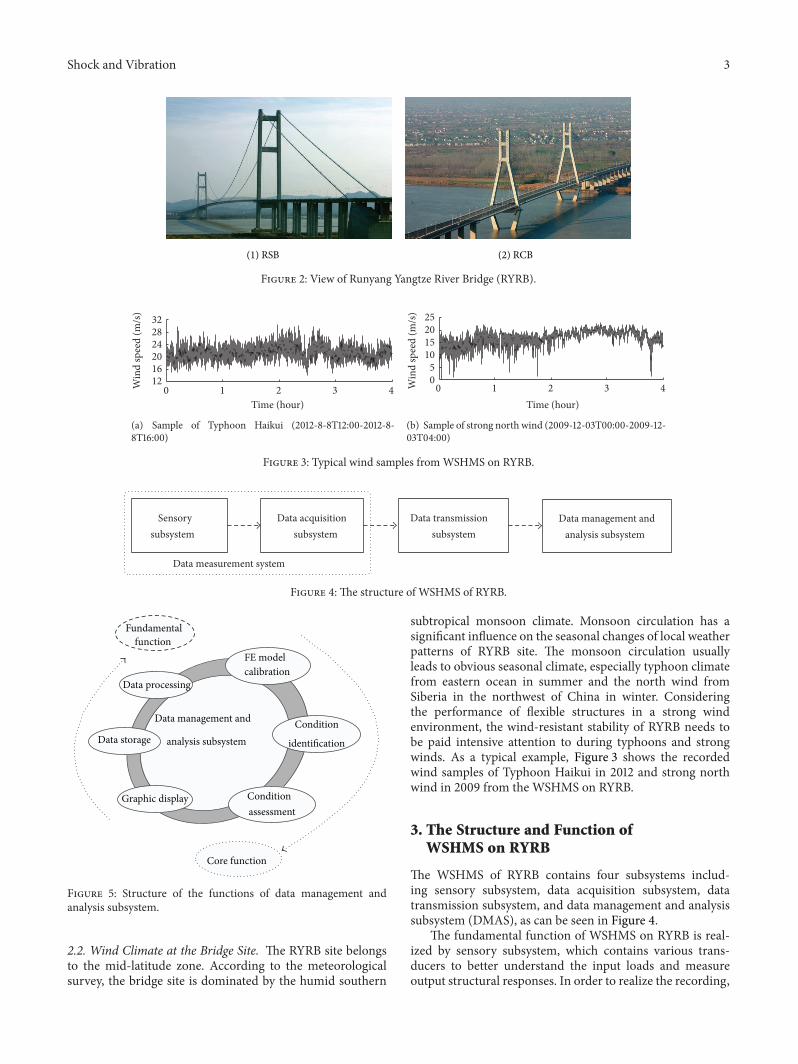
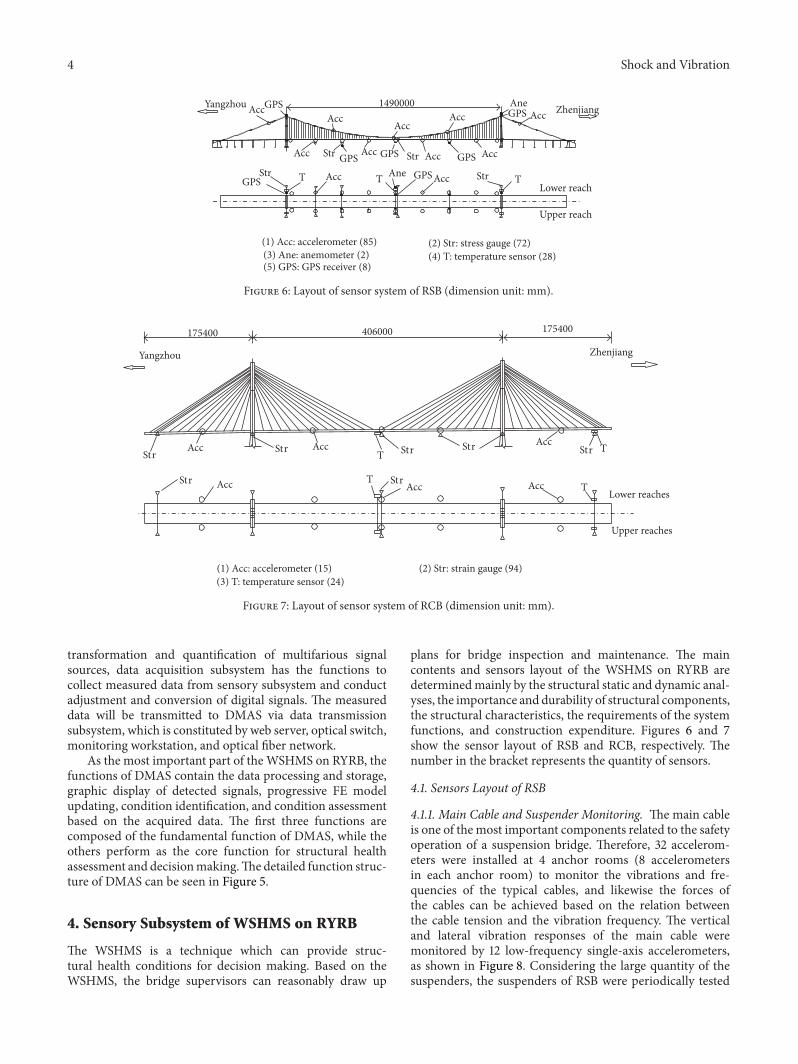
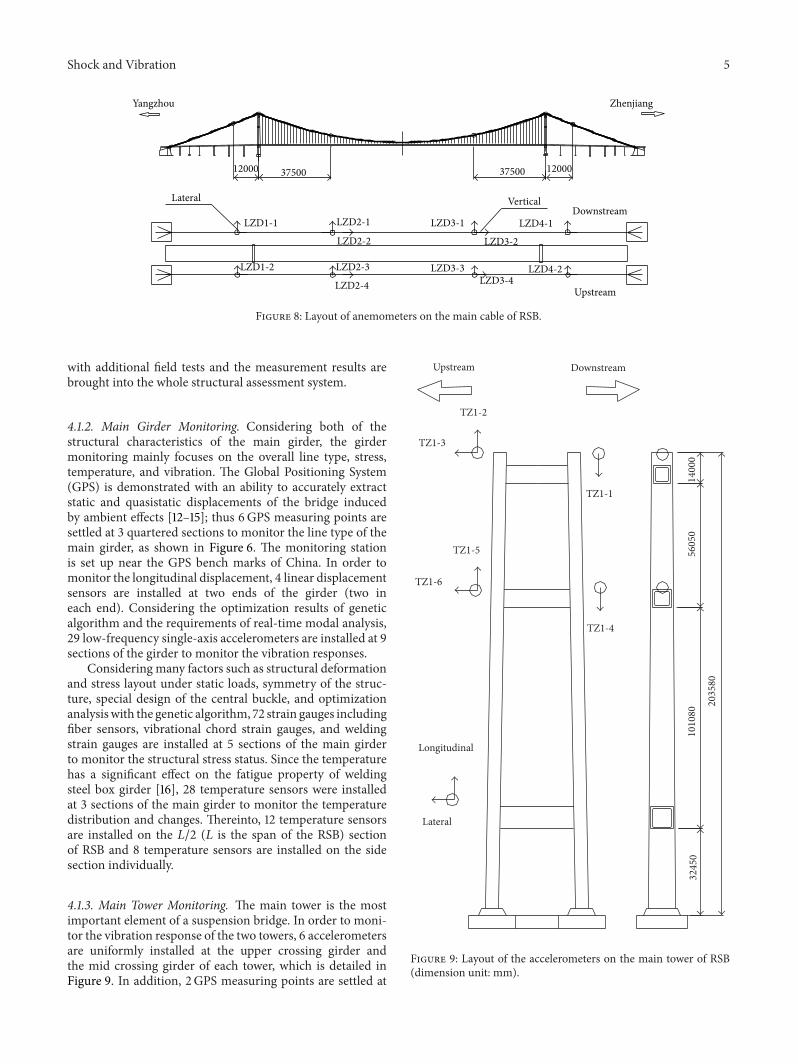
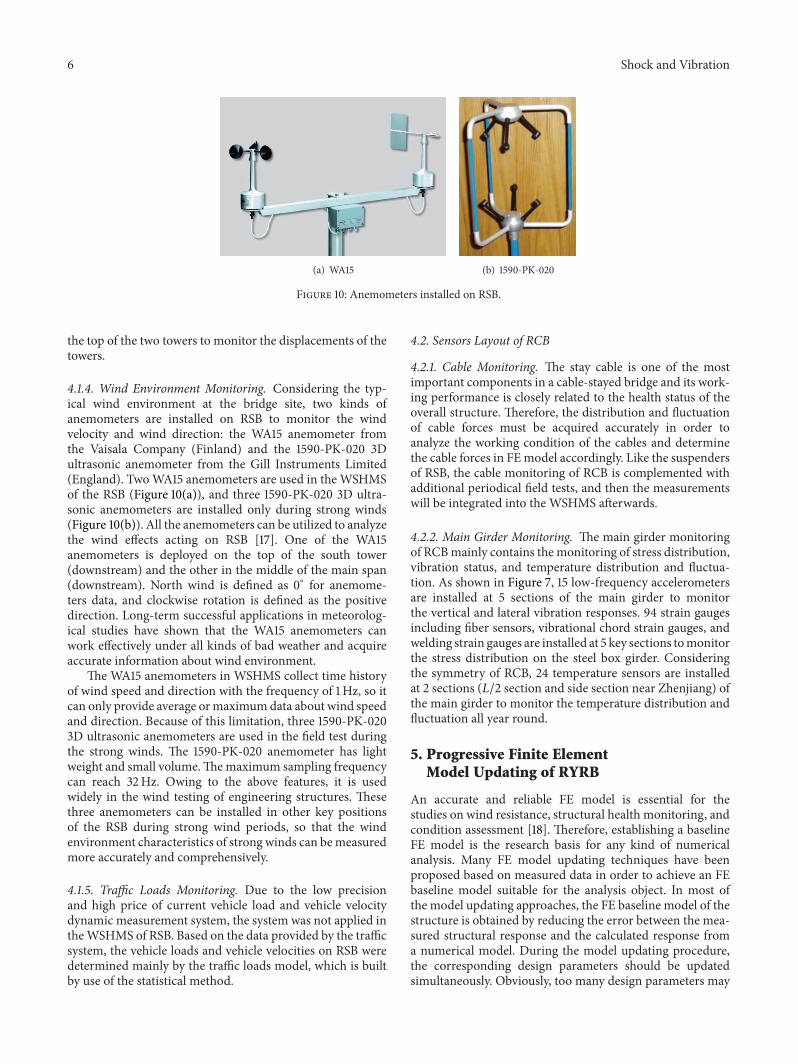
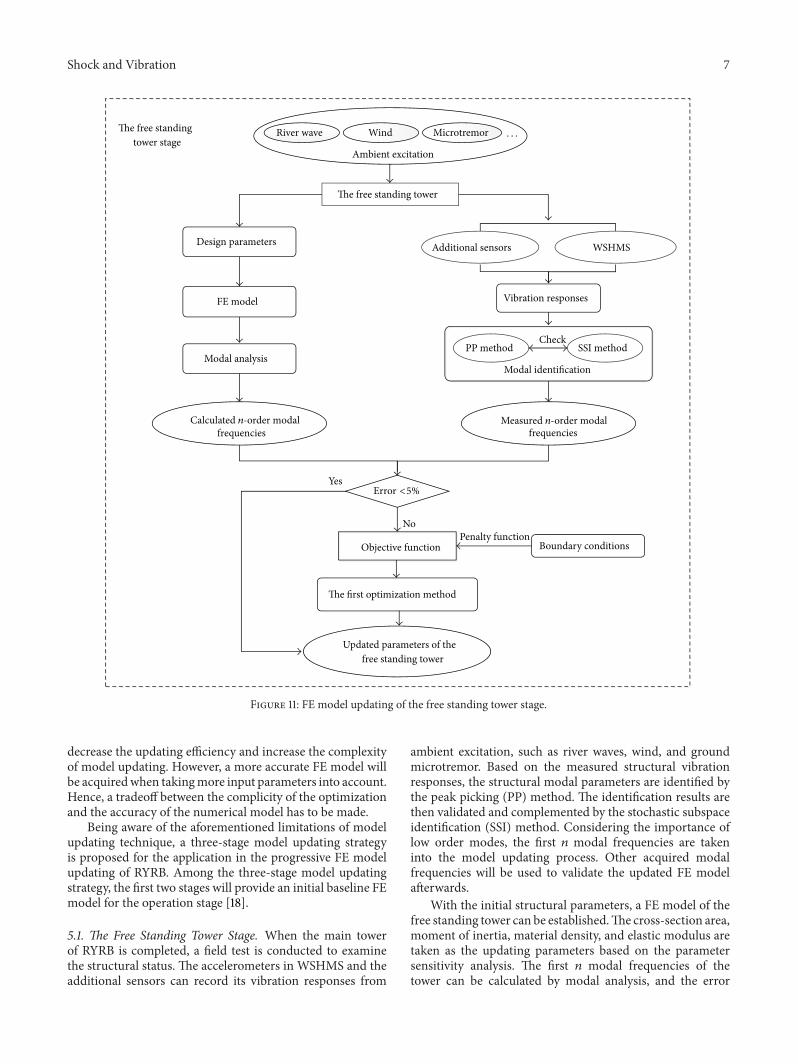
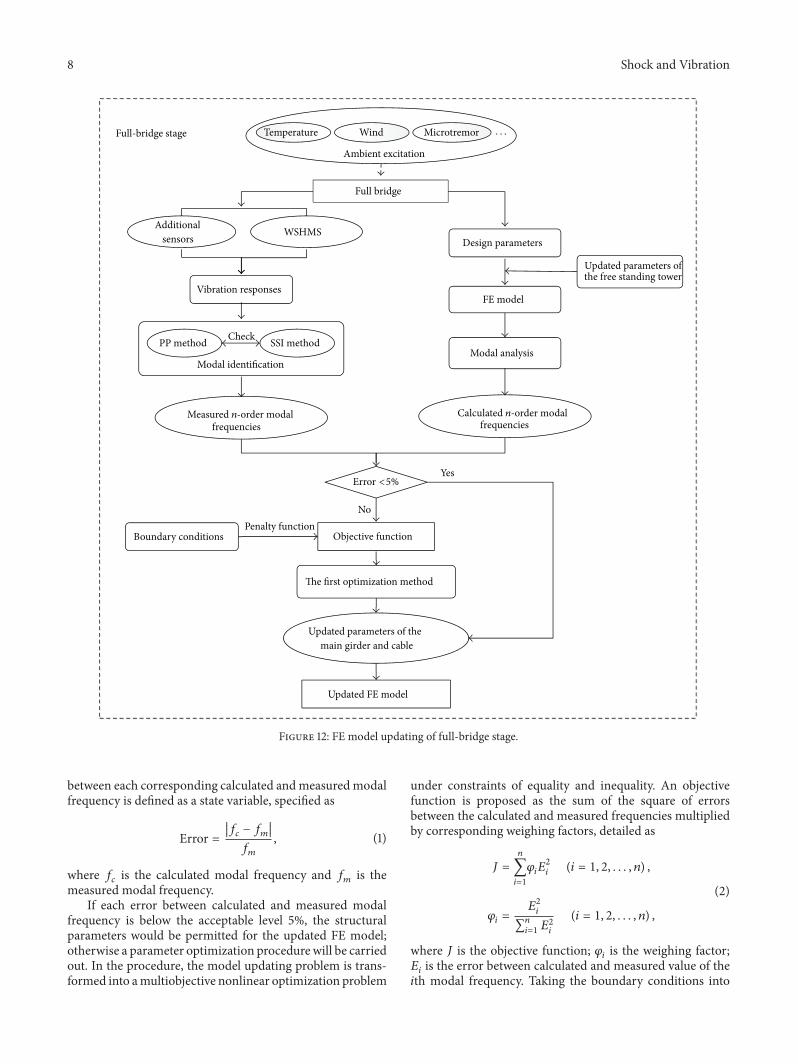
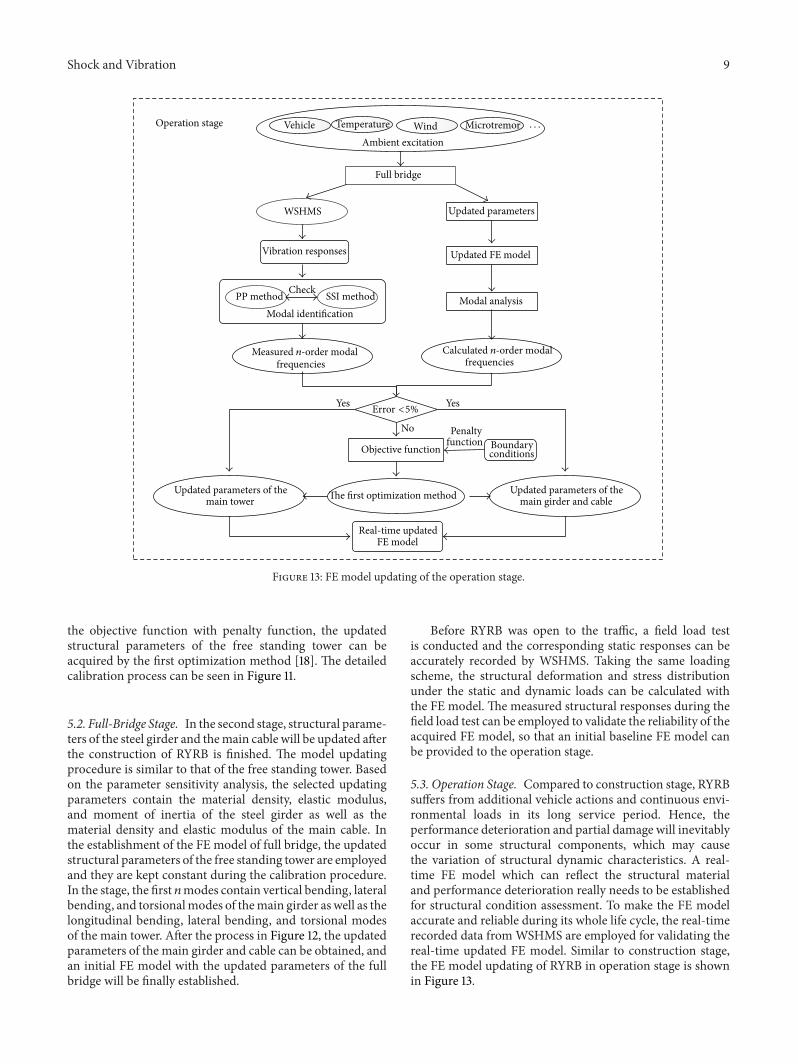
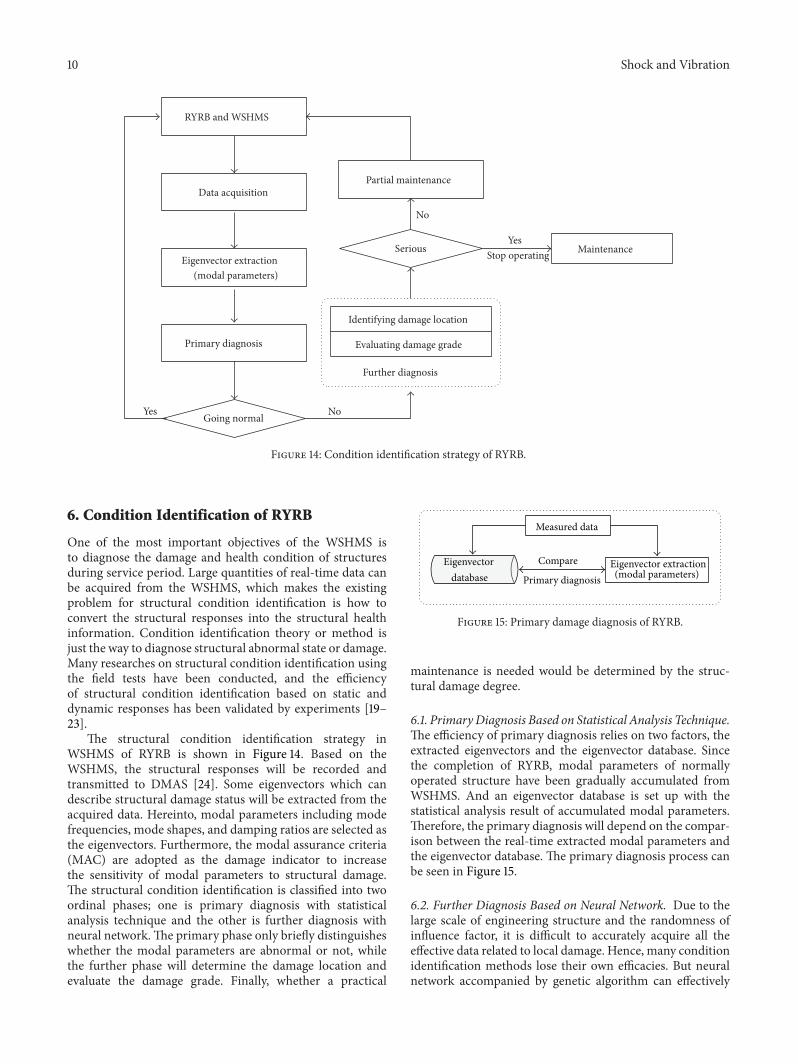
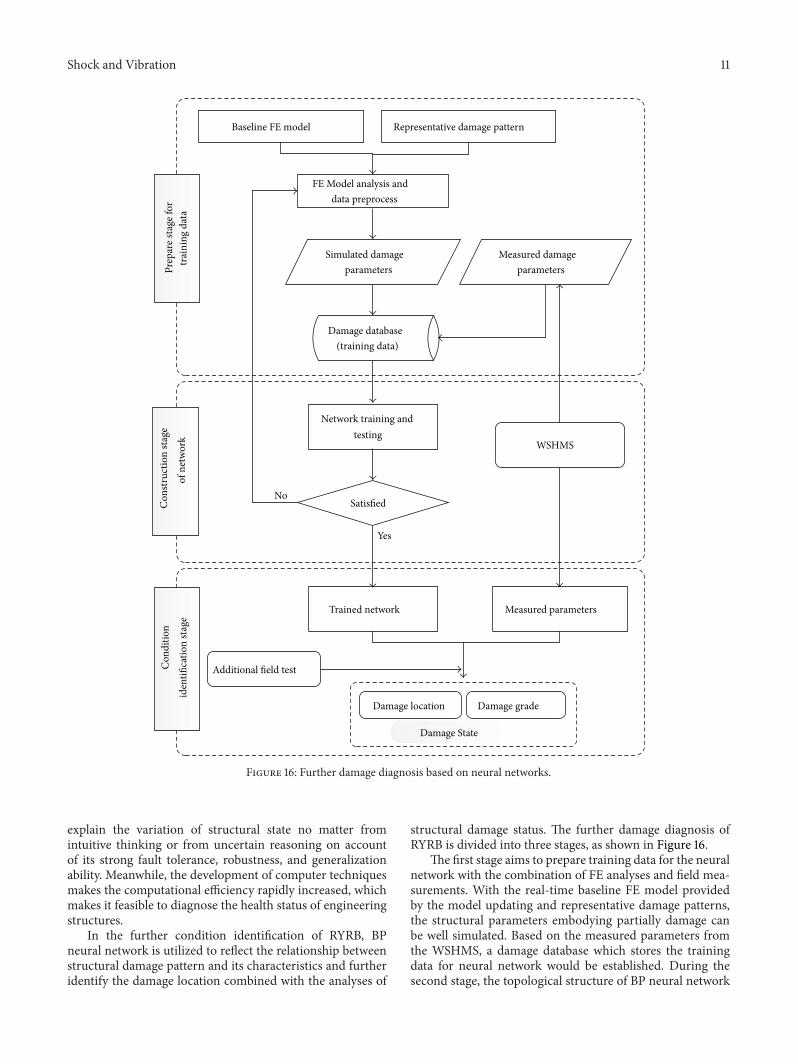
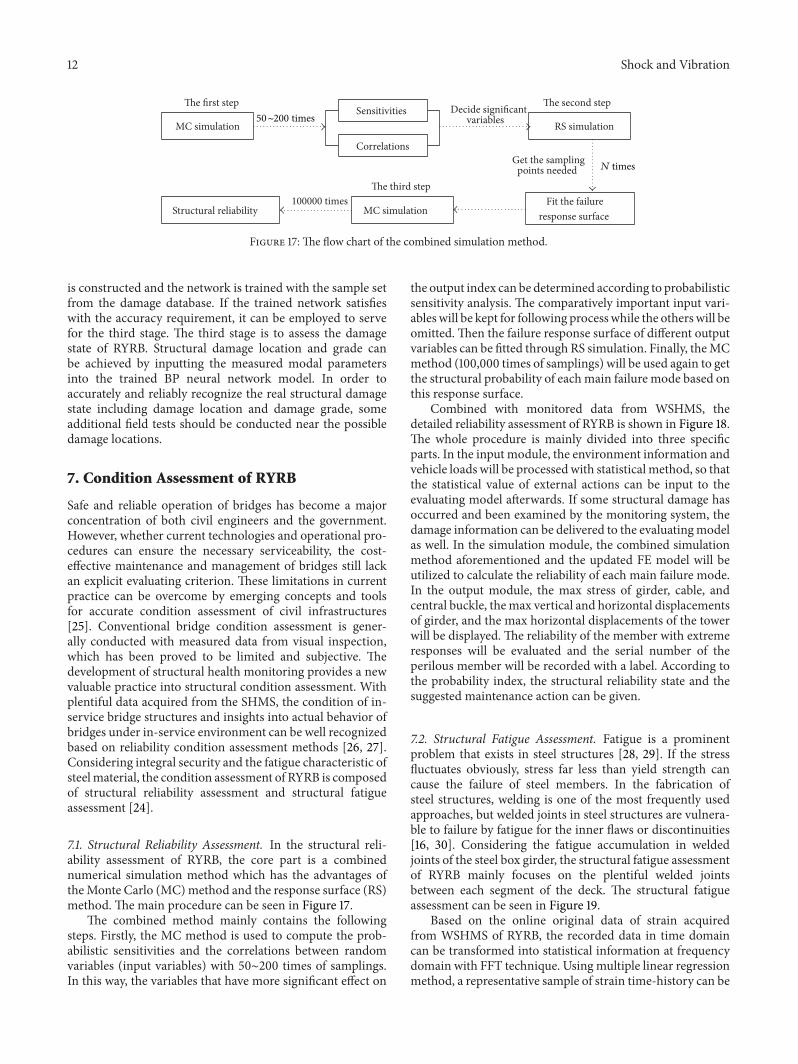
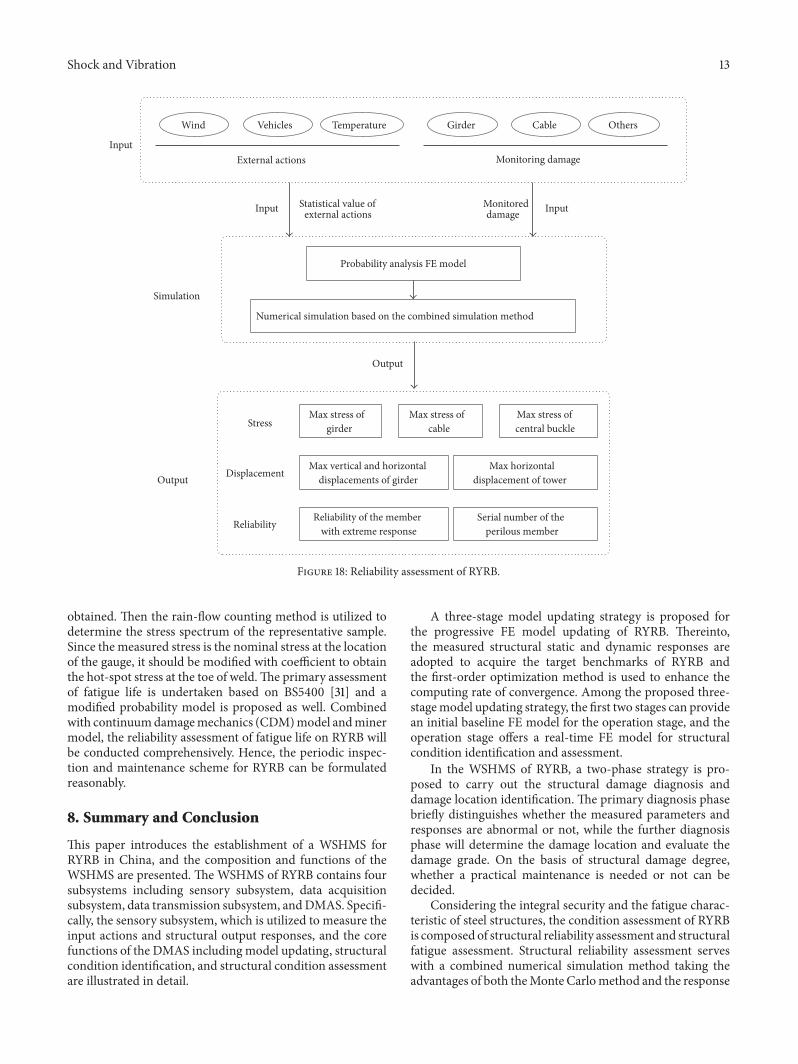
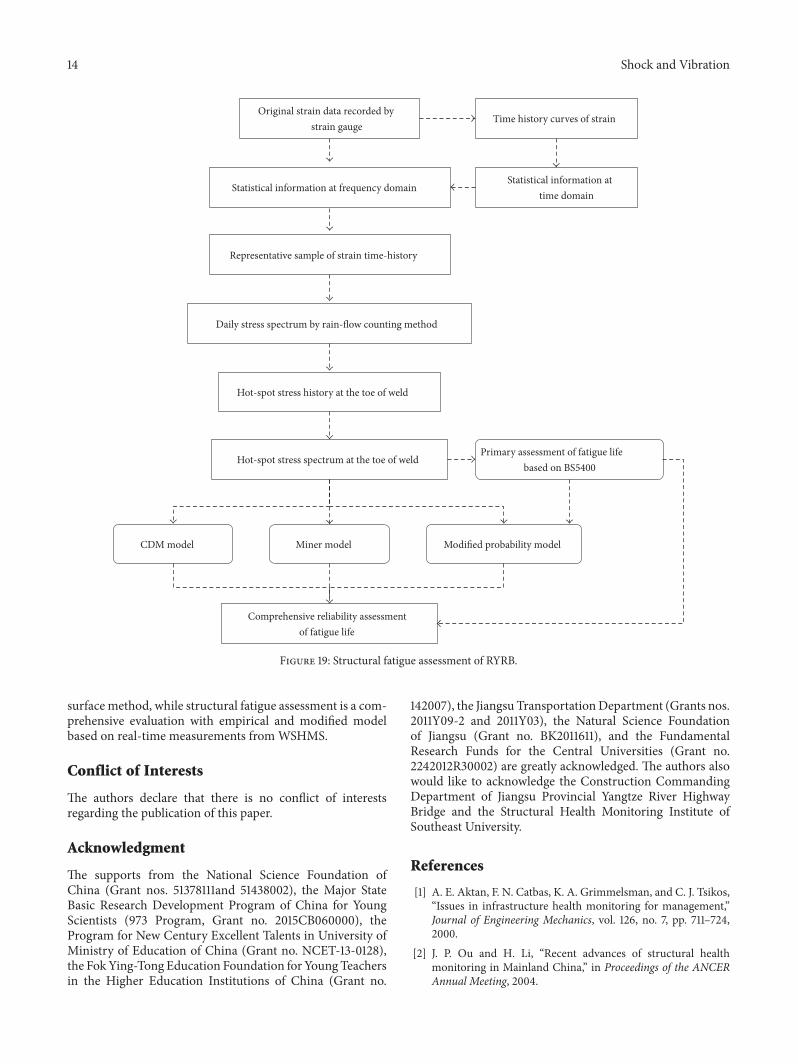

International Journal of
AerospaceEngineeringHindawi Publishing Corporationhttpwwwhindawicom Volume 2014
RoboticsJournal of
Hindawi Publishing Corporationhttpwwwhindawicom Volume 2014
Hindawi Publishing Corporationhttpwwwhindawicom Volume 2014
Active and Passive Electronic Components
Control Scienceand Engineering
Journal of
Hindawi Publishing Corporationhttpwwwhindawicom Volume 2014
International Journal of
RotatingMachinery
Hindawi Publishing Corporationhttpwwwhindawicom Volume 2014
Hindawi Publishing Corporation httpwwwhindawicom
Journal ofEngineeringVolume 2014
Submit your manuscripts athttpwwwhindawicom
VLSI Design
Hindawi Publishing Corporationhttpwwwhindawicom Volume 2014
Hindawi Publishing Corporationhttpwwwhindawicom Volume 2014
Shock and Vibration
Hindawi Publishing Corporationhttpwwwhindawicom Volume 2014
Civil EngineeringAdvances in
Acoustics and VibrationAdvances in
Hindawi Publishing Corporationhttpwwwhindawicom Volume 2014
Hindawi Publishing Corporationhttpwwwhindawicom Volume 2014
Electrical and Computer Engineering
Journal of
Advances inOptoElectronics
Hindawi Publishing Corporation httpwwwhindawicom
Volume 2014
The Scientific World JournalHindawi Publishing Corporation httpwwwhindawicom Volume 2014
SensorsJournal of
Hindawi Publishing Corporationhttpwwwhindawicom Volume 2014
Modelling amp Simulation in EngineeringHindawi Publishing Corporation httpwwwhindawicom Volume 2014
Hindawi Publishing Corporationhttpwwwhindawicom Volume 2014
Chemical EngineeringInternational Journal of Antennas and
Propagation
International Journal of
Hindawi Publishing Corporationhttpwwwhindawicom Volume 2014
Hindawi Publishing Corporationhttpwwwhindawicom Volume 2014
Navigation and Observation
International Journal of
Hindawi Publishing Corporationhttpwwwhindawicom Volume 2014
DistributedSensor Networks
International Journal of