Embed Size (px)
Citation preview
Research ArticleImpact of a Detailed Urban Parameterization on Modelingthe Urban Heat Island in Beijing Using TEB-RAMS
Lei Jiang12 Lixin Lu3 Lingmei Jiang4 Yuanyuan Qi1 and Aqiang Yang1
1 Institute of Remote Sensing and Digital Earth Chinese Academy of Sciences State Key Laboratory of Remote Sensing ScienceBeijing 100101 China
2University of Chinese Academy of Sciences Beijing 100049 China3 Cooperative Institute for Research in the Atmosphere Colorado State University Fort Collins CO 80523 USA4 State Key Laboratory of Remote Sensing Science BeijingNormalUniversity and the Institute of Remote SensingApplications of ChineseAcademy of Sciences School of Geography Beijing Normal University Beijing 100875 China
Correspondence should be addressed to Lixin Lu lixinatmoscolostateedu
Received 12 December 2013 Revised 20 February 2014 Accepted 10 March 2014 Published 5 June 2014
Academic Editor Klaus Dethloff
Copyright copy 2014 Lei Jiang et alThis is an open access article distributed under the Creative Commons Attribution License whichpermits unrestricted use distribution and reproduction in any medium provided the original work is properly cited
The Town Energy Budget (TEB) model coupled with the Regional Atmospheric Modeling System (RAMS) is applied to simulatethe Urban Heat Island (UHI) phenomenon in the metropolitan area of Beijing This new model with complex and detailed surfaceconditions called TEB-RAMS is fromColorado State University (CSU) and the ASTER division ofMission Research CorporationThe spatial-temporal distributions of daily mean 2m air temperature are simulated by TEB-RAMS during the period from 0000UTC01 to 0000UTC02 July 2003 over the area of 116∘Esim1168∘E 396∘Nsim402∘N inBeijingTheTEB-RAMSwas runwith four levelsof two-way nested grids and the finest grid is at 1 km grid increment An Anthropogenic Heat (AH) source is introduced into TEB-RAMS A comparison between the Land Ecosystem-Atmosphere Feedback model (LEAF) and the detailed TEB parameterizationscheme is presentedThe daily variations and spatial distribution of the 2m air temperature agree well with the observations of theBeijing area The daily mean 2m air temperature simulated by TEB-RAMS with the AH source is 06 K higher than that withoutspecifying TEB and AH over the metropolitan area of Beijing The presence of urban underlying surfaces plays an important rolein the UHI formationThe geometric morphology of an urban area characterized by road roof and wall also seems to have notableeffects on the UHI intensity Furthermore the land-use dataset from USGS is replaced in the model by a new land-use map for theyear 2010 which is produced by the Institute of Remote Sensing and Digital Earth (RADI) Chinese Academy of Sciences (CAS)The simulated regional mean 2m air temperature is 068 K higher from 01 to 02 July 2003 with the new land cover map
1 Introduction
Urban warming is much more rapid and evident than globalwarming [1ndash3] The AH emission also plays an importantrole in determining theUHI intensityTheUHI phenomenonwas observed in New York City [4] Bornstein found that theaverage intensity of UHI was maximal near the surface butgradually decreased to zero at 300m Myrup [5] developeda general energy budget model to investigate the competingphysical processes of reduced evaporation in the city centerand the thermal heating of the city buildings and pavingmaterials Oke [6] measured air temperatures in and nearthe surroundings of Vancouver to provide the observational
evidence for comparing an empirical model and a theoreticaladvective model simulated vegetation canopy and UHI Thetheoreticalmodel failed to reproduce the observations ofUHIin Vancouver while the empirical model performed quitewell Kim and Baik [7] verified a change in the average max-imum UHI intensity over different seasons in Seoul KoreaThey found that the average maximumUHI intensity is weakin summer but strong in winter Furthermore the analysesshowed that the maximum UHI is positively correlated withthe previous-day maximum UHI but negatively correlatedwith the wind speed cloudiness and relative humidityDetailed reviews on the UHI effects and urban climate can befound in Arnfield [8] and Grimmond [9] Arnfield assessed
Hindawi Publishing CorporationAdvances in MeteorologyVolume 2014 Article ID 602528 11 pageshttpdxdoiorg1011552014602528
2 Advances in Meteorology
the advances of urban climate studies relating to atmosphericturbulence and exchange processes of energy andwater at dif-ferent scales Grimmond summarized the importance of theobservations in the urban area to understand urban climateand improve the model performance Recently researchershave observed more and more relationships between theclimate change of cities and the UHI effects [10ndash12]
Beijing an important international metropolis hasspread rapidly markedly modifying the regional and localweather and climate characteristics Ren et al [13] studiedthe temporal change of the UHI intensity at a number ofweather stations and found significant urbanization-inducedwarming on seasonal and annual time scales Miao et al[14] analyzed the UHI characteristics and boundary layerstructures in Beijing using the weather research and forecast-ing (WRF) model coupled with a single-layer urban canopymodelThe results show thatWRF can reproduce the diurnalvariation and spatial distribution of theUHI intensity and thediurnal cycle of wind speed and direction and the small-scaleboundary layer convective cells Furthermore Zhang et al[15] investigated the urban impacts on summer precipitationemploying amesoscale numerical model over a larger Beijingmetropolitan areaThey revealed that the rapid urban expan-sion is statistically correlated to summer rainfall reductionin the northeast areas of Beijing Furthermore there is noclear long-term trend in summer aerosol optical depth inBeijing A mesoscale weather model with different land-usedata is also used to analyze two selected heavy summerrainfall events in Beijing Urban expansion produced lessevaporation higher surface temperatures larger sensible heatfluxes and a deeper boundary layer In the current study weapply the TEB-RAMSwith a detailed urban parameterizationscheme to study the UHI phenomenon over themetropolitanarea of Beijing
The versatile numerical prediction model RAMS hasbeen successfully applied to the mesoscale simulation ofmeteorological characteristics [16ndash18] Rozoff et al [19] useda storm-resolving version of RAMS to simulate the urbanatmosphere and they found that the UHI characteristicplays an important role in initiating deep moist convectiondownwind of the city over St Louis Missouri The modelcan successfully simulate the atmospheric circulation of theplanetary boundary layer from the hemisphere-scale down tothe turbulence-scale and it is more usually used in weatherforecasting and regional-scale climate simulations [20ndash23]Zhang et al [24] used RAMS to study the UHI effect inthe Chongqing area and they found that the original RAMSmodel without the single-layer urban canopy model couldnot accurately simulate the UHI characteristics whereasthe accuracy was significantly improved when RAMS-UrbanCanopy was used
Recently the consideration of the urban canopy and AHemission has drawnmore attention to the UHI studies How-ever the traditional mesoscale atmospheric models handlethe urban canopy with the same parameterization schemeused for the vegetation canopy [25 26] Some land surfaceparameters such as the soil constants are changed in theconventionalmodels to describe the urban features which arefar from being realistic The urban canyon geometry and AH
emission are not accounted for in such models In the pastdecade several urban canopy parameterization schemeswereproposed and developed to investigate the surface energybalance and urban climate characteristics among others [2728] In particular Masson [29] presented the TEB modelconsidering a canyon geometry structure that includes threetypes of surfaces roof wall and road The model waspartially amended by Kusaka et al [30] and Lemonsu et al[31] The amended model included the canyon orientationand the diurnal change of solar azimuth angle Moreoverthe land surface consisted of street canyons with differentorientation The TEB model has been successfully usedto a large variety of applications ranging from simulationof urban surface energy balance to air quality modeling[32ndash35] Urban canopy models have now been coupled todifferent regional mesoscale atmospheric models which areused to improve the representation of urban boundary layermeteorology [14 36] The TEB model accounting for theeffect of the anthropogenic sensible and latent heat fluxes onall artificial surfaces seems to be able to contribute to themoreaccurate evaluation of the UHI phenomenon In this workthe TEB-RAMS model is used to investigate and evaluate theUHI intensity in Beijing
2 Study Areas Data and Methodology
We integrate the advanced version of TEB-RAMS overBeijing metropolitan area with four levels of two-way nestedgrids as shown in Figure 1(a)The grid spacing and grid pointnumbers in latitude and longitude directions of these fourdomains are 36 km (80 times 80) 9 km (82 times 82) 3 km (80 times80) and 1 km (83 times 83) The vertical grid contains 25 fullsigma levels Vertical grid stretch ratio is 11 and vertical gridspacing is 120m up to 15 km height in the atmosphere Thesimulation starts on 0000UTC01 July 2003 and ends on 0000UTC 15 July 2003The initial and lateral boundary conditionsare provided by the ERA-40 reanalysis data product [37]Figure 1(b) shows the spatial distributions of the vegetationtypes for grid 4 the finest grid where the red raster representsthe urban area of Beijing The position of the intersectionbetween the lines AB and CD is the location of TianrsquoAn MenTower the center of Beijing
The daily meteorological observation datasets wereobtained from 1951 to present and were used for modelevaluation The ERA-40 reanalysis datasets with 1∘ times 1∘spatial resolutionwere used to provide TEB-RAMS includingpressure-level air temperature wind speed and directiongeopotential height and relative humidity at 6-hour inter-val The model uses sea surface temperatures (SST) of 1∘global monthly climatological sea surface temperature datafrom the National Oceanic and Atmospheric Administration(NOAA)The land-covermaps fromUSGS during the period1992-1993 [38 39] and from RADI during the year 2010 areused to evaluate the urbanization effect on the UHI intensityin Beijing
The overall goal of this study is to describe the generalcharacteristics of UHI in the Beijing area Due to limitedcomputing resources a one-day experiment from 0000 UTC
Advances in Meteorology 3
Grid 1
Grid 2 Grid 3
A
B
C D
130∘E
50∘N
40∘N
30∘N
39∘50998400 N
40∘0998400 N
116∘10998400E 116∘20998400E 116∘30998400E 116∘40998400E
100∘E 110∘E 120∘E
Tianrsquoan men (center of Beijing)(3991∘N 11639∘E)
UrbanDeciduous broadleaf forestCool mixed forestRice paddy and field
Cool forest and fieldFields and woody savannaGrass cropsCrops grass and shrubs
(a)
(b)
Figure 1 (a) Configuration of the four two-way nested domains used for the TEB-RAMS (LEAF3-RAMS) simulation in this studyThe centerof the fourth grid represents the metropolitan area of Beijing and the central position is located in Tianrsquoan Men Tower (b) Beijing city withthe innermost contour representing its most urban region The red region represents urban category The legend shows the vegetation typesof the USGS land-use data
Table 1 The main simulation parameters in the model
RAMS61 DomainOverlay areas 263sim51∘N 96sim1366∘EHorizontal grids 80 times 80 82 times 82 80 times 80 and 83 times 83Grid interval (km) 36 9 3 and 1 kmVertical layers 25 25 25 and 25Time integration (d) From 00 UTC 01 to 00 UTC 15 July 2003Time step (s) 30LW radiation HarringtonSW radiation HarringtonSurface parameterization LEAF3 and TEBForcing data (initialboundary conditions) ERA40 reanalysis data (6-h intervals 1∘ times 1∘ resolution)
01 to 0000UTC 02 July 2003 is performed and analyzedThisday is chosen because it is a clear day and the UHI effectis easier to be discerned The specific model parameters arelisted in Table 1
The Land Ecosystem-Atmosphere Feedback (LEAF) hasevolved along with RAMS through the past two decades[26 40 41] LEAF-3 represents fine-scale variations in surfacecharacteristics using leaf area index vegetation fractionalcoverage albedo and roughness length among others Thetraditional approach treating the urban canopy is similar tothe vegetation canopy in spite of the differences in the geo-metric features and thermal-dynamic characteristics between
the urban surface and vegetated surface on relevant spatialscales Therefore a new urban parameterization schemedeveloped by Masson [29] was introduced and coupled toRAMS called TEB-RAMS The local urban geometry isdefined in the TEB-RAMS model while the usual bare soilformulation is used to represent cities in the old LEAF3-RAMS model The dominant land-use categories in Beijingare urban land and cropmixed farming In the TEB-RAMSsimulation a detailed canyon geometric structure in theTEB scheme replaces the usual bare soil formulation or thesimple one-layer plant canopy in the LEAF3 model TheTEB scheme which is typically utilized to represent urban
4 Advances in Meteorology
Table 2 Input parameters for the TEB scheme in Beijing
Parameters Unit BeijingGeometric parameters
Building fraction mdash 05Building height m 60Wallplane area ratio mdash 44Canyon aspect ratio mdash 30Roughness length m 30
Radiative parametersRoof wall and road albedo mdash 015 025 01Roof wall and road emissivity mdash 09 085 094
Thermal parametersRoof wall and road thickness 005 002 005Roof wall and road thermal conductivity 041 081 10103Roof wall and roadThermal capacity 2110000 1000000 1240000
Temperature initializationInside building temperature ∘C 260
Anthropogenic heat sourcesVehicular sensible heat source Wm2 2000Industrial sensible heat source Wm2 2000
areas can better represent the UHI effects than the LEAF3scheme as shown by Rozoff et al [19] In the present studythree numerical experiments are conducted to examine theindividual model setup performance in terms of representingUHI effects The first experiment is done by default LEAF3-RAMSmodel the second experiment is done by TEB-RAMSwithout AH emission and the third experiment is doneby TEB-RAMS-AH in which AH emission is introducedTable 2 lists the input parameters of the TEB scheme for Bei-jing Furthermore the latest land-use map of 2010 developedby RADI is used to replace the earlier land-use map fromUSGS of 1992TheUHI effect is analyzed due to land uselandcover changes
3 Model Evaluation and Comparison
Although RAMS has been widely used in climate modelingand weather forecasting in many countries it has been usedrelatively less frequently in China Therefore it is espe-cially important to evaluate its baseline performance againstobservations The observations from the Chinese NationalMeteorological Information Center (NMIC) include 2518stations which are part of the international data exchange
Figure 2(a) shows the comparison of TEB-RAMS sim-ulated the daily mean 2m air temperatures and the obser-vations from 01 to 15 July 2003 for the location of Guanx-iangtai at 11647∘E 398∘N The results show that the TEB-RAMS model successfully captures the daily variations ofthe observed 2m air temperature during the simulation timeperiodThe scattered plot of the observed and simulated dailymean 2mair temperature records has a correlation coefficientof 081 (Figure 2(b)) Then the datasets from 18 automaticmeteorological observation stations in the Beijing area wereinterpolated to TEB-RAMS grid 4 to evaluate the simulated
spatial distribution of the 2m air temperatures The sitesrsquocoordinates are provided in Table 2 The spatial distributionof the UHI intensity for the observed data is exhibited inFigure 3 The results show that the spatial distribution of theobserved temperatures is similar to the simulated results inFigure 5Therefore the TEB-RAMSmodel can reproduce theUHI intensity well
Guanxiangtai station at 11647∘E 398∘N is in an urbanarea while Miyun station at 11687∘E 4038∘N is in a ruralarea Figure 4 plots the daily mean 2m air temperatures forboth stations from 01 to 15 July 2003 The air temperatures atthe Guanxiangtai station are found to be consistently higherthan that of the Miyun station The daily mean 2m airtemperature is 085 K higher in the urban area than that inthe rural areaThemaximum difference of the temperature is25 K higher and the minimum difference of the temperatureis minus09 K lower which are consistent with the classic UHIcharacteristics (Table 3)
Sensitivity experiments to compare the TEB-RAMSmodel with and without the AH emission as well as with thedefault LEAF3-RAMS model have been carried out to eval-uate each of these modelsrsquo simulated the UHI phenomenonfor Grid 4 the finest grid where the grid spacing is 1 km times1 km The main surface parameter for the TEB submodel isthe building height which was specified as 60m for BeijingareaThe spatial distributions of model simulated daily mean2m air temperatures for the period from 0000 UTC (1400LST) 01 July 2003 to 0000 UTC 02 July 2003 for the differentmodels are displayed in Figure 5 The areas 1163∘Esim1165∘Eand 3985∘Nsim3997∘N represent urban underlying surfaceThe ranges 1165∘Esim1167∘E and 3985∘Nsim3997∘N representsuburb underlying surface The regional mean difference ofthe 2m temperature in the above area is defined as theUHI intensity Heat is released into the atmosphere due to
Advances in Meteorology 5
Observed valuesSimulated values with TEB-RAMS
306
305
304
303
302
301
300
299
298
297
296
295
2941 2 3 4 5 6 7 8 9 10 11 12 13 14 15
Days
2 m
air t
empe
ratu
re (K
)
(a)
306
306
305
305
304
304
303
303
302
302
301
301
300
300
299
299
298
298
297
297
296
296
295
295294
294
yTEB = 075x + 744
R2 = 066
Sim
ulat
ed 2
m ai
r tem
pera
ture
(K)
Observed air temperature (K)
Observed valuesSimulated values with TEB-RAMS
(b)
Figure 2 (a) Comparison of the TEB-RAMS model simulated daily 2m air temperatures with observations from 01 to 15 July 2003 atthe Guanxiangtai station The black filled circle line represents the observed 2m air temperature in Beijing and the black open circle linerepresents the TEB-RAMS simulated 2m air temperature (b) The scatter diagram of correlation relationship between the simulated 2m airtemperature and the observed temperature The black line represents the linear fit trend
Table 3 Coordinates of the daily temperature measurement sites
Stn num Stn name Lon Lat Mean 119879 (∘C)54399 Haidian 11628 3998 27854433 Chaoyang 11648 3995 26454511 Guanxiangtai 11647 398 27154514 Fengtai 11625 3987 26754398 Shunyi 11663 4012 26854412 Tanghekou 11663 4073 23954416 Miyun 11687 4038 26354419 Huairou 11663 4032 2754421 Shangdianzi 11712 4065 24754424 Pinggu 1171 4015 26554594 Daxing 11633 3975 26454501 Zhaitang 11568 3997 24554505 Mentougou 11612 3992 26354596 Fangshan 116 397 26154597 Xiayunling 11573 3973 2454406 Yanqing 11597 4045 24254410 Foyeding 11613 406 20854513 Shijingshan 11618 3993 269
the effect of human activity especially domestic heating andcombustion from industry Domestic heating as a defaultvalue is 26∘C (Table 2) The two main combustion sourcesin the TEB model are traffic and industry The heat fluxesreleased into the atmosphere directly are averaged on thetown surface Table 2 lists vehicular and industrial sensibleheat source The AH values are higher than those shown inthe literatures [14 24] considering the rapid urbanization ofBeijingThe spatial distribution of 2m air temperatures using
TEB-RAMS-AH is shown in Figure 5(a) There is an evidentwarming effect for the air temperatures at 2m particularly incentral Beijing It is found that the air temperature at 2m overthe metropolitan area of Beijing is approximately 2 K higherthan that over the suburbs of Beijing Figures 5(b) and 5(c)also show the similar UHI phenomenon in Beijing inwhich the temperatures of city area are 1 K warmer thanthe surrounding areas for both figures In addition thespatial distributions of the UHI characteristics are consistent
6 Advances in Meteorology
115∘0998400E
EW
S
118∘0998400E115∘20998400E 115∘40998400E 116∘0998400E 116∘20998400E 116∘40998400E 117∘0998400E 117∘20998400E 117∘40998400E
115∘0998400E 118∘0998400E115∘20998400E 115∘40998400E 116∘0998400E 116∘20998400E 116∘40998400E 117∘0998400E 117∘20998400E 117∘40998400E
41∘20998400N
N
40∘40998400N
40∘20998400N
39∘40998400N
39∘20998400N
41∘0998400N
40∘0998400N
41∘20998400N
40∘40998400N
40∘20998400N
39∘40998400N
39∘20998400N
41∘0998400N
40∘0998400N
Temperature (K)29395ndash2950529505ndash2959529595ndash2966529665ndash2972529725ndash29775
29775ndash2983529835ndash2989529895ndash29955
29995ndash3009529995ndash29995
Figure 3 Spatial distribution of the observed daily mean temperature (K) from 01 to 02 July 2003
1 2 3 4 5 6 7 8 9 10 11 12 13 14 15
Days
304
302
300
298
296
294
Obs
mea
nte
mpe
ratu
re(K
)
54511 Guanxiangtai Urban54416 Miynu rural
Figure 4 Comparison of the observed daily mean air temperature between the Guanxiangtai and Miyun stations from 01 to 15 July 2003The black filled circle line represents the observed temperature at the Guanxiangtai station and the black open circle line represents thetemperatures at the Miyun station
Advances in Meteorology 7
402N
40N
398N
396N116E 1162E 1164E 1166E 1168E
(TEB-RAMS-AH)
301
300
299
298
297
296
295
294
t2m
(a)
402N
40N
398N
396N116E 1162E 1164E 1166E 1168E
(TEB-RAMS)
301
300
299
298
297
296
295
294
(b)
402N
40N
398N
396N116E 1162E 1164E 1166E 1168E
(LEAF3-RAMS)
301
300
299
298
297
296
295
294
(c)
Figure 5 (a) Spatial distributions of model simulated daily mean 2m air temperature (K) from 0000 UTC (1400 LST) 01 to 0000 UTC 02 July2003 using the TEB-RAMS-AH model (b) Same as in (a) without AH emission (c) Same as in (a) but employing the LEAF3-RAMS model
with the spatial distribution of the urban area map shownin Figure 1(b) The modeled heating intensity of the UHIphenomenon decreases in the following order TEB-RAMS-AH TEB-RAMS and LEAF3-RAMS
The spatial distributions of the differences of the sim-ulated daily mean 2m air temperatures for the differentschemes are displayed in Figure 6 The simulated tem-perature from TEB-RAMS-AH is 06 K higher than thatwithout AH and the absence of TEB (LEAF3-RAMS) inFigure 6(c) The maximum difference in 2m temperaturebetween the TEB-RAMS-AH and LEAF3-RAMS schemes isapproximately 1 K In addition the temperature from TEB-RAMS is slightly higher than that of LEAF3-RAMS as shownin Figure 6(b) A detailed urban canopy parameterizationscheme called TEB uses a generalization of local canyongeometry with three surface types roof wall and roadThe TEB model produces a higher UHI intensity when
compared with a simple urban parameterization based onthe LEAF3 model for central Beijing for the simulation timeperiod
Variations in the simulated daily averaged 2m airtemperature along the meridional and zonal distributions areexamined by two cross sections in Figure 7 Figure 7(a) showsthe 2m air temperature variations at the 3991∘N positionalong the meridional distribution The 2m air temperatureis higher near the points at 11618∘E 3991∘N and 11625∘E3991∘N than other places in the vicinity FurthermoreFigure 7(b) shows the 2m air temperature variations at the3991∘N position along the zonal distribution The 2m airtemperatures are also higher in urban underlying surfacethan that in the vicinity as shown in Figure 1(b) We alsofound that the daily mean 2m air temperatures are clearlyhigher in the central area of Beijing than in other adjacentlocations Moreover the order of the 2m air temperature
8 Advances in Meteorology
402N
40N
398N
396N116E 1162E 1164E 1166E 1168E
09
08
07
06
05
04
03
02
01
0
minus(TEB-RAMS)(TEB-RAMS-AH)t2m
(a)
402N
40N
398N
396N116E 1162E 1164E 1166E 1168E
09
08
07
06
05
04
03
02
01
0
(TEB-RAMS)minus(LEAF3-RAMS)
(b)
402N
40N
398N
396N116E 1162E 1164E 1166E 1168E
09
08
07
06
05
04
03
02
01
0
(TEB-RAMS-AH)minus(LEAF3-RAMS)
(c)
Figure 6 (a) Spatial distribution of the difference of model simulated daily mean 2m air temperature (K) for the period from 0000 UTC(1400 LST) 01 to 0000 UTC 02 July 2003 between the TEB-RAMS-AH and TEB-RAMS models (b) Same as in (a) but for the TEB-RAMSand LEAF3-RAMS models (c) Same as in (a) but for the TEB-RAMS-AH and LEAF3-RAMS models
variations from high to low is TEB-RAMS-AH TEB-RAMSand LEAF3-RAMS The land cover dataset of USGS 1992 isused in the model [38 39] while Beijing has gone throughmajor development spurt during this periodTherefore a newland-use dataset of 2010 from RADI was obtained in orderto more realistically evaluate urbanization effect Shown inFigure 8 is the latest total area of the urban surface in Beijingapproximately 1000 km2 which is more than twice as that isdefined by the USGS land-cover dataset (Figure 1(b)) whichis about 400 km2
Two numerical experiments were conducted using TEB-RAMS with one experiment based on the new land coverdataset of 2010 and the other using land cover map of USGS1992 In Figure 9 the difference of the regional mean 2mair temperature between the two different land cover maps
is plotted and the domain-averaged temperature is 068Kwarmer with the new land cover map This demonstratesthat the urban underlying surface plays an important role indetermining theUHI effectThe rapid urbanization in Beijinghas gradually changed the characteristics of the underlyingsurface and atmospheric environment
4 Conclusions and Discussion
In this paper the TEB-RAMS model is used to investigatethe UHI intensity over the metropolitan area of Beijing withfour levels of nested grids It is found that the TEB-RAMSmodel has the ability to represent the particular features ofurban regions used in operational numerical models Thecorrelation coefficient is approximately 081 for the observed
Advances in Meteorology 9
303
302
301
300
299
298
1161 1162 1163 1164 1165
Lon
Dai
ly m
ean 2
m te
mpe
ratu
re (K
)
t2m TEB-RAMS-AHt2m TEB-RAMSt2m LEAF3-RAMS
(a)
303
302
301
300
299
298
Dai
ly m
ean 2
m te
mpe
ratu
re (K
)
397 398 399 40 401
Lat
t2m TEB-RAMS-AHt2m TEB-RAMSt2m LEAF3-RAMS
(b)
Figure 7 (a) Cross section of the daily mean air temperature at 2m along line CD as shown in Figure 1(b) indicated by the black open circleline (TEB-RAMS-AH) green filled circle line (TEB-RAMS) and blue open square line (LEAF3-RAMS) (b) Same as in (a) but along the lineAB also shown in Figure 1(b)
Evergreen needleleaf forestDeciduous broadleaf forestMixed forestsClosed shrublandsOpen shrublands
Woody savannasSavannasGrasslandsPermanent wetlandsCroplands
Urban and built-up Croplandnatural vegetation mosaicWater
40∘10998400N
39∘50998400N
39∘40998400N
40∘N
40∘10998400N
39∘50998400N
39∘40998400N
40∘N
116∘10998400E 116∘20998400E 116∘30998400E 116∘40998400E
116∘10998400E 116∘20998400E 116∘30998400E 116∘40998400E
Figure 8 Spatial distribution of 2010 land use
10 Advances in Meteorology
402N
40N
398N
396N116E 1162E 1164E 1166E 1168E
2
15
1
0
minus1
minus15
minus2
(landuse2010-USGS1992 TEB-RAMS-NOAH)m t2
Figure 9 Spatial distribution of the 2m air temperature difference(K) (landuse2010-USGS1992)
and modeled daily mean 2m air temperatures The spatialdistribution pattern of the model simulated 2m air temper-ature with TEB-RAMS is also consistent with observationsThe time series of 2m air temperature simulation using TEB-RAMS agrees well with that of station observation
The difference of the air temperature between the Guanx-iangtai station and the Miyun station represents the UHIintensity during the time from 1st to 15th July 2003 Itis found that daily averaged 2m air temperature in theurban area is 085 K higher than that of the rural areaSensitivity experiments using TEB-RAMS are conducted todemonstrate the differences in 2m air temperature betweenthe urban and rural areas The results show that the 2mair temperature simulated both by TEB-RAMS and LEAF3-RAMS of the urban area is 1 K warmer than that of therural area Moreover the daily mean 2m air temperatures areconsistently higher in the urban area than that in the area ofother vegetation types as are shown along the meridional andzonal cross section The spatial distribution of UHI closelyfollows the spatial distribution of urban land-use area asexhibited in Figure 1(b) Furthermore sensitivity studies ofTEB-RAMS with and without AH source and LEAF3 schemeare compared for the Beijing area The results show thatthe geometric morphology of an urban area characterizedby road roof and wall seems to have notable effects onthe UHI intensity implying the need for TEB scheme Itis also found that the 2m air temperature in urban areais approximately 2 K higher than in suburb when AH isconsidered and TEB scheme is included in RAMS The TEB-RAMS-AH simulated temperature at 2m is 06 K higher thanthat of LEAF3-RAMS over the metropolitan area of Beijingin the fourth nested grid The order of the simulated 2mair temperature from high to low is TEB-RAMS-AH TEB-RAMS and LEAF3-RAMS respectively Moreover the UHIintensity is the largest for TEB-RAMS-AH model comparedto the other two models Finally the land-use dataset of 1992from USGS is replaced in the model with a new land-use
dataset of 2010 from RADI The results highlight that theurbanization enhances the UHI intensity The difference ofthe regional mean 2m air temperature is 068K warmer from01 to 02 July 2003 due to the effect of rapid urban expansion
Conflict of Interests
The authors declare that there is no conflict of interestsregarding the publication of this paper
Acknowledgments
The authors would like to acknowledge the support from theNational Basic Research Program of China (973 ProgramGrant no 2010CB428502) the National Natural ScienceFoundation of China (Grant nos 40930530 and 41075112)and the Program of the Chinese Academy of Sciences(Y1S02600CX) Dr Luwould like to acknowledge the supportof NSF AGS-1219645
References
[1] P M Vitousek ldquoBeyond global warming ecology and globalchangerdquo Ecology vol 75 no 7 pp 1861ndash1876 1994
[2] T R Karl and K E Trenberth ldquoModern global climate changerdquoScience vol 302 no 5651 pp 1719ndash1723 2003
[3] J Hansen R Ruedy M Sato and K Lo ldquoGlobal surfacetemperature changerdquo Reviews of Geophysics vol 48 no 4Article ID RG4004 pp 1ndash29 2010
[4] RD Bornstein ldquoObservations of the urbanheat island effects inNew York Cityrdquo Journal of Applied Meteorology vol 7 pp 575ndash582 1968
[5] L Q Myrup ldquoA numerical model of the urban heat islandrdquoJournal of Applied Meteorology vol 8 no 4 pp 908ndash918 1969
[6] T R Oke ldquoThe distinction between canopy and boundary-layerurban heat islandsrdquoAtmosphere vol 14 no 4 pp 269ndash727 1976
[7] Y H Kim and J J Baik ldquoMaximum urban heat island intensityin Seoulrdquo Journal of Applied Meteorology vol 41 pp 651ndash6592002
[8] A J Arnfield ldquoTwo decades of urban climate research a reviewof turbulence exchanges of energy and water and the urbanheat islandrdquo International Journal of Climatology vol 23 no 1pp 1ndash26 2003
[9] C S B Grimmond ldquoProgress in measuring and observing theurban atmosphererdquo Theoretical and Applied Climatology vol84 no 1ndash3 pp 3ndash22 2006
[10] P M Mark J B Martin and A B Richard ldquoClimate changein cities due to global warming and urban effectsrdquo GeophysicalResearch Letters vol 37 Article ID L09705 2010
[11] K W Oleson G B Bonan and J Feddema ldquoEffects ofwhite roofs on urban temperature in a global climate modelrdquoGeophysical Research Letters vol 37 no 3 Article ID L037012010
[12] D E Parker ldquoUrban heat island effects on estimates ofobserved climate changerdquo Wiley Interdisciplinary Reviews Cli-mate Change vol 1 no 1 pp 123ndash133 2010
[13] G Y Ren Z Y Chu Z H Chen and Y Y Ren ldquoImplicationsof temporal change in urban heat island intensity observed atBeijing and Wuhan stationsrdquo Geophysical Research Letters vol34 no 5 Article ID L05711 2007
Advances in Meteorology 11
[14] S Miao F Chen M A LeMone M Tewari Q Li and YWang ldquoAn observational and modeling study of characteristicsof urban heat island and boundary layer structures in BeijingrdquoJournal of Applied Meteorology and Climatology vol 48 no 3pp 484ndash501 2009
[15] C L Zhang F Chen S G Miao Q C Li X A Xia andC Y Xuan ldquoImpacts of urban expansion and future greenplanting on summer precipitation in the Beijing metropolitanareardquo Journal of Geophysical Research D Atmospheres vol 114no 2 Article ID D02116 2009
[16] C J Tremback J Powell W R Cotton and R A PielkeldquoThe forward-in-time upstream advection scheme extension tohigher ordersrdquoMonthlyWeather Review vol 115 no 2 pp 540ndash555 1987
[17] R A Pielke W R Cotton R L Walko et al ldquoA comprehen-sive meteorological modeling system-RAMSrdquoMeteorology andAtmospheric Physics vol 49 no 1ndash4 pp 69ndash91 1992
[18] W R Cotton R A Pielke Sr R L Walko et al ldquoRAMS2001 current status and future directionsrdquo Meteorology andAtmospheric Physics vol 82 no 1ndash4 pp 5ndash29 2003
[19] CM RozoffW R Cotton and J O Adegoke ldquoSimulation of StLouis Missouri land use impacts on thunderstormsrdquo Journal ofApplied Meteorology vol 42 pp 716ndash738 2002
[20] L Lu S Pielke RA G E Liston W J Parton D Ojimaand M Hartman ldquoImplementation of a two-way interactiveatmospheric and ecological model and its application to thecentral United Statesrdquo Journal of Climate vol 14 no 5 pp 900ndash919 2001
[21] L Lu and J Shuttleworth ldquoIncorporating NDVI-derived LAIinto the climate version of RAMS and its impact on regionalclimaterdquo Journal of Hydrometeorology vol 6 pp 347ndash362 2002
[22] L Lu A S Denning M A da Silva-Dias et al ldquoMesoscalecirculations and atmospheric CO
2
variations in the TapajosRegion Para Brazilrdquo Journal of Geophysical Research D Atmo-spheres vol 110 no 21 Article ID D21102 pp 1ndash17 2005
[23] E D Freitas C M Rozoff W R Cotton and P L Silva DiasldquoInteractions of an urban heat island and sea-breeze circulationsduring winter over the metropolitan area of Sao Paulo BrazilrdquoBoundary-Layer Meteorology vol 122 no 1 pp 43ndash65 2007
[24] H Zhang N Sato T Izumi K Hanaki and T AramakildquoModified RAMS-Urban canopy model for heat island simula-tion in Chongqing Chinardquo Journal of Applied Meteorology andClimatology vol 47 no 2 pp 509ndash524 2008
[25] J W Deardorff ldquoEfficient prediction of ground surface tem-perature and moisture with inclusion of layer of vegetationrdquoJournal of Geophysical Research Oceans vol 83 pp 1889ndash19031978
[26] R L Walko L E Band J Baron et al ldquoCoupled atmosphere-biophysics-hydrology models for environmental modelingrdquoJournal of AppliedMeteorology vol 39 no 6 pp 931ndash944 2000
[27] B Offerle P Jonsson I Eliasson and C S B GrimmondldquoUrban modification of the surface energy balance in the WestAfrican Sahel Ouagadougou Burkina Fasordquo Journal of Climatevol 18 no 19 pp 3983ndash3995 2005
[28] F Salamanca A Krpo A Martilli and A Clappier ldquoA newbuilding energy model coupled with an urban canopy param-eterization for urban climate simulations-part I formulationverification and sensitivity analysis of the modelrdquo Theoreticaland Applied Climatology vol 99 no 3-4 pp 331ndash344 2010
[29] V Masson ldquoA physically-based scheme for the urban energybudget in atmospheric modelsrdquo Boundary-Layer Meteorologyvol 94 no 3 pp 357ndash397 2000
[30] H Kusaka H Kondo Y Kikegawa and F Kimura ldquoA simplesingle-layer urban canopy model for atmospheric modelscomparison with multi-layer and slab modelsrdquo Boundary-LayerMeteorology vol 101 no 3 pp 329ndash358 2001
[31] A Lemonsu C S B Grimmond and VMasson ldquoModeling thesurface energy balance of the core of an oldMediterranean cityMarseillerdquo Journal of Applied Meteorology vol 43 pp 312ndash3272004
[32] VMasson C S B Grimmond and T R Oke ldquoEvaluation of theTown Energy Balance (TEB) scheme with direct measurementsfrom dry districts in two citiesrdquo Journal of Applied Meteorologyvol 41 no 10 pp 1011ndash1026 2002
[33] VMasson ldquoUrban surfacemodeling and themeso-scale impactof citiesrdquo Theoretical and Applied Climatology vol 84 no 1ndash3pp 35ndash45 2006
[34] G Pigeon M A Moscicki J A Voogt and V MassonldquoSimulation of fall and winter surface energy balance over adense urban area using the TEB schemerdquo Meteorology andAtmospheric Physics vol 102 no 3-4 pp 159ndash171 2008
[35] J Struzewska and JW Kaminski ldquoImpact of urban parameteri-zation on high resolution air quality forecast with the GEM-AQmodelrdquo Atmospheric Chemistry and Physics vol 12 no 21 pp10387ndash10404 2012
[36] C Sarrat A Lemonsu V Masson and D Guedalia ldquoImpactof urban heat island on regional atmospheric pollutionrdquo Atmo-spheric Environment vol 40 no 10 pp 1743ndash1758 2006
[37] E Anderson P Bauer A Beljaars et al ldquoAssimilation andmodeling of the atmospheric hydrological cycle in the ECMWFforecastingsystemrdquo Bulletin of the American MeteorologicalSociety vol 86 no 3 pp 387ndash402 2005
[38] J R Anderson E E Hardy J T Roach and R E Witmer ldquoAland use and land cover classification system for usewith remotesensor datardquo US Geological Survey Professional Paper 9641976
[39] T R Loveland B C Reed J F Brown et al ldquoDevelopment of aglobal land cover characteristics database and IGBP DISCoverfrom 1 km AVHRR datardquo International Journal of RemoteSensing vol 21 no 6-7 pp 1303ndash1330 2000
[40] P J Sellers J A Berry G J Collatz C B Field and F GHall ldquoCanopy reflectance photosynthesis and transpirationIII a reanalysis using improved leaf models and a new canopyintegration schemerdquoRemote Sensing of Environment vol 42 no3 pp 187ndash216 1992
[41] P J Sellers D A Randall G J Collatz et al ldquoA revised landsurface parameterization (SiB2) for atmospheric GCMs Part Imodel formulationrdquo Journal of Climate vol 9 no 4 pp 676ndash705 1996
Submit your manuscripts athttpwwwhindawicom
Hindawi Publishing Corporationhttpwwwhindawicom Volume 2014
ClimatologyJournal of
EcologyInternational Journal of
Hindawi Publishing Corporationhttpwwwhindawicom Volume 2014
EarthquakesJournal of
Hindawi Publishing Corporationhttpwwwhindawicom Volume 2014
Hindawi Publishing Corporationhttpwwwhindawicom
Applied ampEnvironmentalSoil Science
Volume 2014
Mining
Hindawi Publishing Corporationhttpwwwhindawicom Volume 2014
Journal of
Hindawi Publishing Corporation httpwwwhindawicom Volume 2014
International Journal of
Geophysics
OceanographyInternational Journal of
Hindawi Publishing Corporationhttpwwwhindawicom Volume 2014
Journal of Computational Environmental SciencesHindawi Publishing Corporationhttpwwwhindawicom Volume 2014
Journal ofPetroleum Engineering
Hindawi Publishing Corporationhttpwwwhindawicom Volume 2014
GeochemistryHindawi Publishing Corporationhttpwwwhindawicom Volume 2014
Journal of
Atmospheric SciencesInternational Journal of
Hindawi Publishing Corporationhttpwwwhindawicom Volume 2014
OceanographyHindawi Publishing Corporationhttpwwwhindawicom Volume 2014
Advances in
Hindawi Publishing Corporationhttpwwwhindawicom Volume 2014
MineralogyInternational Journal of
Hindawi Publishing Corporationhttpwwwhindawicom Volume 2014
MeteorologyAdvances in
The Scientific World JournalHindawi Publishing Corporation httpwwwhindawicom Volume 2014
Paleontology JournalHindawi Publishing Corporationhttpwwwhindawicom Volume 2014
ScientificaHindawi Publishing Corporationhttpwwwhindawicom Volume 2014
Hindawi Publishing Corporationhttpwwwhindawicom Volume 2014
Geological ResearchJournal of
Hindawi Publishing Corporationhttpwwwhindawicom Volume 2014
Geology Advances in
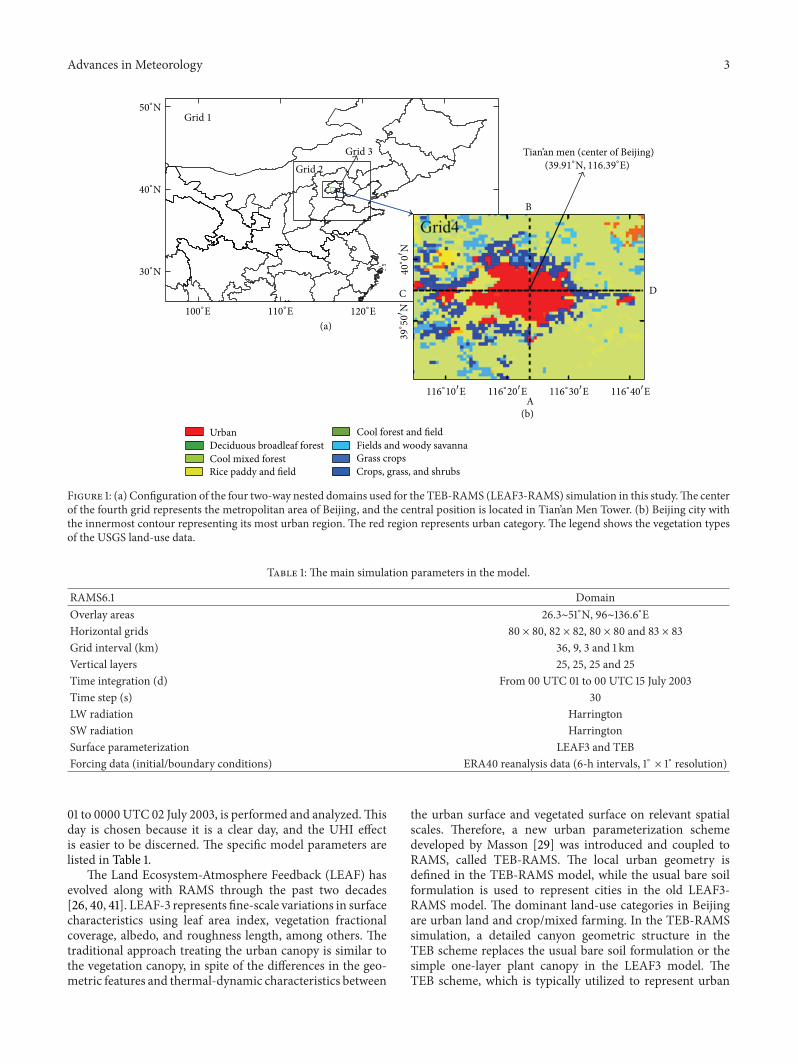
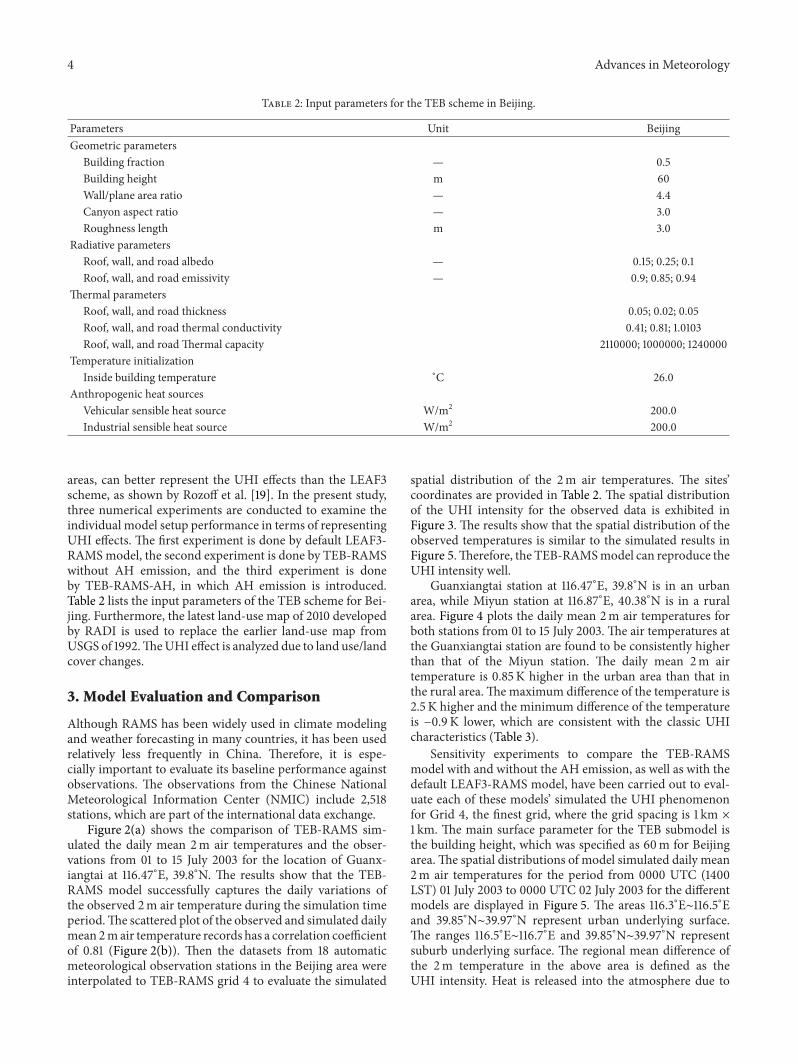
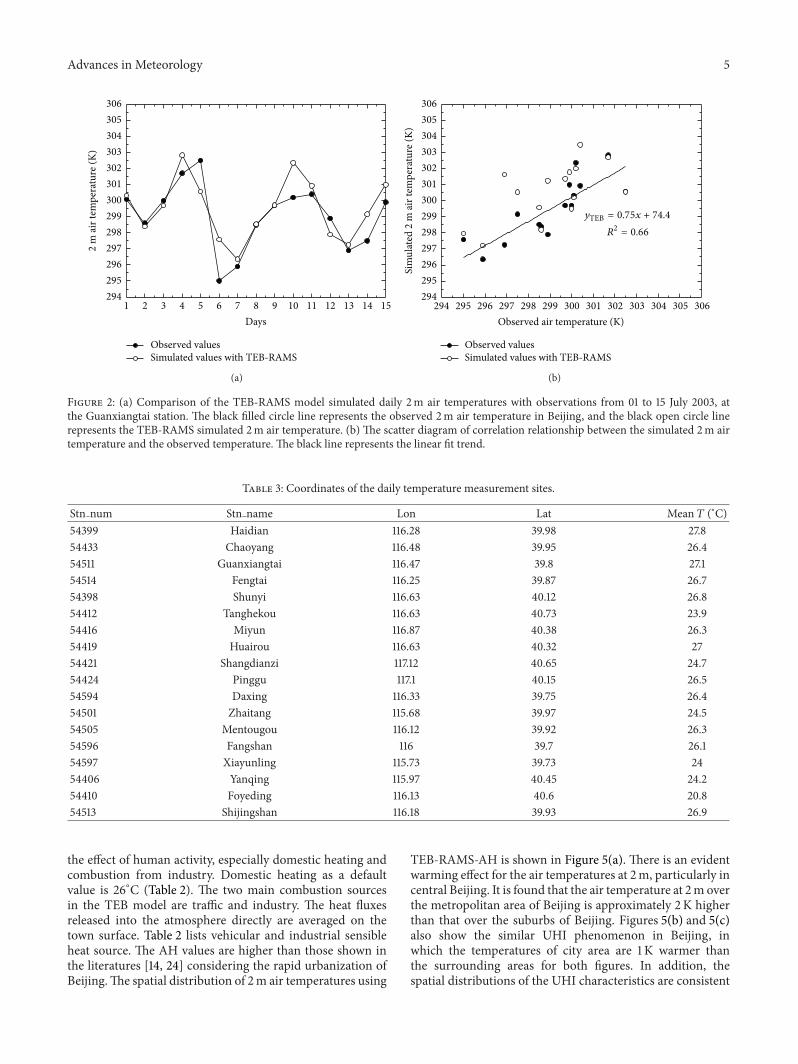
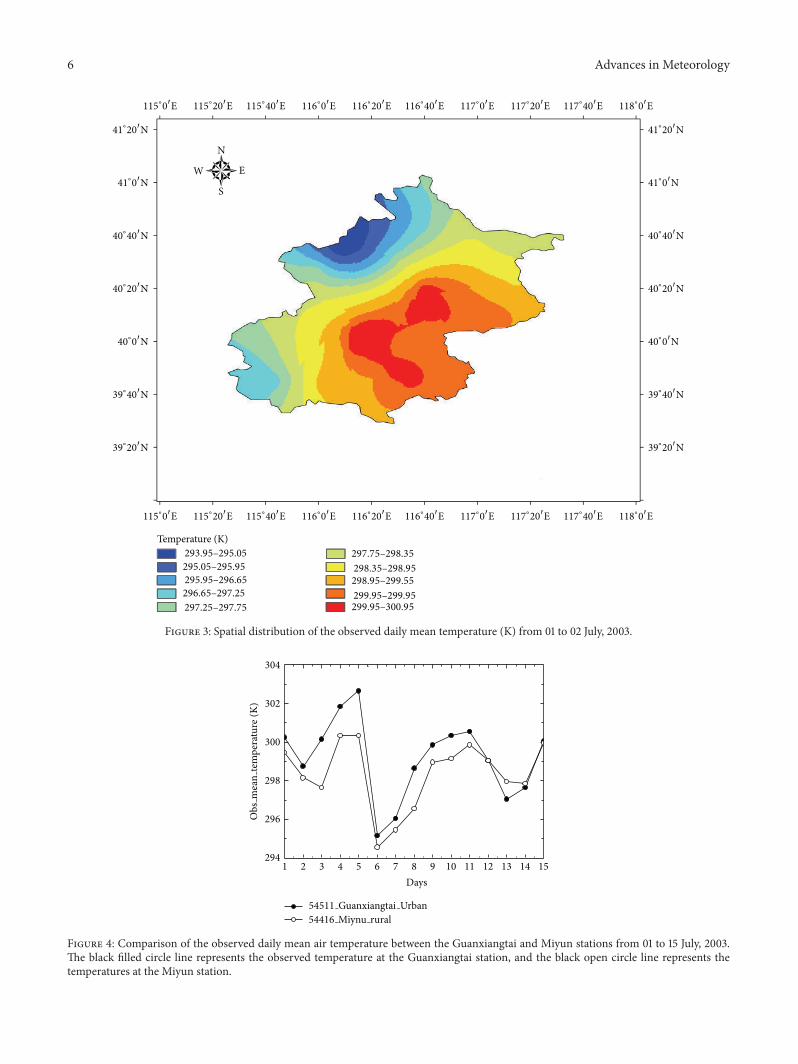
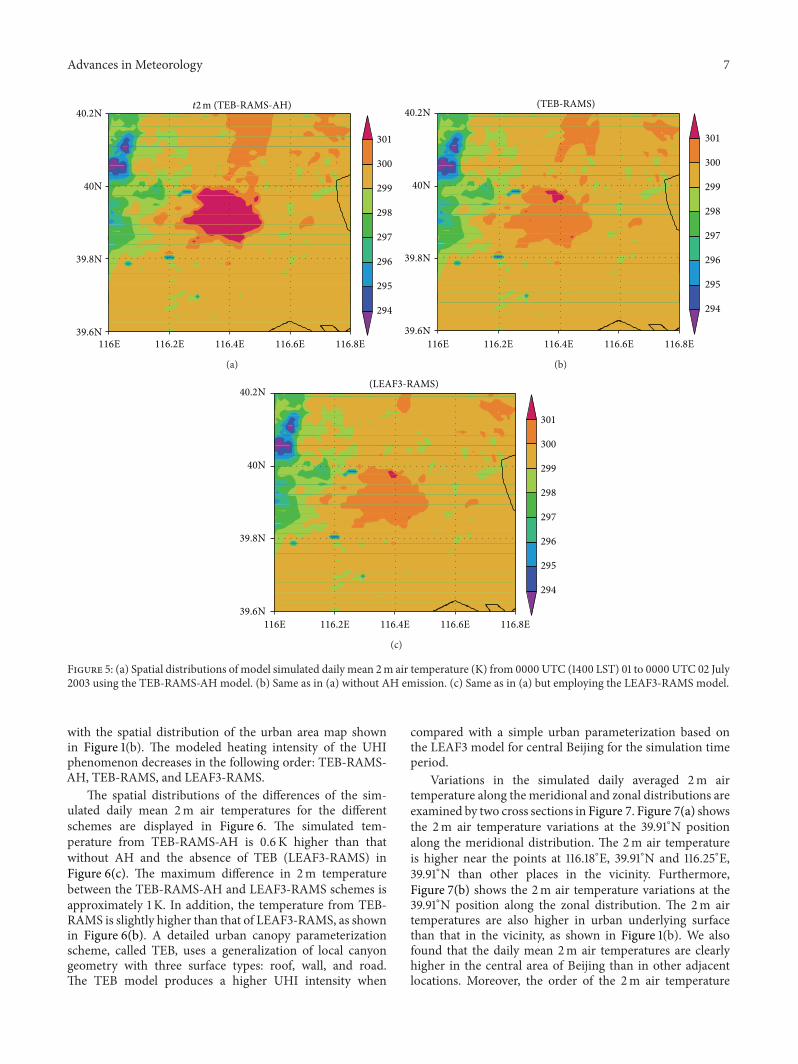
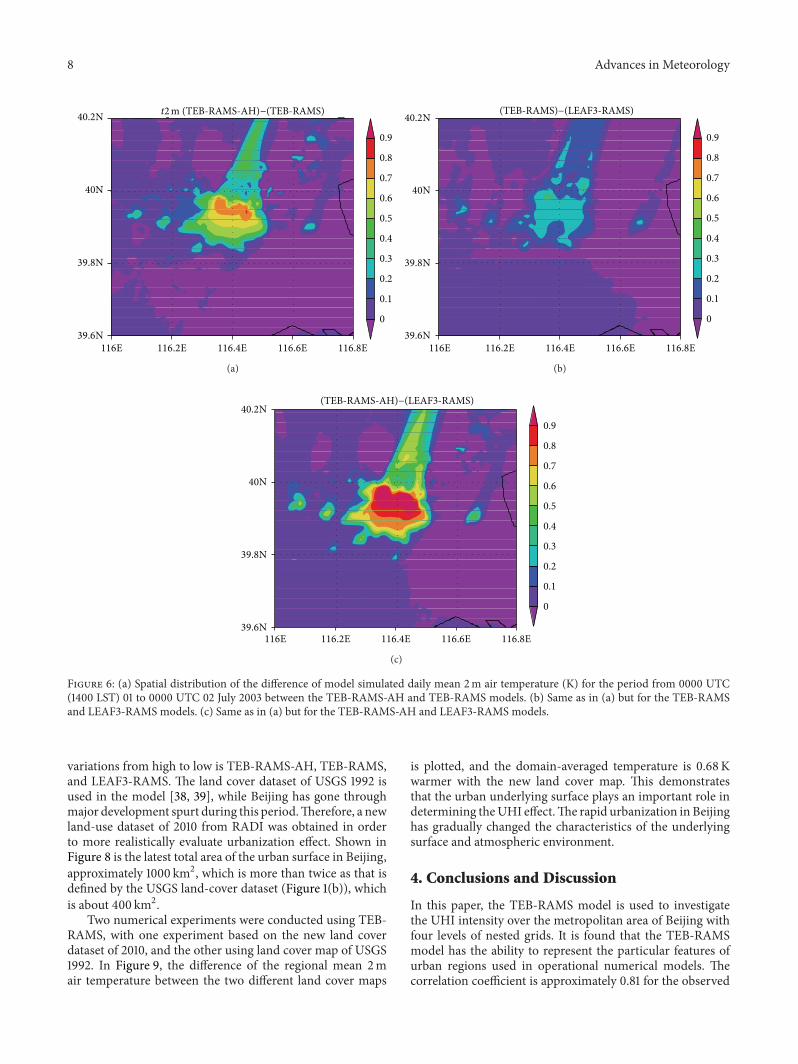
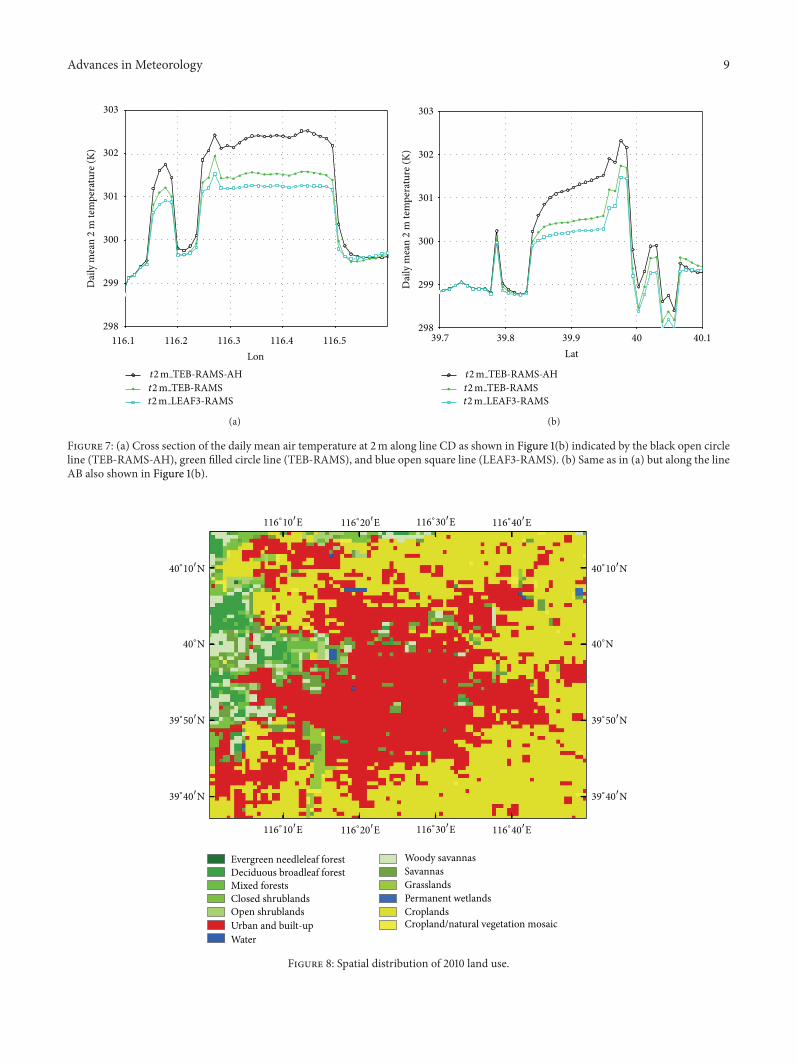
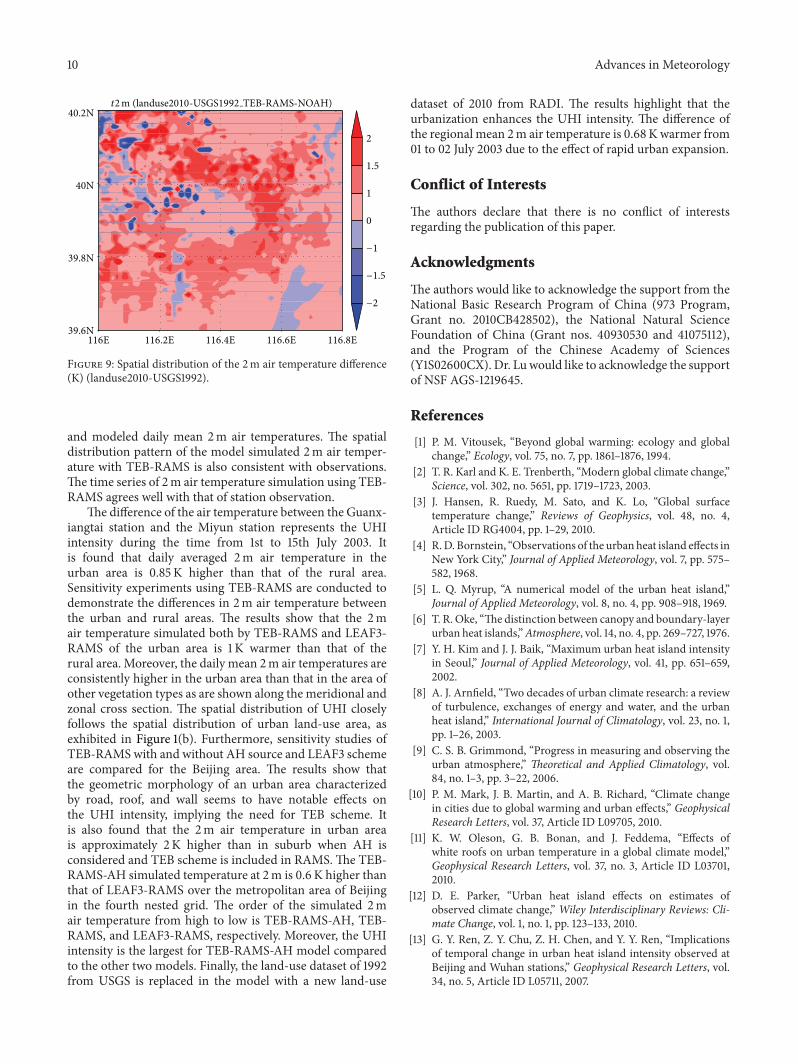
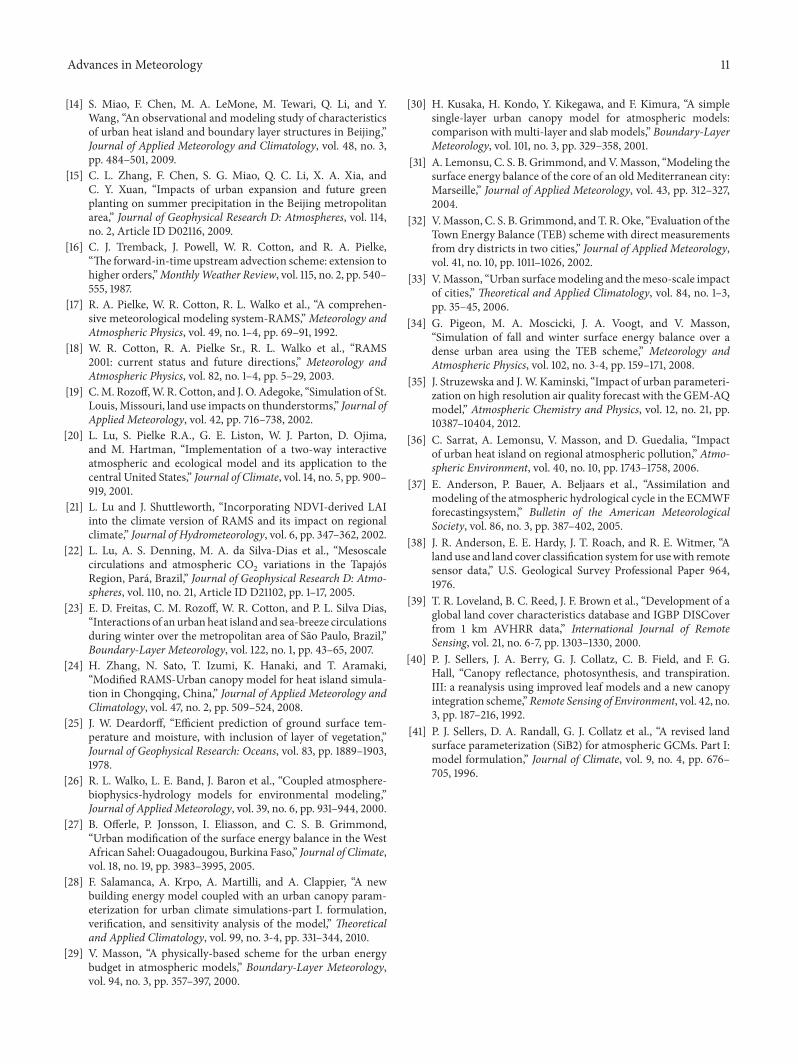


![CITY OF DAVAO REGION Xl DETAILED URBAN ZONING MAP …invest.davaocity.gov.ph/wp-content/uploads/2017/06/Detailed-Urban... · CITY OF DAVAO REGION Xl DETAILED URBAN ZONING MAP [1996-2021]](https://img.pdfslide.net/doc/110x75/5e1c5157b8d58433355a5533/city-of-davao-region-xl-detailed-urban-zoning-map-city-of-davao-region-xl-detailed.jpg)