Embed Size (px)
Citation preview

Hindawi Publishing CorporationInternational Journal of Evolutionary BiologyVolume 2013, Article ID 836738, 25 pageshttp://dx.doi.org/10.1155/2013/836738
Research ArticleIndian Craniometric Variability and Affinities
Pathmanathan Raghavan,1 David Bulbeck,2 Gayathiri Pathmanathan,3
and Suresh Kanta Rathee4
1 School of Archaeology and Anthropology, College of Arts and Social Sciences, The Australian National University,Canberra, ACT 0200, Australia
2 Department of Archaeology and Natural History, College of Asia and the Pacific, The Australian National University,Canberra, ACT 0200, Australia
3 Department of Anthropology, Panjab University, Chandigarh IN-CH 160001, India4Department of Anatomy, Post Graduate Institute of Medical Sciences, Rohtak IIM-R 124001, India
Correspondence should be addressed to David Bulbeck; [email protected]
Received 11 July 2013; Revised 13 October 2013; Accepted 15 October 2013
Academic Editor: Shozo Yokoyama
Copyright © 2013 Pathmanathan Raghavan et al. This is an open access article distributed under the Creative CommonsAttribution License, which permits unrestricted use, distribution, and reproduction in any medium, provided the original work isproperly cited.
Recently published craniometric and genetic studies indicate a predominantly indigenous ancestry of Indian populations. Weaddress this issue with a fuller coverage of Indian craniometrics than any done before.We analyse metrical variability within Indianseries, Indians’ sexual dimorphism, differences between northern and southern Indians, index-based differences of Indian malesfromother series, and Indians’multivariate affinities.The relationship between a variable’smagnitude and its variability is log-linear.This relationship is strengthened by excluding cranial fractions and series with a sample size less than 30. Male crania are typicallylarger than female crania, but there are also shape differences. Northern Indians differ from southern Indians in various featuresincluding narrower orbits and less pronouncedmedial protrusion of the orbits. Indians resemble Veddas in having small crania andsimilar cranial shape. Indians’ wider geographic affinities lie with “Caucasoid” populations to the northwest, particularly affectingnorthern Indians. The latter finding is confirmed from shape-based Mahalanobis-D distances calculated for the best sampled maleand female series. Demonstration of a distinctive South Asian craniometric profile and the intermediate status of northern Indiansbetween southern Indians and populations northwest of India confirm the predominantly indigenous ancestry of northern andespecially southern Indians.
1. Introduction
This paper analyses the metrical variability of human craniawithin the Indian subcontinent and uses the results to informa univariate, bivariate, andmultivariate comparison of Indianand other crania. India’s importance for understandinganatomically modern human origins is widely recognised:India has the highest genetic diversity of any continentalregion after Africa [1] and is generally regarded as the majordispersal centre forHomo sapiens following our exodus fromAfrica [2]. Yet India has been comparatively neglected inhuman craniometric studies, for instance, in being excludedfrom the global survey of modern human crania under-taken by Howells [3]. Studies that have included Indiancrania have been restricted to specimens held in overseas
collections [4–10]. In addition, most of these studies havebeen based on a limited set of measurements, and none ofthem combine a presentation of descriptive statistics with alarge-scale multivariate analysis of the data. The motivationof our paper is to explain Indians’ craniometric affinitiesin the context of a thoroughgoing statistical description ofIndian crania (see Supplementary Material available onlineat http://dx.doi.org/10.1155/2013/836738).
Previously undertakenmultivariate studies are consistentin pointing to a similarity between crania from India andfrom surrounding locations. Stock et al. found that bothnorthern and southern Indian crania cluster tightly together.Closest to Indians are crania from Afghanistan and Iran,the Andaman Islands, Sri Lanka (Veddas and to a lesserdegree Sinhalese), and at a greater remove southwest Asia

2 International Journal of Evolutionary Biology
[9]. Similarly, Wright found that his Indian sample clusterswith Andaman Islanders, the latter being otherwise close tosouthwest Asians and Egyptians [10]. Brace et al. found thatnorthern and southern Indians constitute a discrete cluster,along with Sri Lanka crania. These South Asians cluster withEuropeans if Andamanese are excluded from analysis, orwith Andamanese if Europeans are excluded from analysis[6]. The impression these studies give is that northern andsouthern Indians are very similar in their craniometrics,with secondary affinities to Sri Lanka, Andamanese, andsouthwest Asian crania, regardless of whether differencesbetween populations in cranial size are controlled for [6, 9]or not [10].
Until the mid-2000s, theories on the population historyof India distinguished between indigenous and immigrantstrata [7, 11–14]. The indigenous stratum supposedly con-sisted of foragers of “Australoid” or “proto-Australoid” racialaffinity, with the “Veddoids” (represented by the Veddas)sometimes recognised as a distinct component. The foragerseither survived into recent times as enclaves or else wereabsorbed during the Holocene expansion of farming popula-tions into India fromCentral Asia and/or theMediterranean.Two separate demographic expansions were recognised, oneleading to Dravidian speakers in the south and the otherto Indo-European (Indo-Aryan) speakers in the north. Anadditional incursion of farming populations, restricted tonortheast India, involved Munda (Austro-Asiatic) speakerswith Southeast Asian (“Mongoloid”) affinities.
The recent accumulation of genetic evidence for theLate Pleistocene origin of Homo sapiens in Africa has hadtwo main implications for understanding India’s populationhistory. The first is to reinterpret India’s indigenous stratumas the first wave of Homo sapiens colonists en route fromAfrica to Eurasia and Australia.The secondmain implicationis to cast doubt on the concept of a Dravidian migration andto interpret any Central Asian genetic affinities in southernIndia as a knock-on effect following the Indo-Europeanimmigration into northern India [1, 15]. In the same vein,Reich et al. recognise a distinction between “Ancestral NorthIndian” and “Ancestral South Indian” complexes. The formeris closely related toMiddle East, Central Asian, and Europeanpopulations whereas the latter has no demonstrable similar-ities with other Eurasians. Within the Indian subcontinent,Indo-Aryan speakers have predominantly “Ancestral NorthIndian” ancestry and Dravidian speakers predominantly“Ancestral South Indian” ancestry, while the Onge of theAndaman Islands have retained undiluted “Ancestral SouthIndian” ancestry [16].
Our paper compares Indian crania with the seriesrecorded by Howells [17] on a large suite of craniometricmeasurements, to test three hypotheses on Indian affinitiesarising from recent genetic studies. The first hypothesis isthat northern and southern India crania can be more clearlydistinguished from each other than earlier craniometric stud-ies have indicated. The second hypothesis is that northernIndian crania will show affinities to Howells’ Egyptian andEuropean crania.The third hypothesis is that southern Indiancrania will show affinities with Andaman Islander rather thanEgyptian and European crania.
2. Materials and Methods
Between 2001 and 2005, the first author measured over 1,300adult crania held in anatomical institutions across India,along with a small number in Adelaide, Australia. Twelveethnic groups are represented amongst the cranial collectionsbut two of them, the Coorg and Bengalis, are unfortunatelyavailable only as very small sample sizes. Also, the first authordid not come across crania from many of the “tribal groups”that would be of potential interest for our study, groupssuch as the Munda, Santhal, Yanadi, and Irula. Table 1 andFigure 1 present the language, language distribution [18, 19],geographic location, and holding institutions of the ten seriesthat could be included in this study.
Most of the measured crania were obtained frommedicaldissections of adults of known language affiliation, withsmaller numbers donated by collectors or recovered fromhistorical gravesite excavations.Over 90 percent are of knownadult status and sex, as recorded in the mortuary registers,and some come from named individuals. In addition thefirst author, often accompanied by senior curatorial staff,inspected the crania for their degree of dental developmentand cranial suture closure to confirm their adult status,as well as their general size and the robustness of theirmastoid process, supraorbital region, andnuchalmusculatureto confirm their recorded sex. This familiarisation with themorphological variation shown by adult males and femalesof each Indian series allowed the first author to sex the adultcrania of unrecorded sex, assisted by documentation of thepelvis and other postcranial boneswhere thesewere available.
Crania whose measurements appeared to be affected byrecorded signs of pathology were excluded.
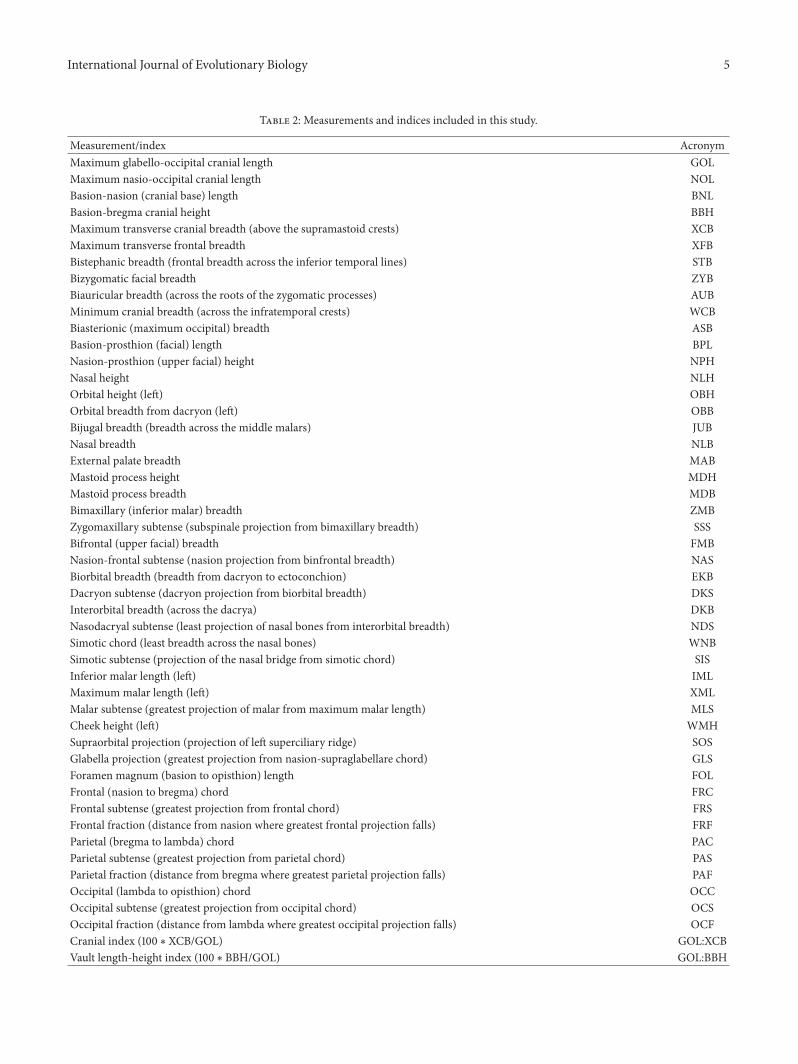
The first author took all 47 craniometric variables definedby Howells [3] excluding his radii (Table 2). He transcribedhis measurements and specimen documentation to an Excelspreadsheet, against which the second author checked theoriginal records. The second author also performed logicalchecks on the data, including calculation of 17 indices(Table 2) that reflect main aspects of cranial shape (whereverthe numerator and denominator measurements were bothavailable). Any noted inconsistencies were resolved throughmutual agreement. The Supplementary Material presents thesample sizes, means, standard deviations, and ranges for themeasurements and indices of the ten series included in thisstudy.
Six analyses are presented in this paper, making use ofour large craniometric database, which allows us to excludeany specimensmissing the analysed variable or variables.Thefirst deals with intraseries variability, considering both thesamples’ standard deviation and their range (the differencebetween the largest and smallest value within the sample).The second analysis focuses on sexual dimorphism andthe third investigates craniometric variation within India.Determination of statistical significance in these analyses isbased on the weighted Simes test [20]. The fourth analysiscompares male average measurements and indices of SouthAsians, including theVeddas of Sri Lanka based on previouslypublished data [5, 7], with those from other parts of theworld. Males rather than females are chosen here because

International Journal of Evolutionary Biology 3
Ludhiana
Patiala
ChandigarhPunjabi
RohtakHaryanavi
Urdu
Hindi
New Delhi
Lucknow
Allahabad
Bhopal
Konkani
Tulu
Malayalam
Tamil
Telugu
Kannada
Chennai
Vellore
Pondicherry
Bangalore
Calicut
Mangalore
Manipal
Tirupathi
VijayawadaHyderabad
Secunderabad
ChinakakaniKrishna
0 500(km)
Figure 1: Distribution of Indian languages covered in this study and locations of holding institutions.

4 International Journal of Evolutionary Biology
Table 1: Indian series included in the present study.
Series Location Language group Holding institutions
Punjabi Northwest India Indo-AryanPanjab: Government Medical College, Patiala; Christian Medical College, Ludhiana.Chandigarh: Government Medical College. New Delhi: Mulana Azad MedicalCollege.
Haryanavi Northwest India Indo-Aryan Haryana: Post Graduate Institute of Medical Sciences, Rohtak.
Hindi North India Indo-Aryan
New Delhi: Maulana Azad Medical College, Lady Harding Medical College. UttarPradesh: King George Medical College, Lucknow; University of Allahabad,Allahabad; Moti Lal Nehru Medical College, Allahabad. Madhya Pradesh: GandhiMedical College, Bhopal.
Urdu South India Indo-Aryan Andhra Pradesh: Osmania Medical College, Hyderabad; Gandhi Medical College,Secunderabad.
Konkani South India Indo-Aryan Karnataka: Kasturba Medical College, Manipal; Kasturba Medical College,Mangalore.
Telugu South India Dravidian
Andhra Pradesh: Osmania Medical College, Hyderabad; Gandhi Medical College,Secunderabad; Sri Venkateshwara University, Tirupathi; Siddarth Medical College,Vijayawada, Andhra Pradesh; NRI Medical College, Chinakakani; DR. PSIMS & Rf,Krishna. Adelaide: South Australian Museum.
Kannada South India Dravidian Karnataka: St John’s Medical College, Bangalore; Kasturba Medical College,Mangalore.
Tulu South India Dravidian Karnataka: Kasturba Medical College, Manipal; Kasturba Medical College,Mangalore.
Tamil South India DravidianPondicherry: Jawaharlal Nehru Institute of Medical Education and Research. TamilNadu: Madras Medical College, Chennai; Christian Medical College, Vellore.Adelaide: South Australian Museum.
Malayalam South India Dravidian Kerala: Government Medical College, Calicut.
they are better sampled. The fifth and sixth analyses employmultivariate techniques to compare the six best sampledIndian series with the Howells series (males and females).The first of these analyses is a principal components analysis[21], and the second is based on Mahalanobis-D distancescalculated from Mosimann indices [22] which are widelyused in osteometric studies where the focus of attention isshape [23–26]. All multivariate analyses were undertakenusing XLSTAT.
A note of caution arises from the decision by Howells[3] to substitute missing variables in the crania he measuredwith the average measurement from the series concerned.One obvious effect is to artificially increase the sample sizefor at least some variables and artificially decrease thesevariables’ standard deviations. These points render Howells’data inappropriate for intraseries variability analysis. As forHowells’ estimates of his series’ means, included in our fourthanalysis, the mean values themselves will not be affected, andtherefore indices calculated from his series’ means are alsonot affected. The effects on the fifth and sixth analyses areunknown but probably slight because Howells focused oncrania with the great majority or all of their measurementsintact.
3. Results
3.1. Analysis of Variability. Variability, as measured both withthe standard deviation and the range, tends to increase asthe mean increases, for all variables and across all series.However, the standard deviation and range increase at a
far slower rate than that of the mean. While the linearrelationship between the mean and the standard deviation ismoderate (Pearson’s 𝑟 = 0.74), the slope of the best-fit lineat 0.03 is flat. Similarly, Pearson’s 𝑟 for the linear relationshipbetween themean and the range is 0.70, while the slope of thebest-fit line is merely 0.14 (Tables 3 and 4).
The association between the mean and variability mea-sures improvesmarkedly by the following two steps, althoughthe slope of the best-fit lines remains flat. The first step isto exclude Howells’ parietal, frontal, and occipital fractionson the basis of their excessive variability. Even though thesecranial fractions (by definition) are smaller than their respec-tive cranial chords, it is the cranial fractions that generallyhave the larger standard deviation (Supplementary Tables S3and S4). When fractions are excluded, Pearson’s 𝑟 correlationcoefficient increases to 0.81 comparing means and standarddeviations and to 0.75 comparing means and ranges (Tables3 and 4). The second step is to exclude sample sizes lessthan 30, based on the rule of thumb that 30 is a sufficientlylarge sample size to reliably estimate the main parameters ofa population [27]. When the smaller samples are excluded,Pearson’s 𝑟 correlation coefficient increases to 0.89 comparingmeans and standard deviations and to 0.85 comparing meansand ranges.
The coefficient of variation, or mean divided by thestandard deviation, widely used in biostatistical analyses[28] has been critiqued as not applicable in comparing onevariable with another [29]. As the present analysis shows,in the case of craniometric variables, the standard deviationincreases with the mean albeit at a far slower rate. In fact,
International Journal of Evolutionary Biology 5
Table 2: Measurements and indices included in this study.
Measurement/index AcronymMaximum glabello-occipital cranial length GOLMaximum nasio-occipital cranial length NOLBasion-nasion (cranial base) length BNLBasion-bregma cranial height BBHMaximum transverse cranial breadth (above the supramastoid crests) XCBMaximum transverse frontal breadth XFBBistephanic breadth (frontal breadth across the inferior temporal lines) STBBizygomatic facial breadth ZYBBiauricular breadth (across the roots of the zygomatic processes) AUBMinimum cranial breadth (across the infratemporal crests) WCBBiasterionic (maximum occipital) breadth ASBBasion-prosthion (facial) length BPLNasion-prosthion (upper facial) height NPHNasal height NLHOrbital height (left) OBHOrbital breadth from dacryon (left) OBBBijugal breadth (breadth across the middle malars) JUBNasal breadth NLBExternal palate breadth MABMastoid process height MDHMastoid process breadth MDBBimaxillary (inferior malar) breadth ZMBZygomaxillary subtense (subspinale projection from bimaxillary breadth) SSSBifrontal (upper facial) breadth FMBNasion-frontal subtense (nasion projection from binfrontal breadth) NASBiorbital breadth (breadth from dacryon to ectoconchion) EKBDacryon subtense (dacryon projection from biorbital breadth) DKSInterorbital breadth (across the dacrya) DKBNasodacryal subtense (least projection of nasal bones from interorbital breadth) NDSSimotic chord (least breadth across the nasal bones) WNBSimotic subtense (projection of the nasal bridge from simotic chord) SISInferior malar length (left) IMLMaximum malar length (left) XMLMalar subtense (greatest projection of malar from maximummalar length) MLSCheek height (left) WMHSupraorbital projection (projection of left superciliary ridge) SOSGlabella projection (greatest projection from nasion-supraglabellare chord) GLSForamen magnum (basion to opisthion) length FOLFrontal (nasion to bregma) chord FRCFrontal subtense (greatest projection from frontal chord) FRSFrontal fraction (distance from nasion where greatest frontal projection falls) FRFParietal (bregma to lambda) chord PACParietal subtense (greatest projection from parietal chord) PASParietal fraction (distance from bregma where greatest parietal projection falls) PAFOccipital (lambda to opisthion) chord OCCOccipital subtense (greatest projection from occipital chord) OCSOccipital fraction (distance from lambda where greatest occipital projection falls) OCFCranial index (100∗XCB/GOL) GOL:XCBVault length-height index (100∗BBH/GOL) GOL:BBH

6 International Journal of Evolutionary Biology
Table 2: Continued.
Measurement/index AcronymFrontal curvature index (100∗ FRS/FRC) FRC:FRSParietal curvature index (100∗PAS/PAC) PAC:PASOccipital curvature index (100∗OCS/OCC) OCC:OCSGnathic index (100∗BPL/BNL) BNL:BPLPosterior craniofacial index (100∗ASB/ZYB) ZYB:ASBTransverse craniofacial index (100∗ZYB/XCB) XCB:ZYBUpper facial index (100∗NPH/ZYB) ZYB:NPHBizygomatic-bimaxillary index (100∗ZMB/ZYB) ZYB:ZMBNasal index (100∗NLB/NLH) NLH:NLBOrbital index (100∗OBH/OBB) OBB:OBHFrontal flatness index (100∗ NAS/FMB) FMB:NASOrbital flatness index (100∗ DKS/EKB) EKB:DKSMaxillary flatness index (100∗ SSS/ZMB) ZMB:SSSNasodacryal index (100∗ NDS/DKB) DKB:NDSSimotic index (100∗ SIS/WNB) WNB:SIS
Table 3: Relationship between measurements’ mean and standard deviation for Indian series.
Measurements included Untransformed variables Variables transformed to base 10 logarithmsPearson’s 𝑟 Slope of best-fit line Pearson’s 𝑟 Slope of best-fit line
All measurements, all series 0.743 0.033 0.839 0.429All measurements exceptfractions, all series 0.812 0.034 0.861 0.424
All measurements exceptfractions, all series with ≥30values per measurement
0.887 0.032 0.907a 0.411b
aPearson’s 𝑟 value is 0.908 for northern Indians and 0.907 for southern Indians.bSlope of best-fit line is 0.408 for northern Indians and 0.413 for southern Indians.
the relationship of the standard deviation and the rangeto the mean is log-linear rather than linear, as shown byexpressing these variables as logarithmic values. Followingthis transformation to the variables, Pearson’s 𝑟 following thistransformation to the variables, is always higher than was thecase with the untransformed variables. Also, the slope of thebest-fit line is always above 0.4, close to the 0.5 value thatwould reflect equal rates of increase between the variablesbeing compared (Tables 3 and 4).
The preceding analysis suggests that the range is just asuseful as the standard deviation in systematically chartingvariability within a cranial series. While the range has a poorreputation for being affected by extreme cases, the pointbeing made here is that extreme cases can be expected forany well-sampled series. For instance, if we consider vaultlength (GOL) for males and females with a sample sizeof at least 30, the smallest male value is always less than162mm and the largest male value is always greater than190mm, while the smallest female value is always less than159mm and the largest female value is always greater than182mm (Supplementary Table S1). Thus, any temptation to“cleanse” a series by trimming it of specimens with extrememeasurements—for instance, measurements more than twostandard deviations from the mean—should be avoided, asit would impose an artificial homogeneity on the series.
However, where particular variables depart from the generalpattern shown by the other variables, as observed here withcranial fractions, these should be removed from analysisas their heightened variability is likely to be an artefact ofmeasurement uncertainty.
Does the intraseries variability noted here primarilyreflect differences in size, distinguishing crania with con-sistently large measurements from crania with consistentlysmaller measurements? If so, we may expect only a weakcorrelation between the means of the main indices and theirvariability. The relationship between the index mean and itsvariability is difficult to discern when indices are consideredas a single set. For instance, Pearson’s 𝑟 for all indices for allseries, comparing the index means and standard deviations,is low, at 0.17. However, this lack of a clear positive correlationis entirely due to extreme variability of the two indicesthat reflect protrusion of the nasal bones (DKB:NDS andWNB:SIS in Supplementary Table S12). (While intraseriesvariability of the nasodacryal index (DKB:NDS) has notpreviously been investigated, the high variability of thesimotic index (WNB:SIS) has already been noted [5, 8].)When these two indices are excluded, index means show amoderate positive correlation with standard deviations andranges (Table 5), as high as 0.78 (log-transformed index andstandard deviation for all series with a sample size of at least

International Journal of Evolutionary Biology 7
Table 4: Relationship between measurements’ mean and range for Indian series.
Linear measurementsincluded
Untransformed variables Variables transformed to base 10 logarithmsPearson’s 𝑟 Slope of best fit line Pearson’s 𝑟 Slope of best fit line
All measurements, all series 0.699 0.142 0.752 0.438All measurements exceptfractions, all series 0.752 0.146 0.767 0.433
All measurements exceptfractions, all series with ≥30values per measurement
0.852 0.166 0.878a 0.420b
aPearson’s 𝑟 value is 0.883 for northern Indians and 0.876 for southern Indians.bSlope of best fit line is 0.431 for northern Indians and 0.411 for southern Indians.
Table 5: Relationship between indices’ mean and variability (other than nasal flatness indices) for Indian series.
Series included and measure ofvariability compared
Untransformed variables Variables transformed to base 10 logarithmsPearson’s 𝑟 Slope of best fit line Pearson’s 𝑟 Slope of best fit line
All series (standard deviations) 0.644 0.028 0.684 0.369All series with ≥30 values perindex (standard deviations) 0.740 0.028 0.781a 0.367b
All series (ranges) 0.509 0.116 0.493 0.351All series with ≥30 values perindex (ranges) 0.637 0.126 0.684c 0.327d
aPearson’s 𝑟 value is 0.797 for northern Indians and 0.768 for southern Indians.bSlope of best fit line is 0.371 for northern Indians and 0.364 for southern Indians.cPearson’s 𝑟 value is 0.725 for northern Indians and 0.660 for southern Indians.dSlope of best fit line is 0.345 for northern Indians and 0.316 for southern Indians.
30). Generally speaking, indices resemble measurements inthe degree to which variability scales with mean values,as would be consistent with considerable intraseries shapevariability.
The extent and ubiquity of shape variation within Indiancranial series can be shown by considering index ranges(Supplementary Tables S1 to S10) in terms of the standardindex categories used in physical anthropology [30]. Allseries except the Konkani include both hyperdolichocephaliccrania with a cranial index less than 65 and brachycephaliccrania with a cranial index above 80. All series other thanthe Konkani include chamaecranic individuals with a vaultlength-height index less than 70 and hyperhypsicranic indi-viduals with a vault length-height index above 80. Similarly,the upper facial index ranges from hypereuryenic individuals(index less than 45) to lepten individuals (index above 55)in every series other than the Urdu. In every series, theorbital index ranges between chaemoconchic (less than 76)and hypsiconchic (above 85), and the nasal index rangesbetween leptorrhine (less than 47) and hyperchamaerrhine(above 58). Similarly, the frontal curvature index breakpointsproposed by Larnach and Macintosh [31] do not begin tocapture the variability recorded for Indians. Every seriesincludes individuals with very receding frontals as shownby an FRC:FRS index less than 21 and individuals with verybulging frontals as shown by an index above 27.
Although many of the following comparisons in thispaper focus on series means, the results should not beinterpreted in a typological sense, given the demonstrationof how variable crania are within any Indian series.
3.2. Sexual Dimorphism. The generally larger size of malecompared to female crania, well established for populationsworldwide, applies to Indians too. One way to illustrate thispattern is to divide the male average by the female averagefor the ten recorded Indian series, for each measurement,and present the resulting ratios as percentages (Figure 2).There are a few measurements where the male average isproportionately much larger than the female average, notablyglabella subtense (GLS, around 150–200%, depending onseries), supraorbital subtense (SOS, around 120–170%), andthe dimensions of the mastoid process (MDB and MDH,around 110–150%). At the other end of the scale, somemeasurements show minimal sexual dimorphism, notablyforamen magnum length (FOL), orbital height (OBH), andfrontal subtense (FRS). By and large, however, there is atendency for male averages to cluster at around 110% of thecorresponding female averages.
Accordingly, the size of the difference between male andfemale averages largely reflects whether the measurement isbig or small. If we subtract the female from the male averageand correlate the result with the male average, excludingfractions and series with a sample size of less than 30 for bothmales and females, we find aPearson’s 𝑟 correlation coefficientof 0.773. (Investigation of the correlation between thesevariables after log transformation is not possible because, asshown in Figure 2, the female average subtracted from themale average occasionally yields zero or a negative number,neither of which can be log-transformed.)
Another observation to be inferred is that the measure-ments with the greatest sexual dimorphism, as reflected by

8 International Journal of Evolutionary Biology
Table 6: Count of measurements for which males are statistically significantly larger than females in Indian series.
Sexual dimorphismSeries Universala Universal if well sampledb Typical if well sampledc Weakd Uncleare Total for 47 measurementsKonkani 6 2 5 0 0 13/47 (27.7%)Urdu 6 2 3 0 0 11/47 (23.4%)Malayalam 6 7 1 0 0 14/47 (29.8%)Tulu 6 16 9 1 0 32/47 (68.1%)Telugu 6 16 12 3 0 37/47 (78.7%)Haryanavi 6 16 5 1 0 28/47 (59.6%)Punjabi 6 16 7 2 0 31/47 (66.0%)Kannada 6 16 10 3 0 35/47 (74.5%)Tamil 6 16 11 3 0 36/47 (76.6%)Hindi 6 16 12 5 0 39/47 (83.0%)aBBH, AUB, MDH, ZYB, JUB, and OBB (males significantly larger in every series).bGOL, XCB, NOL, ASB, OCF, MDB, BNL, NPH, FMB, GLS, EKB, NLH, NLB, WCB, XML, and WMH (males significantly larger in every series with at least30 males).cPAC, STB, XFB, FRC, FRF, BPL, SOS, ZMB, NDS, SIS, MLS, MAB, and IML (males significantly larger in 5 to 6 series with at least 30 males).dPAS, PAF, OCC, OCS, NAS, DKB, DKS, and SSS (males significantly larger in just 1 to 4 series with at least 30 males).eFRS, FOL, OBH, and WNB (males not significantly larger in any series).
the average female :male ratio, also tend to be small (GLS toNLH in Figure 2). Smallmeasurements are also distinguishedfrom large measurements by a greater standard deviationin relation to the mean (Table 3), which makes the propor-tionate relationship between the male and female means anunreliable predictor of whether or not there is a statisticallysignificant difference between the male and female means.This is demonstrated in Table 6, which presents an analysisin terms of the series for which males are significantly largerthan females (one-tailed Student’s t-test, P set at 0.05 or asmaller number as required by the weighted Simes test).
At one extreme are six measurements significantly largerfor males than females in all ten Indian series. At the otherextreme are four measurements that are not significantlylarger for males than females in any of the series (includingFRS, which is actually larger for females than males inall Indian series with a male sample size of at least 30).In between are 16 measurements significantly larger formales than females as long as the male sample size is atleast 30; 11 measurements significantly larger for the clearmajority of series with a male sample size of at least 30; andeight measurements with weak sexual dimorphism. Theseintermediate cases include all four measurements (GLS, SOS,MDB and SIS) with themost pronounced sexual dimorphismbased on the proportionate comparison of the male andfemale means.
The ordering of series in Table 6 shows the importanceof adequate sample size to identify sexual dimorphism inhuman cranial measurements. The Tulu, Haryanavi, Telugu,Punjabis, Kannada, Tamils, and Hindis, with a minimumsample size of at least 30 for males (and 18 for either sex),all show males to be significantly larger than females foraround 60–80% of measurements. In contrast, the Malay-alam, Konkani, and Urdu, represented by smaller samplesizes, can be shown to be sexually dimorphic for just 20–30%of measurements.
For most indices, males and females from the sameIndian series show very similar average values (Supplemen-tary Tables S1 to S12), especially where sample size is largeenough to be reliable (as for the bottom seven series inTable 6). However, there are several indices where malesand females consistently differ. Average frontal curvatureindex (FRC:FRS) is larger for females than males in thesame series, to a degree that is statistically significant aslong as male sample size is at least 30. This accords withthe recognition that male frontals tend to slant back morestrongly compared to females’ more rounded frontals [32].Females exceed males from the same series in their averageorbital index (OBB:OBH), to a statistically significant degreein the case of Hindis, Kannada, Tamils, Telugu, Tulu, andKonkani. This is consistent with the recognition that femalestend to have amore rounded upper orbitalmargin thanmales[33]. On the other hand, males’ XCB:ZYB index consistentlyexceeds that of females in the same series, significantly sofor Hindis, Kannada, Tamils, Tulu, and Urdu, related to thepresence of a wider zygomatic arch as a male marker forthe human skull [32]. Finally, males tend to have a moreprominent nasal skeleton than females from the same series.This is reflected by males’ significantly larger nasodacryalor DKB:NDS index for Hindis, Haryanavis, and Telugu andlarger simotic (WNB:SIS) index for Hindis, Tamils, and Tel-ugu. These instances of sexual dimorphism in cranial shapesuggest a potential shortcoming in multivariate statisticalstudies [6, 9] that poolmales and females in the same analysis,attempting to accommodate sexual dimorphism by simplycompensating for cranial size.
3.3. Craniometric Variability within India. For most mea-surements and indices, when the means are considered,consistent differences between northern and southern Indi-ans, or between Indo-Aryan and Dravidian speakers, aredifficult to discern. For instance, the range of means for

International Journal of Evolutionary Biology 9
MDB
GLSSOS
SISMDHOCFNDSSSS
WMHXMLIMLNPHFRFOCSNLHZYBMLSDKSJUBMABNASPAFAUBZMBBNLBPLNLBFRCGOLOBBPASFMBNOLBBHWCBEKBXCBOCCXFBPACSTB
WNBASBDKBFOLOBHFRS
0 10050 150 200
20015010050Measurement
Groups with at least 30males
Groups with less than 30malesRange of sexual dimorphism
Female average : male average ratio (%)
(%)
Note: on some measurements, less than ten ratio values are shown, because two series have the same value
Figure 2: Sexual dimorphism of the ten Indian series for the Howells measurements, arranged in approximate ascending order.
cranial length is 176.5–181.9mm for northern Indian malesand 176.1–181.9mm for Indo-Aryan males, which overlapextensively with the range of means of 173.0–178.6mm forsouthern Indian males and 173.0–178.5mm for Dravidianmales (Supplementary Table S1). Similarly, looking at cranialindex we find little if any difference between northern Indianmales (70.7–72.3) and southern Indian males (71.3–73.0) orbetween Indo-Aryan males (70.7–72.2) and Dravidian males(71.3–73.0).
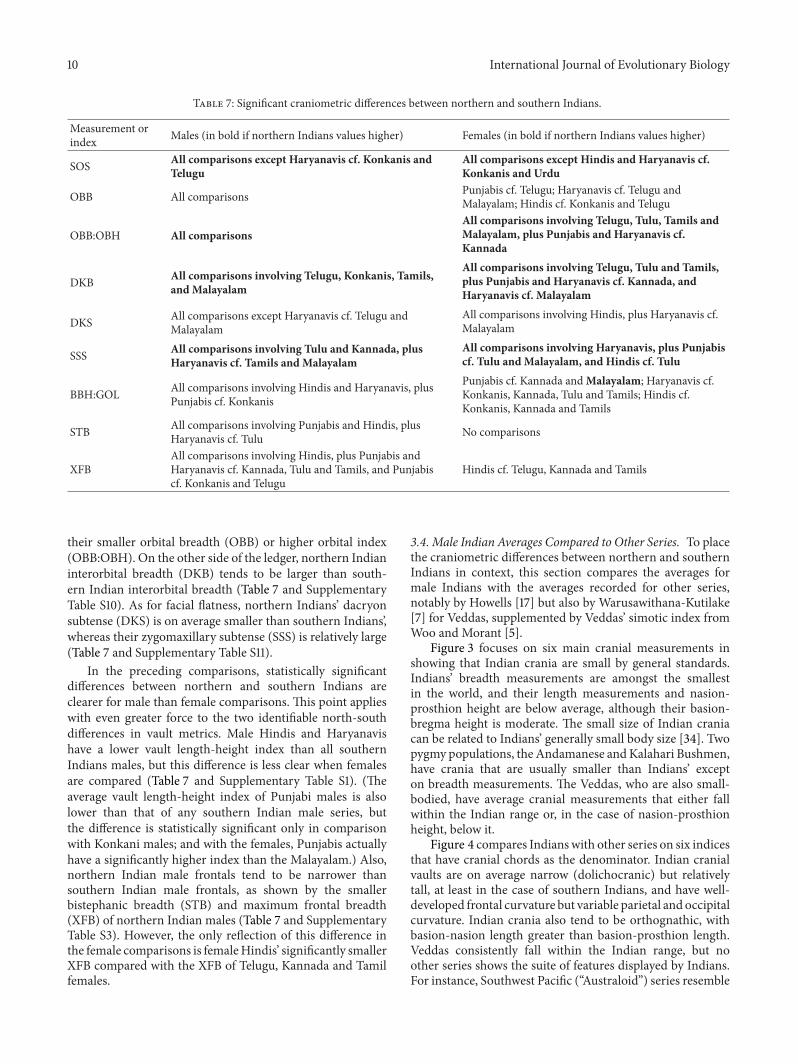
There are, however, some differences between northernand southern Indians in their craniometrics, comparingmales with males and females with females, to a degreethat is statistically significant, generally speaking (weightedSimes test). Average supraorbital projection (SOS) is largerfor northern Indians than southern Indians (Table 7 andSupplementary Table S8). The orbits are on average narroweramongst northern Indians than southern Indians (Table 7and Supplementary Table S9), whether expressed in terms of
10 International Journal of Evolutionary Biology
Table 7: Significant craniometric differences between northern and southern Indians.
Measurement orindex Males (in bold if northern Indians values higher) Females (in bold if northern Indians values higher)
SOS All comparisons except Haryanavis cf. Konkanis andTelugu
All comparisons except Hindis and Haryanavis cf.Konkanis and Urdu
OBB All comparisons Punjabis cf. Telugu; Haryanavis cf. Telugu andMalayalam; Hindis cf. Konkanis and Telugu
OBB:OBH All comparisonsAll comparisons involving Telugu, Tulu, Tamils andMalayalam, plus Punjabis and Haryanavis cf.Kannada
DKB All comparisons involving Telugu, Konkanis, Tamils,and Malayalam
All comparisons involving Telugu, Tulu and Tamils,plus Punjabis and Haryanavis cf. Kannada, andHaryanavis cf. Malayalam
DKS All comparisons except Haryanavis cf. Telugu andMalayalam
All comparisons involving Hindis, plus Haryanavis cf.Malayalam
SSS All comparisons involving Tulu and Kannada, plusHaryanavis cf. Tamils and Malayalam
All comparisons involving Haryanavis, plus Punjabiscf. Tulu and Malayalam, and Hindis cf. Tulu
BBH:GOL All comparisons involving Hindis and Haryanavis, plusPunjabis cf. Konkanis
Punjabis cf. Kannada andMalayalam; Haryanavis cf.Konkanis, Kannada, Tulu and Tamils; Hindis cf.Konkanis, Kannada and Tamils
STB All comparisons involving Punjabis and Hindis, plusHaryanavis cf. Tulu No comparisons
XFBAll comparisons involving Hindis, plus Punjabis andHaryanavis cf. Kannada, Tulu and Tamils, and Punjabiscf. Konkanis and Telugu
Hindis cf. Telugu, Kannada and Tamils
their smaller orbital breadth (OBB) or higher orbital index(OBB:OBH). On the other side of the ledger, northern Indianinterorbital breadth (DKB) tends to be larger than south-ern Indian interorbital breadth (Table 7 and SupplementaryTable S10). As for facial flatness, northern Indians’ dacryonsubtense (DKS) is on average smaller than southern Indians’,whereas their zygomaxillary subtense (SSS) is relatively large(Table 7 and Supplementary Table S11).
In the preceding comparisons, statistically significantdifferences between northern and southern Indians areclearer for male than female comparisons. This point applieswith even greater force to the two identifiable north-southdifferences in vault metrics. Male Hindis and Haryanavishave a lower vault length-height index than all southernIndians males, but this difference is less clear when femalesare compared (Table 7 and Supplementary Table S1). (Theaverage vault length-height index of Punjabi males is alsolower than that of any southern Indian male series, butthe difference is statistically significant only in comparisonwith Konkani males; and with the females, Punjabis actuallyhave a significantly higher index than the Malayalam.) Also,northern Indian male frontals tend to be narrower thansouthern Indian male frontals, as shown by the smallerbistephanic breadth (STB) and maximum frontal breadth(XFB) of northern Indian males (Table 7 and SupplementaryTable S3). However, the only reflection of this difference inthe female comparisons is femaleHindis’ significantly smallerXFB compared with the XFB of Telugu, Kannada and Tamilfemales.
3.4. Male Indian Averages Compared to Other Series. To placethe craniometric differences between northern and southernIndians in context, this section compares the averages formale Indians with the averages recorded for other series,notably by Howells [17] but also by Warusawithana-Kutilake[7] for Veddas, supplemented by Veddas’ simotic index fromWoo and Morant [5].
Figure 3 focuses on six main cranial measurements inshowing that Indian crania are small by general standards.Indians’ breadth measurements are amongst the smallestin the world, and their length measurements and nasion-prosthion height are below average, although their basion-bregma height is moderate. The small size of Indian craniacan be related to Indians’ generally small body size [34]. Twopygmy populations, the Andamanese andKalahari Bushmen,have crania that are usually smaller than Indians’ excepton breadth measurements. The Veddas, who are also small-bodied, have average cranial measurements that either fallwithin the Indian range or, in the case of nasion-prosthionheight, below it.
Figure 4 compares Indianswith other series on six indicesthat have cranial chords as the denominator. Indian cranialvaults are on average narrow (dolichocranic) but relativelytall, at least in the case of southern Indians, and have well-developed frontal curvature but variable parietal and occipitalcurvature. Indian crania also tend to be orthognathic, withbasion-nasion length greater than basion-prosthion length.Veddas consistently fall within the Indian range, but noother series shows the suite of features displayed by Indians.For instance, Southwest Pacific (“Australoid”) series resemble

International Journal of Evolutionary Biology 11
165 170 175 180 185 190 195
125 130 135 140 145 150 155
Male average maximum cranial breadth (mm)
125120 135130 145140
125120 135130 145140
Male average bizygomatic breadth (mm)
55 60 65 70 75
9590 105100 115110
Other Africa
Southwest PacificPolynesia/Micronesia
Amerindians BuriatsAinuEgypt
A
AndamansBushmen Eskimos
Europe
Male average glabello-occipital length (mm)
Male average basion-bregma height (mm)
Male average nasion-prosthion height (mm)
Male average basion-nasion length (mm)
Other East Asia
V
S
SN
SN
SS
SS N
N
V
SSSN
SS
NSS
NVS N S NSS
SSS
NNV
NS S
SS
SS
S
S V
N
S
SSN
SS
SN
V SS
SS
SSN
N
SN
South Asia (N: North India, S: South India, V: Vedda)
Figure 3: Male South Asians compared to Howells series on some main cranial measurements.

12 International Journal of Evolutionary Biology
68 70 75 78
19 2720
20 22 24
69 70 75 80 85
25 3329
86
25
Male average cranial index (GOL:XCB)
Male average vault length-height index (GOL:BBH)
Male average frontal curvature index (FRC:FRS)
Male average parietal curvature index (PAC:PAS)
A
Male average occipital curvature index (OCC:OCS)
92 97 102 107
SN
S
N SN
S
SSS
SS
S
SS
NS
N
SN
V
SSS
S
N
NV
N
SS
S
NS
S
SNSS
S
SN
SS
S SS
SN
SN
N
S
S SSN S
V S
S
NN
V
V
V
Male average gnathic index (BNL:BPL)
Other Africa
Southwest PacificPolynesia/Micronesia
Amerindians BuriatsAinuEgypt
AndamansBushmen Eskimos
Europe
Other East Asia
South Asia (N: North India, S: South India, V: Vedda)
Figure 4: Male South Asians compared to Howells series on indices of the cranial vault.

International Journal of Evolutionary Biology 13
Indians in their narrow vault but differ in their generallylower vault, prognathism, more receding frontal, and morebulging occipital bone.
Figure 5 compares Indians with other series on six indicesthat involve facial chords. Indian crania on average havea moderately wide biasterionic breadth in relation to bizy-gomatic breadth. Stock et al. [9] also found this to be afeature of Indian crania, but in their analysis it was a featureotherwise shared with Andamanese and Veddas, whereashere we instead find a European/Egyptian (“Caucasoid”)similarity for Indians. Indian crania also have a moderatetransverse craniofacial index, narrow face, wide bimaxillarybreadth compared to bizygomatic breadth, quite narrownasalaperture, and variable orbit shape. Indians’ variable orbitshape reflects the difference between southern Indians withbroad orbits and northern Indians with narrower orbits,noted above. None of the comparative series show thesuite of features displayed by Indians. For instance, Cauca-soids resemble Indians in their moderately wide biasterionicbreadth and narrow faces, but differ in their lower transversecraniofacial index and narrower bimaxillary breadth andnasal aperture.
Figure 6 compares Indianswith other series on their facialflatness indices. A low index reflects a flat face, as shownparticularly by the Buriats, other East Asians, and KalahariBushmen, whereas a high index reflects a medially protrusiveface. Indians are shown to have faces that are mediallyvery protrusive across the frontal, orbital, and nasal regionsand moderately protrusive across the maxilla (lower face).Veddas fall within the Indian range on the three availablecomparisons. Comparable results were obtained byWoo andMorant [5] and Hanihara [8], who found that South Asianstend to have the highest frontal flatness index in the world,high simotic index, andmoderate (zygo/pre)maxillary index.The larger dacryon subtense of southern Indians comparedto northern Indians, noted above, is underlined by southernIndians’ particularly high orbital flatness index.
Table 8 summarises the index comparisons in Figures 4 to6.When Indians are compared to other groups represented bymore than one series, a similarity is recognised when Indianseither fall within the range of the other group or else encom-pass the range of the other group. Dissimilarity is recognisedwhen the ranges are mutually exclusive. However, whenIndians are compared to single series, such as Andamaneseor Veddas, similarity is recognised when that series falls nearthe centre of the Indian range, and dissimilarity is recognisedwhen it falls well away from the Indian range.
Except for Buriats, every group or single series is similarto Indians on at least one index. Europe, Veddas, and Egyptregister the largest number of similarities (resp., seven, six,and five). Veddas are dissimilar from Indians on just oneindex, but every other group or single series is dissimilaron between four and six (Ainu, Egypt, Europe) to 13 indices(Kalahari Bushmen). Veddas would appear to be the non-Indian seriesmost similar to Indians, followed byCaucasoids.
3.5. Principal Components Analysis (PCA). PCA providesa multivariate perspective on the univariate and bivariatecomparisons detailed above. The comparisons include all
of the better sampled series measured by Howells [17] butexclude the Veddas, for whom we lack access to the originalmeasurements. The six Indian series with the largest samplesize—three from northern Indian and three from southernIndia—are included for analysis. As noted above, northernIndian cranial series are very similar to each other, as aresouthern Indian cranial series. Therefore, including the lesswell sampled Indian series would just add noise to theanalysis. Further, males and females are analysed separatelyin view of their shape distinctions, as described previously. Inaddition, cranial chord fractions are excluded in view of theirunreliability as reflected by their excessive variability.
Application of PCA produces very similar results forboth males and females. The first component (PC1) accountsfor 30% of variability (approximately), the second and thirdcomponents (PC2 and PC3) for 8% each, and the fourthand fifth components for 5% each (Table 9), with decreas-ingly smaller amounts for the remaining components. Asis common when PCA is applied to biological data [21],PC1 is a size component, with positive weightings on mostvariables (Table 10). In the present analysis, however, thePC1 weightings for the upper and middle facial subtensesare either negative (NAS, DKS, and SIS) or weakly positive(NDS).That is, large overall cranial size tends to be associatedwith upper and middle facial flatness. These subtenses alsohave the highest positive loadings on PC2, followed by craniallengths, while minimum cranial breadth (WCB), maximumcranial breadth (XCB), and malar subtense (MLS) havethe strongest negative loadings. In the case of PC3, whichis the second most important of the shape components,cranial breadths and especially frontal breadths have thehighest positive loadings (STB, XFB, XCB and AUB), whilebasion-prosthion length (BPL) has a strong negative loading(Table 10).
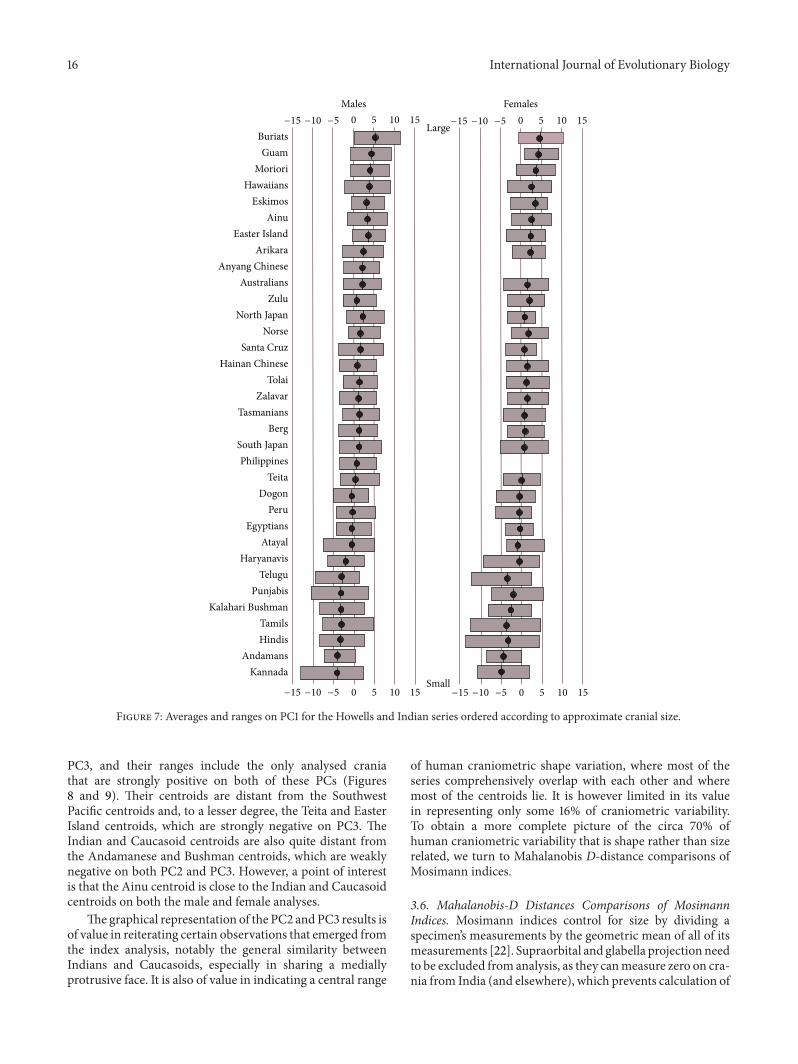
Figure 7 illustrates how the different series score on PC1,arranged in approximate order from the serieswith the largestcrania (Buriats, Guam, Polynesians, Eskimos, and theAinu ofJapan) to the series with the smallest crania (Indians, KalahariBushmen and Andamanese). Figure 7 presents the range ofPC1 scores for each series as well as the series averages.Inspection of the ranges shows that the smallest specimensin the series with the largest crania are of approximately thesame size as the largest specimens in the series with thesmallest crania. In the case of the series with intermediate-sized crania, their ranges overlap extensively with the rangesof both the series with large and small crania. Also of interest,there is a difference of around 10 between the series with thelargest and the smallest crania in terms of their average PC1score (Buriats scoring just over 5 compared with Kannadascoring just over −5), and this is similar to the difference ofaround 10 between the largest and smallest crania within anyseries (for instance, Buriats ranging between about 10 and0, and Kannada ranging very approximately between 0 and−10). These observations apply equally to males and females.
Figures 8 and 9 illustrate how the series compare thetwo main shape components, PC2 and PC3. The series arerepresented both by their centroids and their ranges ofvariation. For most series, these ranges overlap extensivelyand so it would be very difficult, and arguably unnecessary,

14 International Journal of Evolutionary Biology
77 80 85 87
90 95 100 105
46 5448
68 72 76
43 50 55 60 63
75 80 9085
50 52
70 74
45
Male average posterior craniofacial index (ZYB:ASB)
Male average transverse craniofacial index (XCB:ZYB)
Male average upper facial index (ZYB:NPH)
Male average bizygomatic-bimaxillary index (ZYB:ZMB)
Male average orbital index (OBB:OBH)
A
Male average nasal index (NLH:NLB)
SSS
N S S SS
NN
S
V
N
S
S NS
N SS
S
V
SS
VS S
SN
S
SNN
SS
NS
SN
SSS
N
VSSS
NNSS
NSS
NNNS
SS
SS
SS
V
V
Other Africa
Southwest PacificPolynesia/Micronesia
Amerindians BuriatsAinuEgypt
AndamansBushmen Eskimos
Europe
Other East Asia
South Asia (N: North India, S: South India, V: Vedda)
Figure 5: Male South Asians compared to Howells series on indices involving facial chords.

International Journal of Evolutionary Biology 15
7 11 15 19
18 30
35 40 60
14 18 22
17 67
45 50 55
27 37 47 57
16 20
22 26
Male average frontal flatness index (FMB:NAS)
Male average orbital flatness index (EKB:DKS)
Male average maxillary flatness index (ZMB:SSS)
Male average nasodacryal index (DKB:NDS)
A
Male average simotic index (WNB:SIS)
S S V S NSN SN
SS
NN N S S S S S S S
NN
NSS
SS
SS S
S
S SS
N S N S S N
VSSN
SNS S N S S
V
Other Africa
Southwest PacificPolynesia/Micronesia
Amerindians BuriatsAinuEgypt
AndamansBushmen Eskimos
Europe
Other East Asia
South Asia (N: North India, S: South India, V: Vedda)
Figure 6: Male South Asians compared to Howells series on indices of facial flatness.
to distinguish them from each other. The only ranges thatcan be individually labelled are those that relate to series thatfall towards the extremes of modern human craniometricvariation. Both the centroids and the ranges carry the samemessage for understanding differences between series incranial shape. For instance, Buriats are distinguished by astrongly negative score on PC2 and a strongly positive scoreon PC3. This is shown by the position of the Buriat centroidand also by the Buriat range, with approximately half of the
Buriat range of variation falling outside the range of variationdocumented for any of the other series. Also, while mostseries overlap with Buriats on their range, some do not,notably Southwest Pacific groups (Australians, Tasmanians,and Tolai), Easter Islanders, and (in the female analysis) theTeita and Zulu from Sub-Saharan Africa.
In accordwith the index analysis described above, Indiansand Caucasoids align on the two main shape indices. Theircentroids are neutral to weakly positive on both PC2 and
16 International Journal of Evolutionary Biology
Kannada
151050
AndamansHindisTamils
Kalahari BushmanPunjabis
TeluguHaryanavis
AtayalEgyptians
PeruDogon
TeitaPhilippines
South JapanBerg
TasmaniansZalavar
TolaiHainan Chinese
Santa CruzNorse
North JapanZulu
AustraliansAnyang Chinese
ArikaraEaster Island
AinuEskimos
HawaiiansMoriori
GuamBuriats
−5−10−15 151050−5−10−15
151050−5−10−15 151050−5−10−15
Males Females
Large
Small
Figure 7: Averages and ranges on PC1 for the Howells and Indian series ordered according to approximate cranial size.
PC3, and their ranges include the only analysed craniathat are strongly positive on both of these PCs (Figures8 and 9). Their centroids are distant from the SouthwestPacific centroids and, to a lesser degree, the Teita and EasterIsland centroids, which are strongly negative on PC3. TheIndian and Caucasoid centroids are also quite distant fromthe Andamanese and Bushman centroids, which are weaklynegative on both PC2 and PC3. However, a point of interestis that the Ainu centroid is close to the Indian and Caucasoidcentroids on both the male and female analyses.
The graphical representation of the PC2 and PC3 results isof value in reiterating certain observations that emerged fromthe index analysis, notably the general similarity betweenIndians and Caucasoids, especially in sharing a mediallyprotrusive face. It is also of value in indicating a central range
of human craniometric shape variation, where most of theseries comprehensively overlap with each other and wheremost of the centroids lie. It is however limited in its valuein representing only some 16% of craniometric variability.To obtain a more complete picture of the circa 70% ofhuman craniometric variability that is shape rather than sizerelated, we turn to Mahalanobis D-distance comparisons ofMosimann indices.
3.6. Mahalanobis-D Distances Comparisons of MosimannIndices. Mosimann indices control for size by dividing aspecimen’s measurements by the geometric mean of all of itsmeasurements [22]. Supraorbital and glabella projection needto be excluded from analysis, as they canmeasure zero on cra-nia from India (and elsewhere), which prevents calculation of

International Journal of Evolutionary Biology 17
AI: Ainu
AN: Andamans
AC: Anyang Chinese
AR: ArikaraAT: Atayal
AU: Australians
BE: Berg
BU: Buriats
KB: Kalahari Bushman
DO: Dogon
EI: Easter IslandEG: Egyptians
ES: Eskimos
GU: Guam
HC: Hainan Chinese
HW: Hawaiians
MO: Moriori
JN: North Japan
NO: NorsePE: Peru
PH: Philippines
JS: South Japan
SC: Santa Cruz
TA: Tasmanians
TT: Teita
TO: Tolai
ZA: Zalavar
ZU: ZuluHA: HaryanavisPU: PunjabisTL: TeluguTA: Tamils
KA: Kannada
HI: Hindis
Group centroids
AI
AN
AC
Anyan
g
ARAT
AU
Australians
BE
Berg
BU
Buriats
KB
Bushman
DO
EI
Easter
EG
Egypt
ES
GUHCHW
MO
JN
N. J
apan
NO
PEPH
Philippines
JS
SC
TA
Tasmanians
TT
TO
Tolai
ZA
Norse
ZU
HA
Punj
abi
PU
Har
yana
vi
TL
Telugu
TA
Tam
ils
KA
Kannada
HI
Hindis
Teita
Principal component 2
Prin
cipa
l com
pone
nt 3
East Asians
Sub-SaharanAfricans
SouthwestPacific
Indians/Caucasoids
Buriats/
0 1 2 3 4 5 6 7−7 −6 −5 −4 −3 −2 −1
0
1
2
3
4
5
6
−6
−5
−4
−3
−2
−1
Figure 8: Male centroids and ranges for PC2 and PC3 for the Howells and Indian cranial series.
the measurements’ geometric mean. Once the measurementswere transformed into Mosimann indices, the MahalanobisD2 distances between series were calculated. These distanceswere then converted into Euclidean distances by calculatingtheir square roots (Mahalanobis-D distances).The series werethen clustered using average-linkage hierarchical clustering.
Both the male and female dendrograms were seriated,according to a procedure described elsewhere [35]. Thisprocedure involves placing the series and/or clusters mostdifferent from each other at opposite poles of the seriation,and, to the extent permitted by the structure of the dendro-gram, ordering the other series and/or clusters according tothe degree to which they approach one or the other pole.In addition to emphasising extreme differences, the seriationexercise allows for the representation of secondary affinitiesthat may not be captured by the clusters themselves. Thesuccess of the seriated order in producing a perfect seriation ismeasured by the coefficient of variation between the orderedmatrix of interseries distances and the closest matrix thatcould be found with all of the distances perfectly seriated.(The results obtained here, which fall between 70 and 75%,can be described as “fair.”)
Based on the preceding analyses, the following predic-tions can be made of how Indians should compare withthe series measured by Howells. Indians should form a
distinct cluster, albeit with northern Indians distinguishablefrom southern Indians. Indians should be approached byCaucasoids, whereas Buriats and Bushmen should be farremoved.
The seriated dendrograms (Figures 10 and 11) agree in cer-tain fundamental respects. The three northern Indian seriescluster together, as do the three southern Indian clusters,before joining together into a distinct Indian cluster. Also,southern Indians lie at one pole, whereas northern Indiansare intermediate between southern Indians and other series(see below). In addition, Egyptians join the three Europeanseries to make a Caucasoid cluster, while the Andamanesejoin theDogon, Teita, andZulu of Sub-SaharanAfrica to forma distinct cluster. Another similarity between the male andfemale analyses is that Buriats, Eskimos, Easter Islanders, andSouthwest Pacific series (Australians, Tasmanians, and Tolai)are the series most distant from Indians.
Where Figures 10 and 11 disagree is in the secondaryaffinity suggested for Indians. In the male analysis, Indiansare flanked by Sub-Saharan African series (here countingBushmen), whereas in the female analysis, Indians plotadjacently to Caucasoids. Inspection of the original distances(Tables 11 and 12) shows that the female analysis is themore informative from the perspective of revealing Indians’wider affinities. Both male and female Indians are closer

18 International Journal of Evolutionary Biology
AI
AN
ARAT
AU
Australia
BE
Berg
BU
Buriats
KB
Bushman
DO
EI
Easter
EG
Egypt
ES
Eskimos
GUHC
HWMO
JN
NO
NorsePE
JSSC
TA
Tasmania
TE
Teita
TO
Tolai
ZA
Zalavar
ZU
Zulu
HA
Haryanavi
PU
PunjabiTE
Telugu
TA
Tamils
KA
Kannada
HI
Hindis
Buriats
Southwest Pacific/Sub-Saharan Africans
Indians/Caucasoids
Principal component 2
Prin
cipa
l com
pone
nt 3
0
1
2
3
4
5
6
−6
−5
−4
−3
−2
−1
AI: Ainu
AN: Andamans
AR: ArikaraAT: Atayal
AU: Australians
BE: Berg
BU: Buriats
KB: Kalahari Bushman
DO: Dogon
EI: Easter Island EG: Egyptians
ES: Eskimos
GU: Guam
HC: Hainan Chinese
HW: Hawaiians
MO: Moriori
JN: North Japan
NO: NorsePE: Peru
JS: South Japan
SC: Santa Cruz
TA: Tasmanians
TE: Teita
TO: Tolai
ZA: Zalavar
ZU: Zulu
HA: Haryanavis
PU: PunjabisTE: TeluguTA: Tamils
KA: Kannada
HI: Hindis
Group centroids
0 1 2 3 4 5 6 7−6 −5 −4 −3 −2 −1
Figure 9: Female centroids and ranges for PC2 and PC3 for the Howells and Indian cranial series.
to Europeans and Egyptians than to any other analysedseries, notably Bushmen. The reason why this fact does notemerge from the male analysis (Figure 10) is because thecraniometric distances between Indians and Sub-SaharanAfricans are smaller for males than females (Tables 11 and12). Accordingly, the male seriated dendrogram emphasisesthe craniometric distance between Buriats/Eskimos and Sub-Saharan Africans, overriding the craniometric differencebetween Indians and Sub-Saharan Africans, whereas in thefemale analysis these emphases are reversed.
The similarity between Indian and Andamanese craniaproposed by previous multivariate studies [6, 9, 10] cannotbe confirmed by our analysis. Instead, Andamanese clusterwith Sub-SaharanAfricans, as originally observed byHowells[3], whereas Indians are more similar to Caucasoids than toany other populations outside of South Asia. The reason forthe difference between our findings and those of previousstudies on Indian craniometrics may be the larger number ofvariables in our analysis presented here, 42 compared with 20to 30. Further, there is no evidence for the southern Indian-Andamanese affinity that would have been expected fromthe genetic comparisons of Reich et al. [16]. With barely anexception, southern Indians register a greater craniometricdistance from Andamanese than northern Indians do, justas southern Indians are more distant than northern Indians
from any other population outside of South Asia (Tables 11and 12).
4. Discussion
The literature review in our Introduction generated threehypotheses for our craniometric analysis. The first hypothe-sis, the distinction between northern and southern Indianswithin a discrete Indian cluster, was unequivocally con-firmed.The second hypothesis was confirmed as a secondary“Caucasoid” affinity emerged for northern Indians. However,the expectation from the third hypothesis of a secondaryAndamanese affinity for southern Indians was falsified.
The craniometric differences found here between north-ern and southern Indians are not in terms that might havebeen expected from the comparative literature. For instance,based on Bharati et al. [36], narrower crania might have beenexpected in the south than the north, but instead all of thesampled Indian series were found to have similarly narrowcrania. The explanation for this result may be that all of theseIndian populations inhabit hot climates [37], even if the torridheat of northern India’s lowlands is a seasonal phenomenon.If there is an adaptive basis for the differences that southernIndians show from northern Indians, such as broader orbits

International Journal of Evolutionary Biology 19
BuriatsEskimosAustraliansTasmaniansTolaiMorioriEasterIslandHawaiians
Guam
North JapanSouth Japan
AnyangHainanPhilippines
AtayalAinuArikaraSanta CruzPeru
NorseZalavar
EgyptBergAndamans
Teita
ZuluDogon
BushmanKalahari
Punjabis
HindisHaryanavis
TeluguTamilsKannada
7 6 5 4 3 2 1 0
Figure 10: Seriated average-linkage hierarchical dendrogram, Mahalanobis-D distances for 34 male series, Mosimann indices. (Coefficientof variation with a perfect seriation 72.3%.)
that are medially more protrusive, this basis remains to beexplored.
The distinctiveness of Andamanese and southern Indiancrania need not challenge the finding by Reich et al. [16]for an “Ancestral South Indian” ancestry shared by southernIndians and Andamanese.The point is that some populationsare craniometrically specialised while others are not. Thespecialised nature of Buriat craniometrics, which is very clearboth from index and multivariate analysis (Figures 4 to 11),has been noted previously [6].What the present analysis addsis that southern Indians also have specialised craniometrics.Andamanese on the other hand have unspecialised cranio-metrics, as shown by how they cluster with geographically
distant Sub-Saharan Africans, and seriate adjacently to thecentral bloc of recent human crania (consisting of Cauca-soids, Amerindians, and populations from Japan and Chinato Taiwan and parts of the Pacific). Therefore, southern Indi-ans’ craniometric distinctiveness from Andamanese shouldbe interpreted as a result of their craniometric specialisationrather than as evidence against a shared, ancient ancestrywithAndamanese.
Populations with medially protrusive upper and mid-dle faces are distributed from Scandinavia to the circum-Mediterranean, India, and Sri Lanka [5, 8]. This indicates theexistence of a population complex extending from Scandi-navia south-south-east to Sri Lanka. Gene flow across this

20 International Journal of Evolutionary Biology
BuriatsEskimos
AustraliansTasmanians
Tolai
Moriori
EasterIsland
Hawaiians
Guam
North Japan
South Japan
Hainan
Atayal
Ainu
ArikaraSanta Cruz
PeruNorseZalavarEgyptBerg
Andamans
Teita
ZuluDogon
BushmanKalahari
PunjabisHindisHaryanavisTeluguTamilsKannada
6 5 4 3 2 1 07
Figure 11: Seriated average-linkage hierarchical dendrogram, Mahalanobis-D distances for 32 female series, Mosimann indices. (Coefficientof variation with a perfect seriation 74.6%.)
continuously populated region would have been relativelyuninterrupted in comparison to the formidable barriers togene flow presented by the Atlantic Ocean to the northwest,the Sahara Desert to the southwest, and the Himalayas andEurasian Steppe to the northeast. Upper and middle facialprotrusion are developed particularly strongly in southernIndia (Figure 6). This observation is not explicable in termsof a contribution to the southern Indian gene pool fromCentral Asia and/or the Mediterranean. On the other hand,the intermediate position of northern Indians between south-ern Indians, and Caucasoids northwest of India, could beexplicable in terms of the incursion of Indo-European (Indo-Aryan) speakers into northern India from the northwest, oralternatively it could simply reflect clinal variation.
If there were an Australoid “substratum” componentto Indians’ ancestry, we would expect some degree ofcraniometric similarity between Howells’ Southwest Pacificseries and Indians. But in fact, the Southwest Pacific andIndian are craniometrically very distinct, falsifying any claimfor an Australoid substratum in India. Only the “Veddoid”substratum component invoked by some theories wouldbe potentially supported, based on the index similaritiesbetween Veddas and Indians.The problemwith this proposalis that, craniometrically, the Veddas should be viewed as justanother South Asian population. The basis for invoking theVeddas as representative of a substratum component, ratherthan the Kannada and Tamils (for instance), appears difficultto justify. Noteworthy in this context is the accumulating

International Journal of Evolutionary Biology 21
Table 8: Comparisons between Indians and Worldwide Series on Average Indices (Males)a.
Index Indians’variability Similarities Dissimilarities
Cranial Narrow Africa, Eskimos, SouthwestPacific, Veddas
Amerindians, Andamans, Buriats, East Asia, andEurope
Vault length-height Wide Polynesia/Micronesia, Veddas Bushmen
Frontal curvature Narrow Ainu Amerindians, Bushmen, Polynesia/Micronesia, andSouthwest Pacific
Parietal curvature Wide Egypt, Europe, Veddas Bushmen
Occipital curvature Wide Ainu, East Asia Buriats, Bushmen
Gnathic Moderate Egypt, Europe,Polynesia/Micronesia, Veddas Africa, Southwest Pacific
Posterior craniofacial Narrow Europe Africa, Amerindians, Buriats, Bushmen, Eskimos,Polynesia/Micronesia, and Southwest Pacific
Transverse craniofacial Narrow Africa, Ainu Andamans, Buriats, Bushmen, Egypt, Eskimos, andEurope
Upper facial Moderate Amerindians, East Asia, Europe Bushmen, Egypt, Southwest Pacific, and Veddas
Bizygomatic-bimaxillary Moderate Bushmen, Veddas Ainu, Europe, Southwest Pacific, andPolynesia/Micronesia
Nasal Narrow East Asia, Polynesia/Micronesia Africa, Bushmen, Egypt, Eskimos, Europe, andSouthwest Pacific
Orbital Wide Ainu, Bushmen, Europe,Southwest Pacific Amerindians, Andamans, and Polynesia/Micronesia
Frontal flatness Wide None All except Veddas and Egypt
Orbital flatness Wide None (Vedda comparisonunavailable) All except Veddas (comparison unavailable)
Maxillary flatness Moderate Andamans, Egypt, Veddas Ainu, Buriats, Bushmen, East Asia, and Eskimos
Nasodacryal WideAmerindians, Egypt, Eskimos,Europe (Vedda comparisonunavailable)
Africa, Buriats, Bushmen, and East Asia
Simotic Wide Amerindians, Europe Africa, Andamans, Buriats, Bushmen, East Asia, andSouthwest Pacific
a“Africa” and “East Asia” in this table respectively correspond to “other Africa” and “other East Asia” in Figures 3–5.
Table 9: Variability (per cent) explained by the first five principalcomponents.
Sex PC1 PC2 PC3 PC4 PC5Males 30.1 8.0 6.8 5.1 4.8Females 27.5 8.3 7.7 5.4 5.2
evidence that the Dravidian languages have a preagriculturalorigin in southern India and dispersed with the expansion ofthe southern Indian Neolithic [38].
We recognise that craniometric data are not as powerfulas genetic data in unmasking populations’ biological relat-edness. Indeed, where our results could not duplicate theaffinity between southern Indians and Andaman Islanderssuggested by genetic data, we attributed the discrepancy
to southern Indians’ craniometric specialisation. However,craniometric data have particular value for the analysis ofancient South Asian burials [13] which may not supportgenetic analysis if none of their ancient DNA has survived.As documented here, South Asian crania are characterisedby a distinctive suite of features which include tall, narrowvaults, and medially protrusive upper and middle faces.The hypothesis of predominantly local genetic origins forSouth Asian populations predicts that these features will alsocharacterise prehistoric burials.This point provides directionon where to focus attention in future studies on India’sprehistoric burials. At the same time, we should be mindfulof how variable crania within any Indian series can be in theirshape, an aspect that presumably also applied in the past.Therefore, when analysing a single specimen, we should beduly cautious in how much weight to place on the outcome,

22 International Journal of Evolutionary Biology
Table 10: Factor loadings of the measurementsa on the first three principal components.
Measurement PC 1 Males PC 2 Males PC 3 Males PC 1 Females PC 2 Females PC 3 FemalesNAS −0.126 0.766 0.030 −0.079 0.769 −0.212DKS −0.391 0.652 0.123 −0.275 0.716 −0.101SIS −0.134 0.588 0.218 −0.084 0.642 0.127NDS 0.092 0.483 0.023 0.171 0.473 −0.071GOL 0.691 0.485 −0.107 0.650 0.411 −0.259NOL 0.697 0.468 −0.073 0.677 0.400 −0.214WNB −0.020 0.427 0.063 −0.033 0.414 −0.119SSS 0.126 0.431 −0.189 0.084 0.351 −0.272BNL 0.627 0.429 −0.148 0.642 0.346 −0.226FRC 0.509 0.328 0.317 0.493 0.399 0.202PAC 0.364 0.301 −0.080 0.271 0.313 −0.282OBB 0.437 0.323 0.061 0.509 0.257 −0.093FRS −0.085 0.184 0.366 −0.044 0.345 0.217BBH 0.523 0.205 0.135 0.462 0.273 0.049STB 0.232 0.040 0.770 0.294 0.269 0.664OCS 0.359 0.191 −0.055 0.301 0.050 −0.002XFB 0.392 −0.031 0.765 0.424 0.235 0.670NLH 0.659 0.044 0.251 0.671 0.137 0.293PAS 0.044 0.057 0.023 0.027 0.122 −0.160BPL 0.626 0.177 −0.473 0.618 −0.043 −0.524FMB 0.762 0.112 −0.118 0.744 0.072 −0.263MDH 0.442 0.051 −0.007 0.393 0.084 0.097OCC 0.493 0.108 0.085 0.426 0.004 0.134NPH 0.671 0.008 0.199 0.678 0.082 0.236GLS 0.356 0.085 −0.295 0.302 −0.094 −0.341EKB 0.818 0.009 −0.140 0.800 −0.042 −0.244FOL 0.427 −0.019 0.096 0.379 0.084 0.128OBH 0.469 −0.059 0.219 0.467 0.004 0.269DKB 0.467 −0.060 −0.184 0.348 −0.030 −0.280ASB 0.654 −0.066 0.248 0.607 −0.006 0.306NLB 0.478 −0.032 −0.254 0.449 −0.117 −0.299IML 0.575 0.005 −0.386 0.545 −0.173 −0.423MDB 0.569 −0.029 −0.104 0.542 −0.144 −0.030XML 0.713 −0.030 −0.218 0.681 −0.161 −0.209MAB 0.705 −0.122 −0.098 0.640 −0.146 −0.059ZMB 0.697 −0.158 −0.088 0.642 −0.114 −0.026WMH 0.630 −0.140 0.092 0.609 −0.193 0.218JUB 0.892 −0.180 −0.086 0.860 −0.153 −0.096AUB 0.803 −0.191 0.281 0.785 −0.118 0.346ZYB 0.892 −0.183 0.037 0.869 −0.160 0.099SOS 0.508 −0.124 −0.304 0.456 −0.219 −0.324WCB 0.583 −0.287 0.280 0.587 −0.101 0.370XCB 0.687 −0.307 0.424 0.667 −0.194 0.449MLS 0.517 −0.296 −0.271 0.472 −0.351 −0.219aMeasurements in approximate order (weighted across males and females) from a large positive loading to a large negative loading on the second principalcomponent.

International Journal of Evolutionary Biology 23
Table 11: Mahalanobis-D distances after seriation, Mosimann indices, males, Indians, and Kalahari Bushmen compared with each other andwith other series.
Series Punjabis Hindis Haryanavis Telugu Tamils Kannada BushmenBuriats 7.054 7.079 7.389 7.791 8.067 8.099 7.154Eskimos 6.232 6.148 6.717 6.655 7.037 7.340 7.815Australians 5.615 5.685 5.939 6.433 6.821 7.153 6.603Tasmanians 6.077 6.169 6.345 6.664 7.070 7.637 6.440New Britain Tolai 5.758 5.770 6.299 6.320 6.753 7.178 7.162Moriori 6.411 6.377 6.292 7.240 7.717 7.819 8.128Easter Island 5.573 5.477 5.460 6.186 6.798 7.019 7.381Hawaiians 5.563 5.650 5.850 6.210 6.743 6.746 7.363Guam 5.157 5.207 5.625 5.868 6.511 6.589 7.246Anyang Chinese 5.886 5.999 6.498 6.723 7.214 7.035 6.748Hainan Chinese 5.067 5.220 5.832 6.270 6.716 6.537 6.761Philippines 4.935 5.092 5.718 6.053 6.501 6.466 6.226North Japan 5.157 5.414 6.059 6.602 7.067 6.906 6.449South Japan 4.743 4.911 5.566 5.957 6.440 6.349 6.438Taiwan Atayal 4.912 5.024 5.702 6.083 6.651 6.682 6.134Ainu 4.547 4.679 5.044 5.401 6.065 6.217 5.912Arikara (America) 5.438 5.273 5.550 6.272 6.610 6.882 7.799Santa Cruz (America) 5.166 5.241 5.630 6.500 6.754 7.015 6.906Peru (America) 4.871 4.802 5.038 6.013 6.371 6.501 7.224Zalavar (Europe) 3.795 3.648 4.061 4.693 5.349 5.766 6.022Norse (Europe) 4.425 4.278 4.067 5.317 5.943 6.227 6.210Egypt 4.214 4.257 4.201 5.125 5.628 5.836 6.619Berg (Europe) 4.986 4.983 5.049 5.829 6.335 6.619 6.208Andaman Islanders 5.125 5.801 6.275 6.417 6.993 6.908 6.153Zulu (Africa) 4.555 4.971 5.494 5.948 6.399 6.421 5.060Dogon (Africa) 5.745 6.290 6.580 6.901 7.420 7.216 5.670Teita (Africa) 5.084 5.216 5.381 6.240 6.479 6.421 5.366Punjabis 1.615 2.624 3.353 3.618 3.392 6.631Hindis 1.972 2.867 3.074 3.397 7.053Haryanavis 3.583 3.594 3.819 7.234Telugu 2.190 3.484 7.520Tamils 2.430 7.705Kannada 7.785
and when analysing a series we should expect some healthyvariability in the results.
5. Conclusions
Craniometric variability within any Indian series is con-siderable, but between Indian series it is slight for mostmeasurement and indices. Craniometric differences withinIndia boil down to a primary distinction between northernand southern Indians. When crania from outside India areconsidered, the Veddas are similar enough to be grouped
with Indians as “South Asians.” Otherwise, Caucasoid seriesfrom Egypt and Europe are closest to Indians, especiallynorthern Indians. The similarity between these Caucasoidsand northern Indians would be expected from geographi-cal considerations, but it may also reflect some degree ofpopulation incursion into northern India associated withthe introduction of Indo-Aryan languages. Southern Indianshave specialised craniometrics otherwise revealed only byother South Asians. Craniometric analysis thus accordswith recent genetic studies that point to a predominantlyindigenous component in Indians’ biological ancestry.

24 International Journal of Evolutionary Biology
Table 12: Mahalanobis𝐷-distances after seriation, Mossiman indices, females, and Indians compared with each other and with other series.
Series Hindis Punjabis Haryanavis Telugu Tamils KannadaBuriats 7.768 7.937 8.365 8.071 8.842 8.558Eskimos 6.452 6.710 7.128 6.650 7.298 7.452Easter Island 6.477 6.587 6.456 7.204 7.591 7.758Tasmanians 6.601 6.706 6.836 6.892 7.683 8.139Australians 5.687 5.959 6.270 6.299 7.163 7.195New Britain Tolai 6.031 6.330 6.579 6.822 7.497 7.363Kalahari Bushmen 6.730 6.968 7.607 7.225 7.971 7.968Teita (Africa) 6.170 6.558 6.765 6.922 7.419 7.231Dogon (Africa) 6.230 6.410 6.975 6.882 7.530 7.411Zulu (Africa) 5.244 5.607 6.089 6.258 6.814 6.751Andaman Islanders 6.572 6.513 7.319 6.833 7.660 7.539Mokapu Hawaiians 6.471 6.374 6.744 6.718 7.359 7.269Moriori 6.387 6.329 6.179 6.678 7.502 7.394Guam 5.632 5.678 6.075 6.181 6.909 6.802Hainan Chinese 5.697 5.820 6.410 6.360 6.941 6.869North Japan 5.741 5.634 6.484 6.469 7.301 7.147South Japan 5.578 5.694 6.341 6.268 7.082 6.981Taiwan Atayal 5.244 5.268 6.022 5.987 6.686 6.758Ainu 5.024 5.117 5.759 5.367 6.293 6.432Santa Cruz (America) 6.135 6.300 6.685 6.785 7.765 7.603Arikara (America) 5.415 5.732 5.716 5.933 6.809 6.510Peru (America) 5.656 6.027 6.038 6.394 7.244 6.882Norse (Europe) 4.625 4.944 4.855 5.177 6.175 6.127Zalavar (Europe) 4.482 4.785 5.115 5.225 6.192 6.111Egypt 4.823 5.039 5.217 5.339 6.314 6.211Berg (Europe) 5.352 5.655 5.796 6.049 6.958 6.826Hindis 1.887 2.238 2.892 3.196 3.123Punjabis 2.743 2.725 3.207 3.137Haryanavis 3.620 3.862 3.681Telugu 2.099 3.134Tamils 2.751
Acknowledgments
Funding for the first author’s fieldwork was provided by twosources. One was a large Australian Research Council grantto the second author and Colin Groves (“The Contributionof South Asia to the Peopling of Australasia”) and the secondwas a grant to the first author from the Australia-IndiaCouncil in Canberra. The authors would also like to thankthe many postgraduate medical students and researchersfrom various institutions who assisted the first author withaccess to the collections, especially the curators and headsof the collections under their care: Professors Balbitr Singhof the Government Medical College, Chandigarh; ProfessorsSubash Kaushal of the Government Medical College, Patiala;ProfessorsMoly Paul of ChristianMedical College, Ludhiana;Professors Reva Chaudhary of Lady Harding Medical Col-lege, New Delhi; Professors Kaul of Maulana Azad MedicalCollege, New Delhi; Professors Navneet Chauhan of KingGeorge Medical College, Lucknow; Professors Sahai of the
Department of Anthropology, University of Allahabad; Pro-fessors D. K. Satpathy, Director of theMedico-Legal Institute,Bhopal; Professors Usha Dhall of the Post Graduate Instituteof Medical Sciences, Rothak; Professors Ram Narayanan ofManipal Medical College, Karnataka; Professors NageswaraRao of Kasturba Medical College, Mangalore; Prof SaradaDevi and Dr. Teegala M. Reddy of Osmania Medical College,Hyderabad; Professors Subhadra Devi and Professors PapaRao of Sri Venkateshvara University, Tirupathi; Dr. KishoreKumar of Government Veterinary College, Vijayawada; Pro-fessors Balasubramaniam of St. John’s Medical College, Ban-galore; Dr. Manoj Kumar Mohanty of Dr. PNS Institute ofMedical Sciences & Research Foundation, Krishna; Profes-sors Padmanaban of the Post Graduate Institute of MedicalSciences, Pondicherry; Professors James Pandiyan and I. JeyaRaj of Madras Medical College, Chennai; Professors GeetaRamesh of the Madras Veterinary College, Chennai; and Dr.Barry Craig at the Anthropology Department of theMuseumof South Australia, Adelaide. Finally, the authors thank two

International Journal of Evolutionary Biology 25
anonymous referees for their remarks on an earlier version ofthis paper.
References
[1] G. ArunKumar, D. F. Soria-Henanz, V. J. Kavitha et al., “Popula-tion differentiation of southern Indian male lineages correlateswith agricultural expansions predating the caste system,” PLoSONE, vol. 7, no. 11, Article ID e50269, 2012.
[2] S. Oppenheimer, Out of Eden: The Peopling of the World,Robinson, London, UK, 2004.
[3] W. W. Howells, Cranial Variation in Man: A Study by Multi-variate Analysis of Patterns of Difference among Recent HumanPopulations, vol. 67 of Papers of the Peabody Museum, HarvardUniversity, Cambridge, Mass, USA, 1973.
[4] G. Harrower, “A study of the Hokien and the Tamil skull,”Transactions of the Royal Society of Edinburgh, vol. 54, no. 3, pp.573–599, 1926.
[5] T. L.Woo andG.M.Morant, “A biometric study of the “flatness”of the facial skeleton in man,” Biometrika, vol. 26, pp. 196–250,1934.
[6] C. L. Brace, D. P. Tracer, and K. D. Hunt, “Human craniofacialform and the evidence for the peopling of the Pacific,”Bulletin ofthe Indo-Pacific Prehistory Association, vol. 11, pp. 247–269, 1991.
[7] S.Warusawithana-Kutilake, Cranial Variation and the Dispersalof Modern Humans in South Asia, Tharansee Prints, Colombo,Sri Lanka, 1996.
[8] T. Hanihara, “Frontal and facial flatness of major humanpopulations,” American Journal of Physical Anthropology, vol.111, pp. 105–134, 2000.
[9] J. Stock, M. M. Lahr, and S. Kulatilake, “Cranial diversity inSouth Asia relative to modern human dispersals and globalpatterns of human variation,” in The Evolution and Historyof Human Populations in South Asia, M. D. Petraglia and B.Allchin, Eds., pp. 245–268, Springer, New York, NY, USA, 2007.
[10] R. Wright, “Detection of likely ancestry using CRANID,” inForensic Approaches toDeath, Disaster andAbuse,M.Oxenham,Ed., pp. 111–122, Australian Academic Press, Bowen Hills,Australia, 2008.
[11] C. S. Coon,The Origin of Races, A. Knopf, New York, NY, USA,1962.
[12] M. K. Bhasin, H. Walter, and H. Danker-Kopfe, People of India:An Investigation of Biological Variability in Ecological, Ethno-Economic and Linguistic Groups, Kamila-Raj Enterprises, Delhi,India, 1994.
[13] K. A. R. Kennedy, God-Apes and Fossil Men: Paleoanthropologyof South Asia, The University of Michigan Press, Ann Arbor,Mich, USA, 2000.
[14] P. Bellwood, First Farmers: The Origins of Agricultural Societies,Blackwell Publishing, Malden, Mass, USA, 2005.
[15] P. P. Majunder, “The human genetic history of South Asia,”Current Biology, vol. 20, pp. R184–R187, 2010.
[16] D. Reich, K. Thangaraj, N. Patterson, A. L. Price, and L. Singh,“Reconstructing Indian populationhistory,”Nature, vol. 461, no.7263, pp. 489–494, 2009.
[17] The William W. Howells craniometric data set, 2009,http://web.utk.edu/∼auerbach/HOWL.htm.
[18] S. K. Chatterji, Languages and Literatures of Modern India,Prakash Bhavan, Kolkata, India, 1963.
[19] A. Sarker, Handbook of Languages and Dialects of India, FirmaK. L. Mukhopadhyay, Kolkata, India, 1964.
[20] F. Bretz, M. Posch, E. Glimm, F. Klinglmueller, W. Maurer, andK. Rohmeyer, “Graphical approaches for multiple comparisonprocedures using weighted Bonferroni, Simes, or parametrictests,” Biometrical Journal, vol. 53, no. 6, pp. 894–913, 2011.
[21] I. T. Joliffe, Principal Components Analysis, Springer, New York,NY, USA, 2nd edition, 2002.
[22] J. N. Darroch and J. E. Mosimann, “Canonical and principalcomponents of shape,” Biometrika, vol. 72, no. 2, pp. 241–252,1985.
[23] A. B. Falsetti,W. L. Jungers, andT.M.Colle III, “Morphometricsof the callitrichid forelimb: a case study in size and shape,”International Journal of Primatology, vol. 14, no. 4, pp. 551–572,1993.
[24] W. L. Jungers, A. B. Falsetti, and C. E.Wall, “Shape, relative size,and size-adjustments in morphometrics,” American Journal ofPhysical Anthropology, vol. 38, supplement 2, pp. 137–161, 1995.
[25] P. J. Obendorf, C. E. Oxnard, and B. J. Kefford, “Are the smallhuman-like fossils found on Flores human endemic cretins?”Proceedings of the Royal Society B, vol. 275, no. 1640, pp. 1287–1296, 2008.
[26] N. von Cramon-Taubadel and R. Pinhasi, “Craniometric datasupport a mosaic model of demic and cultural neolithic dif-fusion to outlying regions of Europe,” Proceedings of the RoyalSociety B, vol. 278, no. 1720, pp. 2874–2880, 2011.
[27] T. S. Constandse-Westermann, Coefficients of Biological Dis-tance, Humanities Press, Oosterhout, The Netherlands, 1972.
[28] L. Tian, “Inferences on the common coefficient of variation,”Statistics in Medicine, vol. 24, no. 14, pp. 2213–2220, 2005.
[29] W. W. Howells, “Some uses of the standard deviation inanthropometry,” Human Biology, vol. 8, pp. 592–600, 1936.
[30] G. Brauer, “Osteometrie,” in Wesen und Methoden der Anthro-pologie, Band I. 1. Teil: Wissenschaftstheorie, Geschichte, mor-phologische Methoden, R. Knußman, Ed., pp. 160–192, GustavFischer, Stuttgart, Germany, 1988.
[31] S. L. Larnach and N. W. G. Macintosh, The Craniology of theAborigines of Coastal New South Wales, Oceania Monographsno. 13, The University of Sydney, Sydney, Australia, 1966.
[32] D. Shier, J. Butler, and R. Lewis, Hole’s Human Anatomy andPhysiology, chapter 7, McGraw-Hill, New York, NY, USA, 11thedition, 2009.
[33] D. R. Brothwell, Digging up Bones, British Museum (NaturalHistory), London, UK, 3rd edition, 1981.
[34] H. Field, Contributions to the Physical Anthropology of India,Field Research Projects, Coconut Grove, Fla, USA, 1970.
[35] D. Bulbeck, “Biological and cultural evolution in the popu-lation and culture history of Malaya’s anatomically moderninhabitants,” in Dynamics of Human Diversity: The Case ofMainland Southeast Asia, N. Enfield, Ed., Pacific Linguistics no.627, pp. 207–255,The Australian National University, Canberra,Australia, 2011.
[36] S. Bharati, S. Som, P. Bharati, andT. S.Vasulu, “Climate andheadform in India,” American Journal of Human Biology, vol. 13, no.5, pp. 626–634, 2001.
[37] K. L. Beals, “Head form and climatic stress,” American Journalof Physical Anthropology, vol. 37, no. 1, pp. 85–92, 1972.
[38] D. Q. Fuller, “Non-human genetics, agricultural origins andhistorical linguistics in SouthAsia,” inTheEvolution andHistoryof Human Populations in South Asia, M. D. Petraglia and B.Allchin, Eds., pp. 393–443, Springer, New York, NY, USA, 2007.

Submit your manuscripts athttp://www.hindawi.com
Hindawi Publishing Corporationhttp://www.hindawi.com Volume 2014
Anatomy Research International
PeptidesInternational Journal of
Hindawi Publishing Corporationhttp://www.hindawi.com Volume 2014
Hindawi Publishing Corporation http://www.hindawi.com
International Journal of
Volume 2014
Zoology
Hindawi Publishing Corporationhttp://www.hindawi.com Volume 2014
Molecular Biology International
GenomicsInternational Journal of
Hindawi Publishing Corporationhttp://www.hindawi.com Volume 2014
The Scientific World JournalHindawi Publishing Corporation http://www.hindawi.com Volume 2014
Hindawi Publishing Corporationhttp://www.hindawi.com Volume 2014
BioinformaticsAdvances in
Marine BiologyJournal of
Hindawi Publishing Corporationhttp://www.hindawi.com Volume 2014
Hindawi Publishing Corporationhttp://www.hindawi.com Volume 2014
Signal TransductionJournal of
Hindawi Publishing Corporationhttp://www.hindawi.com Volume 2014
BioMed Research International
Evolutionary BiologyInternational Journal of
Hindawi Publishing Corporationhttp://www.hindawi.com Volume 2014
Hindawi Publishing Corporationhttp://www.hindawi.com Volume 2014
Biochemistry Research International
ArchaeaHindawi Publishing Corporationhttp://www.hindawi.com Volume 2014
Hindawi Publishing Corporationhttp://www.hindawi.com Volume 2014
Genetics Research International
Hindawi Publishing Corporationhttp://www.hindawi.com Volume 2014
Advances in
Virolog y
Hindawi Publishing Corporationhttp://www.hindawi.com
Nucleic AcidsJournal of
Volume 2014
Stem CellsInternational
Hindawi Publishing Corporationhttp://www.hindawi.com Volume 2014
Hindawi Publishing Corporationhttp://www.hindawi.com Volume 2014
Enzyme Research
Hindawi Publishing Corporationhttp://www.hindawi.com Volume 2014
International Journal of
Microbiology


![Craniometric Analysis of the Hindbrain and Craniocervical ...epubs.surrey.ac.uk/813560/1/PLOS ONE Craniometric... · [25–27]. The Chihuahua is the smallest known dog breed for which](https://img.pdfslide.net/doc/110x75/5f6bfefecd418f439b108db3/craniometric-analysis-of-the-hindbrain-and-craniocervical-epubs-one-craniometric.jpg)