Embed Size (px)
Citation preview
Research ArticleIsland Modeling Using Unstructured Grid duringa Tropical Storm
Mourani Sinha1 Ravi Kumar Yadav2 and Paromita Chakraborty3
1Department of Mathematics Techno India University Saltlake Kolkata 700091 India2Geological Survey of India Hyderabad 500068 India3National Centre for Medium Range Weather Forecast Noida Uttar Pradesh 201309 India
Correspondence should be addressed to Mourani Sinha mou510gmailcom
Received 29 October 2015 Revised 6 January 2016 Accepted 17 January 2016
Academic Editor Leonard J Pietrafesa
Copyright copy 2016 Mourani Sinha et alThis is an open access article distributed under the Creative Commons Attribution Licensewhich permits unrestricted use distribution and reproduction in any medium provided the original work is properly cited
The coastal wave dynamics of Agatti island situated on a coral atoll in Lakshadweep India having a notable topographic featureof steeper eastern shore over the western shore is analysed in this study A multinested model setup is generated using the globalthird-generation models WAM (Wave Modeling) and SWAN (Simulating Waves Nearshore) A high resolution unstructured gridis generated for the domain containing the island using SMS (Surface-Water Modeling System) interpolated with merged GEBCO(General Bathymetric Chart of the Oceans) and SRTM (Shuttle Radar Topography Mission) bathymetry The SWAN model isintegrated with a fine resolution of one minute by one minute during the tropical storm 01A (05ndash10 June 2004) which passed nearthe island Model simulated significant wave height data when validated against satellite observations exhibited high accuracySWH (significant wave height) is observed to be greater for the west coast than that over the east coast of the island due to steepereastern shore and there is widespread wave energy dissipation along the southwest direction of wave propagation during normalconditions The one-dimensional energy density spectra generated during the storm period exhibit multimodality with structuredand unstructured grids
1 Introduction
Lakshadweep is an archipelago in the Arabian Sea (8∘ndash12∘31015840N latitude and 71∘Endash74∘E longitude) off the west coastof India and the region is well known for its coral diversityLakshadweep coral reefs are believed to play a significant rolein the distribution and maintenance of coral reef biodiversityin India [1] Various studies can be found conducted on thecoral islands as they play crucial role in tourism fishingbuilding materials coastal protection and providing newdrugs and biochemicals [2] Coral reefs protect the coastlinesfrom storm damage erosion and flooding by reducing thewave action Thus study of the coastal wave dynamics of theislands is of immense necessity
Agatti island is the westernmost island of LakshadweepIndia The latitude of the island is 108∘N and longitude is722∘EThe island is north-south elongated and is 75 km longThe width varies as we move north to south It is 1000mwideat its widest point in the northern part and tapers to almost
as little as 100m width in the south The island is flat andrises around 2 to 3m above the sea level The southern partconsists of a long narrow stretch of almost 2 km long and anaverage breadth of 100m The area of human settlement ofthe island is mostly concentrated in the northern portionAgatti is surrounded on all sides by a coral reef as an atolllike with prominence in the west side of the island Thewestern shore of the Agatti island is exposed to high wavesduring the southwest monsoon [3] The coral growth on thatpart is strong so as to protect the island from the southwestmonsoon Reference [4] reports the widespread bleaching ofthe corals in 2010 at Agatti Island Lakshadweep India and itsecological and socioeconomic impacts Reference [5] showshuman dependence on coral reefs in small islands basedon socioeconomic assessments Figure 1 gives the satelliteimagery of the island
The bathymetry of Agatti reveals an asymmetric crosssection of the atoll The western outer reef slope has a mildgradual descent with relatively wide terraces at 4 7 13 25 and
Hindawi Publishing CorporationInternational Journal of OceanographyVolume 2016 Article ID 5834572 8 pageshttpdxdoiorg10115520165834572
2 International Journal of Oceanography
Figure 1 Satellite imagery of Agatti Lakshadweep India
60 meters before it reaches 100ndash200-meter depths and thendrops to 520ndash640 meters and eventually reaches the 1300-meter seabedThe eastern slope is steep creates almost a wallwith very narrow terraces and reaches 200ndash300m within100 meters from the reef flat [1] The general topography ofLakshadweep group of islands exhibits steeper shore on theeast As the slopes become steeper the effect of the gravity onthe flow becomes greater and thus the beaches receive smallerwave heights
Due to extensive reef on the western side there is lesspossibility of the islands being eroded along this coastwhereas the eastern sector of the island is subjected to thedirect furry of thewave action causing the erosion [6] Studiesindicate that the island is quite stable for a considerable timeand it will continue to remain stable provided that propersteps are taken to prevent the erosionThere have been severalstudies on the geomorphic features of the island howeverthe study of the island topography from the dynamical viewpoint is being done for the first time Hence such analysesare prerequisite to understand the topography and coastlinefeatures on the basis of the effects of wind generated wavesenergy densities and conservation ofmass ormass transport
Numerical models can be used most effectively to com-pute wind generated surface waves Fine grid models arerequired for coastal regions which have varying bathymetrywhile for deep waters coarser grids can generate accuratewave parameters with less computational time The advan-tages of unstructured grids used to represent regions ofstrong bathymetry variations have been mentioned in manycontexts They not only reduce the number of computationalgrid points but also conserve spatial resolution in the shallowwater region In this paper we have generated a multinestedmodel setup for the domain containing the island using themodels WAM 453 and SWAN 4091 The purpose of thestudy is to compute and validate significant wave height alongthe coast of the island and analyse energy density spectra for
certain locations so as to understand the coastal dynamicalfeatures of the island
2 Materials and Methods
21 Models WAM is one of the most extensively tested wavemodels in the world and is well documented A detaileddescription of the WAM code is given by [7 8] SWAN is athird-generation wave model developed at Delft Universityof Technology which computes wind generated surfacegravity waves in coastal regions and inlandwatersThemodelis based on thewave action balance equationwith sources andsinks Although WAM and SWAN are both third-generationwave models which compute random short-crested windgenerated wavesWAM is primarily developed for deep waterocean waves whereas SWAN has been developed specificallyfor coastal and inland waters In spite of the fact that bothcodes can be used for shallow and deep water calculationsit must be noted that the application of SWAN on oceanscales is not recommended from an efficiency point of viewThe numerical model SWAN is able to characterize seawaves in nearshore regions taking into account the presenceof currents and wind generated waves This model wasdeveloped at the Technical University of Delft [9] and itcan be considered the nearshore version of the WAM model[10] An unstructured grid algorithm for SWAN presentedby [11] is reported to be numerically accurate and robust inits ability to simulate wave fields over shelf seas in coastalareas and shallow lakes while being sufficiently flexible topermit desired local mesh refinements in such areas SWANconsiders two types of grids namely structured and unstruc-tured Structured grids may be rectilinear and uniform orcurvilinear whereas unstructured gridsmay contain trianglesor a combination of triangles and quadrilaterals In thecurrent version of SWAN however only triangular meshescan be employed
The spatial scales of the wind waves propagating fromdeep to shallow waters are very different Thus mesh refine-ment near the coast is required to be implemented withoutoperating costs associated with grid adaptation at somedistance offshore Generally this is done with the help ofnested models in which first waves are generated on a coarsegrid for a larger region and then on a finer grid for a smallerregion using the coarse grid generated boundary conditionsAs stated in the SWANmanual the use of unstructured gridsoffers a good alternative to nested models not only becauseof the ease of optimal adaption of mesh resolution but alsobecause of the modest effort needed to generate grids aboutcomplicated geometries for example islands and irregularshorelines
This type of flexible meshes is particularly useful incoastal regions where the water depth varies greatly Asa result this variable spatial meshing gives the highestresolution where it is most needed The use of unstructuredgrids facilitates resolving the model area with a relative highaccuracy but with a much fewer grid points than with regulargrids
In our study to simulate the waves in the domaincontaining the island we have used the deep water model
International Journal of Oceanography 3
WAM for the coarse run to include the impact of the southernocean swells and then using the boundary conditions thestructured grid run and finally the unstructured grid run forthe complex geometry
22 SMS SMS (Surface-Water Modeling System) is devel-oped by the Environmental Modeling Research LaboratorySMS can be used to construct 2D and 3D finite elementmeshes and finite difference grids of rivers estuaries bays orwetland areasThe tools include a sophisticated set of creationand editing tools to handle complex modeling situationswith relative ease Several methods of finite element meshcreation are available allowing you to create any combinationof rectangular and triangular elements needed to representyour model domain Both cartesian and boundary-fitted gridcreation tools are available to allow representation of a modeldomain for finite difference models The powerful mesh orgrid creation tools coupled with GIS objects are what makesSMS such an easy-to-use and accurate modeling system
23 Data For this study we have used six hourly and 05-degree QSCATNCEP blended ocean winds as forcing to thewave models The ocean surface wind data is derived fromspatial blending of high resolution satellite data (SeaWindsinstrument on the QuickSCAT satellite (QSCAT)) and globalweather center reanalyses (NCEP) Bathymetry derived fromETOPO5 is given as input to the coarse model runs andthose derived from ETOPO1 are given as input to thefine model runs GEBCO (httpwwwgebconet) data andSRTM (httpsrtmcsicgiarorg) topography data are usedto generate the unstructured grid Model simulations arecomparedwith Envisat track altimeter data to check accuracy
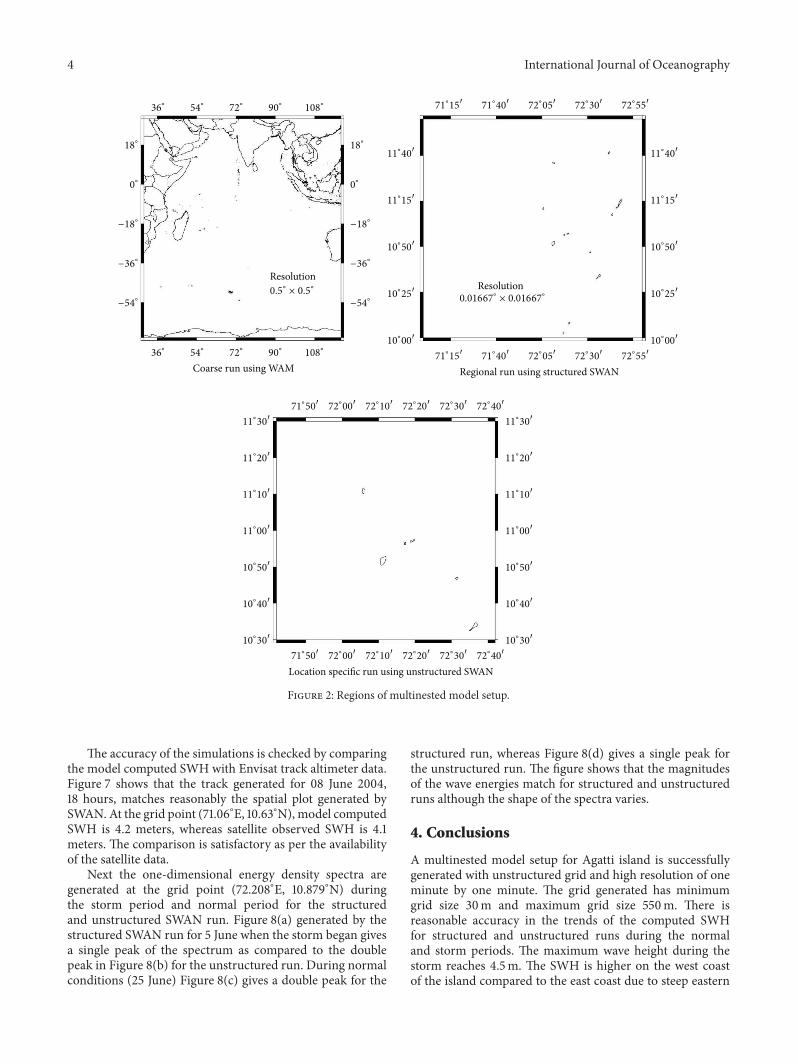
24 Model Experiments Amultinestedmodel setup is gener-ated consisting of (i) coarse run followed by (ii) regional runand finally (iii) location specific model run using unstruc-tured grid For the coarse run the WAM model is integratedfor the whole Indian Ocean (30∘E to 120∘E in longitude andfrom 70∘S to 30∘N in latitude) with NCEP blended windand ETOPO5 bathymetry of resolution 05 times 05 degreesto generate the boundary condition for the regional modelrun Then for the regional domain the nested structuredSWANmodel is compiled for 71∘Endash73∘E and 10∘Nndash12∘N in theArabian Sea with 11015840 times 11015840 resolution to generate the boundarycondition for nested unstructured SWAN run Finally thelocation specific model is used with unstructured grid forthe region 717∘Endash727∘E and 105∘Nndash115∘N to compute thewave parameters Figure 2 depicts the regions of multinestedmodel run
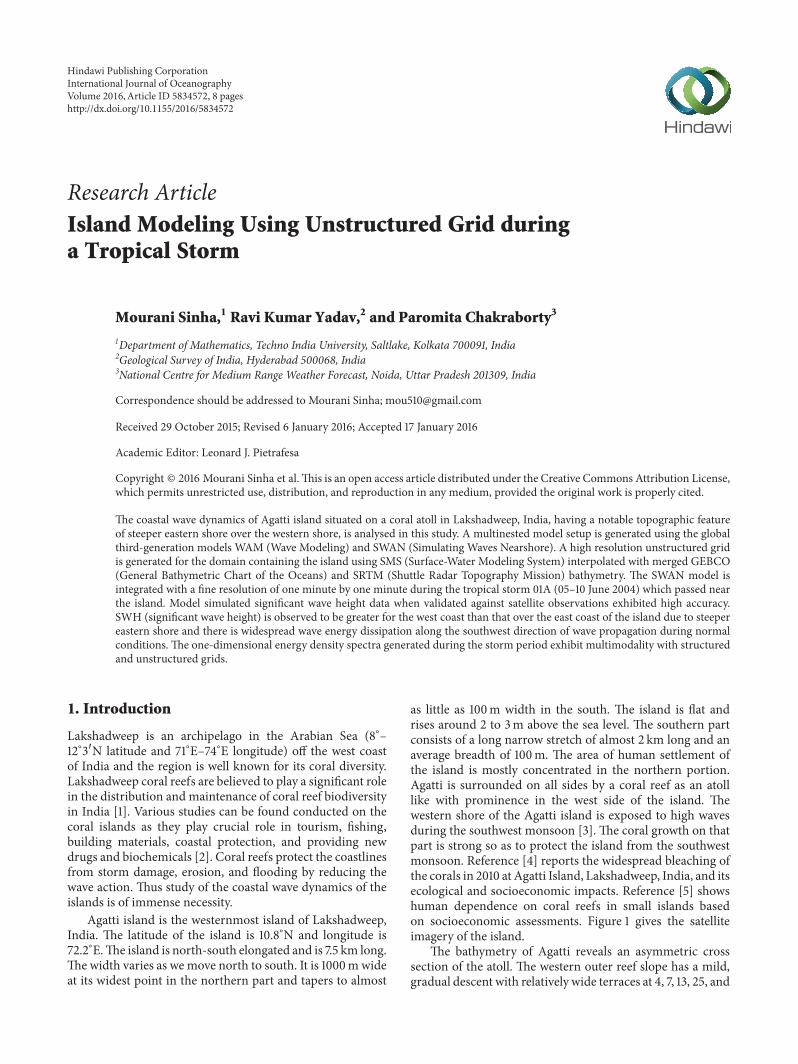
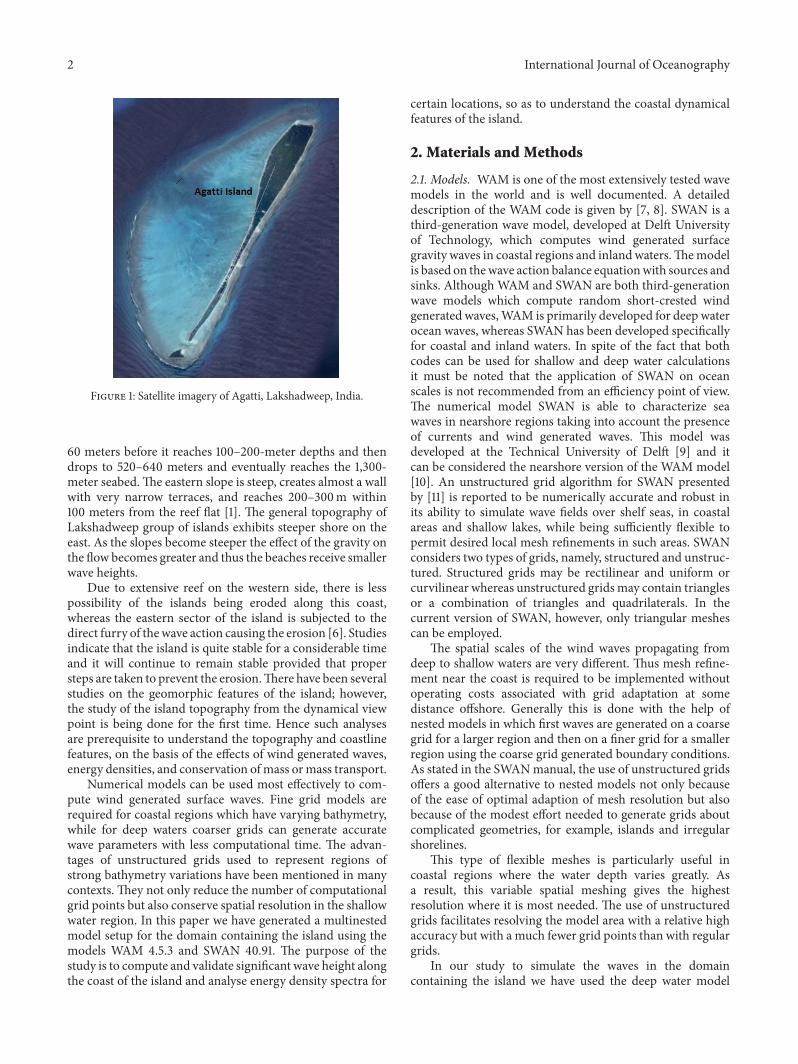
For generating the unstructured grid first we merged theGEBCO (httpwwwgebconet) data of 1 arc-minute (18 km)resolution and SRTM (httpsrtmcsicgiarorg) topographydata (3 arc-seconds or 90m) extracted for the domain ofstudy The merged data is then interpolated to the mesh withclear coast line using SMS Hence the grid generated given byFigure 3 has minimum grid size of 30 meters and maximumgrid size of 550 meters Thus a multinested model setup isdeveloped and taking into account the tropical storm 01A(05ndash10 June 2004) (httpweatherunisyscomhurricane)
shown in Figure 4 which passed near the Agatti island themodel is run during the storm period
3 Results and Discussion
In this experiment the multinested models are run for themonths of May June and July 2004 For a particular gridpoint (72208∘E 10879∘N) computed SWH are comparedfor structured and unstructured SWAN model simulations(Figure 5(a)) The trend observed from the figure depictsreasonable accuracy of the magnitude of the significantwave heights The correlation coefficient calculated is 05and this may be due to high resolution and complex gridgeneration method used for the unstructured case Whennormal conditions prevail SWH ranges from 2 to 25m forboth structured and unstructured cases During the stormperiod SWH increases up to 25m for the unstructured and35m for the structured model There is an underpredictionof the SWHvalues for the unstructured SWAN run comparedto structured run which may be attributed to the differentboundary conditions given to both runs The boundaryconditions given to the structured SWAN run includes theimpacts of the southern ocean swells generated by the coarseWAM run The unstructured SWAN run uses the boundaryconditions from the structured run and thus may not includethe swell impacts efficiently
Figure 5(b) shows the spatial plots for the structured andunstructured SWAN runs during normal conditions In thiscase the time chosen is 31 May 2004 00 hours For bothplots the wave heights are between 1 and 4 meters Theunstructured plot shows strong wave dissipation after thewaves travel across the reef along the southwest directionin which the waves also propagate in May The wave heightsbecome smaller because of breaking and frictional resistanceFigure 5(c) represents similar plots during storm periodHere the time chosen is 08 June 2004 00 hours Higherwave conditions prevail for the entire region with wavedissipation less widespread There is under prediction for theunstructured runs for both the normal and storm conditions
Figures 6(a) and 6(b) give the SWH plots for the unstruc-tured SWAN run at the initial stage (5 June 18 hrs) of thestorm and at the matured stage (10 June 00 hrs) of the stormFor the entire domain SWH ranges between 1 and 35m at theinitial stage and it increases to 45m as the storm maturesTo understand the dynamics of the wave parameters alongthe Agatti coast we have selected a box containing the islandwhich is magnified and shown in the figure Initially theSWH is approximately 1 meter on the east coast of the islandand approximately 2 meters on the west coast There areseveral studies which report the higher wave height on thewestern shore of the island during the southwest monsoonAs mentioned earlier the western outer reef slope of Agattihas a mild gradual descent while the eastern slope is steep
As the storm intensifies the SWH increases to about 2meters in the east coast and about 3 meters in the west coastThe higher SWH at the west coast over the east coast can beattributed to steeper shore on the eastern side As the wavesreach the steeper bottom there is reduction in the heightsfaster
4 International Journal of Oceanography
Coarse run using WAM Regional run using structured SWAN
36∘
54∘
72∘
90∘
108∘
36∘
54∘
72∘
90∘
108∘
18∘
0∘
minus18∘
minus36∘
minus54∘
18∘
0∘
minus18∘
minus36∘
minus54∘
11∘40
998400
11∘15
998400
10∘25
998400
10∘50
998400
10∘00
998400
11∘40
998400
11∘15
998400
10∘25
998400
10∘50
998400
10∘00
998400
71∘15
99840071
∘40
99840072
∘30
99840072
∘05
99840072
∘55
998400
71∘15
99840071
∘40
99840072
∘30
99840072
∘05
99840072
∘55
998400
Location specific run using unstructured SWAN
71∘50
99840072
∘00
99840072
∘10
99840072
∘20
99840072
∘30
99840072
∘40
998400
71∘50
99840072
∘00
99840072
∘10
99840072
∘20
99840072
∘30
99840072
∘40
998400
11∘30
998400
11∘20
998400
11∘10
998400
11∘00
998400
10∘50
998400
10∘40
998400
10∘30
998400
11∘30
998400
11∘20
998400
11∘10
998400
11∘00
998400
10∘50
998400
10∘40
998400
10∘30
998400
ResolutionResolution05
∘times 05
∘
001667∘times 001667
∘
Figure 2 Regions of multinested model setup
The accuracy of the simulations is checked by comparingthe model computed SWH with Envisat track altimeter dataFigure 7 shows that the track generated for 08 June 200418 hours matches reasonably the spatial plot generated bySWAN At the grid point (7106∘E 1063∘N) model computedSWH is 42 meters whereas satellite observed SWH is 41meters The comparison is satisfactory as per the availabilityof the satellite data
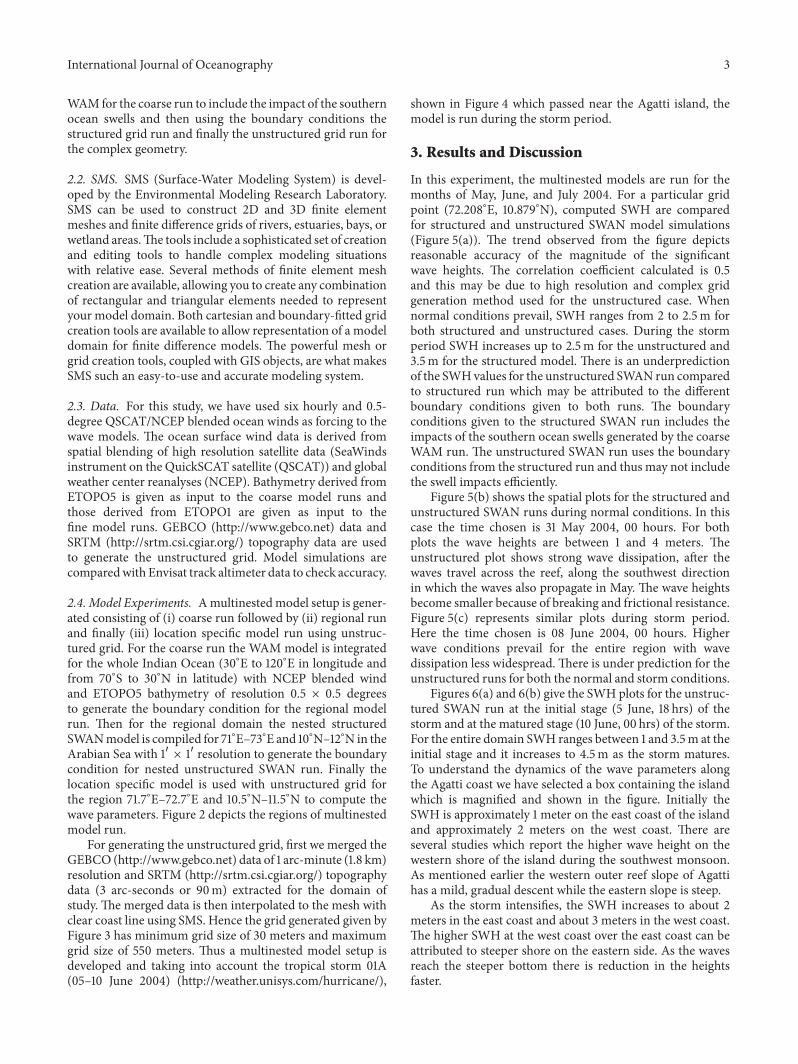
Next the one-dimensional energy density spectra aregenerated at the grid point (72208∘E 10879∘N) duringthe storm period and normal period for the structuredand unstructured SWAN run Figure 8(a) generated by thestructured SWAN run for 5 June when the storm began givesa single peak of the spectrum as compared to the doublepeak in Figure 8(b) for the unstructured run During normalconditions (25 June) Figure 8(c) gives a double peak for the
structured run whereas Figure 8(d) gives a single peak forthe unstructured run The figure shows that the magnitudesof the wave energies match for structured and unstructuredruns although the shape of the spectra varies
4 Conclusions
A multinested model setup for Agatti island is successfullygenerated with unstructured grid and high resolution of oneminute by one minute The grid generated has minimumgrid size 30m and maximum grid size 550m There isreasonable accuracy in the trends of the computed SWHfor structured and unstructured runs during the normaland storm periods The maximum wave height during thestorm reaches 45m The SWH is higher on the west coastof the island compared to the east coast due to steep eastern
International Journal of Oceanography 5
Maximum grid size 550 metersMinimum grid size 30 meters
Grid area 1∘ times 1∘
Latitude 105∘N to 115∘N
Longitude 717∘E to 727∘E
Figure 3 Unstructured grid for Agatti island generated by SMS
Agatti
Figure 4 Track of tropical storm 01A (05ndash10 June 2004)
slope of the island There is widespread dissipation of waveenergy during normal conditions after the waves cross thereef For the SWAN computations satellite validation ofthe SWH data is satisfactory Energy density spectrums arecompared during normal and stormconditions for structuredand unstructured runs and it is concluded that althoughthe magnitudes match the shape of the spectrum variesThe coral reef islands play an important role in shaping theecosystems that have inhabited our tropical oceans for many
million yearsThe inhabitants are vulnerable to extreme waveconditions and hazards and thus long term study of waveclimate of such regions is a necessity
Conflict of Interests
The authors declare that there is no conflict of interestsregarding the publication of this paper
6 International Journal of Oceanography
02
-05
-0400
12
-05
-0400
22
-05
-0400
01
-06
-0400
11
-06
-0400
21
-06
-0400
01
-07
-0400
11
-07
-0400
21
-07
-0400
31
-07
-0400
SWH
(m)
454
353
252
151
050
SWH (structured)SWH (unstructured)
(a)
Structured SWAN run
Unstructured SWAN run
Hsig
Hsig
31 May 2004 00hrs
10∘N
11∘N
12∘N
Latit
ude
0
1
2
3
4
5
6
SWH
(m)
0
1
2
3
4
5
6
SWH
(m)
72∘E 73
∘E71∘E
Longitude
719 721 723 725 727717
Longitude
104
105
106
107
108
109
11
111
112
113
Latit
ude
40998400
20998400
40998400
40998400
20998400
20998400
40998400
20998400
(b)
Structured SWAN run
Unstructured SWAN run
Hsig
Hsig
08 June 2004 00hrs
10∘N
11∘N
12∘N
Latit
ude
0
1
2
3
4
5
6
SWH
(m)
0
1
2
3
4
5
6
SWH
(m)
72∘E 73
∘E71∘E
Longitude
719 721 723 725 727717
Longitude
104
105
106
107
108
109
11
111
112
113
Latit
ude
40998400
20998400
40998400
40998400
20998400
20998400
40998400
20998400
(c)
Figure 5 (a) SWH for structured and unstructured SWAN at 72208∘E 10879∘N (b) SWH plots for structured and unstructured SWANruns during normal conditions (c) SWH plots for structured and unstructured SWAN runs during storm conditions
International Journal of Oceanography 7
05 June 2004 18hrs
0
1
2
3
4
5
6
SWH
(m)
0
1
2
3
4
5
6
SWH
(m)
Longitude
719 721 723 725 727717
Longitude
104
105
106
107
108
109
11
111
112
113
Latit
ude
7214 7216 7218 7220 7222 7224
108
1081
1082
1083
1084
1085
1086
1087
1088
1089
109
Latit
ude
X 722Y 1086Z 1342
(a)
10 June 2004 00hrs
0
1
2
3
4
5
6
SWH
(m)
0
1
2
3
4
5
6
SWH
(m)
719 721 723 725 727717
Longitude
104
105
106
107
108
109
11
111
112
113
Latit
ude
Longitude7214 7216 7218 7220 7222 7224
108
1081
1082
1083
1084
1085
1086
1087
1088
1089
109
Latit
ude
X 722Y 1087Z 1657
(b)
Figure 6 (a) SWHplots for SWAN runwith unstructured grid at the beginning of the storm (b) SWHplots for SWAN runwith unstructuredgrid at the end of the storm
08 June 2004 18hrs Hsig
02468
1012141618202224
72 74 76 78 80700
1
2
3
4
5
8
7
6
72 7371 724722 726 728718714712 716
Longitude
10
102
104
106
108
11
112
114
116
118
12
Latit
ude
Figure 7 Envisat track for SWH and model computed SWH on 08 June 2004 18 hours
8 International Journal of Oceanography
Structured 20040605_00
0 02 04 06 08 1
Frequency (Hz)
0
1
2
3
4
5
6
7
8
9
10En
ergy
den
sitie
s (m
2H
z)
(a)
Unstructured 20040605_00
0 02 04 06 08 1
Frequency (Hz)
0
1
2
3
4
5
6
7
8
9
10
Ener
gy d
ensit
ies (
m2H
z)
(b)
Structured 20040625_00
0 02 04 06 08 1
Frequency (Hz)
0
1
2
3
4
5
6
7
8
9
10
Ener
gy d
ensit
ies (
m2H
z)
(c)
Unstructured 20040625_00
0 02 04 06 08 1
Frequency (Hz)
0
1
2
3
4
5
6
7
8
9
10
Ener
gy d
ensit
ies (
m2H
z)
(d)
Figure 8 Energy density spectrum for 5 June and 25 June at 72208∘E 10879∘N
Acknowledgment
The authors are thankful to Professor A D Rao CAS IITDelhi for his guidance and help in doing the experiments
References
[1] V Hoon and I Babu ldquoSocioeconomic monitoring andassessment for coral reef management at Agatti Island UTof Lakshadweep CARESS LMRCC Indiardquo 2012 httpdocslibgovnoaa documentsCoRISSociEco Monitoring Lakshadweeppdf
[2] B K Carte ldquoBiomedical potential of marine natural productsrdquoBioScience vol 46 no 4 pp 271ndash286 1996
[3] P Chandramohan N M Anand and B U Nayak ldquoShorelinedynamics of the Lakshadweep islandsrdquo Indian Journal ofMarineSciences vol 22 no 3 pp 198ndash202 1993
[4] T T Ajith Kumar and T Balasubramanian ldquoBleaching of coralsin Agatti-Lakshadweep India a window viewrdquo in Proceedings ofthe 12th International Coral Reef Symposium (ICRS rsquo12) CairnsAustralia July 2012
[5] V Hoon and C Loper ldquoA decade of community-based socioe-conomic monitoring in Lakshadweep India 2001-2011rdquo in
Proceedings of the 12th International Coral Reef Symposium(ICRS rsquo12) Cairns Australia July 2012
[6] B G Wagle and P D Kunte ldquoPhoto-geomorphologic study ofrepresentative islands of Lakshadweeprdquo Gondwana GeologicalMagazine vol 4 pp 203ndash209 1999
[7] H P Gunther K Hasselmann S Hasselmann and P A E MJanssen ldquoThe WAM model cycle 4rdquo DKRZ Report 4 DKRZHamburg Germany 1992
[8] G J Komen L Cavaleri M Donelan K Hasselmann SHasselmann and P A E M Janssen Dynamics and Modellingof Ocean Waves Cambridge University Press Cambridge UK1994
[9] N Booij R C Ris and L H Holthuijsen ldquoA third-generationwave model for coastal regions 1 Model description andvalidationrdquo Journal of Geophysical Research C Oceans vol 104no 4 pp 7649ndash7666 1999
[10] WAMDI Group ldquoThe WAM modelmdasha third generation oceanwave prediction modelrdquo Journal of Physical Oceanography vol18 pp 1775ndash1810 1988
[11] M Zijlema ldquoComputation of wind-wave spectra in coastalwaters with SWAN on unstructured gridsrdquoCoastal Engineeringvol 57 no 3 pp 267ndash277 2010
Submit your manuscripts athttpwwwhindawicom
Hindawi Publishing Corporationhttpwwwhindawicom Volume 2014
ClimatologyJournal of
EcologyInternational Journal of
Hindawi Publishing Corporationhttpwwwhindawicom Volume 2014
EarthquakesJournal of
Hindawi Publishing Corporationhttpwwwhindawicom Volume 2014
Hindawi Publishing Corporationhttpwwwhindawicom
Applied ampEnvironmentalSoil Science
Volume 2014
Mining
Hindawi Publishing Corporationhttpwwwhindawicom Volume 2014
Journal of
Hindawi Publishing Corporation httpwwwhindawicom Volume 2014
International Journal of
Geophysics
OceanographyInternational Journal of
Hindawi Publishing Corporationhttpwwwhindawicom Volume 2014
Journal of Computational Environmental SciencesHindawi Publishing Corporationhttpwwwhindawicom Volume 2014
Journal ofPetroleum Engineering
Hindawi Publishing Corporationhttpwwwhindawicom Volume 2014
GeochemistryHindawi Publishing Corporationhttpwwwhindawicom Volume 2014
Journal of
Atmospheric SciencesInternational Journal of
Hindawi Publishing Corporationhttpwwwhindawicom Volume 2014
OceanographyHindawi Publishing Corporationhttpwwwhindawicom Volume 2014
Advances in
Hindawi Publishing Corporationhttpwwwhindawicom Volume 2014
MineralogyInternational Journal of
Hindawi Publishing Corporationhttpwwwhindawicom Volume 2014
MeteorologyAdvances in
The Scientific World JournalHindawi Publishing Corporation httpwwwhindawicom Volume 2014
Paleontology JournalHindawi Publishing Corporationhttpwwwhindawicom Volume 2014
ScientificaHindawi Publishing Corporationhttpwwwhindawicom Volume 2014
Hindawi Publishing Corporationhttpwwwhindawicom Volume 2014
Geological ResearchJournal of
Hindawi Publishing Corporationhttpwwwhindawicom Volume 2014
Geology Advances in
2 International Journal of Oceanography
Figure 1 Satellite imagery of Agatti Lakshadweep India
60 meters before it reaches 100ndash200-meter depths and thendrops to 520ndash640 meters and eventually reaches the 1300-meter seabedThe eastern slope is steep creates almost a wallwith very narrow terraces and reaches 200ndash300m within100 meters from the reef flat [1] The general topography ofLakshadweep group of islands exhibits steeper shore on theeast As the slopes become steeper the effect of the gravity onthe flow becomes greater and thus the beaches receive smallerwave heights
Due to extensive reef on the western side there is lesspossibility of the islands being eroded along this coastwhereas the eastern sector of the island is subjected to thedirect furry of thewave action causing the erosion [6] Studiesindicate that the island is quite stable for a considerable timeand it will continue to remain stable provided that propersteps are taken to prevent the erosionThere have been severalstudies on the geomorphic features of the island howeverthe study of the island topography from the dynamical viewpoint is being done for the first time Hence such analysesare prerequisite to understand the topography and coastlinefeatures on the basis of the effects of wind generated wavesenergy densities and conservation ofmass ormass transport
Numerical models can be used most effectively to com-pute wind generated surface waves Fine grid models arerequired for coastal regions which have varying bathymetrywhile for deep waters coarser grids can generate accuratewave parameters with less computational time The advan-tages of unstructured grids used to represent regions ofstrong bathymetry variations have been mentioned in manycontexts They not only reduce the number of computationalgrid points but also conserve spatial resolution in the shallowwater region In this paper we have generated a multinestedmodel setup for the domain containing the island using themodels WAM 453 and SWAN 4091 The purpose of thestudy is to compute and validate significant wave height alongthe coast of the island and analyse energy density spectra for
certain locations so as to understand the coastal dynamicalfeatures of the island
2 Materials and Methods
21 Models WAM is one of the most extensively tested wavemodels in the world and is well documented A detaileddescription of the WAM code is given by [7 8] SWAN is athird-generation wave model developed at Delft Universityof Technology which computes wind generated surfacegravity waves in coastal regions and inlandwatersThemodelis based on thewave action balance equationwith sources andsinks Although WAM and SWAN are both third-generationwave models which compute random short-crested windgenerated wavesWAM is primarily developed for deep waterocean waves whereas SWAN has been developed specificallyfor coastal and inland waters In spite of the fact that bothcodes can be used for shallow and deep water calculationsit must be noted that the application of SWAN on oceanscales is not recommended from an efficiency point of viewThe numerical model SWAN is able to characterize seawaves in nearshore regions taking into account the presenceof currents and wind generated waves This model wasdeveloped at the Technical University of Delft [9] and itcan be considered the nearshore version of the WAM model[10] An unstructured grid algorithm for SWAN presentedby [11] is reported to be numerically accurate and robust inits ability to simulate wave fields over shelf seas in coastalareas and shallow lakes while being sufficiently flexible topermit desired local mesh refinements in such areas SWANconsiders two types of grids namely structured and unstruc-tured Structured grids may be rectilinear and uniform orcurvilinear whereas unstructured gridsmay contain trianglesor a combination of triangles and quadrilaterals In thecurrent version of SWAN however only triangular meshescan be employed
The spatial scales of the wind waves propagating fromdeep to shallow waters are very different Thus mesh refine-ment near the coast is required to be implemented withoutoperating costs associated with grid adaptation at somedistance offshore Generally this is done with the help ofnested models in which first waves are generated on a coarsegrid for a larger region and then on a finer grid for a smallerregion using the coarse grid generated boundary conditionsAs stated in the SWANmanual the use of unstructured gridsoffers a good alternative to nested models not only becauseof the ease of optimal adaption of mesh resolution but alsobecause of the modest effort needed to generate grids aboutcomplicated geometries for example islands and irregularshorelines
This type of flexible meshes is particularly useful incoastal regions where the water depth varies greatly Asa result this variable spatial meshing gives the highestresolution where it is most needed The use of unstructuredgrids facilitates resolving the model area with a relative highaccuracy but with a much fewer grid points than with regulargrids
In our study to simulate the waves in the domaincontaining the island we have used the deep water model
International Journal of Oceanography 3
WAM for the coarse run to include the impact of the southernocean swells and then using the boundary conditions thestructured grid run and finally the unstructured grid run forthe complex geometry
22 SMS SMS (Surface-Water Modeling System) is devel-oped by the Environmental Modeling Research LaboratorySMS can be used to construct 2D and 3D finite elementmeshes and finite difference grids of rivers estuaries bays orwetland areasThe tools include a sophisticated set of creationand editing tools to handle complex modeling situationswith relative ease Several methods of finite element meshcreation are available allowing you to create any combinationof rectangular and triangular elements needed to representyour model domain Both cartesian and boundary-fitted gridcreation tools are available to allow representation of a modeldomain for finite difference models The powerful mesh orgrid creation tools coupled with GIS objects are what makesSMS such an easy-to-use and accurate modeling system
23 Data For this study we have used six hourly and 05-degree QSCATNCEP blended ocean winds as forcing to thewave models The ocean surface wind data is derived fromspatial blending of high resolution satellite data (SeaWindsinstrument on the QuickSCAT satellite (QSCAT)) and globalweather center reanalyses (NCEP) Bathymetry derived fromETOPO5 is given as input to the coarse model runs andthose derived from ETOPO1 are given as input to thefine model runs GEBCO (httpwwwgebconet) data andSRTM (httpsrtmcsicgiarorg) topography data are usedto generate the unstructured grid Model simulations arecomparedwith Envisat track altimeter data to check accuracy
24 Model Experiments Amultinestedmodel setup is gener-ated consisting of (i) coarse run followed by (ii) regional runand finally (iii) location specific model run using unstruc-tured grid For the coarse run the WAM model is integratedfor the whole Indian Ocean (30∘E to 120∘E in longitude andfrom 70∘S to 30∘N in latitude) with NCEP blended windand ETOPO5 bathymetry of resolution 05 times 05 degreesto generate the boundary condition for the regional modelrun Then for the regional domain the nested structuredSWANmodel is compiled for 71∘Endash73∘E and 10∘Nndash12∘N in theArabian Sea with 11015840 times 11015840 resolution to generate the boundarycondition for nested unstructured SWAN run Finally thelocation specific model is used with unstructured grid forthe region 717∘Endash727∘E and 105∘Nndash115∘N to compute thewave parameters Figure 2 depicts the regions of multinestedmodel run
For generating the unstructured grid first we merged theGEBCO (httpwwwgebconet) data of 1 arc-minute (18 km)resolution and SRTM (httpsrtmcsicgiarorg) topographydata (3 arc-seconds or 90m) extracted for the domain ofstudy The merged data is then interpolated to the mesh withclear coast line using SMS Hence the grid generated given byFigure 3 has minimum grid size of 30 meters and maximumgrid size of 550 meters Thus a multinested model setup isdeveloped and taking into account the tropical storm 01A(05ndash10 June 2004) (httpweatherunisyscomhurricane)
shown in Figure 4 which passed near the Agatti island themodel is run during the storm period
3 Results and Discussion
In this experiment the multinested models are run for themonths of May June and July 2004 For a particular gridpoint (72208∘E 10879∘N) computed SWH are comparedfor structured and unstructured SWAN model simulations(Figure 5(a)) The trend observed from the figure depictsreasonable accuracy of the magnitude of the significantwave heights The correlation coefficient calculated is 05and this may be due to high resolution and complex gridgeneration method used for the unstructured case Whennormal conditions prevail SWH ranges from 2 to 25m forboth structured and unstructured cases During the stormperiod SWH increases up to 25m for the unstructured and35m for the structured model There is an underpredictionof the SWHvalues for the unstructured SWAN run comparedto structured run which may be attributed to the differentboundary conditions given to both runs The boundaryconditions given to the structured SWAN run includes theimpacts of the southern ocean swells generated by the coarseWAM run The unstructured SWAN run uses the boundaryconditions from the structured run and thus may not includethe swell impacts efficiently
Figure 5(b) shows the spatial plots for the structured andunstructured SWAN runs during normal conditions In thiscase the time chosen is 31 May 2004 00 hours For bothplots the wave heights are between 1 and 4 meters Theunstructured plot shows strong wave dissipation after thewaves travel across the reef along the southwest directionin which the waves also propagate in May The wave heightsbecome smaller because of breaking and frictional resistanceFigure 5(c) represents similar plots during storm periodHere the time chosen is 08 June 2004 00 hours Higherwave conditions prevail for the entire region with wavedissipation less widespread There is under prediction for theunstructured runs for both the normal and storm conditions
Figures 6(a) and 6(b) give the SWH plots for the unstruc-tured SWAN run at the initial stage (5 June 18 hrs) of thestorm and at the matured stage (10 June 00 hrs) of the stormFor the entire domain SWH ranges between 1 and 35m at theinitial stage and it increases to 45m as the storm maturesTo understand the dynamics of the wave parameters alongthe Agatti coast we have selected a box containing the islandwhich is magnified and shown in the figure Initially theSWH is approximately 1 meter on the east coast of the islandand approximately 2 meters on the west coast There areseveral studies which report the higher wave height on thewestern shore of the island during the southwest monsoonAs mentioned earlier the western outer reef slope of Agattihas a mild gradual descent while the eastern slope is steep
As the storm intensifies the SWH increases to about 2meters in the east coast and about 3 meters in the west coastThe higher SWH at the west coast over the east coast can beattributed to steeper shore on the eastern side As the wavesreach the steeper bottom there is reduction in the heightsfaster
4 International Journal of Oceanography
Coarse run using WAM Regional run using structured SWAN
36∘
54∘
72∘
90∘
108∘
36∘
54∘
72∘
90∘
108∘
18∘
0∘
minus18∘
minus36∘
minus54∘
18∘
0∘
minus18∘
minus36∘
minus54∘
11∘40
998400
11∘15
998400
10∘25
998400
10∘50
998400
10∘00
998400
11∘40
998400
11∘15
998400
10∘25
998400
10∘50
998400
10∘00
998400
71∘15
99840071
∘40
99840072
∘30
99840072
∘05
99840072
∘55
998400
71∘15
99840071
∘40
99840072
∘30
99840072
∘05
99840072
∘55
998400
Location specific run using unstructured SWAN
71∘50
99840072
∘00
99840072
∘10
99840072
∘20
99840072
∘30
99840072
∘40
998400
71∘50
99840072
∘00
99840072
∘10
99840072
∘20
99840072
∘30
99840072
∘40
998400
11∘30
998400
11∘20
998400
11∘10
998400
11∘00
998400
10∘50
998400
10∘40
998400
10∘30
998400
11∘30
998400
11∘20
998400
11∘10
998400
11∘00
998400
10∘50
998400
10∘40
998400
10∘30
998400
ResolutionResolution05
∘times 05
∘
001667∘times 001667
∘
Figure 2 Regions of multinested model setup
The accuracy of the simulations is checked by comparingthe model computed SWH with Envisat track altimeter dataFigure 7 shows that the track generated for 08 June 200418 hours matches reasonably the spatial plot generated bySWAN At the grid point (7106∘E 1063∘N) model computedSWH is 42 meters whereas satellite observed SWH is 41meters The comparison is satisfactory as per the availabilityof the satellite data
Next the one-dimensional energy density spectra aregenerated at the grid point (72208∘E 10879∘N) duringthe storm period and normal period for the structuredand unstructured SWAN run Figure 8(a) generated by thestructured SWAN run for 5 June when the storm began givesa single peak of the spectrum as compared to the doublepeak in Figure 8(b) for the unstructured run During normalconditions (25 June) Figure 8(c) gives a double peak for the
structured run whereas Figure 8(d) gives a single peak forthe unstructured run The figure shows that the magnitudesof the wave energies match for structured and unstructuredruns although the shape of the spectra varies
4 Conclusions
A multinested model setup for Agatti island is successfullygenerated with unstructured grid and high resolution of oneminute by one minute The grid generated has minimumgrid size 30m and maximum grid size 550m There isreasonable accuracy in the trends of the computed SWHfor structured and unstructured runs during the normaland storm periods The maximum wave height during thestorm reaches 45m The SWH is higher on the west coastof the island compared to the east coast due to steep eastern
International Journal of Oceanography 5
Maximum grid size 550 metersMinimum grid size 30 meters
Grid area 1∘ times 1∘
Latitude 105∘N to 115∘N
Longitude 717∘E to 727∘E
Figure 3 Unstructured grid for Agatti island generated by SMS
Agatti
Figure 4 Track of tropical storm 01A (05ndash10 June 2004)
slope of the island There is widespread dissipation of waveenergy during normal conditions after the waves cross thereef For the SWAN computations satellite validation ofthe SWH data is satisfactory Energy density spectrums arecompared during normal and stormconditions for structuredand unstructured runs and it is concluded that althoughthe magnitudes match the shape of the spectrum variesThe coral reef islands play an important role in shaping theecosystems that have inhabited our tropical oceans for many
million yearsThe inhabitants are vulnerable to extreme waveconditions and hazards and thus long term study of waveclimate of such regions is a necessity
Conflict of Interests
The authors declare that there is no conflict of interestsregarding the publication of this paper
6 International Journal of Oceanography
02
-05
-0400
12
-05
-0400
22
-05
-0400
01
-06
-0400
11
-06
-0400
21
-06
-0400
01
-07
-0400
11
-07
-0400
21
-07
-0400
31
-07
-0400
SWH
(m)
454
353
252
151
050
SWH (structured)SWH (unstructured)
(a)
Structured SWAN run
Unstructured SWAN run
Hsig
Hsig
31 May 2004 00hrs
10∘N
11∘N
12∘N
Latit
ude
0
1
2
3
4
5
6
SWH
(m)
0
1
2
3
4
5
6
SWH
(m)
72∘E 73
∘E71∘E
Longitude
719 721 723 725 727717
Longitude
104
105
106
107
108
109
11
111
112
113
Latit
ude
40998400
20998400
40998400
40998400
20998400
20998400
40998400
20998400
(b)
Structured SWAN run
Unstructured SWAN run
Hsig
Hsig
08 June 2004 00hrs
10∘N
11∘N
12∘N
Latit
ude
0
1
2
3
4
5
6
SWH
(m)
0
1
2
3
4
5
6
SWH
(m)
72∘E 73
∘E71∘E
Longitude
719 721 723 725 727717
Longitude
104
105
106
107
108
109
11
111
112
113
Latit
ude
40998400
20998400
40998400
40998400
20998400
20998400
40998400
20998400
(c)
Figure 5 (a) SWH for structured and unstructured SWAN at 72208∘E 10879∘N (b) SWH plots for structured and unstructured SWANruns during normal conditions (c) SWH plots for structured and unstructured SWAN runs during storm conditions
International Journal of Oceanography 7
05 June 2004 18hrs
0
1
2
3
4
5
6
SWH
(m)
0
1
2
3
4
5
6
SWH
(m)
Longitude
719 721 723 725 727717
Longitude
104
105
106
107
108
109
11
111
112
113
Latit
ude
7214 7216 7218 7220 7222 7224
108
1081
1082
1083
1084
1085
1086
1087
1088
1089
109
Latit
ude
X 722Y 1086Z 1342
(a)
10 June 2004 00hrs
0
1
2
3
4
5
6
SWH
(m)
0
1
2
3
4
5
6
SWH
(m)
719 721 723 725 727717
Longitude
104
105
106
107
108
109
11
111
112
113
Latit
ude
Longitude7214 7216 7218 7220 7222 7224
108
1081
1082
1083
1084
1085
1086
1087
1088
1089
109
Latit
ude
X 722Y 1087Z 1657
(b)
Figure 6 (a) SWHplots for SWAN runwith unstructured grid at the beginning of the storm (b) SWHplots for SWAN runwith unstructuredgrid at the end of the storm
08 June 2004 18hrs Hsig
02468
1012141618202224
72 74 76 78 80700
1
2
3
4
5
8
7
6
72 7371 724722 726 728718714712 716
Longitude
10
102
104
106
108
11
112
114
116
118
12
Latit
ude
Figure 7 Envisat track for SWH and model computed SWH on 08 June 2004 18 hours
8 International Journal of Oceanography
Structured 20040605_00
0 02 04 06 08 1
Frequency (Hz)
0
1
2
3
4
5
6
7
8
9
10En
ergy
den
sitie
s (m
2H
z)
(a)
Unstructured 20040605_00
0 02 04 06 08 1
Frequency (Hz)
0
1
2
3
4
5
6
7
8
9
10
Ener
gy d
ensit
ies (
m2H
z)
(b)
Structured 20040625_00
0 02 04 06 08 1
Frequency (Hz)
0
1
2
3
4
5
6
7
8
9
10
Ener
gy d
ensit
ies (
m2H
z)
(c)
Unstructured 20040625_00
0 02 04 06 08 1
Frequency (Hz)
0
1
2
3
4
5
6
7
8
9
10
Ener
gy d
ensit
ies (
m2H
z)
(d)
Figure 8 Energy density spectrum for 5 June and 25 June at 72208∘E 10879∘N
Acknowledgment
The authors are thankful to Professor A D Rao CAS IITDelhi for his guidance and help in doing the experiments
References
[1] V Hoon and I Babu ldquoSocioeconomic monitoring andassessment for coral reef management at Agatti Island UTof Lakshadweep CARESS LMRCC Indiardquo 2012 httpdocslibgovnoaa documentsCoRISSociEco Monitoring Lakshadweeppdf
[2] B K Carte ldquoBiomedical potential of marine natural productsrdquoBioScience vol 46 no 4 pp 271ndash286 1996
[3] P Chandramohan N M Anand and B U Nayak ldquoShorelinedynamics of the Lakshadweep islandsrdquo Indian Journal ofMarineSciences vol 22 no 3 pp 198ndash202 1993
[4] T T Ajith Kumar and T Balasubramanian ldquoBleaching of coralsin Agatti-Lakshadweep India a window viewrdquo in Proceedings ofthe 12th International Coral Reef Symposium (ICRS rsquo12) CairnsAustralia July 2012
[5] V Hoon and C Loper ldquoA decade of community-based socioe-conomic monitoring in Lakshadweep India 2001-2011rdquo in
Proceedings of the 12th International Coral Reef Symposium(ICRS rsquo12) Cairns Australia July 2012
[6] B G Wagle and P D Kunte ldquoPhoto-geomorphologic study ofrepresentative islands of Lakshadweeprdquo Gondwana GeologicalMagazine vol 4 pp 203ndash209 1999
[7] H P Gunther K Hasselmann S Hasselmann and P A E MJanssen ldquoThe WAM model cycle 4rdquo DKRZ Report 4 DKRZHamburg Germany 1992
[8] G J Komen L Cavaleri M Donelan K Hasselmann SHasselmann and P A E M Janssen Dynamics and Modellingof Ocean Waves Cambridge University Press Cambridge UK1994
[9] N Booij R C Ris and L H Holthuijsen ldquoA third-generationwave model for coastal regions 1 Model description andvalidationrdquo Journal of Geophysical Research C Oceans vol 104no 4 pp 7649ndash7666 1999
[10] WAMDI Group ldquoThe WAM modelmdasha third generation oceanwave prediction modelrdquo Journal of Physical Oceanography vol18 pp 1775ndash1810 1988
[11] M Zijlema ldquoComputation of wind-wave spectra in coastalwaters with SWAN on unstructured gridsrdquoCoastal Engineeringvol 57 no 3 pp 267ndash277 2010
Submit your manuscripts athttpwwwhindawicom
Hindawi Publishing Corporationhttpwwwhindawicom Volume 2014
ClimatologyJournal of
EcologyInternational Journal of
Hindawi Publishing Corporationhttpwwwhindawicom Volume 2014
EarthquakesJournal of
Hindawi Publishing Corporationhttpwwwhindawicom Volume 2014
Hindawi Publishing Corporationhttpwwwhindawicom
Applied ampEnvironmentalSoil Science
Volume 2014
Mining
Hindawi Publishing Corporationhttpwwwhindawicom Volume 2014
Journal of
Hindawi Publishing Corporation httpwwwhindawicom Volume 2014
International Journal of
Geophysics
OceanographyInternational Journal of
Hindawi Publishing Corporationhttpwwwhindawicom Volume 2014
Journal of Computational Environmental SciencesHindawi Publishing Corporationhttpwwwhindawicom Volume 2014
Journal ofPetroleum Engineering
Hindawi Publishing Corporationhttpwwwhindawicom Volume 2014
GeochemistryHindawi Publishing Corporationhttpwwwhindawicom Volume 2014
Journal of
Atmospheric SciencesInternational Journal of
Hindawi Publishing Corporationhttpwwwhindawicom Volume 2014
OceanographyHindawi Publishing Corporationhttpwwwhindawicom Volume 2014
Advances in
Hindawi Publishing Corporationhttpwwwhindawicom Volume 2014
MineralogyInternational Journal of
Hindawi Publishing Corporationhttpwwwhindawicom Volume 2014
MeteorologyAdvances in
The Scientific World JournalHindawi Publishing Corporation httpwwwhindawicom Volume 2014
Paleontology JournalHindawi Publishing Corporationhttpwwwhindawicom Volume 2014
ScientificaHindawi Publishing Corporationhttpwwwhindawicom Volume 2014
Hindawi Publishing Corporationhttpwwwhindawicom Volume 2014
Geological ResearchJournal of
Hindawi Publishing Corporationhttpwwwhindawicom Volume 2014
Geology Advances in
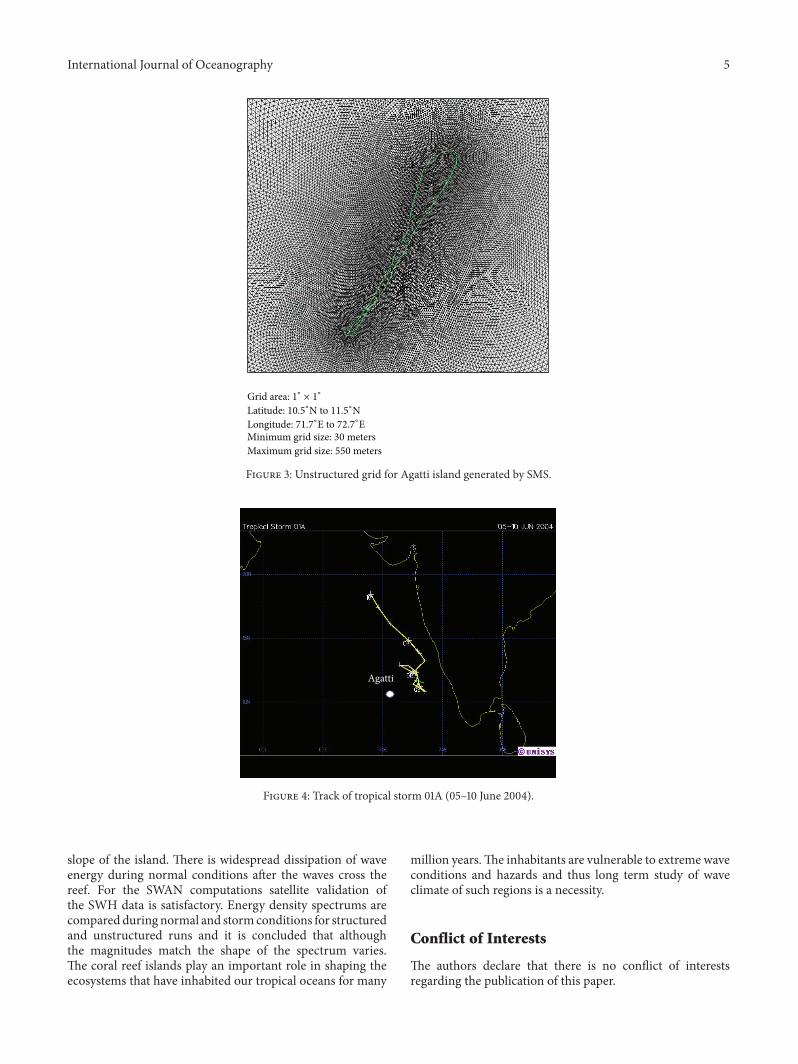
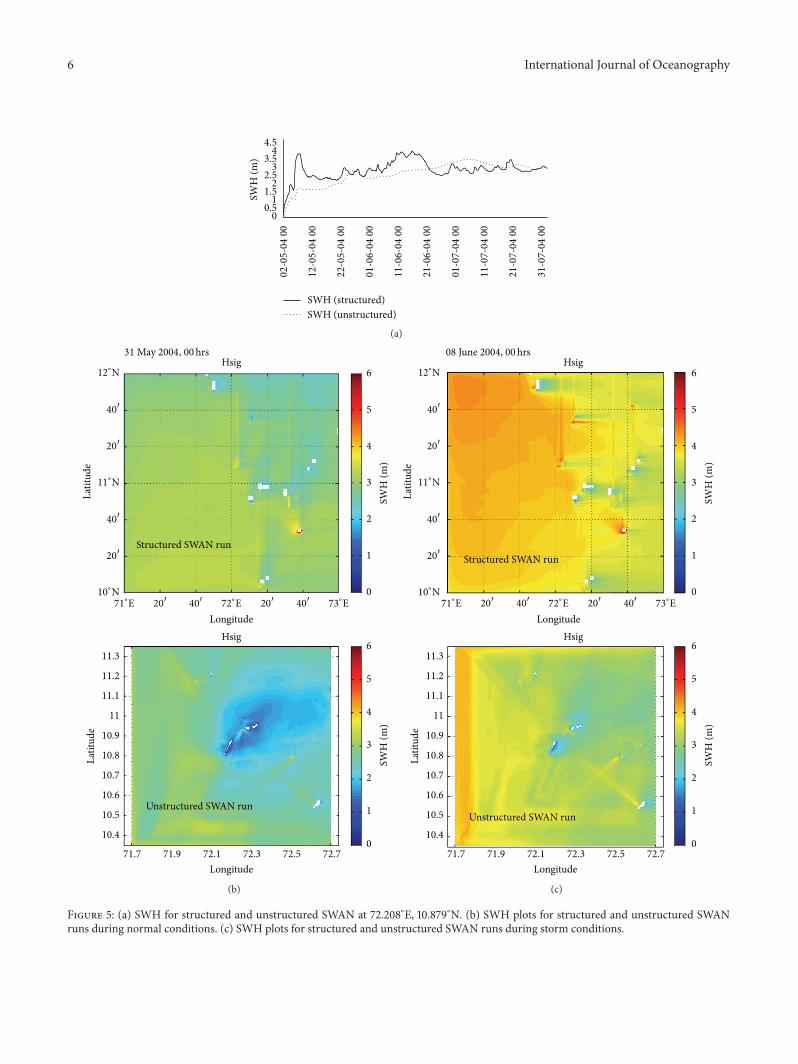
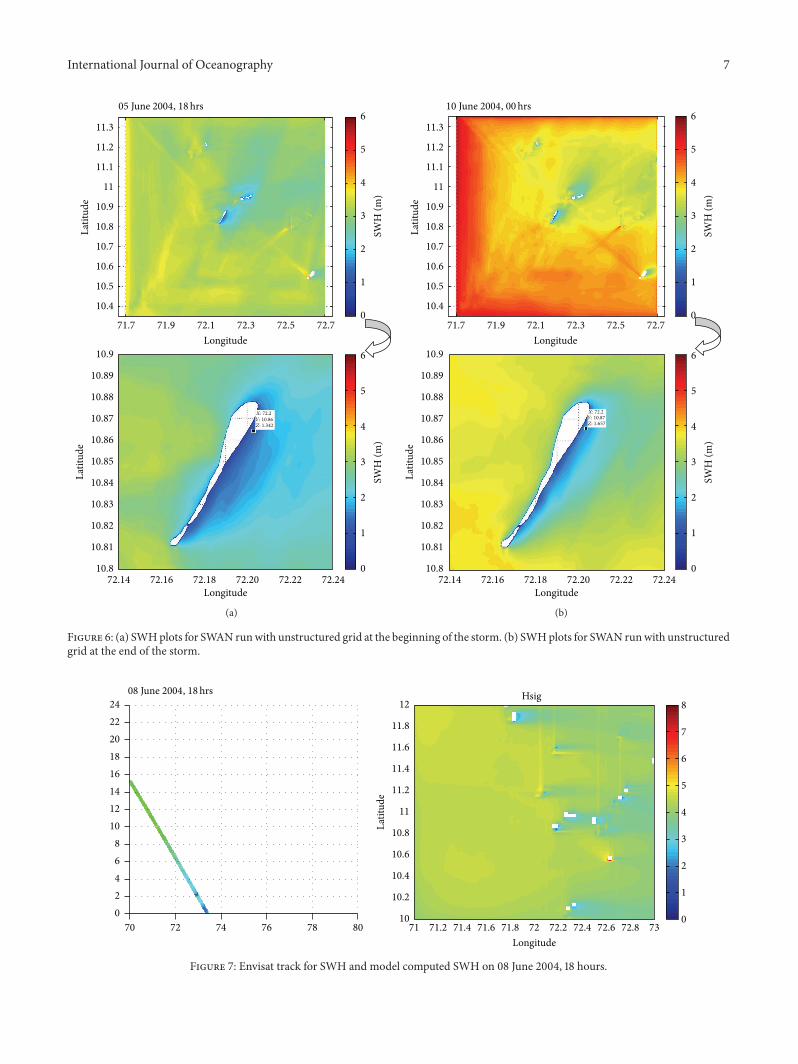
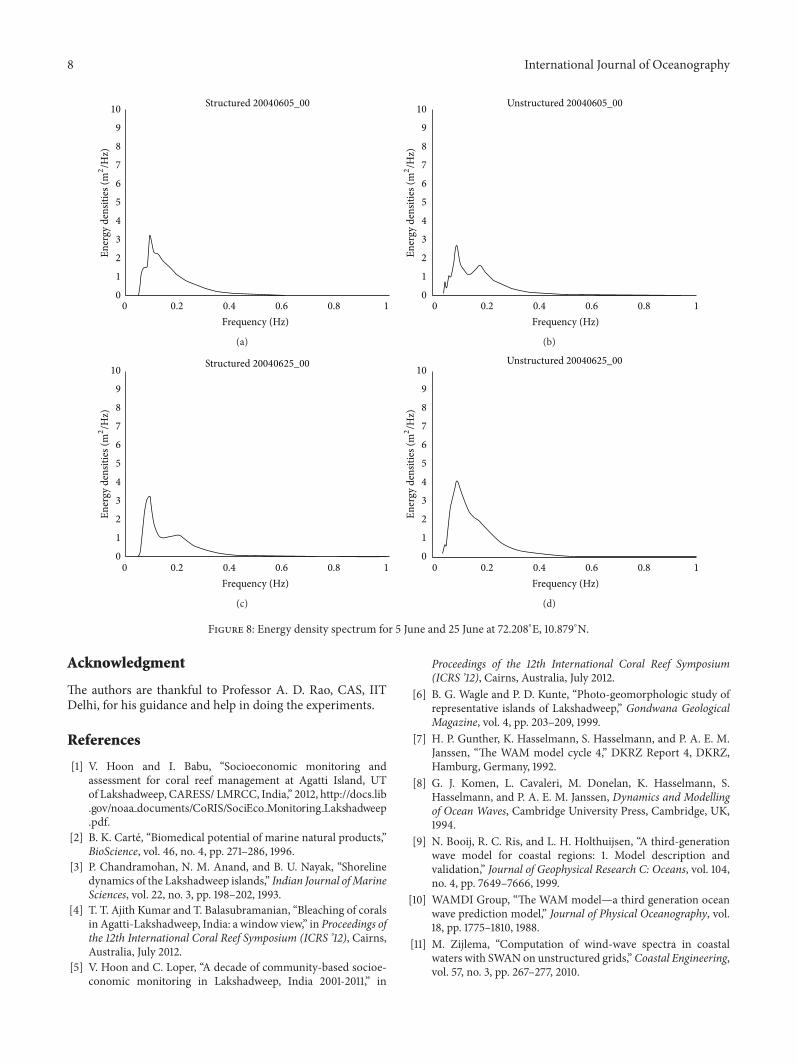