Embed Size (px)
Citation preview

541
Scholars Academic Journal of Biosciences (SAJB) ISSN 2321-6883 (Online)
Sch. Acad. J. Biosci., 2015; 3(6):541-557 ISSN 2347-9515 (Print) ©Scholars Academic and Scientific Publisher (An International Publisher for Academic and Scientific Resources) www.saspublisher.com
Research Article
Isolation and Identification of Microorganism to Study of Their Potential to
Degrade Harmful Azo Dyes by the Enzyme Azoreductase Produced by the
Microorganism Huma Naz Siddiqui, Dr Arunima Karkun*, Simran Jangir
GD Rungta College of Science and Technology, Kohka, Kurud, Bhilai. Chhattisgarh, India
*Corresponding author
Dr Arunima Karkun
Abstract: Azo Dyes are used commonly in different industries. Through the biotransformation of dye compounds, various dye precursor and carcinogenic aromatic amines are generated which leads water pollution and affect
phytoplankton’s, water animals and human beings. Thus there is an aurgent need to remove these dyes from various
industrial effluents. Enzymatic degradation of dyes through microorganisms was an effective and eco friendly process. In
this study different microbes that produce dye degrading enzymes were isolated and identified as B. Brevis, B.
Pantothenticus (Bacteria) and A. Niger, Fusarium (Fungus). B. Brevis and B. Pantothenticus showed degradation for
methyl red at gm/l dye concentration and for congo red (when the concentration was decreased). Percentage dye degradation of B. Pantothenticus was 91.66 (For methyl red) and 75.37 (For congo red). Percentage dye degradation
through A. Niger was 85.71 (For methyl red).The enzyme responsible for dye reduction was purified by Ion exchange
chromatography. Enzyme assay was performed for the purified enzyme, it is found that the optimum pH and temperature
was 7 and 40ºC respectively. Purity of enzyme was determined by SDS-PAGE and the m.wt. of enzyme was64 KD.
Keywords: Azo Dyes, Congo red, Methyl red.
INTRODUCTION
Today, more than 100,000 commercial dyes
are available in market and nearly one million tons per
annum are produced, whereas 10% of dyes are released
in environment and natural resources as dye stuff
waste. This production is increased day by day to meet
the needs of growing population, also increases the
release of dye effluent. Congo red is a carcinogenic direct used for the coloration of paper products. It is
recalcitrant and found in effluents of paper factories.
Azo dyes represent the largest class of organic colorants
listed in the color Index (i.e., 60-70% of the total). They
make up the vast majority of the dyes discharged [1].
Azo -dye is a synthetic dye that has the azo group of
two nitrogen atoms (N=N) connecting aromatic ring
compounds. Azo dyes may be direct, acid, or basic.
Direct dyes are relatively large molecules with high affinity especially for fibers.
Fig-1:Dye effluent generated by Industries which pollute water bodies
A Dyes is a natural or synthetic colored
substance that has an affinity to the substrate to which it
is being applied. Dyes are classified on the basis of their
application and chemical structure. They are composed
of a group of atoms responsible for the dye colour,
called chromophores, as well as an electron
withdrawing or donating substituents that cause or
intensify the colour of the chromophores, called
auxochromes [2]. The most important chromophores
are -C=C-, -C=N-, -C=O, -N=N-, -NO2 and -NO

Siddiqui HN et al., Sch. Acad. J. Biosci., 2015; 3(6):541-557
542
groups.Acid dyes are anionic compounds that are
mainly used for dyeing, nitrogen containing fabrics like
wood, polyamide, silk, and modified aryl. Basic dyes
are cationic compounds that are used for dyeing acid
group containing fibers, usually synthetic fibers like
modified polyaryl [1]. Congo Red is an azo dye with a
structure 3, 3′-((biphenyl)-4,4′- diylbis(azo))-bis(4-
amino-1-naphthalenesulphonicacid) disodium salt. It is intended primarily for the coloration of paper products,
used in medicine (as a biological stain) and as an
indicator since it turns from red-brown in basic medium
to blue in acidic, used to color textile and wood pulp. It
is a recalcitrant and act as potent carcinogen and
mutagenic because of the presence of aromatic amine
group.
Azo dyes as a Recalcitrant Azo Dyes are synthetic organic colourants that
contain azo compound (R-N=N-R’) in which R and R’ can be either Aryl or Alkyl group. They are considered
as xenobiotic compounds that are very recalcitrant to
biodegradation processes [3,4].
The stability and their xenobiotic nature of
reactive azo dyes make them recalcitrant. There are
thousands of synthetic azo dyes used in the textile,
pharmaceutical, cosmetics and food industries, of which
more than 500 contain potentially carcinogenic
aromatic amines in their chemical formulation[5].
During the dyeing processes about 10–90% of the dye
stuff do not bind to the fibres and therefore, released into the sewage treatment system or the environment
[3]. Aromatic amines, such as benzidine, induce urinary
bladder cancer in humans and tumours in some
experimental animals[5]. Azo dyes used in this study
for their Degradation through enzymes produced by
microbes are Methyl red & Congo red
Role of Microbes in Azo dye degradation : Microorganism like bacteria, fungi have ability to
degrade these recalcitrant compound and they have
potential to degrade azo dyes under favorable condition. Lack of suitable condition, microorganism not able to
degrade or mineralize these compounds as a result these
compounds can persist in the environment and known
as Recalcitrant. Degradation of recalcitrant compound
can be achived by physical/chemical or biological
methods.
Mechanism of Reaction catalyzed by azoreductase: Azoreductase catalyze the reaction by Ping Pong
Mechanism by using 2 equivalents of NAD(P)H to
reduce one equivalent of the azo compound substrate.
For example :- Reduction of one methyl red into two equivalent of Aniline.
Ar–N=N–Ar' + 2(NAD(P)H + H+) Ar–NH2 +
NH2–Ar' + 2NAD(P)+
Where, Ar = p-dimethylaniline
Ar’ = o-benzoic acid.
It is the key enzyme expressed in azodye-degrading
bacteria that catalyses the reductive cleavage of the azo
bond. Azoreductases reduce the azo bond (N=N) in
azo dyes to produce colorless amine products[17].
Azoreductase activity has been identified in several
species of bacteria recently; such as Caulobacter
subvibrioides C7-D, Xenophilus azovorans KF46F, Pigmentiphaga kullae K24, Enterobacter agglomerans
and Enterococcus faecalis [6]. Azo reductases catalyze
the reaction only in presence of reducing equivalents
like FADH and NADH. Most of the azo dyes have
sulphonate substituent groups and a high molecular
weight and they are unlikely to pass through cell
membranes. Therefore, the reducing activity referred to
the dye is not dependant on the intracellular uptake of
the dye [7]. Russ et al.[8] suggested that bacterial
membranes are almost impermeable to flavin containing
cofactors and, therefore, restrict the transfer of reduction equivalents by flavins from the cytoplasm to
the sulphonated azo dyes. Thus, a mechanism other than
reduction by reduced flavins formed by cytoplasmic
flavin-dependent azoreductases must be responsible for
sulphonated azo dye reduction in bacterial cells with
intact cell membranes [8]. One such mechanism
involves the electron transport-linked reduction of azo
dyes in the extra-cellular environment. To achieve this,
the bacteria must establish a link between their
intracellular electron transport systems and the high
molecular weight, azo dye molecules.
Fig-4: Proposed mechanism for reduction of azo
dyes by azo reductase (Courtesy: Keck et al., 1997).
OBJECTIVE Isolation of bacteria.
Screening to check their potential to degrade
azo-dye.
To calculate the Percentage dye degradation by
the screened bacterial and fungal species.
To study the activity of enzyme at different
kinetic parameters.
To purify and characterize the Azoreductase
enzyme.

Siddiqui HN et al., Sch. Acad. J. Biosci., 2015; 3(6):541-557
543
MATERIAL AND METHODS
MATERIALS
Reagents:
70% Alcohol, Crystal violet, Grams iodine,
Ethanol, Safranin, Lacto phenol cotton blue, NaOH( 0.1
N),HCL ( 0.1 N ), Hydrogen peroxide, Malachite green,
VP Reagents, Phenol red, 2%Na2co3, 1% Potassium tartrate, 0.5% cuso4, BSA Standard (200μg/ml), Folin
Ciocalteau reagent, Acrylamide 30%, Bis-Acrylamide
0.8%, Tris HCL 1.875 M, Tris HCL 0.6M, APS
5%,TEMED, SDS 5%
Chemicals Ammonium sulphate, Methyl red, Congo red,
Cellulose, NADH, Arabinoseis, Tris HCl.
METHODS Collection of water samples: Water sample
was collect from Dye contaminated area in
sterile Plastic bottle. Sample was stored in
deep freezer at -4ºC.
Dyes: Two commercially available dyes are
used i.e. Congo red and Methyl red.
Stock Dye solution: Stock solution of each
dye was prepared by adding 1gm of dye in
1000 ml of sterilize D.W. Those stock
solutions were used for inoculating the
medium and the conc. of stock dye solution in
the medium was 10 ml/l.
Isolation of dye degrading bacteria and fungus:
Serial dilution
Microbes were isolated through serial dilution
method
Dye decolorizing Bacteria and fungi were isolated
from textile dye effluent by serial dilution ranging from
10-1 to 10-6 dilution for bacteria and 10-1 to 10-4 dilution
for fungus. After dilution 100 μl diluted sample were
pellet on NAM media for bacterial isolation and in SDA
media for fungal isolation by the spared plate method.
The inoculated medium for bacteria was incubated in incubator at 370C for 24 hrs, and for fungus medium
was incubated at room temperature for 4 to 5 days. The
bacterial pure culture was obtained by re-streaking
different individual bacterial colony onto new agar
medium and incubated at 37 °C. Pure culture of fungus
was obtained by point inoculation of fungus into SDA
media.
Identification
Identification of bacteria
All the Bacterial isolates were identified on the
basis of colony morphology, Grams staining and biochemical test according to Bergey’s Manual of
Systematic Bacteriology.
For Microscopic identification of Bacteria, Grams
staining and Endospore Staining was performed.
BIOCHEMICAL TEST
For Bacterial identification following biochemical
test was done.
CATALASE TEST
STARCH HYDROLYSIS TEST
CARBOHYDRATE FERMENTATION TEST
MR/VP TEST
CITRATE TEST
MOTILITY TEST ARABINOSE TEST
Identification of fungus
Fungal species was identified by external appearance (i.e.
color, shape) and by the staining with lactophenol
cotton blue stain. Morphology was observed under
microscope.
Screening
Selected isolates must be screened to know the
ability of producing enzyme that are responsible for the dye degradation. For this, nutrient broth was used for
screening of bacterial isolates and SDA broth for
fungus.
Inoculation of medium and dye for the screening
10 ml of broth containing 100 μl of stock dye
solution of methyl red was poured in 3 test tubes and
then it was inoculated by a loop full culture of 3
different bacterial isolates and kept it in incubator at 37o
C for 1 week. Same method was applied for remaining
dyes, bacterial and fungal isolates. Fungal inoculated
medium were kept at room temp.
Monitoring for Decolourization
Spectrophotometric method was used to
monitor the optical density of the decolorization. The
standard isolates which gave instance decolorization of
azo dyes was inoculated in 50 ml mineral salts basal
media in which 500 μl of dye solution has been added
after autoclaving. A control flask was also maintained.
After inoculation 5 ml of the sample was taken out in
sterile condition and centrifuged at 6000 rpm for 10
min. Supernatant was taken and its optical density was determined spectrophotometrically at 620 nm the
absorbance maxima of azo dye methyl red, evan’s blue
and 500 nm of congo red being studied for
decolourization. Thereafter the percent of dye
decolourization on zero day was calculated by the
formula [9].
% Dye decolorization =
O.D zero day - O.D sample X 100
……...............................
O.D zero day
The inoculated media was then incubated in shaking
incubator at 150 rpm. Percentage dye degradation was
calculated every alternate day for seven days and the
above described method and formula was used every
time.

Siddiqui HN et al., Sch. Acad. J. Biosci., 2015; 3(6):541-557
544
Production of Enzyme
For the assay of enzyme and their purification
it is necessary to produce large quantity of enzyme.
Production of bacterial enzyme
Bacterial enzyme was produced in Large
quantity by the inoculation in the production media
containing limited nitrogen source after which azo dye was the only source of nitrogen. For bacteria,
Production media made by adding per liter of D.W.,
Potassium Dihydrogen Phosphate 3.0 g, Disodium
Hydrogen Phosphate- 6.0 g, Glucose- 2.0 g, Sodium
Nitrate- 0.42g, NaCl- 100g, Dyes (stock) – 10 ml and
the pH was 7.0. The pH of the medium was adjusted
using 0.1 M HCl and NaOH. 50 ml production media
was prepared by adding 500 μl of stock dye solution for
each dye. Then it was inoculated with 1ml of bacterial
nutrient broth to get the enzyme in large amount. The
inoculated medium in PTC bottle was kept in the incubator for 10 days
Production of fungal enzyme
For the large production of fungal enzyme
SDA broth production media was used and the pH 5.6
was adjusted. Further process was as same as bacterial
enzyme production instead of the incubation. Bottle was
kept at room temperature.
Extraction of Enzyme
The enzyme was extracted by centrifugation.
The broth was taken at the end of incubation time and was centrifuged at 6000 rpm for 15 min. The
supernatant was taken and was treated as crude extract.
Enzyme Assay
For assay of crude and purified enzyme, firstly
the following materials are prepared for the
azoreductase assay:-
Potassium phosphate buffer 50mM (Reagent
A).
Azo dye solution 0.1%, (Reagent B)
Enzyme solution (Reagent C) Reduced nicotinamide adenine dinucleotide
sodium salt monohydrate (NADH) 2 mM
(Reagent D).
The assay procedure is based on the principle
that with the addition of NADH to the reaction mixture
containing substrate, buffer and enzyme solution, the
substrate azo dyes azo bond is degraded and there is a
decrease in the absorbance of the dye after an initial lag
phase.
Unit Definition: One unit will reduce 1.0 μ mole of azo dye per
minute in the presence of NADH using Millimolar
extinction coefficient of azo dyes at pH 7.0 and 30°C
temperature.
Calculation
Units/ml enzyme =
(AA 532nm / min Test - AA532nm / min Blank) (3)
(df)
-------------------------------------------------------------------
A × (0.1)
3 = Total volume (in milliliters) of assay
df = Dilution factor
A = Millimolar extinction coefficient of azo dye
Methyl red = 23.36 mM-1 cm-1)
Congo red = 21.20 mM-1 cm-1)
0.1 = Volume (in milliliter) of enzyme used
Procedure:- The procedure adopted was based on the
one done by Zimmermann etal. [15].
1. Pipetted (in milliliters) the following reagents into test tubes:
Test Blank
Reagent A (Buffer) 2.80 2.80
Reagent B (Azo dye solution) 0.05 0.05
Reagent C (Enzyme solution) 0.1 0.1
(Distilled water)
Mixed by inversion and equilibrate at room
temperature. Then add:
Reagent D (NADH) 0.05 0.05
2. Immediately mixed by inversion and recorded the decrease in absorbance at 532 nm for approximately 5
min. obtained the ÄA 532nm/ minute for both the Test
and Blank.
3. Enzyme activity was than calculated by the formula
given above.
Purification of enzyme
Ammonium salt precipitation
Protocol
5.6 gm. Ammonium sulphate was added in 10
ml ml. of crude sample, stirrer slowly. Process was carried out at cooled condition for 45 min.
Then sample was kept in overnight at 4`c.
Sample was centrifuged at 10,000rpm for 10
min.
Pellet was collected and dissolved in 10 ml of
50 mM phosphate buffer.
Dialysis
Activation of Dialysis membrane
Took 100 ml of D.W. And boiled it.
Dialysis membrane was added into boiling
water. Boiled it for 10 min.
Added 2% NaHCO3, boiled it for 10 min.
Take another 100 ml of D.W. and boiled it.
Transferred the dialysis membrane into this
boiling water and boiled it for 10 min.

Siddiqui HN et al., Sch. Acad. J. Biosci., 2015; 3(6):541-557
545
Took out the membrane with the help of
forceps.
Tied the one side of the membrane.
10 ml of enzyme suspension was added in to
the dialysis membrane.
Tied another side of the membrane.
Placed it in beaker contained phosphate buffer.
Placed the beaker in refrigerator. Dialysis membrane placed in another
phosphate buffer for 2-3 times.
Ion exchange chromatography
Column preparation:-
2 gm of cellulose weighed and it dissolved in
50 ml of phosphate buffer pH-7, then poured
in column and equilibrated with phosphate
buffer, checked the pH 7.
After the column preparation the dialyzed
sample was poured onto the column from sides without disturbing the DEAE bed, kept for 45
min.
Enzyme was eluted using the first eluting
buffer i.e. 25 mM Tris HCl and 25 mM NaCl.
Elute was collected in test tube.
The same process of elution was carried out
using 50, 75, 100,125 and 150 mM Nacl
respectively.
Protein estimation (By Lowry method)
Protocol Prepared the 2%Na2CO3 in 0.1N NaOH
(Reagent A) and 0.5% copper sulphat in 1%
Potassium sodium tartrate (reagent B)
After that prepared the Alkaline copper
solution by mixing 50 ml of reagent A and 1ml
of reagent B prior to use as reagent C. FC
reagent was prepared by adding 1ml of FC
reagent in 4ml of D.W.
BSA sample was prepared by adding BSA in
D.W. and the concentration of BSA was
200µg/ml. Poured 0.2, 0.4, 0.6, 0.8 and 1.0 ml
BSA sample into 5 test tube and labeled them as Standard 1 2, 3, 4, 5 respectively.
In other test tube 0.2 ml sample of each crude,
ammonium salt precipitation crude, dialysis
crude and elutes of I.E.C (which shows the
higher enzyme activity) was poured.
All the sample were makeup up to 1ml by
distilled water. A blank test tube also
maintained in which 1ml distilled water was
poured instead of any sample.
5-5ml of Alkaline copper solution was added
in each test tube including blank and incubated
at room temperature for 10 min. After incubation 0.5 ml FC reagent was added
in all the test tubes and let them to incubate at
dark for 30 min.
After incubation, OD was taken at 660 nm
against blank.
Enzyme Kinetics:-
The main factor which influence the rate of reactions
include:
The physical state of reactants.
The concentration of reactants/substrate.
Effect of temperature or the temperature at
which the reaction occurs: As the temperature rises, molecular motion -and hence collisions
between enzyme and substrate – speed up.
There is an optimum temperature at which
enzymes are highly active and after optimum
temperature there is an upper limit beyond
which the enzyme becomes denatured and
ineffective.
To study the effect of temperature four different
temperature i.e. 4ºC, 10ºC, 40ºC, 60ºC was selected and
the process was carried out as same as the enzyme assay but at different temperature.
Effect of pH: The conformation of a protein is
influenced by pH . All enzymes have optimum pH in
which they show higher activity. Enzyme activity
increases with increase pH, but after optimum pH,
enzyme activity decreases with increase pH. In this
study enzyme activity at five different pH i.e. pH
3,5,7,9 and has been studied. For this Phosphate buffer
of particular pH was prepared and the further process
was same as enzyme assay.
SDS-PAGE
Extracted enzyme was purified by SDS-PAGE.
A very common method for separating proteins by
electrophoresis uses a discontinuous polyacrylamide gel
as a support medium and sodium dodecyl sulfate (SDS)
to denature the proteins. The method is called sodium
dodecyl sulfate polyacrylamide gel electrophoresis
(SDS-PAGE).
Observation and Result
Sample collection:- Mallapur Industrial Area was selected for the
sample collection because it has textile industries and
nearby the dye contaminated effluent was present. So
the effluent sample was collected from such
contaminated sites.
Isolation of microorganism
Serial dilution Dye decolorizing Bacteria and fungi were
isolated from textile dye effluent by serial dilution
ranging from 10-1 to 10-6 dilution for bacteria and 10-1 to
10-4 dilution for fungus. After the incubation period of serially diluted sample, 3 different bacterial colonies
(figure 6) which was named as S1 S2 S3 and 2 fungal
species (figure 5) was obtained.

Siddiqui HN et al., Sch. Acad. J. Biosci., 2015; 3(6):541-557
546
Fig-5: Isolated fungal species
Fig-6: Isolated Bacterial colonies.
Identification of microorganism:
Identification of fungus:
i) Morphological characteristic In two fungal colonies, one is dense small
black colony and Large visible hyphae was clearly
observed. Another fungal colony is long wooly, white
to pink.(figure 8).
Microscopic characterization after lactophenol
cotton blue staining Conidia, conidiophores and mycelium was
observed for black fungal colonies under 45x
magnification thus it was confirmed as A.niger(figure
10).
A.niger Fusarium
Fig-7: Microscopic characterization of identified fungal colonies
Identification of bacteria
Colony morphology- According to
colony morphology, all the bacterial
isolates were circular in shape, all of
them having flat elevation, smooth
texture, and their appearance was
cream & shiny. They were differ in
their size and margin (table 1)

Siddiqui HN et al., Sch. Acad. J. Biosci., 2015; 3(6):541-557
547
Table-1: Colony morphology of bacterial isolates
Character S1 S2 S3
Shape Circular Circular Circular
Margin Entire Curled Entire
Elevation Flat Flat Flat
Size Punctiform Small Moderate
Texture Smooth Smooth Smooth
Appearance Cream & Shiny Cream & Shiny Cream & Shiny
Gram staining
All the bacterial cells retain the crystal violet
stain and appeared in purple colour and rod shaped thus
all the bacteria were gram positive and bacillus species
(table 2.)
Table-2: Grams staining of bacterial isolates
Character S1 S2 S3
Gram’s reaction Positive Positive Positive
Shape Rod Coco bacillus Rod
Screening
Screening of methyl red
In the screening of methyl red it was found
that bacterial species S2 was showed the intense
decolorization just after 1 day and reduction of methyl
red was clearly observed as compare to other microbes.
After 7 days, bacterial species S1, S2 and fungal species
fusarium and niger was showed intense decolourization
for methyl red degradation (figure 8&9).
Screening of congo red
After 7 days all the bacterial and fungal
species were unable to degrade congo red dye at gm/l
dye concentration (figure10).
Fig-8:Screening for methyl red dye degradation. results after 1 day.
Fig-9:Screening for methyl red dye degradation, results after 7 days.

Siddiqui HN et al., Sch. Acad. J. Biosci., 2015; 3(6):541-557
548
Fig-10: Screening for Congo red dye degradation, results after 7 days.
Screening of congo red with decreased dye
concentration As shown in figure 15 all the microbes were
unable to degrade congo red at 1g/l dye concentration
so when the dye concentration of congo red was
reduced that was just half of the previous concentration,
intense decolorization were showed by S1 S2 within 7
days.
Fig-11: Screening for congo red dye degradation with decreased dye concentration, results after 7 days.
Decolorization of congo – red dye:
Fig.12: Degradation of congo red with increased day of incubation.

Siddiqui HN et al., Sch. Acad. J. Biosci., 2015; 3(6):541-557
549
Selection of organism
During or after the incubation period all the
test tubes were taken and compare with control. Dye
decolourization was ranked on the basis of visual
identification as Intense (+++), Moderate (++), Slight
(+), No decolourization (-), The A.niger, Fusarium and
S1 S2 organisms containing test tubes showing intense or
moderate decolourization were selected. Thus after the
screening of all the dyes, S1 S2 was selected for their
identification.
Biochemical test of S1 S2 bacteria
According to Bergey’s Manual different
biochemical test was performed and both the species
were identified (table 3).
Table-3. Biochemical test of bacterial isolates
Test S1 S2
Catalase test + +
Starch hydrolysis test + +
VP test _ _
Endospores test + +
Glucose fermentation _ +
6.5 % NaCl growth + _
Motility test Motile Non motile
Citrate test + _
Acid via Arabinose _ _
MR test _ Not performed
Identified species B. brevis B. pantothenticus
Degradability Assay
For Methyl red
Bacteria B. Pantothenticus and fungus A.niger
amd Fusarium was selected for degradability assay on
the basis of instance decolorization. B. Pantothenticus shows 91.66% degradation of methyl red within 7 days
and the degradation percentage was increased after day
by day (Table 4). A.niger degraded 92.85% and
fusarium degraded 85.71% of methyl red within 7 days
(Table 5).Fusarium shows intense decolorization of
methyl red as compare to other micro organism.
Table-4: The degradability assay for the dye Methyl red through B. pantothenticus
Day
O.D ( At 620 nm ) %Dye
degradation of
sample
Blank Sample
0 0.12 0.12 0.00
1 0.12 0.10 16
2 0.12 0.09 25
3 0.12 0.06 50
4 0.12 0.04 66.66
5 0.12 0.03 75
6 0.12 0.02 83.33
7 0.12 0.01 91.66
Graph-1: Percentage of methyl red degradation against days through B.pantothenticus
0
50
100
1 2 3 4 5 6 7
% o
f d
ye d
egrad
ati
on
Days
B.pantithenticus
B.pantithenticus

Siddiqui HN et al., Sch. Acad. J. Biosci., 2015; 3(6):541-557
550
Table-5: The degradability assay for the dye Methyl red through A. niger and Fusarium
Day
O.D ( At 620 nm )
Blank
Sample
Niger %Dye
degradation of
sample
Fusarium %Dye
degradation
of sample
0 0.14 0.14 0.00 0.14 0.00
1 0.14 0.11 21.42 0.12 14.28
2 0.14 0.10 28.57 0.10 28.57
3 0.14 0.08 42.85 0.09 35.71
4 0.14 0.06 57.14 0.07 50
5 0.14 0.05 64.28 0.05 64.28
6 0.14 0.03 78.57 0.04 71.42
7 0.14 0.01 92.85 0.02 85.71
Graph-2: Percentage of methyl red degradation against days through A.niger and A.fusarium
For Congo red
Congo red was 75.37% degraded by B.
pantothenticus after 7 days. But the degradation takes
place at decreased dye concentration i.e. 500µg/l (Table
6).
Table-6: The degradability assay for the dye Congo red through B. pantothenticus
(At decreased dye concentration 500mg/l )
Day
O.D ( At 500 nm ) Dye
degradation
( % ) Blank Sample
0 1.34 1.34 0.00
1 1.34 1.31 2.23
2 1.34 1.17 12.68
3 1.34 0.94 29.85
4 1.34 0.72 46.26
5 1.34 0.58 56.71
6 1.34 0.40 70.14
7 1.34 0.33 75.37
0
20
40
60
80
100
1 2 3 4 5 6 7
% o
f m
eth
yl
red
deg
rad
ati
on
Days
A.niger
Fusarium

Siddiqui HN et al., Sch. Acad. J. Biosci., 2015; 3(6):541-557
551
Graph-3: Percentage of congo red degradation against days through B.pantothenticus
Enzyme assay
For methyl red degradation
It was found that enzyme activity of B. pantothenticus for crude was highest and it was
decreased after ammonium salt precipitation and after
dialysis. Elute 1 shows the highest enzyme activity i.e.
0.07725 after purification thus elute 1 was selected for
further work (Table 7).
Crude extract of A.niger and fusarium was
shows the highest enzyme activity. Enzyme activity was
decreased after ammonium salt precipitation but dialysis crude shows the higher activity as compare to
ammonium salt crude and I.E.C crude. After
purification elute 1of A.niger and elute-6 of fusarium
shows the highest activity as compare to other elutes
thus elute-1 and elute-6 were selected for the further
work (Table 8).
Table-7: Enzyme activity of crud and purified enzyme of B. pantothenticus
(For methyl red degradation)
S.
No.
Tubes OD at
532nm
Enzyme
activity
units/ml
1 2
3
4
5
6
7
8
9
10
11
Blank 0.24 -
Crude Extract 0.39 0.19313
Ammonium salt pptn crud 0.33 0.11588
Dialysis crud 0.30 0.07725
I.E.C. crud 0.29 0.06438
Elute-1 0.30 0.07725
Elute-2 0.28 0.0515
Elute-3 0.28 0.0515
Elute-4 0.25 0.01288
Elute-5 0.27 0.03863
Elute-6 0.25 0.01288
Table 8. Enzyme activity of crud and purified enzyme of A.niger and fusarium
(For methyl red degradation)
S.
No.
A.niger Fusarium
Tubes OD at
532nm
Enzyme
activity
units/ml
OD at
532nm
Enzyme activity
units/ml
1
2
3
4
5
6
7 8
9
10
11
Blank 0.24 - 0.24
Crud Extract 0.38 0.18026 0.40 0.20601
Ammonium
salt pptn crude
0.31 0.09013 0.35 0.14163
Dialysis crude 0.33 0.11588 0.32 0.103
I.E.C. crude 0.32 0.103 0.27 0.03863
Elute-1 0.32 0.103 0.26 0.02575
Elute-2 0.30 0.07725 0.26 0.02575
Elute-3 0.29 0.06438 0.31 0.09013
Elute-4 0.30 0.07725 0.31 0.09013
Elute-5 0.26 0.02575 0.33 0.11588
Elute-6 0.26 0.02575 0.35 0.14163
0
20
40
60
80
1 2 3 4 5 6 7
% o
f d
ye d
egrad
ati
on
Days
B.pantothenticus
B.pantothentic
us
Siddiqui HN et al., Sch. Acad. J. Biosci., 2015; 3(6):541-557
552
For Congo red degradation
The crude extract of B.pantothenticus for
congo red degradation shows 0.25472 enzyme activity
which was highest as compare to other samples.
Enzyme activity was continuously decreased after
ammonium salt precipitation and after dialysis. Elute-6
was selected for further work because it shows higher
enzyme activity as compare to other elutes of I.E.C. and
enzyme activity of elute-6 was similar to Dialysis crude
(Table 9).
Table-9:Enzyme activity of crud and purified enzyme of B. patothenticus (For Congo red)
S.
No.
Tubes OD at 532nm
Enzyme activity
units/ml
1 2
3
4
5
6
7
8
9
10
11
Blank 1.00 -
Crud Extract 1.18 0.25472
Ammonium salt pptn
crude 1.10 0.14151
Dialysis crude 1.08 0.11321
I.E.C. crude 1.04 0.0566
Elute-1 1.03 0.04295
Elute-2 1.03 0.04295
Elute-3 1.05 0.07075
Elute-4 1.06 0.08491
Elute-5 1.06 0.08491
Elute-6 1.08 0.11321
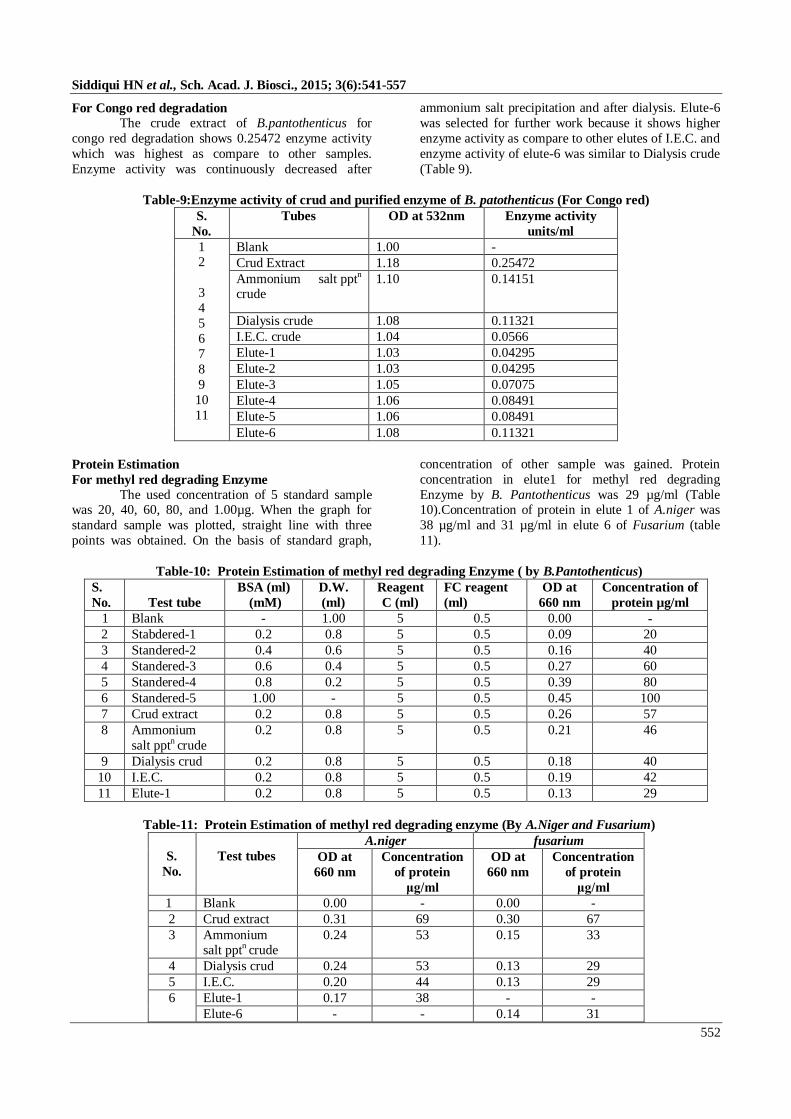
Protein Estimation
For methyl red degrading Enzyme
The used concentration of 5 standard sample was 20, 40, 60, 80, and 1.00µg. When the graph for
standard sample was plotted, straight line with three
points was obtained. On the basis of standard graph,
concentration of other sample was gained. Protein
concentration in elute1 for methyl red degrading
Enzyme by B. Pantothenticus was 29 µg/ml (Table 10).Concentration of protein in elute 1 of A.niger was
38 µg/ml and 31 µg/ml in elute 6 of Fusarium (table
11).
Table-10: Protein Estimation of methyl red degrading Enzyme ( by B.Pantothenticus)
S.
No.
Test tube
BSA (ml)
(mM)
D.W.
(ml)
Reagent
C (ml)
FC reagent
(ml)
OD at
660 nm
Concentration of
protein µg/ml
1 Blank - 1.00 5 0.5 0.00 -
2 Stabdered-1 0.2 0.8 5 0.5 0.09 20
3 Standered-2 0.4 0.6 5 0.5 0.16 40
4 Standered-3 0.6 0.4 5 0.5 0.27 60
5 Standered-4 0.8 0.2 5 0.5 0.39 80
6 Standered-5 1.00 - 5 0.5 0.45 100
7 Crud extract 0.2 0.8 5 0.5 0.26 57
8 Ammonium
salt pptn crude
0.2 0.8 5 0.5 0.21 46
9 Dialysis crud 0.2 0.8 5 0.5 0.18 40
10 I.E.C. 0.2 0.8 5 0.5 0.19 42
11 Elute-1 0.2 0.8 5 0.5 0.13 29
Table-11: Protein Estimation of methyl red degrading enzyme (By A.Niger and Fusarium)
S.
No.
Test tubes
A.niger fusarium
OD at
660 nm
Concentration
of protein
μg/ml
OD at
660 nm
Concentration
of protein
μg/ml
1 Blank 0.00 - 0.00 -
2 Crud extract 0.31 69 0.30 67
3 Ammonium salt pptn crude
0.24 53 0.15 33
4 Dialysis crud 0.24 53 0.13 29
5 I.E.C. 0.20 44 0.13 29
6 Elute-1 0.17 38 - -
Elute-6 - - 0.14 31

Siddiqui HN et al., Sch. Acad. J. Biosci., 2015; 3(6):541-557
553
For Congo red degrading enzyme
Protein concentration in elute 6 for Congo red
degrading Enzyme by B. Pantothenticus was 44 µg/ml
but the concentration of protein was higher in crude
extract i.e. 53 µg/ml (Table 12)
Table-12: Protein Estimation of Congo red degrading enzyme (By B.Pantothenticus)
S.
No.
Test tubes
OD at
660 nm
Concentration
of protein
μg/ml
1 Blank 0.00 -
2 Crud extract 0.24 53
3 Ammonium
salt pptn crude
0.21 46
4 Dialysis crude 0.21 46
5 I.E.C. 0.18 40
6 Elute-6 0.20 44
Enzyme Kinetics
Effect of pH on Enzyme activity
It was found that enzyme activity for all the
dye degradation was higher at pH 7 as compare to pH
3,5,9 and 11 (Table 13). Differences in enzyme activity
can be easily seems by plotting graph by taking enzyme
activity against different pH (Graph 4 to 7).
Table-13: Effect of pH on Enzyme activity
Test tube
pH 3 pH5 pH7 pH 9 pH 11
OD
at
532
nm
Enzym
e
activity
OD
at
532
nm
Enzym
e
activity
OD
at
532
nm
Enzym
e
activity
OD
at
532
nm
Enzym
e
activity
OD
at
532
nm
Enzym
e
activity
Blank1
(Methyl red)
0.28 - 0.36 - 0.24 - 0.20 - 0.12
Test(T)-a
Methyl red (B.patithenticus)
0.30 0.0257 0.39 0.0386 0.30 0.0772 0.23 0.0386 0.14 0.0257
T-b
Methyl red
(A. niger)
0.31 0.0386 0.41 0.0644 0.32 0.103 0.23 0.0386 0.15 0.0386
T-c Methyl red
(A. fusarium)
0.30 0.0257 0.40 0.0515 0.35 0.142 0.22 0.0257 0.14 0.0257
Blank-2
(Congo red)
1.30 - 1.12 1.01 1.07 1.04
T-d Congo red
(B.pantothentics
)
1.33 0.0424 1.18 0.0849 1.10 0.1273 1.11 0.0566 1.06 0.0283
Graph-4:Effect of pH on enzyme activity of B.pantothenticus for methyl red degradation.
00.020.040.060.080.1
3 5 7 9 11
En
zym
e a
cyti
vit
(U/m
l)
pH
B.pantothenticus
B.pantothent
icus

Siddiqui HN et al., Sch. Acad. J. Biosci., 2015; 3(6):541-557
554
Graph-5: Effect of pH on enzyme activity of A.niger for methyl red degradation.
Graph-6: Effect of pH on enzyme activity of A.fusarium for methyl red degradation.
Graph-7: Effect of pH on enzyme activity of B.pantothenticus for congo red degradation.
Effect of Temperature on enzyme activity
It was found that enzyme activity was higher and good at temperature between 37 to 400C and
activity of enzyme was decreased at other temperature
i.e. 4, 10, and 600C (Table 14). Differences in enzyme
activity can easily seem by plotting graph by taking enzyme activity against different temperature (Graph 8
o 11).
0
0.05
0.1
0.15
3 5 7 9 11
En
zym
e a
cti
vit
ypH
A.niger
A.niger
0
0.05
0.1
0.15
3 5 7 9 11En
zym
e acy
tiv
it(U
/ml)
pH
Fusarium
Fusarium
0
0.05
0.1
0.15
3 5 7 9 11
Enzy
me
acti
vity
pH
B.pantothenticus
B.pantothenticus

Siddiqui HN et al., Sch. Acad. J. Biosci., 2015; 3(6):541-557
555
Table-14: Effect of Temperature on Enzyme activity
Test tube
Temperature
40C 10
0C 40
0C 60
0C
OD at
532 nm
Enzyme
activity
OD at
532 nm
Enzyme
activity
OD at
532 nm
Enzyme
activity
OD at
532 nm
Enzyme
activity
Blank1
(Methyl red)
0.23 - 0.23 - 0.23 - 0.23 -
T-a
Methyl red
(B.patithenticus)
0.25 0.025 0.27 0.051 0.32 0.115 0.24 0.012
T-b
Methyl red
(A. niger)
0.24 0.012 0.26 0.038 0.33 0.128 0.26 0.038
T-c Methyl red
(A. fusarium)
0.26 0.038 0.28 0.064 0.32 0.115 0.25 0.025
Blank-2 (Congo red)
0.98 - 0.98 - 0.98 - 0.98 -
T-d Congo red
(B.pantothentics)
1.00 0.028 1.03 0.070 1.33 0.495 1.02 0.056
Graph-8: Effect of temperature on enzyme activity of B.pantothenticus in methyl red degradation
Graph-9: Effect of temperature on enzyme activity of A.niger in methyl red degradation
0
0.05
0.1
0.15
4 10 40 60
En
zy
me a
cti
vit
y
Temperature (in 0C)
B.pantothenticus
B.pantothe
nticus
0
0.05
0.1
0.15
4 10 40 60
En
zy
me a
cti
vit
y
Temperature in 0C
A.niger
A.niger

Siddiqui HN et al., Sch. Acad. J. Biosci., 2015; 3(6):541-557
556
Graph 10. Effect of temperature on enzyme activity of A.fusarium in methyl red degradation
Graph-11: Effect of temperature on enzyme activity of B.pantothenticus in congo red degradation.
DISCUSSION
This study was carried out to estimate the
Enzymatic degradation hazardous azodyes i.e. methyl
red, congo red through the microbes. In this study
degradation of azodyes has been carried out by
B.pantothenticus, A.niger and Fusarium.
Previous study have sown that strain of staphylococcus sp., isolated from soil in a textile
effluent treatement, were able to decolorized the
sulphonate azo dye congo red[10] and Microbial
degradation of Congo red by Gliocladium virens [11].
Various hazardous dyes likes, Congo red, Acid red,
Basic blue and Bromophenol blue, Direct green by the
fungus Trichoderma harzianum [12] has been
investigated earlier but there is no literature on congo
red degradation with B.pantithenticus. B.pantothenticus
degrade 75.37% congo red that is the new literature for
congo red degradation and the enzyme is oxygen
insensitive and show intense decolorization.
Van der Zee [1] demonstrated that biological
treatment strategy based on anaerobic reduction of the
azo dyes, followed by aerobic transformation of the
formed aromatic amines, holds promise to remove
azodyes from waste water. Chang et al [16]
demonstrated that presence of oxygen normally inhibit
the azo bond reduction activity since aerobic respiration
may dominate use of the NADH this impeding electron
transfer from NADH to the azo bond. Percentage dye
degradation by the isolated Bacillus megaterium was
found to be 64.89% Jahir Alam Khan [13]. I have done
degradation of azodyes in under aerobic condition and
different from their results conclutions I found that in
an aerobic condition degradation rate was as good at
anaerobic condition.In an aerobic condition B. pantothenticus shows 91.66% methyl red degradation,
75.37% congored degradation, A.niger and A.fusarium
shows 92.85% and 85.71% methyl red degradation
respectively within 7 days.
Mane, U. V. [14] isolated Actinomycete,
Streptomyces krainskii, SUK -5 was found to decolorize
and degrade textile dye Reactive blue–59.This azo dye
was decolorized and degraded completely by
Streptomyces krainskii SUK–5 at 24 h in shaking
condition in the nutrient medium at pH 8. But
Gurulakshmi. M et al [6] has been isolated Bacillus subtilis which was able to to decolorize the
Acidblue113. The bacterial culture exhibited 90%
decolorization ability within 50 h. which is different
from my work and the degradation percentage was
higher than the percentage which I have done it might
be due the difference of dyes. Optimum dye
decolorizing activity of the culture was observed at pH
7.0 and incubation temperature of 370C Gurulakshmi.
0
0.05
0.1
0.15
4 10 40 60
En
zym
e act
ivit
y U
\ml
Temperature (in 0C)
Fusarium
Fusarium
0
0.2
0.4
0.6
4 10 40 60
En
zy
me a
cti
vit
y
Temperature in 0C
B.pantothenticus
B.pantothe
nticus

Siddiqui HN et al., Sch. Acad. J. Biosci., 2015; 3(6):541-557
557
M et al [6] and it was similar to my work in which
enzyme shows higher activity at pH 7 and at
400C.Maximum, dye-decolorizing efficiency was
observed at 200 mg/l concentration of Acidblue113
Gurulakshmi. M et al [6] but in this study maximum
dye decolorization was observed at g/l concentration
cxcept congo red which was 500mg/l. He confirmed
decolorization by UV-VIS spectrophotometer but in this study decolorization were confiremed by colorimeter.
In this studyAzoreductase enzyme was
purified by ion exchange chromatography and the m.wt.
and purity was checked by SDS-PAGE and the similar
procedure of purification was used by Jahir Alam Khan
[13].
CONCLUSION
Different industrial effluent containing dyes
which produce aromatic amines are harmful for animal, plants and also cause the water pollution. On the basis
of this study it was concluded that B.pantothenticus,
B.bravis (Bacteria) and A.niger, A.fusarium (Fungus)
have ability to produced Azoreductase enzyme which
catalyzed the degradation of azodyes i.e. methyl red,
congo red. It was found that particular microbial
enzyme have capable to degrade specific kinds of dyes
and all the isolated microbes was not able to degrade all
dyes which was used in this study. Enzyme produced by
B.pantothenticus have ability to degrade methyl red and
congo red dye where the A.niger and fusarium are
capable to degrade methyl red except the congo red. Enzymes used NADH for the electron transfer, which
leads the azo bond reduction. Degradation of dyes and
the enzyme activity is depends upon the concentration
of dye. Activity of enzyme increases with decrease dye
concentration. Around pH 6 to 8 and the temperature
between 30 to 40. Azoreductase purified from all
isolated microbes here is oxygen insensitive thus
treatment of effluent can be performed at very low cost
at the industrial site as compare to the anaerobic
treatment which required large input.
REFERENCE
1. Van der Zee FP; Anaerobic azo dye reduction.
Doctoral Thesis, Wageningen University.
Wageningen, The Netherlands, 2002; 142
2. Christie R; Colour Chemistry. The Royal Society
of Chemistry, Cambridge, United Kingdom, 2001.
3. Zollinger H; Syntheses, Properties and
Applications of Organic Dyes and Pigments. In:
Colour Chemistry (2nd Ed). VCH Publishers:
Weinheim; P. 496; 1991.
4. Stolz A; Basic and applied aspects in the microbial
degradation of azo dyes. Appl. Microbiol. Biotechnol, 2001 56: 69-80.
5. Chung KT: The significance of azo-reduction in the
mutagenesis and carcinogenesis of azo dyes. Mutat.
Res., 1983; 114: 269-281.
6. Gurulakshmi M, Sudarmani DNP, Venba R;
Biodegradation of Leather Acid dye by Bacillus
subtilis. Advanced Biotech, November 2008
7. Robinson T, McMullan G, Marchant R, Nigam P;
Remediation of dyes in textile effluent: a critical
review on current treatment technologies with a
proposed alternative, Bioresource Technology,
2001; 77:247–55. 8. Russ R, Rau J, Stolz A; The function of
cytoplasmic flavin reductases in the bacterial
reduction of azo dyes. Appl. Environ. Microbiol,
2000; 66:1429-1434
9. Oranusi NA, Ogugbue CJ; Effect of pH and
nutrient starvation on biodegradation of Azodyes
by Pseudomonas sp. J. Appl. Sci. Environ. Manage,
2005; 9(1):39-43.
10. Park EH, Jang MS, Cha IH, Choi YL, Cho YS,
Kim CH, Lee YC; Decolorization of a sulfonated
azo dye, Congo Red, by Staphylococcus sp. EY-3. Journal of Microbiology and Biotechnology, 2005;
15:221–225.
11. Singh L; Exploration of fungus Gliocladium virens
for textile dye (congo red) accumulation/
degradation in semi-solid medium: A microbial
approach for hazardous degradation” paper
presented in conference “ISME 12” held on August
17-22, 2008, in Cairns, Australia.
12. Singh L, Singh VP; Microbial degradation and
decolourization of dyes in semisolid medium by the
fungus – Trichoderma harzianum. Environment &
We: International Journal of Science & Technology, 2010; 5(3):147-153.
13. Khan JA; Biodegradation of Azo Dye by
Moderately Halotolerant Bacillus megaterium and
Study of Enzyme Azoreductase Involved in
Degradation. Advanced Biotech, 2011; 10(7):
14. Mane UV, Gurav PN, Deshmukh AM, Govindwar
SP; Degradation of textile dye reactive navy – blue
Rx (Reactive blue–59) by an isolated Actinomycete
Streptomyces krainskii SUK – 5. Malaysian Journal
of Microbiology, 2008; 4(2):1-5.)
15. Zimmermann T, Hans GK, Leisinger T; Properties of purified Orange II Azoreductase, the enzyme
Initiating Azo Dye degradation by Pseudomonas
KF46. Eur. J. Biochem, 1982;129:197-203.
16. Chang JS, Chou C, Lin YC, Lin PJ, Ho JY, Hu TL,
Kinetics characteristics of bacterial azo dye
decolorization by Pseudomonas luteola. Water
Research, 2001; 35: 2841–2850.
17. Sumit P, Gilbert HJ; Curr. Purification and
Identification of an FMN-dependent NAD(P)H
Azoreductase from Enterococcus faecalis, 2001;11:
59-66.