Embed Size (px)
Citation preview
Research ArticleMagnitude of Anemia and Hematological Predictors amongChildren under 12 Years in Odisha, India
Shuchismita Behera and Gandham Bulliyya
Regional Medical Research Centre, Indian Council of Medical Research, Bhubaneswar 751023, India
Correspondence should be addressed to Gandham Bulliyya; [email protected]
Received 30 December 2015; Revised 11 March 2016; Accepted 16 March 2016
Academic Editor: Aurelio Maggio
Copyright © 2016 S. Behera and G. Bulliyya. This is an open access article distributed under the Creative Commons AttributionLicense, which permits unrestricted use, distribution, and reproduction in any medium, provided the original work is properlycited.
Background. Anemia is a wide spread public health problem in India which affects children. The present study evaluates theprevalence of anemia and status of various hematological parameters among children of Khurda district, Odisha.Method. A totalof 313 children aged 0–12 years were enrolled for the study which included preschool (0–5 years) and school aged (6–12 years)groups. Hematological indicators were measured by standard procedures, which include red blood cell (RBC) indicators, whiteblood cell (WBC) indicators, and plasma ferritin. Results. Mean hemoglobin (Hb) of the study population was 10.43 ± 3.33 g/dLand prevalence of anemia was 62%. In this population, boys had a lower mean Hb value than that of the girls. All grades of anemiawere higher among school age children than preschool children. Mean plasma ferritin was found to be higher in school age boysthan their counterpart girls.Themean level ofWBC count was found to be higher among preschool age boys than among the schoolage boys (𝑝 = 0.025). Conclusion. The prevalence of anemia was higher with concomitant acute infection among study population,which is a matter of concern. Since the hematological parameters are interrelated with each other as well as with the age and gender,relevant intervention strategy and constant monitoring are needed while providing public health nutrition programs to eradicateanemia.
1. Introduction
Anemia is a widespread public health problem associatedwith an increased risk of morbidity and mortality, especiallyin pregnant women and young children [1]. Globally 1.62billion people are anemic, while among the preschool chil-dren the prevalence of anemia is 47.4%. Nutritional anemia inSouth Asia accounts for nearly half of global cases of anemia.In India, anemia continues to be the major health problemin young children, adolescent girls, and pregnant women.Approximately 50%of the population suffers fromnutritionalanemia as known in countries where meat consumption islow [2].
In India, about 89million children are anemic.The preva-lence of anemia was 70% in children aged 6–59 months [3].The highest prevalence of anemia was seen in children <10years, especially in those <5 years [4]. Iron deficiency is oneof themost common causes of anemia [5]. Besides iron, othernutrients such as vitamins A, E, and C also play key role
in formation and protection of red blood cell (RBC) by stim-ulating stem cells as well as by activating a number of antiox-idant enzymes [6]. Therefore inadequacy of any of thesemicronutrients may lead to anemia in the vulnerable sectionsof population. Studies have shown that preschool childrenare more vulnerable to the risk of iron deficiency anemia.The prevalence of iron deficiency anemia is the highestamong preschool children. In this age group (6–59 months),body grows rapidly and requires high-iron-rich and nutri-tious food that may not be fulfilled by their normal diet. Loweconomic status, less education, and poor health of mothersdue to meager dietary intake are the main causes of anemia.Anemia is the most predominant factor for morbidity andchild mortality, and, hence, it is a critical health issue forchildren in India. Iron deficiency affects cognitive and motordevelopment and increases susceptibility to infections. Theprevention as well as timely management of anemia isessential to attain Sustainable Development Goal-3 (SDG) onensuring healthy lives and promoting wellbeing for all at all
Hindawi Publishing CorporationAnemiaVolume 2016, Article ID 1729147, 10 pageshttp://dx.doi.org/10.1155/2016/1729147
2 Anemia
ages. Further actions are required to reach the World HealthAssembly target of a 50% reduction of anemia in women ofreproductive age by 2025.
Odisha (formerly Orissa) is one of eight empoweredaction group (EAG) states of India with poor demographicand socioeconomic indicators including maternal and childhealth. The Clinical, Anthropometric, and Biochemical(CAB) survey conducted recently in 2014 shows that 70.6%and 81.2% of children aged 6–59 months and 5–9-year-old children are suffering from anemia. Hence, informationregarding young children is inadequate on factors affectinganemia. However, no report is available on prevalence ofanemia among children in Khurda district. In the presentstudy, an attempt has been made to assess the magnitude ofiron deficiency anemia by measuring hematological indices.
2. Materials and Methods
2.1. Setting. The study was conducted in the rural surround-ings of Bhubaneswar city in Khurda district, the state capitalof Odisha located on the east coast of India, by the Bayof Bengal. Apparently healthy children aged less than 12years were chosen for the study, which included preschoolchildren (0–5 years) and school age children (6–12 years).Children havingmedication in the past fortnight prior to datacollection and unwilling individuals were excluded from thestudy.
2.2. Study Design. This is a cross-sectional community-basedsurvey. All children and their parents were informed aboutthe purpose and themethod of the research and the voluntarynature of participation in the study verbally and in writtenform.
2.3. Ethical Consideration. Informed written consent wasobtained from the parents of each child after the studyobjective was explained. The study protocol was approvedby the Institutional Human Ethical Committee of RegionalMedical Research Centre, Bhubaneswar.
2.4. Data Collection. A pretested questionnaire was appliedto obtain relevant information of demographic and socioe-conomic data. Age of each child was collected from dateof birth certificate or birth records available with mother.Confirmation of a child’s age was made with the mother withthe help of Anganwadi Workers, community health workers.
2.5. Anthropometric Measurements. Body weight and heightwere measured using standardised equipment and proce-dures. Body mass index (BMI) for each child was calculatedbased on the ratio of weight (kg) to height in square meters.BMI data were transformed to 𝑧-scores, namely, BMI-for-age𝑧-score (BAZ) using the WHO Growth Standards [7].
2.6. Blood Samples. Either finger prick or venous blood wascollected according to the agreement of the participants. Thefinger prick blood was transferred to Whatman number 1filter paper while twomL of venous blood was dispensed into
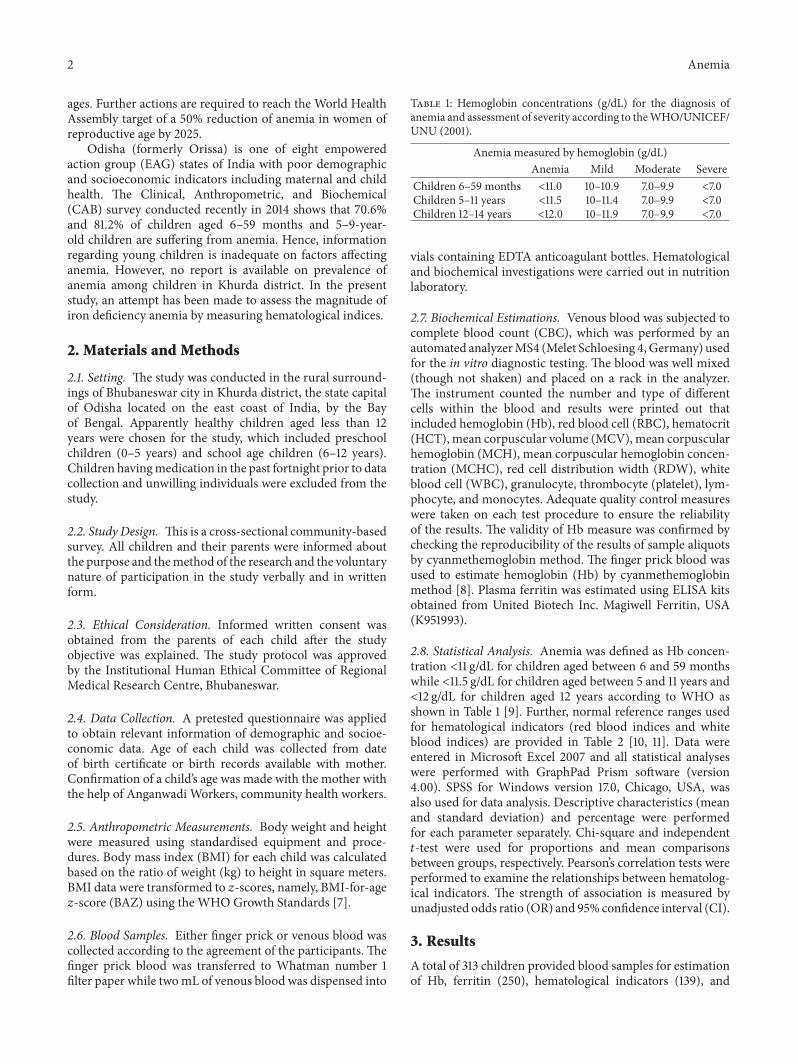
Table 1: Hemoglobin concentrations (g/dL) for the diagnosis ofanemia and assessment of severity according to theWHO/UNICEF/UNU (2001).
Anemia measured by hemoglobin (g/dL)Anemia Mild Moderate Severe
Children 6–59 months <11.0 10–10.9 7.0–9.9 <7.0Children 5–11 years <11.5 10–11.4 7.0–9.9 <7.0Children 12–14 years <12.0 10–11.9 7.0–9.9 <7.0
vials containing EDTA anticoagulant bottles. Hematologicaland biochemical investigations were carried out in nutritionlaboratory.
2.7. Biochemical Estimations. Venous blood was subjected tocomplete blood count (CBC), which was performed by anautomated analyzerMS4 (Melet Schloesing 4,Germany) usedfor the in vitro diagnostic testing. The blood was well mixed(though not shaken) and placed on a rack in the analyzer.The instrument counted the number and type of differentcells within the blood and results were printed out thatincluded hemoglobin (Hb), red blood cell (RBC), hematocrit(HCT), mean corpuscular volume (MCV), mean corpuscularhemoglobin (MCH), mean corpuscular hemoglobin concen-tration (MCHC), red cell distribution width (RDW), whiteblood cell (WBC), granulocyte, thrombocyte (platelet), lym-phocyte, and monocytes. Adequate quality control measureswere taken on each test procedure to ensure the reliabilityof the results. The validity of Hb measure was confirmed bychecking the reproducibility of the results of sample aliquotsby cyanmethemoglobin method. The finger prick blood wasused to estimate hemoglobin (Hb) by cyanmethemoglobinmethod [8]. Plasma ferritin was estimated using ELISA kitsobtained from United Biotech Inc. Magiwell Ferritin, USA(K951993).
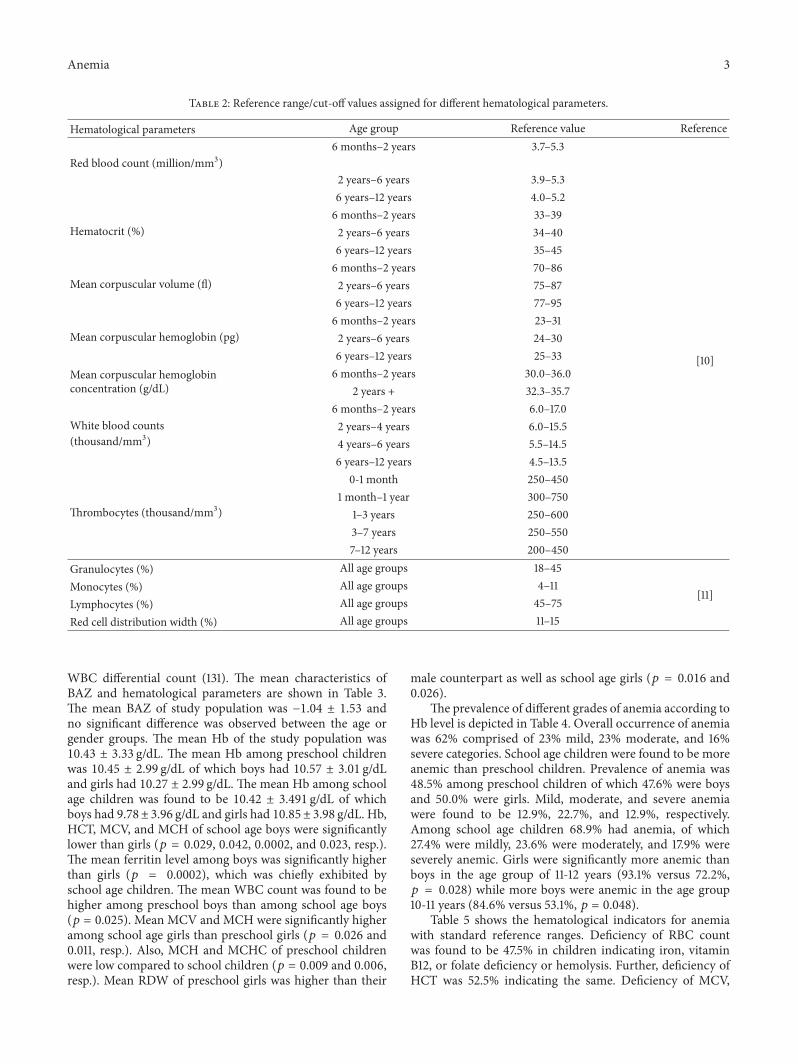
2.8. Statistical Analysis. Anemia was defined as Hb concen-tration <11 g/dL for children aged between 6 and 59 monthswhile <11.5 g/dL for children aged between 5 and 11 years and<12 g/dL for children aged 12 years according to WHO asshown in Table 1 [9]. Further, normal reference ranges usedfor hematological indicators (red blood indices and whiteblood indices) are provided in Table 2 [10, 11]. Data wereentered in Microsoft Excel 2007 and all statistical analyseswere performed with GraphPad Prism software (version4.00). SPSS for Windows version 17.0, Chicago, USA, wasalso used for data analysis. Descriptive characteristics (meanand standard deviation) and percentage were performedfor each parameter separately. Chi-square and independent𝑡-test were used for proportions and mean comparisonsbetween groups, respectively. Pearson’s correlation tests wereperformed to examine the relationships between hematolog-ical indicators. The strength of association is measured byunadjusted odds ratio (OR) and 95% confidence interval (CI).
3. Results
A total of 313 children provided blood samples for estimationof Hb, ferritin (250), hematological indicators (139), and
Anemia 3
Table 2: Reference range/cut-off values assigned for different hematological parameters.
Hematological parameters Age group Reference value Reference
Red blood count (million/mm3)6 months–2 years 3.7–5.3
[10]
2 years–6 years 3.9–5.36 years–12 years 4.0–5.2
Hematocrit (%)6 months–2 years 33–392 years–6 years 34–406 years–12 years 35–45
Mean corpuscular volume (fl)6 months–2 years 70–862 years–6 years 75–876 years–12 years 77–95
Mean corpuscular hemoglobin (pg)6 months–2 years 23–312 years–6 years 24–306 years–12 years 25–33
Mean corpuscular hemoglobinconcentration (g/dL)
6 months–2 years 30.0–36.02 years + 32.3–35.7
White blood counts(thousand/mm3)
6 months–2 years 6.0–17.02 years–4 years 6.0–15.54 years–6 years 5.5–14.56 years–12 years 4.5–13.5
Thrombocytes (thousand/mm3)
0-1 month 250–4501 month–1 year 300–750
1–3 years 250–6003–7 years 250–5507–12 years 200–450
Granulocytes (%) All age groups 18–45
[11]Monocytes (%) All age groups 4–11Lymphocytes (%) All age groups 45–75Red cell distribution width (%) All age groups 11–15
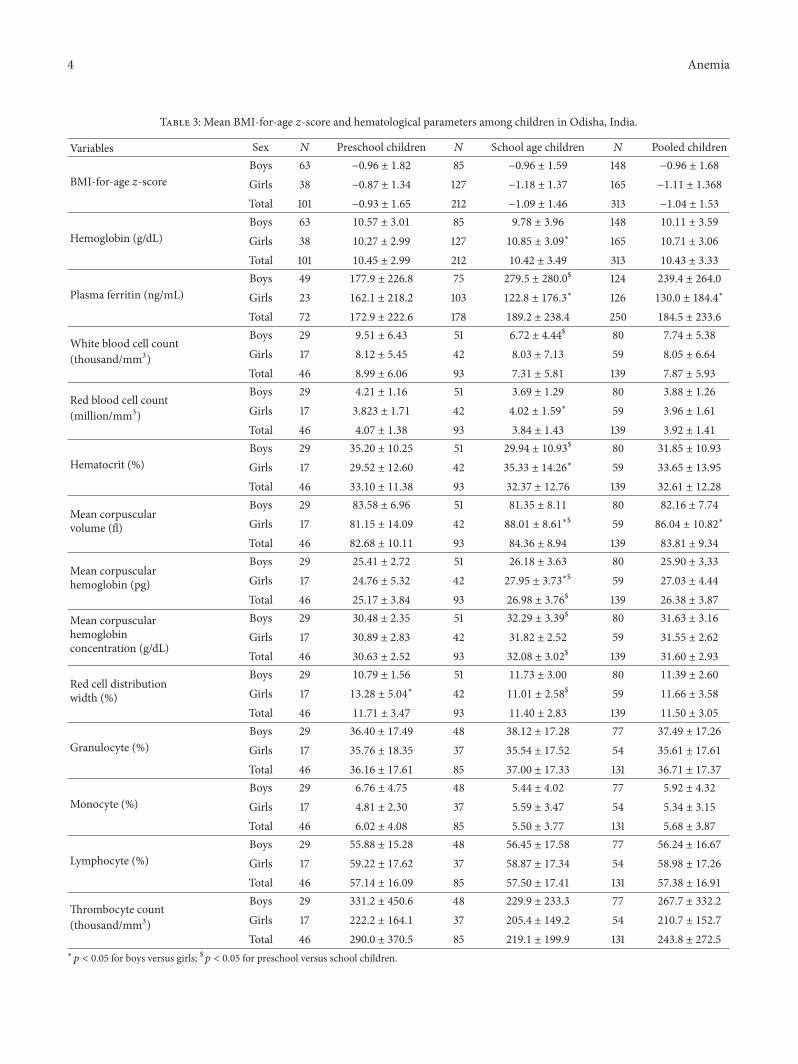
WBC differential count (131). The mean characteristics ofBAZ and hematological parameters are shown in Table 3.The mean BAZ of study population was −1.04 ± 1.53 andno significant difference was observed between the age orgender groups. The mean Hb of the study population was10.43 ± 3.33 g/dL. The mean Hb among preschool childrenwas 10.45 ± 2.99 g/dL of which boys had 10.57 ± 3.01 g/dLand girls had 10.27 ± 2.99 g/dL. The mean Hb among schoolage children was found to be 10.42 ± 3.491 g/dL of whichboys had 9.78± 3.96 g/dL and girls had 10.85± 3.98 g/dL. Hb,HCT, MCV, and MCH of school age boys were significantlylower than girls (𝑝 = 0.029, 0.042, 0.0002, and 0.023, resp.).The mean ferritin level among boys was significantly higherthan girls (𝑝 = 0.0002), which was chiefly exhibited byschool age children. The mean WBC count was found to behigher among preschool boys than among school age boys(𝑝 = 0.025). Mean MCV and MCH were significantly higheramong school age girls than preschool girls (𝑝 = 0.026 and0.011, resp.). Also, MCH and MCHC of preschool childrenwere low compared to school children (𝑝 = 0.009 and 0.006,resp.). Mean RDW of preschool girls was higher than their
male counterpart as well as school age girls (𝑝 = 0.016 and0.026).
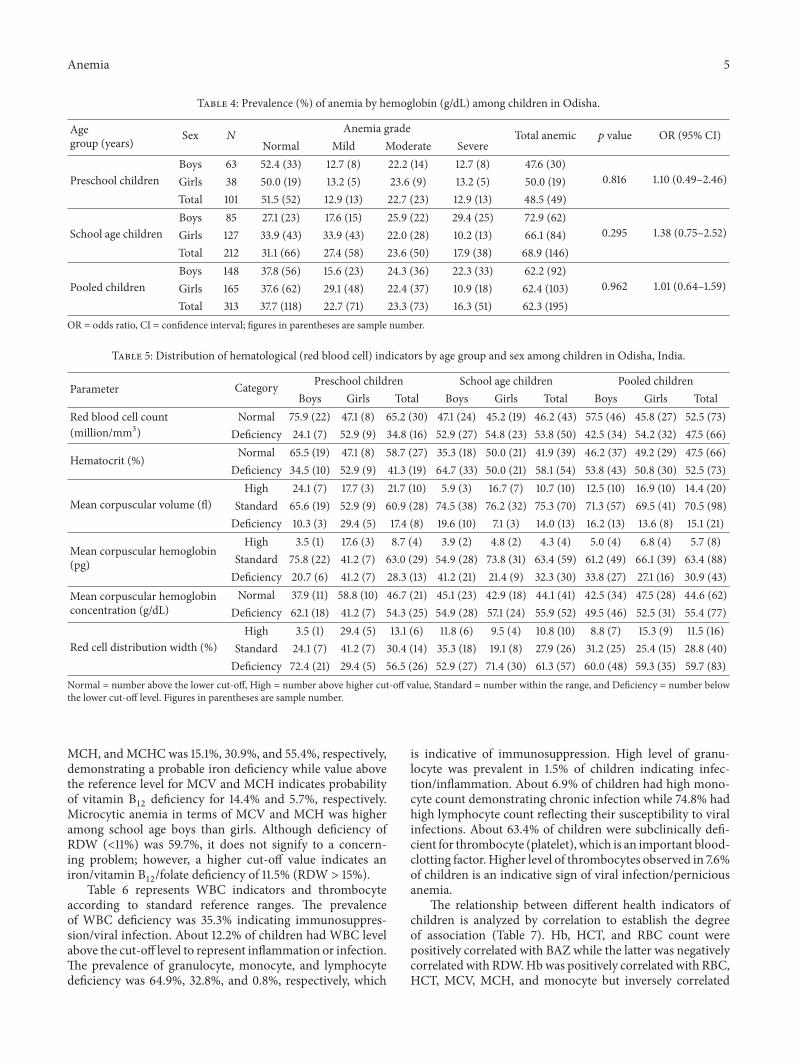
The prevalence of different grades of anemia according toHb level is depicted in Table 4. Overall occurrence of anemiawas 62% comprised of 23% mild, 23% moderate, and 16%severe categories. School age children were found to be moreanemic than preschool children. Prevalence of anemia was48.5% among preschool children of which 47.6% were boysand 50.0% were girls. Mild, moderate, and severe anemiawere found to be 12.9%, 22.7%, and 12.9%, respectively.Among school age children 68.9% had anemia, of which27.4% were mildly, 23.6% were moderately, and 17.9% wereseverely anemic. Girls were significantly more anemic thanboys in the age group of 11-12 years (93.1% versus 72.2%,𝑝 = 0.028) while more boys were anemic in the age group10-11 years (84.6% versus 53.1%, 𝑝 = 0.048).
Table 5 shows the hematological indicators for anemiawith standard reference ranges. Deficiency of RBC countwas found to be 47.5% in children indicating iron, vitaminB12, or folate deficiency or hemolysis. Further, deficiency ofHCT was 52.5% indicating the same. Deficiency of MCV,
4 Anemia
Table 3: Mean BMI-for-age 𝑧-score and hematological parameters among children in Odisha, India.
Variables Sex 𝑁 Preschool children 𝑁 School age children 𝑁 Pooled children
BMI-for-age 𝑧-scoreBoys 63 −0.96 ± 1.82 85 −0.96 ± 1.59 148 −0.96 ± 1.68
Girls 38 −0.87 ± 1.34 127 −1.18 ± 1.37 165 −1.11 ± 1.368
Total 101 −0.93 ± 1.65 212 −1.09 ± 1.46 313 −1.04 ± 1.53
Hemoglobin (g/dL)Boys 63 10.57 ± 3.01 85 9.78 ± 3.96 148 10.11 ± 3.59
Girls 38 10.27 ± 2.99 127 10.85 ± 3.09∗ 165 10.71 ± 3.06
Total 101 10.45 ± 2.99 212 10.42 ± 3.49 313 10.43 ± 3.33
Plasma ferritin (ng/mL)Boys 49 177.9 ± 226.8 75 279.5 ± 280.0
$ 124 239.4 ± 264.0
Girls 23 162.1 ± 218.2 103 122.8 ± 176.3∗ 126 130.0 ± 184.4
∗
Total 72 172.9 ± 222.6 178 189.2 ± 238.4 250 184.5 ± 233.6
White blood cell count(thousand/mm3)
Boys 29 9.51 ± 6.43 51 6.72 ± 4.44$ 80 7.74 ± 5.38
Girls 17 8.12 ± 5.45 42 8.03 ± 7.13 59 8.05 ± 6.64
Total 46 8.99 ± 6.06 93 7.31 ± 5.81 139 7.87 ± 5.93
Red blood cell count(million/mm3)
Boys 29 4.21 ± 1.16 51 3.69 ± 1.29 80 3.88 ± 1.26
Girls 17 3.823 ± 1.71 42 4.02 ± 1.59∗ 59 3.96 ± 1.61
Total 46 4.07 ± 1.38 93 3.84 ± 1.43 139 3.92 ± 1.41
Hematocrit (%)Boys 29 35.20 ± 10.25 51 29.94 ± 10.93
$ 80 31.85 ± 10.93
Girls 17 29.52 ± 12.60 42 35.33 ± 14.26∗ 59 33.65 ± 13.95
Total 46 33.10 ± 11.38 93 32.37 ± 12.76 139 32.61 ± 12.28
Mean corpuscularvolume (fl)
Boys 29 83.58 ± 6.96 51 81.35 ± 8.11 80 82.16 ± 7.74
Girls 17 81.15 ± 14.09 42 88.01 ± 8.61∗$ 59 86.04 ± 10.82
∗
Total 46 82.68 ± 10.11 93 84.36 ± 8.94 139 83.81 ± 9.34
Mean corpuscularhemoglobin (pg)
Boys 29 25.41 ± 2.72 51 26.18 ± 3.63 80 25.90 ± 3.33
Girls 17 24.76 ± 5.32 42 27.95 ± 3.73∗$ 59 27.03 ± 4.44
Total 46 25.17 ± 3.84 93 26.98 ± 3.76$ 139 26.38 ± 3.87
Mean corpuscularhemoglobinconcentration (g/dL)
Boys 29 30.48 ± 2.35 51 32.29 ± 3.39$ 80 31.63 ± 3.16
Girls 17 30.89 ± 2.83 42 31.82 ± 2.52 59 31.55 ± 2.62
Total 46 30.63 ± 2.52 93 32.08 ± 3.02$ 139 31.60 ± 2.93
Red cell distributionwidth (%)
Boys 29 10.79 ± 1.56 51 11.73 ± 3.00 80 11.39 ± 2.60
Girls 17 13.28 ± 5.04∗ 42 11.01 ± 2.58
$ 59 11.66 ± 3.58
Total 46 11.71 ± 3.47 93 11.40 ± 2.83 139 11.50 ± 3.05
Granulocyte (%)Boys 29 36.40 ± 17.49 48 38.12 ± 17.28 77 37.49 ± 17.26
Girls 17 35.76 ± 18.35 37 35.54 ± 17.52 54 35.61 ± 17.61
Total 46 36.16 ± 17.61 85 37.00 ± 17.33 131 36.71 ± 17.37
Monocyte (%)Boys 29 6.76 ± 4.75 48 5.44 ± 4.02 77 5.92 ± 4.32
Girls 17 4.81 ± 2.30 37 5.59 ± 3.47 54 5.34 ± 3.15
Total 46 6.02 ± 4.08 85 5.50 ± 3.77 131 5.68 ± 3.87
Lymphocyte (%)Boys 29 55.88 ± 15.28 48 56.45 ± 17.58 77 56.24 ± 16.67
Girls 17 59.22 ± 17.62 37 58.87 ± 17.34 54 58.98 ± 17.26
Total 46 57.14 ± 16.09 85 57.50 ± 17.41 131 57.38 ± 16.91
Thrombocyte count(thousand/mm3)
Boys 29 331.2 ± 450.6 48 229.9 ± 233.3 77 267.7 ± 332.2
Girls 17 222.2 ± 164.1 37 205.4 ± 149.2 54 210.7 ± 152.7
Total 46 290.0 ± 370.5 85 219.1 ± 199.9 131 243.8 ± 272.5
∗𝑝 < 0.05 for boys versus girls; $𝑝 < 0.05 for preschool versus school children.
Anemia 5
Table 4: Prevalence (%) of anemia by hemoglobin (g/dL) among children in Odisha.
Agegroup (years) Sex 𝑁
Anemia grade Total anemic 𝑝 value OR (95% CI)Normal Mild Moderate Severe
Preschool childrenBoys 63 52.4 (33) 12.7 (8) 22.2 (14) 12.7 (8) 47.6 (30)
0.816 1.10 (0.49–2.46)Girls 38 50.0 (19) 13.2 (5) 23.6 (9) 13.2 (5) 50.0 (19)Total 101 51.5 (52) 12.9 (13) 22.7 (23) 12.9 (13) 48.5 (49)
School age childrenBoys 85 27.1 (23) 17.6 (15) 25.9 (22) 29.4 (25) 72.9 (62)
0.295 1.38 (0.75–2.52)Girls 127 33.9 (43) 33.9 (43) 22.0 (28) 10.2 (13) 66.1 (84)Total 212 31.1 (66) 27.4 (58) 23.6 (50) 17.9 (38) 68.9 (146)
Pooled childrenBoys 148 37.8 (56) 15.6 (23) 24.3 (36) 22.3 (33) 62.2 (92)
0.962 1.01 (0.64–1.59)Girls 165 37.6 (62) 29.1 (48) 22.4 (37) 10.9 (18) 62.4 (103)Total 313 37.7 (118) 22.7 (71) 23.3 (73) 16.3 (51) 62.3 (195)
OR = odds ratio, CI = confidence interval; figures in parentheses are sample number.
Table 5: Distribution of hematological (red blood cell) indicators by age group and sex among children in Odisha, India.
Parameter Category Preschool children School age children Pooled childrenBoys Girls Total Boys Girls Total Boys Girls Total
Red blood cell count(million/mm3)
Normal 75.9 (22) 47.1 (8) 65.2 (30) 47.1 (24) 45.2 (19) 46.2 (43) 57.5 (46) 45.8 (27) 52.5 (73)Deficiency 24.1 (7) 52.9 (9) 34.8 (16) 52.9 (27) 54.8 (23) 53.8 (50) 42.5 (34) 54.2 (32) 47.5 (66)
Hematocrit (%) Normal 65.5 (19) 47.1 (8) 58.7 (27) 35.3 (18) 50.0 (21) 41.9 (39) 46.2 (37) 49.2 (29) 47.5 (66)Deficiency 34.5 (10) 52.9 (9) 41.3 (19) 64.7 (33) 50.0 (21) 58.1 (54) 53.8 (43) 50.8 (30) 52.5 (73)
Mean corpuscular volume (fl)High 24.1 (7) 17.7 (3) 21.7 (10) 5.9 (3) 16.7 (7) 10.7 (10) 12.5 (10) 16.9 (10) 14.4 (20)
Standard 65.6 (19) 52.9 (9) 60.9 (28) 74.5 (38) 76.2 (32) 75.3 (70) 71.3 (57) 69.5 (41) 70.5 (98)Deficiency 10.3 (3) 29.4 (5) 17.4 (8) 19.6 (10) 7.1 (3) 14.0 (13) 16.2 (13) 13.6 (8) 15.1 (21)
Mean corpuscular hemoglobin(pg)
High 3.5 (1) 17.6 (3) 8.7 (4) 3.9 (2) 4.8 (2) 4.3 (4) 5.0 (4) 6.8 (4) 5.7 (8)Standard 75.8 (22) 41.2 (7) 63.0 (29) 54.9 (28) 73.8 (31) 63.4 (59) 61.2 (49) 66.1 (39) 63.4 (88)Deficiency 20.7 (6) 41.2 (7) 28.3 (13) 41.2 (21) 21.4 (9) 32.3 (30) 33.8 (27) 27.1 (16) 30.9 (43)
Mean corpuscular hemoglobinconcentration (g/dL)
Normal 37.9 (11) 58.8 (10) 46.7 (21) 45.1 (23) 42.9 (18) 44.1 (41) 42.5 (34) 47.5 (28) 44.6 (62)Deficiency 62.1 (18) 41.2 (7) 54.3 (25) 54.9 (28) 57.1 (24) 55.9 (52) 49.5 (46) 52.5 (31) 55.4 (77)
Red cell distribution width (%)High 3.5 (1) 29.4 (5) 13.1 (6) 11.8 (6) 9.5 (4) 10.8 (10) 8.8 (7) 15.3 (9) 11.5 (16)
Standard 24.1 (7) 41.2 (7) 30.4 (14) 35.3 (18) 19.1 (8) 27.9 (26) 31.2 (25) 25.4 (15) 28.8 (40)Deficiency 72.4 (21) 29.4 (5) 56.5 (26) 52.9 (27) 71.4 (30) 61.3 (57) 60.0 (48) 59.3 (35) 59.7 (83)
Normal = number above the lower cut-off, High = number above higher cut-off value, Standard = number within the range, and Deficiency = number belowthe lower cut-off level. Figures in parentheses are sample number.
MCH, andMCHCwas 15.1%, 30.9%, and 55.4%, respectively,demonstrating a probable iron deficiency while value abovethe reference level for MCV and MCH indicates probabilityof vitamin B
12deficiency for 14.4% and 5.7%, respectively.
Microcytic anemia in terms of MCV and MCH was higheramong school age boys than girls. Although deficiency ofRDW (<11%) was 59.7%, it does not signify to a concern-ing problem; however, a higher cut-off value indicates aniron/vitamin B
12/folate deficiency of 11.5% (RDW > 15%).
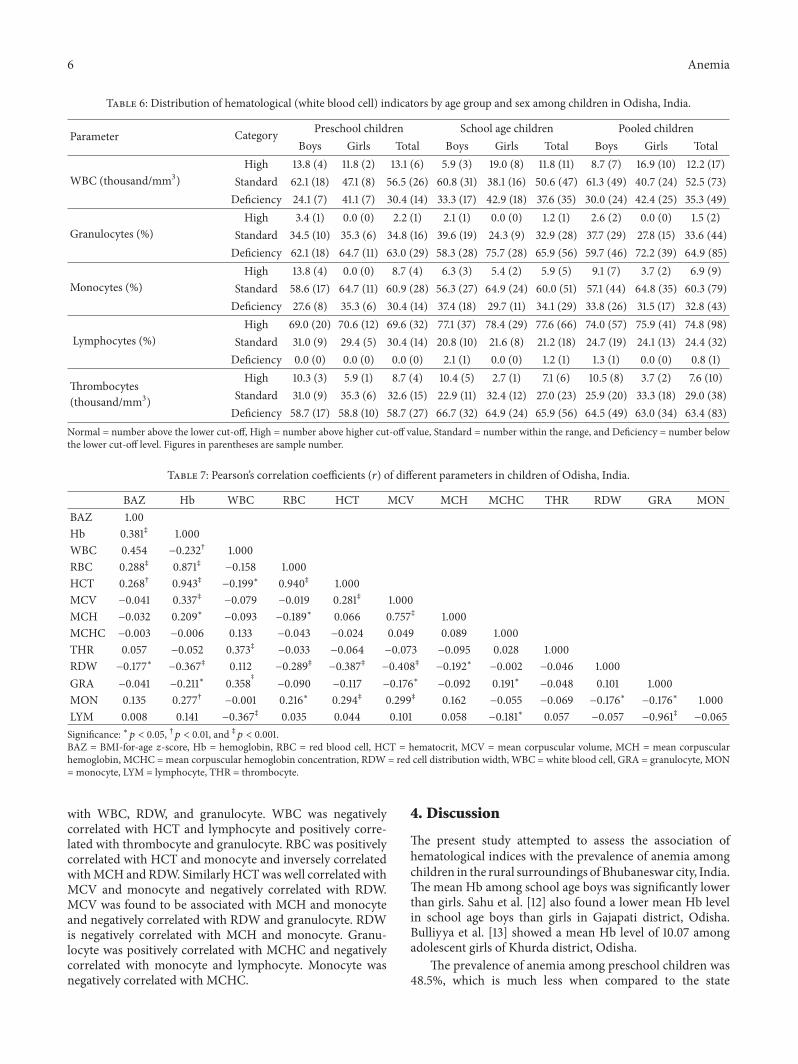
Table 6 represents WBC indicators and thrombocyteaccording to standard reference ranges. The prevalenceof WBC deficiency was 35.3% indicating immunosuppres-sion/viral infection. About 12.2% of children had WBC levelabove the cut-off level to represent inflammation or infection.The prevalence of granulocyte, monocyte, and lymphocytedeficiency was 64.9%, 32.8%, and 0.8%, respectively, which
is indicative of immunosuppression. High level of granu-locyte was prevalent in 1.5% of children indicating infec-tion/inflammation. About 6.9% of children had high mono-cyte count demonstrating chronic infection while 74.8% hadhigh lymphocyte count reflecting their susceptibility to viralinfections. About 63.4% of children were subclinically defi-cient for thrombocyte (platelet), which is an important blood-clotting factor. Higher level of thrombocytes observed in 7.6%of children is an indicative sign of viral infection/perniciousanemia.
The relationship between different health indicators ofchildren is analyzed by correlation to establish the degreeof association (Table 7). Hb, HCT, and RBC count werepositively correlated with BAZ while the latter was negativelycorrelated with RDW.Hbwas positively correlated with RBC,HCT, MCV, MCH, and monocyte but inversely correlated
6 Anemia
Table 6: Distribution of hematological (white blood cell) indicators by age group and sex among children in Odisha, India.
Parameter Category Preschool children School age children Pooled childrenBoys Girls Total Boys Girls Total Boys Girls Total
WBC (thousand/mm3)High 13.8 (4) 11.8 (2) 13.1 (6) 5.9 (3) 19.0 (8) 11.8 (11) 8.7 (7) 16.9 (10) 12.2 (17)
Standard 62.1 (18) 47.1 (8) 56.5 (26) 60.8 (31) 38.1 (16) 50.6 (47) 61.3 (49) 40.7 (24) 52.5 (73)Deficiency 24.1 (7) 41.1 (7) 30.4 (14) 33.3 (17) 42.9 (18) 37.6 (35) 30.0 (24) 42.4 (25) 35.3 (49)
Granulocytes (%)High 3.4 (1) 0.0 (0) 2.2 (1) 2.1 (1) 0.0 (0) 1.2 (1) 2.6 (2) 0.0 (0) 1.5 (2)
Standard 34.5 (10) 35.3 (6) 34.8 (16) 39.6 (19) 24.3 (9) 32.9 (28) 37.7 (29) 27.8 (15) 33.6 (44)Deficiency 62.1 (18) 64.7 (11) 63.0 (29) 58.3 (28) 75.7 (28) 65.9 (56) 59.7 (46) 72.2 (39) 64.9 (85)
Monocytes (%)High 13.8 (4) 0.0 (0) 8.7 (4) 6.3 (3) 5.4 (2) 5.9 (5) 9.1 (7) 3.7 (2) 6.9 (9)
Standard 58.6 (17) 64.7 (11) 60.9 (28) 56.3 (27) 64.9 (24) 60.0 (51) 57.1 (44) 64.8 (35) 60.3 (79)Deficiency 27.6 (8) 35.3 (6) 30.4 (14) 37.4 (18) 29.7 (11) 34.1 (29) 33.8 (26) 31.5 (17) 32.8 (43)
Lymphocytes (%)High 69.0 (20) 70.6 (12) 69.6 (32) 77.1 (37) 78.4 (29) 77.6 (66) 74.0 (57) 75.9 (41) 74.8 (98)
Standard 31.0 (9) 29.4 (5) 30.4 (14) 20.8 (10) 21.6 (8) 21.2 (18) 24.7 (19) 24.1 (13) 24.4 (32)Deficiency 0.0 (0) 0.0 (0) 0.0 (0) 2.1 (1) 0.0 (0) 1.2 (1) 1.3 (1) 0.0 (0) 0.8 (1)
Thrombocytes(thousand/mm3)
High 10.3 (3) 5.9 (1) 8.7 (4) 10.4 (5) 2.7 (1) 7.1 (6) 10.5 (8) 3.7 (2) 7.6 (10)Standard 31.0 (9) 35.3 (6) 32.6 (15) 22.9 (11) 32.4 (12) 27.0 (23) 25.9 (20) 33.3 (18) 29.0 (38)Deficiency 58.7 (17) 58.8 (10) 58.7 (27) 66.7 (32) 64.9 (24) 65.9 (56) 64.5 (49) 63.0 (34) 63.4 (83)
Normal = number above the lower cut-off, High = number above higher cut-off value, Standard = number within the range, and Deficiency = number belowthe lower cut-off level. Figures in parentheses are sample number.
Table 7: Pearson’s correlation coefficients (𝑟) of different parameters in children of Odisha, India.
BAZ Hb WBC RBC HCT MCV MCH MCHC THR RDW GRA MONBAZ 1.00Hb 0.381‡ 1.000WBC 0.454 −0.232† 1.000RBC 0.288‡ 0.871‡ −0.158 1.000HCT 0.268† 0.943‡ −0.199∗ 0.940‡ 1.000MCV −0.041 0.337‡ −0.079 −0.019 0.281‡ 1.000MCH −0.032 0.209∗ −0.093 −0.189∗ 0.066 0.757‡ 1.000MCHC −0.003 −0.006 0.133 −0.043 −0.024 0.049 0.089 1.000THR 0.057 −0.052 0.373‡ −0.033 −0.064 −0.073 −0.095 0.028 1.000RDW −0.177∗ −0.367‡ 0.112 −0.289‡ −0.387‡ −0.408‡ −0.192∗ −0.002 −0.046 1.000GRA −0.041 −0.211∗ 0.358
‡
−0.090 −0.117 −0.176∗ −0.092 0.191∗ −0.048 0.101 1.000MON 0.135 0.277† −0.001 0.216∗ 0.294‡ 0.299‡ 0.162 −0.055 −0.069 −0.176∗ −0.176∗ 1.000LYM 0.008 0.141 −0.367‡ 0.035 0.044 0.101 0.058 −0.181∗ 0.057 −0.057 −0.961‡ −0.065Significance: ∗𝑝 < 0.05, †𝑝 < 0.01, and ‡𝑝 < 0.001.BAZ = BMI-for-age 𝑧-score, Hb = hemoglobin, RBC = red blood cell, HCT = hematocrit, MCV = mean corpuscular volume, MCH = mean corpuscularhemoglobin, MCHC = mean corpuscular hemoglobin concentration, RDW = red cell distribution width, WBC = white blood cell, GRA = granulocyte, MON= monocyte, LYM = lymphocyte, THR = thrombocyte.
with WBC, RDW, and granulocyte. WBC was negativelycorrelated with HCT and lymphocyte and positively corre-lated with thrombocyte and granulocyte. RBC was positivelycorrelated with HCT and monocyte and inversely correlatedwithMCH andRDW. Similarly HCTwas well correlated withMCV and monocyte and negatively correlated with RDW.MCV was found to be associated with MCH and monocyteand negatively correlated with RDW and granulocyte. RDWis negatively correlated with MCH and monocyte. Granu-locyte was positively correlated with MCHC and negativelycorrelated with monocyte and lymphocyte. Monocyte wasnegatively correlated with MCHC.
4. Discussion
The present study attempted to assess the association ofhematological indices with the prevalence of anemia amongchildren in the rural surroundings of Bhubaneswar city, India.The mean Hb among school age boys was significantly lowerthan girls. Sahu et al. [12] also found a lower mean Hb levelin school age boys than girls in Gajapati district, Odisha.Bulliyya et al. [13] showed a mean Hb level of 10.07 amongadolescent girls of Khurda district, Odisha.
The prevalence of anemia among preschool children was48.5%, which is much less when compared to the state
Anemia 7
data of 92.4% [14]. The type of anemia among school agechildren was 68.9% (mild 27.4%, moderate 23.6%, and severe17.9%). Sahu et al. [12] found severity of anemia (35.2% mild,59.4% moderate, and 5.4% severe) in children in Gajapatidistrict much higher than the value in this study. Girls weresignificantly more anemic than boys in the age group of 11-12 years while more boys were anemic in the age group of10-11 years. Similar results were reported for school childrenin Bangalore where prevalence of anemia was higher in boysaged 10 years whereas it was high in girls aged 11 years [15].
The mean HCT, MCV, and MCH of school age boys weresignificantly lower than girls’. Zemel et al. [16] observed asignificantly lower HCT among boys than girls of school agesickle cell children (excluding children receiving transfusiontherapy). In this study chronic undernutrition (stunting)maybe one of the factors for lower level of HCT. Kokore et al.[17] found that MCV and MCH are statistically higherfor girls than their male counterparts aged 5–11 years. Thehypochromasia (MCH deficient) and microcytosis (MCVdeficient) in school age population are higher in boys than ingirls.The disruption of erythrocyte parameters likeMCV andMCH precedes the final stage of anemia with concurrent fallin Hb levels below the limit. In this study, decrease in MCVand MCH might indicate a deficiency in micronutrientsincluding iron and vitamins as suggested earlier [18].
Mean MCV and MCH were significantly higher amongschool age girls than preschool girls. Moreover, MCH andMCHC of preschool children were low compared to schoolchildren. Similar findings were observed among girls of dif-ferent age groups [19]. It was found thatMCV andMCHwereslightly lower in those under-5 children but subsequentlyincreased and reached to the adult level by age of 6 years[20]. Several studies reported an increase in mean MCHand MCHC levels with increase in age [19, 21]. Vitamin B
12
deficiency in terms of value above reference level for MCVand MCH was found to be 14.4% and 5.7%, respectively.Bleyere et al. [19] reported 5.1% of probable vitamin B
12
deficiency (high MCV) among children.In the current study, mean WBC count and proportion
above the upper level were higher among preschool boysthan school age boys (13.8% versus 5.9%). Excess WBC inthe peripheral blood may be indicative of various diseasestates, including inflammation (acute or chronic) from bac-teria virus or parasites [22]. Porniammongkol et al. [23]demonstrated that the percentage of children with elevatedWBC compared to normal range was higher in the youngerage than in the older age. In this study, the prevalence ofWBCdeficiency was 35.3% indicating immunosuppression/viralinfection while 12.2% of them had WBC level above thecut-off level representing inflammation or infection. Bleyereet al. [19] found WBC level below the range in 26.8% and0.8% in above the range of children in West Africa. Thepercentage of children above the upper limit wasmuch higherin this study population and the reason may be that bothWBC and granulocyte are inversely correlated with Hb (𝑝 <0.001). It was also previously well documented that WBCand percentage of neutrophil are inversely associatedwithHb[24]. Since a large proportion of study population is anemic(62%) that may lead to overall elevated levels of WBC.
The mean RDW was 11.5% in the study populationof which preschool girls have significantly higher level ofRDW both by mean level and frequency. It was previouslydemonstrated that RDW levels were significantly higher inlower age group of iron deficient children in Turkey as wellas girls who had higher value than boys [25]. A highercut-off value for RDW indicates an iron/vitamin B
12/folate
deficiency observed to be 11.5% in the study population. Anelevated RDW is also believed to be an early indicator of irondeficiency [26].
The mean values of granulocyte, monocyte, and lym-phocyte were 36.71%, 5.68%, and 57.38%, respectively, andpreschoolers had correspondingly 36.16%, 6.02%, and 57.14%as confirmed by our previous study [27] alongwith school agechildren having 37.00%, 5.50%, and 57.50%, respectively. Themean monocyte and lymphocyte values in children of WestAfrica were found to be 5.2% and 51.3%, respectively [17],which is closer to our value. The prevalence of granulocyte,monocyte, and lymphocyte deficiency was 64.9%, 32.8%, and0.8%, respectively. About 74.8% of children had high lympho-cyte count representing their susceptibility to viral infection.Kokore et al. [17] found only 0.3% of lymphocyte deficiencyin children, which is much less than that of our value, whilea high lymphocyte count was observed among 88.7% ofchildren. In this study chronic infectionwas indicated by highmonocyte count among 6.9% of children. The prevalence oflowmonocytes is reported to be less at 6.5% and 4.8%, respec-tively, in other studies [17, 19]. Monocytes represent a sourceof proinflammatory cytokines and thus are believed to playa role in obesity-associated disease [28]. Chapman et al. [29]demonstrated monocyte concentration to be an independentrisk factor for subclinical carotid atherosclerosis. About63.4% of children were below the lower range for throm-bocyte. Higher level of thrombocytes observed in 7.6% ofchildren indicates viral infection/pernicious anemia. Thishigh number of platelet deficiency may be due to variouscut-off levels suggested to be used for different age group ofchildren whereas many authors recommended to consider asingle cut-off for all age groups (<150 thousand/mm3). Usingthis range, Kokore et al. [17] and Bleyere et al. [19] foundlow thrombocytes in 1.9% and 5.8% of total population,respectively. It was observed that disorders of the bonemarrow and othermedical conditions could cause an elevatedplatelet count [30].
Hb was positively correlated with RBC, HCT, MCV,MCH, and monocyte in this population. At birth, the totalHb level, RBC, and HCT are shown to be higher than atany other period of life [31]. The Hb content and the RBCsthen gradually rise to adult levels by the age of puberty [32].Maude et al. [33] even also found RBC correlated positivelywith total Hb in homozygous sickle cell patients where thereis abnormal synthesis of Hb. It was established that the HCTusually correlates well with Hb but is even less sensitivefor iron deficiency than Hb [34]. The positive associationbetween Hb andMCV suggests a lesser chance of macrocyticanemia in the study population as the concentration of Hbvaries concomitantly with cell volume. When RBCs divide inthe bone marrow compartment, the resultant two daughter
8 Anemia
cells after each division are slightly smaller than the parentcell. The reduction in the number of such divisions results inthe eventual erythrocytes being larger than usual or macro-cytic, with a raised MCV leading to an overall reductionin cell division and in a reduction in Hb biosynthesis [35].Khan et al. [36] found significant relationship between Hband MCH in elderly Pakistani males. Under iron deficiencycondition, formation ofHb is reduced resulting in a reductionof MCH [37]. The transmembrane protein (ferroportin) isresponsible for the transfer of iron from enterocytes andmonocytes/macrophages to the circulation [38]. It was foundthat ferroportin mRNA expression was significantly reducedin monocytes of anemic subjects compared with controls[39]. Importantly, the decreased expression of ferroportinwasparalleled by increased iron storage in monocytes of anemiaof chronic disease patients as estimated by hyperferritine-mia. As a functional consequence of decreased ferroportinexpression and the subsequent reduction of cellular ironexport, intracellular iron levels will increase which interferesin the process of erythropoiesis, thus decreasing expressionof monocytes leading to decrease in Hb.
In this study, RDW was negatively correlated with Hb,RBC count, HCT, MCV, MCH, and monocyte. Lippi et al.[40] also found RDW negatively correlated with Hb andMCV, while inverse relationship of RDW was seen with theHb in iron deficiency anemia; however, no such correlationhappened with noniron deficiency anemia [41]. RDW isshown to have weak inverse correlation with that of HCT,Hb, and MCV in animal model [42] and humans [43]. TheRDW is usually increased in macrocytosis. Occasionally inspherocytosis and polychromatic macrocytes there are smallred cell agglutinates or red cells that have been ingested bymonocytes [44]. Increased RDW indicates the presence ofanisocytosis, which is related to impaired erythropoiesis anderythrocyte degradation, reflecting chronic inflammationand a high level of oxidative stress [45].
RBC was associated with HCT and monocyte and inver-sely with MCH. In anemia, a reduction of the Hb is usuallyaccompanied by reduction in the RBC and HCT [44]. It wasrevealed that venous HCT values correlated highly with cir-culating RBC volume [46]. Under autologous experimentalconditions, the presence of oxidative stressed erythrocytesin blood exacerbates cytokine production markedly andthus the activation status of human monocytes indicates aprobable influence of oxidative stress in these children [47].In anemic condition a marked fall in RBC, Hb, and HCT anda parallel increase in theMCV andMCHwere observed [44].
HCT was positively correlated with MCV and monocyte.Weir and Scott [35] noticed a positive correlation betweenHCT and MCV among elderly Pakistani males. MCV wasfound to be associated with MCH and monocyte positivelyand negatively with the granulocyte. There is a strong associ-ation between MCV and MCH in iron deficiency and mega-loblastic conditions [48]. It was observed that associationbetween high MCV (above cut-off) and high MCH (abovecut-off) as well as a higher peripheral blood monocyte countwith venous thrombosis indicates association of these bloodindices in vivo [49].
WBC was negatively correlated with HCT and lympho-cyte and positively with thrombocyte and granulocyte. It isestablished that HCT among children of 2–16 years is sig-nificantly lower among cases of bacterial and viral infectionwhere WBC is higher than controls [24]. WBC was corre-lated with thrombocyte in the adolescent population [50].Jabeen et al. [51] also noticed negative correlation of WBCwith lymphocyte but positive correlation with granulocyte.Granulocyte was correlated negatively with monocyte andlymphocyte in tandemwith others [51]. MCHCwas inverselyassociated with monocyte and positively with granulocyte.The correlation between HCT and monocyte (𝑝 < 0.001)is more significant than the correlation between Hb andmonocyte (𝑝 < 0.01). As MCHC is the ratio between Hb andHCT, negative correlation with monocyte indicates that withincrease in monocyte percentage there is increase in Hb, butthe rate of increment is less than that of HCT, which is alsoevidenced by their strength of association.
School age boys had significantly higher mean levels offerritin than school age girls. It was observed that, beginningin adolescence, males have higher values of ferritin thanfemales, a trend that persists into late adulthood [52]. Thepositive correlation of BAZ with Hb, RBC count, and HCTshows that rural children suffer more chronic malnourish-ment coupled with anemia [53]. Higher RDW is associatedwith systemic inflammation and undernutrition and repre-sents an integrative measure of the pathological process andhence a negative relation between BAZ and RDW [54].
5. Conclusion
The present study showed magnitude of anemia among chil-dren, which emphasizes the fact that existence of 62% anemiain the population is a matter of concern which is also relatedto undernutrition. The prevalence of high lymphocyte countin the population also indicates viral infection. The preva-lence of anemia was higher in lower age group, which wasfurther more due to frequent infections. Girls of preschoolage showed a probable iron, vitamin B
12, or folate deficiency
as indicated by high RDW value. Girls of the adolescent age(11-12 years) were more anemic indicating more nutritionalrequirement with the onset of puberty. However, overallschool age boys were found to be suffering from higherlevel of hypochromasia and microcytic anemia. Since thehematological parameters are interrelated with each other aswell as with the gender and age groups, constant monitoringand intervention strategy is needed while providing nutri-tional supplementation to eradicate anemia. We recommendawareness creation on water and sanitation and nutritionalcounselling to parents on consumption of iron-rich foodsand iron supplementation to prevent anemia among youngchildren with special emphasis on those from low incomegroup and socioeconomic deprived communities.
Competing Interests
The authors declare that there are no competing interestsregarding the publication of this paper.
Anemia 9
Authors’ Contributions
Shuchismita Behera was responsible for collecting the data,laboratory analysis, data management, interpreting the data,and writing the paper. Gandham Bulliyya was responsiblefor conceiving and designing the study, obtaining ethicalapproval, analyzing the data, interpreting the data, andcritically reviewing the paper.
Acknowledgments
This work was made possible by support from the Directorof RMRC, Bhubaneswar. The authors would like to thank theparticipating children and family members for their willing-ness to give the necessary information and blood samples.The authors also thank the local leaders and communityhealth workers for their kind support.
References
[1] World Health Organization, The World Health Report 2002:Reducing Risks, Promoting Healthy Life, World Health Organi-zation, Geneva, Switzerland, 2002.
[2] L. Allen, B. de Benoist, O. Dary, and R. Hurrell, Guidelines onFood Fortification with Micronutrients, WHO, Geneva, Switzer-land, 2006.
[3] R. K. Singh and S. Patra, “Extent of anaemia among preschoolchildren in EAG states, India: a challenge to policy makers,”Anemia, vol. 2014, Article ID 868752, 9 pages, 2014.
[4] G. Alvarez-Uria, P. K. Naik,M.Midde, P. S. Yalla, and R. Pakam,“Prevalence and severity of anaemia stratified by age and genderin rural India,” Anemia, vol. 2014, Article ID 176182, 5 pages,2014.
[5] L. Allen and J. Casterline-Sabel, “Prevalence and causes ofnutritional anemias,” in Nutritional Anemia, U. Ramakrishnan,Ed., pp. 7–21, CRC Press, Boca Raton, Fla, USA, 2001.
[6] S. Attri, N. Sharma, S. Jahagirdar, B. R. Thapa, and R. Prasad,“Erythrocyte metabolism and antioxidant status of patientswithWilson disease with hemolytic anemia,” Pediatric Research,vol. 59, no. 4, pp. 593–597, 2006.
[7] WHO Multicentre Growth Reference Study Group, “WHOChildGrowth Standards: length/height-for-age, weight-for-age,weight-for-length, weight-for-height and body mass index-for-age: methods and development,” Tech. Rep., World HealthOrganization, Geneva, Switzerland, 2006, http://www.who.int/childgrowth/standards/technical report/en/.
[8] INACG, Measurement of Iron Status. A Report of the Inter-national Nutritional Anaemia Consultative Group (INACG),Nutrition Foundation, New York, NY, USA, 1985.
[9] WHO/UNU/UNICEF, Iron Deficiency Anaemia: Assessment,Prevention and Control, A Guide for Programme Managers,WHO, Geneva, Switzerland, 2001.
[10] Peripheral blood reference ranges adapted from University ofWashington Medical Center, 2004, http://www.lymphomation.org/peripheral-blood-ref.pdf.
[11] International Waldenstrom’s Macroglobulinebia Foundation(IWMF), Complete Blood Count (CBC), International Walden-strom’s Macroglobulinebia Foundation, Sarasota, Fla, USA,2014.
[12] T. Sahu, N. C. Sahani, and L. Patnaik, “Childhood anemia—astudy in tribal area of Mohana block in Orissa,” Indian Journalof Community Medicine, vol. 32, no. 1, pp. 43–45, 2007.
[13] G. Bulliyya, G.Mallick, G. S. Sethy, and S. K. Kar, “Haemoglobinstatus of non-school going adolescent girls in three districts ofOrissa, India,” International Journal of Adolescent Medicine andHealth, vol. 19, no. 4, pp. 395–406, 2007.
[14] National Nutrition Monitoring Bureau (NNMB), “Prevalenceof micronutrient deficiencies,” NNMB Technical Report 22,National Institute of Nutrition, Indian Council of MedicalResearch, Hyderabad, India, 2003.
[15] S. Muthayya, P. Thankachan, M. B. Zimmermann et al., “Lowanemia prevalence in school-aged children in Bangalore, SouthIndia: possible effect of school health initiatives,” EuropeanJournal of Clinical Nutrition, vol. 61, no. 7, pp. 865–869, 2007.
[16] B. S. Zemel, D. A. Kawchak, K. Ohene-Frempong, J. I. Schall,and V. A. Stallings, “Effects of delayed pubertal development,nutritional status, and disease severity on longitudinal patternsof growth failure in children with sickle cell disease,” PediatricResearch, vol. 61, no. 5, pp. 607–613, 2007.
[17] B. A. Kokore, M. N. Bleyere, L. K. Kouakou, D. Kouassi, and P.A. Yapo, “Haematological status and anaemia prevalence amongchildren aged 5 to 11 years in school canteens in Abidjan (CoteD’ivoire),”Middle East Journal of Scientific Research, vol. 14, no.4, pp. 461–470, 2013.
[18] M. Ramzan, I. Ali, and A. Salam, “Iron deficiency anemia inschool children ofDera Ismail Khan, Pakistan,”Pakistan Journalof Nutrition, vol. 8, no. 3, pp. 259–263, 2009.
[19] M. N. Bleyere, A. B. Konan, A. K. Amonkan et al., “Changesin haematological parameters of children aged 5 to 18 years inAbidjan, Cote d’Ivoire,” Journal of Physiology and Pathophysiol-ogy, vol. 4, no. 2, pp. 11–22, 2013.
[20] A. F. Mohsen, A. El-Hazmi, and S. Warsy, “Normal referencevalues for hematological parameters, red cell indices, HbA2and HbFfrom early childhood through adolescence in Saudis,”Annals of Saudi Medicine, vol. 210, no. 3-4, pp. 165–169, 2001.
[21] M. S. Khan, S. Shahnaz, R. Sultana, and I. Ali, “Factors affectingSerumFerritin level in School going children ofDistrict Bannu,”Journal of Postgraduate Medical Institute, vol. 26, no. 3, pp. 237–241, 2012.
[22] N. Abramson and B. Melton, “Leukocytosis: basics of clinicalassessment,”American Family Physician, vol. 62, no. 9, pp. 2053–2060, 2000.
[23] O. Porniammongkol, U. Yamborisut, T. Intajak, and P. P.Sirichakwal, “Iron status of hill tribe children and adolescentboys: a cross sectional study at a welfare center in Chiang Mai,Thailand,” Pakistan Journal of Nutrition, vol. 10, no. 10, pp. 903–909, 2011.
[24] A. Ballin, Y. Senecky, U. Rubinstein et al., “Anemia associatedwith acute infection in children,”The Israel Medical AssociationJournal, vol. 14, no. 8, pp. 484–487, 2012.
[25] F. Akin, E. S. Solak, C. Kilicaslan, S. B. Boke, and S. Arslan,“Iron deficiency anemia among hospitalized children in Konya,Turkey,” Anemia, vol. 2013, Article ID 514801, 4 pages, 2013.
[26] F. A. Oski, “Iron deficiency in infancy and childhood,”The NewEngland Journal of Medicine, vol. 329, no. 3, pp. 190–193, 1993.
[27] S. Behera, G. Bulliyya, P. G. S. Sethy, and K. Kar, “Influence ofantioxidant vitamins on iron and haematological indicators inpre-school children,” International Journal of Food NutritionalSciences, vol. 1, no. 1, pp. 88–98, 2012.
10 Anemia
[28] K. S. Rogacev, C. Ulrich, L. Blomer et al., “Monocyte hetero-geneity in obesity and subclinical atherosclerosis,” EuropeanHeart Journal, vol. 31, no. 3, pp. 369–376, 2010.
[29] C. M. L. Chapman, J. P. Beilby, B. M. McQuillan, P. L. Thomp-son, and J. Hung, “Monocyte count, but not C-reactive proteinor interleukin-6, is an independent risk marker for subclinicalcarotid atherosclerosis,” Stroke, vol. 35, no. 7, pp. 1619–1624,2004.
[30] T. M. S. John, “Reasons for elevated platelet count,” 2014, http://www.livestrong.com/article/120976-reasons-elevated-platelet-count/.
[31] D. Burman, “Haemoglobin levels in normal infants aged 3 to 24months, and the effect of iron,”Archives of Disease in Childhood,vol. 47, no. 252, pp. 261–271, 1972.
[32] M. R. H. Taylor, C. V. Holland, R. Spencer, J. F. Jackson, G.I. O’Connor, and J. R. O’Donnell, “Haematological referenceranges for schoolchildren,” Clinical and Laboratory Haematol-ogy, vol. 19, no. 1, pp. 1–15, 1997.
[33] G. H. Maude, R. J. Hayes, and G. R. Serjeant, “The haematologyof steady state homozygous sickle cell disease: interrelationshipsbetween haematological indices,” British Journal of Haematol-ogy, vol. 66, no. 4, pp. 549–558, 1987.
[34] H. K. Biesalski and J. G. Erhardt, “Diagnosis of nutritionalanemia—laboratory assessment of iron status,” in NutritionalAnemia, M. B. Zimmermann and K. Kraemer, Eds., pp. 37–43,Sight and Life Press, Basel, Switzerland, 2007.
[35] D. G. Weir and J. M. Scott, “The biochemical basis of theneuropathy in cobalamin deficiency,” Bailliere’s Clinical Haema-tology, vol. 8, no. 3, pp. 479–497, 1995.
[36] Z. Khan, M. Nawaz, A. Khan, and U. Bacha, “Hemoglobin,red blood cell count, hematocrit and derived parameters fordiagnosing anemia in elderly males,” Proceedings of the PakistanAcademy of Sciences, vol. 50, no. 3, pp. 217–226, 2013.
[37] B. Thompson, “Food-based approaches for combating irondeficiency,” in Nutritional Anemia, M. B. Zimmermann andK. Kraemer, Eds., pp. 338–358, SIGHT and LIFE Press, Basel,Switzerland, 2007.
[38] A. Donovan, C. A. Lima, J. L. Pinkus et al., “The iron exporterferroportin/Slc40a1 is essential for iron homeostasis,” CellMetabolism, vol. 1, no. 3, pp. 191–200, 2005.
[39] I. Theurl, V. Mattle, M. Seifert, M. Mariani, C. Marth, and G.Weiss, “Dysregulated monocyte iron homeostasis and erythro-poietin formation in patients with anemia of chronic disease,”Blood, vol. 107, no. 10, pp. 4142–4148, 2006.
[40] G. Lippi, F. Sanchis-Gomar, E. Danese, and M. Montagnana,“Association of red blood cell distribution width with plasmalipids in a general population of unselected outpatients,” Kardi-ologia Polska, vol. 71, no. 9, pp. 931–936, 2013.
[41] R. Aulakh, I. Sohi, T. Singh, and N. Kakkar, “Red cell distri-bution width (RDW) in the diagnosis of iron deficiency withmicrocytic hypochromic anemia,” Indian Journal of Pediatrics,vol. 76, no. 3, pp. 265–267, 2009.
[42] C. Guglielmini, H. Poser, A. D. Pria et al., “Red blood celldistribution width in dogs with chronic degenerative valvulardisease,” Journal of theAmericanVeterinaryMedical Association,vol. 243, no. 6, pp. 858–862, 2013.
[43] A. Vaya, L. Rivera, J. Todolı, J. L. Hernandez, B. Laiz, andJ. M. Ricart, “Haematological, biochemical and inflammatoryparameters in inactive Behcet’s disease. Its association withred blood cell distribution width,” Clinical Hemorheology andMicrocirculation, vol. 56, no. 4, pp. 319–324, 2014.
[44] B. J. Bain, A Beginner’s Guide to Blood Cells: HaematologicalFindings in Health and Disease, Blackwell, London, UK, 2ndedition, 2003.
[45] L. Ferrucci, J. M. Guralnik, R. C. Woodman et al., “Proinflam-matory state and circulating erythropoietin in persons with andwithout anemia,”TheAmerican Journal of Medicine, vol. 118, no.11, pp. 1288.e11–1288.e19, 2005.
[46] D. M. Mock, E. F. Bell, G. L. Lankford, and J. A. Widness,“Hematocrit correlates well with circulating red blood cellvolume in very low birth weight infants,” Pediatric Research, vol.50, no. 4, pp. 525–531, 2001.
[47] A. M. Liese, M. Q. Siddiqi, J. H. Siegel, T. Denny, and Z.Spolarics, “Augmented TNF-𝛼 and IL-10 production by primedhuman monocytes following interaction with oxidatively mod-ified autologous erythrocytes,” Journal of Leukocyte Biology, vol.70, no. 2, pp. 289–296, 2001.
[48] R. F. Croft, A. M. Streeter, and B. J. O’neill, “Red cell indices inmegaloblastosis and iron deficiency,” Pathology, vol. 6, no. 2, pp.107–117, 1974.
[49] S. M. Rezende, W. M. Lijfering, F. R. Rosendaal, and S. C.Cannegieter, “Hematologic variables and venous thrombosis:red cell distribution width and blood monocyte count areassociated with an increased risk,” Haematologica, vol. 99, no.1, pp. 194–200, 2014.
[50] G. S. Tell, R. H. Grimm Jr., O. D. Vellar, and L.Theodorsen, “Therelationship of white cell count, platelet count, and hematocritto cigarette smoking in adolescents: the Oslo Youth Study,”Circulation, vol. 72, no. 5, pp. 971–974, 1985.
[51] F. Jabeen, H. A. Rizvi, F. Aziz, and A. Z. Wasti, “Hyperglycemicinduced variations in hematological indices in type 2 diabetics,”International Journal of Advance Research, vol. 1, no. 8, pp. 322–334, 2013.
[52] R. S. Gibson, Principles of Nutritional Assessment, OxfordUniversity Press, Oxford, UK, 2nd edition, 2005.
[53] R. Bhoite and U. Iyer, “Magnitude of malnutrition and irondeficiency anemiaamong rural school children: an appraisal,”Asian Journal of Experimental Biology Science, vol. 2, no. 2, pp.354–361, 2011.
[54] Z. Forhecz, T. Gombos, G. Borgulya, Z. Pozsonyi, Z. Prohaszka,and L. Janoskuti, “Red cell distribution width in heart failure:prediction of clinical events and relationship with markers ofineffective erythropoiesis, inflammation, renal function, andnutritional state,” American Heart Journal, vol. 158, no. 4, pp.659–666, 2009.

Submit your manuscripts athttp://www.hindawi.com
Stem CellsInternational
Hindawi Publishing Corporationhttp://www.hindawi.com Volume 2014
Hindawi Publishing Corporationhttp://www.hindawi.com Volume 2014
MEDIATORSINFLAMMATION
of
Hindawi Publishing Corporationhttp://www.hindawi.com Volume 2014
Behavioural Neurology
EndocrinologyInternational Journal of
Hindawi Publishing Corporationhttp://www.hindawi.com Volume 2014
Hindawi Publishing Corporationhttp://www.hindawi.com Volume 2014
Disease Markers
Hindawi Publishing Corporationhttp://www.hindawi.com Volume 2014
BioMed Research International
OncologyJournal of
Hindawi Publishing Corporationhttp://www.hindawi.com Volume 2014
Hindawi Publishing Corporationhttp://www.hindawi.com Volume 2014
Oxidative Medicine and Cellular Longevity
Hindawi Publishing Corporationhttp://www.hindawi.com Volume 2014
PPAR Research
The Scientific World JournalHindawi Publishing Corporation http://www.hindawi.com Volume 2014
Immunology ResearchHindawi Publishing Corporationhttp://www.hindawi.com Volume 2014
Journal of
ObesityJournal of
Hindawi Publishing Corporationhttp://www.hindawi.com Volume 2014
Hindawi Publishing Corporationhttp://www.hindawi.com Volume 2014
Computational and Mathematical Methods in Medicine
OphthalmologyJournal of
Hindawi Publishing Corporationhttp://www.hindawi.com Volume 2014
Diabetes ResearchJournal of
Hindawi Publishing Corporationhttp://www.hindawi.com Volume 2014
Hindawi Publishing Corporationhttp://www.hindawi.com Volume 2014
Research and TreatmentAIDS
Hindawi Publishing Corporationhttp://www.hindawi.com Volume 2014
Gastroenterology Research and Practice
Hindawi Publishing Corporationhttp://www.hindawi.com Volume 2014
Parkinson’s Disease
Evidence-Based Complementary and Alternative Medicine
Volume 2014Hindawi Publishing Corporationhttp://www.hindawi.com