Embed Size (px)
Citation preview

Research ArticleMechanical Properties of Boehmite Evaluated byAtomic Force Microscopy Experiments and MolecularDynamic Finite Element Simulations
J Fankhaumlnel1 D Silbernagl2 M Ghasem Zadeh Khorasani2 B Daum1 A Kempe1
H Sturm2 and R Rolfes1
1 Institute of Structural Analysis Leibniz Universitat Hannover Appelstraszlige 9A 30167 Hannover Germany2Bundesanstalt fur Materialforschung und -prufung Unter den Eichen 87 12205 Berlin Germany
Correspondence should be addressed to J Fankhanel jfankhaenelisduni-hannoverde
Received 14 July 2016 Revised 6 October 2016 Accepted 16 October 2016
Academic Editor Victor M Castano
Copyright copy 2016 J Fankhanel et al This is an open access article distributed under the Creative Commons Attribution Licensewhich permits unrestricted use distribution and reproduction in any medium provided the original work is properly cited
Boehmite nanoparticles show great potential in improving mechanical properties of fiber reinforced polymers In order to predictthe properties of nanocomposites knowledge about the material parameters of the constituent phases including the boehmiteparticles is crucial In this study the mechanical behavior of boehmite is investigated using Atomic Force Microscopy (AFM)experiments and Molecular Dynamic Finite Element Method (MDFEM) simulations Youngrsquos modulus of the perfect crystallineboehmite nanoparticles is derived from numerical AFM simulations Results of AFM experiments on boehmite nanoparticlesdeviate significantly Possible causes are identified by experiments on complementary types of boehmite that is geological andhydrothermally synthesized samples and further simulations of imperfect crystals and combined boehmiteepoxy models Undercertain circumstances the mechanical behavior of boehmite was found to be dominated by inelastic effects that are discussed indetail in the present work The studies are substantiated with accompanying X-ray diffraction and Raman experiments
1 Introduction
Aluminum oxides exhibit a wide range of commercial appli-cations and are commonly used as a material for the rein-forcement phase of nanocomposites (eg Chen et al [1]Horch et al [2] and Pradhan et al [3]) Also aluminumoxyhydroxides like boehmite show promising results asnanofillers (eg Arlt [4] Chen et al [5] and Ozdilek et al[6]) In particular Arlt [4] showed that unmodified andtaurine modified boehmite nanoparticles are able to improvematrix-dominated properties of carbon fiberepoxy com-posites like shear strength shear modulus compressivestrength or compression after impact resistance by 10 to25 In contrast Shahid et al [7] investigated boehmiteparticles with different surface modifications (lysine andpara-hydroxybenzoate) in a carbon fiberepoxy compositeand reported an increase of tensile and flexural properties forvery small particle fractions (lt2wt) For fractions greater
than approximately 5 wt the named properties decreasecompared to the unfilled composite
Comparing the results of the aforementioned studies it isapparent that the composition ofmatrix particle and particlesurface modification is crucial for the resulting compositepropertiesThe long term goal of the presented investigationsis to optimize the mechanical properties of nanocompositesand to understand the underlying mechanisms of the particlereinforcement bymeans of numerical methods (virtual mate-rial design) Therefore knowledge about material propertiesof boehmite namely Youngrsquos modulus Poissonrsquos ratio anddensity are needed in order to model the material as realisti-cally as possible and to calibrate the simulation models
The structural properties of boehmite have been widelystudied experimentally through X-ray diffraction by Bokh-imi et al [8] or by means of Raman spectroscopy by Kisset al [9] and numerically through quantum mechanicscalculations by Tunega et al [10] andNoel et al [11] However
Hindawi Publishing CorporationJournal of NanomaterialsVolume 2016 Article ID 5017213 13 pageshttpdxdoiorg10115520165017213
2 Journal of Nanomaterials
a
b
c
Figure 1 Crystal structure of boehmite (unit cell and materialexcerpt) Pictures of atomistic structures created with Jmol [14]
little literature on the mechanical properties of boehmite isavailable especially concerningYoungrsquosmodulus Streller [12]reported a value of approximately 120GPa from nanoinden-tation tests using a sample of APYRAL AOH20 (NabaltecAG) boehmite with a diameter of 1 120583m However the appli-cability of nanoindentation of boehmite is questionable Asdiscussed in Section 2 monocrystalline boehmite does notappear to be stable in sufficient size to perform nanoinden-tation measurements The diameter of the boehmite crystalshould be at least in the higher 120583m range since the maximumindentation depth should not exceed 10of the sample heightin order to get undisturbed results Additionally the samplesurface is assumed to be an infinite plane which allows for aregion of inelastic deformation in the proximity of the indentTo the authorsrsquo best knowledge there are no measurementsof the mechanical properties of verifiable monocrystallineboehmite to be found in literature which is apparently due tothe fact that macroscopic monocrystalline boehmite is veryhard to obtain
Tunega et al [10] calculated the bulk modulus ofboehmite using density functional theory and density func-tional based tight binding method obtaining values of93GPa and 82GPa respectively Assuming for simplicityan isotropic behavior and a Poissonrsquos ratio of 022 Youngrsquosmodulus can be estimated to fall within the range of 138 to156GPa
Due to the lack of literature the goal of the present study isthe determination of the mechanical properties of boehmiteSince both approaches experimental and numerical haveobstacles to overcome a combination of these methodsappears most promising
2 Boehmite
Boehmite is a mineral of aluminum with an orthorhombicunit cell (119886 = 3693 A 119887 = 12221 A and 119888 = 2865 A)classified as oxyhydroxide (120574-AlO(OH)) Its crystal structureshown in Figure 1 consists of double layers of oxygen octahe-drons with a central aluminum atom The outfacing oxygenis bonded via hydrogen bonds to the hydroxyl group of theadjacent layer of octahedrons [13]
Due to the weak bonds boehmite is prone to intercala-tion that is the inclusion of small molecules usually waterin between these layers This causes a larger spacing in [010]
direction and a perfect cleavage perpendicular to the generaldirection of the hydrogen bonding Boehmite has a preferredgrowing direction in the 119886-119888 plane which corresponds to the(010) plane [15] and is also prone to dissolving [16 17]There-fore monocrystalline boehmite is not stable in mm rangeand the boehmite crystal shows a high susceptibility to latticedefects typically slit-like cracks and domains of amorphousboehmite Boehmite with an increased spacing in the [010]direction is referred to as pseudoboehmite and amorphousboehmite is usually referred to as gel Boehmite can befound in nature or precipitated and grown from solution ofaluminum salts and alumina under hydrothermal conditions
The point of origin for the studies presented in thefollowing was the investigation of commercially availablespray dried boehmite nanoparticles (HP14 Sasol Germany)[18] for their mechanical properties (the correspondingmeasurements are shown in Section 33) The results indi-cated a conspicuously lower stiffness than expected Threepossible explanations for the low stiffness are considered anddiscussed in the present work
(1) Effects related to the crystal size(2) Slippage of weakly linked boehmite sheets(3) Presence of amorphous boehmite domains
In order to distinguish between these effects two additionalboehmite samples of different morphology were investigatedThese complementary samples feature substantial differencesin terms of crystallinity and sample size thus providingevidence of the nature of each effect on the stiffness ofthe particle samples The first complementary sample isa geological boehmite sample that comprises crystallinedomains in a 120583m range In this case effects related to thesample size and influence of an amorphous phase can be ruledout leaving the slippage of weakly linked sheets The secondcomplementary sample a hydrothermally formed boehmitefilm which consists predominately of pseudoboehmite andamorphous boehmite was examined in order to investigatethe effect of presence of those phases
21 Spray Dried Nanoparticles HP14 Commercially availablespray dried boehmite nanoparticles (HP14 Sasol Germany)were prepared in a polymer matrix (Epoxy Araldite LY3585) In order to determine the morphology of the nanos-tructured boehmite XRD and Raman spectroscopy wereused Results are shown in Section 31 and discussed laterMechanical measurements are shown in Section 33
22 Geological Boehmite Boehmite crystals were preparedfrom a geological sample (denoted as GeoB on NathrolithSaga Quarry Tveidalen Norway) and mounted on a glasssubstrate The crystal is roughly 80120583m in diameter Since theplane of the preferred crystal growth direction is the largestflat area of the crystal the double octahedral sheets are paral-lel to the substrate surface and therefore the measurement istaken approximately in [010] direction that is perpendicularto the (010) plane The boehmite structure was confirmedby Raman spectroscopy as shown in Section 32 Mechanicalmeasurements are shown in Section 33
Journal of Nanomaterials 3
23 Hydrothermally Synthesized Boehmite Additional boeh-mite samplesweremade via a hydrothermal route (denoted ashyB) Boehmite was synthesized on aluminum disks (diam-eter 20mm thickness 2mm) which were cleaned (acetonein ultrasonic bath for 10min) rinsed and polished Okada etal [17] established a correlation between temperature and pHvalue of a hydrothermal process and the formation of eitherbayerite boehmite or AlOOH gel Based on these findingsthe discs were exposed to purified water at approximately120∘C (approx 2000mbar) for at least one hour in orderto synthesize boehmite with a low degree of crystallinity Itwas found that after one hour boehmite could be detectedby Raman spectroscopy as shown in Section 32 Mechanicalmeasurements are shown in Section 33
3 Experimental Part
31 XRD Measurements In order to determine the size ofthe boehmite crystals and also the crystallinity of HP14nanoparticles X-ray diffraction (XRD) measurements wereconducted Results are shown in Figure 2 XRD patternswere collected with Cu K120572 (120582 = 154056nm) radiationon a D8 Discover diffractometer (Bruker AXS Germany)equipped with a Lynxeye detector Samples were measured intransmission geometry in a 2120579 range from5∘ to 80∘ with a stepsize of 0009∘ For structure solutions the measurement timeper step was 1 s
The crystal size of the nanoparticles was determined bythe Scherrer Formula [19] to be approximately 13 nm Also inFigure 2 the boehmite standardmeasurement available in theRruff database (ID R120123) is shown [20] As can be seenin the inset of Figure 2 there is a shift of the (020) reflectionpeak to lower values of 2120579 which is due to a larger spacingbetween the octahedral double planes This larger spacing isthe main characteristic of pseudoboehmite [16] The XRDmeasurement shows intensity besides the actual peaks Thisis due to a halo of an amorphous phase which is thereforealso present in the nanoparticles
32 Raman Spectroscopy Raman measurements of all boeh-mite samples were performed on a custom-made WITecRaman microscope utilizing 543 nm NdYAG-based laserand Peltier-cooled CCD spectrometer (ANDOR DV401-BV-352) A connecting fiber with 100120583m core and 20xobjective were used for the presented measurements AllRaman spectra were performed as qualitative measurementsmeaning that only the Raman shift was evaluated in orderto identify chemical species and to determine morphologiesof boehmite The Raman intensities are not normalized Themain vibrational transitions were reported by Kiss et al [9]The most intense peak at 369 cmminus1 is the dominant spec-tral signature of boehmite In the presented measurementsthis spectral signature was found at 368 cmminus1 which is insatisfactory agreement with the literature value Doss andZallen [16] described this characteristic vibrational transitionas a fully symmetric mode in which all aluminum andoxygen atoms move parallel to the [010] direction Thismovement has an intralayer-shear bond-bending characterA decrease in intralayer bond strength due to the presence of
151413
020
120
031
051
200
Inte
nsity
times10
3
20 30 40 50102120579 (degree)
Figure 2 XRD measurement of HP14 (black) Also the Rruffstandard spectrum (grey) is shown
Ram
an in
tens
ityA HP14
B GeoB
C hyB
A998400 B998400
350 400 450 500300 Raman shift (cmminus1 (
350 cmminus1
358 cmminus1
368 cmminus1
368 cmminus1
Figure 3 Raman intensity at 368 cmminus1 Raman shift (filled markers)with their Gaussian fit (black line) A1015840 and B1015840 show the residue of thefit (grey markers)
pseudoboehmite amorphous phases and nanoscopic crystalsizes causes a downshift of this characteristic peak
Considering the Raman spectrum of the hyB (C trianglein Figure 3) the dominant peak at 368 cmminus1 is significantlyshifted to lower wavenumbers (358 cmminus1) Doss and Zallen[16] found a strong relationship between the crystalline sizeof boehmite and such a shift which was confirmed by Yangand Frost [21] Since this peak is associated with latticemovements the lack of long range order in the crystal canlead to a shift in the vibrational mode Therefore it can beassumed that the synthesized boehmitersquos morphology hasindeed a very low degree of crystallinity
Figure 3 shows also the Raman spectra of HP14 (Afilled circles) and GeoB (B filled squares) A Gaussian fit ofthese peaks yields a Raman shift of 368 cmminus1 in both casesThe residue of the Gaussian fit of the HP14 spectrum (A1015840grey circles) shows a clear shoulder peak of low intensity
4 Journal of Nanomaterials
Table 1 AFM probe properties and summary of experimental results
Sample 119896119888 (Nm) 1205960 (kHz) 119877 (nm) 119864boehmite (GPa) Inelastic deformationsHP14 14 202 17 4 lt 119864 lt 70 UnknownGeoB 50 320 40 4 lt 119864 lt 70 NohyB 16 212 19 119864 lt 4 Yes
at 350 cmminus1 Such a peak is a strong indication for thepresence of pseudoboehmite or amorphous boehmite inthe nanoparticles The Raman spectrum of GeoB shows asymmetrical peak at 368 cmminus1 which means that there is nosignificant residue of the Gaussian fit of the GeoB spectrum(B1015840 grey squares) Therefore the lattice of GeoB can beassumed to be free of any substantial amount of defects
33 AFM Measurements All Atomic Force Microscopy(AFM) measurements were carried out with an MFP-3Dmicroscope (Asylum Research Santa Barbara CA) Threedifferent AFM modes were used tapping mode (topog-raphy) force-distance curves (FDC) and intermodulationAFM (ImAFM) with the resulting amplitude-dependentforce spectroscopy (ADFS) for mechanical measurementsForADFSmeasurements an additional intermodulation lock-in analyzer by Intermodulation Products (Segersta Sweden)was used as part of the AFM setup
In this study FDCs were chosen as a well-establishedmethod [22 23] to determine the mechanical properties ofboehmite FDCs have been shown to be a reliable tool toobtain mechanical properties by probing very little samplevolume This is important since monocrystalline boehmitecan only be obtained in small quantities too little for othermethods for example nanoindentation
In order to record a FDC a microfabricated tip with aradius 119877 which is mounted on a cantilever with a springconstant 119896119888 is used as a probe Since the cantilever is assumedto behave linearly and elastically Hookrsquos law relates theapplied force 119865 to the cantilever deflection 120575 119865 = 119896119888 times 120575
The sample deformation D can be calculated from thedeflection 120575 and the position of the sample 119885 in 119885-directionwhich is controlled by the AFMrsquos 119885-piezo 119863 = 119885 minus 120575
From a fit of the Hertz equation (1) using the relation forthe reduced Youngrsquos modulus 119864tot (2) with Poissonrsquos ratio ]the tip radius 119877 can be determined when Youngrsquos modulus Eis known and vice versa [24]
119863 = ( 119865radic119877 times 119864tot)23 (1)
1119864tot =34 (1 minus ]2tip119864tip +
1 minus ]2119864 ) (2)
Reference measurements on glass substrates were used forthis purpose since the mechanical properties of glass are wellknown (119864 = 70GPa ] = 03) Once the tip radius119877 is knownthe experimental parameters are set and Youngrsquos modulus ofany sample can be estimated
In order to probe even smaller sample volumes dynamicAFM methods can be implemented The advantage ofdynamic methods for example tapping mode is that theyyield mechanical information by applying very little forceOne further method is the ImAFM yielding amplitude-dependent force spectroscopy (ADFS) By exciting the AFMcantilever with two frequencies close to the resonance fre-quency the resulting oscillation of the cantilever is a beatThe spectrum of amplitudes in a beat equals a force spectrumwhich can be used to probe the sample since the amplitude ofthe cantilever oscillation is correlated to the force by Hookersquoslaw One image point is recorded per beat while the samplesurface is scanned with this method The damping of thebeatrsquos amplitude at every image point gives rise to (a) thesample height comparable to a tapping mode scan and (b) anequivalent of a FDC namely the ADFS curve which can bederived from a model This model is described in detail in[25]
For AFMmeasurements of HP14 the nanoparticles wereembedded in an epoxy matrix The composite was cutpolished and cleaned with oxygen plasma in order toremove polymer residue from the particle surface The AFMprobe used for this ADFS measurement was a MikromaschHQNSC35 (Wetzlar Germany) (cf Table 1) For comparisonadditional ADFS measurements on glass substrates wereconducted
At each pixel of the image shown in the inset of Figure 4an ADFS curve was recorded which provides information onthe mechanical properties of the sample The particles can bedistinguished from the surrounding matrix by the local mor-phology of the sample surface ADFS curves correspondingto the pixels of these distinguishable regions are summed upin order to calculate an average curve The average curvescorresponding to the particle (filled circles) the epoxymatrix(blank circles) and the reference curve on glass (grey curve)are shown in Figure 4
Youngrsquos modulus for glass is taken as 70GPa as describedbefore and the one for the epoxy matrix is known frommacroscopic mechanical measurements and FDCs to beapproximately 35GPa
Since the slope of ADFS curves is inversely proportionalto the stiffness the following can be understood from the plotin Figure 4 the stiffness of HP14 is higher than the stiffnessof the matrix However boehmite unexpectedly appears to bemore compliant than glass
35GPa lt 119864boehmite lt 70GPa (3)
which is in stark disagreement with values from the literatureand numerical results which are discussed further downin the text and predict 136GPa le 119864boehmite le 267GPa
Journal of Nanomaterials 5
0 20 30 40 50 60 7010Force (nN)
0
2
4
6
Posit
ion
(nm
)
100nm 5
10
15
20
(nm
)
ErefEpoxy = 35GPa
70GPa gt EHP14 gt 35GPaEref Glass = 70 GPa
Figure 4 Average ADFS curves corresponding to HP14 (filledcircles) epoxy matrix (blank circles) and glass (grey circles) withHertz fit corresponding to 70GPa (black line) Inset topography of aHP14 nanoparticle (elevated structure left to the center) embeddedin an epoxy matrix At each pixel an ADFS curve was recorded
3
2
1
0
32
10
3
minus06
137
(120583m)
(120583m)
(120583m)
Figure 5 Tapping mode topography of GeoB
The measurement of embedded HP14 particles was repeatedsuccessfully for at least 10 times and the stiffness of the particlenever exceeded the stiffness of glass
In order to confirm this unexpected compliance of boeh-mite a macroscopic crystal GeoB wasmeasured by FDCTheAFM probe used for this measurement was a NanosensorsPointprobe-Plus-NCHR (Nanosensors Neuchatel Switzer-land) (cf Table 1) For reference FDC and ADFS measure-ments on glass substrates and epoxy were conducted
FDCmeasurements of GeoBwere conducted on a plateaustep which means that forces were applied roughly perpen-dicular to the octahedral double planes This correspondsto the simulated FDC of boehmite shown in Section 4 Asconfirmed by Raman spectroscopy the GeoB crystal showslittle to no defects However as can be seen in the topographyof GeoB shown in Figure 5 the surface of the sample iscontaminated with amorphous material It cannot be deter-mined if this amorphous material is boehmite Only curves
0
5
10
15
20
Def
orm
atio
n D
(nm
)
10 20 30 40 50 600Cantilever deflection 120575 (kc = 50Nm)
FDC epoxy
FDC glass
FDC GeoBADFS curves
Hertz fit (EEpoxy = 4 GPa)
Hertz fit (EGeoB = 11GPa)
Hertz fit (EGlass = 70 GPa)
(rescaled for reference)
Figure 6 Deformation versus cantilever deflection experimentalcurves of glass (grey circles) GeoB (filled circles) and epoxy(blank circles) Standard deviation of the average curve is shown aserror bars The Hertz fit of each experimental curve yields Youngrsquosmodulus For comparison theADFS curves on glass and epoxywererescaled and added to the plot (red markers)
on clean spots of the sample were accepted and averagedFrom averaged FDCs the deformation was calculated fromthe cantilever deflection and the sample position and plottedversus the cantilever deflection which is proportional to theapplied force (GeoB curve in Figure 6) These experimentalcurves can be fitted by Hertz (1) yielding a reduced Youngrsquosmodulus 119864tot Applying (2) Youngrsquos moduli 119864Epoxy and 119864GeoBcan be calculated assuming Poissonrsquos ratios for epoxy andboehmite to be ]Epoxy = 03 and ]GeoB = 025 The AFM tiprsquoselastic constants are 119864tip = 245GPa and ]tip = 025
The hysteresis of the approaching and the retracting partof the FDC was considered to reveal inelastic deformations
FDCs at two different spots (A and B in Figure 5) onGeoB are shown in Figure 7 It should be noted that thedeformations at an uncontaminated spot (B) are solely elasticsince there is no hysteresis apparent and only such hysteresisfree curves were accepted for generating the average curveshown in Figure 6 It should be also noted that all curvesshown in Figure 6 are in agreement with the Hertz theorywhich also implies that only elastic deformations are inducedsince the Hertz theory only considers elastic deformations
The curves shown in Figure 6 are also in very goodagreement considering shape and relation to each other withthe ADFS curves of the experiment concerning the HP14shown in Figure 4
Furthermore boehmite with a very low degree of crys-tallinity (hyB) was examined in order to determine if theunexpected compliance of boehmite is due to the presenceof lattice defects and amorphous domains The AFM probeused for this measurement was a Mikromasch HQNSC35(Wetzlar Germany) (cf Table 1) For reference FDC mea-surements on glass substrates were conducted
The topography of hyB (Figure 8) shows partly crystallinesheets on which FDC measurements can be conducted Dueto the signal to noise ratio of single FDCs it is preferableto calculate an average curve from a number of FDCs
6 Journal of Nanomaterials
A B
0
20
40
60
80
100
120
140
Cant
ileve
r defl
ectio
n (n
m)
50 100 150 0 50 100 1500 Piezo displacement Z (nm)
Figure 7 FDCs (approach red retract blue) taken on the spotsA (contaminated) and B (clean) in Figure 5 Curve A shows aconsiderable hysteresis Curve B shows no hysteresis thereforepurely elastic deformations can be assumed
To collect enough curves which were all recorded undercomparable conditions curves were measured successively atone point and an average was calculated from approximately10 loadingunloading cycles From these average curves thedeformation was calculated from the cantilever deflectionand the sample position The deformations from three dif-ferent spots (A B and C) are shown in Figure 9 versus thecantilever deflection Since curves taken on different spotsvary a lot and we solely want to demonstrate a characteristicbehavior of curves we do not show the standard deviationAlso shown are the resulting curves of ameasurement of glassand a calculated Hertz curve for epoxy These deformationcurves cannot be fitted by theHertz relation (1) and thereforeindicate inelastic behavior Especially at low applied forces(up to 10 nm cantilever deflection) they show deformationswhich even exceed the deformations measured on epoxy Athigher forces the slope of the deformation curve decreaseswhich indicates stiffer properties
This is confirmed by analyzing the approach and retrac-tion curve shown in Figures 9 and 10 for the spots A Band C At low forces a high hysteresis indicates large inelasticdeformations At higher forces the material underneath thetip is already compressed and behaves more elastically This isa characteristic behavior when a thin compliant layer on topof a stiff substrate or mechanical gradient (stiffness increaseswith distance to the surface) is measured In this case theHertz theory does not apply since Youngrsquos modulus is not aconstant it depends on the deformation D
34 Summary of Experimental Part These experiments wereconducted to decide on the cause for the low experimentalYoungrsquos modulus measured on boehmite nanoparticles Is ita defect of the crystal or is the crystal indeed that compliantAmorphous domains would be stable at the surface of theboehmite crystal since lattice defects are expected to decreasetowards the center of a crystal and the nanoparticles have
been shown to be crystalline Thus amorphous boehmiteor pseudoboehmite would form a compliant layer on theoutside of the crystal If an amorphous phase was presentin the measurement of HP14 shown in Section 33 it wouldcontribute to the mechanical measurements in the same wayas shown in measurements of hyB That means that FDC orADFS curves would show amuch higher slope and hysteresisat the very beginning of the curve On the contrary ADFScurves taken on HP14 show very similar characteristics tothe FDCs taken on GeoB which are in agreement with theHertz theory by showing no gradient in Youngrsquos modulusTherefore slippage of the planes appears as a more likelyexplanation for the low measured stiffness which is not inaccordancewith themeasurements onGeoBwhere deforma-tions were found to be elastic The authors hypothesize that inthe case of a macroscopic monocrystalline boehmite (GeoB)the induced deformation leads to local lattice distortions dueto plane slippage which will be equilibrated by the far-fieldlattice structure after the applied force is removed This isonly possible because (a) the (010) layers are rather stiff incomparison with the weak bonds between the layers and (b)the volume effected by the deformation is small comparedto the monocrystalline domain The compression createdin the (010) layers due to the deformation is spread alongthe whole plane and acting like a spring can restore thelattice structure in the deformed volume The deformationstherefore appear to be elastic In case of the nanoparticlesdeformations are permanent since there is no unaffectedfar-field lattice structure However for both the micro- andmacroscopic boehmite the measured stiffness is much lowerthan what is expected due to plane slippage
In fact ambivalent behavior of boehmite nanoparticlesare supported by literature Halbach and Mulhaupt [26]found a considerable increase of the elastic modulus ofboehmite-based polyethylene nanocomposites (which is astrong indication for high Youngrsquos modulus of boehmite)but also observed no decrease in elongation break which isusually associated with brittle filler material Also Khumaloet al [27] investigated the rheological properties of polyethy-leneboehmite nanocomposites and found an uncharacteris-tic lack of increase in the melt viscosity of such materials Inorder to get a better understanding of these discrepancies anumerical study of the problem was pursued
4 Numerical AFM Simulation
The results presented in the following are the outcome ofcomputational studies simulating an AFM FDC measure-ment on a pure boehmite crystal structure and combinedboehmite-epoxy structures respectively
41 AFM Simulation Models All simulations are carriedout using the Molecular Dynamic Finite Element Method(MDFEM for a detailed presentation see [28 29]) TheMDFEM provides a framework for calculating classi-cal molecular dynamics (MD) problems within the well-established Finite Element Method (FEM) (see eg Wack-erfuss [29] for an overview of molecular dynamics in thecontext of the FEM) The main motivation for this approach
Journal of Nanomaterials 7
(nm
)
10
08
06
04
02
00
40
20
0
minus20
minus40
(120583m)
(120583m)
A
BC
1000 02 04 06 08
Figure 8 Tapping mode topography of hyB
6050403020100Cantilever deflection (nm)
A
B
C hyB approach hyB retract
EEpoxy calculated = 35GPa
Eglass reference = 70 GPa
0
5
10
15
20
25
30
Def
orm
atio
n (n
m)
Figure 9 Deformation-deflection curves derived from averagedFDCmeasured on glass (blank circles) with its Hertz fit (black line)and hyB (approach black circles retract grey circles) at the spots AB and C The Hertz curve of epoxy was calculated and is shown forcomparison (black line)
is the simplification of multiscale techniques as in particularthe coupling of atomistic and continuum mechanics simu-lations can be performed in a very efficient way within onesoftware package Additionally the need for special in-housedeveloped software for the MDFEM interaction is reducedsince the highly efficient solvers as well as the pre- andpostprocessing tools of the FEM software can be used
The MDFEM requires special FE-meshes that are gener-ated with an in-house software package (using Open Babel
A B C
0
10
20
30
40
50
60
70
Cant
ileve
r defl
ectio
n (n
m)
20 40 60 80 4020 40 60 80 20 60 800 00Piezo displacement Z (nm)
Figure 10 FDC curves (approach red retract blue) taken on thespots A B and C in Figure 11
[30] and Packmol [31]) based on the chemical structure of theconstituents The boehmite is assumed to be of cmcm unitcell (119886 = 28681 A 119887 = 122256 A and 119888 = 36941 A) asreported by Bokhimi et al [8] and experimentally confirmedthrough X-ray diffraction as discussed in Section 31 TheAFM tip material is silicon (Fd3m unit cell 119886 = 35668 A)Starting fromunit cells the model is generated by duplicatingthe unit cells and extracting the desired geometry In case ofthe matrix material Bisphenol-A-diglycidylether (DGEBPA)prepolymer chains are packed randomly into the simulation
8 Journal of Nanomaterials
AFM sample
AFM tip
Boundary region(02 nm)
VdW-cutoff(15nm)
Sample width (5ndash8 nm)
Sam
ple h
eigh
t(3
---4
8nm
)
Tip radiusR (2ndash5 nm)
Prescribed AFM tip displacement
Figure 11 Schematic representation of the AFMmodels
box avoiding intersections with the particle Subsequentlythe matrix is cured by randomly iterating over all hydroxylgroups searching for the closest epoxy group and connect-ing both reactive sites using the MethyltetrahydrophthalicAnhydride (MTHPA) hardener molecules If all hardenermolecules have been placed or no more reaction partnersare found the same process is executed for the etherificationreaction connecting reactive sites with a slightly biggerdistance without a hardener molecule Figure 11 shows aschematic representation of the AFMmodels
All simulations presented in the following are performedusing the DREIDING force field [32] It has been param-eterized for a large subset of the periodic tables of thechemical elements and was recently used successfully tomodel anhydride-cured epoxy resin as well as alumina [33]and boehmite nanoparticles [34] in an MDFEM contextEven though it is possible to apply different cutoff radii forthe physical interactions (denoted as VdW-cutoff) within thesample and between sample and tip a spherical cutoff of15 A has proven to be suitable for both cases by parametricstudiesTheAFM tip ismodeled as an ideal hemisphere and isconsidered to be rigidmeaning that all chemical and physicalinteractions are eliminated within the tip by removing thecorresponding elements and introducing a rigid coupling toa reference node Preliminary investigations have shown thatthis simplification has negligible influence on the resultingelastic modulus The first step in the simulations is as usualin molecular dynamics calculations the determination of theequilibrium state of the system Therefore the whole modelincluding theAFM tip is relaxed over a period of time rangingfrom 50 to 100 ps depending on the model size The timestep for all calculations is determined dynamically using thebond stiffness and lies in the range of 1-2 fs In the relaxationstep the equilibrium position of the tip (in the sense of thetip lying on the sample surface without cantilever forces)is obtained automatically Subsequently the load is appliedquasistatically in terms of an AFM tip displacement of 05 to
15 nm depending on the sample and tip size A simulationtime of 300 ps for the maximum displacement of 15 nm hasproven to be suitable by parametric studies All samples areconstrained on all surfaces in a border region of 02 nmexcept for the top surface where the tip indents the material
Due to the comparatively high numerical effort of MDsimulations as well as MDFEM simulations it is necessary toreduce themodel sizeThus in preliminary investigations theeffect of the tip radius and the sample size on the calculatedmodulus is analyzed
42 Results of Preliminary Simulations The indentationdirection is parallel to [010] in all simulations of this subsec-tion As a result of the simulations force-deformation curvesare obtained Youngrsquos modulus is then calculated via a Hertzfit in a manner similar to the AFM experiments If a rigidAFM tip is assumed 119864tip becomes infinite and the first termin the parenthesis in (2) vanishes The reduced Hertz curve isthen fitted to the simulated curve with a least square fit usingMATLAB
Firstly the influence of the tip radius on the calculatedelastic modulus of the perfect boehmite structure is exam-ined Therefore the tip radius is increased from 1 to 5 nm insteps of 1 nm The sample size is chosen to be four times asbig as the tip radius This is shown to be large enough not toimpose any boundary effects on the measured modulus lateron The results of this study are displayed in Figure 12 It isapparent that with increasing tip radius the calculated moduliconverge Small tip radii underestimate the moduli but yetfor the 2 nm tip the deviations from the results of biggertips are smaller than 4 Therefore the 2 nm tip has beenchosen for further investigations Furthermore it is apparentthat the calculated values (127ndash135GPa) lie slightly abovethe shown reference value from experimental tests from theliterature (120GPa [12] difference approx 13) However theapplicability of this source in the present context is discussedin Section 1
Journal of Nanomaterials 9
SimulationAFM experiment [12]
4321 5Tip radius (nm)
0
2
4
6
8
10
12
14
Youn
grsquos m
odul
us (M
Pa)
times104
Figure 12 Influence of the AFM tip size on the calculated elasticmodulus of the perfect boehmite crystal
Secondly the sample size is addressed with a similarapproach Starting from 8 times 48 times 8 nm the sample size isgradually reduced to a minimum of 5 times 3 times 5 nmThe tip sizeis fixed with 2 nmThe resulting force-deformation curves areshown in Figure 13 The straight lines in Figure 13 indicatethe onset of a deviation between the fitted curve and thesimulated curvesThis effect is caused by boundary effects (ata certain penetration the rigid boundaries start influencingthe curve) indicating that the sample size is chosen too smallTo avoid this either the sample size has to be increased or therange in which the Hertz fit is calculated has to be truncated(here the latter was already performed)
As expected Figure 13 shows that the point where thesimulated curves start deviating from the Hertz curve isshifted to a lower deformation with decreasing sample sizeInterestingly reducing the model size from 8 to 65 nm andfrom 65 to 5 nm leads to an almost equal deformation shiftof about 015 nmThe sample size of 8 times 48 times 8 nm is chosenas the minimum required sample size in order to receive asufficiently large interval for the Hertz fit
43 Simulation Results As can be concluded from the previ-ous section the elastic modulus of boehmite is converging toa value of approximately 136GPa and calculated with a valueof 127 GPa for a tip size of 2 nm which is the reference modelfor further investigations
Until here all simulations have been performed in the[010] direction perpendicular to the boehmite layers Inthe simulation coordinate system this corresponds to the119887-direction (see Figure 1) To account for the anisotropyadditional simulations were performed in [100] direction (119886-direction) and [001] direction (119888-direction) resulting in aYoungrsquos modulus of 232GPa and 267GPa respectively
Themoduli obtained from the simulations strongly differfrom the experimentally obtained values (in the range of
0 500 1000 1500 2000 2500Indentation force (N)
0
005
01
015
02
025
03
035
04
045
05
times10minus10
Simulation 5 times 3nmSimulation 65 times 39nm
Simulation 8 times 48nmHertz curve 127GPa
Def
orm
atio
n (n
m)
Figure 13 Effect of the sample size on the calculated elasticmodulusof the perfect boehmite crystal Only data left of the vertical line inthe respective color was considered in the fit
10GPa for GeoB) To identify the cause of these differencesin the following the influence of several imperfections isinvestigated Since the indentation in [010] direction resultedin the softest behavior so far the following investigations areperformed perpendicular to the crystal layers only Firstly theintercalation of water between the boehmite layers that wasreported by Bokhimi et al [8] is addressed Therefore 10 ofthe alumina atoms of the interlayer surface of the boehmitesample are modeled being occupied with a water moleculebonded by a hydrogen bond instead of just a hydroxyl groupThis leads to slightly increased interlayer distances and thus toa weaker bonding between the layers However the reductionobtained is in the range of 16 resulting in an elasticmodulusof approximately 113 GPa
Furthermore the influence of alumina and hydroxylgroup defects is examined To consider defects random Al-atoms or OH-groups are deleted from the model assumingthat the defects do not lead to fundamental changes in thecrystal structure In both cases the amount of defects isvaried from 0 to 20 in steps of 5 For each variationthe outcome of three calculations is averaged The resultingvalues are shown in Figure 14 It is apparent that hydroxylgroup defects lead to rather small reduction of the modulusby a maximum of 18 for 20 deleted OH-groupsThe causeof the softer behavior is the decrease of hydrogen bondsexisting in the model that in turn lead to a weaker bondingbetween the boehmite layers In case of alumina defectsthe reduction is much more distinct For the case of 20deleted Al-atoms the reduction of the elastic modulus isin the range of 47 resulting in a value of about 72GPaThis comparatively large reduction is caused by voids inthe octahedral boehmite crystal structure However bothimperfect models still result in much higher moduli thanthe experimentally determined ones However the net-likestructure of the hydrothermally formed boehmite film which
10 Journal of Nanomaterials
Alumina defectsHydroxyl group defects
0
2
4
6
8
10
12
14
16
Youn
grsquos M
odul
us (M
Pa)
5 10 15 200Percent of deleted alumina atomsOH groups
times104
Figure 14 Influence of aluminahydroxyl group defects on thecalculated elastic modulus of boehmite
was observed in the experiments can induce additionalmechanisms that were not covered by the simulation Thisincludes for instance cracking of layers or the tilting of biggerstructures like needles or plates The explicated phenomenacan further reduce the resulting modulus
The drastically reduced moduli obtained from experi-mental AFM measurements have been interpreted to origi-nate from inelastic phenomena These include in particularslippage of the crystal layers but also cracking of layers andtilting of substructures To provide evidence for this inelasticbehavior an attempt is made by performing AFM simula-tions on combined boehmiteepoxy samples The crystal ismodeled with the real orthorhombic shape different particleorientations and a particle size of 5 nm as illustrated inFigures 15(a)ndash15(c) This again requires a reduction of themodel size (the real primary particle size is in the range of14 nm [18]) in order to limit the numerical effort The boxsize perpendicular to the loading direction is chosen based onfindings from preliminary investigations on the pure matrixmaterial as 15 nmThematrix is modeled in order to keep theparticle in its place and to allow for the simulation of inelasticphenomena of the boehmite particle
The size in loading direction is assigned according to theorientation of the particle in such a way that the bound-ary region is located directly below the particle (see alsoFigure 15(a)) This corresponds to a rigid surface supportingthe particle as an idealization of the sample holder in thereal experiment It should bementioned that for stability andperformance reasons the chemical bonds are modeled usingharmonic potentials which cannot reproduce the failure ofbonds and hence the cracking of boehmite layers Threedifferent configurations are simulated Firstly the load isapplied in [010] direction (perpendicular to the layers)secondly the layers are oriented diagonally and the particle
(a) Parallel to layers plane toplane support
(b) Inclined layers plane to planesupport
(c) Inclined layers edge toplane support
(d) Deformed configuration of(b) at peak load
(e) Deformed configuration of(b) after unloading
Figure 15 (a)ndash(c) Investigated undeformed particle orientations(d) and (e) Deformed configurations corresponding to the initiallyinclined layers with plane to plane support
has a plane area of support (Figure 15(b)) and thirdly thelayers are oriented diagonally and the particle rests on thesample holder only by an edge see Figure 15(c)
The three configurations have been exposed to a loadingand subsequently an unloading process Figure 16 shows thecorresponding deflection versus force curves of the loadingand unloading process as well as the respective Hertz fit
A huge difference between the configuration perpendicu-lar to the layers and the other two configurations is apparentFor loading in [010] direction the loading and unloadingpath are nearly identical indicating a purely elastic problemand resulting in a Youngrsquos modulus of approximately 136GPaThis result shows a good agreement with the simulationsperformed on the pure boehmite sample For the otherparticle orientations a drastically reduced slope of the curvesand a hysteretic behavior is observed This indicates inelasticbehavior The corresponding plots of the deformed structureof the configurationwith plane to plane support Figures 15(d)and 15(e) provide insight in the inelastic mechanisms
Journal of Nanomaterials 11
The main mechanism leading to the reduced slope of theresulting curves is a slippage of the crystal layers that canclearly be seen in the deformed shape in Figure 15(d) Thesudden onset of crystal layer slippage can as well be seen fromthe force jumps in the loading path in the deflection-forcecurves in Figure 16 The roughness of the curve originatesfrom the jump from one equilibrium position of the inter-layer hydrogen bonds to another The crystal layer slippageadditionally induces a tilting of the single boehmite layersIn case of the configuration with edge on plane support (seeFigure 15(c)) the particle can furthermore tilt as a wholeresulting in an even more decreased slope of the curves
In both cases the Hertz curve is fitted to the unload-ing curve since this curve is in the presence of inelasticeffects expected to exhibit the elastic behavior This leadsto calculated moduli of approximately 40GPa for planeto plane support and 325GPa for edge to plane supportHowever the unloading path is not considered to be purelyelastic The deformed structure after the unloading processin Figure 15(e) shows that the layer slippage is reversed bythe unloading This reversal is assumed to be introduced byrestoring forces of the compressed matrix material as wellas through the tip-particle adhesion The unloading curvethus also exhibits small jumps The calculated moduli fromthe unloading curve show a significant reduction comparedto the simulation of the pure boehmite samples that is asignificant approach to the experimental dimensions (aroundvalues of 10GPa) is observed
5 Results and Discussion
Results from literature suggested that the Youngrsquos modulusof boehmite falls in the range from 120 to 160GPa MDFEMsimulations on bulk boehmite presented in Section 43yielded anisotropic Youngrsquos moduli of 232GPa 136GPa and267GPa in the directions [100] [010] and [001] respectivelyWhile these results are at least of similar magnitude to theresults from the cited literature experimental investigationsindicated far lower stiffness For the macroscopic GeoBsample the stiffness obtained frommeasurements was foundto be on the order of 10GPa for a test roughly alignedwith the [010] direction (cf Section 34) For the particlesample the stiffness was determined to fall somewhere inbetween epoxy (35GPa) and glass (70GPa) in Section 33Three hypotheses for this conspicuous discrepancy wereput forth and discussed sample size related effects inelas-tic slippage of crystal layers and possible distortion ofthe experimental results by the presence of amorphousboehmite
The third hypothesis was refuted in Section 33 byexperiments on boehmite samples known to feature lowcrystallinity which resulted in even lower stiffness Thisled to the conclusion that the experiments on particle andGeoB samples are not critically affected by the presenceof amorphous boehmite This interpretation is consistentwith results from simulations on bulk boehmite includingdefects in Section 43 A number of particle imperfectionswere considered such as alumina or hydroxyl defects orintercalated water molecules In particular the latter one is
0
02
04
06
08
1
12
14
16
Tip
disp
lace
men
t (nm
)
500 1000 1500 2000 2500 30000Indentation force (N)
Loading perpendicular to layersLoading inclined layers plane to planeLoading inclined layers plane to edgeUnloading perpendicular to layersUnloading inclined layers plane to planeUnloading inclined layers plane to edgeHertz fit 136 GPa
Hertz fit 325 GPaHertz fit 40 GPa
Figure 16 Loading curve unloading curve and Hertz fit of theinvestigated configurations from Figure 15
observed in the real crystalline material However none ofthe considered defects could account for a sufficient drop instiffness
The second hypothesis on the other hand is corroboratedby simulations emulating the actual AFM test conditions ofa particle embedded in epoxy resin The simulated measure-ments resulted in substantially lower stiffness 325 to 40GPacomparable to the experiments on GeoB when the loadingdirection did not coincide with [010] It seems likely thatto some extent the stiffness mismatch can be attributed toinevitable load-misalignments in the experiments Inelasticlayer slippage triggered by misalignment of the loadingdirection is therefore identified as the probable cause of thevery low stiffness in certain situations Furthermore the effectof imperfect contact of the particle on the sample holderwas considered also resulting in somewhat reduced apparentstiffness
In the simulations on the particle inelasticity is alsoclearly indicated by the presence of hysteresis in the load-ingunloading curves No hysteresis is apparent in the FDCsof the GeoB though It is presumed that in macroscopiccrystal samples the slippage is reversed by conformationof the deformed areas to the far-field lattice structure afterunloading In microscopic samples however the entirecrystal is affected by the deformation and it is thereforepermanent Hence the hypothesis of a sample size dependenteffect is accepted as well
Moreover the model size of the simulation might havean effect on the results too Since the number of atoms had
12 Journal of Nanomaterials
to be reduced for the simulation the simulation box repre-sents a downscaled model of the actual AFM measurementAlthough the box size was selected from a series leadingto convergent results it cannot be ruled out that for asignificant enlargement of the box additional phenomena likelayer buckling become relevant Further inaccuracies of thesimulation model arise from the choice of the interatomicforce field or the rigid representation of the AFM tip Theseeffects might contribute to the remaining discrepancies thatis stiffness as low as 325GPa in the simulations versusstiffness as low as 10 GPa in themeasurementsThe remaininguncertainties motivate further investigations and will beaddressed in future work
6 Conclusion
The anisotropic Young moduli of the single crystalline boeh-mite were determined by means of MDFEM simulationsyielding values of 232 136 and 267GPa in the directions[100] [010] and [001] respectively Results of AFM exper-iments on boehmite nanoparticles in contrast showed dras-tically reduced but seemingly elastic moduli in the range of10GPa Three hypothesized causes of the significantly lowervalues were examined by experiments on complementarytypes of boehmite that is geological and hydrothermallysynthesized samples and further simulations of imperfectcrystals and combined boehmiteepoxy models It is con-cluded from these investigations that the mechanical behav-ior of boehmite nanoparticles and geological boehmite isdominated by the slippage of weakly linked boehmite layersThe approaching and retracting part of the experimentallydetermined FDC of the geological sample exhibit no visiblehysteresis and hence the behavior appears to be purely elasticHowever further simulations indicated that the inelasticprocess of layer slippage can be reversed by certain effectsFor the geological sample in which the deformations weresmall compared to the size of the crystal we hypothesize theconformation of the deformed areas to the far-field latticestructure
Competing Interests
The authors declare that they have no competing interests
Acknowledgments
This work originates from the Research Unit FOR 2021ldquoActing Principles of Nano-Scaled Matrix Additives for Com-posite Structuresrdquo funded by the German Research Founda-tion (DFG) The authors would like to thank Dr FranziskaEmmerling BAM Berlin Division 13 for providing andanalyzing X-ray diffraction data of boehmite nanoparticlesFurthermore the authors acknowledge the support by theRRZN scientific computing cluster which is funded by theLeibniz Universitat Hannover the Lower Saxony Ministryof Science and Culture (MWK) and the German ResearchFoundation (DFG) The authors wish to express their grati-tude for the financial support
References
[1] C-H Chen J-Y Jian and F-S Yen ldquoPreparation and charac-terization of epoxy120574-aluminum oxide nanocompositesrdquo Com-posites Part A Applied Science and Manufacturing vol 40 no4 pp 463ndash468 2009
[2] R A Horch N Shahid A S Mistry M D Timmer A GMikos and A R Barron ldquoNanoreinforcement of poly(prop-ylene fumarate)-based networks with surface modified alu-moxane nanoparticles for bone tissue engineeringrdquo Biomacro-molecules vol 5 no 5 pp 1990ndash1998 2004
[3] S Pradhan R Lach H H Le W Grellmann H Raduschand R Adhikari ldquoEffect of filler dimensionality on mechanicalproperties of nanofiller reinforced polyolefin elastomersrdquo ISRNPolymer Science vol 2013 Article ID 284504 9 pages 2013
[4] C ArltWirkungsweisen nanoskaliger Bohmite in einem Polymerund seinem Kohlenstoggfaserverbund unter Druckbelastung [dis-sertation] 2011
[5] WW Chen S WWu Y D Lei et al ldquoInterfacial structure andperformance of rubberboehmite nanocomposites modified bymethacrylic acidrdquo Polymer vol 52 no 19 pp 4387ndash4395 2011
[6] C Ozdilek K Kazimierczak D van der Beek and S JPicken ldquoPreparation and properties of polyamide-6-boehmitenanocompositesrdquo Polymer vol 45 no 15 pp 5207ndash5214 2004
[7] N Shahid R G Villate and A R Barron ldquoChemically func-tionalized alumina nanoparticle effect on carbon fiberepoxycompositesrdquo Composites Science and Technology vol 65 no 14pp 2250ndash2258 2005
[8] X Bokhimi J A Toledo-Antonio M L Guzman-Castillo andF Hernandez-Beltran ldquoRelationship between crystallite sizeand bond lengths in boehmiterdquo Journal of Solid State Chemistryvol 159 no 1 pp 32ndash40 2001
[9] A B Kiss G Keresztury and L Farkas ldquoRaman and Ir-spectra and structure of boehmite (120574-Alooh)mdashevidence for therecently discarded D-17
2ℎspace grouprdquo Spectrochimica Acta Part
A-Molecular and Biomolecular Spectroscopy vol 36 no 7 pp653ndash658 1980
[10] D Tunega H Pasalic M H Gerzabek and H LischkaldquoTheoretical study of structural mechanical and spectroscopicproperties of boehmite (120574-AlOOH)rdquo Journal of Physics Con-densed Matter vol 23 no 40 Article ID 404201 2011
[11] Y Noel R Demichelis F Pascale P Ugliengo R Orlandoand R Dovesi ldquoAb initio quantum mechanical study of 120574-AlOOH boehmite structure and vibrational spectrumrdquo Physicsand Chemistry of Minerals vol 36 no 1 pp 47ndash59 2009
[12] R C Streller Boehmite als Nanofullstoffe fur Polypropylen-Nanocomposites und Nanopartikel-modifizierte PolypropylenKautschuk-Blends [Dissertation] 2008
[13] M Digne P Sautet P Raybaud H Toulhoat and E ArtacholdquoStructure and stability of aluminum hydroxides a theoreticalstudyrdquo Journal of Physical Chemistry B vol 106 no 20 pp 5155ndash5162 2002
[14] ldquoJmol an open-source Java viewer for chemical structures in3Drdquo httpwwwjmolorg
[15] J QWang J L Liu X Y Liu M H Qiao Y Pei and K N FanldquoHydrothermal transformation of bayerite to boehmiterdquo Scienceof Advanced Materials vol 1 pp 77ndash85 2009
[16] C J Doss and R Zallen ldquoRaman studies of sol-gel aluminafinite-size effects in nanocrystalline AlO(OH)rdquo Physical ReviewB vol 48 no 21 pp 15626ndash15637 1993
Journal of Nanomaterials 13
[17] K Okada T Nagashima Y Kameshima A Yasumori and TTsukada ldquoRelationship between formation conditions proper-ties and crystallite size of boehmiterdquo Journal of Colloid andInterface Science vol 253 no 2 pp 308ndash314 2002
[18] Sasol ldquoDispersal HP14rdquo Brunsbuttel Germany 2014[19] AGuinierX-RayDiffraction in Crystals Imperfect Crystals and
Amorphous Bodies Dover Publications New York NY USA1994
[20] ldquoThe Rruff projectrdquo Bob Downs httprruffinfo[21] J Yang and R L Frost ldquoSynthesis and characterization of
boehmite nanofibersrdquo Research Letters in Inorganic Chemistryvol 2008 Article ID 602198 4 pages 2008
[22] B Cappella S K Kaliappan and H Sturm ldquoUsing AFMforce-distance curves to study the glass-to-rubber transition ofamorphous polymers and their elastic-plastic properties as afunction of temperaturerdquo Macromolecules vol 38 no 5 pp1874ndash1881 2005
[23] D Silbernagl and B Cappella ldquoReconstruction of a hiddentopography by single AFM force-distance curvesrdquo SurfaceScience vol 603 no 16 pp 2363ndash2369 2009
[24] H-J Butt B Cappella and M Kappl ldquoForce measurementswith the atomic forcemicroscope technique interpretation andapplicationsrdquo Surface Science Reports vol 59 no 1ndash6 pp 1ndash1522005
[25] D Platz D Forchheimer E A Tholen and D B HavilandldquoInteraction imaging with amplitude-dependence force spec-troscopyrdquo Nature Communications vol 4 article 1360 2013
[26] T S Halbach and R Mulhaupt ldquoBoehmite-based polyethylenenanocomposites prepared by in-situ polymerizationrdquo Polymervol 49 no 4 pp 867ndash876 2008
[27] V M Khumalo J Karger-Kocsis and R Thomann ldquoPolyethy-lenesynthetic boehmite alumina nanocomposites structurethermal and rheological propertiesrdquo Express Polymer Lettersvol 4 no 5 pp 264ndash274 2010
[28] L Nasdala A Kempe and R Rolfes ldquoAre finite elements appro-priate for use in molecular dynamic simulationsrdquo CompositesScience and Technology vol 72 no 9 pp 989ndash1000 2012
[29] J Wackerfuss ldquoMolecular mechanics in the context of the finiteelement methodrdquo International Journal for Numerical Methodsin Engineering vol 77 no 7 pp 969ndash997 2009
[30] N M OrsquoBoyle M Banck C A James C Morley T Vander-meersch and G R Hutchison ldquoOpen Babel an open chemicaltoolboxrdquo Journal of Cheminformatics vol 3 no 10 article 332011
[31] L Martinez R Andrade E G Birgin and J M MartınezldquoPACKMOL a package for building initial configurations formolecular dynamics simulationsrdquo Journal of ComputationalChemistry vol 30 no 13 pp 2157ndash2164 2009
[32] S L Mayo B D Olafson andW A Goddard III ldquoDREIDINGa generic force field for molecular simulationsrdquo The Journal ofPhysical Chemistry vol 94 no 26 pp 8897ndash8909 1990
[33] A Kempe L Nasdala and R Rolfes ldquoSimulating size-depe-ndency of the tensile modulus of aluminaepoxy nanocom-posites using the molecular dynamic finite element methodrdquoin Proceedings of the International Conference on Mechanics ofNano Micro and Macro Composite Structures no 182 pp 1ndash2June 2012
[34] J Fankhanel A Kempe and R Rolfes ldquoSimulating atomicforce microscopy for the determination of the elastic prop-erties of nanoparticle reinforced epoxy resinrdquo in Proceedingsof the 7th European Congress on Computational Methods in
Applied Sciences and Engineering (ECCOMAS Congress rsquo16)Crete Island Greece June 2016 httpswwweccomas2016orgproceedingspdf7538pdf
Submit your manuscripts athttpwwwhindawicom
ScientificaHindawi Publishing Corporationhttpwwwhindawicom Volume 2014
CorrosionInternational Journal of
Hindawi Publishing Corporationhttpwwwhindawicom Volume 2014
Polymer ScienceInternational Journal of
Hindawi Publishing Corporationhttpwwwhindawicom Volume 2014
Hindawi Publishing Corporationhttpwwwhindawicom Volume 2014
CeramicsJournal of
Hindawi Publishing Corporationhttpwwwhindawicom Volume 2014
CompositesJournal of
NanoparticlesJournal of
Hindawi Publishing Corporationhttpwwwhindawicom Volume 2014
Hindawi Publishing Corporationhttpwwwhindawicom Volume 2014
International Journal of
Biomaterials
Hindawi Publishing Corporationhttpwwwhindawicom Volume 2014
NanoscienceJournal of
TextilesHindawi Publishing Corporation httpwwwhindawicom Volume 2014
Journal of
NanotechnologyHindawi Publishing Corporationhttpwwwhindawicom Volume 2014
Journal of
CrystallographyJournal of
Hindawi Publishing Corporationhttpwwwhindawicom Volume 2014
The Scientific World JournalHindawi Publishing Corporation httpwwwhindawicom Volume 2014
Hindawi Publishing Corporationhttpwwwhindawicom Volume 2014
CoatingsJournal of
Advances in
Materials Science and EngineeringHindawi Publishing Corporationhttpwwwhindawicom Volume 2014
Smart Materials Research
Hindawi Publishing Corporationhttpwwwhindawicom Volume 2014
Hindawi Publishing Corporationhttpwwwhindawicom Volume 2014
MetallurgyJournal of
Hindawi Publishing Corporationhttpwwwhindawicom Volume 2014
BioMed Research International
MaterialsJournal of
Hindawi Publishing Corporationhttpwwwhindawicom Volume 2014
Nano
materials
Hindawi Publishing Corporationhttpwwwhindawicom Volume 2014
Journal ofNanomaterials
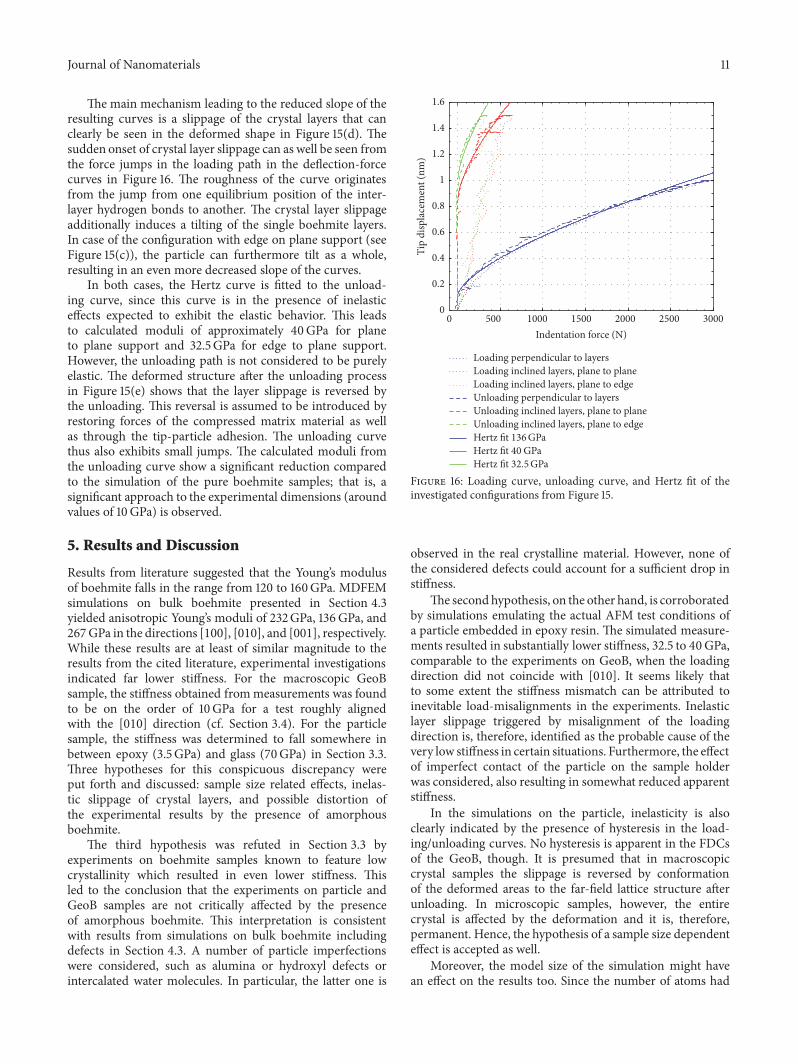