Embed Size (px)
Citation preview
Research ArticleNIRS Characterization of Paper Pulps to Predict Kappa Number
Ana Moral,1 Elena Cabeza,1 Roberto Aguado,2 and Antonio Tijero2
1Chemical Engineering Department, Experimental Sciences Faculty, Pablo de Olavide University, Road of Utrera km 1,41013 Seville, Spain2Grupo de Celulosa y Papel, Chemical Engineering Department, Faculty of Chemistry, Complutense University of Madrid,Avenue Complutense s/n, 28040 Madrid, Spain
Correspondence should be addressed to Ana Moral; [email protected]
Received 8 August 2014; Revised 18 October 2014; Accepted 27 October 2014
Academic Editor: Ming-Guo Ma
Copyright © 2015 Ana Moral et al. This is an open access article distributed under the Creative Commons Attribution License,which permits unrestricted use, distribution, and reproduction in any medium, provided the original work is properly cited.
Rice is one of themost abundant food crops in theworld and its straw stands as an important source of fibres both from an economicand an environmental point of view. Pulp characterization is of special relevance in works involving alternative rawmaterials, sincepulp properties are closely linked to the quality of the final product. One of the analytical techniques that can be used in pulpcharacterization is near-infrared spectroscopy (NIRS). The use of NIRS has economic and technical advantages over conventionaltechniques.This paper aims to discuss the convenience of using NIRS to predict Kappa number in rice straw pulps produced underdifferent conditions. We found that the resulting Kappa number can be acceptably estimated by NIRS, as the errors obtained withthat method are similar to those found for other techniques.
1. Introduction
The use of wood as the main raw material in the pulpand paper industry is related to some economic and envi-ronmental issues. Wood prices make up the largest partof the costs of cellulose pulp production. While most ofthe wood comes from plantation forests, this has raisedsome controversy due to some natural forests having beenreplaced by monocultures. These are two of the reasons thathave fostered research into the use of alternative, nonwoodraw materials in response to environmental and economicpressure. In fact, nonwood raw materials constitute the soleeffective source of cellulose fibre in some regions of the worldwhere wood is a scarce resource [1–4].
Rice for human consumption belongs commonly tospeciesOryza sativa orOryza glaberrima; the latter, however,is much less widely used than the former and its productionis restricted to West Africa [5]. Rice straw is an abundantnonwood raw material due to the large disposal of it whichtakes place during the harvest which poses serious problemsto farmers. Traditionally, straw has been burnt on site.This practice generates heavy smoke frequently resulting in
breathing, cardiorespiratory, and allergic problems in nearbypopulations and also in the release of large amounts of carbondioxide to the environment. However, rice straw can beprocessed differently in order to facilitate its valorisation.Oneway is by using it as animal feed; however, advocates anddetractors of this use disagree on the actual protein value andthe digestibility of the material [6]. Another way is by usingstraw ash or husk ash, which is similar in composition, toextract silicon [7]. This substance can also be obtained fromthe liquors of alkaline and acid treatments [8]. In any case,using rice straw to produce cellulose pulp [9] is the mostattractive choice.
The growing concern with the preservation of the envi-ronment in developed societies must be reconciled with theincreasing demand for paper and board pulp worldwide.Thisleads to a new focus on the use of alternative raw materialsand the development of pulping processes which cause lessenvironmental impact (soda, soda-anthraquinone) [10].
Pulps characterization has special relevance in studiesrelated to the use of alternative raw materials through lesspolluting processes in the pulp and paper industry. Pulpproperties are closely linked to the quality of the final product.
Hindawi Publishing CorporationJournal of SpectroscopyVolume 2015, Article ID 104609, 6 pageshttp://dx.doi.org/10.1155/2015/104609
2 Journal of Spectroscopy
However, conventional techniques imply a high consumptionof reagents and time for its realization. At the same time,the destruction of samples during the process hinders theexecution of subsequent determinations that could favour theknowledge of other parameters of special interest [11].
From the 1950s, near-infrared spectroscopy (NIRS) beganto get known, and its possibilities were foreseen. Previously,only MIR and FIR spectroscopy were considered useful,since they allowed for analysing individual componentspresent in each sample [12]. NIRS began to be used in thecharacterization of organic compounds from the 60s and itsuse has been extended to the control of almost all processes infood, pharmaceuticals, textile, chemical, petrochemical, andmedical industries [13, 14].
NIRS has a number of advantages over conventionaltechniques: it suits solids, liquids, and gases and does notrequire sample pretreatment; the spectral recording andanalysis of routine are fast; it is nondestructive and allowsfor multicomponent analysis and in-line analysis, and it isinexpensive [15].
NIRS is a powerful and fast tool for the determination ofthe constituents of wood [16, 17].There are precedents for theuse of the near-infrared spectroscopy for the determinationof yield [18] and Kappa number of pulps from hardwoodsand softwoods [19, 20]. Absorption bands observed in thereflectance of the wood spectra arise from the emissionof electromagnetic waves produced by the overtones andcombinations of C–H, C–O, N–H, and O–H [18].
The difficulty of NIRS application lies in the natureof spectra combined with the existence of multiple peakswhich overlap. Therefore, it is necessary to develop advancedchemometric techniques helping to decipher the wide rangeof information provided by the spectra. Instruments andsoftware developments have allowed great advances in theapplicability of the technique [21].
Multivariate calibration can be difficult to perform, andit generally requires quantitative and qualitative knowledgeof the properties of the samples to be analysed. In orderto extract valuable information, different chemometric tech-niques can be used: principal components analysis (PCA),partial least squares (PLS), and multivariate resolution ofcurves (MCR), to name a few.
In the pulp and paper industry, the determination of theKappa number is a parameter of special significance, sinceit is an indirect method to estimate the content of residuallignin and an indicator of bleachability [22]. The aim of thisstudy is to evaluate the potential of NIR technology as asubstitute for conventional trials in the determination of theKappa number. The influence of the variables involved in thecooking process of rice straw on Kappa number has beenstudied, and so has their relationship with the NIR spectraobtained.
2. Materials and Methods
2.1. Raw Material. The rice species used in this study areOryza sativa (Asiatic) and Oryza glaberrima (African). Ricefrom both species was grown in the Southeast of Spain andits straw was harvested.
2.2. Pulping. Pulps were obtained by cooking rice straw ina 15 L batch cylindrical reactor that was heated by means ofelectrical resistances. Rice straw was placed in the reactortogether with soda and anthraquinone and pulped by usinga reagent concentration, temperature, cooking time, and aliquid/solid ratio as shown in Table 1. The operating condi-tions have been chosen based on previous works [2]. Thereactor was linked through an axle to a control unit, whichincluded a motor actuating the reactor and instrumentsfor measurement and control of pressure and temperature.Afterwards, the cooked material was unloaded into a washerin order to remove residual cooking liquor and then fiberizedin a disintegrator at 1200 rpm for 30min. The washed pulpwas beaten in a Sprout-Bauer refiner and the fiberizedmaterial passed through a screen of 0.16mm mesh size inorder to remove uncooked particles.
2.3. Experimental Design. Pulping processes have beenmod-elled in various ways for the estimation of Kappa number interms of process variables, in order to optimize the operatingconditions accordingly.
Most of the existing models are kinetic equations. How-ever, to the best of our knowledge, few researchers have useda factorial design that allows for the development of empiricalmodels with several independent variables, to examine theKappa number. These empirical models are preferable to themechanistic ones, since the latter are too complex when theycontain more than two independent variables.
In this work, we chose a factorial design consisting of aseries of points (tests) around a central composition point(central test).
The total number of tests required for the five indepen-dent variables studied (namely, temperature (𝑇), time (𝑡),soda concentration (𝑆), anthraquinone concentration (𝐴),and liquid/solid ratio (𝐻)) was found to be 27.
The values of the independent variables were normalized:
𝑋𝑛= 2𝑋 − 𝑋
𝑋max − 𝑋min, (1)
where𝑋𝑛is the normalized value of temperature (𝑇), time (𝑡),
or liquid/solid ratio (𝑆);𝑋 is the absolute experimental valueof the variable concerned;𝑋 is themean of the extreme valuesof X, and 𝑋max and 𝑋min are its maximum and minimumvalue, respectively. Experimental conditions and normalizedvalues are shown in Table 1.
The experimental data were fitted to the following secondorder polynomial model:
𝑌 = 𝑎0+
𝑛
∑
𝑖=1
𝑏𝑖𝑋𝑛,𝑖+
𝑛
∑
𝑖=1
𝑐𝑖𝑋𝑛,𝑖
2
+
𝑛
∑
𝑖=1
𝑏𝑖𝑋𝑛,𝑖𝑋𝑛,𝑗, (2)
where 𝑖 < 𝑗.𝑋𝑛represent the normalized values of the process
variables (time, temperature, concentration of reagents, etc.).The coefficients 𝑎
0, 𝑏𝑖, 𝑐𝑖, and 𝑑
𝑖𝑗are constants to be estimated
from the experimental data.
2.4. Determination of Kappa Number. Kappa number wasdetermined in accordance with ISO 302:2004, applicable for
Journal of Spectroscopy 3
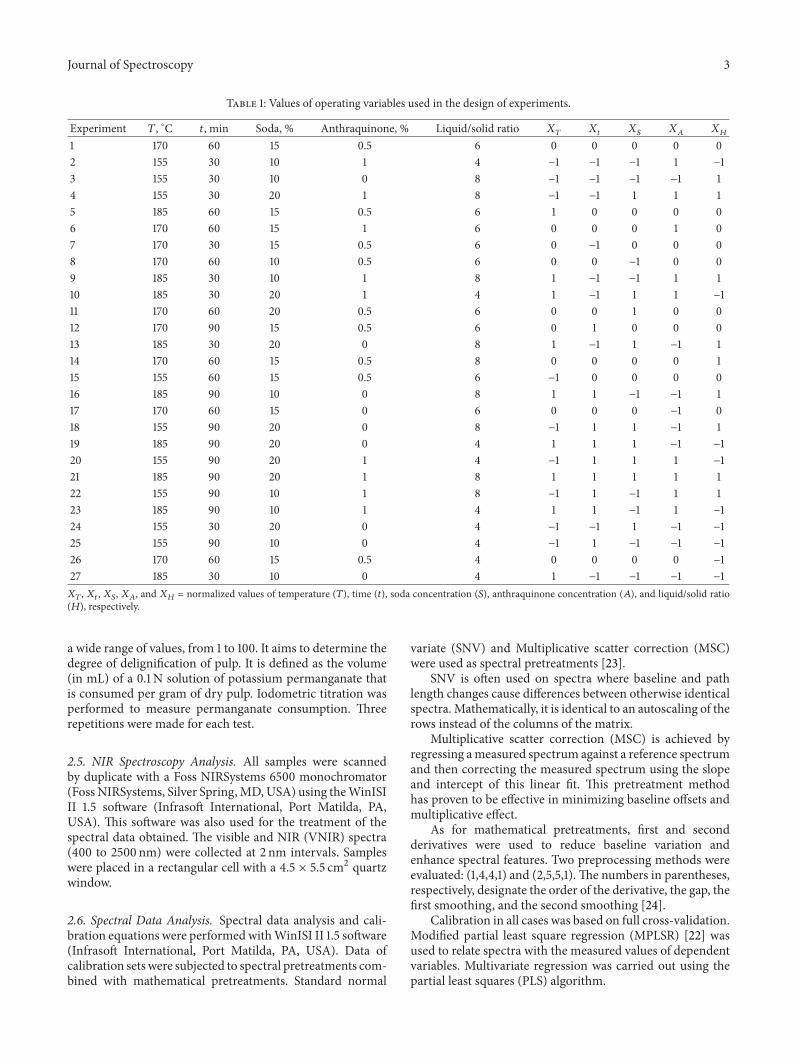
Table 1: Values of operating variables used in the design of experiments.
Experiment 𝑇, ∘C 𝑡, min Soda, % Anthraquinone, % Liquid/solid ratio 𝑋𝑇𝑋𝑡𝑋𝑆𝑋𝐴𝑋𝐻
1 170 60 15 0.5 6 0 0 0 0 02 155 30 10 1 4 −1 −1 −1 1 −13 155 30 10 0 8 −1 −1 −1 −1 14 155 30 20 1 8 −1 −1 1 1 15 185 60 15 0.5 6 1 0 0 0 06 170 60 15 1 6 0 0 0 1 07 170 30 15 0.5 6 0 −1 0 0 08 170 60 10 0.5 6 0 0 −1 0 09 185 30 10 1 8 1 −1 −1 1 110 185 30 20 1 4 1 −1 1 1 −111 170 60 20 0.5 6 0 0 1 0 012 170 90 15 0.5 6 0 1 0 0 013 185 30 20 0 8 1 −1 1 −1 114 170 60 15 0.5 8 0 0 0 0 115 155 60 15 0.5 6 −1 0 0 0 016 185 90 10 0 8 1 1 −1 −1 117 170 60 15 0 6 0 0 0 −1 018 155 90 20 0 8 −1 1 1 −1 119 185 90 20 0 4 1 1 1 −1 −120 155 90 20 1 4 −1 1 1 1 −121 185 90 20 1 8 1 1 1 1 122 155 90 10 1 8 −1 1 −1 1 123 185 90 10 1 4 1 1 −1 1 −124 155 30 20 0 4 −1 −1 1 −1 −125 155 90 10 0 4 −1 1 −1 −1 −126 170 60 15 0.5 4 0 0 0 0 −127 185 30 10 0 4 1 −1 −1 −1 −1𝑋𝑇, 𝑋𝑡, 𝑋𝑆, 𝑋𝐴, and 𝑋
𝐻= normalized values of temperature (𝑇), time (𝑡), soda concentration (𝑆), anthraquinone concentration (𝐴), and liquid/solid ratio
(𝐻), respectively.
a wide range of values, from 1 to 100. It aims to determine thedegree of delignification of pulp. It is defined as the volume(in mL) of a 0.1 N solution of potassium permanganate thatis consumed per gram of dry pulp. Iodometric titration wasperformed to measure permanganate consumption. Threerepetitions were made for each test.
2.5. NIR Spectroscopy Analysis. All samples were scannedby duplicate with a Foss NIRSystems 6500 monochromator(Foss NIRSystems, Silver Spring,MD,USA) using theWinISIII 1.5 software (Infrasoft International, Port Matilda, PA,USA). This software was also used for the treatment of thespectral data obtained. The visible and NIR (VNIR) spectra(400 to 2500 nm) were collected at 2 nm intervals. Sampleswere placed in a rectangular cell with a 4.5 × 5.5 cm2 quartzwindow.
2.6. Spectral Data Analysis. Spectral data analysis and cali-bration equations were performedwithWinISI II 1.5 software(Infrasoft International, Port Matilda, PA, USA). Data ofcalibration setswere subjected to spectral pretreatments com-bined with mathematical pretreatments. Standard normal
variate (SNV) and Multiplicative scatter correction (MSC)were used as spectral pretreatments [23].
SNV is often used on spectra where baseline and pathlength changes cause differences between otherwise identicalspectra.Mathematically, it is identical to an autoscaling of therows instead of the columns of the matrix.
Multiplicative scatter correction (MSC) is achieved byregressing ameasured spectrum against a reference spectrumand then correcting the measured spectrum using the slopeand intercept of this linear fit. This pretreatment methodhas proven to be effective in minimizing baseline offsets andmultiplicative effect.
As for mathematical pretreatments, first and secondderivatives were used to reduce baseline variation andenhance spectral features. Two preprocessing methods wereevaluated: (1,4,4,1) and (2,5,5,1). The numbers in parentheses,respectively, designate the order of the derivative, the gap, thefirst smoothing, and the second smoothing [24].
Calibration in all cases was based on full cross-validation.Modified partial least square regression (MPLSR) [22] wasused to relate spectra with the measured values of dependentvariables. Multivariate regression was carried out using thepartial least squares (PLS) algorithm.
4 Journal of Spectroscopy
The residuals obtained after the calculation of eachregression term in the modified partial least squares (MPLS)regression were standardized dividing by the standard devi-ation before the calculation of the next regression term.According to Shenk and Westerhaus [25], the number ofterms was fixed when the SECV presented a minimum valuebefore overfitting.
The different pretreatments were characterised by cal-culating the standard error of cross-validation (SECV) andthe coefficient of determination of cross-validation (1-VR).Two measurements of each sample were used to estimate thestandard error of the reference method (ETL):
ETL = √∑ (𝑦1− 𝑦2)
2𝑁, (3)
where 𝑦1and 𝑦
2are the values obtained for a sample and its
repetition andN is the number of data pairs used to calculatethe ETL.
3. Results and Discussion
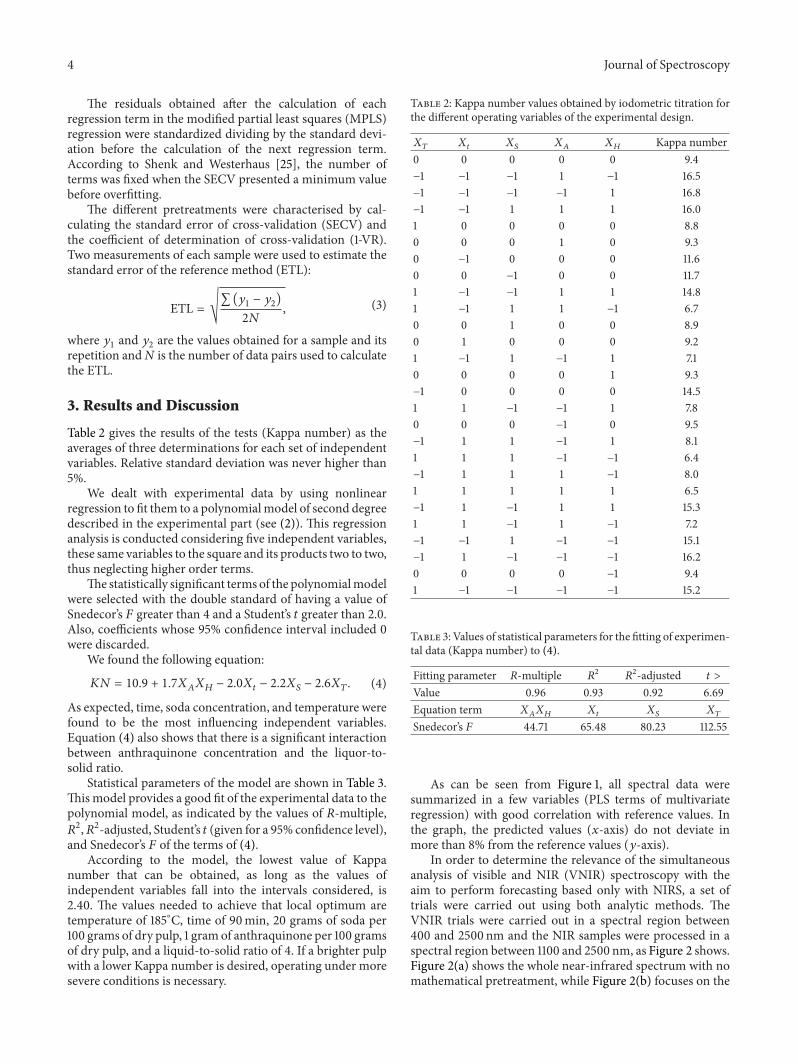
Table 2 gives the results of the tests (Kappa number) as theaverages of three determinations for each set of independentvariables. Relative standard deviation was never higher than5%.
We dealt with experimental data by using nonlinearregression to fit them to a polynomialmodel of second degreedescribed in the experimental part (see (2)). This regressionanalysis is conducted considering five independent variables,these same variables to the square and its products two to two,thus neglecting higher order terms.
The statistically significant terms of the polynomialmodelwere selected with the double standard of having a value ofSnedecor’s 𝐹 greater than 4 and a Student’s 𝑡 greater than 2.0.Also, coefficients whose 95% confidence interval included 0were discarded.
We found the following equation:
𝐾𝑁 = 10.9 + 1.7𝑋𝐴𝑋𝐻− 2.0𝑋
𝑡− 2.2𝑋
𝑆− 2.6𝑋
𝑇. (4)
As expected, time, soda concentration, and temperature werefound to be the most influencing independent variables.Equation (4) also shows that there is a significant interactionbetween anthraquinone concentration and the liquor-to-solid ratio.
Statistical parameters of the model are shown in Table 3.Thismodel provides a good fit of the experimental data to thepolynomial model, as indicated by the values of 𝑅-multiple,𝑅2,𝑅2-adjusted, Student’s 𝑡 (given for a 95% confidence level),
and Snedecor’s 𝐹 of the terms of (4).According to the model, the lowest value of Kappa
number that can be obtained, as long as the values ofindependent variables fall into the intervals considered, is2.40. The values needed to achieve that local optimum aretemperature of 185∘C, time of 90min, 20 grams of soda per100 grams of dry pulp, 1 gram of anthraquinone per 100 gramsof dry pulp, and a liquid-to-solid ratio of 4. If a brighter pulpwith a lower Kappa number is desired, operating under moresevere conditions is necessary.
Table 2: Kappa number values obtained by iodometric titration forthe different operating variables of the experimental design.
𝑋𝑇𝑋𝑡
𝑋𝑆
𝑋𝐴
𝑋𝐻
Kappa number0 0 0 0 0 9.4−1 −1 −1 1 −1 16.5−1 −1 −1 −1 1 16.8−1 −1 1 1 1 16.01 0 0 0 0 8.80 0 0 1 0 9.30 −1 0 0 0 11.60 0 −1 0 0 11.71 −1 −1 1 1 14.81 −1 1 1 −1 6.70 0 1 0 0 8.90 1 0 0 0 9.21 −1 1 −1 1 7.10 0 0 0 1 9.3−1 0 0 0 0 14.51 1 −1 −1 1 7.80 0 0 −1 0 9.5−1 1 1 −1 1 8.11 1 1 −1 −1 6.4−1 1 1 1 −1 8.01 1 1 1 1 6.5−1 1 −1 1 1 15.31 1 −1 1 −1 7.2−1 −1 1 −1 −1 15.1−1 1 −1 −1 −1 16.20 0 0 0 −1 9.41 −1 −1 −1 −1 15.2
Table 3: Values of statistical parameters for the fitting of experimen-tal data (Kappa number) to (4).
Fitting parameter 𝑅-multiple 𝑅2
𝑅2-adjusted 𝑡 >
Value 0.96 0.93 0.92 6.69Equation term 𝑋
𝐴𝑋𝐻
𝑋𝑡
𝑋𝑆
𝑋𝑇
Snedecor’s 𝐹 44.71 65.48 80.23 112.55
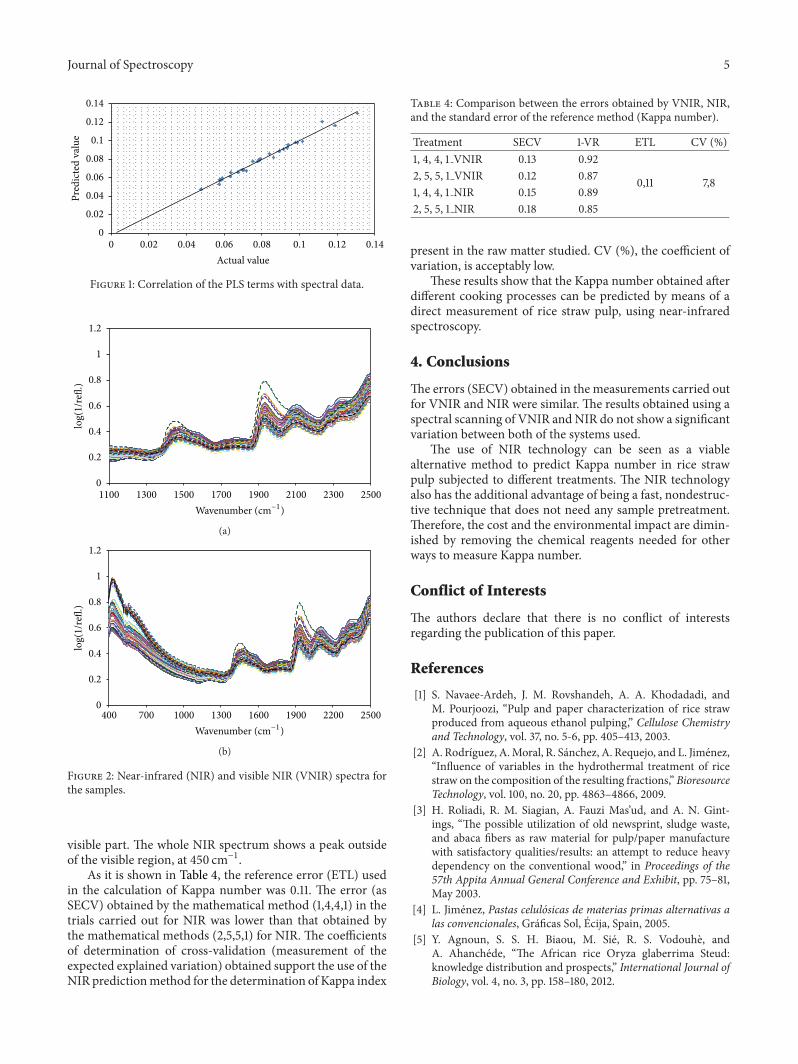
As can be seen from Figure 1, all spectral data weresummarized in a few variables (PLS terms of multivariateregression) with good correlation with reference values. Inthe graph, the predicted values (𝑥-axis) do not deviate inmore than 8% from the reference values (𝑦-axis).
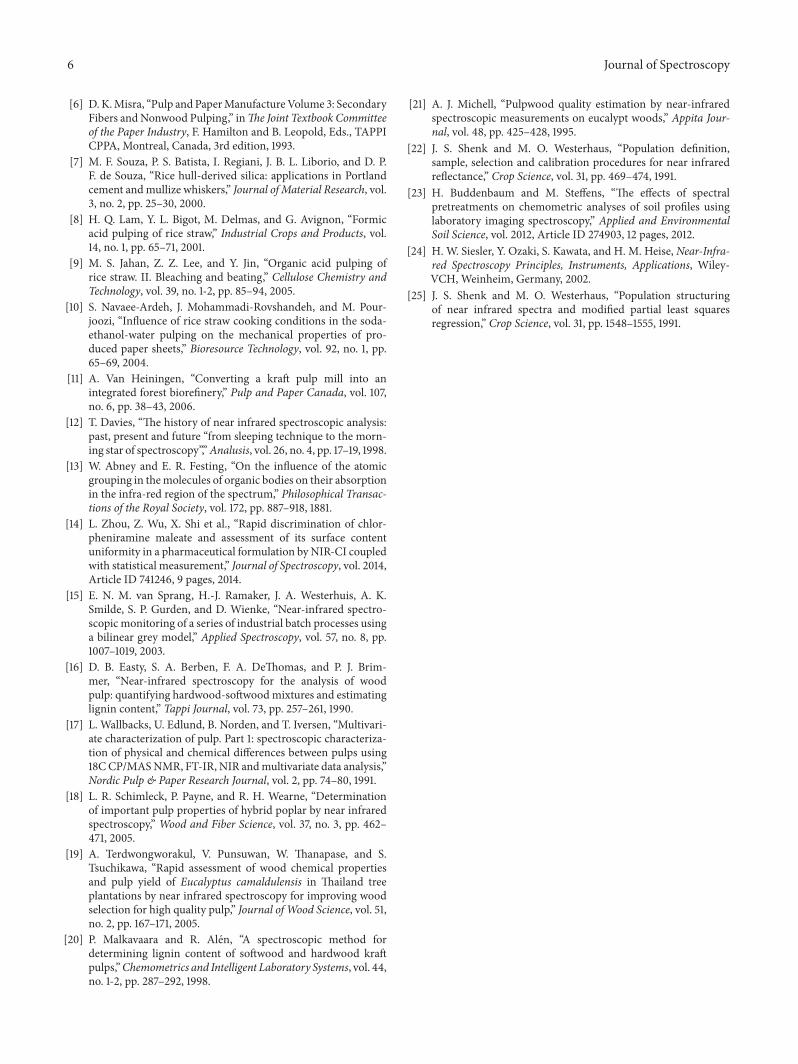
In order to determine the relevance of the simultaneousanalysis of visible and NIR (VNIR) spectroscopy with theaim to perform forecasting based only with NIRS, a set oftrials were carried out using both analytic methods. TheVNIR trials were carried out in a spectral region between400 and 2500 nm and the NIR samples were processed in aspectral region between 1100 and 2500 nm, as Figure 2 shows.Figure 2(a) shows the whole near-infrared spectrum with nomathematical pretreatment, while Figure 2(b) focuses on the
Journal of Spectroscopy 5
0
0.02
0.04
0.06
0.08
0.1
0.12
0.14
0 0.02 0.04 0.06 0.08 0.1 0.12 0.14
Pred
icte
d va
lue
Actual value
Figure 1: Correlation of the PLS terms with spectral data.
0
0.2
0.4
0.6
0.8
1
1.2
1100 1300 1500 1700 1900 2100 2300 2500
log(
1/re
fl.)
Wavenumber (cm−1)
(a)
log(
1/re
fl.)
0
0.2
0.4
0.6
0.8
1
1.2
400 700 1000 1300 1600 1900 2200 2500Wavenumber (cm−1)
(b)
Figure 2: Near-infrared (NIR) and visible NIR (VNIR) spectra forthe samples.
visible part. The whole NIR spectrum shows a peak outsideof the visible region, at 450 cm−1.
As it is shown in Table 4, the reference error (ETL) usedin the calculation of Kappa number was 0.11. The error (asSECV) obtained by the mathematical method (1,4,4,1) in thetrials carried out for NIR was lower than that obtained bythe mathematical methods (2,5,5,1) for NIR. The coefficientsof determination of cross-validation (measurement of theexpected explained variation) obtained support the use of theNIR predictionmethod for the determination of Kappa index
Table 4: Comparison between the errors obtained by VNIR, NIR,and the standard error of the reference method (Kappa number).
Treatment SECV 1-VR ETL CV (%)1, 4, 4, 1 VNIR 0.13 0.92
0,11 7,82, 5, 5, 1 VNIR 0.12 0.871, 4, 4, 1 NIR 0.15 0.892, 5, 5, 1 NIR 0.18 0.85
present in the raw matter studied. CV (%), the coefficient ofvariation, is acceptably low.
These results show that the Kappa number obtained afterdifferent cooking processes can be predicted by means of adirect measurement of rice straw pulp, using near-infraredspectroscopy.
4. Conclusions
The errors (SECV) obtained in the measurements carried outfor VNIR and NIR were similar. The results obtained using aspectral scanning of VNIR and NIR do not show a significantvariation between both of the systems used.
The use of NIR technology can be seen as a viablealternative method to predict Kappa number in rice strawpulp subjected to different treatments. The NIR technologyalso has the additional advantage of being a fast, nondestruc-tive technique that does not need any sample pretreatment.Therefore, the cost and the environmental impact are dimin-ished by removing the chemical reagents needed for otherways to measure Kappa number.
Conflict of Interests
The authors declare that there is no conflict of interestsregarding the publication of this paper.
References
[1] S. Navaee-Ardeh, J. M. Rovshandeh, A. A. Khodadadi, andM. Pourjoozi, “Pulp and paper characterization of rice strawproduced from aqueous ethanol pulping,” Cellulose Chemistryand Technology, vol. 37, no. 5-6, pp. 405–413, 2003.
[2] A. Rodrıguez, A.Moral, R. Sanchez, A. Requejo, and L. Jimenez,“Influence of variables in the hydrothermal treatment of ricestraw on the composition of the resulting fractions,” BioresourceTechnology, vol. 100, no. 20, pp. 4863–4866, 2009.
[3] H. Roliadi, R. M. Siagian, A. Fauzi Mas’ud, and A. N. Gint-ings, “The possible utilization of old newsprint, sludge waste,and abaca fibers as raw material for pulp/paper manufacturewith satisfactory qualities/results: an attempt to reduce heavydependency on the conventional wood,” in Proceedings of the57th Appita Annual General Conference and Exhibit, pp. 75–81,May 2003.
[4] L. Jimenez, Pastas celulosicas de materias primas alternativas alas convencionales, Graficas Sol, Ecija, Spain, 2005.
[5] Y. Agnoun, S. S. H. Biaou, M. Sie, R. S. Vodouhe, andA. Ahanchede, “The African rice Oryza glaberrima Steud:knowledge distribution and prospects,” International Journal ofBiology, vol. 4, no. 3, pp. 158–180, 2012.
6 Journal of Spectroscopy
[6] D.K.Misra, “Pulp andPaperManufactureVolume 3: SecondaryFibers andNonwood Pulping,” inThe Joint Textbook Committeeof the Paper Industry, F. Hamilton and B. Leopold, Eds., TAPPICPPA, Montreal, Canada, 3rd edition, 1993.
[7] M. F. Souza, P. S. Batista, I. Regiani, J. B. L. Liborio, and D. P.F. de Souza, “Rice hull-derived silica: applications in Portlandcement andmullize whiskers,” Journal of Material Research, vol.3, no. 2, pp. 25–30, 2000.
[8] H. Q. Lam, Y. L. Bigot, M. Delmas, and G. Avignon, “Formicacid pulping of rice straw,” Industrial Crops and Products, vol.14, no. 1, pp. 65–71, 2001.
[9] M. S. Jahan, Z. Z. Lee, and Y. Jin, “Organic acid pulping ofrice straw. II. Bleaching and beating,” Cellulose Chemistry andTechnology, vol. 39, no. 1-2, pp. 85–94, 2005.
[10] S. Navaee-Ardeh, J. Mohammadi-Rovshandeh, and M. Pour-joozi, “Influence of rice straw cooking conditions in the soda-ethanol-water pulping on the mechanical properties of pro-duced paper sheets,” Bioresource Technology, vol. 92, no. 1, pp.65–69, 2004.
[11] A. Van Heiningen, “Converting a kraft pulp mill into anintegrated forest biorefinery,” Pulp and Paper Canada, vol. 107,no. 6, pp. 38–43, 2006.
[12] T. Davies, “The history of near infrared spectroscopic analysis:past, present and future “from sleeping technique to the morn-ing star of spectroscopy”,”Analusis, vol. 26, no. 4, pp. 17–19, 1998.
[13] W. Abney and E. R. Festing, “On the influence of the atomicgrouping in themolecules of organic bodies on their absorptionin the infra-red region of the spectrum,” Philosophical Transac-tions of the Royal Society, vol. 172, pp. 887–918, 1881.
[14] L. Zhou, Z. Wu, X. Shi et al., “Rapid discrimination of chlor-pheniramine maleate and assessment of its surface contentuniformity in a pharmaceutical formulation byNIR-CI coupledwith statistical measurement,” Journal of Spectroscopy, vol. 2014,Article ID 741246, 9 pages, 2014.
[15] E. N. M. van Sprang, H.-J. Ramaker, J. A. Westerhuis, A. K.Smilde, S. P. Gurden, and D. Wienke, “Near-infrared spectro-scopic monitoring of a series of industrial batch processes usinga bilinear grey model,” Applied Spectroscopy, vol. 57, no. 8, pp.1007–1019, 2003.
[16] D. B. Easty, S. A. Berben, F. A. DeThomas, and P. J. Brim-mer, “Near-infrared spectroscopy for the analysis of woodpulp: quantifying hardwood-softwoodmixtures and estimatinglignin content,” Tappi Journal, vol. 73, pp. 257–261, 1990.
[17] L. Wallbacks, U. Edlund, B. Norden, and T. Iversen, “Multivari-ate characterization of pulp. Part 1: spectroscopic characteriza-tion of physical and chemical differences between pulps using18CCP/MASNMR, FT-IR, NIR andmultivariate data analysis,”Nordic Pulp & Paper Research Journal, vol. 2, pp. 74–80, 1991.
[18] L. R. Schimleck, P. Payne, and R. H. Wearne, “Determinationof important pulp properties of hybrid poplar by near infraredspectroscopy,” Wood and Fiber Science, vol. 37, no. 3, pp. 462–471, 2005.
[19] A. Terdwongworakul, V. Punsuwan, W. Thanapase, and S.Tsuchikawa, “Rapid assessment of wood chemical propertiesand pulp yield of Eucalyptus camaldulensis in Thailand treeplantations by near infrared spectroscopy for improving woodselection for high quality pulp,” Journal of Wood Science, vol. 51,no. 2, pp. 167–171, 2005.
[20] P. Malkavaara and R. Alen, “A spectroscopic method fordetermining lignin content of softwood and hardwood kraftpulps,”Chemometrics and Intelligent Laboratory Systems, vol. 44,no. 1-2, pp. 287–292, 1998.
[21] A. J. Michell, “Pulpwood quality estimation by near-infraredspectroscopic measurements on eucalypt woods,” Appita Jour-nal, vol. 48, pp. 425–428, 1995.
[22] J. S. Shenk and M. O. Westerhaus, “Population definition,sample, selection and calibration procedures for near infraredreflectance,” Crop Science, vol. 31, pp. 469–474, 1991.
[23] H. Buddenbaum and M. Steffens, “The effects of spectralpretreatments on chemometric analyses of soil profiles usinglaboratory imaging spectroscopy,” Applied and EnvironmentalSoil Science, vol. 2012, Article ID 274903, 12 pages, 2012.
[24] H. W. Siesler, Y. Ozaki, S. Kawata, and H. M. Heise, Near-Infra-red Spectroscopy Principles, Instruments, Applications, Wiley-VCH, Weinheim, Germany, 2002.
[25] J. S. Shenk and M. O. Westerhaus, “Population structuringof near infrared spectra and modified partial least squaresregression,” Crop Science, vol. 31, pp. 1548–1555, 1991.

Submit your manuscripts athttp://www.hindawi.com
Hindawi Publishing Corporationhttp://www.hindawi.com Volume 2014
Inorganic ChemistryInternational Journal of
Hindawi Publishing Corporation http://www.hindawi.com Volume 2014
International Journal ofPhotoenergy
Hindawi Publishing Corporationhttp://www.hindawi.com Volume 2014
Carbohydrate Chemistry
International Journal of
Hindawi Publishing Corporationhttp://www.hindawi.com Volume 2014
Journal of
Chemistry
Hindawi Publishing Corporationhttp://www.hindawi.com Volume 2014
Advances in
Physical Chemistry
Hindawi Publishing Corporationhttp://www.hindawi.com
Analytical Methods in Chemistry
Journal of
Volume 2014
Bioinorganic Chemistry and ApplicationsHindawi Publishing Corporationhttp://www.hindawi.com Volume 2014
SpectroscopyInternational Journal of
Hindawi Publishing Corporationhttp://www.hindawi.com Volume 2014
The Scientific World JournalHindawi Publishing Corporation http://www.hindawi.com Volume 2014
Medicinal ChemistryInternational Journal of
Hindawi Publishing Corporationhttp://www.hindawi.com Volume 2014
Chromatography Research International
Hindawi Publishing Corporationhttp://www.hindawi.com Volume 2014
Applied ChemistryJournal of
Hindawi Publishing Corporationhttp://www.hindawi.com Volume 2014
Hindawi Publishing Corporationhttp://www.hindawi.com Volume 2014
Theoretical ChemistryJournal of
Hindawi Publishing Corporationhttp://www.hindawi.com Volume 2014
Journal of
Spectroscopy
Analytical ChemistryInternational Journal of
Hindawi Publishing Corporationhttp://www.hindawi.com Volume 2014
Journal of
Hindawi Publishing Corporationhttp://www.hindawi.com Volume 2014
Quantum Chemistry
Hindawi Publishing Corporationhttp://www.hindawi.com Volume 2014
Organic Chemistry International
ElectrochemistryInternational Journal of
Hindawi Publishing Corporation http://www.hindawi.com Volume 2014
Hindawi Publishing Corporationhttp://www.hindawi.com Volume 2014
CatalystsJournal of