Embed Size (px)
Citation preview
Drew et al. BMC Genomics 2012, 13:323http://www.biomedcentral.com/1471-2164/13/323
RESEARCH ARTICLE Open Access
Brain transcriptome variation among behaviorallydistinct strains of zebrafish (Danio rerio)Robert E Drew1,2†, Matthew L Settles3, Erin J Churchill1, Shayna M Williams1, Soniya Balli2 and Barrie D Robison1*†
Abstract
Background: Domesticated animal populations often show profound reductions in predator avoidance and fear-related behavior compared to wild populations. These reductions are remarkably consistent and have beenobserved in a diverse array of taxa including fish, birds, and mammals. Experiments conducted in commonenvironments indicate that these behavioral differences have a genetic basis. In this study, we quantifieddifferences in fear-related behavior between wild and domesticated zebrafish strains and used microarray analysisto identify genes that may be associated with this variation.
Results: Compared to wild zebrafish, domesticated zebrafish spent more time near the water surface and weremore likely to occupy the front of the aquarium nearest a human observer. Microarray analysis of the braintranscriptome identified high levels of population variation in gene expression, with 1,749 genes significantlydifferentially expressed among populations. Genes that varied among populations belonged to functionalcategories that included DNA repair, DNA photolyase activity, response to light stimulus, neuron development andaxon guidance, cell death, iron-binding, chromatin reorganization, and homeobox genes. Comparatively fewergenes (112) differed between domesticated and wild strains with notable genes including gpr177 (wntless),selenoprotein P1a, synaptophysin and synaptoporin, and acyl-CoA binding domain containing proteins (acbd3 andacbd4).
Conclusions: Microarray analysis identified a large number of genes that differed among zebrafish populations andmay underlie behavioral domestication. Comparisons with similar microarray studies of domestication in rainbowtrout and canids identified sixteen evolutionarily or functionally related genes that may represent components ofshared molecular mechanisms underlying convergent behavioral evolution during vertebrate domestication.However, this conclusion must be tempered by limitations associated with comparisons among microarray studiesand the low level of population-level replication inherent to these studies.
Keywords: Zebrafish, Transcriptome, Microarray, Behavior, Anxiety, Domestication
BackgroundThe process of animal domestication is a striking ex-ample of convergent behavioral evolution. During do-mestication, populations diverge from their wildprogenitors as a result of genetic drift, artificial selectionon desirable traits, relaxed selection on previously im-portant characteristics, and adaptation to new environ-mental and ecological conditions [1-3]. Evolution incaptivity is associated with a set of phenotypic changes,
* Correspondence: [email protected]†Equal contributors1Department of Biological Sciences and Program in Bioinformatics andComputational Biology, University of Idaho, Moscow, ID 83844, USAFull list of author information is available at the end of the article
© 2012 Drew et al.; licensee BioMed Central LCommons Attribution License (http://creativecreproduction in any medium, provided the or
including enhanced growth rate [4-6], attenuated re-sponsiveness to stress [7,8], increased feeding behavior[9], and reduced predator avoidance behavior [6,10,11].Reductions in predator avoidance behavior are the mostconsistent responses to domestication and have beenobserved across a broad range of taxa, including mam-mals, birds, and fish [12-14]. However, it is not knownwhether the apparent convergent evolution of predatoravoidance behavior during domestication is the result ofsimilar genetic changes or of changes in a myriad of al-ternative molecular “routes” to the same phenotypicendpoint. In fact, little is known about the genetic poly-morphisms associated with domestication in any verte-brate species.
td. This is an Open Access article distributed under the terms of the Creativeommons.org/licenses/by/2.0), which permits unrestricted use, distribution, andiginal work is properly cited.
Drew et al. BMC Genomics 2012, 13:323 Page 2 of 13http://www.biomedcentral.com/1471-2164/13/323
Differences in gene regulation are an important sourceof genetic variation for phenotypic evolution [15-17].Transcriptome analyses have detected substantial vari-ation among populations in numerous species, includingyeast [18], Drosophila [19], fish [17,20-24], and humans[25,26]. Much of this variation has a heritable compo-nent [25,27-30]. While the majority of variation in geneexpression appears to evolve in a neutral fashion, somegenes show patterns consistent with evolution underpositive selection and may contribute to local adaptation[17,29,31-33], including behavioral adaptations [20,34].In particular, microarray studies suggest that domestica-tion may also be associated with changes in gene expres-sion [22,35-37].In the present study, we use the zebrafish (Danio rerio)
as a model for examining the relationship between be-havioral domestication and variation in gene expression.The utility of the zebrafish in developmental biology andgenomics is widely known, and there has been increasedusage of the zebrafish as a model for behavior genetics[38-41]. Variation in behavior has been observed amongpopulations of zebrafish, including variation amongdomesticated (laboratory) populations [38], among popu-lations recently acquired from the wild [42], and betweenwild and domesticated populations [9,43-45]. In each ofthese studies, the populations were reared under identi-cal conditions suggesting that the differences in behaviorhave a genetic component [9,43,44].In our study, we used microarrays to perform a
transcriptome-wide analysis of variation in brain geneexpression among four behaviorally distinct strains ofzebrafish with different histories of domestication. First,we quantified behavioral differences between wild anddomesticated zebrafish strains using a high throughputbehavior assay [46]. Second, using microarrays, wedetected substantial variation in expression profilesamong these behaviorally distinct populations, a portionof which was associated with domestication history. Fi-nally we compared our results against other microarraystudies [22,35-37,47] and identified sixteen homologousgenes that were associated with behavioral domesticationand variation in fear-related behavior across multiplespecies.
Results and discussionBehavioral variation among zebrafish strainsWe used a simple, high-throughput assay to characterizebehavioral differences among zebrafish strains [46]. Theassay was based on initial observations that fish fromdomesticated strains tended to spend more time nearthe surface and at the front of the aquarium nearesthuman technicians while wild fish tended to be found atthe back and near the bottom of the aquarium. Thisassay decomposes this place preference type behavior
into a vertical component (Vertical Depth) and a hori-zontal component (Horizontal Position). Vertical Depthquantifies the mean distance of an individual from thewater surface while Horizontal Position is the proportionof the time an individual spends within one body lengthof the front of the tank, nearest to a human observer.Although simple in design, the behaviors quantified by
this assay can be used as indices of fear-related behaviorin fish species, and are likely indicators of trade-offs be-tween foraging and predator avoidance. In the wild,proximity to the surface is believed to increase the riskof predation by aerial predators [13,48,49] and observa-tions of zebrafish and other fish species are consistentwith this hypothesis [50,51]. However, in captivity, fishare commonly offered food that floats on the surface,providing a contradictory stimulus for approaching thesurface. Indeed, mean distance from the surface isnegatively correlated with feeding behavior in zebrafish(M. Oswald and B.D.R., Unpublished data), masu salmon(O. masou) [52], and growth hormone transgenic cohosalmon (O. kisutch) [53]. Also distance from the surfaceis positively correlated with freezing in response to asimulated predator by masu salmon [52]. Recent workhas also shown that zebrafish spend less time in theupper half of aquaria in response to stressful stimuli andtreatment with anxiogenic chemicals (alarm pheromoneand caffeine), and more time following treatment withanxiolytic compounds (ethanol and fluoxetine) [54].Therefore we conclude that these behaviors are validindicators of fearfulness in various fish species.We used these behavior assays to characterize four
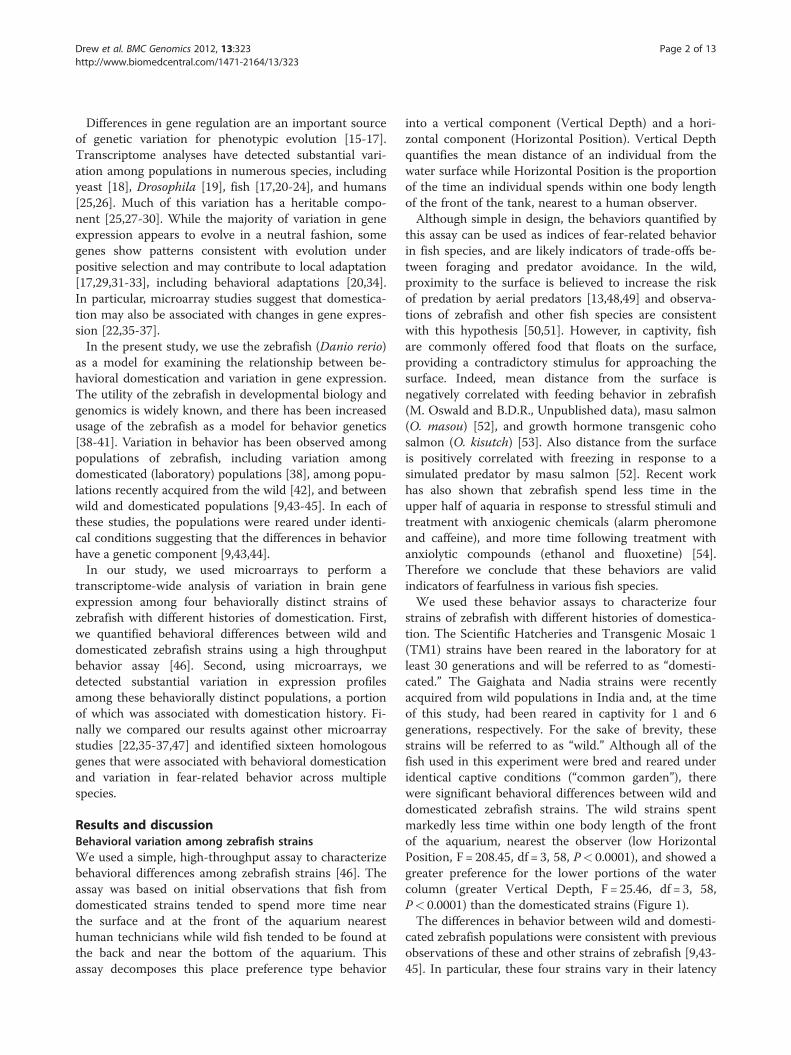
strains of zebrafish with different histories of domestica-tion. The Scientific Hatcheries and Transgenic Mosaic 1(TM1) strains have been reared in the laboratory for atleast 30 generations and will be referred to as “domesti-cated.” The Gaighata and Nadia strains were recentlyacquired from wild populations in India and, at the timeof this study, had been reared in captivity for 1 and 6generations, respectively. For the sake of brevity, thesestrains will be referred to as “wild.” Although all of thefish used in this experiment were bred and reared underidentical captive conditions (“common garden”), therewere significant behavioral differences between wild anddomesticated zebrafish strains. The wild strains spentmarkedly less time within one body length of the frontof the aquarium, nearest the observer (low HorizontalPosition, F = 208.45, df = 3, 58, P< 0.0001), and showed agreater preference for the lower portions of the watercolumn (greater Vertical Depth, F = 25.46, df = 3, 58,P< 0.0001) than the domesticated strains (Figure 1).The differences in behavior between wild and domesti-
cated zebrafish populations were consistent with previousobservations of these and other strains of zebrafish [9,43-45]. In particular, these four strains vary in their latency
a
a a b b
b
a a b b
Figure 1 Box plots of behavioral variation among two wild andtwo domesticated zebrafish strains. (a) Domesticated zebrafish[Scientific Hatcheries (SH) and TM1] had lower Vertical Depth,spending more time close to the water surface than wild zebrafish[Nadia and Gaighatta] (P< 0.0001). (b) Domesticated zebrafish alsohad higher levels of Horizontal Position, spending a larger portion oftime within one body length of the front of the aquarium nearestthe human observer (P< 0.0001). Boxes represent the 25th and 75th
percentiles, while the median is indicated by the interior horizontalline. The 5th and 95th percentiles are represented by the whiskers.Significant differences among strains are represented by lower caseletters within each figure.
Drew et al. BMC Genomics 2012, 13:323 Page 3 of 13http://www.biomedcentral.com/1471-2164/13/323
to feed from the surface of the water such that wild fishtake much longer to commence feeding than domesti-cated fish [9]. Likewise, similar differences have beenobserved between wild and domesticated populations ofother fish species (primarily salmonids) [13,48,55-59]. In
general, domesticated fish tend to be bolder, feed morefrequently, and have reduced ability to avoid predation[13], characteristics that have been linked with decreasedsurvival in a wild environment [60].
Transcriptome variation among zebrafish strainsWe next tested if these behaviorally distinct zebrafishstrains also differed in gene expression in the brain toidentify genes or pathways that may underlie behavioralvariation. GeneChipW Zebrafish Genome microarrays(Affymetrix, Santa Clara, CA) were used to quantify theexpression of approximately 14,900 zebrafish transcriptsin the brains of fish observed in the behavior studyabove.A total of 7,958 probe sets were detected as expressed
in our zebrafish brain samples, based on our filtering cri-teria for expression (see Methods). Of these, 3,199 probesets displayed probe level variation indicative of se-quence polymorphisms among individuals and popula-tions, known as single feature polymorphisms (SFPs)[61-63]. The presence of SFPs can confound compari-sons of gene expression among different genotypes andtherefore these features were removed from the analysis.The remaining 4,759 probe sets were analyzed using
linear models for microarrays (limma) [64,65] to test fordifferences in transcriptome profiles among strains, be-tween wild and domesticated strains, and between malesand females. Our initial analysis revealed considerablevariation in gene expression among the strains with1,752 probe sets differentially expressed among strains,259 with a 2-fold or greater difference in pairwise com-parisons of mean expression levels [see Additional file1]. This level of brain transcriptome variation amongpopulations is substantially higher that than observedbetween two populations of rainbow trout (201 genes,[37]) and among eight behaviorally diverse inbred mouselines (188 genes, [47]); however these differences mayreflect differences in statistical analyses or gene contentof the array platforms.The three probe sets with the highest differences
among strains corresponded to quality control probe setsfor green fluorescent protein (GFP: AFFX-Dr-M62653-1_at, AFFX-Dr-M62653-1_s_at) and cyan fluorescentprotein (CFP: AFFX-Dr-AF292560-1_s_at). Because theexpression of GFP in the TM1 strain was the result oftransgenic manipulation [66], these genes were removedfrom the analysis. The next ten most differentiallyexpressed zebrafish genes included cytochrome P450,family 1, subfamily A (cyp1a); major histocompatibilitycomplex class II DAB gene (mhc2dab); G protein-coupled receptor 177 (gpr177); and seven unannotatedsequences.The Database for Annotation, Visualization and Inte-
grated Discovery (DAVID version 6.7) [67,68] was used
Drew et al. BMC Genomics 2012, 13:323 Page 4 of 13http://www.biomedcentral.com/1471-2164/13/323
to identify functional categories that were overrepre-sented in the final gene lists (excluding SFPs) relative tothe 7,958 genes detected as expressed in our analysis.DAVID identified 116 functional categories that weresignificantly overrepresented among genes that varied inexpression among strains [see Additional file 2]. Notablefunctional categories included those involved in DNArepair, DNA photolyase activity, response to light stimu-lus, neuron development and axon guidance, cell death,iron-binding, WD40 repeat domains, chromatinorganization, and homeobox genes. Functional interpret-ation of these findings is complicated because, althoughthese genes differed among zebrafish populations, vari-ation in expression was distributed in different patternsamong the four zebrafish populations and did not neces-sarily involve correlated expression. These categoriesmay represent functional groups of genes that, in thebrain, may frequently vary among zebrafish populations.It is not known if this variation in gene expression isunder selection or whether it is associated with variationin brain function or behavior.
Transcriptome variation between wild and domesticatedstrainsA total of 612 probe sets were initially identified as dif-ferentially expressed between wild and domesticatedstrains. Visual inspection of the data suggested thatmany of these differences were driven by extreme valuesin one of the strains. To increase the stringency of theanalysis, genes associated with domestication wereretained if the ranges of expression levels of wild anddomesticated samples overlapped by no more than onesample. This additional criterion narrowed the list to112 genes that were differentially expressed betweenwild and domesticated samples, 10 of which had a 2-folddifference or greater [see Additional file 3].G protein-coupled receptor 177 (gpr177) showed the
largest difference with a 5.59-fold down-regulation indomesticated zebrafish. gpr177, also known as wntless orevenness interrupted (evi), is necessary for the release ofthe WNT signaling peptide from WNT-secreting cells[69,70]. The WNT signaling pathway is a major controlpathway for many aspects of embryonic development,including patterning of the central nervous system, andis also involved in axon guidance and synapse formationin adult organisms [71,72]. In addition, defects in WNTsignaling are associated with neurological disorders inhumans, including schizophrenia and Alzheimer’s dis-ease [73]. Selenoprotein P (sepp1a) was also among themost differentially expressed genes with a 1.85-fold up-regulation in domesticated zebrafish, similar to previousobservations of these strains [43]. The role of SEPP inthe brain is not completely understood but the proteinplays a vital role in selenium homeostasis [74]. Mouse
SEPP knockout mutants have reduced ability to storeselenium in the brain and other tissues, and show severeneurological impairment [75-77]. In humans, seleniumlevels are associated with disease states including epi-lepsy, Parkinson’s disease, and Alzheimer’s disease [74].Although it is unknown if SEPP plays a role in these dis-orders, sequence variation in sepp affects the ability toutilize selenium in humans [78].DAVID identified seven functional categories that were
overrepresented among all genes differentially expressedbetween wild and domesticated zebrafish. After account-ing for overlap, the functional groups can be reduced totwo categories: vesicle proteins and acyl-CoA bindingdomain containing proteins. Each of these groups wasrepresented by at most two or three individual genes.The vesicle proteins included synaptophysin b andsynaptoporin which are associated with synaptic vesiclesand synaptic plasticity [79,80], and SEC31 homolog, asubunit of the coat protein complex II which enables theformation of transport vesicles from the endoplasmicreticulum. Knockout mice lacking synaptophysin are vi-able but show increased exploratory behavior andreduced learning ability and memory [81], indicatingthat this gene can be directly involved in behavioral vari-ation. Stress is also known to influence both mRNA andprotein levels of synaptophysin in rats but the relation-ship is complex and influenced by factors including sexand the severity of the stressor [82-84]. Reduced sensi-tivity to stress has been observed in domesticated fish[8,85] and may be a factor in our study. The acyl-CoAbinding domain containing proteins included acbd3 andacbd4. ACBD3 maintains the structure of the Golgi ap-paratus, influences protein transport between the Golgiapparatus and the endoplasmic reticulum, and is an im-portant component of several cellular signaling pathways(reviewed by [86]). The function of ACBD4 has not beendetermined.
Transcriptome variation between zebrafish sexesAlthough not a primary focus of this experiment, wealso tested for sex differences in gene expression. Wedetected only eight sexually dimorphic genes in thebrain: insulin-like growth factor 1 (igf1); deiodinase,iodothyronine, type II (dio2); inhibin, beta Aa (inhbaa);endothelial PAS domain protein 1 (epas1); and fourunannotated genes (Dr.14275.1.A1_at, Dr.16113.1.S1_at,Dr.16580.1.A1_at, Dr.18139.1.S1_at, Dr.18392.1.A1_at,and Dr.6751.1.S1_at). Of these only dio2 was previouslydocumented as sexually dimorphic in zebrafish brains[43,87]. Interestingly, although 40 of the 42 sexually di-morphic genes identified by Santos et al. [87]were repre-sented on the GeneChipW Zebrafish Genomemicroarray, only eleven were detected as expressed inour study. This lack of concordance with our study is
Drew et al. BMC Genomics 2012, 13:323 Page 5 of 13http://www.biomedcentral.com/1471-2164/13/323
surprising, but could result from differences in experi-mental procedures, microarray platform and chemistry,and statistical analysis. A higher number of sexually di-morphic genes (81 genes) were also detected in braintranscriptomes of immature Atlantic salmon (Salmosalar) [34]. Despite the differences between these studiesand ours, all three studies showed substantially fewersexually dimorphic genes in the brain relative to othertissues, such as liver (1249 genes [88]) and gonads (2940genes [89]). This result is comparable to observations inmammals [90].
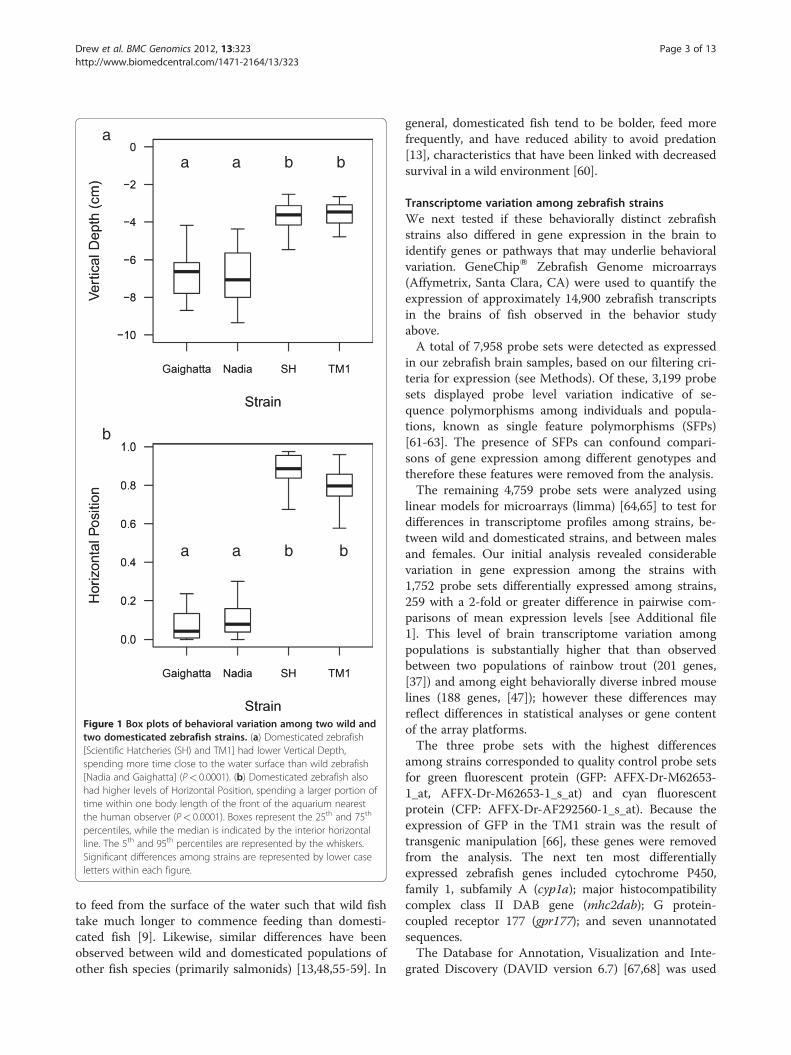
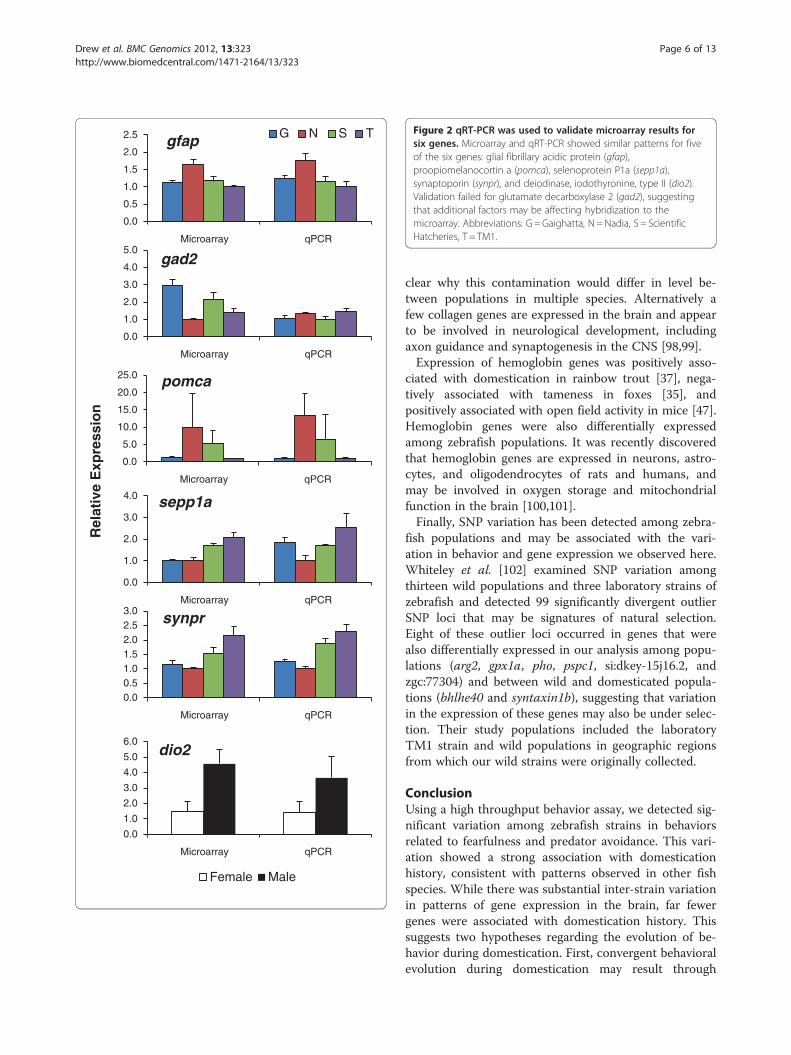
Validation using quantitative real-time PCRWe performed a technical validation using quantitativereal-time PCR (qRT-PCR) to verify expression of six dif-ferentially expressed genes identified by the microarrayanalysis. The genes selected for qRT-PCR validation dif-fered significantly among strains (gad2, gfap, pomca), be-tween wild and domesticated strains (sepp1a, synpr), orbetween the sexes (dio2) in the microarray analysis. TheqRT-PCR results were consistent with the microarrayanalysis for four of the six genes (Figure 2). qRT-PCRmeasures of gad2 expression did not agree with themicroarray results, suggesting that there may be add-itional factors affecting hybridization to the microarray.Expression of sepp1a also differed between microarrayand qRT-PCR in that the Gaighatta strain had higherlevels than expected; however, we previously foundagreement between our microarray findings (currentstudy) and qRT-PCR measures of sepp1a in an inde-pendent sample of these strains [43]. This unexpecteddisagreement may reflect strain-specific regulation ofsepp1a expression by dietary selenium levels [43].
Comparison with other studiesExamination of these findings in a comparative contextcan allow us to prioritize genes for future analyses. Wetherefore compared our results to other analyses in zeb-rafish and other species. Several microarray studies haveexamined transcriptome variation associated with do-mestication or fear-related behavioral variation in othervertebrates. These studies include a comparison betweenwild and domesticated rainbow trout [37], an analysis ofthe effect of selection for tame behavior in gray fox [35],a comparison between dogs and wolves [36], and an ana-lysis of behavioral variation among inbred mouse lines[47]. Cross-species comparisons of microarray studiesare complicated by differences in microarray platformsand chemistry, hybridization efficiencies, experimentaldesign, and statistical analyses. The studies also differedat the scale at which gene expression was measured inthe brain. The canid and mouse studies measured ex-pression separately in multiple regions of the brain[35,36,47] while our study and the rainbow trout study
[37] examined gene expression in the entire brain. Re-gional analyses of gene expression may be able to detectlocal changes in gene expression that are not detectablein whole brain analyses [91] but brain regions must beselected with care to ensure that relevant regions areincluded in the analysis.Despite these complications, we identified sixteen evo-
lutionarily or functionally related groups of genes thatwere associated with domestication in five vertebratespecies, or fear-related behaviors in mice (Table 1). Theassociation of these genes with independently deriveddomesticated populations of evolutionarily divergentspecies suggests that these genes may be components ofpathways influenced by convergent evolution during do-mestication, although they may not represent the causa-tive polymorphisms. These genes are involved in avariety of functions including translation initiation, pro-tein folding (DNAj genes), amelioration of oxidativestress (glutathione peroxidases and selenoprotein P), andmetabolic function (cytochrome c oxidases, NADHdehydrogenases). However, a few are known to affectfunctions in the brain.A few of these genes are associated with synapse func-
tion and long-term potentiation. Syntaxins are compo-nents of the SNARE complex which mediates thedocking of vesicles with extracellular membranes, in-cluding the release of neurotransmitters from axonterminals [92], and appears to be regulated by severalsyntaxin-binding proteins [93,94]. Protein levels of syn-taxins increase during long-term potentiation in the rathippocampus [95]. In studies related to domestication,mRNA expression of syntaxin1b2 was higher in foxesselected for tameness [35]; expression of syntaxin-binding proteins was higher in domesticated rainbowtrout [37] and correlated with fear-related behaviors inmice [47]. In contrast, in our study of zebrafish, expres-sion of three syntaxin genes differed among strains butwas not associated with domestication history. Likewise,caspases, such as capase-3, are associated with synapticplasticity and learning, in addition to their involvementin apoptosis [96,97]. Caspase-3a and capase-8 were up-regulated in domesticated populations of zebrafish(current study) and rainbow trout [37]. These observa-tions suggest that synapse development and functionmay be influenced by domestication.The association of collagens and hemoglobins with do-
mestication of multiple species was surprising. Collagensare rare in the brain and are usually associated with themeninges surrounding the brain [98]. This includes sev-eral of the collagen genes differentially expressed amongzebrafish populations (present study), between wild anddomesticated rainbow trout [37], and correlated with be-havior in mice [47]. It is possible that the meninges mayhave contaminated the brain samples, although it is not
0.0
1.0
2.0
3.0
4.0
5.0
Microarray qPCR
gad2
0.0
1.0
2.0
3.0
4.0
Microarray qPCR
sepp1a
0.0
5.0
10.0
15.0
20.0
25.0
Microarray qPCR
pomca
0.00.51.01.52.02.53.0
Microarray qPCR
synpr
0.0
1.0
2.0
3.0
4.0
5.0
6.0
Microarray qPCR
dio2
Female Male
Rel
ativ
e E
xpre
ssio
n
0.0
0.5
1.0
1.5
2.0
2.5
Microarray qPCR
gfap G N S T Figure 2 qRT-PCR was used to validate microarray results forsix genes. Microarray and qRT-PCR showed similar patterns for fiveof the six genes: glial fibrillary acidic protein (gfap),proopiomelanocortin a (pomca), selenoprotein P1a (sepp1a),synaptoporin (synpr), and deiodinase, iodothyronine, type II (dio2).Validation failed for glutamate decarboxylase 2 (gad2), suggestingthat additional factors may be affecting hybridization to themicroarray. Abbreviations: G =Gaighatta, N =Nadia, S = ScientificHatcheries, T = TM1.
Drew et al. BMC Genomics 2012, 13:323 Page 6 of 13http://www.biomedcentral.com/1471-2164/13/323
clear why this contamination would differ in level be-tween populations in multiple species. Alternatively afew collagen genes are expressed in the brain and appearto be involved in neurological development, includingaxon guidance and synaptogenesis in the CNS [98,99].Expression of hemoglobin genes was positively asso-
ciated with domestication in rainbow trout [37], nega-tively associated with tameness in foxes [35], andpositively associated with open field activity in mice [47].Hemoglobin genes were also differentially expressedamong zebrafish populations. It was recently discoveredthat hemoglobin genes are expressed in neurons, astro-cytes, and oligodendrocytes of rats and humans, andmay be involved in oxygen storage and mitochondrialfunction in the brain [100,101].Finally, SNP variation has been detected among zebra-
fish populations and may be associated with the vari-ation in behavior and gene expression we observed here.Whiteley et al. [102] examined SNP variation amongthirteen wild populations and three laboratory strains ofzebrafish and detected 99 significantly divergent outlierSNP loci that may be signatures of natural selection.Eight of these outlier loci occurred in genes that werealso differentially expressed in our analysis among popu-lations (arg2, gpx1a, pho, pspc1, si:dkey-15j16.2, andzgc:77304) and between wild and domesticated popula-tions (bhlhe40 and syntaxin1b), suggesting that variationin the expression of these genes may also be under selec-tion. Their study populations included the laboratoryTM1 strain and wild populations in geographic regionsfrom which our wild strains were originally collected.
ConclusionUsing a high throughput behavior assay, we detected sig-nificant variation among zebrafish strains in behaviorsrelated to fearfulness and predator avoidance. This vari-ation showed a strong association with domesticationhistory, consistent with patterns observed in other fishspecies. While there was substantial inter-strain variationin patterns of gene expression in the brain, far fewergenes were associated with domestication history. Thissuggests two hypotheses regarding the evolution of be-havior during domestication. First, convergent behavioralevolution during domestication may result through
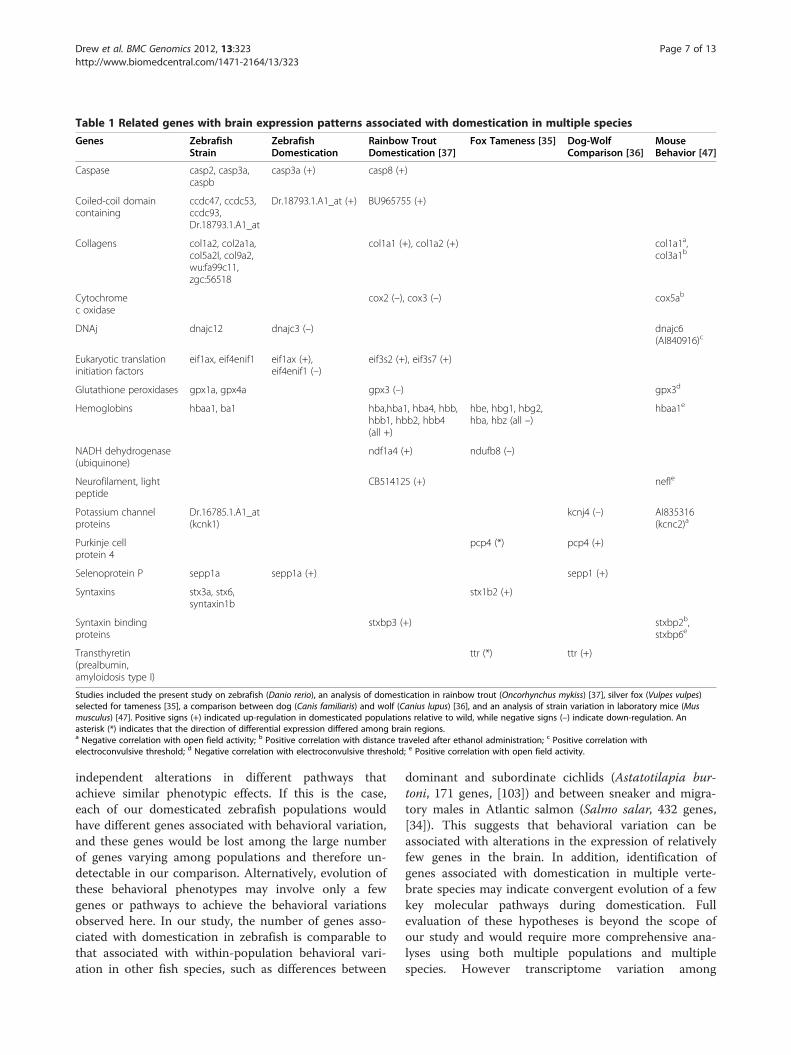
Table 1 Related genes with brain expression patterns associated with domestication in multiple species
Genes ZebrafishStrain
ZebrafishDomestication
Rainbow TroutDomestication [37]
Fox Tameness [35] Dog-WolfComparison [36]
MouseBehavior [47]
Caspase casp2, casp3a,caspb
casp3a (+) casp8 (+)
Coiled-coil domaincontaining
ccdc47, ccdc53,ccdc93,Dr.18793.1.A1_at
Dr.18793.1.A1_at (+) BU965755 (+)
Collagens col1a2, col2a1a,col5a2l, col9a2,wu:fa99c11,zgc:56518
col1a1 (+), col1a2 (+) col1a1a,col3a1b
Cytochromec oxidase
cox2 (–), cox3 (–) cox5ab
DNAj dnajc12 dnajc3 (–) dnajc6(AI840916)c
Eukaryotic translationinitiation factors
eif1ax, eif4enif1 eif1ax (+),eif4enif1 (–)
eif3s2 (+), eif3s7 (+)
Glutathione peroxidases gpx1a, gpx4a gpx3 (–) gpx3d
Hemoglobins hbaa1, ba1 hba,hba1, hba4, hbb,hbb1, hbb2, hbb4(all +)
hbe, hbg1, hbg2,hba, hbz (all –)
hbaa1e
NADH dehydrogenase(ubiquinone)
ndf1a4 (+) ndufb8 (–)
Neurofilament, lightpeptide
CB514125 (+) nefle
Potassium channelproteins
Dr.16785.1.A1_at(kcnk1)
kcnj4 (–) AI835316(kcnc2)a
Purkinje cellprotein 4
pcp4 (*) pcp4 (+)
Selenoprotein P sepp1a sepp1a (+) sepp1 (+)
Syntaxins stx3a, stx6,syntaxin1b
stx1b2 (+)
Syntaxin bindingproteins
stxbp3 (+) stxbp2b,stxbp6e
Transthyretin(prealbumin,amyloidosis type I)
ttr (*) ttr (+)
Studies included the present study on zebrafish (Danio rerio), an analysis of domestication in rainbow trout (Oncorhynchus mykiss) [37], silver fox (Vulpes vulpes)selected for tameness [35], a comparison between dog (Canis familiaris) and wolf (Canius lupus) [36], and an analysis of strain variation in laboratory mice (Musmusculus) [47]. Positive signs (+) indicated up-regulation in domesticated populations relative to wild, while negative signs (–) indicate down-regulation. Anasterisk (*) indicates that the direction of differential expression differed among brain regions.a Negative correlation with open field activity; b Positive correlation with distance traveled after ethanol administration; c Positive correlation withelectroconvulsive threshold; d Negative correlation with electroconvulsive threshold; e Positive correlation with open field activity.
Drew et al. BMC Genomics 2012, 13:323 Page 7 of 13http://www.biomedcentral.com/1471-2164/13/323
independent alterations in different pathways thatachieve similar phenotypic effects. If this is the case,each of our domesticated zebrafish populations wouldhave different genes associated with behavioral variation,and these genes would be lost among the large numberof genes varying among populations and therefore un-detectable in our comparison. Alternatively, evolution ofthese behavioral phenotypes may involve only a fewgenes or pathways to achieve the behavioral variationsobserved here. In our study, the number of genes asso-ciated with domestication in zebrafish is comparable tothat associated with within-population behavioral vari-ation in other fish species, such as differences between
dominant and subordinate cichlids (Astatotilapia bur-toni, 171 genes, [103]) and between sneaker and migra-tory males in Atlantic salmon (Salmo salar, 432 genes,[34]). This suggests that behavioral variation can beassociated with alterations in the expression of relativelyfew genes in the brain. In addition, identification ofgenes associated with domestication in multiple verte-brate species may indicate convergent evolution of a fewkey molecular pathways during domestication. Fullevaluation of these hypotheses is beyond the scope ofour study and would require more comprehensive ana-lyses using both multiple populations and multiplespecies. However transcriptome variation among
Drew et al. BMC Genomics 2012, 13:323 Page 8 of 13http://www.biomedcentral.com/1471-2164/13/323
populations can be substantial and should be given care-ful consideration when designing genomic analyses ofbehavior and other traits.
MethodsZebrafish strainsWe used zebrafish from four distinct strains for ourexperiments. Two of these strains have been reared incaptivity for more than thirty generations each [9,43,44].The Scientific Hatcheries strain (SH) was originallyobtained from a commercial breeder (Scientific Hatcher-ies, Huntington, CA) and reared in our laboratory forthree generations prior to the experiment. It is difficultto determine the total number of generations for whichthis strain has been in captivity, but it is known to be atleast thirty. The TM1 strain was founded from a petstore population and reared for 24 generations at theUniversity of Miami [66] and a further six generationsprior to the experiment at the University of Idaho. TheTM1 strain is GFP transgenic using a β-actin promoter[66]. Two additional strains, Nadia and Gaighata, wererecently derived from wild populations in India. TheNadia strain was originally collected in India in 1999. Atthe time of this study, the strain had been reared in thelaboratory for six generations, remaining qualitativelysimilar to the original wild collections [9,43,44]. TheGaighatta strain was collected in India in 2005, and wasin its first generation of lab rearing at the time of thisstudy.Prior to the experiment, all zebrafish were reared in a
recirculating zebrafish facility at the University of Idaho,designed by Aquaneering Inc. (San Diego, CA). Fishwere feed twice daily with a combination of commercialflake food and Artemia nauplii. Temperature of the facil-ity was maintained at 28 °C with a constant 14 h light:10 h dark cycle. These rearing conditions were main-tained during the behavior assays. All procedures involv-ing animals were approved by the University of IdahoAnimal Care and Use Committee.
Behavior assaysSixteen adult fish (4 to 6 months old) from each strainwere randomly assigned to 1-L aquaria (22 cm long,15 cm high, 5 cm wide), one fish per aquarium. Theaquaria were delimited into six 2-cm vertical zones usingthin twine tied across the front of the entire row ofaquaria. Fish were visually isolated by placing paper bar-riers between aquaria. Each aquarium was labeled with aunique numerical identifier so that information regardingstrain and sex was unknown to the observer. The fishwere then allowed to acclimatize overnight. Starting thenext day, behaviors were scored by a single observer, un-aware of the strain identity of each fish, three times perday for 10 days (30 observation periods per individual
fish). Observations of behavior were conducted at 0830hours (one hour prior to the morning feeding), 1230hours, and 1630 hours (one hour after the afternoonfeeding) following methods developed in our laboratory[43,46]. Briefly, each fish was observed at the eye level ofthe observer from a distance of 0.5 m for a period ofthree seconds, and its vertical and horizontal locationwas recorded three times at one second intervals. Verti-cal location was coded as an integer representing the ver-tical zone occupied by the fish (1 = top, 6 = bottom); thefinal “Vertical Depth” score for each individual was com-puted as the mean across all 30 observation periods. Thehorizontal location of the fish was recorded as a binaryvariable, with 1 indicating the fish was within one bodylength of the front of the tank and 0 indicating the fishwas not. “Horizontal Position” was calculated as meanhorizontal location across all 30 observations and is anestimate of the proportion of time the animal spentwithin one body length of the front of the tank, nearestthe human observer, over the course of the experiment.All behavior experiments were performed in a commonrearing environment experimental design in which ex-treme care was taken to expose all fish to identical rear-ing conditions. These behaviors have been shown to haverepeatabilities between 0.4 and 0.6 [46].Sex of each fish was determined by inspection of ex-
ternal sex characteristics. Our goal was to test equalnumbers of males and females from each strain; how-ever, the final experiment was slightly imbalanced due tounequal sex ratios in the Nadia (male-biased) and SH(female-biased) strains. This did not affect our behav-ioral analyses, as we detected no differences in behaviorbetween the sexes (data not shown).All behavior data were analyzed using SAS, version 9.1
(SAS Institute, Cary, NC). We tested the effect of strainon behavior phenotypes using one-way Analysis of Vari-ance (ANOVA) with the GLM procedure. The modelincluded Sex, Domestication history, and Strain nestedwithin Domestication history as fixed effects in themodel. The residuals were visually examined to ensurethat the assumption of normality was not violated.
Tissue isolation and RNA extractionAfter behavior assays were completed, fish wereremoved from the individual tanks and placed in one ofsixteen 3-L group tanks. Four fish of the same sex andstrain were assigned to each tank, resulting in four repli-cate tanks per strain. In the case of strains with biasedsex ratios (see above), some tanks contained either 3 or5 fish. The fish remained in these tanks during theperiod between collection of behavioral data and isola-tion of tissues for microarray analysis (one week).On the sampling day, each fish was anesthetized in
170 mg L−1 tricaine methanesulfonate (MS222, Western
Drew et al. BMC Genomics 2012, 13:323 Page 9 of 13http://www.biomedcentral.com/1471-2164/13/323
Chemical Inc., Ferndale, WA), briefly blotted on a papertowel, and rapidly measured for standard length andbody mass. The brain was then quickly removed andhomogenized in TRIzol (Invitrogen, Carlsbad, CA).Brains from all individuals in a tank were homogenizedtogether, for a total of two biological replicate pools persex per strain (16 microarrays total). Total RNA wasthen extracted using the TRIzol method following manu-facturer’s protocol. RNA quality was confirmed using gelelectrophoresis and visual spectrophotometry using aNanodrop spectrophotometer. All samples had 260/280 nm absorbance ratios between 1.85 and 2.05, and260/230 nm absorbance ratios greater than 0.85.
Microarray hybridizationFor each array, 10 μg of total RNA were converted tocDNA. Biotinylated cRNA was then produced in vitrousing the GeneChip expression 3′ amplification one-cycle target labeling kit (Affymetrix, Santa Clara, CA,USA). Affymetrix Zebrafish Genome Arrays (~14,900transcripts) were hybridized with fragmented biotiny-lated cRNA for 16 h at 45 °C with constant rotation(45 rpm), and processed using the Affymetrix GeneChipFluidic Station 450. Streptavidin-conjugated phycoeryth-rin (SAPE) was used for staining, followed by amplifica-tion using a biotinylated anti-streptavidin antibody. Thiswas followed by another round of SAPE prior to scan-ning using a GeneChip Scanner 3000 (Affymetrix). Allmicroarray procedures were performed at the GenomicsCore Facility of the Center for Reproductive Biology atWashington State University (Pullman, WA).
Statistical analysis of microarray dataCEL files containing raw data were then processed andanalyzed using R software and Bioconductor packages[104,105]. These CEL files have been deposited with theNCBI Gene Expression Omnibus (GEO, Accession:GSE38729, http://www.ncbi.nlm.nih.gov/geo). Microarrayhybridization data were examined for physical anomalieson the chip by pseudochip and residual error visualiza-tions. Quality assurance of microarray data was com-pleted using the affyQAReport function from theBioconductor package affyQCReport. Hybridization andhousekeeping controls, RNA degradation, sample clus-tering, NUSE plots, LPE plots, and RLE plots all showedhigh quality data (not shown) and no chips wereremoved. The arrays were then pre-processed using theRobust Multi-array Average (RMA) procedure [106-108]using the affy package [109]. Next, unexpressed and lowvariability genes were removed by unbiased filtering.Affymetrix present-marginal-absent (PMA) calls weredetermined using a P-value cut off for absent of greaterthan 0.04 and present less than 0.04; marginal calls weretreated as absent. Unexpressed genes were then defined
as having a signal less than the expression value at which99 % of genes were called as absent across all samples. Afilter on interquartile range was also applied to removegenes with low variability. Genes with an interquartilerange of less than 0.5 across all chips in the experimentwere excluded, reducing the dataset further to 7,958genes.Signal intensities were also examined at the probe level
to identify single feature polymorphisms (SFPs), differ-ences at the probe level due to genetic polymorphismsrather than expression differences, which may also im-pact computed expression values. Briefly, in R using pre-viously described methods [61], the RMA normalizedexpression estimate for each probe set was subtractedfrom background corrected and normalized expressionlevels at individual probes within the probe set. Normal-ized residuals were analyzed using significance analysisof microarrays (SAM) [110] within the siggenes packageto detect features with a significant effect for strain(FDR adjusted α < 0.01). A total of 3,199 genes with sig-nificant SFPs were then removed from the analysis.The Linear Models for Microarray Data (limma) pack-
age was then used to perform differential expressionanalysis on the filtered gene list using a linear model onlog2 signal values with an empirical Bayes correction tothe variance [64,65]. Comparisons of interest wereextracted through contrasts, and P-values were correctedfor multiple comparisons using the Benjamini andHochberg method (FDR= 5 %) [111]. The data were ini-tially analyzed with a fully crossed factorial model ofStrain and Sex. However, because the Sex and inter-action terms were not significant for the vast majority ofgenes (see Results), we also tested for differential expres-sion among strains using a model that excluded sex. Theeffect of domestication history was tested using contrastsbetween wild and domesticated strains.Functional analyses of the resulting gene lists were
performed using DAVID version 6.7 [67,68]. Functionalcategories were evaluated against the probability thatthey appeared in lists of differentially expressed genes atrandom based on their representation in the full list ofgenes that were classified as expressed in the zebrafishbrain in our analysis. Functional classifications consid-ered in the analysis included gene ontologies (GOs,[112]), COG ontologies, protein domains from PIRsuperfamilies, Interpro, and SMART databases, KEGGpathways, SP PIR keywords, and Up Seq features. Ana-lysis of gene ontologies used the “FAT” option which fil-ters the output, removing upper level GOs primarilyfrom the top five levels of the hierarchy, in favor of morespecific GOs that are often more informative. Categorieswere considered overrepresented if the EASE score wasless than 0.05. We also report P-values adjusted for mul-tiple tests using the Benjamini-Hochberg correction
Drew et al. BMC Genomics 2012, 13:323 Page 10 of 13http://www.biomedcentral.com/1471-2164/13/323
[111]. The Functional Annotation Clustering tool wasused to identify categories with overlapping lists of dif-ferentially expressed genes.
qRT-PCR validationTechnical validation of microarray results was per-formed using qRT-PCR on the sixteen sample poolsused in the microarray analysis. Six genes were selectedin order to represent multiple patterns of expression, in-cluding genes that differed among strains, between wildand domesticated strains, or between the sexes. The pri-mer sequences for these genes are provided in Add-itional file 4. For each sample, 400 ng total RNA wereconverted to cDNA in a 20 μl total volume containing100 ng random primers (Invitrogen, Carlsbad, CA),0.5 mM dNTP, 0.05 M DTT, 1X SuperScript reactionbuffer, and SuperScript II reverse transcriptase (100 U;Invitrogen). The resulting cDNA was diluted 1:5 with TE(pH 8) and used as template for qRT-PCR using SYBRW-Green PCR Master Mix (Applied Biosystems, FosterCity, CA) on an ABI 7900HT Fast Real-Time PCR Sys-tem, following the manufacturer’s protocol. Specificity ofthe qRT-PCR was verified through melting curve ana-lysis. β actin was used as a reference gene because ex-pression of this gene did not differ among strains in themicroarray analysis. Standard curves and negative con-trols were included for both target and reference geneson every plate. Standard curves consisted of a 1:4 dilu-tion series of a cDNA pool created from all 16 samples.qRT-PCR data were analyzed using mixed model ana-
lysis of covariance (ANCOVA) using the lm function inR. This approach analyzed expression of the target gene(CTs) while simultaneously normalizing expression by in-cluding expression of the reference gene (CTs) as a cov-ariate in the model [88,113]. We employed a fullycrossed factorial model using the main effects of Strainand Sex. When the effect of Strain was significant, pair-wise comparisons were performed using Tukey’s Studen-tized Range test.
Additional files
Additional file 1: Microarray analysis revealed 1,752 probe sets thatdiffered significantly in expression among strains of zebrafish(Danio rerio).
Additional file 2: Functional categories overrepresented amonggenes differentially expressed among strains of zebrafish (Daniorerio), revealed by DAVID analysis.
Additional file 3: Microarray analysis revealed 112 probe sets thatdiffered significantly between domesticated and wild zebrafishstrains.
Additional file 4: Genes and primers for validation of microarrayresults with quantitative Real-Time PCR (qRT-PCR).
Competing interestsThe authors have no competing interests.
Authors’ contributionsBDR conceived and designed the experiment. BDR and RED drafted themanuscript. EJC reared fish and collected behavior data. EJC and REDprepared RNA samples for microarray analysis. RED, EJC, SB, and SMWperformed the qRT-PCR validations. MLS, BDR and RED performed statisticalanalyses. All authors read and approved the final manuscript.
AcknowledgementsThe authors thank Mary Oswald, Kevin Kelliher, Scott Nuismer, and DeborahStenkamp for discussion and comments on previous versions of themanuscript, and Derek Pouchnik for his help with microarray analyses. Wealso thank Patt Gibbs for originally providing us with a breeding stock of theTM1 strain, and Deepak Nopany and John Godwin for collection of theGaighatta strain. This work was supported by the NSF-Idaho EPSCoR Programand by the National Science Foundation under award numbers EPS-0132626and EPS-0447689 (BDR) and IOS-0818904 (BDR and RED). Participation by SWwas supported by the National Science Foundation REU grant (EEC-0648202)awarded to R. Wells (University of Idaho). The University of Idaho zebrafishfacility was constructed with funding from the National Institutes of HealthGrant # P20 RR016448 from the COBRE Program of the National Center forResearch Resources.
Author details1Department of Biological Sciences and Program in Bioinformatics andComputational Biology, University of Idaho, Moscow, ID 83844, USA.2Department of Biology and Program in Biomedical Engineering andBiotechnology, University of Massachusetts—Dartmouth, North Dartmouth,MA 02747, USA. 3Department of Computer Science and Program inBioinformatics and Computational Biology, University of Idaho, Moscow, ID83844, USA.
Received: 9 February 2012 Accepted: 28 June 2012Published: 20 July 2012
References1. Price EO: Behavioral genetics and the process of animal domestication. In
Genetics and the behavior of domestic animals. Edited by Grandin T.Academic Press: San Diego; 1998:41–65.
2. Price EO: Behavioral development in animals undergoing domestication.Applied Animal Behaviour Science 1999, 65(3):245–271.
3. Waples RS: Dispelling some myths about hatcheries. Fisheries 1999,24(2):12–21.
4. Devlin RH, Biagi CA, Yesaki TY, Smailus DE, Byatt JC: Growth ofdomesticated transgenic fish. Nature 2001, 409(6822):781–782.
5. Fleming IA, Agustsson T, Finstad B, Johnsson JI, Björnsson BT: Effects ofdomestication on growth physiology and endocrinology of Atlanticsalmon (Salmo salar). Can J Fish Aquat Sci 2002, 59(8):1323–1330.
6. Johnsson JI, Petersson E, Jönsson E, Björnsson BT, Järvi T: Domesticationand growth hormone alter antipredator behaviour and growth patternsin juvenile brown trout, Salmo trutta. Can J Fish Aquat Sci 1996, 53(7):1546–1554.
7. Künzl C, Sachser N: The behavioral endocrinology of domestication: acomparison between the domestic guinea pig (Cavia aperea f. porcellus)and its wild ancestor, the cavy (Cavia aperea). Horm Behav 1999,35(1):28–37.
8. Woodward CC, Strange RJ: Physiological stress responses in wild andhatchery-reared rainbow trout. Trans Am Fish Soc 1987, 116(4):574–579.
9. Oswald M, Robison BD: Strain-specific alteration of zebrafish feedingbehavior in response to aversive stimuli. Can J Zool 2008,86(10):1085–1094.
10. Berejikian BA, Mathews SB, Quinn TP: Effects of hatchery and wild ancestryand rearing environments on the development of agonistic behavior insteelhead trout (Oncorhynchus mykiss) fry. Can J Fish Aquat Sci 1996,53(9):2004–2014.
11. Johnsson JI, Abrahams MV: Interbreeding with domestic strain increasesforaging under threat of predation in juvenile steelhead trout(Oncorhynchus mykiss): an experimental study. Can J Fish Aquat Sci 1991,48:243–247.
12. Harri M, Mononen J, Ahola L, Plyusnina I, Rekila T: Behavioural andphysiological differences between silver foxes selected and not selectedfor domestic behaviour. Animal Welfare 2003, 12(3):305–314.
Drew et al. BMC Genomics 2012, 13:323 Page 11 of 13http://www.biomedcentral.com/1471-2164/13/323
13. Huntingford FA: Implications of domestication and rearing conditions forthe behaviour of cultivated fishes. J Fish Biol 2004, 65A(S1):122–142.
14. Jensen P, Andersson L: Genomics meets ethology: A new route tounderstanding domestication, behavior, and sustainability in animalbreeding. Ambio 2005, 34(4–5):320–324.
15. Britten RJ, Davidson EH: Gene regulation for higher cells: a theory. Science1969, 165(3891):349–357.
16. Fay JC, Wittkopp PJ: Evaluating the role of natural selection in theevolution of gene regulation. Heredity 2008, 100(2):191–199.
17. Whitehead A, Crawford DL: Variation within and among species ingene expression: raw material for evolution. Mol Ecol 2006,15(5):1197–1211.
18. Fay JC, McCullough HL, Sniegowski PD, Eisen MB: Population geneticvariation in gene expression is associated with phenotypic variation inSaccharomyces cerevisiae. Genome Biol 2004, 5(4):R26.
19. Hutter S, Saminadin-Peter SS, Stephan W, Parsch J: Gene expressionvariation in African and European populations of Drosophilamelanogaster. Genome Biol 2008, 9(1):R12.
20. Giger T, Excoffier L, Amstutz U, Day PJR, Champigneulle A, Hansen MM,Kelso J, Largiadèr CR: Population transcriptomics of life-history variationin the genus Salmo. Mol Ecol 2008, 17(13):3095–3108.
21. Oleksiak MF, Churchill GA, Crawford DL: Variation in gene expressionwithin and among natural populations. Nat Genet 2002, 32(2):261–266.
22. Roberge C, Einum S, Guderley H, Bernatchez L: Rapid parallel evolutionarychanges of gene transcription profiles in farmed Atlantic salmon. MolEcol 2006, 15(1):9–20.
23. Townsend JP, Cavalieri D, Hartl DL: Population genetic variation ingenome-wide gene expression. Mol Biol Evol 2003, 20(6):955–963.
24. Whitehead A, Crawford DL: Variation in tissue-specific gene expressionamong natural populations. Genome Biol 2005, 6(2):R13.
25. Spielman RS, Bastone LA, Burdick JT, Morley M, Ewens WJ, Cheung VG:Common genetic variants account for differences in gene expressionamong ethnic groups. Nat Genet 2007, 39(2):226–231.
26. Storey JD, Madeoy J, Strout JL, Wurfel M, Ronald J, Akey JM: Gene-expression variation within and among human populations. Am J HumGenet 2007, 80(3):502–509.
27. Brem RB, Kruglyak L: The landscape of genetic complexity across 5,700gene expression traits in yeast. Proc Natl Acad Sci USA 2005,102(5):1572–1577.
28. Morley M, Molony CM, Weber TM, Devlin JL, Ewens KG, Spielman RS,Cheung VG: Genetic analysis of genome-wide variation in human geneexpression. Nature 2004, 430(7001):743–747.
29. Roberge C, Guderley H, Bernatchez L: Genomewide identification of genesunder directional selection: gene transcription QST scan in divergingAtlantic salmon subpopulations. Genetics 2007, 177:1011–1022.
30. Whiteley AR, Derome N, Rogers SM, St-Cyr J, Laroche J, Labbe A, Nolte A,Renaut S, Jeukens J, Bernatchez L: The phenomics and expressionquantitative trait locus mapping of brain transcriptomes regulatingadaptive divergence in lake whitefish species pairs (Coregonus sp.).Genetics 2008, 180(1):147–164.
31. Landry CR, Townsend JP, Hartl DL, Cavalieri D: Ecological and evolutionarygenomics of Saccharomyces cerevisiae. Mol Ecol 2006, 15(3):575–591.
32. Larsen PF, Nielsen EE, Williams TD, Hemmer-Hansen J, Chipman JK,Kruhøffer M, Grønkjær P, George SG, Dyrskjøt L, Loeschcke V: Adaptivedifferences in gene expression in European flounder (Platichthys flesus).Mol Ecol 2007, 16(22):4674–4683.
33. Whitehead A, Crawford DL: Neutral and adaptive variation in geneexpression. Proc Natl Acad Sci USA 2006, 103(14):5425–5430.
34. Aubin-Horth N, Landry CR, Letcher BH, Hofmann HA: Alternative lifehistories shape brain gene expression profiles in males of the samepopulation. Proceedings of the Royal Society of London, Series B 2005,272(1573):1655–1662.
35. Lindberg J, Bjornerfeldt S, Saetre P, Svartberg K, Seehuus B, Bakken M, Vila C,Jazin E: Selection for tameness has changed brain gene expression insilver foxes. Curr Biol 2005, 15(22):R915–R916.
36. Saetre P, Lindberg J, Leonard JA, Olsson K, Pettersson U, Ellegren H,Bergström TF, Vilà C, Jazin E: From wild wolf to domestic dog: geneexpression changes in the brain. Mol Brain Res 2004, 126(2):198–206.
37. Tymchuk W, Sakhrani D, Devlin R: Domestication causes large-scale effectson gene expression in rainbow trout: analysis of muscle, liver and braintranscriptomes. Gen Comp Endocrinol 2009, 164(2–3):175–183.
38. Gerlai R: Zebrafish: an uncharted behavior genetic model. Behav Genet2003, 33(5):461–468.
39. Guo S: Linking genes to brain, behavior and neurological diseases: whatcan we learn from zebrafish? Genes Brain Behav 2004, 3(2):63–74.
40. Sison M, Cawker J, Buske C, Gerlai R: Fishing for genes influencingvertebrate behavior: zebrafish making headway. Lab Anim 2006,35(5):33–39.
41. Tropepe V, Sive HL: Can zebrafish be used as a model to study theneurodevelopmental causes of autism? Genes Brain Behav 2003,2(5):268–281.
42. Wright D, Rimmer LB, Pritchard VL, Krause J, Butlin RK: Inter and intra-population variation in shoaling and boldness in the zebrafish (Daniorerio). Naturwissenschaften 2003, 90(8):374–377.
43. Benner MJ, Drew RE, Hardy RW, Robison BD: Zebrafish (Danio rerio) varyby strain and sex in their behavioral and transcriptional responses toselenium supplementation. Comp Biochem Physiol A Mol Integr Physiol2010, 157(4):310–318.
44. Robison BD, Rowland W: A potential model system for studying thegenetics of domestication: behavioral variation among wild anddomesticated strains of zebra danio (Danio rerio). Can J Fish Aquat Sci2005, 62(9):2046–2054.
45. Wright D, Nakamichi R, Krause J, Butlin RK: QTL analysis of behavioral andmorphological differentiation between wild and laboratory zebrafish(Danio rerio). Behav Genet 2006, 36(2):271–284.
46. Robison BD, Singer M, Benner MJ, Oswald ME: A high throughput andinexpensive assay for anxiety related behaviors in the zebrafish, basedon place preference and latency to feed. In Zebrafish Protocols forNeurobehavioral Research. Edited by Kalueff AV, Stewart AM. New York, NewYork: Humana Press; in press.
47. Letwin NE, Kafkafi N, Benjamini Y, Mayo C, Frank BC, Luu T, Lee NH, ElmerGI: Combined application of behavior genetics and microarray analysisto identify regional expression themes and gene–behavior associations.J Neurosci 2006, 26(20):5277–5287.
48. Reinhardt UG: Selection for surface feeding in farmed and sea-ranchedmasu salmon juveniles. Trans Am Fish Soc 2001, 130(1):155–158.
49. Weber ED, Fausch KD: Interactions between hatchery and wild salmonidsin streams: differences in biology and evidence for competition. Can JFish Aquat Sci 2003, 60(8):1018–1036.
50. Hamilton IM, Dill LM: Monopolization of food by zebrafish increases inrisky habitats. Can J Zool 2002, 80(12):2164–2169.
51. Rehnberg BG, Smith JF: The influence of alarm substance and shoal sizeon the behavior of zebra danios. J Fish Biol 1988, 33(1):155–163.
52. Iguchi K, Matsubara N, Hakoyama H: Behavioural individuality assessedfrom two strains of cloned fish. Anim Behav 2001, 61(2):351–356.
53. Sundström LF, Devlin RH, Johnsson JI, Biagi CA: Vertical position reflectsincreased feeding motivation in growth hormone transgenic cohosalmon (Oncorhynchus kisutch). Ethology 2003, 109(8):701–712.
54. Egan RJ, Bergner CL, Hart PC, Cachat JM, Canavello PR, Elegante MF,Elkhayat SI, Bartels BK, Tien AK, Tien DH, et al: Understanding behavioraland physiological phenotypes of stress and anxiety in zebrafish. BehavBrain Res 2009, 205(1):38–44.
55. Bachman RA: Foraging behaviour of free-ranging wild and hatcherybrown trout in a stream. Trans Am Fish Soc 1984, 113(1):1–31.
56. Lucas MD, Drew RE, Wheeler PA, Verrell PA, Thorgaard GH: Behavioraldifferences among rainbow trout clonal lines. Behav Genet 2004,34(3):355–365.
57. Moyle PB: Comparative behavior of young brook trout of domestic andwild origin. Progressive Fish-Culturist 1969, 31(1):51–59.
58. Vincent RE: Some influences of domestication upon three stocks ofbrook trout (Salvelinus fontinalis Mitchill). Trans Am Fish Soc 1960,89(1):35–52.
59. Yamamoto T, Reinhardt UG: Dominance and predator avoidance indomesticated and wild masu salmon Oncorhynchus masou. FisheriesScience 2003, 69(1):88–94.
60. Biro PA, Abrahams MV, Post JR, Parkinson EA: Behavioural trade-offsbetween growth and mortality explain evolution of submaximal growthrates. J Anim Ecol 2006, 75(5):1165–1171.
61. Coram TE, Settles ML, Wang M, Chen X: Surveying expression levelpolymorphism and single-feature polymorphism in near-isogenic wheatlines differing for the Yr5 stripe rust resistance locus. Theor Appl Genet2008, 117(3):401–411.
Drew et al. BMC Genomics 2012, 13:323 Page 12 of 13http://www.biomedcentral.com/1471-2164/13/323
62. Gilad Y, Rifkin SA, Bertone P, Gerstein M, White KP: Multi-speciesmicroarrays reveal the effect of sequence divergence on geneexpression profiles. Genome Res 2005, 15(5):674–680.
63. Xu WW, Cho S, Yang SS, Bolon Y-T, Bilgic H, Jia H, Xiong Y, Muehlbauer GJ:Single-feature polymorphism discovery by computing probe affinityshape powers. BMC Genomics 2009, 10:48.
64. Smyth GK: Linear models and empirical Bayes methods for assessingdifferential expression in microarray experiments. Stat Appl Genet Mol Biol2004, 3(1):3.
65. Smyth GK: Limma: linear models for microarray data. In Bioinformatics andComputational Biology Solutions using R and Bioconductor. Edited byGentleman R, Carey V, Dudoit S, Irizarry R, Huber W. New York: Springer;2005:397–420.
66. Gibbs PDL, Schmale MC: GFP as a genetic marker scorable throughoutthe life cycle of transgenic zebra fish. Marine Biotechnol 2000, 2(2):107–125.
67. Dennis G, Sherman BT, Hosack DA, Yang J, Gao W, Lane HC, Lempicki RA:DAVID: Database for Annotation, Visualization, and Integrated Discovery.Genome Biol 2003, 4(9):R60.
68. Huang DW, Sherman BT, Lempicki RA: Systematic and integrative analysisof large gene lists using DAVID Bioinformatics Resources. Nat Protoc2009, 4(1):44–57.
69. Bänziger C, Soldini D, Schütt C, Zipperlen P, Hausmann G, Basler K: Wntless,a conserved membrane protein dedicated to the secretion of Wntproteins from signaling cells. Cell 2006, 125(3):509–522.
70. Bartscherer K, Pelte N, Ingelfinger D, Boutros M: Secretion of Wnt ligandsrequires Evi, a conserved transmembrane protein. Cell 2006, 125(3):523–533.
71. Korkut C, Ataman B, Ramachandran P, Ashley J, Barria R, Gherbesi N, BudnikV: Trans-synaptic transmission of vesicular Wnt signals through Evi/Wntless. Cell 2009, 139(2):393–404.
72. Salinas PC, Zou Y: Wnt signaling in neural circuit assembly. Annu RevNeurosci 2008, 31:339–358.
73. De Ferrari GV, Moon RT: The ups and downs of Wnt signaling inprevalent neurological disorders. Oncogene 2006, 57(7545):7545–7553.
74. Schweizer U, Schomburg L, Savaskan NE: The neurobiology of selenium:lessons from transgenic mice. J Nutr 2004, 134(4):707–710.
75. Hill KE, Zhou J, McMahan WJ, Motley AK, Atkins JF, Gesteland RF, Burk RF:Deletion of selenoprotein P alters distribution of selenium in the mouse.J Biol Chem 2003, 278(16):13640–13646.
76. Hill KE, Zhou J, McMahan WJ, Motley AK, Burk RF: Neurological dysfunctionoccurs in mice with targeted deletion of the selenoprotein P gene. J Nutr2004, 134(1):157–161.
77. Schomburg L, Schweizer U, Holtmann B, Flohé L, Sendtner M, Köhrle J:Gene disruption discloses role of selenoprotein P in selenium delivery totarget tissues. Biochem J 2003, 370(Pt. 2):397–402.
78. Méplan C, Crosley LK, Nicol F, Beckett GJ, Howie AF, Hill KE, Horgan G,Mathers JC, Arthur JR, Hesketh JE: Genetic polymorphisms in the humanselenoprotein P gene determine the response of selenoprotein markersto selenium supplementation in a gender-specific manner (the SELGENstudy). FASEB J 2007, 21(12):3063–3074.
79. Janz R, Sudhof TC, Hammer RE, Unni V, Siegelbaum SA, Bolshakov VY:Essential roles in synaptic plasticity for synaptogyrin I and synaptophysinI. Neuron 1999, 24:687–700.
80. Janz R, Sudhof TC: Cellugyrin, a novel ubiquitous form of synaptogyrinthat is phosphorylated by pp 60c-src. J Biol Chem 1998, 273(5):2851–2857.
81. Schmitt U, Tanimoto N, Seeliger M, Schaeffel F, Leube RE: Detection ofbehavioral alterations and learning deficits in mice lackingsynaptophysin. Neuroscience 2009, 162:234–243.
82. Thome J, Pesold B, Baader M, Hu M, Gewirtz JC, Duman RS, Henn FA: Stressdifferentially regulates synaptophysin and synaptotagmin expression inhippocampus. Biol Psychiatry 2001, 50:809–812.
83. Gao Y, Bezchlibnyk YB, Sun X, Wang J-F, McEwen BS, Young LT: Effects ofrestraint stress on the expression of proteins involved in synaptic vesicleexocytosis in the hippocampus. Neuroscience 2006, 141:1139–1148.
84. Carvalho-Netto EF, Myers B, Jones K, Solomon MB, Herman JP: Sexdifferences in synaptic plasticity in stress-responsive brain regionsfollowing chronic variable stress. Physiol Behav 2011, 104:242–247.
85. Salonius K, Iwama GK: Effects of early rearing environment on stressresponse, immune function, and disease resistance in juvenile coho
(Oncorhynchus kisutch) and chinook salmon (O. tshawytscha). Can J FishAquat Sci 1993, 50:759–766.
86. Fan J, Liu J, Culty M, Papadopoulos V: Acyl-coenzyme A binding domaincontaining 3 (ACBD3; PAP7; GCP60): An emerging signaling molecule.Prog Lipid Res 2010, 49:218–234.
87. Santos EM, Kille P, Workman VL, Paull GC, Tyler CR: Sexually dimorphicgene expression in the brains of mature zebrafish. Comp Biochem PhysiolA Mol Integr Physiol 2008, 149(3):314–324.
88. Robison BD, Drew RE, Murdoch GK, Powell M, Rodnick KJ, Settles M, StoneD, Churchill E, Hill RA, Papasani MR, et al: Sexual dimorphism in hepaticgene expression and the response to dietary carbohydrate manipulationin the zebrafish (Danio rerio). Comp Biochem Physiol Part D GenomicsProteomics 2008, 3(2):141–154.
89. Santos EM, Workman VL, Paull GC, Filby AL, Van Look KJW, Kille P, Tyler CR:Molecular basis of sex and reproductive status in breeding zebrafish.Physiol Genomics 2007, 30(2):111–122.
90. Rinn JL, Snyder M: Sexual dimorphism in mammalian gene expression.Trends Genet 2005, 21(5):298–305.
91. Reimers M, Heilig M, Sommer WH: Gene discovery inneuropharmacological and behavioral studies using Affymetrixmicroarray data. Methods 2005, 37(3):219–228.
92. Palfreyman MT, Jorgensen EM: Roles of SNARE proteins in synaptic vesiclefusion. In Molecular Mechanisms of Neurotransmitter Release. Edited by WangZ-W. Totowa, NJ: Humana Press; 2008:35–59.
93. Fujita Y, Shirataki H, Sakisaka T, Asakura T, Ohya T, Kotani H, Yokoyama S,Nishioka H, Matsuura Y, Mizoguchi A, et al: Tomosyn: A syntaxin-1-bindingprotein that forms a novel complex in the neurotransmitter releaseprocess. Neuron 1998, 20(5):905–915.
94. Scales SJ, Hesser BA, Masuda ES, Scheller RH: Amisyn, a novel syntaxin-binding protein that may regulate SNARE complex assembly. J Biol Chem2002, 277(31):28271–28279.
95. Smirnova T, Laroche S, Errington ML, Hicks AA, Bliss TVP, Mallet J:Transsynaptic expression of a presynaptic glutamate receptor duringhippocampal long-term potentiation. Science 1993, 262:433–436.
96. Kudryashova IV, Onufriev MV, Kudryashov IE, Gulyaeva NV: Regulation ofcathepsin B and caspase-3 in long-term plasticity. Neurochemical Journal2009, 3(4):260–266.
97. Huesmann GR, Clayton DF: Dynamic role of postsynaptic caspase-3 andBIRC4 in zebra finch song-response habituation. Neuron 2006, 52:1061–1072.
98. Hubert T, Grimal S, Carroll P, Fichard-Carroll A: Collagens in the developingand diseased nervous system. Cell Mol Life Sci 2009, 66:1223–1238.
99. Su J, Gorse K, Ramirez F, Fox MA: Collagen XIX is expressed byinterneurons and contributes to the formation of hippocampal synapses.J Comp Neurol 2010, 518:229–253.
100. Biagioli M, Pinto M, Cesselli D, Zaninello M, Lazarevic D, Roncaglia P, SimoneR, Vlachouli C, Plessy C, Bertin N, et al: Unexpected expression of α- and β-globin in mesencephalic dopaminergic neurons and glial cells. Proc NatlAcad Sci USA 2009, 106(36):15454–15459.
101. Richter F, Meurers BH, Zhu C, Medvedeva VP, Chesselet M-F: Neuronsexpress hemoglobin a- and b-chains in rat and human brains. J CompNeurol 2009, 515:538–547.
102. Whiteley AR, Bhat A, Martins EP, Mayden RL, Arunachalam M, Uusi-Heikkilä,Ahmed ATA, Shrestha J, Clark M, Stemple D, et al: Population genomics ofwild and laboratory zebrafish (Danio rerio). Mol Ecol 2011, 20(20):4259–4276.
103. Renn SCP, Aubin-Horth N, Hofmann HA: Fish and chips: functionalgenomics of social plasticity in an African cichlid fish. J Exp Biol 2008,211:3041–3056.
104. Gentleman RC, Carey VJ, Bates DM, Bolstad B, Dettling M, Dudoit S, Ellis B,Gautier L, Ge Y, Gentry J, et al: Bioconductor: open software developmentfor computational biology and bioinformatics. Genome Biol 2004,5(10):R80.
105. R Development Core Team: R: A language and environment for statisticalcomputing. Vienna, Austria: R Foundation for Statistical Computing; 2006.
106. Bolstad BM, Irizarry RA, Astrand M, Speed TP: A comparison ofnormalization methods for high density oligonucleotide array databased on bias and variance. Bioinformatics 2003, 19(2):185–193.
107. Irizarry RA, Bolstad BM, Collin F, Cope LM, Hobbs B, Speed TP: Summariesof Affymetrix GeneChip probe level data. Nucleic Acids Res 2003, 31(4):e15.
Drew et al. BMC Genomics 2012, 13:323 Page 13 of 13http://www.biomedcentral.com/1471-2164/13/323
108. Irizarry RA, Hobbs B, Collin F, Beazer-Barclay YD, Antonellis KJ, Scherf U,Speed TP: Exploration, normalization, and summaries of high densityoligonucleotide array probe level data. Biostatistics 2003, 4(2):249–264.
109. Gautier L, Cope L, Bolstad BM, Irizarry RA: affy–analysis of AffymetrixGeneChip data at the probe level. Bioinformatics 2004, 20(3):307–315.
110. Tusher VG, Tibshirani R, Chu G: Significance analysis of microarraysapplied to the ionizing radiation response. Proc Natl Acad Sci USA 2001,98(9):5116–5121.
111. Benjamini Y, Hochberg Y: On the adaptive control of the false discoveryrate in multiple testing with independent statistics. Journal of Educationaland Behavioral Statistics 2000, 25(1):60–83.
112. Gene Ontology Consortium: Gene Ontology: tool for the unification ofbiology. Nat Genet 2000, 25:25–29.
113. Drew RE, Rodnick KJ, Settles M, Wacyk J, Churchill E, Powell MS, Hardy RW,Murdoch GK, Hill RA, Robison BD: Effect of starvation on transcriptomes ofbrain and liver in adult female zebrafish (Danio rerio). Physiol Genomics2008, 35(3):283–295.
doi:10.1186/1471-2164-13-323Cite this article as: Drew et al.: Brain transcriptome variation amongbehaviorally distinct strains of zebrafish (Danio rerio). BMC Genomics2012 13:323.
Submit your next manuscript to BioMed Centraland take full advantage of:
• Convenient online submission
• Thorough peer review
• No space constraints or color figure charges
• Immediate publication on acceptance
• Inclusion in PubMed, CAS, Scopus and Google Scholar
• Research which is freely available for redistribution
Submit your manuscript at www.biomedcentral.com/submit