Embed Size (px)
Citation preview

RESEARCH ARTICLE Open Access
Genome-wide profiling of 24 hr dielrhythmicity in the water flea, Daphniapulex: network analysis reveals rhythmicgene expression and enhances functionalgene annotationSamuel S. C. Rund1,2,7,8†, Boyoung Yoo3,9†, Camille Alam2, Taryn Green3, Melissa T. Stephens5, Erliang Zeng3,5,10,11,Gary F. George1,2, Aaron D. Sheppard1,2, Giles E. Duffield1,2, Tijana Milenković1,3,4 and Michael E. Pfrender1,2,6*
Abstract
Background: Marine and freshwater zooplankton exhibit daily rhythmic patterns of behavior and physiology whichmay be regulated directly by the light:dark (LD) cycle and/or a molecular circadian clock. One of the best-studiedzooplankton taxa, the freshwater crustacean Daphnia, has a 24 h diel vertical migration (DVM) behavior wherebythe organism travels up and down through the water column daily. DVM plays a critical role in resource trackingand the behavioral avoidance of predators and damaging ultraviolet radiation. However, there is little informationat the transcriptional level linking the expression patterns of genes to the rhythmic physiology/behavior of Daphnia.
Results: Here we analyzed genome-wide temporal transcriptional patterns from Daphnia pulex collected over a44 h time period under a 12:12 LD cycle (diel) conditions using a cosine-fitting algorithm. We used acomprehensive network modeling and analysis approach to identify novel co-regulated rhythmic genes that havesimilar network topological properties and functional annotations as rhythmic genes identified by the cosine-fittinganalyses. Furthermore, we used the network approach to predict with high accuracy novel gene-functionassociations, thus enhancing current functional annotations available for genes in this ecologically relevant modelspecies. Our results reveal that genes in many functional groupings exhibit 24 h rhythms in their expressionpatterns under diel conditions. We highlight the rhythmic expression of immunity, oxidative detoxification, andsensory process genes. We discuss differences in the chronobiology of D. pulex from other well-characterizedterrestrial arthropods.
Conclusions: This research adds to a growing body of literature suggesting the genetic mechanisms governingrhythmicity in crustaceans may be divergent from other arthropod lineages including insects. Lastly, these resultshighlight the power of using a network analysis approach to identify differential gene expression and provide novelfunctional annotation.
Keywords: Biological networks, Circadian, Diel, Diel Vertical Migration (DVM), Functional enrichment analysis, Geneexpression, Network centrality, Network clustering, Protein function prediction
* Correspondence: [email protected]†Equal contributors1Eck Institute for Global Health, University of Notre Dame, Notre Dame, IN46556, USA2Department of Biological Sciences, University of Notre Dame, Notre Dame,IN 46556, USAFull list of author information is available at the end of the article
© 2016 The Author(s). Open Access This article is distributed under the terms of the Creative Commons Attribution 4.0International License (http://creativecommons.org/licenses/by/4.0/), which permits unrestricted use, distribution, andreproduction in any medium, provided you give appropriate credit to the original author(s) and the source, provide a link tothe Creative Commons license, and indicate if changes were made. The Creative Commons Public Domain Dedication waiver(http://creativecommons.org/publicdomain/zero/1.0/) applies to the data made available in this article, unless otherwise stated.
Rund et al. BMC Genomics (2016) 17:653 DOI 10.1186/s12864-016-2998-2

BackgroundAs organisms progress through their 24 h day, they ex-perience a daily cycle of environmental changes, includ-ing rhythms in temperature, light, predation risk, andresource availability. To respond to these daily environ-mental changes, organisms modulate their biology in arhythmic manner driven by both the coordinated actionof an endogenous circadian pacemaker or clock, as wellas the direct effect of the environmental light:dark cycle(LD cycle) [1–8]. True ‘circadian rhythms’ are thoserhythms that can be observed under constant condi-tions, as opposed to ‘diel’ (or diurnal) rhythms that areobserved under a LD cycle.Examples of time-of-day specific biology observed in
other organisms include increasing olfactory sensitivityprior to times of foraging [9], rhythmic coordination ofdetoxification enzymes [10], and time-of-day specificchanges in susceptibility to immune challenge [11, 12].In the disease vector mosquitoes Anopheles gambiae andAedes aegypti, gene expression data shows that up to20 % of the transcriptome is regulated in a circadianand/or diel manner [4, 8, 13]. Similarly, under both cir-cadian and/or diel conditions, as much as 5 % of thetranscripts expressed in the fruit fly Drosophila melano-gaster head and 4 % in the honeybee Apis mellifera headare rhythmically expressed [14–16].Daphnia has long been a model for ecological investi-
gation largely because of its cosmopolitan distributionand central role in the trophic cascades of freshwaterecosystems [17]. The addition of genome level informa-tion to this well studied ecological model makes it arelevant system for investigating 24 h daily rhythmicbiology in a non-insect arthropod [17–19]. Chronobiologyresearch in Daphnia has focused primarily on behavioral
processes like locomotor activity, daily vertical migration(DVM) through a water column, and mandibular activity(‘feeding’) [20–22]. These phenotypes are all rhythmicunder environmental diel conditions. We highlight inFig. 1 many of the daily environmental rhythms experi-enced by Daphnia species, including temperature, ambi-ent light, and risk of exposure to pathogens and parasites.In Daphnia, DVM is thought to be primarily a predatorand ultraviolet-radiation (UV-R) avoidance behavior [23,24]. DVM has been observed in some, but not all reports,to persist even in the absence of a LD cycle [23, 25].“Preemptive” or “anticipatory” changes in gene regula-
tion and physiology are possible due to the presence of anendogenous cellular molecular circadian clock that pro-vides crucial timing mechanisms in organisms as diverseas cyanobacteria, plants, fungi, insects, and mammals. Thecircadian clock is cell autonomous and at the molecularlevel comprises a series of transcriptional-translationalfeedback loops (TTFLs) whose completion takes approxi-mately 24 h [26]. The genetic underpinning of the meta-zoan circadian clock is highly conserved [27]. However,even within insects that typically have a conserved geneticconstruct with regard to their circadian clock, there issome variation in the arrangement of the TTFL compo-nents that are found in at least four different functionalconfigurations [28, 29]. As genomic investigations expandinto taxonomically diverse arthropods, there is a greaterlikelihood to find additional variation as well as gain an in-creased understanding of the genetic basis of rhythmicity.The investigation of non-model organisms and their
genomes is significantly challenged by a lack of func-tional annotation for many of their protein coding genes.The specific function of many genes, in even well stud-ied organisms, is incomplete. It is not unusual for
Time-of-day
Wat
er d
epth
Decreasing Temperature, Light, UV radiation, and Oxygen
Surface light cycle
Parasites
Fish predation
Daphnia DVM(Daily VerticalMigration)
Fig. 1 Twenty-four hour rhythmic changes in Daphnia’s environment. Daphnia are exposed to different environmental conditions and stressors asthe 24 h day progresses. This variation is a consequence of the daily rising and setting of the sun, the chronobiology of other organisms in theenvironment, and Daphnia’s pattern of diel vertical migration (DVM) through the water column. The sun brings changes in temperature, ambientlight, UV radiation, and increased risk of fish predation (which locate Daphnia visually) in populations found in large bodies of water. Similarly, asDaphnids move down the water column they are exposed to decreasing ambient light of changing wavelengths, and reduced UV radiation,temperature, and oxygen levels. Some parasites of Daphnia live in the sediment at the bottom of water bodies, so risk of being parasitized isincreased at times-of-day the Daphnia are lower in the water column (daytime in populations from large water bodies)
Rund et al. BMC Genomics (2016) 17:653 Page 2 of 20

upward of a third of the genes in any genome to lackfunctional annotation [30, 31]. This lack of functionalannotation is exacerbated in the diverse genomes ofmany newly sequenced organisms that often containlineage-specific genes lacking homology with other as-sembled genomes [19, 31]. The single genome sequenceavailable for the highly diverse lineage of Branchiopodcrustaceans is that of the water flea, Daphnia pulex [19].In excess of one third of the D. pulex genome compriseslineage-specific genes that lack orthologs in othereukaryote genomes and thus lack any functional annota-tion [19]. These two factors, diverse clocks and un-known genes, present significant challenges inunderstanding the rhythmic biology of this species.Here we describe diel transcriptome analysis per-
formed on female D. pulex. Diel as opposed to constant(circadian/ dark:dark) conditions were chosen, as theseconditions are more applicable in the context of existingexperimental data and indeed natural, real-world envi-ronments. This first genome-wide examination ofDaphnia transcriptional rhythms allows us to explore awide breadth of crustacean biochemistry, physiology,and behavior that may be under rhythmic control. Inaddition to an analysis of cyclic behavior using availablestatistical software (JTK_CYCLE [32]), we employed acomprehensive network modeling and analysis approachto validate and discover both orthologous and novelrhythmic gene regulation in D. pulex, as follows.Established approaches to the statistical analysis of gene
expression patterns can provide valuable insights into cel-lular functioning. However, these analyses often ignore thefunctional relationships among genes and miss the oppor-tunity to leverage the patterns of co-expression that resultfrom shared regulatory machinery or complex linkage innetworks of biological processes [33–36]. For this reason,we modeled Daphnia gene expression data as a gene co-expression network, in which nodes correspond to genesand edges link genes with similar expressions [35]. Usingthe resulting network data, we performed comprehensivecomputational analyses to search for genes that sharetopological properties (in the sense that they occupy simi-lar network positions or cluster together) with the rhyth-mic genes identified by independent analysis of theexpression data using JTK_CYCLE. Our goals were to illu-minate the transcriptional signature of rhythmicity in amodel crustacean and develop a network-based analyticalapproach to validate rhythmic genes and infer functionalrelationships for genes lacking functional annotations.
Results and discussionGlobal transcription analysis and JTK_CYCLE analysisTo perform an analysis of D. pulex rhythmic gene ex-pression under laboratory conditions, we profiledgenome-wide expression patterns of mature, egg-bearing
females maintained on a 12:12 LD cycle with abrupt LDtransitions. RNA samples were collected every 4 hoursover 2 days and interrogated using custom high-density12-plex NimbleGen microarrays. Gene expression pro-files were mined for 24 h rhythmic, sinusoidal gene ex-pression patterns using the JTK_CYCLE cosine wave-fitting algorithm [32, 37, 38]. From the 21,002 geneswith expression levels above background in our micro-array experiments, we identified 1,661 genes that wererhythmically expressed using q < 0.1 (p < 0.03) and 22–26 h period length cutoff criteria (See Fig. 2, Additionalfile 1). These genes represent 5.7 % of the total D. pulexgene set, and 7.9 % of the expressed genes. These rhyth-mically expressed genes possess diverse biological func-tions; however, many (14.0 %) of these genes lack anyfunctional annotation (i.e., have no associated orthoDB,KOG, EC, nor GO annotation). Visualizations of top-level GO term annotations of the rhythmically expressedgenes are provided in Fig. 3a and Additional file 2, and acomplete listing is found in Additional file 1. In Fig. 2bwe highlight some of the 1,661 rhythmic genes scoredwith low q-values in the JTK_CYCLE analysis; note thediversity in expression in time-of-peak expression(phase), amplitude of rhythms, and raw-intensity values.For two of these highlighted genes, a salivary C-type lec-tin (JGI_V11_220785) and a β,β-carotene-15,15′-dioxy-genase (JGI_V11_97232) we performed microarrayvalidation using qRT-PCR, see Additional file 3.The medial peak-to-trough fold change of genes deter-
mined to be rhythmic by JTK_CYCLE was 2.06. How-ever, many rhythmically expressed genes had muchhigher daily fold-changes in expression (Fig. 2c). Whilethere were genes with peak expression at all times-of-theday, there were a greater number of genes having a peakexpression during mid-day (~ZT 4 – ZT 8) and mid-night (~ZT 16–20) than at other times-of-the day(Fig. 2c). We report peak time-of-day expression inZeitgeber time (ZT), with ZT 0 defined as the time oflights-on and ZT 12 defined as the time of lights-off.
Network dataWe modeled the temporal gene expression data with agene co-expression network as follows: in the network,nodes are genes, and two nodes are connected by an edgeif the corresponding genes show similar expression pat-terns over time. We studied five different networks con-struction methods using different gene expression“correlation” (i.e., edge weight) measures and differentedge cut-offs [35]. These methods included: 1) signedPearson correlation with top N interactions, 2) absolutePearson correlation with top N interactions, 3) mutual in-formation with top N interactions, 4) intersection of abso-lute Pearson correlation and mutual information with top10 N interactions, and 5) intersection of absolute Pearson
Rund et al. BMC Genomics (2016) 17:653 Page 3 of 20

correlation and mutual information with top 25 N interac-tions) (see Methods). Each of these five methods capturesa different intuition of how well the genes’ expressionlevels “correlate” over time. As such, it should be no sur-prise that some of the networks look different (Fig. 4),have different properties [39] (Additional file 4), and havepairwise intersections that are relatively low (Additionalfile 5). Because of this, we proceeded by analyzing each ofthe five networks individually to reveal novel rhythmicgenes predicted from their network topology or structure.
Network-based prediction of rhythmic genesFor each network, we searched in the given network forthe subset of the 1,661 genes that have been identified as
rhythmic by JTK_CYCLE analysis of the expression data(Additional file 6). Then, we pursued two directions foridentifying new rhythmic genes from network topology.First, we checked if the subset of the 1,661
JTK_CYCLE-identified rhythmic genes that were in thegiven network were statistically significantly “central” or“peripheral” in the network [36, 40], and if so, we identi-fied other genes with similar network positions and pre-dicted these genes as additional rhythmic genes (seeMethods). Here, we used seven popular node centrality,or peripherality, measures, each of which captures some-what complementary information on the network pos-ition of a node [40, 41]: betweenness, closeness,clustering coefficient, degree, eccentricity, graphlet
1 2 3 4 5 6
0
200
400
600
Fold Change
Gen
es
+
Time - of - Day (ZT)4 8 12 16 20
0
10000
20000
30000
40000
500
1000
1500
2000
200
300
400
500
600
2000
3000
4000
5000
4000
6000
8000
10000
3500
4000
4500
5000
5500
6000
0 0 12Time (ZT)12
Exp
ress
ion
-0.30 -0.20 -0.10 0.00 0.10 0.20 0.30
JGI_V11_220785salivary C-type lectin
JGI_V11_223905Chymotrypsin
JGI_V11_97232 JGI_V11_327978unknown
JGI_V11_290631 JGI_V11_260070unknown
0
a b
c
Fig. 2 The Daphnia genome is expressed in a highly rhythmic manner. a Hierarchical clustering of rhythmic Daphnia genes. Yellow indicateshigher expression, and blue indicates lower expression versus the mean value for each gene. All 1,661 Daphnia genes identified as rhythmic byJTK_CYCLE are displayed. The heat map on the right is a continuation of the one on the left. b Example gene expression profiles of select geneswith low JTK_CYCLE q-values. Note the diversity in time-of-peak expression (phase), amplitude of rhythms, and raw-intensity values. Error barsrepresent S.E.M. of technical replicates. For two of these genes, we performed qRT-PCR confirmation, see Additional file 3. c Histograms ofrhythmic gene amplitude (peak-to-trough fold change) and times of peak expression. The 1,661 genes called rhythmic by JTK_CYCLE had amedian fold change of 2.06. However, there are a significant number of rhythmic genes with a greater than 5-fold amplitude in expression. Peaksof transcriptional expression occur at mid-day and mid-night. Day and night are indicated by the horizontal white/black bars. Histogram X-axisvalues reflect the minimum fold change/time-of-day reflected in that bin (i.e. >1, ≥1.5, ≥2.0, ≥2.5, etc)
Rund et al. BMC Genomics (2016) 17:653 Page 4 of 20
degree, and k-coreness centrality. In this way, we pre-dicted 3,475 genes by at least one combination of net-work type and centrality measure to be rhythmic, ofwhich 3,019 were not among the 1,661 JTK_CYCLE-identified rhythmic genes and are thus novel. Each pre-diction was supported by up to 7 combinations of net-work type and centrality measure (out of the 10 possiblecombinations; see Methods).Second, we checked whether the rhythmic genes statisti-
cally significantly grouped (i.e., clustered) together in thenetwork, and if so, we found other genes that clusteredwith them and predicted these genes as additional rhythmicgenes (see Methods) [42–44]. Here, we relied on a popularmethod called Markov clustering algorithm (MCL) [45]. Inthis way, we predicted 445 genes from at least one networkto be rhythmic by the clustering analysis, of which 133(Additional file 1) were not among the 1,661 JTK_CYCLE-identified rhythmic genes and were thus novel. Each predic-tion was supported by up to 3 different networks (out ofthe 3 possible networks, see Methods).
Validation of the novel network-based rhythmicpredictionsOf the entire set of genes in the expression data, 7,262genes were present (i.e., non-isolated) in at least one of
our five networks (Additional file 6) and could be testedas being rhythmically expressed or not. Of the 1,661JTK_CYCLE-identified rhythmic genes, 626 genes werepresent in at least one of our networks (Additional file 6).Recall that we predicted 3,475 and 445 genes by the cen-trality and clustering analysis, respectively, of which 3,019and 133, respectively, were not among the 1,661JTK_CYCLE-identified rhythmic genes and were thusnovel (yet, our network-based predictions significantlyoverlap with the JTK_CYCLE-identified rhythmic genes,with p-values below 2×10⁻¹⁶, which validates the predic-tions). Of all predictions, 387 were common to both thecentrality and clustering analysis (p-value below 2×10⁻¹⁶)and were thus of high-confidence, of which 116 werenovel (Additional file 1). The overlaps of the different genesets are illustrated in Fig. 5a.We provide as comprehensive as possible bioinformat-
ics validation of our novel predictions. First, we validatedthe novel predictions via a functional enrichment ana-lysis. Namely, we split genes from our networks intothree sets: 1) the 626 genes identified as rhythmic usingJTK_CYCLE that were in any of our networks (as posi-tive control or “known” rhythmic genes), 2) our novelpredictions (either the 3019, 133, or 116 predictionsfrom the centrality analysis, the clustering analysis, or
0
100
200
300
400
500
600
Rhythmic, no BF GO termRhythmic, has BF GO term(s)
JTK JTK + Network
JGI
RhythmicDeterminationSource ofGO Terms
organization or biogenesis
multicellular organismal processresponse to stimuluscellular processimmune system processbiological regulationcellular component
metabolic processsignalingbiological adhesionlocalizationsingle-organism process
JGI +Network
1166 1234 1161
495 543 616
0
5000
10000
15000
Exp
ress
ion
Chitinases
JGI_V11_333182JGI_V11_308194
Time (ZT)
5000
10000
15000
JGI_V11_234859JGI_V11_305446
0
5000
10000
15000 Peroxidases
JGI_V11_234105JGI_V11_311082
C-type lectins
0 12 0 12
a b
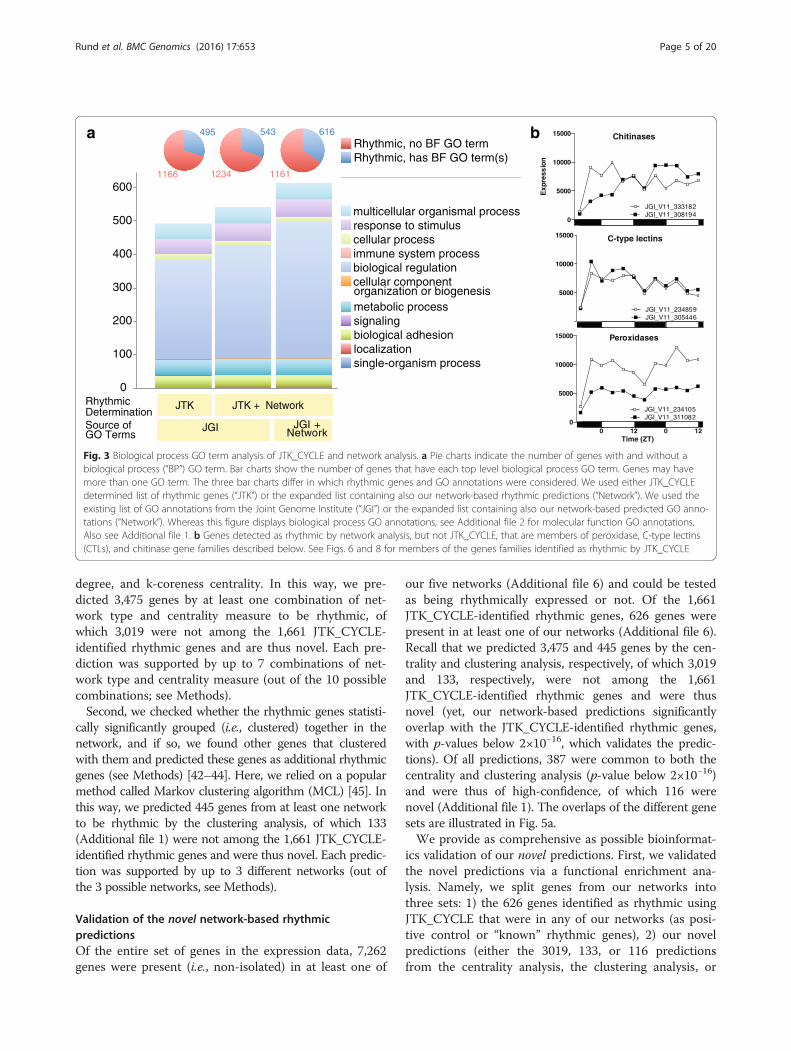
Fig. 3 Biological process GO term analysis of JTK_CYCLE and network analysis. a Pie charts indicate the number of genes with and without abiological process (“BP”) GO term. Bar charts show the number of genes that have each top level biological process GO term. Genes may havemore than one GO term. The three bar charts differ in which rhythmic genes and GO annotations were considered. We used either JTK_CYCLEdetermined list of rhythmic genes (“JTK”) or the expanded list containing also our network-based rhythmic predictions (“Network”). We used theexisting list of GO annotations from the Joint Genome Institute (“JGI”) or the expanded list containing also our network-based predicted GO anno-tations (“Network”). Whereas this figure displays biological process GO annotations, see Additional file 2 for molecular function GO annotations.Also see Additional file 1. b Genes detected as rhythmic by network analysis, but not JTK_CYCLE, that are members of peroxidase, C-type lectins(CTLs), and chitinase gene families described below. See Figs. 6 and 8 for members of the genes families identified as rhythmic by JTK_CYCLE
Rund et al. BMC Genomics (2016) 17:653 Page 5 of 20

both analyses, respectively), and 3) the remaining “nega-tive control” genes that have not been predicted asrhythmic by any approach in our study. Then, we mea-sured the enrichment of Gene Ontology (GO) terms ineach of the three data sets, with the hypothesis that our
novel network-based predictions would be involved inthe same processes (i.e., GO terms) as the JTK_CYCLE-determined rhythmic genes, but not as the negativecontrol genes; and this was exactly what we observed(p-value of 4.4×10⁻⁵ with respect to the hypergeometric
Fig. 4 Visualization of the networks from our study. Illustration of SIGN N (signed Pearson correlation with top N interactions), ABS N (absolutePearson correlation with top N interactions), MI N (mutual information), and ABS-MI-10 N (intersection of absolute Pearson correlation and mutualinformation with top 10 N interactions) networks. Intersection of absolute Pearson correlation and mutual information with top 10 N interactionsis not shown, as it resembles ABS-MI-10 N. In our study, for prediction purposes, we study the networks’ largest connected components. In bluewe show the subset of all genes from the given network that are among the 1,661 rhythmic genes determined using JTK_CYCLE statistical ana-lyses of the expression data. In yellow we show the subset of all genes from the given network that are among the novel network-based pre-dicted rhythmic genes, i.e., network-based predicted rhythmic genes that could not be identified using the JTK_CYCLE statistical analyses. Notethat the differences between some of these networks should not be surprising, since the networks were constructed using different network in-ference approaches. Also, note that the network visualizations are only intended for illustration. One should not rely on visualizations to determinehow meaningful the networks are. For example, what appears to be a group (cluster) of rhythmic genes in the given figure/network might notbe reported as a statistically significantly meaningful cluster by network analysis. Or, what appears to be a single cluster in the figure might bebroken down and reported as multiple clusters by network analysis. Network analysis (rather than visualization) is a systematic and mathematic-ally/computationally non-ambiguously precise way of interpreting the network data
Rund et al. BMC Genomics (2016) 17:653 Page 6 of 20

test, Fig. 5b, Additional file 7). Second, we further vali-dated our novel predictions by searching for them in anindependent set (i.e. set not considered when making thepredictions in the first place) of “known” rhythmic genes.Specifically, we calculated the significance of the overlapbetween our novel network-based predictions and se-quence homologs of rhythmic [8] mosquito genes as“known” rhythmic genes. Fifty homologs of rhythmicmosquito genes were present in at least one of our net-works (anywhere in the given network). Our novel predic-tions captured a statistically significant portion of these 50genes (with p-values of 0.0028, 0.0129, and 0.0452 for ournovel centrality-based, cluster-based, and both centrality-and cluster-based predictions, respectively), unlike the 626genes identified as rhythmic using JTK_CYCLE (p-valueof 0.2591) or the negative control genes (p-value of 0.999).
These encouraging results (genes in our novelnetwork-based prediction set performing similar func-tions as, or significantly overlapping with “known”rhythmic genes) imply the effectiveness of the networkapproach. When combined with the statistical analyses(i.e. JTK_CYCLE) of expression data, this approach wasable to uncover additional biological knowledge com-pared to the statistical analyses alone. Of course, inaddition to the above bioinformatics validation of ournovel predictions, future experimental validation is cer-tainly of interest.
Network-based prediction of novel functional annotationsand their validationWe can use the same network approach as above (i.e.the centrality and clustering analyses) to predict novelfunctional annotations of currently uncharacterizedgenes based on how well these genes group withfunctionally annotated genes. In this context, we firstvalidated the accuracy of the network approach byhiding gene-function associations using leave-one-outcross-validation (see Methods) and measuring how ac-curately we could predict the hidden associations. Wefound that the prediction accuracy of the network ap-proach is 95 % (p-value of 2.2×10⁻¹⁶ with respect tothe hypergeometric test). Given such a high accuracy,we next applied the network approach to currentlyuncharacterized genes to predict their functional an-notations. In this way, we predicted 477 novel gene-function associations spanning 253 uncharacterizedgenes and 33 GO terms. Also, we predicted an add-itional 287 novel associations spanning 121 character-ized genes and 22 GO terms (see Additional file 1).Hence, we demonstrated that our network approachcomplements significantly and with high accuracy thecurrently limited functional annotation data (SeeFig. 3a, Additional file 1, and Additional file 2.). Inthe sections below, we highlight genes of interestfrom various rhythmic gene families. Network analysisrevealed novel rhythmic genes in only three of thesehighlighted gene families, peroxidases, C-type lectins,and chitinases. The profiles of these identified genesare visualized in Fig. 3b.
Rhythmic expression of immune genesA pattern of diel vertical migration (DVM), which servesto reduce exposure to predators and track resources, is awell-documented behavior in many populations ofDaphnia living in large bodies of water. This DVM typ-ically manifests as a downward migration during the dayand an upward migration at night [23]. While there is afitness benefit in terms of predator avoidance and re-source acquisition, this behavior may also cause in-creased exposure to pathogens during the daytime since
271185* 41*
129
116*2903 17
JTK_CYCLE identified genesin all networks combined
Clustering-basedpredictions
Centrality-basedpredictions
06* 0
5
026 15
GO terms enriched in novel network-based predictions
GO terms enriched in negative control genes
GO terms enriched in JTK_CYCLE rhythmic genes
* p value: 4.43 x 10 -5
* p value: 2.2 x 10 -16
b
a
Fig. 5 Validation of our network-based rhythmic gene and GOannotation predictions. a Pairwise overlaps between the 626JTK_CYCLE-derived rhythmic genes that are in any of our networks,the network-based rhythmic genes predicted by the centralityanalysis, and the network-based rhythmic genes predicted by theclustering analysis. Stars next to the overlap values indicate that allthree pairwise overlaps are statistically significant, with p-valuesbelow 2×10⁻¹⁶, which validates our network approach. b Validationof our network-based rhythmic genes in terms of GO term overlapswith positive and negative control genes. Pairwise overlaps ofenriched GO terms between the JTK_CYCLE-identified rhythmicgenes, negative controls, and our novel network-based predictionsproduced by both centrality analysis and the clustering analysis. Alsosee Additional file 7
Rund et al. BMC Genomics (2016) 17:653 Page 7 of 20

many Daphnia parasites tend to live in water body sedi-ments [46]. This observation suggests that there may bean advantage to increasing the transcriptional activity ofgenes involved in immune processes during the daytimewhen Daphnia are lower in the water column to coun-teract the increased time-of-day risk of infection.
Using D. pulex immune system genes identified byMcTaggart et al. [47] and using FlyBase and OrthoDB[48, 49], we identified recognition and signal transduc-tion genes, as well as chitinases that were rhythmicallyexpressed with maximum expression peaking almost ex-clusively in the daytime (Fig. 6a). There was an
CTL
Rec
ogni
tion
Sig
nal
Tra
nsdu
ctio
n
TLR
IMD
Dredd
RelishIMD
Pat
hway
Atta
ck
MelanizationPhagocytosis Antimicrobial Peptides
TEP GNBP
Chitanase Activity
CAS
SVG
-1
0
11
0
-1
-2
0
5
10
15
20 GNBP (JGI_V11_203138)GNBP (JGI_V11_303036)GNBP (JGI_V11_329548)
Nor
m. E
xpre
ssio
n (L
og ) 2
Exp
ress
ion
(10
00s)TEP
TLR
0 12 0 12
Time (ZT)
-1.0
-0.5
0.0
0.5
Nor
m. E
xpre
ssio
n (L
og ) 2
0 0 12
Time (ZT)12
IMDDreddRelish
-2
-1
0
1 CASSVG
Nor
m. E
xpre
ssio
n (L
og ) 2
0 0 12
Time (ZT)120 0 12
Time (ZT)12
-2
-1
0
1
Nor
m. E
xpre
ssio
n (L
og ) 2
chitnase
Nor
m. E
xpre
ssio
n (L
og ) 2a
b c
Fig. 6 Rhythmic expression of Daphnia immune system components. Numerous genes with putative immune functions were found to haverhythmic expression in D. pulex. a The Daphnia immune system can be separated into recognition proteins, signal transduction proteins, andattack proteins and processes. The cartoon illustrates the relationship between these categories. There were a number of rhythmically expressedpathogen recognition genes including two thioester-containing proteins (TEP), nineteen C-type lectins (CTLs), and three gram-negative bacteria-binding proteins (GNBP). Additionally, three membrane-bound toll-like receptors (TLRs) were rhythmically expressed. For signal transduction, fourmembers of the IMD (Immune Deficiency) pathway were also found to be rhythmically expressed: IMD, Dredd, and two Relish paralogs. Expressionis presented as raw florescence values for GNBPs (for visualization purposes). Two additional rhythmic CTLs were identified using network analysisand these are visualized in Fig. 3b. b 32 chitinase (CHT) genes, which may have direct immune functions (as a pathogen-chitinase) were found tohave rhythmic expression. For visualization purposes, the 26 with peak phase between ZT4 – ZT6 are presented. Two additional rhythmicchitinases were identified using network analysis and these are visualized in Fig. 3b. c A scavenger (SVG) gene and three caspases genes (CAS),which may have immune recognition or signal transduction functions, respectably (but these gene classes also serve other roles), were also foundto have rhythmic expression. Day and night for all plots in this figure are indicated by the horizontal white/black bars. Unless otherwise noted,expression in this figure is presented as log2 of median normalized expression
Rund et al. BMC Genomics (2016) 17:653 Page 8 of 20

abundance of extracellular pathogen recognition mol-ecules [i.e., pattern recognition receptors (PRRs);Fig. 6a; Additional file 1]: First, we identified 19 C-type lectins (CTLs), which activate prophenoloxidase/melanization pathways and promote phagocytosis. Six-teen of these peaked between ZT 4–6 and the other3 at the very end of night (~ZT 20-0) (Two add-itional rhythmic CTLs were identified using networkanalysis and these are visualized in Fig. 3b). Next,three gram negative binding proteins (GNBPs) thatactivate Toll and prophenoloxidase/melanization path-ways were found to be rhythmic (JGI_V11_203138,ZT 6; JGI_V11_303036, ZT 6; JGI_V11_329548, ZT18). Finally, we identified two rhythmic thioester-containing proteins (TEPs), which promote phagocyt-osis (JGI_V11_300538, ZT6; JGI_V11_61510, ZT6).There were three paralogs of Toll-like receptors (TLRs)
proteins rhythmically expressed with expression peakingin the morning (JGI_V11_3995, ZT4; JGI_V11_40744,ZT4; JGI_V11_190084, ZT 6; Fig. 6a). These proteinsserve as PRRs (but are transmembrane not extracellularproteins) and as components in the Toll signaling path-way. This observation indicates that the Toll pathway maybe rhythmically upregulated by means of rhythmic expres-sion of GNBPs and TLRs. Similarly, prophenoloxidase ac-tivity/melanization may be rhythmic due to the 24 hrhythmic expression of GNBPs and CTLs. Note the GNBPparalog JGI_V11_329548 had an expression profile thatdid not peak in the morning, but instead in the middle ofthe night (ZT 18). TEPs and CTLs also promote phagocyt-osis, so this immune response may also be regulated in atime-of-day specific manner in D. pulex.The IMD signal transduction pathway in D. pulex
also contained highly rhythmic genes like IMD(JGI_V11_313869, ZT 6), Dredd (JGI_V11_45861, ZT 4),and two Relish homologues (JGI_V11_329057, ZT 6;JGI_V11_62213, ZT 7) (Fig. 6a). This result suggested theIMD immune pathway is more sensitive to activation orwill mount a more robust response in the morning. Inmice, such a phenomenon exists, with expression of Toll-like receptor 9 (TLR9) and subsequent TLR9 mediated in-nate and adaptive immunity under control of the circadianclock [50].Of the 32 chitinases with rhythmic expression, 27 dis-
played peak expression in the morning (Fig. 6b). Sincechitinases can be extracellular they may contribute torhythmic immunity by directly hydrolyzing the cell wallsof chitin-containing pathogens. We note that networkanalysis revealed an additional two rhythmicallyexpressed chitinases (Fig. 3b).The rhythmic nature of many immune genes, which
generally peak in expression during the daytime (60 ofthe 69 rhythmic, as determined by JTK_CYCLE, im-mune genes discussed in this section peak in expression
between ZT2 - ZT8), is consistent with the hypothesisthat resistance to infection may be higher during the daythan the night. Rhythmic levels of extracellular PRRs,chitinases, and IMD signaling pathway componentscould drive this time-of-day difference. A time-of-dayspecific resistance to pathogens has been noted in Dros-ophila and mice [11, 12, 50], but remains to be investi-gated in Daphnia.
Metabolic genes, vesicular-type ATPase subunits, andtRNA synthetases are constitutively expressedOrganisms over a wide taxonomic span ranging frommosquitoes to mice show extensive rhythmic expressionof genes involved in fatty acid (FA) degradation, the cit-ric acid (TCA) cycle, and glycolysis, as well as vesicular-type ATPases (V-ATPase) subunits and aminoacyl-tRNAsynthetases [8, 51]. Surprisingly, neither JTK_CYCLEnor network analysis revealed noteworthy rhythmicity ofgenes involved in these processes in D. pulex. Only afew examples of metabolic genes (as identified on theKEGG Pathway Database [52]) were expressed in arhythmic manner (Fig. 7, Additional file 1). No TCAcycle components were rhythmically expressed despiteall annotated components showing transcriptional activ-ity (Fig. 7). Similarly, of the 31 annotated genes playing arole in fatty acid degradation, only a sterol carrier pro-tein X-related thiolase (JGI_V11_221682, ZT 6) andacyl-coA dehydrogenase (JGI_V11_327246, ZT 6) wererhythmically expressed (Fig. 7). Finally, of 20 genes in-volved in glycolysis, none were rhythmically expressed(Fig. 7). We also do not detect expression rhythms ofany D. pulex V-ATPase subunits (Fig. 7). In contrast, inAn. gambiae, heads genes encoding at least 7 enzymes inthe glycolysis pathway and 5 in the TCA cycle and 9 of12 V-ATPase subunits were rhythmically expressed [8].It is plausible that D. pulex primarily regulates
metabolic gene expression to match available nutrient re-serves and/or ambient temperatures, instead of antici-pating future nutrient levels. Under the resource-rich,temperature controlled, and oxygen-stable laboratoryconditions, it would therefore not be surprising that wedid not detect many rhythmic metabolic genes. RearingDaphnia under cycling temperature conditions or foodresource levels in the laboratory will be required tounderstand if rhythmic metabolic levels indeed existunder cycling environmental condition.All annotated tRNA synthetases (ligases) displayed con-
stitutive expression (Fig. 7) with the exception of the tRNAsynthetase JGI_V11_187913 (ZT 18) (Additional file 1).Rhythms in aminoacyl-tRNA synthetases would suggest anorganism has increased protein synthesis activity at par-ticular times-of-day and could indicate there may be rhyth-mic control at the translational level which produces,enhances, or modifies 24 h rhythms downstream of gene
Rund et al. BMC Genomics (2016) 17:653 Page 9 of 20

expression. In mosquitoes, 12 of these aminoacyl-tRNAsynthetases are rhythmic, and expressed in a similar phase[8], yet in D. pulex, we find that expression of annotatedtRNA synthetases was primarily constitutive, indicating itis unlikely that there are 24 h rhythms in translation. How-ever, there are various other steps involved in proteintranslation, post-translational modification, and degrad-ation that could still provide time-of-day regulation andmodification of protein levels.
Sensory processesThere are a variety of reasons why sensory biology maybe modulated by time-of-day. In the mosquito, sensitiv-ity to human host odorants peak at night – the timewhen the mosquito host-seeks for a blood meal [9]. In asimilar manner, D. pulex may adjust its sensory pro-cesses in anticipation of changing food resource avail-ability or times of greater risk of predation.Electrophysiological studies in numerous terrestrial ar-thropods reveal sensitivity to light is time-of-daydependent (even under constant conditions, and is thusis not a direct response to changing light conditions).This change in sensitivity compensates for the orders-of-magnitude differences in ambient light changes as theday progresses [53], yet none of the D. pulex phototrans-duction pathway genes identified by Rivera et al. [54]were rhythmically expressed in D. pulex (Additional file1). However, we found four rhabdomeric opsins (as
annotated by Colbourne et al. [19]), all from the LongBclade, were rhythmically expressed (Fig. 8) and with asimilar time of peak expression, occurring in the morn-ing (JGI_V11_198385, ZT 4; JGI_V11_305803, ZT 4;JGI_V11_106095, ZT 4; JGI_V11_254506 ZT 6). Inaddition to changes in ambient light caused by the dailyenvironmental LD cycle, Daphnia may respond tochanges in light intensity and wavelengths as they movehigher and lower in the water column. It has been notedin Daphnia longispina that eye pigment migration isunder circadian control (observed under both normalLD cycle conditions and constant illumination) [55].Therefore, instead of regulating the phototransductioncascade to control for changing ambient light condi-tions, D. pulex may ‘shield’ its eyes in a time-of-day spe-cific fashion such has been described in othercrustaceans [56].Daphnids may also adjust their chemoperception
abilities/sensitivities in a time-of-day specific manner,for example to respond to changing needs for preda-tor avoidance. Among the gustatory receptors (Grs)identified by Peñalva-Arana et al. [57], we found threethat were rhythmically expressed (Fig. 8): Gr12(JGI_V11_327171) and Gr43 (JGI_V11_327170), bothpeaking at ZT 6; and Gr36 (JGI_V11_329588) whichpeaks late at night (ZT 22). Gustatory receptors canbe very specific in the odorants they detect [58]. It isplausible that D. pulex shows time-of-day specific
-1
0
1 TCA
-1
0
1
-1
Glycolysis
-1
0
1 FA
0
1 V-ATPase
Nor
m. E
xpre
ssio
n (L
og )
0 12 0 12
Time (ZT)
2
12
Fig. 7 Daphnia metabolic processes genes are not rhythmically expressed. Citric acid cycle components (TCA), fatty acid degradationcomponents (FA), glycolysis components, and subunits of vesicular type H+ ATPase (V-ATPase) are almost entirely constitutively expressed overthe 24 h day: few genes in these functional pathways were scored as rhythmic by JTK_CYCLE. Exceptions (found rhythmic by JTK_CYCLE q < 0.1)are indicated in blue. Network analysis revealed no further rhythmic genes in any of these four gene families. Expression is presented as log2 ofmedian normalized expression. Day and night are indicated by the horizontal white/black bars
Rund et al. BMC Genomics (2016) 17:653 Page 10 of 20

sensitivity to certain odorants, and not others. Asimilar olfactory phenomena has been observed in themosquito, which is more sensitive to certain humanhost odorants during normal host-seeking times-of-day [9]. D. pulex could, for example, upregulate itsability to sense predator kairomones at the time-of-day when predation risk is highest.
Oxidative stress detoxificationIt has been reported that Drosophila has daily rhythms inresistance to oxidative stress [59]. We examined D. pulexgenes with known or putative roles in oxidative stress de-toxification and found that many were rhythmicallyexpressed (Fig. 8). Catalase had rhythmic expressionpeaking at mid-day (cat, JGI_V11_308727, ZT 6; Fig. 8),
-0.5
0.0
0.5 OpsinsLOPB3
LOPB4
LOPB5
LOPB12
-0.5
0.0
0.5 Peroxidases
6
7
8
9
10
Ex p
ress
ion
(Log
)
Gr12
2
6.5
7.0
7.5
8.0
8.5 Gr43
2.6
2.7
2.8
2.9 Gr36
13.5
14.0
14.5 Catalase
Med
ian
Nor
mal
ized
Ex p
. (Lo
g ) 2
0 12 0 12Time (ZT)
12
Med
ian
Nor
mal
ized
Exp
. (Lo
g ) 2
Ex p
ress
ion
(Log
) 2
Exp
ress
ion
(Log
) 2
Ex p
ress
ion
(Log
) 2
JGI_V11_304755JGI_V11_307875 JGI_V11_206041JGI_V11_314049
0 12 0 12Time (ZT)
12
Fig. 8 Rhythmic expression of sensory genes and oxidative detoxification genes. Rhythmic expression of LongB clade opsin genes, rhythmicgustatory receptors (Grs), catalase, and rhythmic peroxidases. Expression is presented in log2 for single gene plots and log2 of median normalizedexpression for multi-gene plots. Day and night are indicated by the horizontal white/black bars. Error bars are presented for single-gene plots andrepresent S.E.M. of technical replicates. Additional peroxidases were identified using network analysis and these are visualized in Fig. 3b)
Rund et al. BMC Genomics (2016) 17:653 Page 11 of 20

consistent with the peak time of catalase activity describedin D. longispina [60]. Four genes encoding putative perox-idases (JGI_V11_304755, ZT 8; JGI_V11_307875, ZT 4;JGI_V11_206041, ZT 10; ZT_V11_314049, ZT 10; Fig. 8)were also rhythmically expressed and peak during thedaytime (Fig. 8). Interestingly, sodium oxidase dismutase 1expression was weakly rhythmic, but with expressionpeaking much later (SOD1, JGI_V11_329848, ZT20; Add-itional file 1). We note that network analysis revealed anadditional two rhythmically expressed peroxidases(Fig. 3b). These data suggest that response to oxidativestress may be time-of-day specific. During the daytime,when sunlight-induced oxidative stress would be mostlikely to occur, D. pulex may be more prepared to respondto oxidative stress.
Clock genesWe next looked at D. pulex homologues of arthropodcore molecular clock genes primarily as annotated byTilden et al. [61]. These ‘canonical’ clock genes make upthe transcriptional-translation feedback loops (TTFLs)that encompass the molecular circadian clock. TTFLshave been characterized in a variety of organisms includ-ing terrestrial arthropods, rodents, and humans [28, 62].However, the molecular clock has yet to be characterizedin Daphnia. Orthologs of the core molecular clockmechanism in Drosophila are found in the D. pulex gen-ome [61], suggesting that the elements of a conservedarthropod clock are present in Daphnia. Tilden et al.[61] identified well-characterized circadian clock genesincluding clock, cycle, period, PAR domain protein 1ε,vrille, eight timeless paralogs, and both cryptochrome 1(a Drosophila-like photoreceptor) and cryptochrome 2 (amouse-like transcriptional repressor) [61]. Finding bothforms of cryptochrome suggests that the D. pulex has anendogenous circadian molecular clock that is more simi-lar to that of the monarch butterfly Danaus plexippusand the mosquito An. gambiae than to Drosophila(which lacks the cryptochrome 2 transcriptional repres-sor) [8, 61, 63, 64].Based on the observation that a full complement of
canonical clock gene orthologues were expressed inD. pulex, and based on current insect clock models,including those of Drosophila and the mosquito, wewould predict 24 h sinusoidal rhythmic expressionprofiles for several of these genes in cells throughoutthe organism [8, 13–15, 62–66]. This prediction in-cludes at least one, if not both, of the two positiveloop components of the TTFL mechanism, clock andcycle, the three negative loop components, period,timeless and cryptochrome 2, and the members of theinterlocking loop, pdp1 and vrille.Under LD cycle conditions and using our stringent
cutoff criteria, our analysis of microarray data did not
detect 24 h sinusoidal rhythmic expression of any of theputative canonical clock genes [clock, cycle, period, PARdomain protein 1ε, vrille, four of the eight timeless para-logs (a - h), cryptochrome 1, cryptochrome 2, nor pig-ment dispersing hormone (a neuronal clock output gene,also know as pigment dispersing factor)] usingJTK_CYCLE or network analysis (Fig. 9, Additional file 1).However, period (peak phase ZT 18) and cryptochrome 2(ZT 16) were scored as rhythmic by JTK_CYCLE (q <0.05, Fig. 9) when the period length cutoff criteria was re-laxed to 28 h, and when the microarray data were sub-jected to CircWave cosinor analysis (p < 0.05; period, R2 =0.56, ZT 18; cryptochrome 2, R2 = 0.55, ZT 17.6) (Fig. 9).Similarly, timeless-b (ZT 16), timeless-e (ZT 16), werescored as rhythmic by JTK_CYCLE when the periodlength was relaxed to 28 h, and timeless-f (ZT 8), andtimeless-g (ZT 8) were rhythmic at a period of 20 h. Nosignificant rhythmicity was detected in any of these time-less paralogs by CircWave cosinor analysis. However, thereis phase concordance between period, timeless-b, timeless-e and cryptochrome 2, which falls during the early/middleof the night, as is observed in fruit flies, mosquitoes, hon-eybees and some butterflies [4, 8, 13, 14, 29, 64, 66]. Thisfinding would be consistent with the protein products ofperiod, timeless (specifically timeless-b and timeless-e) andcryptochrome 2 functioning as interacting elements of thenegative arm of the TTFL mechanism of the molecularclock. Surprisingly, neither clock nor cycle, the presumedpositive loop TTFL components, or vrille, exhibit a hint ofrhythmicity. While not the focus of this investigation, thelack of a consistent signature of high amplitude, high fi-delity rhythmic clock gene expression suggests that theDaphnia clock does not exhibit robust rhythmicity in thecanonical clock components (transcripts), at least whenexamined in this case at a whole whole-animal tissue level.Robust rhythmicity has however been described in severalother arthropods, including Drosophila, mosquitoes, thehoneybee and the butterfly [8, 13–15, 64, 66].There are a number of possible explanations for the lack
of robust clock gene rhythmicity detected in this experi-ment. First, there is evidence that specific tissues of cray-fish express clock genes in anti-phase of one another; andin mice the phase of clock gene expression can vary be-tween tissues by as much as 4–8 h [67, 68]. As we assayedentire organisms, it may be that differences in peak phasesbetween tissues reduced the amplitude of the oscillationor appeared as multiple peaks of expression; giving the ap-pearance of a lack of rhythmicity. Second, clock generhythmicity may be limited only to a subset of tissues andthus would not be detected in a whole-organism assay.For example, rhythmic clock gene expression was not de-tected in all peripheral tissues of the Zebrafish [69].It is also feasible that D. pulex has an alternative, non-
canonical, core molecular clock that operates differently
Rund et al. BMC Genomics (2016) 17:653 Page 12 of 20

from well-characterized insect clocks. In fact, under con-stant light conditions, D. magna has been reported tohave an unusually long 28 h free running period [23, 70].Alternate clock mechanisms have been suggested in anumber of invertebrates including the nematode, Caenor-habditis elegans [71], the sea squirt, Ciona intestinalis[72], and in other crustaceans like the speckled sea louse,Eurydice pulchra [73], and the prawn, Macrobrachiumrosenbergii [74].In summary, under our laboratory diel conditions and
while assaying whole organism transcriptomic data, ro-bust, high fidelity, high amplitude, 24 h sinusoidal expres-sion of Daphnia canonical clock genes was not detected.We suggest several possible explanations, but we cannotdistinguish among these alternatives. Future experimentsto determine the mechanism of Daphnia circadian clocksshould examine tissue-specific expression patterns ofclock genes under both diel and constant dark conditions.
Comparison with condition-dependent gene regulationWe next explored the overlap between D. pulex geneswe identified as rhythmic and those previously identi-fied as having differential expression under variousexperimental manipulations. Table 1 highlights theproportion of genes previously identified as differen-tially expressed (q < 0.05) under differing environmen-tal temperatures [75], salinities [76], and resourcemanipulations of carbon: phosphorus ratio [77] thatwe also found to be rhythmic (JTK_CYCLE q < 0.05).For example, 38 % of genes differentially regulated inresponse to salinity stress were also found to berhythmically expressed. The degree of overlap sug-gests that not controlling for RNA collection timeacross treatments or replicates could result in falsepositives or false negatives in differential expressionstudies. Future experimental designs should take thesefindings into consideration and time-of-day specific
7000
8000
9000
10000
cryptochrome 1
exp
ress
ion
0 12 0 12
time (ZT)
2000
2500
3000
3500
cycle
12000
14000
16000
18000
timeless - a
1000
2000
3000
timeless - e
5000
6000
7000
8000
cryptochrome 2
5000
10000
15000
period
2000
2500
3000
3500
4000
timeless - b
300
400
500
600
timeless - f
2500
3000
3500
4000
clock
4000
6000
8000
10000
12000
vrille
400
600
800
timeless - c
500
1000
1500
2000
2500
3000
timeless - g
1800
2000
2200
2400
2600
2800
pigment dispersing hormone
10000
15000
20000
PAR domain protein 1
500
1000
1500
timeless - d
200
300
400
500
600
timeless - h
Fig. 9 Clock gene expression. Microarray expression of D. pulex clock genes. Day and night are indicated by the horizontal white/black bars.Expression is presented as raw florescence values. Error bars represent S.E.M. of technical replicates
Rund et al. BMC Genomics (2016) 17:653 Page 13 of 20

effects should also be considered when interpretingpreviously collected data.
ConclusionsWe present genome-wide diel transcriptional profiling ofDaphnia under controlled laboratory conditions. Ouranalysis revealed that Daphnia express a great numberand diversity of genes in a highly rhythmic manner, in-cluding genes involved in sensory processes, response tooxidative stress, and immune-related genes. It is advan-tageous for an organism to upregulate its ability to com-bat or avoid environmental stressors at the times-of-daythey are most likely to encounter such risks. Wehighlighted how during the daytime, Daphnia popula-tions may be at greater risk of oxidative damage (fromthe Sun), predation (from fish, which locate them visu-ally during the day), and exposure to pathogens (whichthey encounter at greater frequency at the bottom of thewater column in Daphnia populations that migratedownwards during the day-time). It therefore should notbe surprising that genes that function in detoxifying oxi-dative stress, chemoperception, and combating patho-gens are rhythmically expressed.We showed that while D. pulex has a full comple-
ment of the core clock genes found in other animals,
the expected high amplitude rhythmic expression ofthese genes is not apparent when examined at thewhole animal level. Work in other crustaceans sug-gests that clock rhythmicity may be limited to a sub-set of tissues or has anti-phasic expression in varioustissues that would obfuscate the expression patternsof these genes in a whole-organism assay. It is alsopossible that D. pulex has an alternative molecularclock. Our work contributes to a growing understand-ing that there is less conservation than initially re-ported in the mechanisms of arthropod clocks andthat more investigation is prudent in elucidating thecore clock of Daphnia.Finally, we developed a comprehensive network mod-
eling and analysis approach that complements and en-hances the standard statistical analyses of differentialexpression (e.g., JTK_CYCLE). This network analysis,when built on top of the statistical analyses, revealedadditional knowledge about rhythmicity that could notbe captured by the statistical analyses alone. Importantly,we demonstrated the usefulness of the network ap-proach to identify novel functional annotations for cur-rently uncharacterized genes. As the number of availablearthropod genome sequence assemblies increases, andthe taxonomic breadth of these genomes widens, meth-odological approaches that take into account the pat-terns of co-expression and network configuration willbecome vital additions to the process of functionalannotation.Future work may include examining rhythms at the
protein and functional level and examining rhythms inspecific tissues (especially in regards to clock gene ex-pression). Further, because other Zeitgebers (time-givers), such as temperature rhythms, may enhance ob-served rhythms [78], their role in governing Daphniarhythmicity should also be investigated.
MethodsExperimental material, RNA collection, extraction, andmicroarray hybridizationA D. pulex genotype was collected from a vernal pondin southwestern Michigan (42.31979 N 85.35837 W) onMay 1, 2011. This pond, referred to as “Roughwood”,has a maximum depth of <2.0 M. Single adult femaleswere isolated in the lab to initiate isoclonal cultures andthese lines were maintained through parthenogeneticreproduction. The experimental time course was per-formed in August of 2011. Stock cultures of this geno-type (Roughwood 40-11) were maintained for threegenerations at 18 °C in 1 quart jars containing COMBOwater medium [79] and a 12 L:12D photoperiod (withabrupt transitions). The media, containing resource inthe form of algae Scenedesmus acutus culture at a con-centration of 200,000 cells/ml, was replaced every
Table 1 Comparisons between condition-dependent and tem-poral regulation of gene expression
Experiment Conditions Genotypes Overlap d
Thermal regime a 18 °C vs. 28 °C Low tolerancegenotype C
11 % / 183
Low tolerancegenotype E
12 % / 199
High tolerancegenotype B
7 % / 116
High tolerancegenotype K
7 % / 116
Salinity stress b 5 gL−1 NaCl vs. control High tolerancegenotype
38 % / 631
Low tolerancegenotype
33 % / 548
Carbon:Phosphorousratio c
HiC:LoP (C:P ~800) vs.LoC:HiP (C:P ~100)(3 days)
G1: LoC:HiPtolerance
4 % / 66
G2: HiC:LoPtolerance
8 % / 133
HiC:LoP (C:P ~800) vs.LoC:HiP (C:P ~100)(6 h)
G1: LoC:HiPtolerance
16 % / 266
G2: HiC:LoPtolerance
9 % / 149
aYampolsky et al. 2014 [75]bLatta et al. 2012 [76]cChowdhury et al. 2014 [77]dThe number and percent of genes both differentially expressed in the givenexperimental treatment conditions (q < 0.05) and also rhythmically expressedas determined by JTK_CYCLE in this present study (q < 0.05)
Rund et al. BMC Genomics (2016) 17:653 Page 14 of 20

second day to maintain a constant level of resource andindividuals were culled to maintain a density of 50 indi-viduals per culture. To establish the experimental gener-ation, female offspring from the second or third clutchof second-generation females were collected within 48 hof birth, pooled, and divided into twelve 1 quart jarscontaining 750 ml of COMBO media and algae andmaintained as above with the same feeding regime and12 L:12D photoperiod. When these third generation fe-males were 10–12 day old the experiment began andreplicate pools of 30 animals per jar were collected,rinsed in distilled water, and snap frozen on dry ice every4 h over a 44 h period.To assess patterns of gene expression, we used the D.
pulex Expression Array 12x135k GEO AccessionGPL11278 (See Colbourne et al. [19]). The platform is ahigh-density NimbleGen (Roche-NimbleGen, Madison,WI) microarray that accommodates 12 experiments perglass slide, with each experiment interrogating 137,000probes. Each predicted and experimentally validatedgene is represented by as many as three probes, whereasthe remaining probes are designed from transcriptionallyactive regions whose gene models are not yet known.Total RNA was purified from a single pool of animals
collected at each time point using TRIzol reagent (Invi-trogen, Carlsbad, CA) extraction followed by RNA puri-fication using a Qiagen RNeasy Mini Kit with on-column DNAse treatment to isolate total RNA. RNAse-cure (Ambion, Austin, TX) was used after RNA purifica-tion to inactivate any remaining RNAases. The qualityand quantity of resulting RNA were assessed using aNano Drop (Thermo Scientific, Waltham, MA) andRNA Nano LabChip for the Bioanalyzer (Agilent Tech-nologies, Santa Clara, CA). Beginning with 1.0 μg oftotal RNA, a single round of amplification using Messa-geAmpTM II aRNA kit (Ambion) was performed foreach RNA sample. The cRNA (10 μg) was converted todouble strand cDNA with random primers using theInvitrogen SuperScript Double-Stranded cDNA Synthe-sis Kit (Invitrogen). From 1 μg double-stranded cDNA,labeled cDNA was generated with NimbleGen’s Dual-colour Labeling Kit (Roche NimbleGen).RNA from each pooled sample was used to create four
technical hybridization replicates. Dual-colour hybridization,post-hybridization washing, and scanning were done ac-cording to Roche NimbleGen protocols [80]. Images wereacquired using a NimbleGen MS 200 with 2 μm reso-lution, and GenePix 6.0 software (Molecular Devices,Sunnyvale, CA). The image data from these arrays wereprocessed using NimbleScan v2.5 software (Roche Nim-bleGen) to extract probe intensity values. These datahave been deposited in the NCBI Gene Expression Omi-nibus and are accessible through GEO accession numberGSE67781.
Microarray data analysisGene expression values (i.e., gene intensity values) wereobtained from a summarization of intensity values of allcorresponding probes using the RMA (Robust Multi-arrayAverage) method [81]. The pre-processed microarray datawere imported into an in-house analysis pipeline usingBioconductor [82] for normalization and analysis. Allgenes were quantile-normalized across arrays, samples,and technical replicates [83]. Unless otherwise noted, datapresented is normalized, but not log transformed.
JTK_CYCLE analysis of rhythmic gene expressionTo determine the patterns of rhythmic gene regulationwe first used the JTK_CYCLE algorithm as previouslydescribed [32, 37, 38]. JTK_CYCLE is a nonparametricstatistical algorithm designed to identify and characterizecycling variables in large datasets. It applies theJonckheere-Terpstra-Kendall (JT) test and Kendall’s tau(rank correlation), to find the optimal combination ofperiod and phase that minimize the p-value of Kendall’stau correction between the experimental time series andeach tested cyclical ordering, this being derived from co-sine curves. JTK_CYCLE generates period length, phase,and amplitude estimates, as well as corrects for multiplecomparisons post hoc. The reported q-value takes intoconsideration the false discovery rate (FDR) across allgenes [84].Prior to running JTK_CYCLE, genome features on the
microarray not mapping to a gene in the D. pulex v1.1frozen gene set were excluded, as were all probes thatfailed to exceed background levels in at least one sample.A background fluorescence cutoff value of 136.5 wasused as it was a value that excluded >99.8 % of randomprobes on the arrays. Genes were scored as being rhyth-mic if they were found using the JTK_CYCLE algorithmto have a q < 0.1 (a commonly used JTK_CYCLE cutoff )and period length of 22–26 h.Gene annotations followed the 2013–2014 gene anno-
tations from the Department of Energy – Joint GenomeInstitute Daphnia Genome Browser [85] supported bygene annotations from OrthoDb [48] and euGenesArthropod 2009.12 annotations [86]. Further gene andgene family identifications were taken from Rivera et al.[54], Colbourne et al. [19], McTaggart et al. [47],Peñalva-Arana et al. [57], KEGG Pathways Database[52], and from 2013 to 2014 Drosophila melanogasterhomologs listed on FlyBase [49]. For each gene familymentioned in this paper (e.g., chitinases, putative clockgenes, glycolysis, etc.), the identities of all genes consid-ered for that family are provided in Additional file 1.
Hierarchical cluster analysisWe performed hierarchical cluster analysis (Fig. 2) usingCluster 3.0 and visualized the results using Java
Rund et al. BMC Genomics (2016) 17:653 Page 15 of 20

TreeView. Data were mean centered, normalized acrossthe time course for each gene, and centroid linkage clus-tering performed [87, 88].
Real-time quantitative RT-PCR (qRT-PCR) analysisTotal RNA (as above) was used for cDNA synthesisusing a High Capacity cDNA reverse transcriptase kit(Applied Biosystems, Foster City, CA) primed with ran-dom hexamers. PCR thermocycling and qRT-PCR wereperformed using SYBR green reagents per manufacture’sprotocol using an Applied Biosystems 7500 Fast Real-Time PCR System. Quantification was based on the gen-eration of standard curves. Dissociation curves to testfor primer dimers were generated using dissociationcurve software (Applied Biosystems). Normalization ofgenes was calculated relative to a D. pulex gene deemedconstitutively expressed over the 24 h, Alpha tubulin(JGI_V11_301837). See Additional file 3 for primer se-quences used.
Cosinor analysisCircWave v1.4 software, an extension of cosinor analysis,was also used to analyze clock gene expression rhythmi-city. This analysis fits a Fourier curve (one sine wave) tothe data. The p values reported are the result of F-testsfrom the software [89].
Network constructionWe modeled temporal gene expression data with a geneco-expression network as follows: in the network, nodesare genes, and two nodes are connected by an edge ifthe corresponding genes show similar expression pat-terns over time. To measure similarity between expres-sion profiles of two genes, we used one of the followingthree popular edge weight methods: signed Pearson cor-relation, absolute Pearson correlation, and mutual infor-mation, see Rider et al. [35] for details. Each edge weightmethod assigned to every pair of genes a score that cap-tures some intuition of how well the genes’ expressionlevels “correlate” over time; then, we constructed a co-expression network by predicting the top K highest-scoring node pairs as edges in the network. We varied Kfrom N (where N is the number of genes in the expres-sion data) to 10N in increments of N, and we also testedK = 25N, 50N, and 100N, in order to evaluate the effectof the value of parameter K on the resulting networkstructure. Intuitively, we wanted to choose this value ina way that keeps only significant edges and provides ameaningful representation as well as interpretation ofthe data [90]. Namely, for each edge weight method, weaimed to construct a network that ideally linked allgenes (i.e., has no isolated nodes), in order to includeinto the network as much information from the data aspossible. At the same time, we aimed to construct a
network that is not too dense (where density is definedas the number of edges in the network out of all possibleedges), in order to mimic the sparse nature of manyreal-world networks as well as avoid randomness in net-work topology [90, 91]. Empirically, by studying thenumber of non-isolated nodes, edges, connected compo-nents, and nodes and edges in the largest connectedcomponent, we found that as K increases, the number ofnon-isolated nodes barely increases, while the networkdensity increases drastically. Therefore, since largervalues of K increase network density without introdu-cing many new nodes into the networks, which couldunnecessarily increase computation complexity of net-work analysis methods or include “lower-confidence” in-teractions, we empirically decided to focus on thefollowing networks (i.e., their largest connected compo-nents): signed Pearson correlation with top N interac-tions, absolute Pearson correlation with top Ninteractions, and mutual information with top N interac-tions. Also, since edges that are captured by both Pear-son correlation as well as mutual information could beof higher confidence, we also studied (largest connectedcomponents of) the intersections of absolute Pearsoncorrelation and mutual information with: 1) top 10 N in-teractions and 2) top 25 N interactions. Thus, we stud-ied a total of five networks.
Network-based prediction of new rhythmic genes – nodecentrality-based analysisFor a given network and a given centrality measure, i.e.,for each of 5×7 = 35 possible cases (where 5 correspondsto the number of studied networks and 7 corresponds tothe number of studied centralities), in 11 cases we ob-served statistically significant differences (p-values below0.01) between network positions of the rhythmic genesand the remaining genes. Next, for each of the 11 cases,we ranked all genes in the network from the most cen-tral to the least central (or vice versa). We took the topK% most (or least) central genes, where we varied Kfrom 1 to 100 % in increments of 1 %. Then, we com-puted precision (the portion of the top K% genes thatare JTK_CYCLE-identified rhythmic genes), recall (theportion of JTK_CYCLE-identified rhythmic genes fromthe given network that are among the top K% genes),and F-score (which combines precision and recall into asingle value that is easier to interpret than the two indi-vidual and typically “contradictory” measures). At thevalue of K where F-score peaks (meaning that the meth-odology achieves the highest prediction accuracy at thatvalue of K), we measured the enrichment of the top K%genes in the JTK_CYCLE-identified rhythmic genes(with respect to the hypergeometric test). In 10 out ofthe 35 possible cases, we observed statistically significantenrichments signal (with p-values below 0.05 after
Rund et al. BMC Genomics (2016) 17:653 Page 16 of 20

Bonferroni correction for multiple hypothesis testing,which was done using p.adjust package in R). In each ofthe 10 cases, we took the remaining (non-JTK_CYCLE-identified) genes among the top (or bottom) K% genesand predicted them as network-based rhythmic candi-dates. We recorded how many of the 10 combinations ofnetwork type and centrality measure support each pre-diction, because the more the combinations, the higherthe prediction confidence.
Network-based prediction of new rhythmic genes –network clustering-based analysisWe clustered each network with Markov clustering algo-rithm (MCL) (with the inflation parameter set to 2, be-cause this value gives empirically optimal cluster sizedistribution, i.e., not too many very small clusters or toofew very large clusters). Then, focusing on meaningfulclusters (of size at least two and containing at least twoJTK_CYCLE-identified rhythmic genes), for each valueof K in 1–100 % range, we found all clusters that haveenrichment in the JTK_CYCLE-identified rhythmicgenes greater than K% (i.e., clusters in which at least K%of the genes are JTK_CYCLE-identified rhythmic genes),and we measured the statistical significance of the en-richment via the hypergeometric test (at a p-valuethreshold of 0.05 after Bonferroni correction for multiplehypothesis testing). For each of the resulting significantclusters, we predicted the genes in the cluster asnetwork-based rhythmic genes. We took all predictionsfrom all significant clusters and computed the overallprediction accuracy via precision, recall, and F-scoremeasures. Further, in order to ensure that we could notachieve the same prediction accuracy by chance, we ran-domly clustered the network 100 times and repeated theabove steps to compute “randomized” precision, recall,and F-score. Then, we used these randomized results todetermine “optimal” K at which to make predictionsfrom the real clusters. Namely, we selected the value ofK at which F-score peaks, but only if that F-score valueis statistically significantly high compared to the ran-domized F-score values. For three of our five networks(absolute Pearson correlation with top N interactions,intersection of absolute Pearson correlation and mutualinformation with top 10 N interactions, and intersectionof absolute Pearson correlation and mutual informationwith top 25 N interactions), results are statistically sig-nificantly better from the actual clusters than from therandomized clusters, and we predicted new rhythmicgenes from these three networks (and we left out theother two networks from consideration when makingpredictions). We recorded how many of the three net-works support each prediction, as the higher the numberof networks, the higher the prediction confidence.
Network-based prediction of novel functional annotationsand their validationTo validate the network approach in the context of pre-dicting novel gene-function associations, we used leave-one-out cross-validation, as follows. When consideringall genes in any one network, we hid functional informa-tion for one gene of interest at a time. Then, we usedfunctional information about all other genes that groupwith the gene of interest (with respect to either central-ity of clustering analysis) to potentially predict func-tion(s) of the gene of interest. Namely, if the given genegroup is statistically significantly enriched in a givenfunction (with p-value below 0.05 after Bonferroni cor-rection for multiple hypothesis testing), we annotatedthe entire gene group with that function, including ourgene of interest. We repeated this procedure for allgenes and got the set of predicted gene-function associa-tions for each of centrality and clustering analysis. Forincreased confidence, we considered association predic-tions that are in the intersection of the two analyses. Forthe resulting predictions, we measured their accuracy viaprecision, which is the percentage of associations thatwe predicted via the network approach which are in theknown functional annotation data. Novel predictions areprovided in Additional file 1.
Additional files
Additional file 1: JTK_CYCLE and network analysis results. Thespreadsheet shows, for each D. pulex gene: 1) Gene annotations 2)JTK_CYCLE derived statistics, 3) network analysis rhythmic genepredictions and statistics, and 4) network analysis functional annotations,predictions, and statistics. (XLSX 1853 kb)
Additional file 2: Molecular function GO annotations of our rhythmicgenes. Pie charts indicate the number of genes with and without amolecular function GO term. Bar charts show the number of genes thathave each top level molecular function GO term. Genes may have morethan one GO term. The three bar charts differ in which rhythmic genesand GO annotations were considered. We used either JTK_CYCLEdetermined list of rhythmic genes (“JTK”) or the expanded list containingalso our network-based rhythmic predictions (“Network”). We used theexisting list of GO annotations from the Joint Genome Institute (“JGI”) orthe expanded list containing also our network-based predicted GO anno-tations (“Network”). Whereas this figure displays molecular function GOannotations, see Fig. 3 for biological process GO annotations. Also seeAdditional file 1. (TIF 2814 kb)
Additional file 3: Microarray validation using qRT-PCR. Microarray valid-ation was performed on two rhythmic genes, a salivary C-type lectin anda β,β-carotene-15,15′-dioxygenase using qRT-PCR. The qRT-PCR gene ex-pression is relative to Alpha tubulin. Day and night are indicated by thehorizontal white/black bars. Primer sequences are provided. (PDF 271 kb)
Additional file 4: Properties of our networks. The size, density, averagediameter, and average clustering coefficient of the five networks (i.e.,their largest connected components), which we consider in our study.We also studied additional network properties, including the degreedistribution, clustering spectrum, and graphlet frequencies (results notshown). (DOCX 57 kb)
Additional file 5: Intersections between our networks. Pairwise networkintersections, in terms of the number of edges common to two given
Rund et al. BMC Genomics (2016) 17:653 Page 17 of 20

networks divided by the number of edges present in the union of thetwo networks. (DOCX 55 kb)
Additional file 6: Information on the rhythmic genes in our networks.The number of all nodes or the subset of the 1,661 JTK_CYCLE-identifiedrhythmic genes, for each network and all five networks combined. (DOCX68 kb)
Additional file 7: Validation of our network-based rhythmic genes interms of GO term overlaps with positive and negative control genes.Pairwise overlaps of enriched GO terms between the JTK_CYCLE-identifiedrhythmic genes, negative controls, and our novel predictions produced by(A) centrality analysis or (B) the clustering analysis. (PDF 347 kb)
AbbreviationsCHT, chitinase; CTL, C-type lectin; DVM, diel vertical migration; FA, fattyacid; GNBP, gram-negative bacteria-binding protein; GO, gene ontology; Gr,gustatory receptor; IMD, immune deficiency; LD, light:dark; MCL, Markov clus-tering algorithm; PRR, pattern recognition receptor; SIGN N, signed pearsoncorrelation with top N interactions; TCA the citric acid; TEP, thioester-contain-ing protein; TLR, toll-like receptor; TTFL, transcriptional-translational feedbackloop; V-ATPase, vesicular-type ATPase
AcknowledgementsWe thank Sayanty Roy for her assistance in the maintenance of experimentalstocks; Michael Hughes for provision of and assistance with the JTK_CYCLEalgorithm; Enrique Blair and Cameron Houk for their assistance with dataprocessing, Jacqueline Lopez for her assistance with our GEO submission;and we are especially thankful to Tom Little and Seanna McTaggart forsharing their expertise.
FundingS.S.C.R. is funded by a strategic award from the Wellcome Trust for theCentre for Immunity, Infection and Evolution (no 095831) and a RoyalSociety Newton International Fellowship (NF140517); T.M. by the NationalScience Foundation (NSF) CAREER CCF-1452795 and CCF-1319469 grants;and G.E.D. by the Eck Institute for Global Health and the NIGMS(R01-GM087508). This project was supported by National Institutes of Health(NIH) grant R24-GM078274 to M.E.P. The funding bodies did not have a rolein the design of the study, data collection, analysis, interpretation of data,writing the manuscript, nor the decision to publish.
Availability of data and materialsMicroarray expression data has been deposited on NCBI Gene ExpressionOminibus and are accessible through GEO accession number GSE67781.
Authors’ contributionsS.S.C.R., C.D.C.A., G.E.D., and M.E.P. collected and prepared the biologicalmaterial; M.T.S., E.Z., and C.D.C.A. generated and processed the microarraydata. C.D.C.A., S.S.C.R., G.E.D., and G.F.G. generated and processed theqRT-PCR data. S.S.C.R performed the JTK_CYCLE analysis. T.G. and B.Y.performed all network-based analyses of the data. T.M. designed and super-vised all aspects of the network-based analyses. G.E.D., T.M., and M.E.P.conceived and designed the study. All authors contributed to the analysis ofdata and writing of the manuscript and approved the final manuscript.
Competing interestsThe authors declare they have no competing interests.
Consent for publicationNot applicable.
Ethics approval and consent for participationNot applicable.
Author details1Eck Institute for Global Health, University of Notre Dame, Notre Dame, IN46556, USA. 2Department of Biological Sciences, University of Notre Dame,Notre Dame, IN 46556, USA. 3Department of Computer Science andEngineering, University of Notre Dame, Notre Dame, IN 46556, USA.4Interdisciplinary Center for Network Science and Applications (iCeNSA),University of Notre Dame, Notre Dame, IN 46556, USA. 5Notre Dame
Genomics and Bioinformatics Core Facility, University of Notre Dame, NotreDame, IN 46556, USA. 6Notre Dame Environmental Change Initiative,University of Notre Dame, Notre Dame, IN 46556, USA. 7Centre for Immunity,Infection and Evolution, Institute of Evolution, University of Edinburgh,Edinburgh EH9 3FL, UK. 8Institute of Immunology and Infection Research,School of Biological Sciences, University of Edinburgh, Edinburgh EH9 3FL,UK. 9Present Address: Department of Computer Science, Stanford University,Stanford, CA 94305, USA. 10Present Address: Department of Biology, Universityof South Dakota, Vermillion, SD 57069, USA. 11Present Address: Department ofComputer Science, University of South Dakota, Vermillion, SD 57069, USA.
Received: 20 April 2016 Accepted: 5 August 2016
References1. Ceriani MF, Hogenesch JB, Yanovsky M, Panda S, Straume M, Kay SA.
Genome-wide expression analysis in Drosophila reveals genes controllingcircadian behavior. J Neurosci. 2002;22:9305–19.
2. Lin Y, Han M, Shimada B, Wang L, Gibler TM, Amarakone A, Awad TA,Stormo GD, Van Gelder RN, Taghert PH. Influence of the period-dependentcircadian clock on diurnal, circadian, and aperiodic gene expression inDrosophila melanogaster. Proc Natl Acad Sci U S A. 2002;99:9562–7.
3. Albers HE, Liou SY, Ferris CF, Stopa EG, Zoeller RT. Neurochemistry ofcircadian timing. In: Klein DC, Moore RY, Reppert SM, editors.Suprachiasmatic nucleus: The mind's clock. New York: Oxford UniversityPress; 1991. p. 263–88.
4. Rund SSC, Gentile JE, Duffield GE. Extensive circadian and light regulation ofthe transcriptome in the malaria mosquito Anopheles gambiae. BMCGenomics. 2013;14:218.
5. Michael TP, Mockler TC, Breton G, McEntee C, Byer A, Trout JD, Hazen SP,Shen R, Priest HD, Sullivan CM, Givan SA, Yanovsky M, Hong F, Kay SA,Chory J. Network discovery pipeline elucidates conserved time-of-day-specific cis-regulatory modules. PLoS Genet. 2008;4:e14.
6. Hastings JW. Biochemical aspects of rhythms - phase shifting by chemicals.Cold Spring Harb Symp Quant Biol. 1960;25:131–43.
7. Wijnen H, Naef F, Boothroyd C, Claridge-Chang A, Young MW. Control ofdaily transcript oscillations in Drosophila by light and the circadian clock.PLoS Genet. 2006;2:e39.
8. Rund SSC, Hou TY, Ward SM, Collins FH, Duffield GE. Genome-wide profilingof diel and circadian gene expression in the malaria vector Anophelesgambiae. Proc Natl Acad Sci U S A. 2011;108:E421–30.
9. Rund SSC, Bonar NA, Champion MC, Ghazi JP, Houk CH, Leming MT, Syed Z,Duffield GE. Daily rhythms in antennal protein and olfactory sensitivity inthe malaria mosquito Anopheles gambiae. Sci Rep. 2013;3:2494.
10. Balmert NJ, Rund SSC, Ghazi JP, Zhou P, Duffield GE. Time-of-day specificchanges in metabolic detoxification and insecticide resistance in the malariamosquito Anopheles gambiae. J Insect Physiol. 2014;64:30–9.
11. Lee JE, Edery I. Circadian regulation in the ability of Drosophila to combatpathogenic infections. Curr Biol. 2008;18:195–9.
12. Stone EF, Fulton BO, Ayres JS, Pham LN, Ziauddin J, Shirasu-Hiza MM. Thecircadian clock protein timeless regulates phagocytosis of bacteria inDrosophila. PLoS Pathog. 2012;8:e1002445.
13. Leming MT, Rund SSC, Behura SK, Duffield GE, O'Tousa JE. A database ofcircadian and diel rhythmic gene expression in the yellow fever mosquitoAedes aegypti. BMC Genomics. 2014;15:1128.
14. Ueda HR, Matsumoto A, Kawamura M, Iino M, Tanimura T, Hashimoto S.Genome-wide transcriptional orchestration of circadian rhythms inDrosophila. J Biol Chem. 2002;277:14048–52.
15. Rodriguez-Zas SL, Southey BR, Shemesh Y, Rubin EB, Cohen M, RobinsonGE, Bloch G. Microarray analysis of natural socially regulated plasticity incircadian rhythms of honey bees. J Biol Rhythms. 2012;27:12–24.
16. Duffield GE. DNA microarray analyses of circadian timing: The genomicbasis of biological time. J Neuroendocrinol. 2003;15:991–1002.
17. Miner BE, De Meester L, Pfrender ME, Lampert W, Hairston Jr NG. Linkinggenes to communities and ecosystems: Daphnia as an ecogenomic model.Proc Biol Sci. 2012;279:1873–82.
18. Ebert D. Genomics. A genome for the environment. Science. 2011;331:539–40.19. Colbourne JK, Pfrender ME, Gilbert D, Thomas WK, Tucker A, Oakley TH,
Tokishita S, Aerts A, Arnold GJ, Basu MK, Bauer DJ, Caceres CE, Carmel L, CasolaC, Choi JH, Detter JC, Dong Q, Dusheyko S, Eads BD, Frohlich T, Geiler-Samerotte KA, Gerlach D, Hatcher P, Jogdeo S, Krijgsveld J, Kriventseva EV,
Rund et al. BMC Genomics (2016) 17:653 Page 18 of 20

Kultz D, Laforsch C, Lindquist E, Lopez J, Manak JR, Muller J, Pangilinan J,Patwardhan RP, Pitluck S, Pritham EJ, Rechtsteiner A, Rho M, Rogozin IB,Sakarya O, Salamov A, Schaack S, Shapiro H, Shiga Y, Skalitzky C, Smith Z,Souvorov A, Sung W, Tang Z, Tsuchiya D, Tu H, Vos H, Wang M, Wolf YI,Yamagata H, Yamada T, Ye Y, Shaw JR, Andrews J, Crease TJ, Tang H, Lucas SM,Robertson HM, Bork P, Koonin EV, Zdobnov EM, Grigoriev IV, Lynch M, BooreJL. The ecoresponsive genome of Daphnia pulex. Science. 2011;331:555–61.
20. Steams SC. Light responses of Daphnia pulex. Limnol Oceanogr. 1975;20:564–70.21. Starkweather PL. Diel variation in feeding behavior of Daphnia pulex.
Influences of food density and nutritional history on mandibular activity.Limnol Oceanogr. 1978;23:307–17.
22. Haney JF, Hall DJ. Diel vertical migration and filter-feeding activities ofDaphnia. Arch Hydrobiol. 1975;75:413–41.
23. Ringelberg J, Servaas H. A circadian rhythm in Daphnia magna. Oecologia.1971;6:289–92.
24. Rhode SC, Pawlowski M, Tollrian R. The impact of ultraviolet radiation onthe vertical distribution of zooplankton of the genus Daphnia. Nature. 2001;412:69–72.
25. Loose CJ. Lack of endogenous rhythmicity in Daphnia diel verticalmigration. Limnol Oceanogr. 1993;38:1837–41.
26. Dunlap JC, Loros JJ, Decoursey PJ. Chronobiology: Biological timekeeping.Sunderland Mass: Sinauer Associates; 2004.
27. Wager-Smith K, Kay SA. Circadian rhythm genetics: from flies to mice tohumans. Nat Genet. 2000;26:23–7.
28. Yuan Q, Metterville D, Briscoe AD, Reppert SM. Insect cryptochromes: Geneduplication and loss define diverse ways to construct insect circadianclocks. Mol Biol Evol. 2007;24:948–55.
29. Rubin EB, Shemesh Y, Cohen M, Elgavish S, Robertson HM, Bloch G.Molecular and phylogenetic analyses reveal mammalian-like clockwork inthe honey bee (Apis mellifera) and shed new light on the molecularevolution of the circadian clock. Genome Res. 2006;16:1352–65.
30. Adams M. Open questions: genomics and how far we haven't come. BMCBiol. 2013;11:109.
31. Anton BP, Kasif S, Roberts RJ, Steffen M. Objective: biochemical function.Front Genet. 2014;5:210.
32. Hughes ME, Hogenesch JB, Kornacker K. JTK_CYCLE: An efficientnonparametric algorithm for detecting rhythmic components in genome-scale data sets. J Biol Rhythms. 2010;25:372–80.
33. Sharan R, Ulitsky I, Shamir R. Network‐based prediction of protein function.Mol Syst Biol. 2007;3:88.
34. Ideker T, Sharan R. Protein networks in disease. Genome Res. 2008;18:644–52.35. Rider AK, Milenković T, Siwo GH, Pinapati RS, Emrich SJ, Ferdig MT, Chawla
NV. Networks’ characteristics are important for systems biology. Network Sci.2014;2:139–61.
36. Faisal FE, Milenkovic T. Dynamic networks reveal key players in aging.Bioinformatics. 2014;30:1721–9.
37. Hughes ME, Grant GR, Paquin C, Qian J, Nitabach MN. Deep sequencing thecircadian and diurnal transcriptome of Drosophila brain. Genome Res. 2012;22:1266–81.
38. Xu K, DiAngelo JR, Hughes ME, Hogenesch JB, Sehgal A. The circadian clockinteracts with metabolic physiology to influence reproductive fitness. CellMetab. 2011;13:639–54.
39. Milenković T, Lai J, Pržulj N. GraphCrunch: a tool for large network analyses.BMC Bioinformatics. 2008;9:70.
40. Milenković T, Memišević V, Bonato A, Pržulj N. Dominating biologicalnetworks. PLoS One. 2011;6:e23016.
41. Meng L, Hulovatyy Y, Striegel A, Milenković T. On the interplay betweenindividuals’ evolving interaction patterns and traits in dynamic multiplexsocial networks. IEEE Trans Netw Sci Eng. 2016;3:32-43.
42. Solava RW, Michaels RP, Milenković T. Graphlet-based edge clusteringreveals pathogen-interacting proteins. Bioinformatics. 2012;28:i480–6.
43. Milenković T, Memišević V, Ganesan AK, Pržulj N. Systems-level cancer geneidentification from protein interaction network topology applied tomelanogenesis-related functional genomics data. J R Soc Interface. 2010;7:423–37.
44. Milenković T, Pržulj N. Uncovering biological network function via graphletdegree signatures. Cancer Inform. 2008;6:257–73.
45. Van Dongen S. Graph clustering via a discrete uncoupling process. SIAM JMatrix Anal Appl. 2008;30:121–41.
46. Decaestecker E, De Meester L, Ebert D. In deep trouble: habitat selectionconstrained by multiple enemies in zooplankton. Proc Natl Acad Sci U S A.2002;99:5481–5.
47. McTaggart SJ, Conlon C, Colbourne JK, Blaxter ML, Little TJ. Thecomponents of the Daphnia pulex immune system as revealed by completegenome sequencing. BMC Genomics. 2009;10:175.
48. Waterhouse RM, Tegenfeldt F, Li J, Zdobnov EM, Kriventseva EV. OrthoDB: ahierarchical catalog of animal, fungal and bacterial orthologs. Nucleic AcidsRes. 2013;41:D358–65.
49. dos Santos G, Schroeder AJ, Goodman JL, Strelets VB, Crosby MA,Thurmond J, Emmert DB, Gelbart WM, FlyBase Consortium. FlyBase:introduction of the Drosophila melanogaster Release 6 reference genomeassembly and large-scale migration of genome annotations. Nucleic AcidsRes. 2015;43:D690–7.
50. Silver AC, Arjona A, Walker WE, Fikrig E. The circadian clock controls toll-likereceptor 9-mediated innate and adaptive immunity. Immunity. 2012;36:251–61.
51. Panda S, Antoch MP, Miller BH, Su AI, Schook AB, Straume M, Schultz PG,Kay SA, Takahashi JS, Hogenesch JB. Coordinated transcription of keypathways in the mouse by the circadian clock. Cell. 2002;109:307–20.
52. Kanehisa Laboratories. KEGG Pathway Database. [http://www.genome.jp/kegg/pathway.html] Accessed Jan 2014.
53. Fleissner G, Fleissner G. Efferent control of visual sensitivity in arthropodeyes : With emphasis on circadian rhythms. Stuttgart, New York: G. FischerVerlag; 1987.
54. Rivera AS, Pankey MS, Plachetzki DC, Villacorta C, Syme AE, Serb JM, OmilianAR, Oakley TH. Gene duplication and the origins of morphologicalcomplexity in pancrustacean eyes, a genomic approach. BMC Evol Biol.2010;10:123.
55. Cellier-Michel S, Berthon JL. Rhythmicity of the pigments in the compoundeye of Daphnia longispina (Cladocera). J Freshwat Ecol. 2003;18:445–50.
56. Meyer-Rochow VB. The crustacean eye: dark/light adaptation, polarizationsensitivity, flicker fusion frequency, and photoreceptor damage. Zool Sci.2001;18:1175–97.
57. Peñalva-Arana DC, Lynch M, Robertson HM. The chemoreceptor genes ofthe waterflea Daphnia pulex: Many Grs but no Ors. BMC Evol Biol. 2009;9:79.
58. Hallem EA, Dahanukar A, Carlson JR. Insect odor and taste receptors. AnnuRev Entomol. 2006;51:113–35.
59. Krishnan N, Davis AJ, Giebultowicz JM. Circadian regulation of response tooxidative stress in Drosophila melanogaster. Biochem Biophys Res Commun.2008;374:299–303.
60. Borgeraas J, Hessen DO. Diurnal patterns of antioxidant activity in alpineand arctic Daphnia under in situ UV-radiation. Archiv für Hydrobiologie.2002;156:83–95.
61. Tilden AR, McCoole MD, Harmon SM, Baer KN, Christie AE. Genomic identificationof a putative circadian system in the cladoceran crustacean Daphnia pulex. CompBiochem Physiol Part D Genomics Proteomics. 2011;6:282–309.
62. Panda S, Hogenesch JB, Kay SA. Circadian rhythms from flies to human.Nature. 2002;417:329–35.
63. Zhu H, Yuan Q, Froy O, Casselman A, Reppert SM. The two CRYs of thebutterfly. Curr Biol. 2005;15:R953–4.
64. Zhu H, Sauman I, Yuan Q, Casselman A, Emery-Le M, Emery P, Reppert SM.Cryptochromes define a novel circadian clock mechanism in monarchbutterflies that may underlie sun compass navigation. PLoS Biol. 2008;6:e4.
65. Bell-Pedersen D, Cassone VM, Earnest DJ, Golden SS, Hardin PE, Thomas TL,Zoran MJ. Circadian rhythms from multiple oscillators: lessons from diverseorganisms. Nat Rev Genet. 2005;6:544–56.
66. Gentile C, Rivas GBS, Meireles-Filho ACA, Lima JBP, Peixoto AA. Circadianexpression of clock genes in two mosquito disease vectors: cry2 is different.J Biol Rhythms. 2009;24:444–51.
67. Escamilla-Chimal EG, Velazquez-Amado RM, Fiordelisio T, Fanjul-Moles ML.Putative pacemakers of crayfish show clock proteins interlocked withcircadian oscillations. J Exp Biol. 2010;213:3723–33.
68. Peirson SN, Butler JN, Duffield GE, Takher S, Sharma P, Foster RG.Comparison of clock gene expression in SCN, retina, heart, and liver ofmice. Biochem Biophys Res Commun. 2006;351:800–7.
69. Whitmore D, Foulkes NS, Strähle U, Sassone-Corsi P. Zebrafish Clockrhythmic expression reveals independent peripheral circadian oscillators.Nat Neurosci. 1998;1:701–7.
70. Harris JE. The role of endogenous rhythms in vertical migration. J Mar BiolAssoc UK. 1963;43:153–66.
71. der Linden V, Alexander M, Beverly M, Kadener S, Rodriguez J, Wasserman S,Rosbash M, Sengupta P. Genome-wide analysis of light-and temperature-entrained circadian transcripts in Caenorhabditis elegans. PLoS Bio. 2010;8:e1000503.
Rund et al. BMC Genomics (2016) 17:653 Page 19 of 20

72. Minamoto T, Hanai S, Kadota K, Oishi K, Matsumae H, Fujie M, Azumi K,Satoh N, Satake M, Ishida N. Circadian clock in Ciona intestinalis revealed bymicroarray analysis and oxygen consumption. J Biochem. 2010;147:175–84.
73. Zhang L, Hastings MH, Green EW, Tauber E, Sladek M, Webster SG, KyriacouCP, Wilcockson DC. Dissociation of circadian and circatidal timekeeping inthe marine crustacean Eurydice pulchra. Curr Bio. 2013;23:1863–73.
74. Yang J, Dai Z, Yang F, Yang W. Molecular cloning of Clock cDNA from theprawn, Macrobrachium rosenbergii. Brain Res. 2006;1067:13–24.
75. Yampolsky LY, Zeng E, Lopez J, Williams PJ, Dick KB, Colbourne JK, PfrenderME. Functional genomics of acclimation and adaptation in response tothermal stress in Daphnia. BMC Genomics. 2014;15:859.
76. Latta LC, Weider LJ, Colbourne JK, Pfrender ME. The evolution of salinitytolerance in Daphnia: a functional genomics approach. Ecol Lett. 2012;15:794–802.
77. Roy Chowdhury P, Lopez JA, Weider LJ, Colbourne JK, Jeyasingh PD.Functional genomics of intraspecific variation in carbon and phosphoruskinetics in Daphnia. J Exp Zool A Ecol Genet Physiol. 2014;321:387–98.
78. Yoshii T, Vanin S, Costa R, Helfrich-Forster C. Synergic entrainment ofDrosophila's circadian clock by light and temperature. J Biol Rhythms. 2009;24:452–64.
79. Kilham SS, Kreeger DA, Lynn SG, Goulden CE, Herrera L. COMBO: A definedfreshwater culture medium for algae and zooplankton. Hydrobiologia. 1998;377:147–59.
80. Lopez J, Colbourne J. Dual-labeled expression microarray protocol for high-throughput genomic investigations. CGB Technical Report. 2011. doi:10.2506/cgbtr-201102.
81. Irizarry RA, Hobbs B, Collin F, Beazer-Barclay YD, Antonellis KJ, Scherf U,Speed TP. Exploration, normalization, and summaries of high densityoligonucleotide array probe level data. Biostatistics. 2003;4:249–64.
82. Gentleman RC, Carey VJ, Bates DM, Bolstad B, Dettling M, Dudoit S, Ellis B,Gautier L, Ge Y, Gentry J, Hornik K, Hothorn T, Huber W, Iacus S, Irizarry R,Leisch F, Li C, Maechler M, Rossini AJ, Sawitzki G, Smith C, Smyth G, TierneyL, Yang JY, Zhang J. Bioconductor: open software development forcomputational biology and bioinformatics. Genome Biol. 2004;5:R80.
83. Bolstad BM, Irizarry RA, Astrand M, Speed TP. A comparison of normalizationmethods for high density oligonucleotide array data based on variance andbias. Bioinformatics. 2003;19:185–93.
84. Storey JD. A direct approach to false discovery rates. J R Stat Soc BStatistical Methodology. 2002;64:479–98.
85. Department of Energy. Joint Genome Institute Daphnia Genome Browser[http://genome.jgi.doe.gov] Accessed Jan 2014
86. Li L, Stoeckert Jr CJ, Roos DS. OrthoMCL: Identification of ortholog groupsfor eukaryotic genomes. Genome Res. 2003;13:2178–89.
87. Eisen MB, Spellman PT, Brown PO, Botstein D. Cluster analysis and display ofgenome-wide expression patterns. Proc Natl Acad Sci U S A. 1998;95:14863–8.
88. Saldanha AJ. Java Treeview–extensible visualization of microarray data.Bioinformatics. 2004;20:3246–8.
89. Oster H, Damerow S, Hut RA, Eichele G. Transcriptional profiling in theadrenal gland reveals circadian regulation of hormone biosynthesis genesand nucleosome assembly genes. J Biol Rhythms. 2006;21:350–61.
90. Hulovatyy Y, DMello S, Calvo RA, Milenkovic T. Network analysis improvesinterpretation of affective physiological data. J Complex Networks. 2014;2:614–36.
91. Newman M. Networks: an introduction. New York: Oxford University Press;2010.
• We accept pre-submission inquiries
• Our selector tool helps you to find the most relevant journal
• We provide round the clock customer support
• Convenient online submission
• Thorough peer review
• Inclusion in PubMed and all major indexing services
• Maximum visibility for your research
Submit your manuscript atwww.biomedcentral.com/submit
Submit your next manuscript to BioMed Central and we will help you at every step:
Rund et al. BMC Genomics (2016) 17:653 Page 20 of 20