Embed Size (px)
Citation preview
RESEARCH ARTICLE Open Access
Phenotypic effect of mutations in evolvingpopulations of RNA moleculesMichael Stich, Ester Lázaro, Susanna C Manrubia*
Abstract
Background: The secondary structure of folded RNA sequences is a good model to map phenotype ontogenotype, as represented by the RNA sequence. Computational studies of the evolution of ensembles of RNAmolecules towards target secondary structures yield valuable clues to the mechanisms behind adaptation ofcomplex populations. The relationship between the space of sequences and structures, the organization of RNAensembles at mutation-selection equilibrium, the time of adaptation as a function of the population parameters,the presence of collective effects in quasispecies, or the optimal mutation rates to promote adaptation all areissues that can be explored within this framework.
Results: We investigate the effect of microscopic mutations on the phenotype of RNA molecules during their insilico evolution and adaptation. We calculate the distribution of the effects of mutations on fitness, the relativefractions of beneficial and deleterious mutations and the corresponding selection coefficients for populationsevolving under different mutation rates. Three different situations are explored: the mutation-selection equilibrium(optimized population) in three different fitness landscapes, the dynamics during adaptation towards a goalstructure (adapting population), and the behavior under periodic population bottlenecks (perturbed population).
Conclusions: The ratio between the number of beneficial and deleterious mutations experienced by a populationof RNA sequences increases with the value of the mutation rate μ at which evolution proceeds. In contrast, theselective value of mutations remains almost constant, independent of μ, indicating that adaptation occurs throughan increase in the amount of beneficial mutations, with little variations in the average effect they have on fitness.Statistical analyses of the distribution of fitness effects reveal that small effects, either beneficial or deleterious, arewell described by a Pareto distribution. These results are robust under changes in the fitness landscape, remarkablywhen, in addition to selecting a target secondary structure, specific subsequences or low-energy folds are required.A population perturbed by bottlenecks behaves similarly to an adapting population, struggling to return to theoptimized state. Whether it can survive in the long run or whether it goes extinct depends critically on the lengthof the time interval between bottlenecks.
BackgroundThe fate of evolving populations is determined by anumber of intrinsic properties of the ensemble andextrinsic mechanisms that interact in a highly non-trivialmanner. The natural mutation rate of populations andtheir size, the effect that such mutations have on fitnessand how these effects vary with the state of the popula-tion, or the environmental perturbations they have tocope with, all are relevant variables conditioning long-term survivability [1].
Populations evolving in constant environments even-tually reach a fitness plateau, often interpreted as anoptimum in the fitness landscape. The time required toreach the optimum and the structure of the populationat the mutation-selection equilibrium corresponding tothat environment depend, in addition to the factorslisted above, on the environment and on the initial stateof the population. During adaptation, the effect of muta-tions is different from their effect at equilibrium, prob-ably due, among others, to differences in the fitness ofpopulations and to changes in the genomic context[2,3]. Though it is common to observe an increase offitness during adaptation, situations where fitness
* Correspondence: [email protected] de Astrobiología (INTA-CSIC), Carretera de Ajalvir km 4, 28850Torrejón de Ardoz, Madrid, Spain
Stich et al. BMC Evolutionary Biology 2010, 10:46http://www.biomedcentral.com/1471-2148/10/46
© 2010 Stich et al; licensee BioMed Central Ltd. This is an Open Access article distributed under the terms of the Creative CommonsAttribution License (http://creativecommons.org/licenses/by/2.0), which permits unrestricted use, distribution, and reproduction inany medium, provided the original work is properly cited.
decreases before the new plateau is attained are not rare[4-6]. Based on several experimental observations and inmathematical models separating genotype and pheno-type, it seems that the rate of incorporation of newmutations in adapting populations proceeds regularly,while the phenotype experiences discontinuous changes[7,8]. This search-and-fix behaviour has characteristictime scales dependent on the mutation rate and the sizeof the population, such that efficient optimization willonly be observed in environments that remain constantfor a time span longer than that required to find and fixbeneficial changes [9]. Often, the process of smoothadaptation in constant environments is systematicallyinterrupted by external perturbations. Common distur-bances are unavoidable environmental fluctuations ordurable changes that constitute a new, previously inex-perienced selection pressure. An extreme perturbation isrepresented by population bottlenecks, where one orfew individuals face the task of reconstructing, usuallyin relatively short time, the whole population.The relationship between the mutation rate of a popu-
lation and the variability of the environment where itevolves has been a matter of interest for a long time[10-12]. In strictly constant environments there shouldbe selection against mutability, while periodically varyingenvironments would demand different types in thepopulation (optimal at one or another period), such thatmutation rates that minimize the genetic load of thepopulation would be favoured [10]. Early theoriesassumed fitness values monotonically decreasing withthe number of mutations accumulated by an individual[13], and recognised the effect that epistatic interactionscould play. Subsequent studies focused on the distribu-tion of beneficial effects [14] and, under the strongassumption that the mutational neighbourhood of agenome is random, predicted an exponential distributionof the differences between the parental and mutatedphenotypes [15]. More recent studies have identified therelevant effect of fitness-dependent mutation rates [16]and the dependence of the effect of mutations on theenvironment where they occur [17]. Still, an increasingnumber of empirical observations [6,18] indicate thatexisting theories are not of general applicability [19,20],and encourage additional efforts to quantify the effect ofmutations on phenotype. Knowledge of the functionalrelationship between genomic mutation rates and phe-notypic changes is essential to further develop phenom-enological theories of evolution and adaptation. This is amain motivation behind the efforts currently devoted toobtain the distribution of fitness effects of mutations.The activity in the field acknowledges the profound dif-ficulty in deriving such a relationship and points to itsconceivable non-universality.
Simple, computational models of evolution explicitlyseparating genotype and phenotype might be of greataid in bridging the gap between phenomenological the-ories and experimental observations. The former arebuilt on empirical observations which, as of yet, are farfrom complete. Actually, most experimental observa-tions deal with a relatively small number of cases andmodel organisms, such that generalization is still a diffi-cult enterprise [21]. Another problem presented by theexperimental data is the small number of beneficialmutations that can be identified. Drift and clonal inter-ference cause many beneficial mutations, especiallywhen they have small effects, to be lost. Occasionally,some of these small effect mutations reach appreciablefrequencies in the population, though they can often beincorrectly classified as neutral mutations. Anothersource of trouble concerns the selection coefficients ofthe mutations responsible for adaptation. Initial studiesconcluded that most evolutionary change was due tomutations with a small effect on fitness [22,23]. How-ever, more recent evidences assign a prominent role tolarge effect mutations, especially at the first stages ofadaptation or when the fitness of the wild type in thenew environment is low [19,20,24-26]. Studies carriedout with bacterial or viral populations focused on theanalysis of the distributions of the fitness effects of ben-eficial mutations produced prior to selection [18,27,28].Some of these studies report a good agreement with anexponential distribution, even when there are large var-iations in the fitness values of the wild type across envir-onments [28]. On the other hand, other studies onadaptation to environments in which the wild type haslow fitness reveal deviations from an exponential distri-bution due to the increase in the amount of beneficialmutations with large effect on fitness [27]. Finally, astudy combining simulation and experimental data sug-gests that, regardless of the underlying distribution ofmutations accessible to individuals, adaptation can bewell described by a similar distribution of successfulmutations with a simple form, peaked around a singlevalue [29].The computational study of random ensembles of
RNA sequences folding into their minimum free energysecondary structure (a proxy for the phenotype) haspermitted one to assess the role played by compensatorymutations [2]. More recently, analyses of the distribu-tion of fitness effects on such ensembles have led to theconclusion that fitness values among similar genotypesare correlated [30]. Evolving populations of RNAsequences subject to point mutations and selection onstructure have been successfully used as a suitableframework to explore several other aspects of evolutionin heterogeneous populations [31]. However, these
Stich et al. BMC Evolutionary Biology 2010, 10:46http://www.biomedcentral.com/1471-2148/10/46
Page 2 of 17
populations differ fundamentally from random sets ofsequences.Genomes within a population have to be highly corre-
lated, since they share a phylogenetic history and haveexperienced similar selection pressures.The aim of this contribution is to investigate the inter-
nal organization of optimized, adapting and perturbedpopulations of RNA molecules evolving under differentgenomic mutation rates, with the goal of quantifying theeffect of mutations on fitness and establishing linksbetween the state of the population and the effect ofmutations. In the case of optimized populations, differ-ent fitness landscapes are used to probe the generalityof our results. The model we use does not presupposeany underlying distribution of mutational effects. Muta-tions arise according to the established mutation rateand their effects are not selected a priori. They dependon the specific change that they produce in the second-ary structure of the evolving molecules, in particularsubsequences, or in the energy of the folded state. Ourmodel also permits us to analyze the multiple mutationssimultaneously present in a population, independently ofwhether they become fixed or not. Thus, mutations withhighly deleterious effects can be pinpointed and thosewith a very small effect can be distinguished from neu-tral changes.
Results and DiscussionEvolutionary algorithmSelection and mutationOur model system consists of a population of replicatingRNA sequences, each of length l = 50 nucleotides (nt).We begin with an ensemble of N random sequences.The ensemble evolves through discrete generations andthe population size is kept constant. An exception is thecase of perturbations through population bottlenecks, tobe discussed in detail below. At every generation, all thesequences in the population are folded into their mini-mum free energy secondary structure with help of theVienna package (see Methods). We define a target sec-ondary structure S (see Figure 1) towards which theevolution of the population is directed. The secondarystructure of the molecules in the population is com-pared to S. The probability p(di) that a molecule i in thepopulation replicates is larger the closer to S it folds.This probability is defined as
p d Zdili( ) exp= −⎛
⎝⎜⎞⎠⎟
−1 (1)
where di is the distance between the structure corre-sponding to sequence i and the target structure S. As ameasure of structural distance, we use the base-pair dis-tance (see Definitions). The constant l is a scale factor,
since the maximum base pair distance between twomolecules of length l is proportional to l. The overall
normalization factor is Z d li
Ni= −( )=∑ exp /
1 . The
fitness function defined in Eq. (1) corresponds to themain fitness landscape to be studied in this work (S-landscape).With the above definition of replication probability,
the selective advantage s ≡ [p(di) - p(dj)]/p(dj) of asequence i folding at distance di to the target withrespect to a sequence j folding at distance dj = m + di isindependent of di,
s m l= −e / .1 (2)
This result implies that the selective advantage of astructure depends on the populational context, and noton its absolute distance to the target. Further, it revealsthat the selection parameter b determines the relativeadvantage between different sequences in the popula-tion. In the limit b ® 0, s ® 0 for any two sequences:the distinction between molecules folding closer orfarther from S is lost and all have asymptotically thesame probability to replicate. When b ® ∞, only thesequence closest to the target is selected, the rest beingeliminated in the next generation. The target structure Sis found and fixed for most finite values of b, and onlyquantitative changes in the properties of the populationare produced when it is varied. Increases in b can becompensated by decreases in μ, and vice versa. In thiswork, the value of this selection parameter will be fixedto b = 2.When a molecule replicates, each nucleotide has a
probability μ to be replaced by a nucleotide randomlychosen with equal probability among A, C, G, and U.In cases where the populations exceeds the maximumsize N, we perform the usual Wright-Fisher sampling.DefinitionsThe Hamming distance between two RNA sequences orsubsequences is given by the number of positions inwhich their nucleotides differ. Structural differences canbe estimated by various means. In this work, we applythe base-pair distance, given by the number of basepairs that have to be opened and closed to transformone structure into the other (as implemented in theRNAfold algorithm [32]).A relevant macroscopic quantity to characterize the
degree of optimization of the population is the fractionr of structures in the population folding into the targetstructure. This quantity is zero when our simulationstarts: note that the probability that a random sequenceof length l folds into an arbitrary secondary structure isnegligibly small, of the order of 10-15 in the present case[33] (but see also [34]). The maximum value of r is
Stich et al. BMC Evolutionary Biology 2010, 10:46http://www.biomedcentral.com/1471-2148/10/46
Page 3 of 17
attained at the statistically stationary state, once the tar-get structure is fixed in the population. The process offixation and the dependence of r with the mutation rateμ have been described in detail elsewhere [9].The change in fitness of an RNA molecule under
replication with mutation rate μ is quantified by com-paring the secondary structures of the mother i anddaughter j sequences. We calculate the distances di anddj, as described, and the difference Δij = di - dj. If Δij =Δ > 0 (meaning that the mother sequence was fartherfrom the target structure than its mutated daughter),the mutations increased fitness and count in the total ofbeneficial changes. If Δij = Δ < 0, mutations have causeda negative change in fitness, and the daughter sequenceis farther from the target than her mother was. WhenΔij = 0, either mutations had no effect on fitness or nomutation has occurred.This procedure is repeated over a large number of
mother-daughter pairs (i, j), as we will specify, to obtain aprobability distribution Π(Δ) of the changes in fitness.That distribution eventually yields the fraction of deleter-ious changes p and the fraction of beneficial changes q:
p d q d= ∏ = ∏+
∞
−∞
−
∫∫ ( ) , ( ) .Δ Δ Δ Δ 0
0(3)
The fraction of replication events with no changein fitness, n’ = Π(0)-regardless of whether nomutations occurred or because the ones occurring wereneutral-, can be immediately obtained from p and q: n’ =1 - p - q.For a mutation rate μ, the probability that a sequence
of length l acquires k mutations upon replication followsa Poisson distribution of average μl,
P kl k l
k( )
( )!
.=− e (4)
The probability of incorporating no mutations is thusP(0) = e-μl, which for μl ≪ 1 reduces to P(0) = 1 - μl.The fraction of truly neutral mutations is thus n = n’ -P(0). If one wishes to calculate the fraction of deleter-ious, beneficial or neutral mutations conditional on atleast one mutation having taken place, it suffices todivide the values of p, q, and n above by the expected
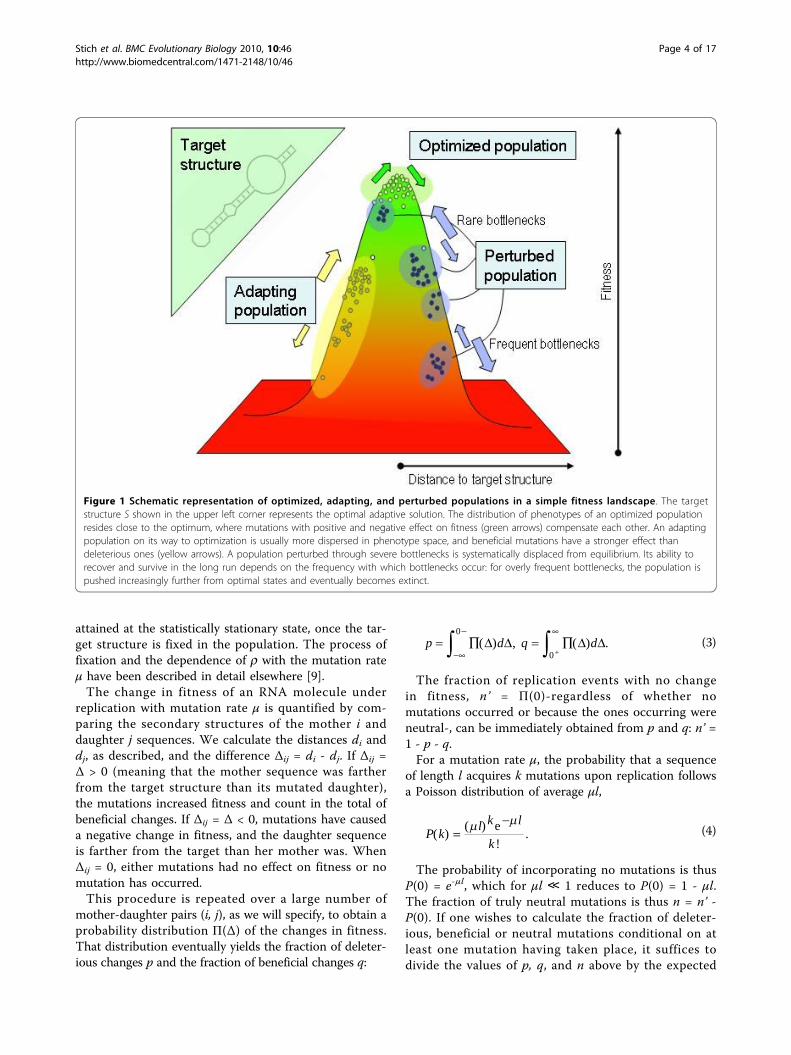
Figure 1 Schematic representation of optimized, adapting, and perturbed populations in a simple fitness landscape. The targetstructure S shown in the upper left corner represents the optimal adaptive solution. The distribution of phenotypes of an optimized populationresides close to the optimum, where mutations with positive and negative effect on fitness (green arrows) compensate each other. An adaptingpopulation on its way to optimization is usually more dispersed in phenotype space, and beneficial mutations have a stronger effect thandeleterious ones (yellow arrows). A population perturbed through severe bottlenecks is systematically displaced from equilibrium. Its ability torecover and survive in the long run depends on the frequency with which bottlenecks occur: for overly frequent bottlenecks, the population ispushed increasingly further from optimal states and eventually becomes extinct.
Stich et al. BMC Evolutionary Biology 2010, 10:46http://www.biomedcentral.com/1471-2148/10/46
Page 4 of 17
number of sequences with one or more mutations, 1 - P(0). The effect of single mutations can be estimated inthis way only for sufficiently small values of the muta-tion rate μ, since for relatively large values the probabil-ity of having two mutations in the same sequencebecomes non-negligible. For example, for μ = 10-3, theprobability that a sequence of length l = 50 is hit by twoor more mutations is P(k ≥ 2) = 1 - P(0) - P(1) ≃0.00121, thus one in a thousand molecules gets morethan one mutation under replication. At sufficiently lowmutation rates, the distribution of effects of mutationson fitness thus corresponds to the distribution of theeffect of single mutations. As μ increases, sequences at adistance of two and more mutations from the parentalmolecule can appear in a single replication event. Thishas implications in the mobility of the population insequence space and in its evolutionary dynamics [35].The average selection coefficients sq and sp are calcu-
lated as the relative average change in fitness producedby all replication events affected by mutations with abeneficial or a deleterious effect on fitness, respectively:
p
q
pl d
ql d
= ∏
= ∏
−
−∞
−∞
−
+
∫∫
( ) ( )
( ) ( ) ,
10
1
0
Δ Δ Δ
Δ Δ Δ(5)
where l corresponds to the maximum fitness change,such that 0 < (sp, sq) < 1. The fraction of deleteriousand beneficial mutations and the corresponding averageselection coefficients are calculated while keeping afixed value of the genomic mutation rate μ.
Numerical resultsIn the following we investigate the response of popula-tions of RNA sequences evolving under the situationsdescribed. The three different cases explored are sche-matically represented in Figure 1. The target structureselected in our simulations is depicted in the upper leftcorner. Starting with a random population of sequences,for values of the mutation rate below the error thresholdμc, the population is able to climb up towards the opti-mum of the phenotype space. After the transient, ifmutation-selection equilibrium is reached, the popula-tion sits around the optimum, with a fraction r of cor-rectly folding sequences determined by μ: the error rateat which a population evolves determines the degree ofadaptation reached at the equilibrium. The mutationrate also determines the spread of the population insequence and structure spaces. Populations perturbedthrough bottlenecks are forced to recover starting with asingle sequence. If the time between bottlenecks is longenough, beneficial mutations can be found and fixed,
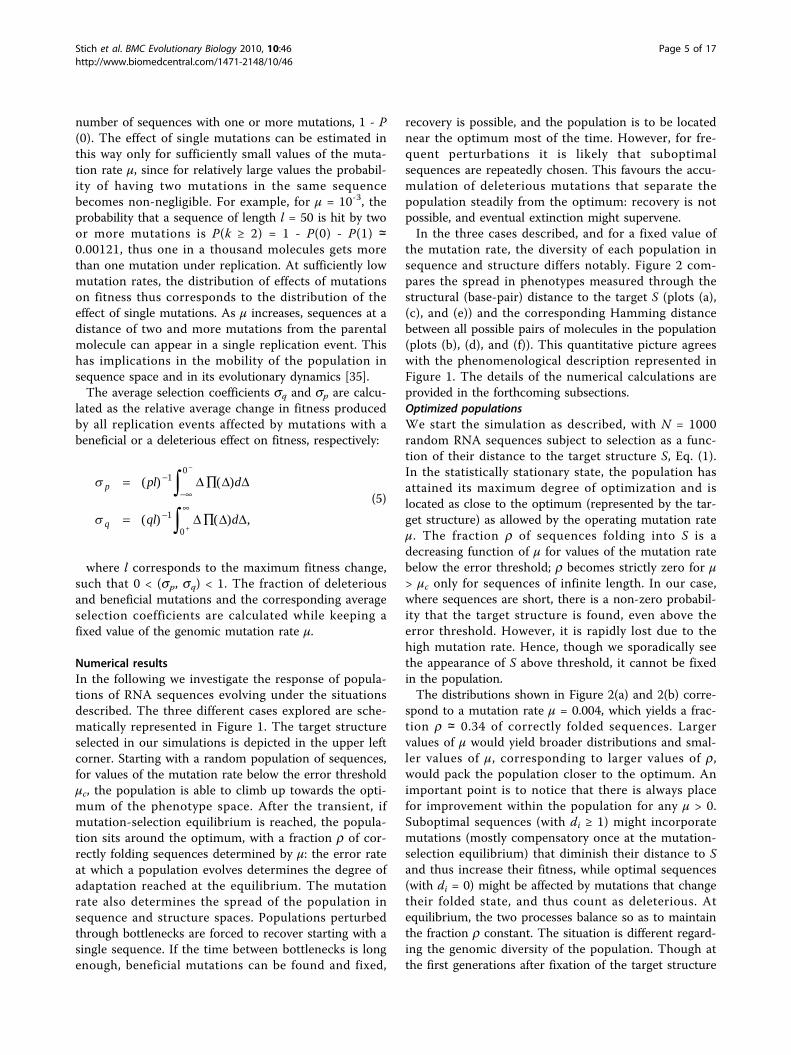
recovery is possible, and the population is to be locatednear the optimum most of the time. However, for fre-quent perturbations it is likely that suboptimalsequences are repeatedly chosen. This favours the accu-mulation of deleterious mutations that separate thepopulation steadily from the optimum: recovery is notpossible, and eventual extinction might supervene.In the three cases described, and for a fixed value of
the mutation rate, the diversity of each population insequence and structure differs notably. Figure 2 com-pares the spread in phenotypes measured through thestructural (base-pair) distance to the target S (plots (a),(c), and (e)) and the corresponding Hamming distancebetween all possible pairs of molecules in the population(plots (b), (d), and (f)). This quantitative picture agreeswith the phenomenological description represented inFigure 1. The details of the numerical calculations areprovided in the forthcoming subsections.Optimized populationsWe start the simulation as described, with N = 1000random RNA sequences subject to selection as a func-tion of their distance to the target structure S, Eq. (1).In the statistically stationary state, the population hasattained its maximum degree of optimization and islocated as close to the optimum (represented by the tar-get structure) as allowed by the operating mutation rateμ. The fraction r of sequences folding into S is adecreasing function of μ for values of the mutation ratebelow the error threshold; r becomes strictly zero for μ> μc only for sequences of infinite length. In our case,where sequences are short, there is a non-zero probabil-ity that the target structure is found, even above theerror threshold. However, it is rapidly lost due to thehigh mutation rate. Hence, though we sporadically seethe appearance of S above threshold, it cannot be fixedin the population.The distributions shown in Figure 2(a) and 2(b) corre-
spond to a mutation rate μ = 0.004, which yields a frac-tion r ≃ 0.34 of correctly folded sequences. Largervalues of μ would yield broader distributions and smal-ler values of μ, corresponding to larger values of r,would pack the population closer to the optimum. Animportant point is to notice that there is always placefor improvement within the population for any μ > 0.Suboptimal sequences (with di ≥ 1) might incorporatemutations (mostly compensatory once at the mutation-selection equilibrium) that diminish their distance to Sand thus increase their fitness, while optimal sequences(with di = 0) might be affected by mutations that changetheir folded state, and thus count as deleterious. Atequilibrium, the two processes balance so as to maintainthe fraction r constant. The situation is different regard-ing the genomic diversity of the population. Though atthe first generations after fixation of the target structure
Stich et al. BMC Evolutionary Biology 2010, 10:46http://www.biomedcentral.com/1471-2148/10/46
Page 5 of 17
all sequences are similar, in successive iterations thepopulation explores the neutral network of genotypes.This permits the population to expand in sequencespace, displaying broad variability in sequences whilemaintaining the optimized phenotype. Further, the topo-logical properties of the neutral network allow a deepexploration of the space of configurations, a feature thathas been shown to underly the extreme plasticityobserved not only in RNA sequence evolution in silico[7], but also in natural populations [8]. The
reorganizations of the populations at the sequence level,which occur all the time, can be masked by the morevisible process of adaptation, where the similaritybetween phenotypes and their degree of optimization isthe dominant and obvious outcome of selection pro-cesses. The relationship between sequence and structurein RNA molecules illustrates the complex mechanismsrelating the genomic level to its phenotypic expression,and constitutes a first, simple instance that allows us tomeasure the effect of mutations on fitness.
100
200
300
400
100
200
300
400
Abs
olut
e nu
mbe
r of
mol
ecul
es
0 10 20 30 40 50Structural distance
0
100
200
300
400
5
10
15
5
10
15
Abs
olut
e nu
mbe
r of
pai
rs o
f m
olec
ules
(x1
04 )0 10 20 30 40 50
Hamming distance
0
5
10
15
(a) (b)
(c) (d)
(e) (f)
Figure 2 Population diversity in phenotype and genotype spaces. The phenotype of molecules is represented by their folded secondarystructure. Phenotypes in an optimized population are close to the target structure and have typically a small structural distance to S (a).However, the population is spread in the space of genotypes (b). An adapting population is approaching the target (c). Due to the fastinheritance of the best (suboptimal) structure found, the dispersion in the space of genotypes is relatively small (d). A population subjected toperiodic bottlenecks spreads in the space of phenotypes due to frequent perturbations (e). Since all molecules come from a recent parentsequence, the dispersion in the space of genotypes is small (f).
Stich et al. BMC Evolutionary Biology 2010, 10:46http://www.biomedcentral.com/1471-2148/10/46
Page 6 of 17
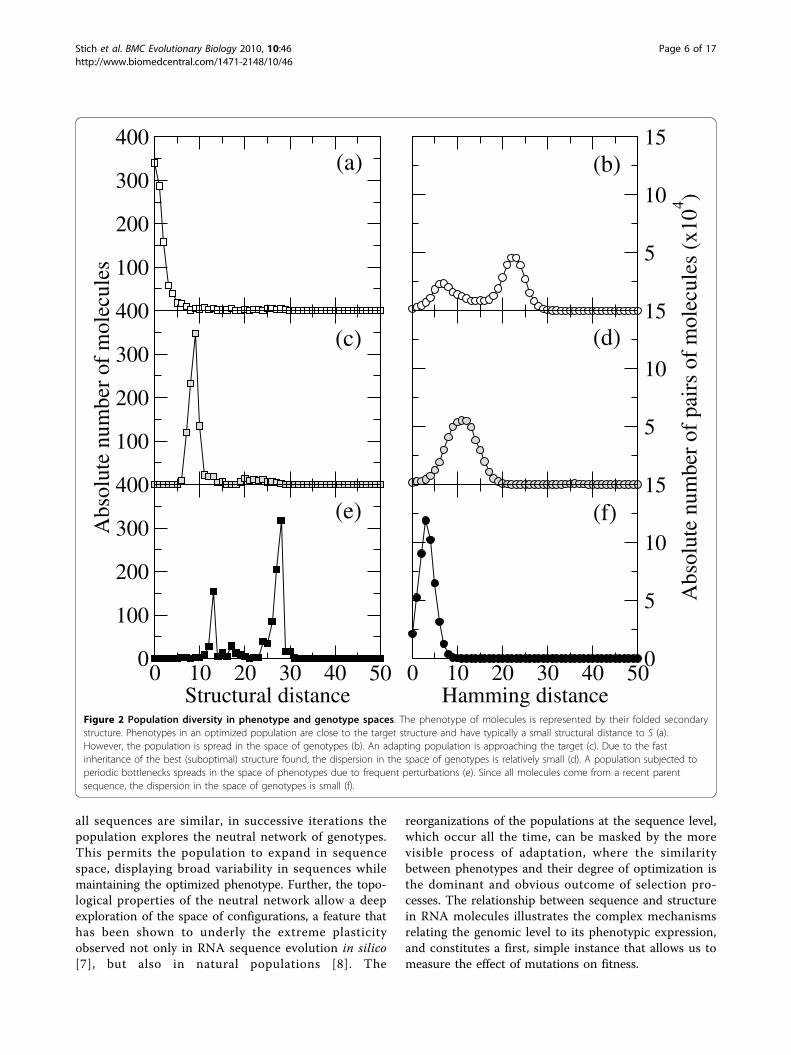
At the mutation-selection equilibrium, the effect ofdeleterious mutations is compensated by the incorpora-tion of compensatory mutations (counted as beneficialin the distribution of fitness effects), together with thereplicative advantage of correctly folding sequences. Sev-eral examples of probability distributions Π(Δ) areshown in Figure 3. As can be seen, the total number ofmutations of each sign depends on the mutation rate μ.Beneficial mutations are very rare at low values of μ,where the largest fractions r of correctly foldedsequences occur. The fraction of mutations with deleter-ious effects is slightly larger, though it still has low abso-lute value. As could have been expected, mostreplication events do not change fitness, particularlybecause mutations are absent. As μ increases, mutationsbecome more abundant, and changes of fitness uponreplication increase in frequency. Simultaneously, thedistribution becomes more symmetrical: the ratiobetween beneficial and deleterious mutations increasestowards one. This analysis has been repeated for popula-tions optimized at different values of μ. Figure 4 sum-marizes the obtained values of p, q, and the selectioncoefficients sp and sq as a function of the mutation rateμ. We have indicated the approximate position of theerror threshold μc. It is interesting to note that the effectof mutations on phenotype does not have any particularsensitivity to this important threshold. It only affects theprobability of fixation of beneficial mutations, not theirappearance, which increases monotonically with μ. This
is consistent with previous observations of structuralstability, a kind of collective effect in RNA populations,which still maintain a distributed signal of the targetsecondary structure despite the fact that no sequence inthe population folds into it [9].Below the critical error threshold, the phenotypic
mutation fractions seem to bear a simple functionalrelationship with μ:
p q∝ ∝ , , (6)
with exponents a ≃ 0.89 ± 0.01 and g ≃ 1.77 ± 0.02,indicating that, as the degree of adaptation of a popula-tion reduces as a consequence of evolution at progres-sively increased mutation rates, compensatory mutationsincrease their frequency at a higher speed than do dele-terious mutations. We expect the algebraic relationshipbetween phenotypic and microscopic mutation rates tobe generic, although the specific values of the exponentsa and g will depend on the length of the sequences andon the particular secondary structure chosen. The ratioq/p quantifies the number of compensatory mutationsper deleterious mutation. Its dependence with μ is dis-played in the inset of Figure 4. Together with the func-tional relationships reported in Eq. (6), we obtain q/p ≃μξ, with ξ = g - a = 0.87 ± 0.03.The average selection coefficients vary only slightly
with μ, with sp taking about twice the value of sq. Thisrelationship is dependent on sequence length and targetstructure.
-0.6 -0.4 -0.2 0 0.2 0.4 0.6Δ/l
10-6
10-5
10-4
10-3
10-2
10-1
100
( )
Π Δ
μ=5x10⁻⁴
μ=3x10⁻³
μ=10-2
μ=4x10⁻²
Figure 3 Distribution of phenotypic changes - Optimizedpopulation. The effect of mutations on the phenotype is quantifiedthrough the change in fitness caused upon replication. Fourdistributions corresponding to different values of the mutation rateμ are shown. The probability distribution Π(Δ) has been obtained byaveraging over 300 generations in populations of size N = 1000. Itssymmetry increases as μ grows, corresponding to populations thatare more spread in the space of sequences and structures.
Figure 4 Dependence of the phenotypic mutation fractionsand of the average selective coefficients on the mutation rateμ - Optimized population. The phenotypic mutation fractions pand q increase monotonically as μ grows. Below the error thresholdthey behave as a power-law of μ, to a good approximation. Theaverage selective coefficients sp and sq show little variation with μ.The inset shows the ratio between the fraction of beneficial anddeleterious mutations. The straight line serves as a guide to the eye.
Stich et al. BMC Evolutionary Biology 2010, 10:46http://www.biomedcentral.com/1471-2148/10/46
Page 7 of 17
Adapting populationsThe study of adapting populations is performed in a waysimilar to that for optimized populations. An ensembleof N = 1000 random RNA sequences is the startingpoint, and we replicate and select sequences asdescribed. Now, however, fitness changes are measuredbefore the population has found the target structure,such that it is formed by a population of phylogeneti-cally related, suboptimal structures. In practice, we mea-sure the structure of the population and the effect ofmutations during 50 generations after the initial randomstate. The average number of generations required tofind and fix the target structure is well above this value.The internal structure of the population at generation
50 is illustrated through the representative exampleshown in Figure 2(c) and 2(d). The narrow peak arounda distance d ≃ 9 to the target structure in Figure 2(c)indicates that the phenotypes of the population arelocated close to a suboptimal structure at this distance.Note that most sequences are not folding into the beststructure at this generation, since structures at distancessmaller than the most abundant are also present. Theywill be likely fixed in subsequent generations, represent-ing a further step towards optimization. Since the popu-lation is out of equilibrium and continuously jumping toincreasingly better structures, the spread in the genomespace is smaller than in the optimized case.The distribution of changes in fitness along the first
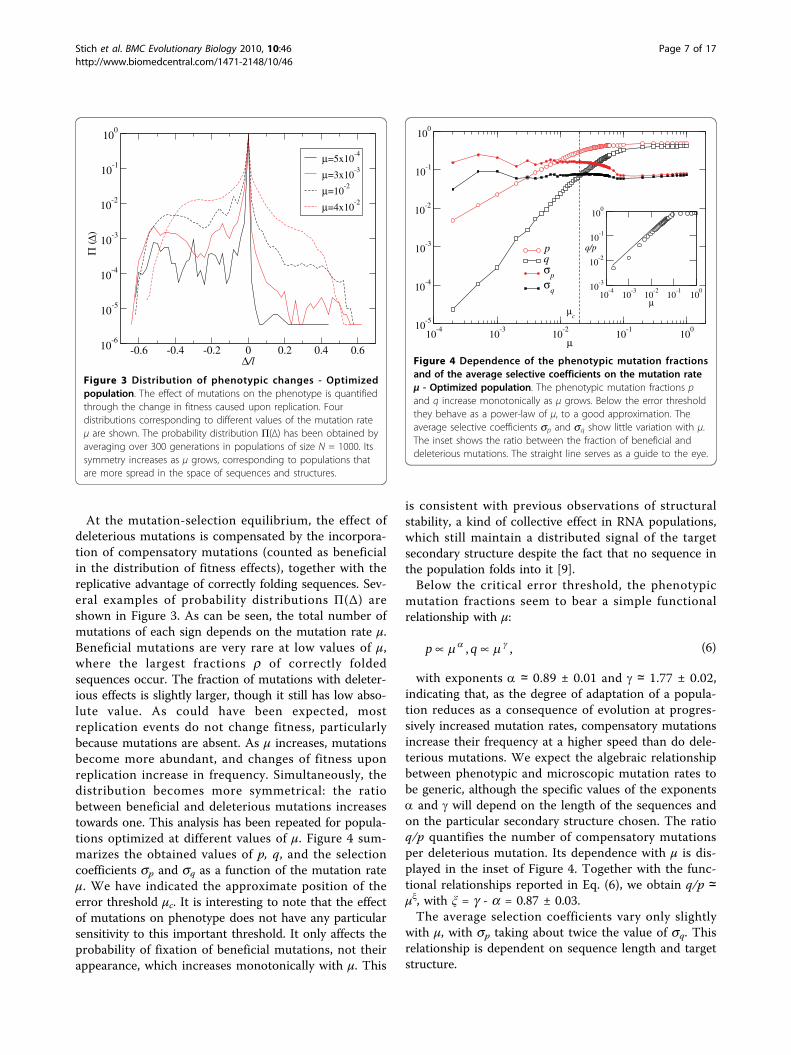
50 generations of adaptation is shown in Figure 5 forfour different values of the mutation rate μ. The overallshape of Π(Δ) is similar to that obtained at the
mutation-selection equilibrium: a larger amount of dele-terious mutations and a tendency of the distribution tobecome symmetrical as μ grows.Figure 6 is the counterpart for adapting populations of
Figure 4. It represents the average fraction of beneficialand deleterious mutations and the corresponding selec-tion coefficients acting in the first 50 generations of evo-lution as a function of the mutation rate μ. Incomparison to an optimized population, the fraction ofdeleterious mutations is slightly smaller than in the opti-mized case, while the fraction of mutations with a posi-tive effect on fitness (whether they are truly beneficialor compensatory) is significantly larger. This fact isexplained by considering that there are many more pos-sibilities of improvement in the suboptimal states visitedby an adapting population. This difference is bigger inthe case of populations that evolve at low μ than inpopulations evolving at high μ. For μ values above theerror threshold, adapting and optimized populationsbehave similarly. The functional dependence of the phe-notypic mutation fractions with μ is of the same type asobserved in an optimized population, Eq. (6). The expo-nents take different values in this case: using a leastsquares fit to the numerical data we obtain a = 0.93 ±0.01 and g = 1.06 ± 0.01. Note the remarkable quantita-tive difference in the behaviour of the ratio q/p, repre-sented in the inset. Though still increasing as a functionof μ, its variation with the mutation rate is much milderthan in the case of optimized populations, as the corre-sponding exponent ξ = 0.13 ± 0.04 indicates. This resultsuggests that in the first stages of adaptation, popula-tions evolving at different error rates are more similarthan the same populations when equilibrium has been
-0.6 -0.4 -0.2 0 0.2 0.4 0.6Δ/l
10-6
10-5
10-4
10-3
10-2
10-1
100
( )
μ=5x10⁻⁴
μ=2x10⁻³
μ=10-2
μ=4x10⁻²
Π Δ
Figure 5 Distribution of phenotypic changes - Adaptingpopulation. Four distributions Π(Δ) corresponding to differentvalues of the mutation rate μ for adapting populations are shown.The probability distribution has been obtained by averaging overthe first 50 generations in six independent runs for populations ofsize N = 1000. Compare these results with those shown in Figure 3.
10-4
10-3
10-2
10-1
100
μ
10-5
10-4
10-3
10-2
10-1
100
pqσ
pσ
q10
-410
-310
-210
-110
0
μ
10-3
10-2
10-1
100
q/p
μc
Figure 6 Dependence of the phenotypic mutation fractionsand of the average selective coefficients on the mutation rateμ - Adapting population. Caption as in Figure 4. Compare theresults shown in the two figures.
Stich et al. BMC Evolutionary Biology 2010, 10:46http://www.biomedcentral.com/1471-2148/10/46
Page 8 of 17
attained. In this case, however, substantial deviationsobserved in the q/p curve suggest that the power-law isnot a good fit in the whole range of μ. The selectivevalue of mutations is, both for beneficial and deleteriouschanges, typically lower than in the optimized case.Adaptation takes place through an increase in the frac-tion of beneficial mutations. In natural systems, muta-tions with a large effect on fitness can mask beneficialmutations with a small effect, which are then not identi-fied during evolution (see [25] and references therein).Perturbed populationsAn optimized population can be shifted from equili-brium through the action of an external perturbation.Severe population bottlenecks, very common in the nat-ural environment of highly heterogeneous populationssuch as RNA viruses, force the population to regeneratefrom one or a few individuals. The dynamics of this pro-cess can be simulated in our scenario. Consider an opti-mized population that has evolved until reachingmutation-selection equilibrium, as described. Take oneof the sequences in the population and let it replicateduring g generations. Now the growth of the populationis unconstrained until reaching the size N = 1000.In practice, the sequence selected at the bottleneck
has an average number ⟨c⟩ of daughter sequences pergeneration defined as
c d li= −2 2exp( / ). (7)
This dynamical rule applies now to the case of agrowing population and substitutes the definition ofreplicative ability given in Eq. (1), the latter applying topopulations of constant size. If the sequence at the bot-tleneck folds into the target structure, then ⟨c⟩ = 2,meaning that it duplicates on the average at eachgeneration. Suboptimal sequences (with di > 0) replicateat a slower pace. Note that the relative advantageof sequences folding into structures at relative distancem is the same as for the case of constant populations,Eq. (2).If the number g of generations elapsed between bottle-
necks is large enough, the population will be able torecover and again attain mutation-selection equilibrium.As g decreases, the time for optimization becomesshorter and, for g small enough, the total populationwill not be capable of achieving the optimum. Still, sur-vival might be possible. At too low values of g, however,the perturbation becomes too strong and the fewsequences after the bottleneck might be unable to repli-cate, in which case the population goes extinct.For optimized and adapting populations, the mutation
rate μ is the main source of randomness in the system,permitting as well change and improvement. Populationbottlenecks constitute an additional source of
stochasticity and represent a stronger perturbation,since selecting a random sequence to found a newpopulation implies choosing a suboptimal structure witha probability of at least 1 - r. In those cases, the popula-tion faces two important difficulties: first, it has to goagain through the adapting transient, where the targetstructure has not yet been found; second, the reductionin the population size impairs the capability of theensemble to generate beneficial variants.Figure 2(e) and 2(f) show the typical structure of a
population 20 generations after a bottleneck. A sequenceat a large distance from the optimum was selected bychance, such that, after 20 generations, the population isstill far from finding the target structure, and formed atthat moment by two groups that are identified as thetwo peaks in the distribution of structural distances. Itis interesting how concentrated the population is insequence space [Figure 2(f)], due to the clonal regenera-tion and the short time elapsed from the commonancestor of all sequences.The dynamics of three populations under the action of
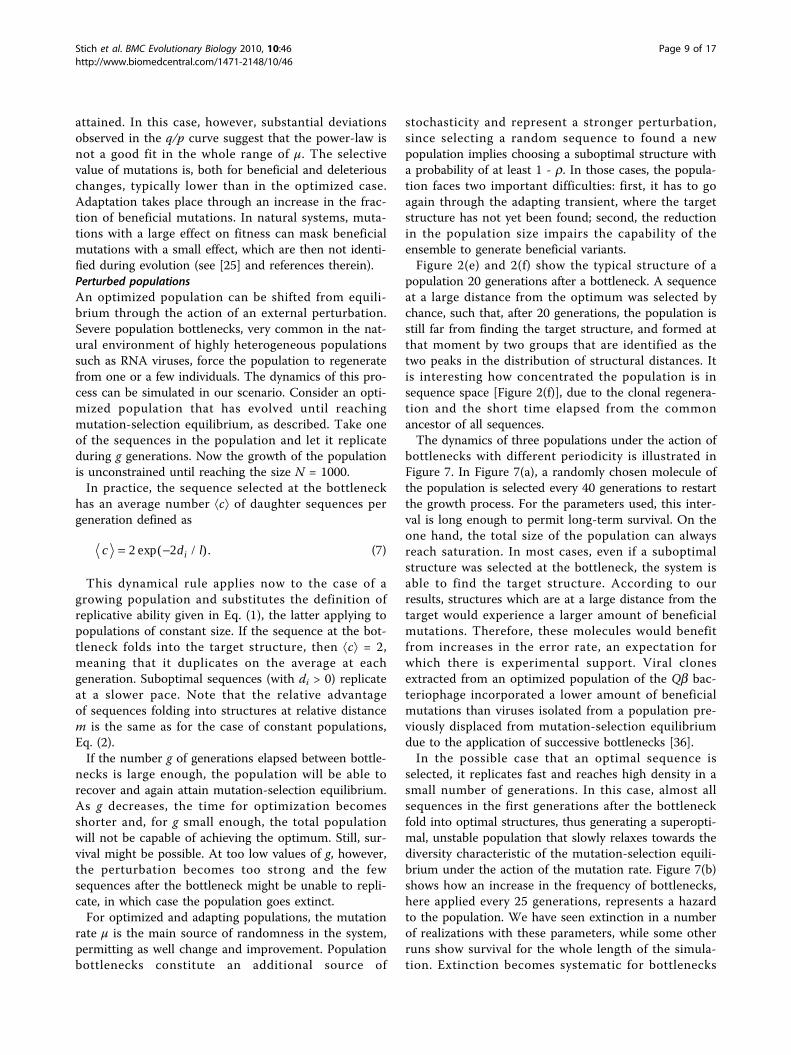
bottlenecks with different periodicity is illustrated inFigure 7. In Figure 7(a), a randomly chosen molecule ofthe population is selected every 40 generations to restartthe growth process. For the parameters used, this inter-val is long enough to permit long-term survival. On theone hand, the total size of the population can alwaysreach saturation. In most cases, even if a suboptimalstructure was selected at the bottleneck, the system isable to find the target structure. According to ourresults, structures which are at a large distance from thetarget would experience a larger amount of beneficialmutations. Therefore, these molecules would benefitfrom increases in the error rate, an expectation forwhich there is experimental support. Viral clonesextracted from an optimized population of the Qb bac-teriophage incorporated a lower amount of beneficialmutations than viruses isolated from a population pre-viously displaced from mutation-selection equilibriumdue to the application of successive bottlenecks [36].In the possible case that an optimal sequence is
selected, it replicates fast and reaches high density in asmall number of generations. In this case, almost allsequences in the first generations after the bottleneckfold into optimal structures, thus generating a superopti-mal, unstable population that slowly relaxes towards thediversity characteristic of the mutation-selection equili-brium under the action of the mutation rate. Figure 7(b)shows how an increase in the frequency of bottlenecks,here applied every 25 generations, represents a hazardto the population. We have seen extinction in a numberof realizations with these parameters, while some otherruns show survival for the whole length of the simula-tion. Extinction becomes systematic for bottlenecks
Stich et al. BMC Evolutionary Biology 2010, 10:46http://www.biomedcentral.com/1471-2148/10/46
Page 9 of 17
applied too frequently. In Figure 7(c) the perturbation isapplied every 10 generations and extinction is certain.Note that, irrespectively of the frequency of bottlenecks,any population suffering extreme bottlenecks is con-demned to extinction, since there is a non-zero prob-ability that the molecule chosen at the bottleneck failsto replicate in cases when it is far enough from the opti-mal structure. This argument applies to any number ofmolecules, though as the population increases in sizethis probability becomes negligibly small. The extensionof these results to natural systems has to be done withdue care. For example, extinction is rare in viral popula-tions subject to bottlenecks even when these are appliedat a frequency incompatible with the full regeneration ofthe population [37], due to the ability to recover fitnessthrough a multiplicity of pathways.The critical frequency of bottleneck application for
the population to survive depends on other modelparameters, especially on the mutation rate μ. Lowvalues of μ correspond to a higher density r of
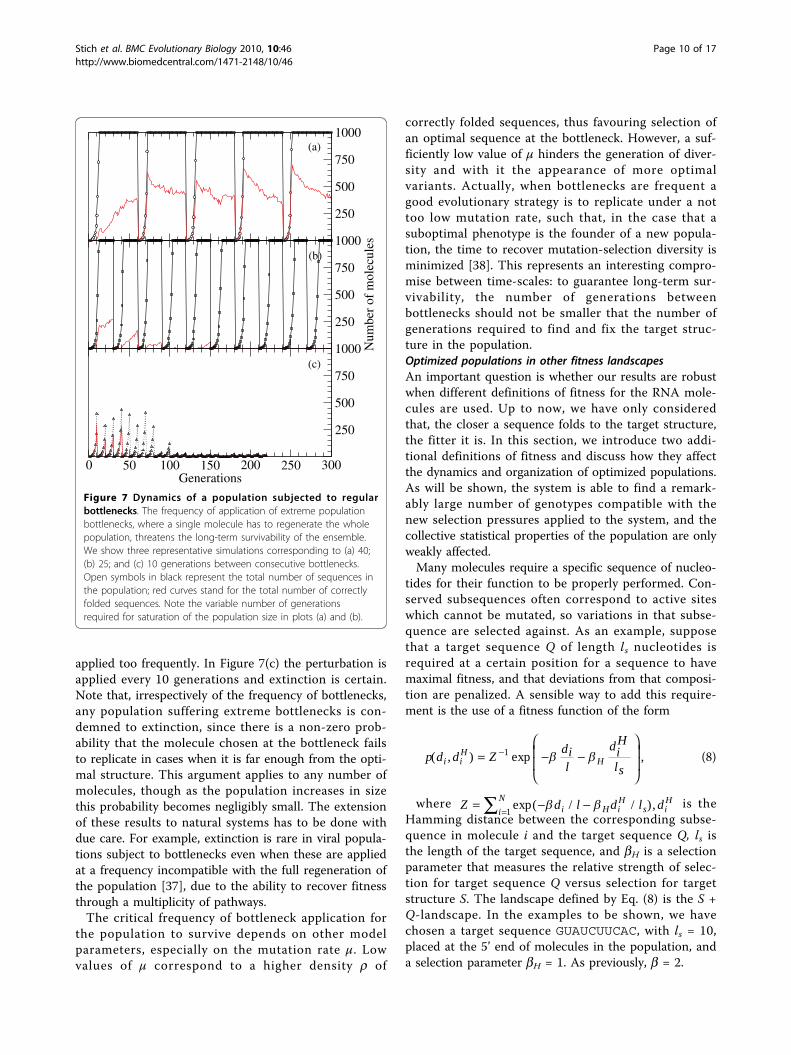
correctly folded sequences, thus favouring selection ofan optimal sequence at the bottleneck. However, a suf-ficiently low value of μ hinders the generation of diver-sity and with it the appearance of more optimalvariants. Actually, when bottlenecks are frequent agood evolutionary strategy is to replicate under a nottoo low mutation rate, such that, in the case that asuboptimal phenotype is the founder of a new popula-tion, the time to recover mutation-selection diversity isminimized [38]. This represents an interesting compro-mise between time-scales: to guarantee long-term sur-vivability, the number of generations betweenbottlenecks should not be smaller that the number ofgenerations required to find and fix the target struc-ture in the population.Optimized populations in other fitness landscapesAn important question is whether our results are robustwhen different definitions of fitness for the RNA mole-cules are used. Up to now, we have only consideredthat, the closer a sequence folds to the target structure,the fitter it is. In this section, we introduce two addi-tional definitions of fitness and discuss how they affectthe dynamics and organization of optimized populations.As will be shown, the system is able to find a remark-ably large number of genotypes compatible with thenew selection pressures applied to the system, and thecollective statistical properties of the population are onlyweakly affected.Many molecules require a specific sequence of nucleo-
tides for their function to be properly performed. Con-served subsequences often correspond to active siteswhich cannot be mutated, so variations in that subse-quence are selected against. As an example, supposethat a target sequence Q of length ls nucleotides isrequired at a certain position for a sequence to havemaximal fitness, and that deviations from that composi-tion are penalized. A sensible way to add this require-ment is the use of a fitness function of the form
p d d Zdil
diH
lsi i
HH( , ) exp ,= − −
⎛
⎝
⎜⎜
⎞
⎠
⎟⎟
−1 (8)
where Z d l d l di H iH
s iH
i
N= − −=∑ exp( / / ), 1
is theHamming distance between the corresponding subse-quence in molecule i and the target sequence Q, ls isthe length of the target sequence, and bH is a selectionparameter that measures the relative strength of selec-tion for target sequence Q versus selection for targetstructure S. The landscape defined by Eq. (8) is the S +Q-landscape. In the examples to be shown, we havechosen a target sequence GUAUCUUCAC, with ls = 10,placed at the 5’ end of molecules in the population, anda selection parameter bH = 1. As previously, b = 2.
0 50 100 150 200 250 300Generations
250
500
750
1000
250
500
750
1000
Num
ber
of m
olec
ules
250
500
750
1000(a)
(b)
(c)
Figure 7 Dynamics of a population subjected to regularbottlenecks. The frequency of application of extreme populationbottlenecks, where a single molecule has to regenerate the wholepopulation, threatens the long-term survivability of the ensemble.We show three representative simulations corresponding to (a) 40;(b) 25; and (c) 10 generations between consecutive bottlenecks.Open symbols in black represent the total number of sequences inthe population; red curves stand for the total number of correctlyfolded sequences. Note the variable number of generationsrequired for saturation of the population size in plots (a) and (b).
Stich et al. BMC Evolutionary Biology 2010, 10:46http://www.biomedcentral.com/1471-2148/10/46
Page 10 of 17
A second important property of folded molecules istheir thermodynamical stability. Usually, sequences fold-ing into configurations of lower energy are at an advan-tage with respect to those of higher energy. Supposethat there is an absolute minimum energy Em forsequences of length l, and call Ei the energy of sequencei folded into its minimum free energy secondary struc-ture. A suitable fitness function to favour low-energyconfigurations is
p d d Zdil
diE
Emi i
EE( , ) exp ,= − −
⎛
⎝
⎜⎜
⎞
⎠
⎟⎟
−1 (9)
where, analogous to previous definitions,
Z d l d E d E Ei E iE
mi
NiE
i m= − −( ) = −=∑ exp / / , 1
is
the distance between the energy of molecule i and thereference energy Em, and bE is a selection parameterthat again measures the relative strength of selection forlow energy versus selection for target structure S. Equa-tion (9) defines the S + E-landscape. In the forthcomingexamples, Em = -72 kcal/mol, which corresponds to theenergy of a sequence of length l = 50 with 23 G=C pairsthat contribute -3 kcal/mol each and where the positivecontribution of the loop has been discarded. This valueof Em is a lower bound to the energy of sequences oflength l = 50. The selection parameter bE = 0.5, and b =2. Let us compare the mutation-selection equilibria ofthree populations evolving on each of the landscapesdescribed under a mutation rate μ = 0.003. In order toevaluate the degree of adaptation achieved for each ofthe traits under selection (structure, sequence, andenergy), three relevant quantities describing the macro-scopic state of these populations are used: as before, thedensity of sequences correctly folding into the targetsequence, the average energy ⟨E⟩ = N-1∑i Ei of the popu-
lation, and the fraction rH of sequences at distance diH
= 0 from the target sequence Q. As previously per-formed, the simulation begins with an ensemble of N =1000 random sequences. At each generation, the quanti-
ties di, diH and/or Ei relevant in each landscape are
evaluated. Substitution by a new generation of offspringsequences proceeds as described.At the mutation-selection equilibrium, we observe the
following. The population evolving in landscape S has r≃ 0.43, its average energy is ⟨E⟩ ≃ -12.3 kcal/mol and rH≃ 0. That is, the required secondary structure has beensuccessfully found but essentially none of the subse-quences matches Q. The energy of the population iscomparable to that of an ensemble of randomly chosensequences folding into the target structure S. Whenselection for sequence is turned on in the S + Q
landscape, there is a fraction r ≃ 0.45 of sequences cor-rectly folding into the target structure. However, thisoccurs simultaneously with a fraction rH ≃ 0.85 ofmolecules bearing the correct target sequence Q. Theaverage energy in this case is comparable to that in theprevious landscape, ⟨E⟩ ≃ -13.0 kcal/mol. Hence, thepopulation has been completely displaced from its posi-tion in the space of sequences (compared to landscapeS), allowing the optimization of a second trait (targetsequence) while keeping other macroscopic valuesessentially unchanged. The third population, evolving onlandscape S + E, is optimized at r ≃ 0.36 with rH ≃ 0.However, its average energy has significantly decreasedto ⟨E⟩ ≃ -28.4 kcal/mol. This again speaks for a majordisplacement in sequence space with respect to the twoprevious landscapes, favouring those sequences foldinginto S with minimum energy, and with a compositionthat does not match the target sequence Q.The target structure S and the target sequence Q can
be simultaneously (and partly independently) optimizedsince Q is compatible with folding into S. This is not ageneral situation, since demanding a target sequencetoo long or too biased in its composition might preventthe existence of solutions fulfilling both requirements.This is also the case for the selection of S together withthe requirement of a low folding energy. If the para-meter bE would take an exceedingly high value, struc-tures of low energy (different from S) would dominatethe population. This is probably the reason why r takesa value slightly lower in landscape S + E than in thetwo former landscapes. While it is important to takethese possibilities into account, our results indicate that,in this model, the simultaneous optimization of twotraits is possible for a broad range of selection para-meters b, bH, and bE.In addition to the different conceptual situations
represented by the three landscapes introduced in thiswork, there are relevant geometrical differences amongthem. Selection for structure represents a rough land-scape where changes in a single nucleotide can causedeep reorganizations in the folded configuration. On thecontrary, selection for a specific sequence represents asmooth landscape where changes in the distance di
H
are strictly proportional to the mutation rate. Actually,for a mutation rate μ the distribution of changes in di
H
is a Poisson distribution of average μl, identical to Eq.(4). The landscape corresponding to selection for lowenergy shares characteristics with both. On the onehand, if mutations acquired through replication do notdisrupt the folded state, changes in energy have to besmall, since only the composition of the sequence isaffected. However, if mutations lead to a different foldedstate, the minimum energy can suffer major changes,due to the appearance of a different distribution of
Stich et al. BMC Evolutionary Biology 2010, 10:46http://www.biomedcentral.com/1471-2148/10/46
Page 11 of 17
structural motifs (stacks, loops and dangling ends) hav-ing a major role in the folded energy.In the next section, we study the distribution of fitness
effects Π(ΔL) corresponding to landscapes S, S + Q, andS + E. The superindex L is generic and corresponds to adifferent variable ΔL for each landscape. To make thethree distributions quantitatively comparable, we have touse rescaled variables in the x-axes, analogous to x =Δ/l, as introduced for landscape S. They are xQ = ΔQ/lfor landscape S + Q and xE = ΔE/l for landscape S + E,with
Δ Δ ΔQ l H Hls
= +
, (10)
where Δ H iH
jHd d= − is the change in distance to tar-
get sequence Q between a mother sequence i and itsdaughter sequence j, and
Δ Δ ΔE l E EEm
= +
, (11)
with ΔE = Ei - Ej.
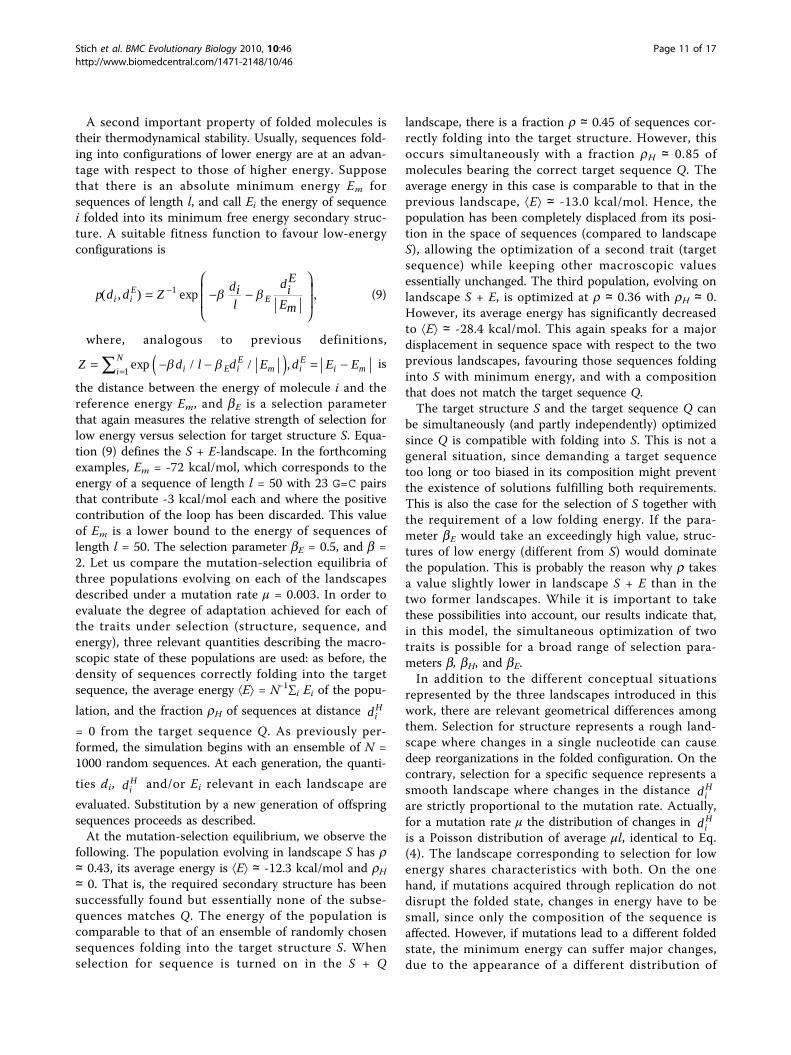
The effects of mutations on fitnessIn this section we discuss some of our results in quanti-tative detail. First, we perform a systematic analysis ofthe functional form of the distribution of fitness effectsfor optimized and adapting populations under selectionfor structure. Second, we analyse the effects on fitnessfor optimized populations in different fitness landscapes.Finally, we derive gross quantities that are usually mea-sured in experimental research, as the fraction of muta-tions causing positive or negative changes in fitnessconditional on the incorporation of a single mutation.Statistical analysis of the distribution of fitness effectsWe have used five different probability density functionsto fit the numerical, cumulative distributions of theeffects of mutations on fitness. Table 1 shows the
functional form of the probability distributions (PD)assayed P(x) and of the corresponding cumulative prob-
ability function (CPF), Q x P x dx( ) ( )≤ = ∫ΛΛ
0. The
results for optimized and adapting populations evolvingunder selection of the secondary structure are compiledin Table 2. Those parameters yield the best fit in eachcase, and have associated errors and R-squared values asshown. As a general trend, we observe that beneficialmutations typically have significantly smaller fitnesseffects than deleterious mutations - in agreement withthe difference in the average selection coefficients calcu-lated previously. This can be seen for instance in the lparameter of exponential fits, in the consistent changesin the shape parameter b for Γ and b distributions, inthe slope a of the Pareto distribution, or in the s valueof the Lognormal distribution.If we were only to consider R-squared values corre-
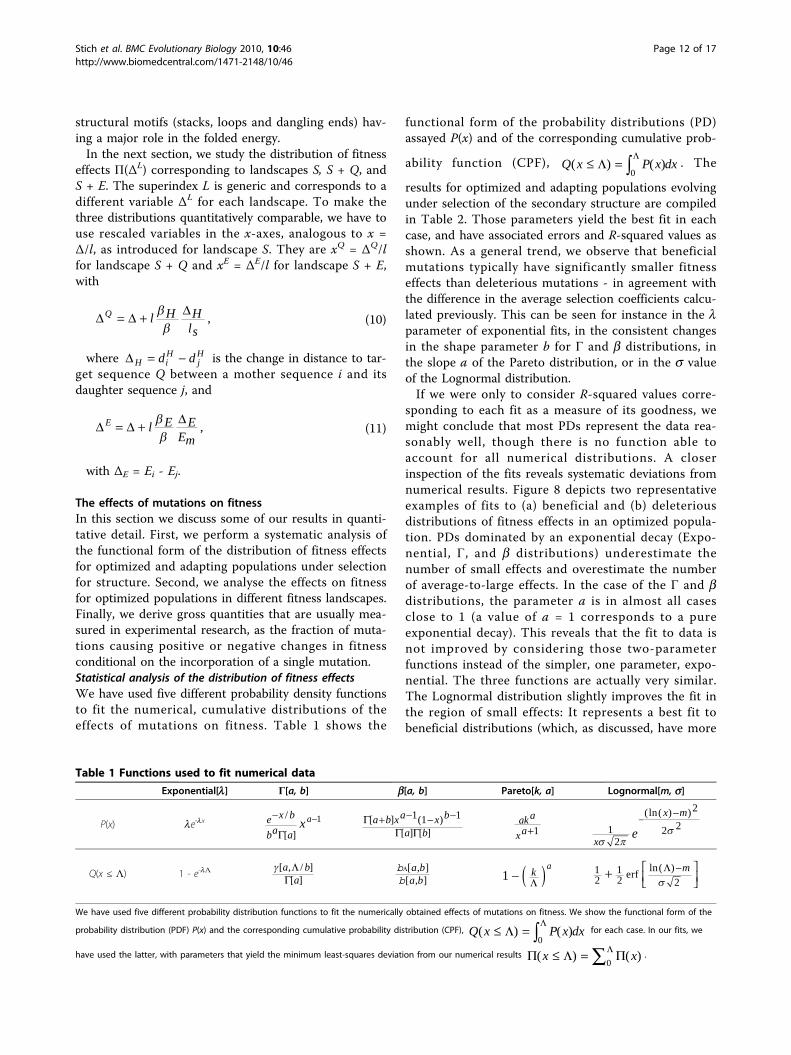
sponding to each fit as a measure of its goodness, wemight conclude that most PDs represent the data rea-sonably well, though there is no function able toaccount for all numerical distributions. A closerinspection of the fits reveals systematic deviations fromnumerical results. Figure 8 depicts two representativeexamples of fits to (a) beneficial and (b) deleteriousdistributions of fitness effects in an optimized popula-tion. PDs dominated by an exponential decay (Expo-nential, Γ, and b distributions) underestimate thenumber of small effects and overestimate the numberof average-to-large effects. In the case of the Γ and bdistributions, the parameter a is in almost all casesclose to 1 (a value of a = 1 corresponds to a pureexponential decay). This reveals that the fit to data isnot improved by considering those two-parameterfunctions instead of the simpler, one parameter, expo-nential. The three functions are actually very similar.The Lognormal distribution slightly improves the fit inthe region of small effects: It represents a best fit tobeneficial distributions (which, as discussed, have more
Table 1 Functions used to fit numerical data
Exponential[l] Γ[a, b] b[a, b] Pareto[k, a] Lognormal[m, s]
P(x) le-lx e x b
ba ax a− −/
[ ]Γ1 Γ
Γ Γ[ ] ( )
[ ] [ ]a b xa x b
a b+ − − −1 1 1 aka
xa+1 12
2
2 2
x
x m
e
−
−(ln( ) )
Q(x ≤ Λ) 1 - e-lΛ [ , / ]
[ ]a b
aΛ
Γbb
Λ[ , ][ , ]a ba b 1 − ( )k
a
Λ12
12 2
+ −⎡⎣⎢
⎤⎦⎥
erfln( )Λ m
We have used five different probability distribution functions to fit the numerically obtained effects of mutations on fitness. We show the functional form of the
probability distribution (PDF) P(x) and the corresponding cumulative probability distribution (CPF), Q x P x dx( ) ( )≤ = ∫ΛΛ
0for each case. In our fits, we
have used the latter, with parameters that yield the minimum least-squares deviation from our numerical results Π Λ ΠΛ( ) ( )x x≤ = ∑0
.
Stich et al. BMC Evolutionary Biology 2010, 10:46http://www.biomedcentral.com/1471-2148/10/46
Page 12 of 17
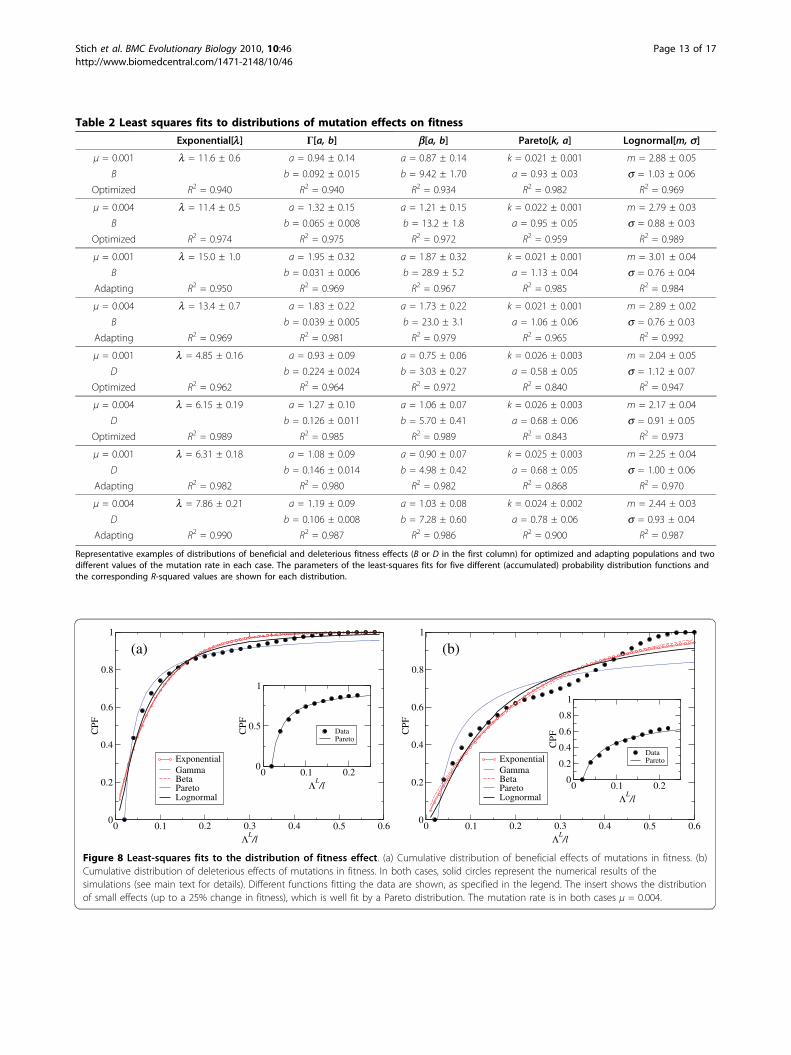
Table 2 Least squares fits to distributions of mutation effects on fitness
Exponential[l] Γ[a, b] b[a, b] Pareto[k, a] Lognormal[m, s]
μ = 0.001 l = 11.6 ± 0.6 a = 0.94 ± 0.14 a = 0.87 ± 0.14 k = 0.021 ± 0.001 m = 2.88 ± 0.05
B b = 0.092 ± 0.015 b = 9.42 ± 1.70 a = 0.93 ± 0.03 s = 1.03 ± 0.06
Optimized R2 = 0.940 R2 = 0.940 R2 = 0.934 R2 = 0.982 R2 = 0.969
μ = 0.004 l = 11.4 ± 0.5 a = 1.32 ± 0.15 a = 1.21 ± 0.15 k = 0.022 ± 0.001 m = 2.79 ± 0.03
B b = 0.065 ± 0.008 b = 13.2 ± 1.8 a = 0.95 ± 0.05 s = 0.88 ± 0.03
Optimized R2 = 0.974 R2 = 0.975 R2 = 0.972 R2 = 0.959 R2 = 0.989
μ = 0.001 l = 15.0 ± 1.0 a = 1.95 ± 0.32 a = 1.87 ± 0.32 k = 0.021 ± 0.001 m = 3.01 ± 0.04
B b = 0.031 ± 0.006 b = 28.9 ± 5.2 a = 1.13 ± 0.04 s = 0.76 ± 0.04
Adapting R2 = 0.950 R2 = 0.969 R2 = 0.967 R2 = 0.985 R2 = 0.984
μ = 0.004 l = 13.4 ± 0.7 a = 1.83 ± 0.22 a = 1.73 ± 0.22 k = 0.021 ± 0.001 m = 2.89 ± 0.02
B b = 0.039 ± 0.005 b = 23.0 ± 3.1 a = 1.06 ± 0.06 s = 0.76 ± 0.03
Adapting R2 = 0.969 R2 = 0.981 R2 = 0.979 R2 = 0.965 R2 = 0.992
μ = 0.001 l = 4.85 ± 0.16 a = 0.93 ± 0.09 a = 0.75 ± 0.06 k = 0.026 ± 0.003 m = 2.04 ± 0.05
D b = 0.224 ± 0.024 b = 3.03 ± 0.27 a = 0.58 ± 0.05 s = 1.12 ± 0.07
Optimized R2 = 0.962 R2 = 0.964 R2 = 0.972 R2 = 0.840 R2 = 0.947
μ = 0.004 l = 6.15 ± 0.19 a = 1.27 ± 0.10 a = 1.06 ± 0.07 k = 0.026 ± 0.003 m = 2.17 ± 0.04
D b = 0.126 ± 0.011 b = 5.70 ± 0.41 a = 0.68 ± 0.06 s = 0.91 ± 0.05
Optimized R2 = 0.989 R2 = 0.985 R2 = 0.989 R2 = 0.843 R2 = 0.973
μ = 0.001 l = 6.31 ± 0.18 a = 1.08 ± 0.09 a = 0.90 ± 0.07 k = 0.025 ± 0.003 m = 2.25 ± 0.04
D b = 0.146 ± 0.014 b = 4.98 ± 0.42 a = 0.68 ± 0.05 s = 1.00 ± 0.06
Adapting R2 = 0.982 R2 = 0.980 R2 = 0.982 R2 = 0.868 R2 = 0.970
μ = 0.004 l = 7.86 ± 0.21 a = 1.19 ± 0.09 a = 1.03 ± 0.08 k = 0.024 ± 0.002 m = 2.44 ± 0.03
D b = 0.106 ± 0.008 b = 7.28 ± 0.60 a = 0.78 ± 0.06 s = 0.93 ± 0.04
Adapting R2 = 0.990 R2 = 0.987 R2 = 0.986 R2 = 0.900 R2 = 0.987
Representative examples of distributions of beneficial and deleterious fitness effects (B or D in the first column) for optimized and adapting populations and twodifferent values of the mutation rate in each case. The parameters of the least-squares fits for five different (accumulated) probability distribution functions andthe corresponding R-squared values are shown for each distribution.
0 0.1 0.2ΛL
/l
0
0.5
1
CPF
DataPareto
0 0.1 0.2 0.3 0.4 0.5 0.6ΛL
/l
0
0.2
0.4
0.6
0.8
1
CPF
ExponentialGammaBetaParetoLognormal
(a)
0 0.1 0.2ΛL
/l
0
0.2
0.4
0.6
0.8
1
CPF
DataPareto
0 0.1 0.2 0.3 0.4 0.5 0.6ΛL
/l
0
0.2
0.4
0.6
0.8
1
CPF
ExponentialGammaBetaParetoLognormal
(b)
Figure 8 Least-squares fits to the distribution of fitness effect. (a) Cumulative distribution of beneficial effects of mutations in fitness. (b)Cumulative distribution of deleterious effects of mutations in fitness. In both cases, solid circles represent the numerical results of thesimulations (see main text for details). Different functions fitting the data are shown, as specified in the legend. The insert shows the distributionof small effects (up to a 25% change in fitness), which is well fit by a Pareto distribution. The mutation rate is in both cases μ = 0.004.
Stich et al. BMC Evolutionary Biology 2010, 10:46http://www.biomedcentral.com/1471-2148/10/46
Page 13 of 17
weight in small effects), though it systematically fails inthe same regions as functions characterized by expo-nential decays.None of the functions assayed are thus able to explain
the shape of the distributions obtained in the wholedomain of changes in fitness. One reason might be thatour sequences are relatively short and thus fold intosmall secondary structures. We cannot discard thatlarge effects on fitness could be affected by structuralmotifs of the particular target secondary structure stu-died in this work (e.g. the prominent shoulder observedin several distributions of deleterious fitness effects isprobably caused by global disruptions of the target sec-ondary structure).The distribution of small effects on fitness, which con-
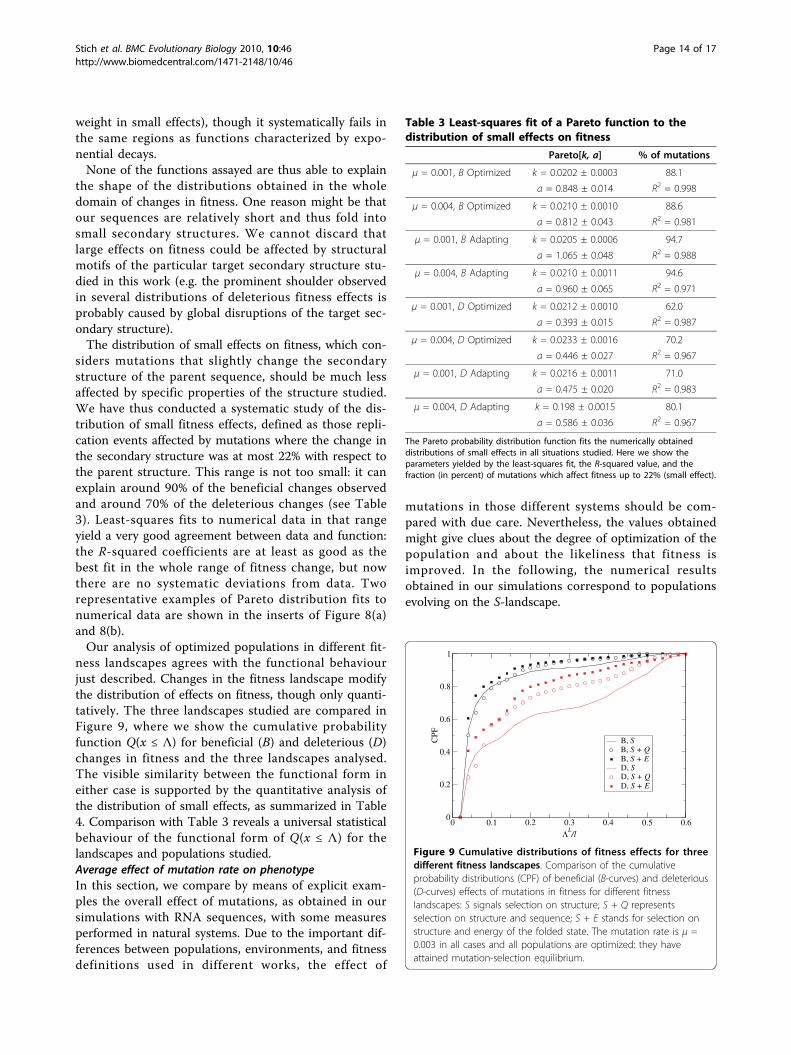
siders mutations that slightly change the secondarystructure of the parent sequence, should be much lessaffected by specific properties of the structure studied.We have thus conducted a systematic study of the dis-tribution of small fitness effects, defined as those repli-cation events affected by mutations where the change inthe secondary structure was at most 22% with respect tothe parent structure. This range is not too small: it canexplain around 90% of the beneficial changes observedand around 70% of the deleterious changes (see Table3). Least-squares fits to numerical data in that rangeyield a very good agreement between data and function:the R-squared coefficients are at least as good as thebest fit in the whole range of fitness change, but nowthere are no systematic deviations from data. Tworepresentative examples of Pareto distribution fits tonumerical data are shown in the inserts of Figure 8(a)and 8(b).Our analysis of optimized populations in different fit-
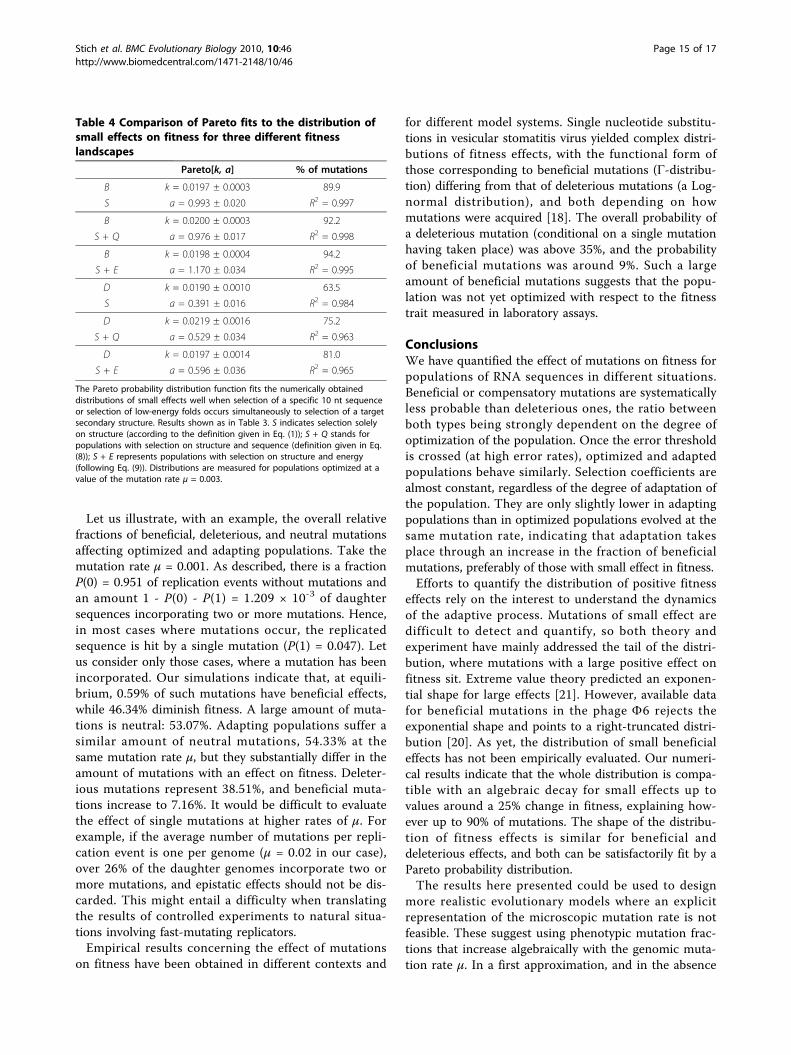
ness landscapes agrees with the functional behaviourjust described. Changes in the fitness landscape modifythe distribution of effects on fitness, though only quanti-tatively. The three landscapes studied are compared inFigure 9, where we show the cumulative probabilityfunction Q(x ≤ Λ) for beneficial (B) and deleterious (D)changes in fitness and the three landscapes analysed.The visible similarity between the functional form ineither case is supported by the quantitative analysis ofthe distribution of small effects, as summarized in Table4. Comparison with Table 3 reveals a universal statisticalbehaviour of the functional form of Q(x ≤ Λ) for thelandscapes and populations studied.Average effect of mutation rate on phenotypeIn this section, we compare by means of explicit exam-ples the overall effect of mutations, as obtained in oursimulations with RNA sequences, with some measuresperformed in natural systems. Due to the important dif-ferences between populations, environments, and fitnessdefinitions used in different works, the effect of
mutations in those different systems should be com-pared with due care. Nevertheless, the values obtainedmight give clues about the degree of optimization of thepopulation and about the likeliness that fitness isimproved. In the following, the numerical resultsobtained in our simulations correspond to populationsevolving on the S-landscape.
Table 3 Least-squares fit of a Pareto function to thedistribution of small effects on fitness
Pareto[k, a] % of mutations
μ = 0.001, B Optimized k = 0.0202 ± 0.0003 88.1
a = 0.848 ± 0.014 R2 = 0.998
μ = 0.004, B Optimized k = 0.0210 ± 0.0010 88.6
a = 0.812 ± 0.043 R2 = 0.981
μ = 0.001, B Adapting k = 0.0205 ± 0.0006 94.7
a = 1.065 ± 0.048 R2 = 0.988
μ = 0.004, B Adapting k = 0.0210 ± 0.0011 94.6
a = 0.960 ± 0.065 R2 = 0.971
μ = 0.001, D Optimized k = 0.0212 ± 0.0010 62.0
a = 0.393 ± 0.015 R2 = 0.987
μ = 0.004, D Optimized k = 0.0233 ± 0.0016 70.2
a = 0.446 ± 0.027 R2 = 0.967
μ = 0.001, D Adapting k = 0.0216 ± 0.0011 71.0
a = 0.475 ± 0.020 R2 = 0.983
μ = 0.004, D Adapting k = 0.198 ± 0.0015 80.1
a = 0.586 ± 0.036 R2 = 0.967
The Pareto probability distribution function fits the numerically obtaineddistributions of small effects in all situations studied. Here we show theparameters yielded by the least-squares fit, the R-squared value, and thefraction (in percent) of mutations which affect fitness up to 22% (small effect).
0 0.1 0.2 0.3 0.4 0.5 0.6ΛL
/l
0
0.2
0.4
0.6
0.8
1
CPF
B, SB, S + QB, S + ED, SD, S + QD, S + E
Figure 9 Cumulative distributions of fitness effects for threedifferent fitness landscapes. Comparison of the cumulativeprobability distributions (CPF) of beneficial (B-curves) and deleterious(D-curves) effects of mutations in fitness for different fitnesslandscapes: S signals selection on structure; S + Q representsselection on structure and sequence; S + E stands for selection onstructure and energy of the folded state. The mutation rate is μ =0.003 in all cases and all populations are optimized: they haveattained mutation-selection equilibrium.
Stich et al. BMC Evolutionary Biology 2010, 10:46http://www.biomedcentral.com/1471-2148/10/46
Page 14 of 17
Let us illustrate, with an example, the overall relativefractions of beneficial, deleterious, and neutral mutationsaffecting optimized and adapting populations. Take themutation rate μ = 0.001. As described, there is a fractionP(0) = 0.951 of replication events without mutations andan amount 1 - P(0) - P(1) = 1.209 × 10⁻³ of daughtersequences incorporating two or more mutations. Hence,in most cases where mutations occur, the replicatedsequence is hit by a single mutation (P(1) = 0.047). Letus consider only those cases, where a mutation has beenincorporated. Our simulations indicate that, at equili-brium, 0.59% of such mutations have beneficial effects,while 46.34% diminish fitness. A large amount of muta-tions is neutral: 53.07%. Adapting populations suffer asimilar amount of neutral mutations, 54.33% at thesame mutation rate μ, but they substantially differ in theamount of mutations with an effect on fitness. Deleter-ious mutations represent 38.51%, and beneficial muta-tions increase to 7.16%. It would be difficult to evaluatethe effect of single mutations at higher rates of μ. Forexample, if the average number of mutations per repli-cation event is one per genome (μ = 0.02 in our case),over 26% of the daughter genomes incorporate two ormore mutations, and epistatic effects should not be dis-carded. This might entail a difficulty when translatingthe results of controlled experiments to natural situa-tions involving fast-mutating replicators.Empirical results concerning the effect of mutations
on fitness have been obtained in different contexts and
for different model systems. Single nucleotide substitu-tions in vesicular stomatitis virus yielded complex distri-butions of fitness effects, with the functional form ofthose corresponding to beneficial mutations (Γ-distribu-tion) differing from that of deleterious mutations (a Log-normal distribution), and both depending on howmutations were acquired [18]. The overall probability ofa deleterious mutation (conditional on a single mutationhaving taken place) was above 35%, and the probabilityof beneficial mutations was around 9%. Such a largeamount of beneficial mutations suggests that the popu-lation was not yet optimized with respect to the fitnesstrait measured in laboratory assays.
ConclusionsWe have quantified the effect of mutations on fitness forpopulations of RNA sequences in different situations.Beneficial or compensatory mutations are systematicallyless probable than deleterious ones, the ratio betweenboth types being strongly dependent on the degree ofoptimization of the population. Once the error thresholdis crossed (at high error rates), optimized and adaptedpopulations behave similarly. Selection coefficients arealmost constant, regardless of the degree of adaptation ofthe population. They are only slightly lower in adaptingpopulations than in optimized populations evolved at thesame mutation rate, indicating that adaptation takesplace through an increase in the fraction of beneficialmutations, preferably of those with small effect in fitness.Efforts to quantify the distribution of positive fitness
effects rely on the interest to understand the dynamicsof the adaptive process. Mutations of small effect aredifficult to detect and quantify, so both theory andexperiment have mainly addressed the tail of the distri-bution, where mutations with a large positive effect onfitness sit. Extreme value theory predicted an exponen-tial shape for large effects [21]. However, available datafor beneficial mutations in the phage F6 rejects theexponential shape and points to a right-truncated distri-bution [20]. As yet, the distribution of small beneficialeffects has not been empirically evaluated. Our numeri-cal results indicate that the whole distribution is compa-tible with an algebraic decay for small effects up tovalues around a 25% change in fitness, explaining how-ever up to 90% of mutations. The shape of the distribu-tion of fitness effects is similar for beneficial anddeleterious effects, and both can be satisfactorily fit by aPareto probability distribution.The results here presented could be used to design
more realistic evolutionary models where an explicitrepresentation of the microscopic mutation rate is notfeasible. These suggest using phenotypic mutation frac-tions that increase algebraically with the genomic muta-tion rate μ. In a first approximation, and in the absence
Table 4 Comparison of Pareto fits to the distribution ofsmall effects on fitness for three different fitnesslandscapes
Pareto[k, a] % of mutations
B k = 0.0197 ± 0.0003 89.9
S a = 0.993 ± 0.020 R2 = 0.997
B k = 0.0200 ± 0.0003 92.2
S + Q a = 0.976 ± 0.017 R2 = 0.998
B k = 0.0198 ± 0.0004 94.2
S + E a = 1.170 ± 0.034 R2 = 0.995
D k = 0.0190 ± 0.0010 63.5
S a = 0.391 ± 0.016 R2 = 0.984
D k = 0.0219 ± 0.0016 75.2
S + Q a = 0.529 ± 0.034 R2 = 0.963
D k = 0.0197 ± 0.0014 81.0
S + E a = 0.596 ± 0.036 R2 = 0.965
The Pareto probability distribution function fits the numerically obtaineddistributions of small effects well when selection of a specific 10 nt sequenceor selection of low-energy folds occurs simultaneously to selection of a targetsecondary structure. Results shown as in Table 3. S indicates selection solelyon structure (according to the definition given in Eq. (1)); S + Q stands forpopulations with selection on structure and sequence (definition given in Eq.(8)); S + E represents populations with selection on structure and energy(following Eq. (9)). Distributions are measured for populations optimized at avalue of the mutation rate μ = 0.003.
Stich et al. BMC Evolutionary Biology 2010, 10:46http://www.biomedcentral.com/1471-2148/10/46
Page 15 of 17
of additional evidence, it would be advisable to maintainconstant selection coefficients. As a consequence, atleast in the system that we have studied, fitness equili-bria are reached and maintained mainly through com-pensatory epistasis, and not through a variation in theaverage selective coefficients with fitness. This result isin good agreement with recent measurements of thesame effects in populations of the bacteriophage FX174,where, moreover, the distributions of beneficial anddeleterious fitness effects follow a single functional form[6], as obtained here.The restrictions imposed by the simultaneous selec-
tion of more than one phenotypic trait is an importantsubject worthy of additional analysis. Landscapes suchas those introduced here could be a first step towardsthe quantification of constraints in evolution and adap-tation of complex populations. Despite remarkable dif-ferences among the situations investigated, thedistributions of effects on fitness are best explained by aunique functional form (at least for small effects) irre-spectively of the state of adaptation of the population(whether optimized or adapting) and of the fitness land-scape on which the population evolves (S, S + Q, or S +E). One of our future objectives is to deepen the studyof the universality of these and similar models, analyzingwhether populations differing in their fitness valuesacross environments, evolving towards different targetstructures, or incorporating a larger number of realisticphenotypic traits, still adapt through an increase in theamount of beneficial mutations with small effects on fit-ness, and whether the functional form of the distribu-tion of fitness effects agrees with those obtained here.
MethodsSimulations have been carried out at the Itanium IIcluster of INTA (Instituto Nacional de Técnica Aeroe-spacial, Spain). For random number generation, werelied on the Mersenne Twister and Ziff’s GFSR4 algo-rithms as provided by GNU Scientific Library (GSL),Version 1.7 [39]. For secondary structure folding (mini-mum free energy) and calculation of base-pair andHamming distances, we use the Vienna RNA package[32], version 1.5, with the current standard parameterset. Nonlinear regressions to probability distributionfunctions were performed with the Statistics packages ofMathematica 5.2.
AcknowledgementsUseful discussions with J. Aguirre are gratefully acknowledged. We thank D.Hochberg for a careful reading of the manuscript. Support from the SpanishMICINN through research project FIS2008-05273 is gratefully acknowledged.
Authors’ contributionsMS, EL, and SCM conceived and designed the research. MS performed thesimulations. MS, EL, and SCM analyzed the data. EL and SCM performed the
statistical analysis. SCM wrote the paper. All authors read and approved thefinal manuscript.
Received: 14 May 2009Accepted: 17 February 2010 Published: 17 February 2010
References1. de Visser JAGM, Rozen DE: Limits to adaptation in asexual populations. J
Evol Biol 2005, 18:779-788.2. Wilke CO, Lenski RE, Adami C: Compensatory mutations cause excess of
antagonistic epistasis in RNA secondary structure folding. BMC Evol Biol2003, 3:3.
3. Domingo E, Holland JJ: RNA virus mutations and fitness for survival. AnnuRev Microbiol 1997, 51:151-178.
4. Lázaro E, Escarmís C, Domingo E, Manrubia SC: Modeling viral genomefitness evolution associated with serial bottleneck events: Evidence ofstationary states of fitness. J Virol 2002, 76:8675-8681.
5. Lázaro E, Escarmís C, Pérez-Mercader J, Manrubia SC, Domingo E:Resistance of virus to extinction upon bottleneck passages: study of adecaying and fluctuating pattern of fitness loss. Proc Natl Acad Sci USA2003, 100:10830-10835.
6. Silander OK, Tenaillon O, Chao L: Understanding the evolutionary fate offinite populations: The dynamics of mutational effects. PLoS Biol 2007,5:922-931.
7. Huynen MA, Stadler PF, Fontana W: Smoothness within ruggedness: therole of neutrality in adaptation. Proc Natl Acad Sci USA 1996, 93:397-401.
8. Koelle K, Cobey S, Grenfell B, Pascual M: Epochal evolution shapes thephylodynamics of interpandemic influenza A (H3N2) in humans. Science2006, 314:1898-1903.
9. Stich M, Briones C, Manrubia SC: Collective properties of evolvingmolecular quasispecies. BMC Evol Biol 2007, 7:110.
10. Kimura M: On the evolutionary adjustment of spontaneous mutationrates. Genet Res 1967, 9:23-34.
11. Leigh EG: Natural selection and mutability. Am Nat 1970, 104:301-305.12. Ishii K, Matsuda H, Iwasa Y, Sasaki A: Evolutionary stable mutation rate in
a periodically changing environment. Genetics 1989, 121:163-174.13. Kimura M, Maruyama T: The mutational load with epistatic interactions in
fitness. Genetics 1966, 54:1337-1351.14. Gillespie J: A simple stochastic gene substitution model. Theor Pop Biol
1983, 23:202-215.15. Orr HA: The distribution of fitness effects among beneficial mutations.
Genetics 2003, 163:1519-1526.16. Agrawal AF: Genetic loads under fitness-dependent mutation rates. J Evol
Biol 2002, 15:1004-1010.17. Martin G, Lenormand T: The fitness effect of mutations across
environments: A survey in the light of fitness landscape models.Evolution 2006, 60:2413-2427.
18. Sanjuán R, Moya A, Elena SF: The distribution of fitness effects caused bysingle-nucleotide substitutions in an RNA virus. Proc Natl Acad Sci USA2004, 101:8396-8401.
19. Rokyta DR, Joyce P, Caudle SB, Wichman HA: An empirical test of themutational landscape model of adaptation using a single-stranded DNAvirus. Nat Gen 2005, 37:441-444.
20. Rokyta DR, Beisel CJ, Joyce P, Ferris MT, Burch CL, Wichman HA: Beneficialfitness effects are not exponential for two viruses. J Mol Evol 2008,67:368-376.
21. Eyre-Walker A, Keightley PD: The distribution of fitness effects of newmutations. Nat Rev Genet 2007, 8:610-618.
22. Fisher RA: The genetical theory of natural selection Oxford University Press,Oxford, England 1930.
23. Lande R: The response to selection on major and minor mutationsaffecting a metrical trait. Heredity 1983, 50:47-65.
24. Orr HA: The population genetics of adaptation: the distribution of factorsfixed during adaptive evolution. Evolution 1998, 52:935-949.
25. Bull JJ, Badgett MR, Wichman HA: Big-Benefit mutations in abacteriophage inhibited with heat. Mol Biol Evol 2000, 17:942-950.
26. Barrett RDH, McLean RC, Bell G: Mutations of intermediate effect areresponsible for adaptation in evolving Pseudomonas fluorescenspopulations. Biol Lett 2006, 2:236-238.
27. Mc Lean RC, Buckling A: The distribution of fitness effects of beneficialmutations in Pseudomonas aeruginosa. PLoS Genetics 2009, 5:e1000406.
Stich et al. BMC Evolutionary Biology 2010, 10:46http://www.biomedcentral.com/1471-2148/10/46
Page 16 of 17
28. Kassen R, Bataillon T: Distribution of fitness effects among beneficialmutations before selection in experimental populations of bacteria. NatGen 2006, 38:484-488.
29. Hegreness M, Shoresh N, Hartl D, Kishony R: An equivalence principle forthe incorporation of favourable mutations in asexual populations.Science 2006, 311:1615-1617.
30. Cowperthwaite MC, Bull JJ, Ancel Meyers L: Distribution of beneficialfitness effects in RNA. Genetics 2005, 170:1449-1457.
31. Schuster P: Prediction of RNA Secondary Structures: From Theory toModels and Real Molecules. Rep Prog Phys 2006, 69:1419-1477.
32. Hofacker IL, Fontana W, Stadler PF, Bonhoeffer LS, Tacker M, Schuster P:Fast Folding and Comparison of RNA Secondary Structures. MonatshChem 1994, 125:167-188.
33. Stein PR, Waterman MS: On some new sequences generalizing theCatalan and Motzkin numbers. Discrete Math 1978, 26:261-272.
34. Stich M, Briones C, Manrubia SC: On the structural repertoire of pools ofshort, random RNA sequences. J Theor Biol 2008, 252:750-763.
35. Wilke CO: Adaptive evolution on neutral networks. Bull Math Biol 2001,63:715-730.
36. Cases-González C, Arribas M, Domingo E, Lázaro E: Beneficial Effects ofPopulation Bottlenecks in an RNA Virus Evolving at Increased Error Rate.J Mol Biol 2008, 384:1120-1129.
37. Escarmís C, Gómez-Mariano G, Dávila M, Lázaro E, Domingo E: Resistanceto extinction of low fitness virus subjected to plaque-to-plaquetransfers: Diversification by mutation clustering. J Mol Biol 2002,315:647-661.
38. Aguirre J, Lázaro E, Manrubia SC: A trade-off between fast growth anddiversity generation limits the optimization of viral quasispecies. J TheorBiol 2009, 261:148-155.
39. GNU Scientific Library (GSL). http://www.gnu.org/software/gsl/.
doi:10.1186/1471-2148-10-46Cite this article as: Stich et al.: Phenotypic effect of mutations inevolving populations of RNA molecules. BMC Evolutionary Biology 201010:46.
Submit your next manuscript to BioMed Centraland take full advantage of:
• Convenient online submission
• Thorough peer review
• No space constraints or color figure charges
• Immediate publication on acceptance
• Inclusion in PubMed, CAS, Scopus and Google Scholar
• Research which is freely available for redistribution
Submit your manuscript at www.biomedcentral.com/submit
Stich et al. BMC Evolutionary Biology 2010, 10:46http://www.biomedcentral.com/1471-2148/10/46
Page 17 of 17