Embed Size (px)
Citation preview
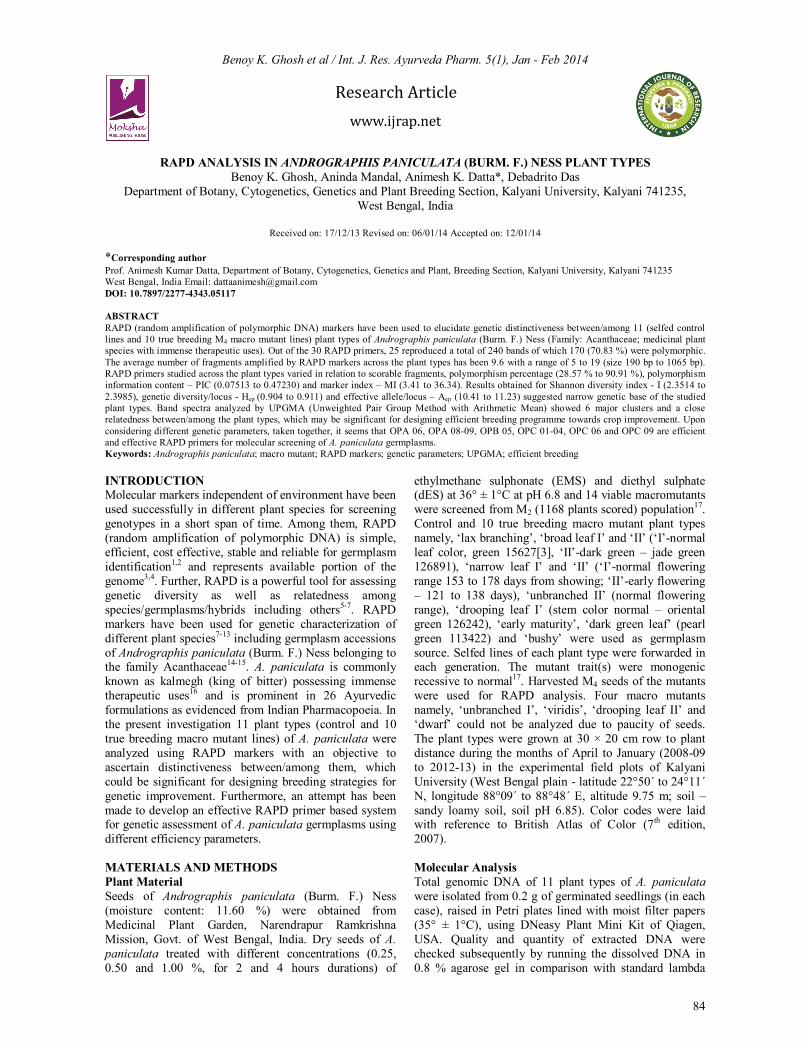
Benoy K. Ghosh et al / Int. J. Res. Ayurveda Pharm. 5(1), Jan - Feb 2014
84
Research Article www.ijrap.net
RAPD ANALYSIS IN ANDROGRAPHIS PANICULATA (BURM. F.) NESS PLANT TYPES
Benoy K. Ghosh, Aninda Mandal, Animesh K. Datta*, Debadrito Das Department of Botany, Cytogenetics, Genetics and Plant Breeding Section, Kalyani University, Kalyani 741235,
West Bengal, India
Received on: 17/12/13 Revised on: 06/01/14 Accepted on: 12/01/14 *Corresponding author Prof. Animesh Kumar Datta, Department of Botany, Cytogenetics, Genetics and Plant, Breeding Section, Kalyani University, Kalyani 741235 West Bengal, India Email: [email protected] DOI: 10.7897/2277-4343.05117 ABSTRACT RAPD (random amplification of polymorphic DNA) markers have been used to elucidate genetic distinctiveness between/among 11 (selfed control lines and 10 true breeding M4 macro mutant lines) plant types of Andrographis paniculata (Burm. F.) Ness (Family: Acanthaceae; medicinal plant species with immense therapeutic uses). Out of the 30 RAPD primers, 25 reproduced a total of 240 bands of which 170 (70.83 %) were polymorphic. The average number of fragments amplified by RAPD markers across the plant types has been 9.6 with a range of 5 to 19 (size 190 bp to 1065 bp). RAPD primers studied across the plant types varied in relation to scorable fragments, polymorphism percentage (28.57 % to 90.91 %), polymorphism information content – PIC (0.07513 to 0.47230) and marker index – MI (3.41 to 36.34). Results obtained for Shannon diversity index - I (2.3514 to 2.3985), genetic diversity/locus - Hep (0.904 to 0.911) and effective allele/locus – Aep (10.41 to 11.23) suggested narrow genetic base of the studied plant types. Band spectra analyzed by UPGMA (Unweighted Pair Group Method with Arithmetic Mean) showed 6 major clusters and a close relatedness between/among the plant types, which may be significant for designing efficient breeding programme towards crop improvement. Upon considering different genetic parameters, taken together, it seems that OPA 06, OPA 08-09, OPB 05, OPC 01-04, OPC 06 and OPC 09 are efficient and effective RAPD primers for molecular screening of A. paniculata germplasms. Keywords: Andrographis paniculata; macro mutant; RAPD markers; genetic parameters; UPGMA; efficient breeding INTRODUCTION Molecular markers independent of environment have been used successfully in different plant species for screening genotypes in a short span of time. Among them, RAPD (random amplification of polymorphic DNA) is simple, efficient, cost effective, stable and reliable for germplasm identification1,2 and represents available portion of the genome3,4. Further, RAPD is a powerful tool for assessing genetic diversity as well as relatedness among species/germplasms/hybrids including others5-7. RAPD markers have been used for genetic characterization of different plant species7-13 including germplasm accessions of Andrographis paniculata (Burm. F.) Ness belonging to the family Acanthaceae14-15. A. paniculata is commonly known as kalmegh (king of bitter) possessing immense therapeutic uses16 and is prominent in 26 Ayurvedic formulations as evidenced from Indian Pharmacopoeia. In the present investigation 11 plant types (control and 10 true breeding macro mutant lines) of A. paniculata were analyzed using RAPD markers with an objective to ascertain distinctiveness between/among them, which could be significant for designing breeding strategies for genetic improvement. Furthermore, an attempt has been made to develop an effective RAPD primer based system for genetic assessment of A. paniculata germplasms using different efficiency parameters. MATERIALS AND METHODS Plant Material Seeds of Andrographis paniculata (Burm. F.) Ness (moisture content: 11.60 %) were obtained from Medicinal Plant Garden, Narendrapur Ramkrishna Mission, Govt. of West Bengal, India. Dry seeds of A. paniculata treated with different concentrations (0.25, 0.50 and 1.00 %, for 2 and 4 hours durations) of
ethylmethane sulphonate (EMS) and diethyl sulphate (dES) at 36° ± 1°C at pH 6.8 and 14 viable macromutants were screened from M2 (1168 plants scored) population17. Control and 10 true breeding macro mutant plant types namely, ‘lax branching’, ‘broad leaf I’ and ‘II’ (‘I’-normal leaf color, green 15627[3], ‘II’-dark green – jade green 126891), ‘narrow leaf I’ and ‘II’ (‘I’-normal flowering range 153 to 178 days from showing; ‘II’-early flowering – 121 to 138 days), ‘unbranched II’ (normal flowering range), ‘drooping leaf I’ (stem color normal – oriental green 126242), ‘early maturity’, ‘dark green leaf’ (pearl green 113422) and ‘bushy’ were used as germplasm source. Selfed lines of each plant type were forwarded in each generation. The mutant trait(s) were monogenic recessive to normal17. Harvested M4 seeds of the mutants were used for RAPD analysis. Four macro mutants namely, ‘unbranched I’, ‘viridis’, ‘drooping leaf II’ and ‘dwarf’ could not be analyzed due to paucity of seeds. The plant types were grown at 30 × 20 cm row to plant distance during the months of April to January (2008-09 to 2012-13) in the experimental field plots of Kalyani University (West Bengal plain - latitude 22°50´ to 24°11´ N, longitude 88°09 ́ to 88°48 ́ E, altitude 9.75 m; soil – sandy loamy soil, soil pH 6.85). Color codes were laid with reference to British Atlas of Color (7th edition, 2007). Molecular Analysis Total genomic DNA of 11 plant types of A. paniculata were isolated from 0.2 g of germinated seedlings (in each case), raised in Petri plates lined with moist filter papers (35° ± 1°C), using DNeasy Plant Mini Kit of Qiagen, USA. Quality and quantity of extracted DNA were checked subsequently by running the dissolved DNA in 0.8 % agarose gel in comparison with standard lambda
Benoy K. Ghosh et al / Int. J. Res. Ayurveda Pharm. 5(1), Jan - Feb 2014
85
DNA marker of known concentration. The DNA from each case was diluted to 30 ng/μl for RAPD analysis. RAPD analysis Ten-base 30 RAPD primers (OPA 01-10, OPB 01-10, OPC 01-10; Operon Technologies, Alameda, USA) were used for Polymerase Chain Reaction (PCR). Amplification reactions were performed in volumes 25 µl containing 2.5 µl of 10X assay buffer (100 mM Tris- HCl; pH 8.3, 500 mM KCl, 15 mM MgCl2), 100 mM of each dNTPs (dATP, dCTP, dGTP and dTTP) (MB1 Ferment Inc., Maryland, USA), 5 pg of RAPD primer, 1.0 unit of Taq DNA polymerase (Bangalore Genei, India) and 30 ng of template DNA. The amplification reactions were carried out in a DNA Thermal Cycler (Eppendorf AG, Hamburg, Germany) programmed for 44 cycles following as: 1st cycle of 5 minutes at 94°C followed by 43 cycles each of 1 minute at 92°C, 1 minute at 37°C, 2 minutes at 72°C. The final step consisted of one cycle of 7 minutes at 72°C for complete polymerization. After completion of the PCR, 2.5 µl of 6X loading dye (MB1 Ferment Inc., Maryland, USA) was added to the amplified products and were electrophorized in a 1.5 % (m/v) agarose (Bangalore Genei, Bangalore, India) gels with 1X TAE buffer, stained with ethidium bromide and documented by a gel documentation system (Syngene, Cambridge, UK). Three repeat runs were made to observe the consistency of the band positions as well as intensity for each plant type and
with each primer. The primers documenting uniformity were considered for analysis. Statistical Analysis RAPD bands were designated based on their molecular weight and calculated using the kilo base (kb) ladder used as marker. Molecular data processed in MS excel for calculating polymorphic band(s) of individual primer, average polymorphic band per primer and percentage of polymorphism. Analysis of informative potential of molecular markers and genetic diversity among the genotypes under assessment including the effective number of allele per locus - Aep
18, Shannon diversity index – I19, genetic diversity/diversity index – Hep
18, marker index (MI) and polymorphism information content – PIC20 were computed for each primer across the plant types based on frequency of alleles of each plant type locus. Cluster Analysis RAPD bands were scored as present (1) or absent (0) in the studied species entered in a binary data matrix. Based on the results on bands spectra, proximity matrix has been generated for all possible pairs from Euclidean Distance and was used to construct the dendrogram by Unweighted Pair Group Method with Arithmetic Mean (UPGMA). The data was analyzed using IBM SPSS Statistics 20. The combined data from RAPD markers were processed together.
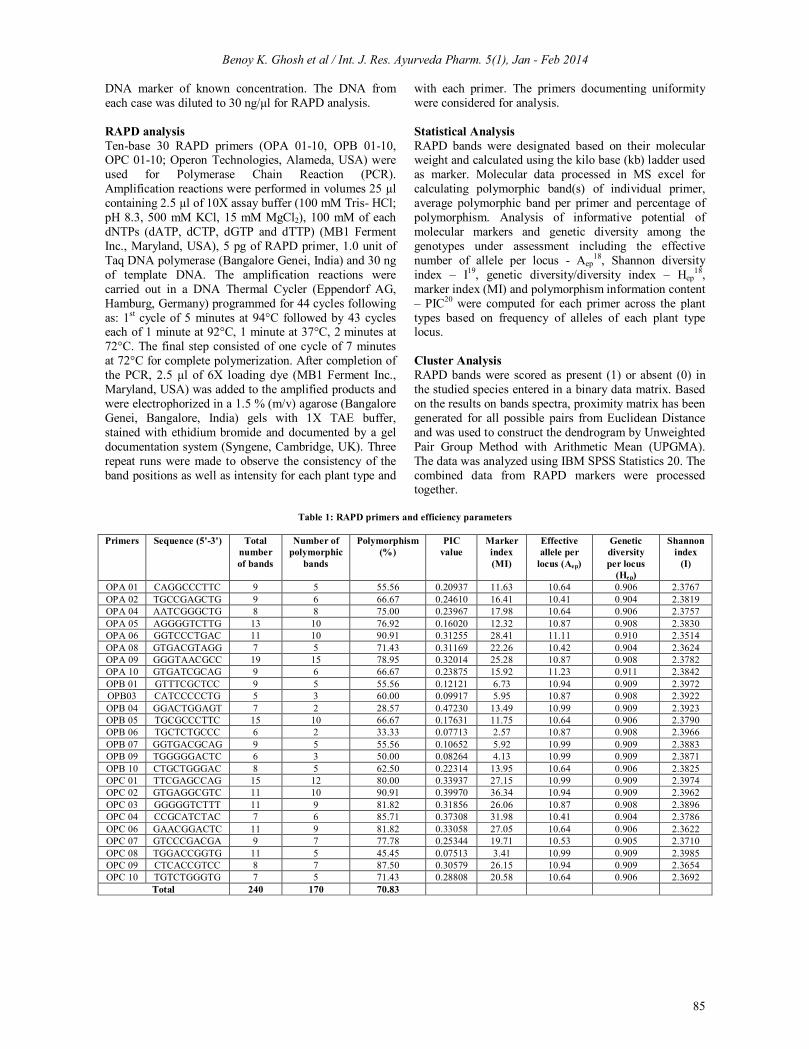
Table 1: RAPD primers and efficiency parameters
Primers Sequence (5'-3') Total
number of bands
Number of polymorphic
bands
Polymorphism (%)
PIC value
Marker index (MI)
Effective allele per
locus (Aep)
Genetic diversity per locus
(Hep)
Shannon index
(I)
OPA 01 CAGGCCCTTC 9 5 55.56 0.20937 11.63 10.64 0.906 2.3767 OPA 02 TGCCGAGCTG 9 6 66.67 0.24610 16.41 10.41 0.904 2.3819 OPA 04 AATCGGGCTG 8 8 75.00 0.23967 17.98 10.64 0.906 2.3757 OPA 05 AGGGGTCTTG 13 10 76.92 0.16020 12.32 10.87 0.908 2.3830 OPA 06 GGTCCCTGAC 11 10 90.91 0.31255 28.41 11.11 0.910 2.3514 OPA 08 GTGACGTAGG 7 5 71.43 0.31169 22.26 10.42 0.904 2.3624 OPA 09 GGGTAACGCC 19 15 78.95 0.32014 25.28 10.87 0.908 2.3782 OPA 10 GTGATCGCAG 9 6 66.67 0.23875 15.92 11.23 0.911 2.3842 OPB 01 GTTTCGCTCC 9 5 55.56 0.12121 6.73 10.94 0.909 2.3972 OPB03 CATCCCCCTG 5 3 60.00 0.09917 5.95 10.87 0.908 2.3922 OPB 04 GGACTGGAGT 7 2 28.57 0.47230 13.49 10.99 0.909 2.3923 OPB 05 TGCGCCCTTC 15 10 66.67 0.17631 11.75 10.64 0.906 2.3790 OPB 06 TGCTCTGCCC 6 2 33.33 0.07713 2.57 10.87 0.908 2.3966 OPB 07 GGTGACGCAG 9 5 55.56 0.10652 5.92 10.99 0.909 2.3883 OPB 09 TGGGGGACTC 6 3 50.00 0.08264 4.13 10.99 0.909 2.3871 OPB 10 CTGCTGGGAC 8 5 62.50 0.22314 13.95 10.64 0.906 2.3825 OPC 01 TTCGAGCCAG 15 12 80.00 0.33937 27.15 10.99 0.909 2.3974 OPC 02 GTGAGGCGTC 11 10 90.91 0.39970 36.34 10.94 0.909 2.3962 OPC 03 GGGGGTCTTT 11 9 81.82 0.31856 26.06 10.87 0.908 2.3896 OPC 04 CCGCATCTAC 7 6 85.71 0.37308 31.98 10.41 0.904 2.3786 OPC 06 GAACGGACTC 11 9 81.82 0.33058 27.05 10.64 0.906 2.3622 OPC 07 GTCCCGACGA 9 7 77.78 0.25344 19.71 10.53 0.905 2.3710 OPC 08 TGGACCGGTG 11 5 45.45 0.07513 3.41 10.99 0.909 2.3985 OPC 09 CTCACCGTCC 8 7 87.50 0.30579 26.15 10.94 0.909 2.3654 OPC 10 TGTCTGGGTG 7 5 71.43 0.28808 20.58 10.64 0.906 2.3692
Total 240 170 70.83
Benoy K. Ghosh et al / Int. J. Res. Ayurveda Pharm. 5(1), Jan - Feb 2014
86
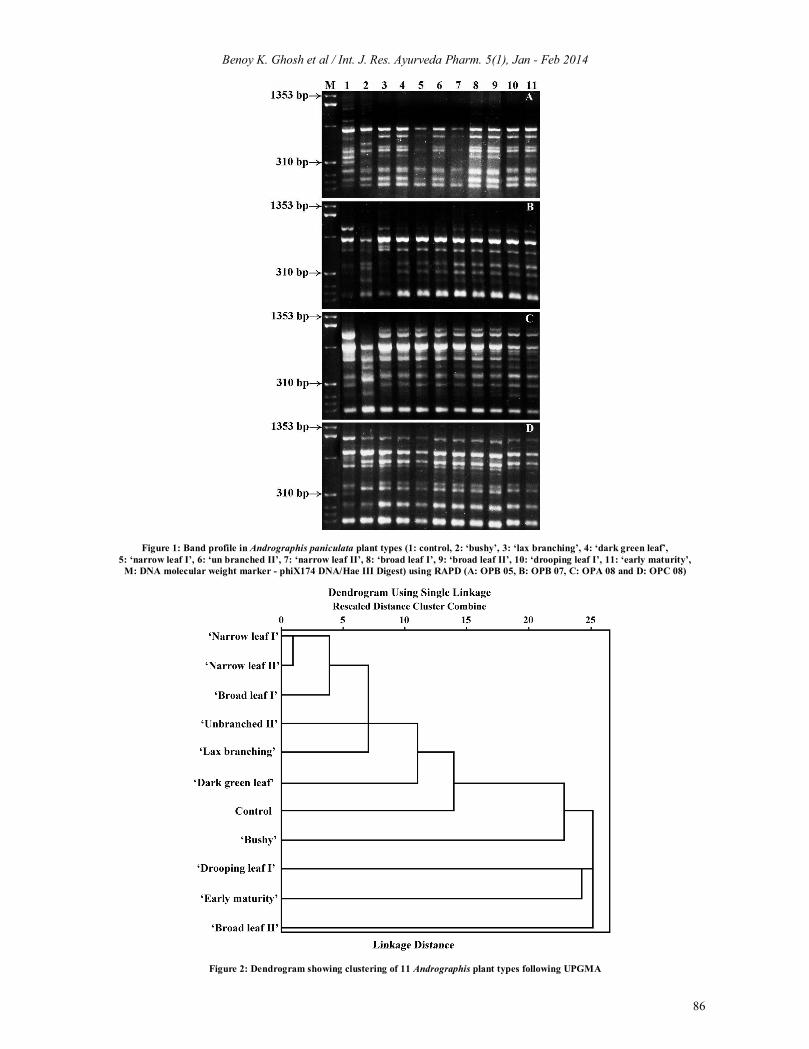
Figure 1: Band profile in Andrographis paniculata plant types (1: control, 2: ‘bushy’, 3: ‘lax branching’, 4: ‘dark green leaf’, 5: ‘narrow leaf I’, 6: ‘un branched II’, 7: ‘narrow leaf II’, 8: ‘broad leaf I’, 9: ‘broad leaf II’, 10: ‘drooping leaf I’, 11: ‘early maturity’,
M: DNA molecular weight marker - phiX174 DNA/Hae III Digest) using RAPD (A: OPB 05, B: OPB 07, C: OPA 08 and D: OPC 08)
Figure 2: Dendrogram showing clustering of 11 Andrographis plant types following UPGMA
Benoy K. Ghosh et al / Int. J. Res. Ayurveda Pharm. 5(1), Jan - Feb 2014
87
RESULTS AND DISCUSSION Out of the 30 RAPD primers, 25 reproduced (Table 1; Figure 1: A-D) unambiguous scorable bands uniformly across the plant types. The RAPD primers yielded a total of 240 markers of which 170 (70.83 %) were polymorphic. Polymorphism generated by the markers across the plant types varied from 28.57 % (OPB 04) to 90.91 % (OPA 06 and OPC 02). The level of polymorphism generated across the plant types is high suggesting that RAPD possesses the ability to resolve enhanced genetic variations in the studied plant types. The average number of fragments amplified by RAPD markers across the plant types was 9.60 with a range of 5 to 19 (size 190 bp to 1065 bp). Such a high variation in the number of fragments produced by RAPD markers may be attributed to the differences in the binding sites throughout genome of the plant types. The efficiency of the RAPD primers has been quantified by using estimation of different genetic parameters (Table 1). Shannon diversity index ranged from 2.3514 (OPA 06) to 2.3985 (OPC 08) among RAPD markers across the plant types as expected RAPD markers showed relatively high degree of genetic diversity. However, Shannon diversity index assessed across the primers in different plant types (3.1598 in control, 3.1454 in ‘bushy’, 3.1807 in ‘lax branching’, 3.1706 in ‘dark green leaf’, 3.1621 in ‘narrow leaf I’, 3.1625 in ‘narrow leaf II’, 3.1726 in ‘unbranched II’, 3.1839 in ‘broad leaf I’, 3.1606 in ‘broad leaf II’, 3.1557 in ‘drooping leaf I’ and 3.1573 in ‘early maturity’) was rather uniform possibly indicating narrow genetic base of the studied plant types. Lattoo et al.14 analyzed 53 A. paniculata accession belonging to 5 eco-geographic regions using RAPD markers and found that molecular genetic diversity based on Shannon index per primer averaged 5.585 with values ranging from 3.08 to 8.70 indicating towards wide genetic base. Upon comparison on PIC values (marker discrimination power – Kesari et al.21) it has been noted that the range varied from 0.07513 (OPC 08) to 0.47230 (OPB 04). Wijarat et al.15 assessed 58 accessions of the species from Thailand using 30 random RAPD primers and found PIC values ranging from 0.034 to 0.405 with an average of 0.172. Genetic diversity (Hep) is the expected heterozygosity18, is an index of effectiveness of RAPD loci information. In the present investigation, Hep showed remarkable homogeneity among the primers and it ranged from 0.904 (OPA 02 and 08) to 0.911 (OPA 10). Further, Hep showed positive and significant correlation (r = 0.997, P < 0.001, DF = 24) with effective allele/locus (10.41 to 11.23). Marker index has been calculated in order to characterize the capacity of individual primer to detect polymorphic loci across the plant types. Considering MI values it seems that OPC 02 and OPC 04 are the most efficient primers. Based on the number and frequency of scorable fragments, polymorphism percentage and different efficiency parameters, taken together, it seems that OPA 06, OPA 08-09, OPB 05, OPC 01-04, OPC 06 and OPC 09 are efficient and effective markers and may be used for molecular screening of A. paniculata germplasms. Band spectra analyzed by UPGMA (Figure 2) revealed clustering of the genotypes in 6 major groups. A close relatedness between/among the genotypes (cluster 1:
‘narrow leaf I’ and ‘II’ and ‘broad leaf I’; 2: ‘lax branching’ with genotypes of cluster 1; 3: ‘dark green leaf’ and ‘unbranched II’; 4: control with cluster 3; 5: ‘bushy’ with cluster 4; 6: ‘drooping leaf I’, ‘early maturity’ and ‘broad leaf II’) has been noted. Such genetic relatedness may be significant as it provides scope for intercrossing and subsequently raising desirable plant type(s) of interest in the species. ACKNOWLEDGEMENT The Research is grant aided by DST-PURSE Programme, Kalyani University, West Bengal, India. REFERENCES 1. Zhou Y, Zhou C, Yao H, Liu Y, Tu R. Application of ISSR markers
in detection of genetic variation among Chinese yam (Dioscorea opposita Thunb) cultivars. Life Sci J 2008; 5: 6–12.
2. Saini M, Singh S, Hussain Z, Sikka VK. RAPD analysis in mung bean Vigna radiata (L.) Wilczek. II: A comparison of efficiency parameters of RAPD primer. Indian J Biotech 2010; 9: 137–146.
3. Parsons JB, Newbury HT, Jackson MT, Ford-Lloyd BV. Contrasting genetic diversity relationships are revealed in rice (Oryza sativa L.) using different marker types. Mol Breed 1997; 3:115–125. http://dx.doi.org/10.1023/A:1009635721319
4. Qian W, Ge S, Hong DY. Genetic variation within and among populations of wild rice Oryza granulata from China detected by rRAPD and ISSR markers. Theor Appl Genet 2001; 102: 440–449. http://dx.doi.org/10.1007/s001220051665
5. Lacerda DR, Acedo MDP, Lemos Filho JP, Lovato MB. Genetic diversity and structure of natural populations of Plathymenia reticulata (Mimosoideae), a tropical tree from the Brazilian Cerrado. Mol Ecol 2001; 10: 1143–1152. http://dx.doi.org/ 10.1046/j.1365-294X.2001.01264.x
6. Patamsytė J, Čėsnienė T, Naugžemys D, Kleizaitė V, Vaitkūnienė, Rančelis V, Žvingila D. Genetic diversity of warty cabbage (Bunias orientalis L.) revealed by RAPD and ISSR markers. Žemdirbystė Agriculture 2011; 98: 293–300.
7. Mandal A, Datta AK, Datta S, Gupta S. Genetic assessment of eight Corchorus spp. (Tiliaceae) using RAPD and ISSR markers. Nucleus 2013; 56(1): 23–30. http://dx.doi.org/10.1007/s13237-013-0076-6
8. Takeuchi A. Identification of close related varieties in Niigata Pref. Based on DNA markers (in Japanese). Breeding Sci 1994; 44: 129.
9. Yazaki S, Kawata M, Monma B, Muraki M, Miura Y, Takaiwa F, Shimamto Y, Ueda S. Analysis of DNA polymorphisms among maize inbred lines by RAPDs. Breeding Sci 1994; 44: 130.
10. Fujishiro T, Sasakuma T. Variety identification and molecular characterization of newly bred line by RAPD marker in Brassica juncea. Breeding Sci 1994; 1: 132.
11. Roy A, Bandyopadhyay A, Mahapatra AK, Ghosh SK, Singh NK, Bansal KC, Koundal KR, Mohapatra T. Evaluation of genetic diversity in jute (Corchorus) species using STMS, ISSR and RAPD markers. Plant Breed 2006; 125: 292–297. http://dx.doi.org/ 10.1111/j.1439-0523.2006.01208.x
12. Saha B, Datta S, Datta AK, Da Silva JAT. Assessment of biochemical and molecular diversity of five elite Gladiolus varieties. Floriculture ornamental Biotech 2011; 5: 64–67.
13. Saha B, Datta AK, Datta S, Da Silva JAT. In vitro corm development, field evaluation and determination of genetic stability of corm derived elite Gladiolus germplasm. Floriculture ornamental Biotech 2013; 7: 82–85.
14. Lattoo SK, Dhar RS, Khan S, Bamotra S, Bhan MK, Dhar AK, Gupta KK. Comparative analysis of genetic diversity using molecular and morphometric markers in Andrographis paniculata (Burm. f.) Nees. Genet Resour Crop Evol 2008; 55: 33–43. http://dx.doi.org/10.1007/s10722-007-9212-y
15. Wijarat P, Keeratinijakal V, Toojinda T, Vanavichit T, Tragoonrung S. Genetic diversity and in breeder specie of Andrographis paniculata (Burm. f.) Nees by randomly amplified polymorphic deoxyribonucleic acid (RAPD) and floral architecture analysis. J Plant Breed Crop Sci 2011; 3: 327–334.
16. Ghosh BK, Datta AK, Mandal A, Dubey PK, Halder S. An overview on Andrographis paniculata (Burm. F.) Nees. Int J Res Ayurveda Pharm 2012a; 3(6): 752–760. http://dx.doi.org/10.7897/ 2277-4343.03610
Benoy K. Ghosh et al / Int. J. Res. Ayurveda Pharm. 5(1), Jan - Feb 2014
88
17. Ghosh BK, Datta AK, Das A, Mandal A. Induced macro mutation in Andrographis paniculata (Burm. F.) Nees. Int J Res Ayurveda Pharm 2012b; 3(4): 604-610.
18. Weir BS. Genetic data analysis II: Methods for discrete population genetic data. Sinauer Publishers, Sunderland, MA, USA; 1996.
19. Martynov SP, Dobrotvorskaya TV, Dotlacil L, Stehno Z, Faberova I, Bares I. Genealogical approach to the formation of the winter wheat core collection. Russian J Genet 2003; 39: 917–923. http://dx.doi.org/10.1023/A:1025382807351
20. Anderson JA, Churchill GA, Autrique JE, Tanksley SD, Sorrells ME. Optimizing parental selection for genetic linkage maps. Genome 1993; 36: 181–186. http://dx.doi.org/10.1139/g93-024
21. Kesari V, Sathyanarayana VM, Parida A, Rangan L. Molecular marker-based characterization in candidate plus trees of Pongamia pinnata, a potential biodiesel legume. AoB Plants; 2010. plq017
Cite this article as: Benoy K. Ghosh, Aninda Mandal, Animesh K. Datta, Debadrito Das. RAPD analysis in Andrographis paniculata (Burm. F.) Ness plant types. Int. J. Res. Ayurveda Pharm. 2014;5(1):84-88 http://dx.doi.org/ 10.7897/2277-4343.05117
Source of support: DST-PURSE Programme, Kalyani University, West Bengal, India, Conflict of interest: None Declared