Embed Size (px)
Citation preview
Research ArticleQuantitative Analysis of Cepharanthine in PlasmaBased on Semiautomatic Microextraction by Packed SorbentCombined with Liquid Chromatography
Camille Desgrouas,1,2 Marc Desbordes,1 Jérôme Dormoi,3
Evelyne Ollivier,2 Daniel Parzy,1 and Nicolas Taudon1,4
1 UMR-MD3, Institut de Recherche Biomedicale des Armees, Faculte de Pharmacie, Aix-Marseille Universite,13385 Marseille, France
2UMR-MD3, Laboratoire de Pharmacognosie et Ethnopharmacologie, Faculte de Pharmacie, Aix-Marseille Universite,13385 Marseille, France
3 Unite de Parasitologie, Institut de Recherche Biomedicale des Armees, BP 73, 91223 Bretigny-sur-Orge, France4Unite de Toxicologie Analytique, Institut de Recherche Biomedicale des Armees, BP 73, 91223 Bretigny-sur-Orge, France
Correspondence should be addressed to Nicolas Taudon; [email protected]
Received 31 October 2013; Revised 17 December 2013; Accepted 24 December 2013; Published 16 February 2014
Academic Editor: Hiroyuki Kataoka
Copyright © 2014 Camille Desgrouas et al. This is an open access article distributed under the Creative Commons AttributionLicense, which permits unrestricted use, distribution, and reproduction in any medium, provided the original work is properlycited.
The spread of Plasmodium falciparum resistance toward most of the used drugs requires new antimalarial compounds. Takingadvantage of the biodiversity, the ethnopharmacological approach opens the way for the discovery and the characterization ofpotent original molecules. Previous works led to the selection of a bisbenzylisoquinoline, cepharanthine, extracted from Stephaniarotunda, which is mainly present in Cambodia. A sensitive and selective liquid chromatography method has been developed forthe determination of cepharanthine in mouse plasma. The method involved a semiautomated microextraction by packed sorbent(MEPS) using 4mg of solid phase silica-C8 sorbent. LC separation was performed on a Kinetex XB-C18 column (2.6𝜇m) with amobile phase of acetonitrile containing formic acid and 10mM ammonium formate buffer pH 3.5. Data were acquired at 282 nmwith a diode array detector.Thedrug/internal standard peak area ratioswere linked via linear relationships to plasma concentrations(75–2,000 ng/mL). Precision was below 5% and accuracy was 99.0–102%. Extraction recovery of cepharanthine was 56–58%. Themethod was successfully used to determine the pharmacokinetic profile of cepharanthine in healthy and Plasmodium bergheiinfected mice. The infection did not impact pharmacokinetic parameters of cepharanthine.
1. Introduction
Affecting about 216 million and killing 660,000 people in2010, malaria is still one of the most widespread parasitictropical diseases. Its main impact is located in sub-SaharanAfrica, where at least 90% of all malaria-related deathsoccur [1]. The emergence of Plasmodium falciparum resis-tance to many antimalarial drugs is a severe problem allover the world. In front of the global spread of resistance,the WHO officially recommended in 2006 that artemisinincombination therapies (ACTs) must be adopted as first-line
treatment of uncomplicated malaria caused by P. falciparum[2]. Unfortunately, recent reports from the South-East Asiarevealed evidence of emerging resistance to artemisinin [3,4]. If ACT efficacy should fail, no suitable alternatives existas first-line treatments of P. falciparum malaria. If it hadsuddenly spread, this phenomenon would have catastrophicconsequences, especially in Africa. Consequently, new anti-malarial compounds, particularly those that are based oncompounds structurally unrelated to existing antimalarialagents and that have new independentmechanisms of action,are needed in the battle against this major endemic disease.
Hindawi Publishing CorporationJournal of Analytical Methods in ChemistryVolume 2014, Article ID 695231, 6 pageshttp://dx.doi.org/10.1155/2014/695231
2 Journal of Analytical Methods in Chemistry
In front of this urgent need, the rich vegetable biodiversity, inparticular in the tropical rainforests, is an important sourceof new chemical structures [5]. The majority of the worldpopulation relies mainly on natural products for their pri-mary healthcare. Studying relationships between people andplants, ethnobotanists have a responsibility both to scientificcommunity and to indigenous culture. An important numberof modern drugs have been isolated from natural resources.Besides, it is particularly interesting to note that the emer-gence of resistance to antimalarial drugs isolated from plantmight be slower to appear. For example, one year only afterits marketing, resistance cases were reported for atovaquone.It took 15 years to observe a loss of efficacy with amino-quinolines. Quinine, isolated from Cinchona, is still usefuldespite more than 350 years of continuous use. Artemisinin’sspot of resistance limited to the South-East of Asia has beendescribed since the last few years, whereas Artemisia annua,from which artemisinin is extracted, was used for more than2,000 years [6].Thus, as source of new drugs and insecticides,interest in medical plants has increased in recent years. Newchemical structures, among which some may be potentiallyhelpful against infectious diseases like malaria, have beenisolated but many still remain to be discovered. It is in thiscontext that an inquiry was performed on Cambodian plantsused in traditional medicines. An antiplasmodial activity wasresearched on extracts from 28 indigenous wild plant species.Twenty-six extracts from 8 plants showed an antiplasmodialactivity. Among them, extracts from Stephania rotundaLour. (Menispermaceae) possessed an interesting activity[7]. Stephania rotunda is a plant growing on calcareouscliff of Cambodian mountain areas [8]. Cheng and Huonmentioned S. rotunda to be active on malaria and fevers [9].Concentrations at which extracts were able to inhibit 50%of parasitic growth (IC
50) on the P. falciparum chloroquine-
resistant strain W2 were, respectively, 1.0 and 2.8 𝜇g/mLfor dichloromethane and water extracts of S. rotunda tuber[7]. Fractionation of dichloromethane extracts allowed theisolation of a bisbenzylisoquinoline named cepharanthine.Exerting an interesting activity on plasmodial culture (IC
50
above 0.60 𝜇M on W2 strain) [10], efficacy of cepharanthinewas tested in Balb/c mice infected by P. berghei. At the doseof 10mg/kg administered by intraperitoneal and oral routes,cepharanthine induced a decrease of the parasitemia by 47%and 50%, respectively [10]. The present work involves thedevelopment of a semiautomated microextraction by packedsorbent (MEPS) for the extraction of cepharanthine in plasmasample. Previous works have reported analytical methods forthe extraction and quantification of cepharanthine in plasmasample from beagle dog and human [11, 12]. However, noanalytical methods have been reported for the quantificationof cepharanthine in mouse, which is a classic malaria model.Moreover, in these two papers the method of sample clean-up was a protein precipitation (PPT) using solvents. PPTis a rapid, nonspecific method that can be utilized forsample cleanup in a high-throughput, automated manner.Nevertheless, the major limit of PPT is that many matrixcomponents such as lipids, formulation agents, and sub-stances remain in the supernatant after centrifugation. Thus,problems may occur including baseline noise, ghost peak,
or carryover for example. In light of these considerations,the development of a solid-phase extraction was emphasized.Moreover, in the context of the study presented here, lowvolumes of plasma samples frommouse were collected.Thus,the purification and concentration of analytes using MEPSto clean up samples seemed relevant [13, 14]. In addition,this step of pretreatment was semiautomated. The samplecleanup and analyte concentration by the MEPS processallowed the quantification of cepharanthine in low volumeof sample by a LC-DAD method. This method was validatedaccording to validation procedures, parameters, and accep-tance criteria [15–17]. It was used to analyze samples from apreclinical study performed for the first time in the mouse.Pharmacokinetic results in healthy and infected animals arepresented.
2. Experimental
2.1. Chemicals and Reagents. Cepharanthine was isolated andpurified from Stephania rotunda Lour. tuber by the Labo-ratory of Pharmacognosy and Ethnopharmacology (UMR-MD3, Aix-Marseille University) with identification andpurity evaluated by elemental analysis greater than 99.6%.Berberine chloride form was obtained from Sigma (St. Louis,MO, USA). All solvents and chemicals were of analyti-cal grade. Acetonitrile, methanol, ammonium formate, andformic acid were purchased from Fischer Scientific SAS(Illkirch, France). The formate buffer (630mg/L ammoniumformate) was prepared in purified water and adjusted to pH3.5 with formic acid. In-house deionized water was furtherpurified with a PURELAB Ultra system (ELGA LabWater,Antony, France). Polyoxyethylated 12-hydroxystearic acid(Solutol HS 15) was obtained fromBASF (Ludwigshafen, Ger-many). For method validation, human plasma was obtainedfrom pooled plasma samples collected from healthy volun-teers not undergoing drug therapy (Etablissement Francaisdu Sang, Marseille, France). Plasma samples from BALB/cmice (Charles River Laboratories, L’Arbresle Cedex, France)were collected with sodium heparin. The blood was cen-trifuged at 3,000 ×g for 10min to obtain plasma. The drug-free plasma was aliquoted, stored at −80∘C, and then usedduring the study in the preparation of quality control (QC)samples.
2.2. Instrumentation and Chromatographic Conditions. Opti-mization of various experimental parameters including thenature of the stationary phase, composition of the eluent,nature of the organic modifier, and temperature of the col-umn was carried out (data not shown).The chromatographicanalysis was performed using aWaters Acquity UPLC instru-ment (Milford, MA, USA). Data acquisition and processingwere performed using Water’s Empower 2 software (Milford,MA, USA). Separation was carried out on a Kinetex XB-C18column (100mm × 4.6mm, 2.6 𝜇m, Phenomenex, Torrance,CA, USA) maintained at 40∘C. The mobile phase consistingof 10mM formate buffer pH 3.5—acetonitrile with 0.5%formic acid (74 : 26, v/v) was delivered isocratically at a flowrate of 0.6mL/min. The detector wavelength was fixed at
Journal of Analytical Methods in Chemistry 3
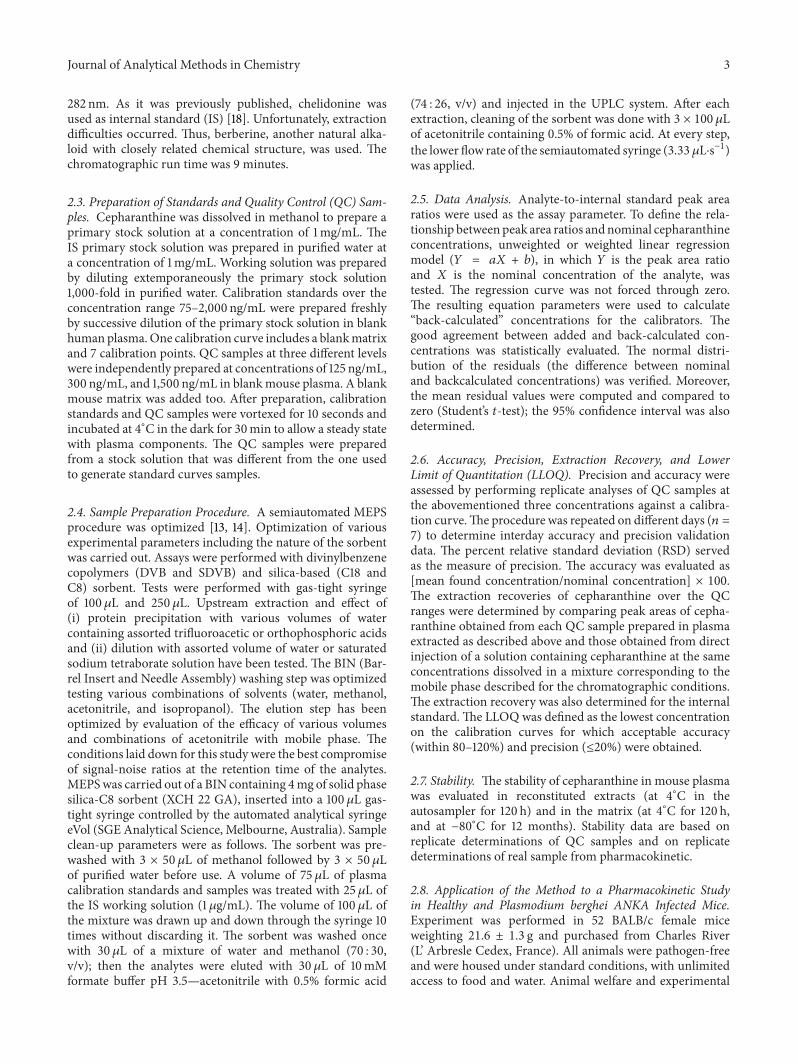
282 nm. As it was previously published, chelidonine wasused as internal standard (IS) [18]. Unfortunately, extractiondifficulties occurred. Thus, berberine, another natural alka-loid with closely related chemical structure, was used. Thechromatographic run time was 9 minutes.
2.3. Preparation of Standards and Quality Control (QC) Sam-ples. Cepharanthine was dissolved in methanol to prepare aprimary stock solution at a concentration of 1mg/mL. TheIS primary stock solution was prepared in purified water ata concentration of 1mg/mL. Working solution was preparedby diluting extemporaneously the primary stock solution1,000-fold in purified water. Calibration standards over theconcentration range 75–2,000 ng/mL were prepared freshlyby successive dilution of the primary stock solution in blankhuman plasma.One calibration curve includes a blankmatrixand 7 calibration points. QC samples at three different levelswere independently prepared at concentrations of 125 ng/mL,300 ng/mL, and 1,500 ng/mL in blankmouse plasma. A blankmouse matrix was added too. After preparation, calibrationstandards and QC samples were vortexed for 10 seconds andincubated at 4∘C in the dark for 30min to allow a steady statewith plasma components. The QC samples were preparedfrom a stock solution that was different from the one usedto generate standard curves samples.
2.4. Sample Preparation Procedure. A semiautomated MEPSprocedure was optimized [13, 14]. Optimization of variousexperimental parameters including the nature of the sorbentwas carried out. Assays were performed with divinylbenzenecopolymers (DVB and SDVB) and silica-based (C18 andC8) sorbent. Tests were performed with gas-tight syringeof 100 𝜇L and 250𝜇L. Upstream extraction and effect of(i) protein precipitation with various volumes of watercontaining assorted trifluoroacetic or orthophosphoric acidsand (ii) dilution with assorted volume of water or saturatedsodium tetraborate solution have been tested. The BIN (Bar-rel Insert and Needle Assembly) washing step was optimizedtesting various combinations of solvents (water, methanol,acetonitrile, and isopropanol). The elution step has beenoptimized by evaluation of the efficacy of various volumesand combinations of acetonitrile with mobile phase. Theconditions laid down for this study were the best compromiseof signal-noise ratios at the retention time of the analytes.MEPSwas carried out of a BIN containing 4mg of solid phasesilica-C8 sorbent (XCH 22 GA), inserted into a 100 𝜇L gas-tight syringe controlled by the automated analytical syringeeVol (SGE Analytical Science, Melbourne, Australia). Sampleclean-up parameters were as follows. The sorbent was pre-washed with 3 × 50𝜇L of methanol followed by 3 × 50 𝜇Lof purified water before use. A volume of 75 𝜇L of plasmacalibration standards and samples was treated with 25𝜇L ofthe IS working solution (1𝜇g/mL). The volume of 100 𝜇L ofthe mixture was drawn up and down through the syringe 10times without discarding it. The sorbent was washed oncewith 30 𝜇L of a mixture of water and methanol (70 : 30,v/v); then the analytes were eluted with 30 𝜇L of 10mMformate buffer pH 3.5—acetonitrile with 0.5% formic acid
(74 : 26, v/v) and injected in the UPLC system. After eachextraction, cleaning of the sorbent was done with 3 × 100 𝜇Lof acetonitrile containing 0.5% of formic acid. At every step,the lower flow rate of the semiautomated syringe (3.33 𝜇L⋅s−1)was applied.
2.5. Data Analysis. Analyte-to-internal standard peak arearatios were used as the assay parameter. To define the rela-tionship betweenpeak area ratios andnominal cepharanthineconcentrations, unweighted or weighted linear regressionmodel (𝑌 = 𝑎𝑋 + 𝑏), in which 𝑌 is the peak area ratioand 𝑋 is the nominal concentration of the analyte, wastested. The regression curve was not forced through zero.The resulting equation parameters were used to calculate“back-calculated” concentrations for the calibrators. Thegood agreement between added and back-calculated con-centrations was statistically evaluated. The normal distri-bution of the residuals (the difference between nominaland backcalculated concentrations) was verified. Moreover,the mean residual values were computed and compared tozero (Student’s 𝑡-test); the 95% confidence interval was alsodetermined.
2.6. Accuracy, Precision, Extraction Recovery, and LowerLimit of Quantitation (LLOQ). Precision and accuracy wereassessed by performing replicate analyses of QC samples atthe abovementioned three concentrations against a calibra-tion curve.The procedure was repeated on different days (𝑛 =7) to determine interday accuracy and precision validationdata. The percent relative standard deviation (RSD) servedas the measure of precision. The accuracy was evaluated as[mean found concentration/nominal concentration] × 100.The extraction recoveries of cepharanthine over the QCranges were determined by comparing peak areas of cepha-ranthine obtained from each QC sample prepared in plasmaextracted as described above and those obtained from directinjection of a solution containing cepharanthine at the sameconcentrations dissolved in a mixture corresponding to themobile phase described for the chromatographic conditions.The extraction recovery was also determined for the internalstandard.The LLOQ was defined as the lowest concentrationon the calibration curves for which acceptable accuracy(within 80–120%) and precision (≤20%) were obtained.
2.7. Stability. The stability of cepharanthine in mouse plasmawas evaluated in reconstituted extracts (at 4∘C in theautosampler for 120 h) and in the matrix (at 4∘C for 120 h,and at −80∘C for 12 months). Stability data are based onreplicate determinations of QC samples and on replicatedeterminations of real sample from pharmacokinetic.
2.8. Application of the Method to a Pharmacokinetic Studyin Healthy and Plasmodium berghei ANKA Infected Mice.Experiment was performed in 52 BALB/c female miceweighting 21.6 ± 1.3 g and purchased from Charles River(L’ Arbresle Cedex, France). All animals were pathogen-freeand were housed under standard conditions, with unlimitedaccess to food and water. Animal welfare and experimental

4 Journal of Analytical Methods in Chemistry
procedures were in accordance with the “Principles of Lab-oratory Animal Care” (NIH publication No.85-23, revised1985) and with the “Guide for Care and Use of LaboratoryAnimals” and were approved by the local Animal EthicsCommittee (Tropical Medicine Institute, Marseille, France).Prior to administrations of cepharanthine, 28 mice wereinfected by the rodent malaria parasite, P. berghei ANKA.Briefly, 24 mice were infected by intraperitoneal inoculationwith 106 of infected red blood cells from4 donormice, dilutedin normal saline. The administration of cepharanthine wasperformed 3 days later, after individual confirmation of posi-tive parasitemia by blood smear. Healthy and infected (𝑛 =24 by group) mice received intraperitoneal administrationof cepharanthine at the dose of 21mg/kg. The solution foradministration of cepharanthine was prepared freshly andconsisted of 4.2mg⋅mL−1 of cepharanthine in a mixturecomposed of methanol, water for injection, and Solutol(30 : 49 : 21, v/v/w). The dose was individually adjusted andbased on 100 𝜇L for 20 g body weight. Blood samples (onesample per mice) were drawn in heparinized polypropylenetubes at the following timepoints (3 animals per time-point): before administration, 5, 15, and 30min and 1, 2, 4,and 6 h after drug administration. Blood samples were col-lected by retroorbital bleeding in anesthetized animals withisoflurane (Mundipharma, Issy-les Moulineaux, France) andthen centrifuged at 3,000 g for 10min. Plasma samples weretransferred into polypropylene tubes and stored at −80∘Cuntil assay. A blood smear was done for each sample comingfrom an infected mouse. At the end of the bleeding, micewere sacrificed by cervical dislocation. Noncompartmentalanalysis was performed using WinNonlin software version6.3 (Pharsight Co., Mountain View, CA, USA). The areaunder the plasma concentration-time curve (AUC
0–6 h) wascalculated using the linear log trapezoidal method. The peakplasma concentration (𝐶max) and the time to reach the peakplasma concentration (𝑇max) were observed from the valuesof experimental data. The elimination rate constant (𝐾el)was estimated by regression analysis from the slope of theline of best fit, and the elimination half-life (𝑡
1/2) of the
drug was obtained by 0.693/𝐾el. Total clearance (CL) andapparent volume of distribution (𝑉
𝑑) were uncorrected for
bioavailability (𝐹).
3. Results and Discussion
3.1. Selectivity. The analysis of blank matrices from differ-ent sources showed the absence of interfering endogenouscomponents at the retention times of the cepharanthineand internal standard. Figure 1 shows typical chromatogramsfrom of blank plasma mouse. Representative chromatogramfrom real sample is shown in Figure 2. The specificityof this method was demonstrated by representative chro-matograms of blank matrices, which indicated that eachanalyte was well resolved from the matrix endogenous peaks.No interference was found with any tested antimalarialdrugs (i.e., atovaquone, chloroquine and its major metabo-lite desethylchloroquine, desethylamodiaquine, doxycycline,quinine, mefloquine, and primaquine).
0.002
0.000
2.80 5.60 8.40
AU
(min)
Figure 1: Representative chromatogram of blank plasma mouseafter the MEPS procedure.
0.002
0.000
2.80 5.60 8.40
AU
(min)
SICep
hara
nthi
ne
Figure 2: Representative chromatogram of a real sample fromthe pharmacokinetic study in mouse 4 hours after intraperitonealadministration of cepharanthine.
3.2. Relationship between Response and Nominal Concentra-tions. Interassay repeatability was determined for calibrationcurves prepared on different days (𝑛 = 7). Observedretention times (𝑛 = 30) were 2.69min for cepharanthineand 6.97min for the internal standard (RSDs, 0.04–0.13%).For each point on the calibration curves, the concentrationswere back calculated from the corresponding linear equa-tion parameters. For concentrations of calibration standards,the RSD around the mean value does not exceed 10.5%.The goodness of fit between back-calculated concentrationsand nominal concentrations was statistically evaluated (i)by comparing the regression line of back-calculated versusnominal concentrations to the reference line (slope = 1 andintercept = 0); no significant different was observed (slope =1.02, 95% confidence interval (IC
95%) [0.99, 1.04]; intercept= −8.52, IC
95% [−25.7, 8.62]); (ii) by studying the frequencydistribution histogram of the residuals, which were normallydistributed and centered around zero, the number of positiveand negative values being approximately equal (Skewness =0.43, IC
95% [−0.29, 1.14]; Kurtosis = 0.07, IC95% [−1.33, 1.48]);
(iii) by comparing the bias to zero (−1.735, IC95% [−14.9,
11.4]); a 𝑡-test showed that this parameter was not statisticallydifferent from zero.
3.3. Accuracy, Precision, Extraction Recovery, and LowerLimit of Quantitation (LLOQ). Precision was below 5% andaccuracy ranged from 99.0 to 102.0%. Individual results arepresented in Table 1. These data are well within the generally
Journal of Analytical Methods in Chemistry 5
Table 1: Extraction recovery, precision, and accuracy of the method(𝑛 = 7).
Theoretical nominalconcentration(ng⋅mL−1)
Extraction yield(%)
Accuracy(%)
Precision(%)
125 58.3 99.1 4.1300 56.4 102 3.81500 58.8 99.0 4.2
required validation criteria limits. The mean absolute extrac-tion recoveries determined with seven replicates for each QClevel were 57.8% (RSD, 11.0%) and 77.2% (RSD, 11.7%) forcepharanthine and internal standard, respectively. It was notstatistically different over the range of concentrations studied.The lower limit of quantitationwas 75 ng/mL.At this level, theprecision of determination, expressed as RSD, was less than11%, with adequate accuracy assay.
3.4. Stability. After a period of 120 h stored at 4∘C, nodegradation of cepharanthine was observed for either plasmasamples or reconstituted extracts. There was no statisticaldifference between freshly prepared samples (𝑃 < 0.05)and back-calculated concentrations with values equal to97.0 ± 5.0% and 99.5 ± 9.4%, respectively. In samples frompharmacokinetic study frozen at −80∘C, cepharanthine wasstable for at least 12 months. A paired comparison withconcentrations previously observed did not show significantdifference (𝑃 < 0.05).
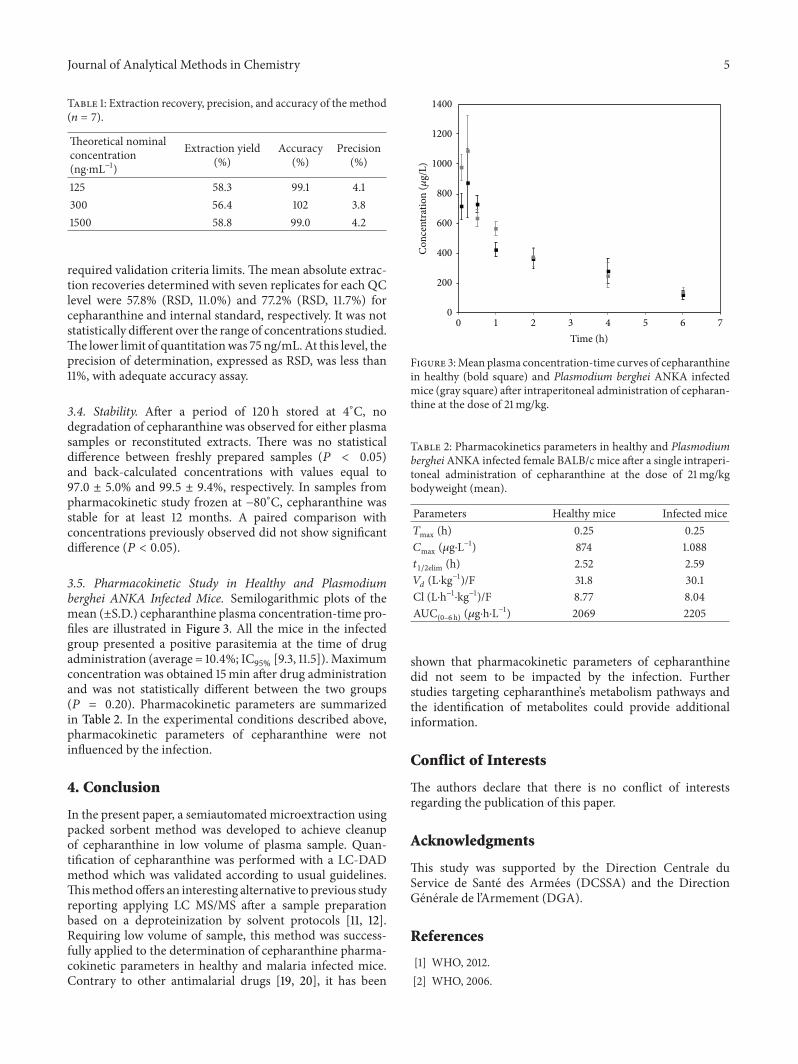
3.5. Pharmacokinetic Study in Healthy and Plasmodiumberghei ANKA Infected Mice. Semilogarithmic plots of themean (±S.D.) cepharanthine plasma concentration-time pro-files are illustrated in Figure 3. All the mice in the infectedgroup presented a positive parasitemia at the time of drugadministration (average = 10.4%; IC
95% [9.3, 11.5]). Maximumconcentration was obtained 15min after drug administrationand was not statistically different between the two groups(𝑃 = 0.20). Pharmacokinetic parameters are summarizedin Table 2. In the experimental conditions described above,pharmacokinetic parameters of cepharanthine were notinfluenced by the infection.
4. Conclusion
In the present paper, a semiautomated microextraction usingpacked sorbent method was developed to achieve cleanupof cepharanthine in low volume of plasma sample. Quan-tification of cepharanthine was performed with a LC-DADmethod which was validated according to usual guidelines.Thismethod offers an interesting alternative to previous studyreporting applying LC MS/MS after a sample preparationbased on a deproteinization by solvent protocols [11, 12].Requiring low volume of sample, this method was success-fully applied to the determination of cepharanthine pharma-cokinetic parameters in healthy and malaria infected mice.Contrary to other antimalarial drugs [19, 20], it has been
1400
1200
1000
800
600
400
200
00 1 2 3 4 5 6 7
Time (h)
Con
cent
ratio
n (𝜇
g/L)
Figure 3:Mean plasma concentration-time curves of cepharanthinein healthy (bold square) and Plasmodium berghei ANKA infectedmice (gray square) after intraperitoneal administration of cepharan-thine at the dose of 21mg/kg.
Table 2: Pharmacokinetics parameters in healthy and PlasmodiumbergheiANKA infected female BALB/c mice after a single intraperi-toneal administration of cepharanthine at the dose of 21mg/kgbodyweight (mean).
Parameters Healthy mice Infected mice𝑇max (h) 0.25 0.25𝐶max (𝜇g⋅L
−1) 874 1.088𝑡1/2elim (h) 2.52 2.59𝑉𝑑(L⋅kg−1)/F 31.8 30.1
Cl (L⋅h−1⋅kg−1)/F 8.77 8.04AUC(0–6 h) (𝜇g⋅h⋅L
−1) 2069 2205
shown that pharmacokinetic parameters of cepharanthinedid not seem to be impacted by the infection. Furtherstudies targeting cepharanthine’s metabolism pathways andthe identification of metabolites could provide additionalinformation.
Conflict of Interests
The authors declare that there is no conflict of interestsregarding the publication of this paper.
Acknowledgments
This study was supported by the Direction Centrale duService de Sante des Armees (DCSSA) and the DirectionGenerale de l’Armement (DGA).
References
[1] WHO, 2012.[2] WHO, 2006.
6 Journal of Analytical Methods in Chemistry
[3] I. H. Cheeseman, B. A. Miller, S. Nair et al., “A major genomeregion underlying artemisinin resistance in malaria,” Science,vol. 336, no. 6077, pp. 79–82, 2012.
[4] A. M. Dondorp, F. Nosten, P. Yi et al., “Artemisinin resistancein Plasmodium falciparum malaria,” The New England Journalof Medicine, vol. 361, no. 5, pp. 455–467, 2009.
[5] K. Kaur, M. Jain, T. Kaur, and R. Jain, “Antimalarials fromnature,” Bioorganic & Medicinal Chemistry, vol. 17, no. 9, pp.3229–3256, 2009.
[6] B. Pradines, H. Vial, and P. Olliaro, “Malaria prophylaxis andtreatment: problems, recent developments and perspectives,”Medecine Tropicale, vol. 63, no. 1, pp. 79–98, 2003.
[7] S. Hout, A. Chea, S.-S. Bun et al., “Screening of selectedindigenous plants of Cambodia for antiplasmodial activity,”Journal of Ethnopharmacology, vol. 107, no. 1, pp. 12–18, 2006.
[8] T. Thuy, A. Porzel, K. Franke, L. Wessjohann, and T. Sung,“Isoquinolone and protoberberine alkaloids from Stephaniarotunda,” Pharmazie, vol. 60, no. 9, pp. 701–704, 2005.
[9] S. Cheng and C. Huon, “Medecine traditionnelle et pharma-copee,” 1996.
[10] A. Chea, S. Hout, S.-S. Bun et al., “Antimalarial activity of alka-loids isolated from Stephania rotunda,” Journal of Ethnopharma-cology, vol. 112, no. 1, pp. 132–137, 2007.
[11] G. Hao, H. Liang, Y. Li et al., “Simple, sensitive and rapidHPLC-MS/MSmethod for the determination of cepharanthinein human plasma,” Journal of Chromatography B, vol. 878, no.28, pp. 2923–2927, 2010.
[12] R.-H. Dong, Z.-Z. Fang, H.-Z. Gao et al., “Bioanalysis ofcepharanthine by LC-ESI-MS-MS and its application to phar-macokinetic studies,” Chromatographia, vol. 73, no. 1-2, pp. 75–81, 2011.
[13] M. Abdel-Rehim, “Recent advances in microextraction bypacked sorbent for bioanalysis,” Journal of Chromatography A,vol. 1217, no. 16, pp. 2569–2580, 2010.
[14] M. Abdel-Rehim, “Microextraction by packed sorbent (MEPS):a tutorial,” Analytica Chimica Acta, vol. 701, no. 2, pp. 119–128,2011.
[15] F. Bressolle, M. Bromet-Petit, and M. Audran, “Validation ofliquid chromatographic and gas chromatographic methods.Applications to pharmacokinetics,” Journal of ChromatographyB, vol. 686, no. 1, pp. 3–10, 1996.
[16] B. Shah, V. K. Kakumanu, and A. K. Bansal, “Analyticaltechniques for quantification of amorphous/crystalline phasesin pharmaceutical solids,” Journal of Pharmaceutical Sciences,vol. 95, no. 8, pp. 1641–1665, 2006.
[17] FDA, 2001.[18] S. Bory, S.-S. Bun, B. Baghdikian et al., “Simultaneous HPLC
determination of three bioactive alkaloids in the Asian medici-nal plant Stephania rotunda,”Natural Product Communications,vol. 5, no. 6, pp. 877–882, 2010.
[19] C. A.Morris, S. Duparc, I. Borghini-Fuhrer, D. Jung, C.-S. Shin,and L. Fleckenstein, “Review of the clinical pharmacokinetics ofartesunate and its active metabolite dihydroartemisinin follow-ing intravenous, intramuscular, oral or rectal administration,”Malaria Journal, vol. 10, article 263, 2011.
[20] N. J. White, “Clinical pharmacokinetics of antimalarial drugs,”Clinical Pharmacokinetics, vol. 10, no. 3, pp. 187–215, 1985.

Submit your manuscripts athttp://www.hindawi.com
Hindawi Publishing Corporationhttp://www.hindawi.com Volume 2014
Inorganic ChemistryInternational Journal of
Hindawi Publishing Corporation http://www.hindawi.com Volume 2014
International Journal ofPhotoenergy
Hindawi Publishing Corporationhttp://www.hindawi.com Volume 2014
Carbohydrate Chemistry
International Journal of
Hindawi Publishing Corporationhttp://www.hindawi.com Volume 2014
Journal of
Chemistry
Hindawi Publishing Corporationhttp://www.hindawi.com Volume 2014
Advances in
Physical Chemistry
Hindawi Publishing Corporationhttp://www.hindawi.com
Analytical Methods in Chemistry
Journal of
Volume 2014
Bioinorganic Chemistry and ApplicationsHindawi Publishing Corporationhttp://www.hindawi.com Volume 2014
SpectroscopyInternational Journal of
Hindawi Publishing Corporationhttp://www.hindawi.com Volume 2014
The Scientific World JournalHindawi Publishing Corporation http://www.hindawi.com Volume 2014
Medicinal ChemistryInternational Journal of
Hindawi Publishing Corporationhttp://www.hindawi.com Volume 2014
Chromatography Research International
Hindawi Publishing Corporationhttp://www.hindawi.com Volume 2014
Applied ChemistryJournal of
Hindawi Publishing Corporationhttp://www.hindawi.com Volume 2014
Hindawi Publishing Corporationhttp://www.hindawi.com Volume 2014
Theoretical ChemistryJournal of
Hindawi Publishing Corporationhttp://www.hindawi.com Volume 2014
Journal of
Spectroscopy
Analytical ChemistryInternational Journal of
Hindawi Publishing Corporationhttp://www.hindawi.com Volume 2014
Journal of
Hindawi Publishing Corporationhttp://www.hindawi.com Volume 2014
Quantum Chemistry
Hindawi Publishing Corporationhttp://www.hindawi.com Volume 2014
Organic Chemistry International
ElectrochemistryInternational Journal of
Hindawi Publishing Corporation http://www.hindawi.com Volume 2014
Hindawi Publishing Corporationhttp://www.hindawi.com Volume 2014
CatalystsJournal of


![Cepharanthine and Curcumin inhibited mitochondrial ......Cepharanthine is a natural alkaloid extracted from the roots of the Stephania japonica, which has anti-inflammatory [26], anti-Hepatitis](https://img.pdfslide.net/doc/110x75/60b79a4b07c47168b001a2d4/cepharanthine-and-curcumin-inhibited-mitochondrial-cepharanthine-is-a-natural.jpg)


![ACCESSORIES Magnum PRO Semiautomatic Gunslincolnelectric.com/assets/global/Products/GunTorch_GunsandTorches... · STEP 2 Magnum® PRO Semiautomatic Guns | [ 3 ] SELECT YOUR GUN -](https://img.pdfslide.net/doc/110x75/5aa647ab7f8b9a2f048e8374/accessories-magnum-pro-semiautomatic-2-magnum-pro-semiautomatic-guns-3-select.jpg)