Embed Size (px)
Citation preview
Research ArticleSource Contributions of PM
2.5in the Severe Haze Episode in
Hebei Cities
Zhe Wei, Litao Wang, Simeng Ma, Fenfen Zhang, and Jing Yang
Department of Environmental Engineering, School of City Construction, Hebei University of Engineering,Handan, Hebei 056038, China
Correspondence should be addressed to Litao Wang; [email protected]
Received 13 August 2015; Revised 5 October 2015; Accepted 5 October 2015
Academic Editor: Xavier Querol
Copyright © 2015 Zhe Wei et al.This is an open access article distributed under the Creative Commons Attribution License, whichpermits unrestricted use, distribution, and reproduction in any medium, provided the original work is properly cited.
Beijing-Tianjin-Hebei area is one of the most polluted areas in China. This paper used the Fifth-Generation Penn State/NCARMesoscale Model (MM5) and Model-3/Community Multiscale Air Quality (CMAQ) modeling system to quantify the sourcecontribution to PM
2.5in Hebei cities in order to obtain an in-depth understanding haze process in January and February 2013, using
theMultiresolution Emission Inventory for China (MEIC).The result showed that PM2.5
were mainly originated from the southernHebei (SHB) with the fractions of 70.8% and 66.4% to Shijiazhuang, 70.6% and 63.9% to Xingtai, and 68.5% and 63.0% to Handanin January and February 2013, respectively. The northern Hebei (NHB) contributed 69.8% and 70.7% to Zhangjiakou, 68.7% and66.2% to Chengde, and 57.7% and 59.6% to Qinhuangdao in January and February. In Cangzhou, Hengshui, and Langfang, regionaljoint policymaking should be implemented due to the pollution ofmultiple sources. In Baoding and Tangshan, industrial emissionscontributed 38.1% and 41.9% of PM
2.5to Baoding and 39.8% and 45.8% to Tangshan in January and February, respectively. Industrial
and domestic emissions should be controlled in Tangshan and Baoding, especially for industrial emissions of NHB.
1. Introduction
An extreme regional haze episode with extensive influencearea and high particulate matters (PM) concentration hasoccurred in centre-eastern China during January 2013, whichhas attracted wide attentions and concerns over the world.This haze event is the most serious pollution event since 1961[1], and the average concentration of PM
10has reached the
largest value since 2001 [2]. Large amounts of studies havediscussed this haze episode in terms of the characteristics,the formation processing, source contributions, chemicalcompositions of particulate matters, and so forth [1–7].The stagnant meteorological conditions and typical terrainresulted in accumulation of particulate matters, leading tosevere and lasting haze episode [8]. Hebei was one of themost polluted provinces in China in January of 2013, which isrelated to the huge emissions in Hebei and the surroundingregions. According to theAsian INTEX-B emission inventory[9], the PM
2.5emission from Hebei, Henan, Shandong, and
Shanxi accounted for 28% of national total emission in 2006.
The percentages for SO2, NO𝑋, CO, VOC, BC, and OC were
28%, 25%, 28%, 24%, 30%, and 24%, respectively [10]. In 2011,45.5% of the steel in the world was produced in China, 24.0%of which was produced in Hebei. Hebei’s cement productionaccounted for 6.9% of the national total amount [11]. China’scoke production accounted for more than 60% of the world,14.5% of which was produced in Hebei [12]. All of the datagives a clue why Hebei province has the most severe airpollution all over China. The daily average concentrationhas even attained 300 𝜇gm−3 in Shijiazhuang [8] in January12, 2013, which has notably exceeded Chinese Grade IIstandard (75 𝜇gm−3) [13].The coexistence ofmultipollutants,the superposition of multiple sources, the poor meteorolog-ical conditions, increase of secondary components, and thetypical terrain have prompted the severe formation of thishaze event [3, 14].
Along with economic development and environmentaldeterioration, the government looks forward to quantify thesource contributions of PM
2.5. Several cities have released
the detailed source apportionment results of PM2.5, as shown
Hindawi Publishing Corporatione Scientific World JournalVolume 2015, Article ID 480542, 11 pageshttp://dx.doi.org/10.1155/2015/480542
2 The Scientific World Journal
Zhengzhou
Taiyuan
Jinan
Beijing
TianjinShijiazhuang
XingtaiHandan
HengshuiCangzhou
LangfangBaoding
Zhangjiakou Chengde
TangshanQinhuangdao
Beijing and Tianjin (BJTJ) Northern Hebei (NHB)Southern Hebei (SHB) Shanxi (SX)Shandong (SD)Henan (HN)
Domain 2
Domain1
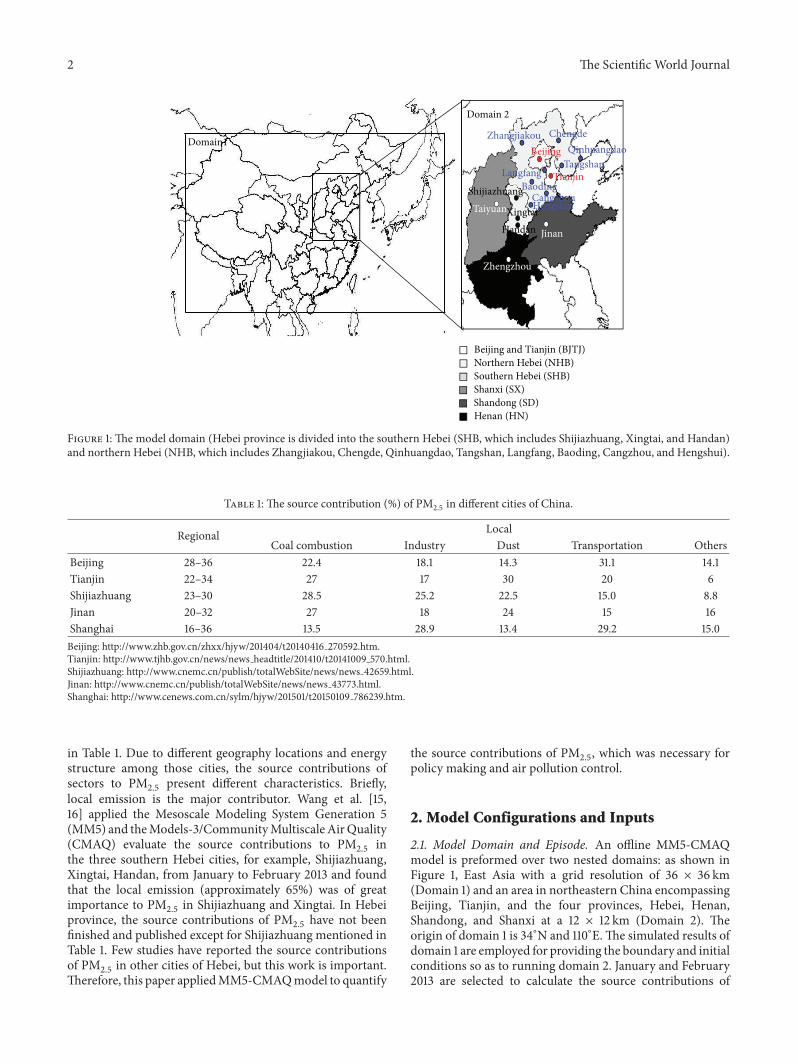
Figure 1: The model domain (Hebei province is divided into the southern Hebei (SHB, which includes Shijiazhuang, Xingtai, and Handan)and northern Hebei (NHB, which includes Zhangjiakou, Chengde, Qinhuangdao, Tangshan, Langfang, Baoding, Cangzhou, and Hengshui).
Table 1: The source contribution (%) of PM2.5
in different cities of China.
Regional LocalCoal combustion Industry Dust Transportation Others
Beijing 28–36 22.4 18.1 14.3 31.1 14.1Tianjin 22–34 27 17 30 20 6Shijiazhuang 23–30 28.5 25.2 22.5 15.0 8.8Jinan 20–32 27 18 24 15 16Shanghai 16–36 13.5 28.9 13.4 29.2 15.0Beijing: http://www.zhb.gov.cn/zhxx/hjyw/201404/t20140416 270592.htm.Tianjin: http://www.tjhb.gov.cn/news/news headtitle/201410/t20141009 570.html.Shijiazhuang: http://www.cnemc.cn/publish/totalWebSite/news/news 42659.html.Jinan: http://www.cnemc.cn/publish/totalWebSite/news/news 43773.html.Shanghai: http://www.cenews.com.cn/sylm/hjyw/201501/t20150109 786239.htm.
in Table 1. Due to different geography locations and energystructure among those cities, the source contributions ofsectors to PM
2.5present different characteristics. Briefly,
local emission is the major contributor. Wang et al. [15,16] applied the Mesoscale Modeling System Generation 5(MM5) and theModels-3/CommunityMultiscaleAirQuality(CMAQ) evaluate the source contributions to PM
2.5in
the three southern Hebei cities, for example, Shijiazhuang,Xingtai, Handan, from January to February 2013 and foundthat the local emission (approximately 65%) was of greatimportance to PM
2.5in Shijiazhuang and Xingtai. In Hebei
province, the source contributions of PM2.5
have not beenfinished and published except for Shijiazhuang mentioned inTable 1. Few studies have reported the source contributionsof PM
2.5in other cities of Hebei, but this work is important.
Therefore, this paper appliedMM5-CMAQmodel to quantify
the source contributions of PM2.5, which was necessary for
policy making and air pollution control.
2. Model Configurations and Inputs
2.1. Model Domain and Episode. An offline MM5-CMAQmodel is preformed over two nested domains: as shown inFigure 1, East Asia with a grid resolution of 36 × 36 km(Domain 1) and an area in northeastern China encompassingBeijing, Tianjin, and the four provinces, Hebei, Henan,Shandong, and Shanxi at a 12 × 12 km (Domain 2). Theorigin of domain 1 is 34∘N and 110∘E.The simulated results ofdomain 1 are employed for providing the boundary and initialconditions so as to running domain 2. January and February2013 are selected to calculate the source contributions of
The Scientific World Journal 3
PM2.5, because themonthly average concentration of PM
2.5in
January 2013 is the highest since 2001, and the number of daysof haze is maximum since 1961. The simulations of Februaryare used to compare the source contribution of PM
2.5with the
severe haze period of January. Additionally, a spin-up periodof 5 days (27–31 December 2012) is applied to minimize theinfluence of the initial conditions.
2.2. Model Configurations and Data Input. Using MM5model (version 3.7) combined with four-dimensional dataassimilation (FDDA) to produce meteorological field forCMAQ model. The input data of MM5 and terrain and landuse data are drawn from US Geological Survey Database(ftp://ftp.ucar.edu/mesouser/MM5V3/TERRAIN DATA/),which provides initial and boundary field for CMAQ. Firstguess field with 1∘ × 1∘ resolution, 6-hour interval, and theinitial conditions are extracted from the US GeologicalSurvey Database. The observation data use the NationalCenter for Environmental Prediction (NCEP) Final (FNL)Operational Global Analysis datasets. The major physicsoptions used in the MM5 simulations include the Kain-Fritsch 2 cumulus scheme, the high resolution BlackadarPBL scheme, and the mixed phase explicit moisture schemefor cloud microphysics, the cloud atmospheric radiationscheme for both long-wave and short-wave radiation, andthe force/restore surface scheme. The MM5 output filesare postprocessed by the Meteorology-Chemistry InterfaceProcessor (MCIP) version 3.6 on an hourly basis [17]. Thevertical distribution includes 23 sigma stories, and sigmastory of the closest land is equal to zero. The highest sigmastory is equal to one. 23 sigma levels are selected for thevertical grid structure with the model top pressure of 100mbat approximately 15 km. The height of the first 12 levelsextends up to 2 km from the surface with the lowest level atapproximately 40m.
2.3. Simulation Design and Scenarios. Models-3/CMAQ isa three-dimensional Eulerian atmospheric chemistry andtransport modeling system, which can simulate almost allmajor components including SO
2, NO2, CO, O
3, PM2.5, and
PM10
throughout the troposphere. The SAPRC-99 chem-ical mechanism with aqueous and aerosol extensions andAERO5 model are selected for the gaseous chemistry andaerosol modules, respectively. The aqueous-phase chemistrymechanism is the Regional Acid DepositionModel (RADM).It is noted that online dust emissions are not included inCMAQ v4.7.1; that is to say, this paper does not calculate thecontribution of dust emission.
In this paper, CMAQ is applied with Brute-Force methodas a source sensitivity method for quantifying source con-tributions of PM
2.5by zeroing out emissions from a specific
source [18]. This mode will simulate different cases, firstlyon base case emission and then on emission of zeroing-outa specific source of region.The discrepancy between the baseand the sensitivity simulations can be attributed as the contri-butions of particular source category.This method is a widelyused application way to predict the effect of source [19]. Butthis method is approximate source contributions [20, 21]. In
this paper, base scenarios were preformed firstly using thismodel, and then zero-out regional source included Beijing-Tianjin, southernHebei, northernHebei, Henan, Shanxi, andShandong for calculating the spatial source contributionsof PM
2.5, respectively. The other scenarios were focused on
zeroing the sectoral emission in those regions (i.e., zero-outemissions of industrial source, domestic source, transporta-tion, power plant, and agricultural source of Beijing-Tianjin,resp.). 41 scenarios are simulated to quantify the spatialcontributions, the sectoral contributions, and spatial-sectoralcontributions in Hebei cities. Additionally, industrial source,domestic source, transportation, power plant, and agricul-tural source were derived from MEIC emissions inventory,which is a bottom-up emission inventory developed byTsinghua University [22].
According to the conclusions of BTH-Steel version 1.0(Emissions Inventory Of Steel Industry in the Beijing-Tianjin-Hebei Area, BTH-Steel version 1.0), the three citiesof Xingtai, Handan, and Shijiazhuang are regarded as theSHB in this paper, where the steel and iron industry are cen-tered (http://www.china-eia.com/tzgg/12373.htm). Addition-ally, the three cities belong to the northern china plain and arelocated in eastern Taihang Mountain. In this area, the majorindustrial manufactures include coal, power, steel and iron,and glass industry. Because of the high emission and typicalterrain, this area experiences the most severe haze eventin January 2013. The other cities (Zhangjiakou, Chengde,Qinhuangdao, Cangzhou, Hengshui, Langfang, Baoding, andTangshan) in Hebei are seen as the northern Hebei (NHB).Among these cities, most of the northwest areas in Hebeiare mountainous and hilly, such as Zhangjiakou, Chengde,and Qinhuangdao. Tangshan and Baoding located aroundthe Beijing and Tianjin city are developing cities. Tangshanis a rapid development city, and the gross domestic product(GDP) of Tangshan in 2013 was up to 612.1 billion RMBand ranked 1st in Hebei, because there are lots of industrialmanufactures based on coal and steel, which emit largeamounts of air pollutants. There is almost no heavy industryin Cangzhou, Hengshui, and Langfang, but they sufferedfrom the PM
2.5pollution.
3. Results
3.1. The Spatial Contributions of PM2.5 Concentrations. Thispaper used the same model and configurations details intro-duced byWang et al. [15]. The model results were thoroughlyevaluated in terms of five major meteorological parametersand chemical concentrations (PM
2.5and PM
10). Mean bias
(MB), the root mean square error (RMSE), the normalizedmean bias (NMB), the normalized mean error (NME), themean fractional bias (MFB), and the mean fractional error(MFE) were analyzed according to the standard defined inZhang et al. [23]. MM5-CMAQ could reproduce the mostpolluted episodes in southern Beijing-Tianjin-Hebei, theYangtze River Delta, and the Sichuan Basin, respectively. Butin northeastern and northwestern China, the concentrationsof PM
2.5and PM
10present underprediction due to the
spatial allocation of the emissions and the lack of an online
4 The Scientific World Journal
Table 2: The average spatial source contribution (%) to PM2.5
concentrations in Hebei cities.
SHB NHB BJTJ SX SD HN Sum
Shijiazhuang Jan. 70.8 14.1 2.3 4.9 1.4 1.4 94.9Feb. 66.4 15.0 3.2 3.8 3.8 1.9 94.1
Xingtai Jan. 70.6 9.4 2.2 4.9 2.5 5.6 95.2Feb. 63.9 10.1 3.2 3.6 5.8 7.6 94.2
Handan Jan. 68.5 7.6 1.9 4.1 2.9 9.9 94.9Feb. 63.0 7.9 2.8 2.9 6.2 10.9 93.7
Zhangjiakou Jan. 0.5 69.8 1.6 2.5 0.2 0.5 75.1Feb. 2.0 70.7 1.6 2.7 0.8 0.4 78.2
Chengde Jan. 0.7 68.7 4.0 1.1 0.6 0.4 75.5Feb. 0.7 66.2 7.6 0.7 2.4 0.6 78.2
Qinhuangdao Jan. 0.8 57.7 2.7 0.6 2.0 0.6 64.4Feb. 0.8 59.6 4.4 0.6 5.7 0.6 71.7
Cangzhou Jan. 3.1 54.1 14.0 2.1 10.7 3.7 87.7Feb. 2.6 45.9 16.1 2.0 18.7 3.1 88.4
Hengshui Jan. 10.2 54.3 4.2 3.0 11.0 7.0 89.7Feb. 6.2 48.6 6.5 2.7 18.7 6.3 89
Langfang Jan. 2.3 30.0 52.9 1.5 1.4 0.8 88.9Feb. 1.5 31.5 48.9 1.3 5.9 0.8 89.9
Baoding Jan. 3.7 82.1 5.5 1.8 1.3 0.9 95.3Feb. 3.5 78.2 6.8 1.4 4.4 1.1 95.4
Tangshan Jan. 0.8 81.6 4.7 0.6 1.2 0.5 89.4Feb. 0.9 79.0 6.3 0.6 4.4 0.6 91.8
SHB: southern Hebei; NHB: northern Hebei; BJTJ: Beijing and Tianjin; SX:Shanxi; SD: Shandong; HN: Henan.
dust emission module in this model. The stimulated resultsoverall underpredict PM
2.5and PM
10concentrations over
Domain 1. Although the MFBs and MFEs to PM2.5
reached−19.5% and 58.5% in January and −14.1% and 62.1% inFebruary, respectively, all of them were within the criteriafor a satisfactory performance. As for PM
10, the NMBs were,
respectively, −32.0% in January and −31.6% in February. Allof the prediction meteorological field, the spatial allocationemissions, and dust emissions might lead to underpredictionof PM
2.5and PM
10. In Domain 2, the model predictions
agreed well with observations.The averaged NMBs for PM2.5
of Beijing, Tianjin, Shijiazhuang, Xingtai, and Handan were−8.2%, 40.6%, 0.8%, −18.4%, and 8.8% in January and 9.4%,27.3%, −19.5%, −13.9%, and −5.6% in February, respectively.The domain-wide NMBs for PM
10over Domain 2 were
−13.6% and −10.4% for January and February. The finer gridresolution notably reduced the underpredictions in PM
10.
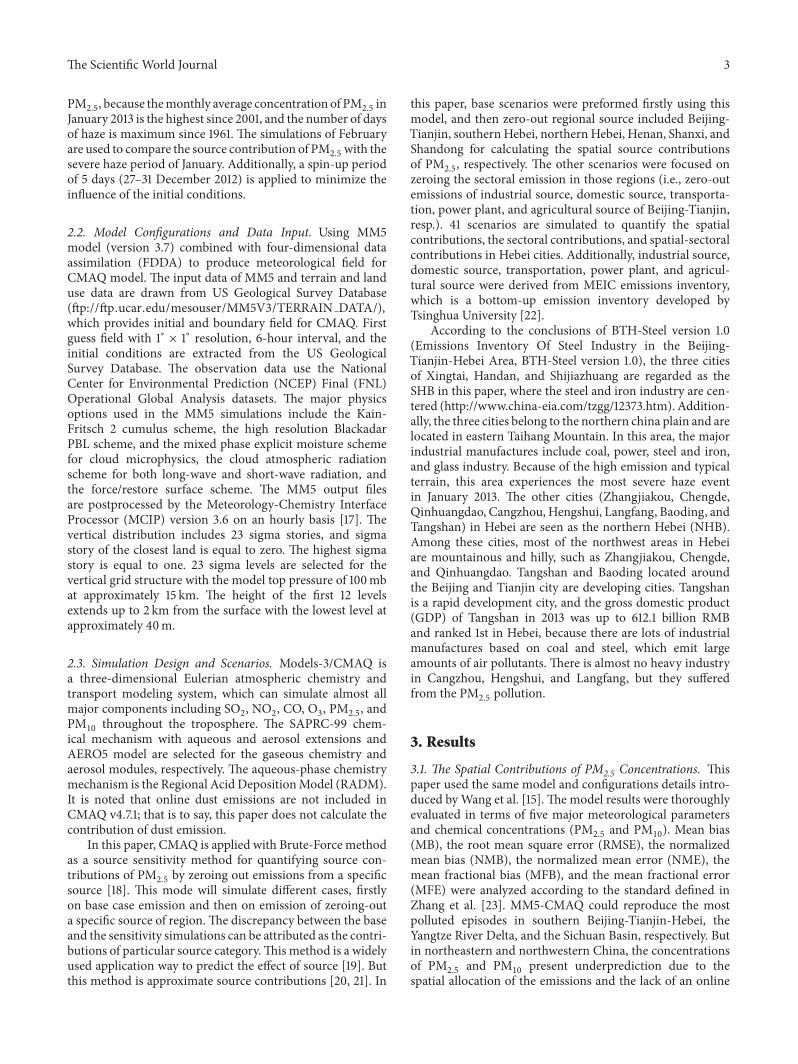
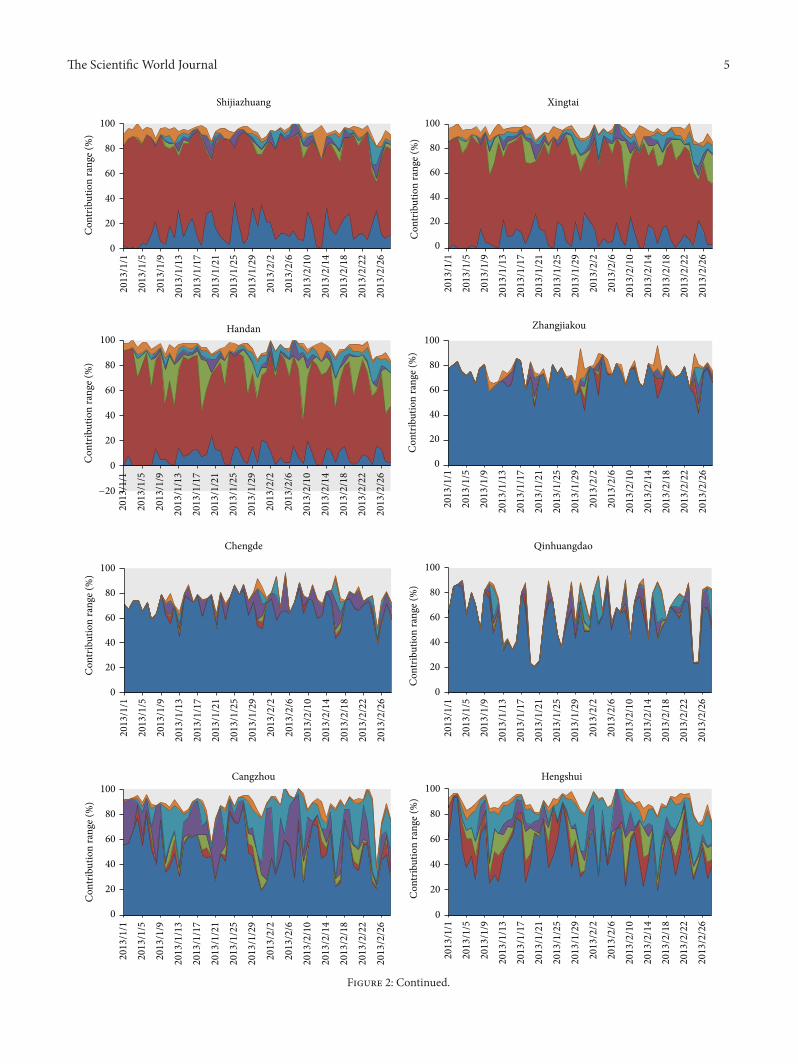
Table 2 gives the average spatial contributions to PM2.5
concentrations in Hebei cities during January and February2013. In Xingtai, Shijiazhuang, and Handan, PM
2.5was
mainly originated from the SHB with the fractions of 70.6%,70.8%, and 68.5% in January and 63.9%, 66.4%, and 63.0% inFebruary, respectively. That is to say, the local emission is themajor contributor. In Shijiazhuang, NHB contributed 14.1%and 15.0% of PM
2.5concentrations in January and February,
which were higher than 9.4% and 10.1% in Xingtai and 7.6%and 7.9% in Handan. The source contributions of Henan
(HN) to PM2.5
in January and February were, respectively,5.6% and 7.6% inXingtai and 9.9% and 10.9% inHandan, bothof which were higher than 1.4% and 1.9% in Shijiazhuang.Geography position plays an important role. Therefore, HNcontributed more PM
2.5in Handan, and NHB contributed
more PM2.5
in Shijiazhuang shown in Figure 2. This papernoted that HN is the largest contributor before and afterJanuary 11 identified as the heaviest day, but SHB is themajor contributor on January 11. PM
2.5concentration would
decrease shortly when the contributions of HN increase inHandan. Additionally, the contribution of NHB would notdevelop a high PM
2.5concentration despite the fact that
its contribution is not ignored. High PM2.5
concentrationsusually occurred under high contribution of SHB. Namely,local emission should be firstly controlled.
In Zhangjiakou, Chengde, and Qinhuangdao, NHB wasthe largest contributor shown in Figure 2, which contributed69.8% and 70.7% on average to Zhangjiakou in Januaryand February, 68.7% and 66.2% to Chengde, and 57.7%and 59.6% to Qinhuangdao, respectively. Little difference ofcontributions between the two months suggests that thereis no intensive emission and no notable regional transportoccurred in January. Stagnant meteorological conditions,such as low wind speed and inversion layer, resulted inaccumulation of particulate matters, as well as high relativehumidity that accelerates the reaction of heterogeneouschemistry [24]. Simultaneously, the sum source contributionsof January and February were, respectively, 75.1% and 78.2%in Zhangjiakou, 64.4% and 71.7% in Qinhuangdao, and75.5% and 78.2% in Chengde. Dust emission could not becalculated in this model result in underestimation of sourcecontributions. This paper noted that SD contributed morePM2.5
in February with contribution of 5.7% that is higherthan 2.0% of January in Qinhuangdao.The upper air of BohaiSea could produce PM
2.5and supply sea-slat into atmosphere,
which arrive at Qinhuangdao city along with the particlesfrom SD under southern wind.
In Cangzhou, Hengshui, and Langfang, all of SD, BJTJ,SHB, SX, and HN contributed a considerable amount ofPM2.5
shown in Figure 2. In Hengshui, NHB contributed54.3% and 48.6% of PM
2.5in January and February. SD was
the second largest contributor in January, with contributionsof 11.0% to PM
2.5, followed by 10.2% of SHB and 7.0% of
HN. In Langfang, BJTJ was the most obvious contributorthat contributed 52.9% and 48.9% of PM
2.5in January
and February, respectively, which have exceeded 30.0% and31.5% of NHB. Therefore, the source contributions of thetransport processing of BJTJ should be taken into account inmaking control strategies. In the three cities, the influenceof complicated multiple sources induces the high PM
2.5in
January; that is to say, regional transport process is themajor cause for formation of haze event. Therefore, controlstrategies should be focused on regional joint policy makingin the three cities.
In Tangshan and Baoding, NHB contributed 81.6% ofJanuary and 79.0% of February in Tangshan and 82.1%and 78.2% in Baoding, respectively. Additionally, the sumcontributions were 89.4–91.8% in Tangshan and 95.3–95.4%in Baoding. It is indicated that MM5-CMAQ is available to
The Scientific World Journal 5
2013
/1/1
2013
/1/5
2013
/1/9
2013
/1/13
2013
/1/17
2013
/1/21
2013
/1/25
2013
/1/29
2013
/2/2
2013
/2/6
2013
/2/10
2013
/2/14
2013
/2/18
2013
/2/22
2013
/2/26
2013
/1/1
2013
/1/5
2013
/1/9
2013
/1/13
2013
/1/17
2013
/1/21
2013
/1/25
2013
/1/29
2013
/2/2
2013
/2/6
2013
/2/10
2013
/2/14
2013
/2/18
2013
/2/22
2013
/2/26
2013
/1/1
2013
/1/5
2013
/1/9
2013
/1/13
2013
/1/17
2013
/1/21
2013
/1/25
2013
/1/29
2013
/2/2
2013
/2/6
2013
/2/10
2013
/2/14
2013
/2/18
2013
/2/22
2013
/2/26
2013
/1/1
2013
/1/5
2013
/1/9
2013
/1/13
2013
/1/17
2013
/1/21
2013
/1/25
2013
/1/29
2013
/2/2
2013
/2/6
2013
/2/10
2013
/2/14
2013
/2/18
2013
/2/22
2013
/2/26
2013
/1/1
2013
/1/5
2013
/1/9
2013
/1/13
2013
/1/17
2013
/1/21
2013
/1/25
2013
/1/29
2013
/2/2
2013
/2/6
2013
/2/10
2013
/2/14
2013
/2/18
2013
/2/22
2013
/2/26
2013
/1/1
2013
/1/5
2013
/1/9
2013
/1/13
2013
/1/17
2013
/1/21
2013
/1/25
2013
/1/29
2013
/2/2
2013
/2/6
2013
/2/10
2013
/2/14
2013
/2/18
2013
/2/22
2013
/2/26
−20
0
20
40
60
80
100
Con
trib
utio
n ra
nge (
%)
Con
trib
utio
n ra
nge (
%)
Con
trib
utio
n ra
nge (
%)
Con
trib
utio
n ra
nge (
%)
Con
trib
utio
n ra
nge (
%)
Con
trib
utio
n ra
nge (
%)
Con
trib
utio
n ra
nge (
%)
Con
trib
utio
n ra
nge (
%)
0
20
40
60
80
100
Xingtai
0
20
40
60
80
100Handan
0
20
40
60
80
100Zhangjiakou
0
20
40
60
80
100
Chengde
0
20
40
60
80
100
Qinhuangdao
0
20
40
60
80
100
0
20
40
60
80
100Hengshui
Shijiazhuang
2013
/1/1
2013
/1/5
2013
/1/9
2013
/1/13
2013
/1/17
2013
/1/21
2013
/1/25
2013
/1/29
2013
/2/2
2013
/2/6
2013
/2/10
2013
/2/14
2013
/2/18
2013
/2/22
2013
/2/26
2013
/1/1
2013
/1/9
2013
/1/13
2013
/1/17
2013
/1/21
2013
/1/25
2013
/1/29
2013
/2/2
2013
/2/6
2013
/2/10
2013
/2/14
2013
/2/18
2013
/2/22
2013
/2/26
2013
/1/5
Cangzhou
Figure 2: Continued.
6 The Scientific World Journal
2013
/1/1
2013
/1/5
2013
/1/9
2013
/1/13
2013
/1/17
2013
/1/21
2013
/1/25
2013
/1/29
2013
/2/2
2013
/2/6
2013
/2/10
2013
/2/14
2013
/2/18
2013
/2/22
2013
/2/26
2013
/1/1
2013
/1/5
2013
/1/9
2013
/1/13
2013
/1/17
2013
/1/21
2013
/1/25
2013
/1/29
2013
/2/2
2013
/2/6
2013
/2/10
2013
/2/14
2013
/2/18
2013
/2/22
2013
/2/26
2013
/1/1
2013
/1/5
2013
/1/9
2013
/1/13
2013
/1/17
2013
/1/21
2013
/1/25
2013
/1/29
2013
/2/2
2013
/2/6
2013
/2/10
2013
/2/14
2013
/2/18
2013
/2/22
2013
/2/26
Con
trib
utio
n ra
nge (
%)
Con
trib
utio
n ra
nge (
%)
Con
trib
utio
n ra
nge (
%)
0
20
40
60
80
100Baoding
0
20
40
60
80
100Tangshan
0
20
40
60
80
100Langfang
SXSDBJTJ
HNSHBNHB
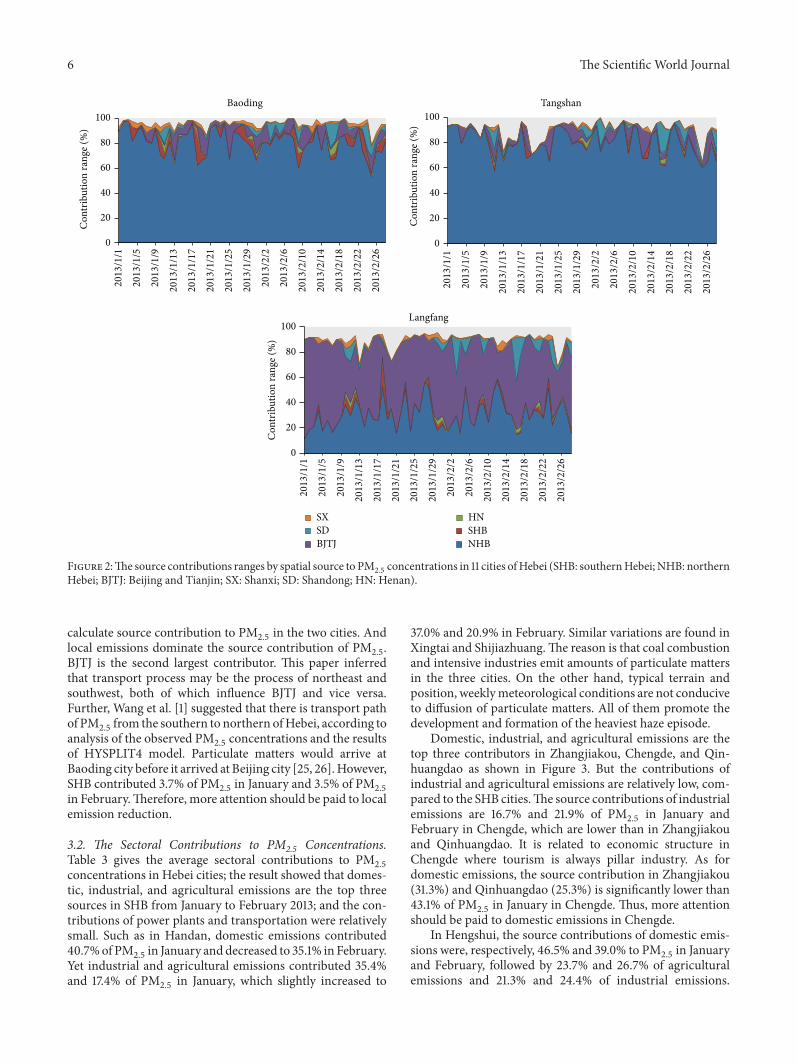
Figure 2:The source contributions ranges by spatial source to PM2.5
concentrations in 11 cities ofHebei (SHB: southernHebei; NHB: northernHebei; BJTJ: Beijing and Tianjin; SX: Shanxi; SD: Shandong; HN: Henan).
calculate source contribution to PM2.5
in the two cities. Andlocal emissions dominate the source contribution of PM
2.5.
BJTJ is the second largest contributor. This paper inferredthat transport process may be the process of northeast andsouthwest, both of which influence BJTJ and vice versa.Further, Wang et al. [1] suggested that there is transport pathof PM
2.5from the southern to northern ofHebei, according to
analysis of the observed PM2.5
concentrations and the resultsof HYSPLIT4 model. Particulate matters would arrive atBaoding city before it arrived at Beijing city [25, 26].However,SHB contributed 3.7% of PM
2.5in January and 3.5% of PM
2.5
in February.Therefore, more attention should be paid to localemission reduction.
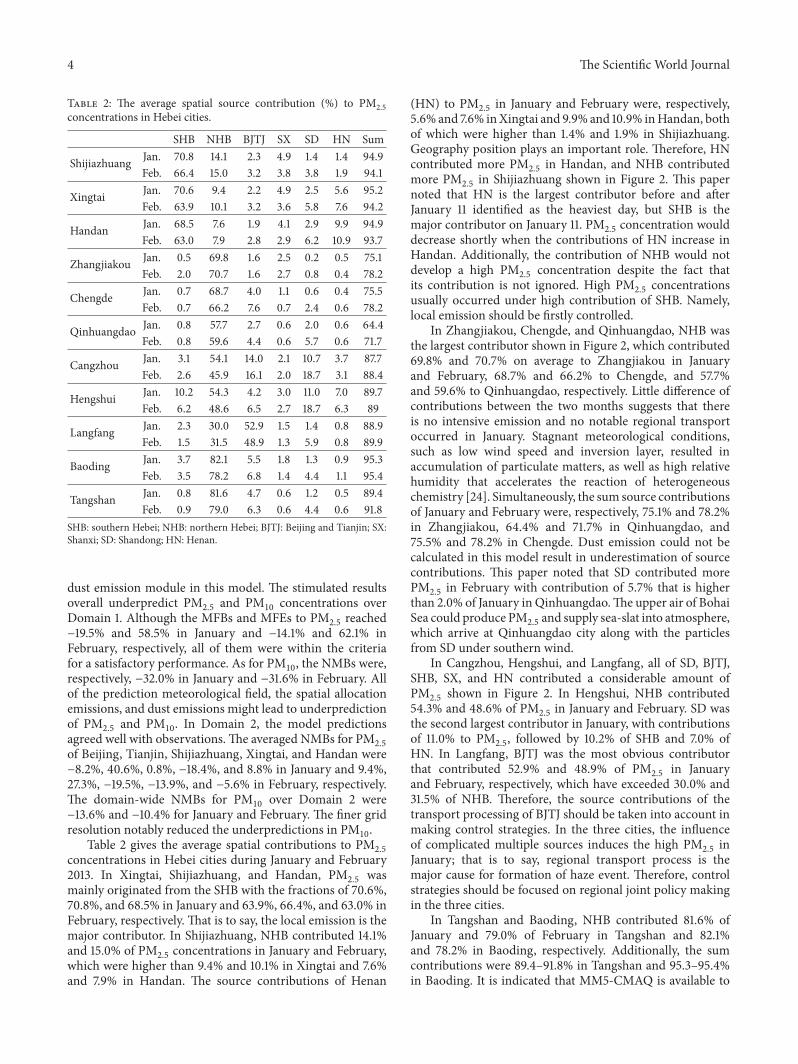
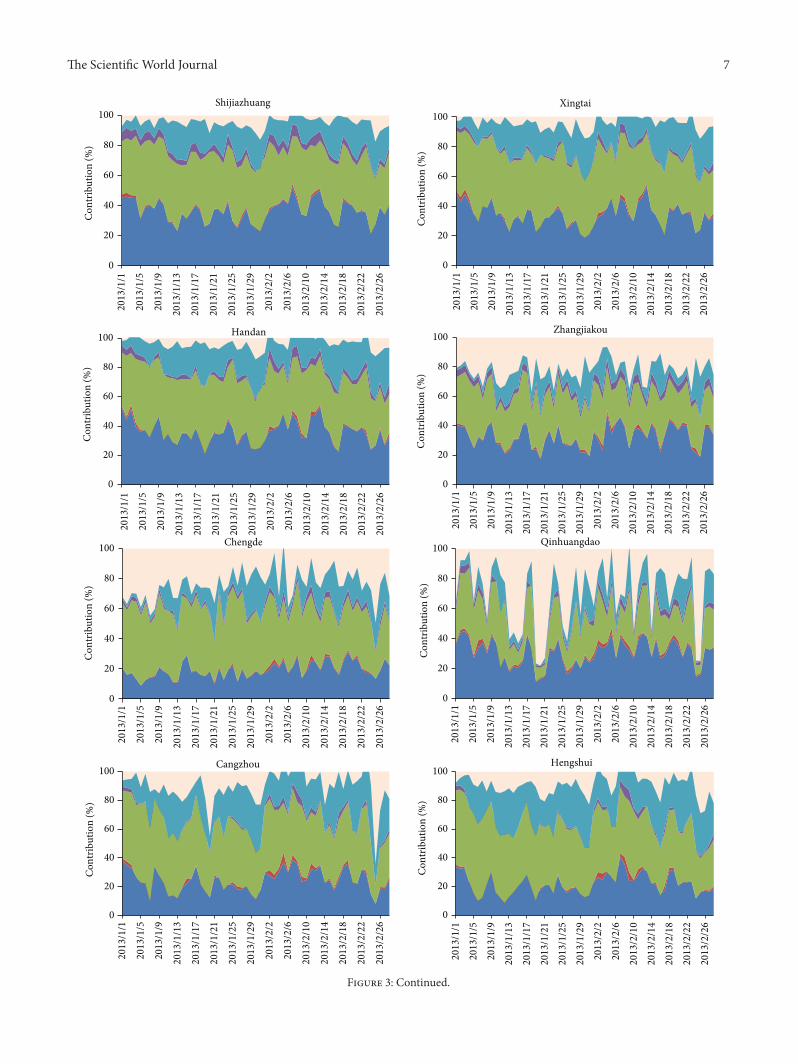
3.2. The Sectoral Contributions to PM2.5 Concentrations.Table 3 gives the average sectoral contributions to PM
2.5
concentrations in Hebei cities; the result showed that domes-tic, industrial, and agricultural emissions are the top threesources in SHB from January to February 2013; and the con-tributions of power plants and transportation were relativelysmall. Such as in Handan, domestic emissions contributed40.7%of PM
2.5in January anddecreased to 35.1% in February.
Yet industrial and agricultural emissions contributed 35.4%and 17.4% of PM
2.5in January, which slightly increased to
37.0% and 20.9% in February. Similar variations are found inXingtai and Shijiazhuang.The reason is that coal combustionand intensive industries emit amounts of particulate mattersin the three cities. On the other hand, typical terrain andposition, weeklymeteorological conditions are not conduciveto diffusion of particulate matters. All of them promote thedevelopment and formation of the heaviest haze episode.
Domestic, industrial, and agricultural emissions are thetop three contributors in Zhangjiakou, Chengde, and Qin-huangdao as shown in Figure 3. But the contributions ofindustrial and agricultural emissions are relatively low, com-pared to the SHB cities.The source contributions of industrialemissions are 16.7% and 21.9% of PM
2.5in January and
February in Chengde, which are lower than in Zhangjiakouand Qinhuangdao. It is related to economic structure inChengde where tourism is always pillar industry. As fordomestic emissions, the source contribution in Zhangjiakou(31.3%) and Qinhuangdao (25.3%) is significantly lower than43.1% of PM
2.5in January in Chengde. Thus, more attention
should be paid to domestic emissions in Chengde.In Hengshui, the source contributions of domestic emis-
sions were, respectively, 46.5% and 39.0% to PM2.5
in Januaryand February, followed by 23.7% and 26.7% of agriculturalemissions and 21.3% and 24.4% of industrial emissions.
The Scientific World Journal 7
0
20
40
60
80
10020
13/1
/1
2013
/1/5
2013
/1/9
2013
/1/1
3
2013
/1/1
7
2013
/1/2
1
2013
/1/2
5
2013
/1/2
9
2013
/2/2
2013
/2/6
2013
/2/1
0
2013
/2/1
4
2013
/2/1
8
2013
/2/2
2
2013
/2/2
6
Cont
ribut
ion
(%)
0
20
40
60
80
100
2013
/1/1
2013
/1/5
2013
/1/9
2013
/1/1
320
13/1
/17
2013
/1/2
120
13/1
/25
2013
/1/2
920
13/2
/220
13/2
/620
13/2
/10
2013
/2/1
420
13/2
/18
2013
/2/2
220
13/2
/26
Cont
ribut
ion
(%)
0
20
40
60
80
100
2013
/1/1
2013
/1/5
2013
/1/9
2013
/1/1
3
2013
/1/1
7
2013
/1/2
1
2013
/1/2
5
2013
/1/2
9
2013
/2/2
2013
/2/6
2013
/2/1
0
2013
/2/1
4
2013
/2/1
8
2013
/2/2
2
2013
/2/2
6
Cont
ribut
ion
(%)
0
20
40
60
80
100
2013
/1/1
2013
/1/5
2013
/1/9
2013
/1/1
320
13/1
/17
2013
/1/2
120
13/1
/25
2013
/1/2
920
13/2
/220
13/2
/620
13/2
/10
2013
/2/1
420
13/2
/18
2013
/2/2
220
13/2
/26
Cont
ribut
ion
(%)
Zhangjiakou
0
20
40
60
80
100
2013
/1/1
2013
/1/5
2013
/1/9
2013
/1/1
3
2013
/1/1
7
2013
/1/2
1
2013
/1/2
5
2013
/1/2
9
Cont
ribut
ion
(%)
Chengde
0
20
40
60
80
100
2013
/1/1
2013
/1/5
2013
/1/9
2013
/1/1
320
13/1
/17
2013
/1/2
120
13/1
/25
2013
/1/2
920
13/2
/220
13/2
/620
13/2
/10
2013
/2/1
420
13/2
/18
2013
/2/2
220
13/2
/26
Cont
ribut
ion
(%)
Qinhuangdao
0
20
40
60
80
100
2013
/1/1
2013
/1/5
2013
/1/9
2013
/1/1
3
2013
/1/1
7
2013
/1/2
1
2013
/1/2
5
2013
/1/2
9
2013
/2/2
2013
/2/6
2013
/2/1
0
2013
/2/1
4
2013
/2/1
8
2013
/2/2
2
2013
/2/2
6
Cont
ribut
ion
(%)
0
20
40
60
80
100
2013
/1/1
2013
/1/5
2013
/1/9
2013
/1/1
320
13/1
/17
2013
/1/2
120
13/1
/25
2013
/1/2
920
13/2
/220
13/2
/620
13/2
/10
2013
/2/1
420
13/2
/18
2013
/2/2
220
13/2
/26
Cont
ribut
ion
(%)
Shijiazhuang
Cangzhou Hengshui
Xingtai
Handan
2013
/2/1
0
2013
/2/1
4
2013
/2/1
8
2013
/2/2
2
2013
/2/2
6
2013
/2/2
2013
/2/6
Figure 3: Continued.
8 The Scientific World Journal
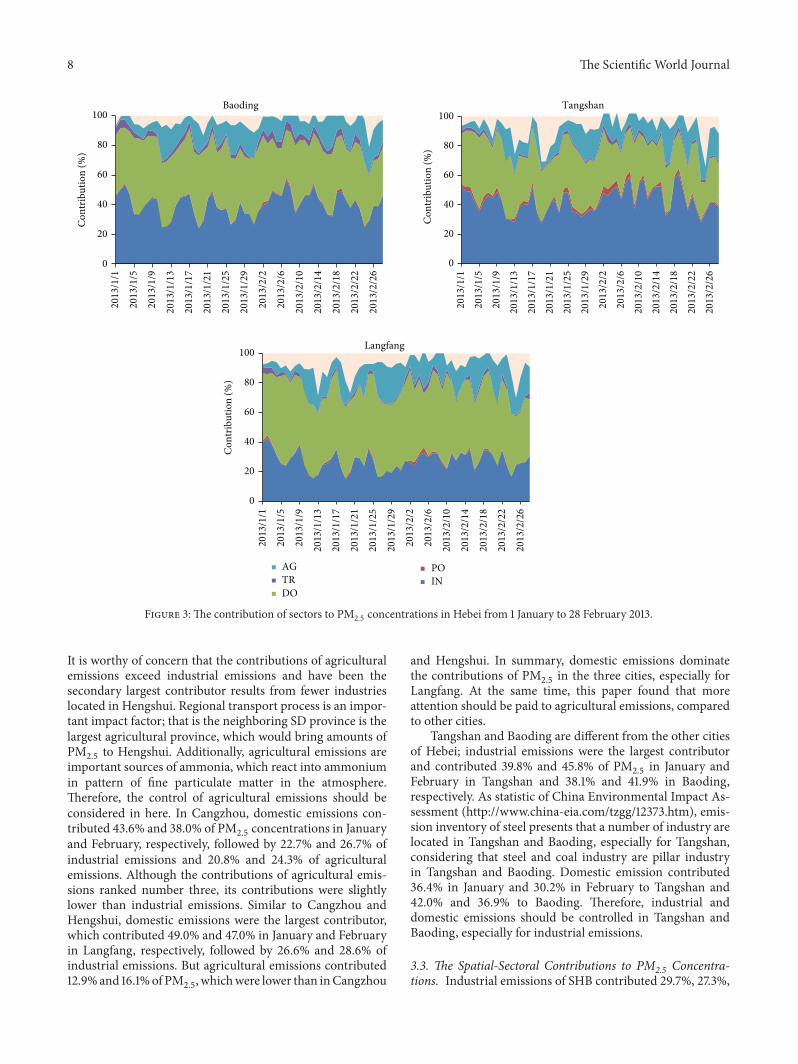
AGTRDO
POIN
0
20
40
60
80
10020
13/1
/1
2013
/1/5
2013
/1/9
2013
/1/1
3
2013
/1/1
7
2013
/1/2
1
2013
/1/2
5
2013
/1/2
9
2013
/2/2
2013
/2/6
2013
/2/1
0
2013
/2/1
4
2013
/2/1
8
2013
/2/2
2
2013
/2/2
6
Cont
ribut
ion
(%)
Baoding
0
20
40
60
80
100
2013
/1/1
2013
/1/5
2013
/1/9
2013
/1/1
320
13/1
/17
2013
/1/2
120
13/1
/25
2013
/1/2
920
13/2
/220
13/2
/620
13/2
/10
2013
/2/1
420
13/2
/18
2013
/2/2
220
13/2
/26
Cont
ribut
ion
(%)
Tangshan
0
20
40
60
80
100
2013
/1/1
2013
/1/5
2013
/1/9
2013
/1/1
3
2013
/1/1
7
2013
/1/2
1
2013
/1/2
5
2013
/1/2
9
2013
/2/2
2013
/2/6
2013
/2/1
0
2013
/2/1
4
2013
/2/1
8
2013
/2/2
2
2013
/2/2
6
Cont
ribut
ion
(%)
Langfang
Figure 3: The contribution of sectors to PM2.5
concentrations in Hebei from 1 January to 28 February 2013.
It is worthy of concern that the contributions of agriculturalemissions exceed industrial emissions and have been thesecondary largest contributor results from fewer industrieslocated in Hengshui. Regional transport process is an impor-tant impact factor; that is the neighboring SD province is thelargest agricultural province, which would bring amounts ofPM2.5
to Hengshui. Additionally, agricultural emissions areimportant sources of ammonia, which react into ammoniumin pattern of fine particulate matter in the atmosphere.Therefore, the control of agricultural emissions should beconsidered in here. In Cangzhou, domestic emissions con-tributed 43.6% and 38.0% of PM
2.5concentrations in January
and February, respectively, followed by 22.7% and 26.7% ofindustrial emissions and 20.8% and 24.3% of agriculturalemissions. Although the contributions of agricultural emis-sions ranked number three, its contributions were slightlylower than industrial emissions. Similar to Cangzhou andHengshui, domestic emissions were the largest contributor,which contributed 49.0% and 47.0% in January and Februaryin Langfang, respectively, followed by 26.6% and 28.6% ofindustrial emissions. But agricultural emissions contributed12.9%and 16.1%of PM
2.5, whichwere lower than inCangzhou
and Hengshui. In summary, domestic emissions dominatethe contributions of PM
2.5in the three cities, especially for
Langfang. At the same time, this paper found that moreattention should be paid to agricultural emissions, comparedto other cities.
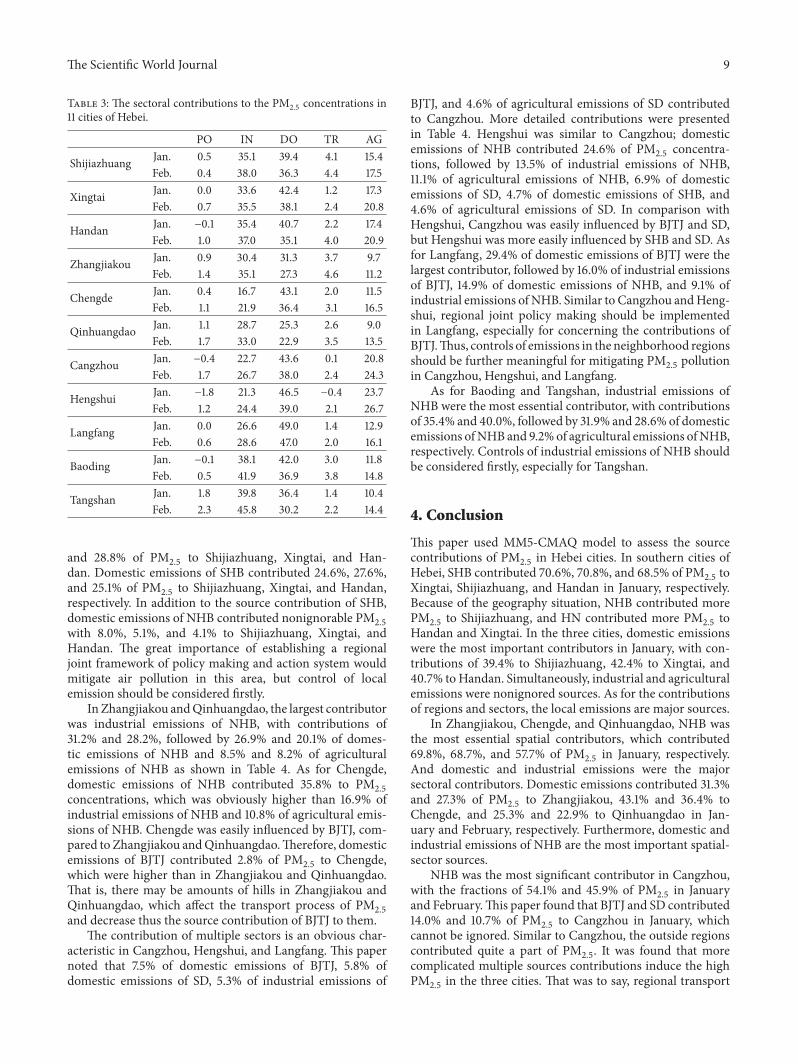
Tangshan and Baoding are different from the other citiesof Hebei; industrial emissions were the largest contributorand contributed 39.8% and 45.8% of PM
2.5in January and
February in Tangshan and 38.1% and 41.9% in Baoding,respectively. As statistic of China Environmental Impact As-sessment (http://www.china-eia.com/tzgg/12373.htm), emis-sion inventory of steel presents that a number of industry arelocated in Tangshan and Baoding, especially for Tangshan,considering that steel and coal industry are pillar industryin Tangshan and Baoding. Domestic emission contributed36.4% in January and 30.2% in February to Tangshan and42.0% and 36.9% to Baoding. Therefore, industrial anddomestic emissions should be controlled in Tangshan andBaoding, especially for industrial emissions.
3.3. The Spatial-Sectoral Contributions to PM2.5 Concentra-tions. Industrial emissions of SHB contributed 29.7%, 27.3%,
The Scientific World Journal 9
Table 3: The sectoral contributions to the PM2.5
concentrations in11 cities of Hebei.
PO IN DO TR AG
Shijiazhuang Jan. 0.5 35.1 39.4 4.1 15.4Feb. 0.4 38.0 36.3 4.4 17.5
Xingtai Jan. 0.0 33.6 42.4 1.2 17.3Feb. 0.7 35.5 38.1 2.4 20.8
Handan Jan. −0.1 35.4 40.7 2.2 17.4Feb. 1.0 37.0 35.1 4.0 20.9
Zhangjiakou Jan. 0.9 30.4 31.3 3.7 9.7Feb. 1.4 35.1 27.3 4.6 11.2
Chengde Jan. 0.4 16.7 43.1 2.0 11.5Feb. 1.1 21.9 36.4 3.1 16.5
Qinhuangdao Jan. 1.1 28.7 25.3 2.6 9.0Feb. 1.7 33.0 22.9 3.5 13.5
Cangzhou Jan. −0.4 22.7 43.6 0.1 20.8Feb. 1.7 26.7 38.0 2.4 24.3
Hengshui Jan. −1.8 21.3 46.5 −0.4 23.7Feb. 1.2 24.4 39.0 2.1 26.7
Langfang Jan. 0.0 26.6 49.0 1.4 12.9Feb. 0.6 28.6 47.0 2.0 16.1
Baoding Jan. −0.1 38.1 42.0 3.0 11.8Feb. 0.5 41.9 36.9 3.8 14.8
Tangshan Jan. 1.8 39.8 36.4 1.4 10.4Feb. 2.3 45.8 30.2 2.2 14.4
and 28.8% of PM2.5
to Shijiazhuang, Xingtai, and Han-dan. Domestic emissions of SHB contributed 24.6%, 27.6%,and 25.1% of PM
2.5to Shijiazhuang, Xingtai, and Handan,
respectively. In addition to the source contribution of SHB,domestic emissions of NHB contributed nonignorable PM
2.5
with 8.0%, 5.1%, and 4.1% to Shijiazhuang, Xingtai, andHandan. The great importance of establishing a regionaljoint framework of policy making and action system wouldmitigate air pollution in this area, but control of localemission should be considered firstly.
In Zhangjiakou andQinhuangdao, the largest contributorwas industrial emissions of NHB, with contributions of31.2% and 28.2%, followed by 26.9% and 20.1% of domes-tic emissions of NHB and 8.5% and 8.2% of agriculturalemissions of NHB as shown in Table 4. As for Chengde,domestic emissions of NHB contributed 35.8% to PM
2.5
concentrations, which was obviously higher than 16.9% ofindustrial emissions of NHB and 10.8% of agricultural emis-sions of NHB. Chengde was easily influenced by BJTJ, com-pared to Zhangjiakou andQinhuangdao.Therefore, domesticemissions of BJTJ contributed 2.8% of PM
2.5to Chengde,
which were higher than in Zhangjiakou and Qinhuangdao.That is, there may be amounts of hills in Zhangjiakou andQinhuangdao, which affect the transport process of PM
2.5
and decrease thus the source contribution of BJTJ to them.The contribution of multiple sectors is an obvious char-
acteristic in Cangzhou, Hengshui, and Langfang. This papernoted that 7.5% of domestic emissions of BJTJ, 5.8% ofdomestic emissions of SD, 5.3% of industrial emissions of
BJTJ, and 4.6% of agricultural emissions of SD contributedto Cangzhou. More detailed contributions were presentedin Table 4. Hengshui was similar to Cangzhou; domesticemissions of NHB contributed 24.6% of PM
2.5concentra-
tions, followed by 13.5% of industrial emissions of NHB,11.1% of agricultural emissions of NHB, 6.9% of domesticemissions of SD, 4.7% of domestic emissions of SHB, and4.6% of agricultural emissions of SD. In comparison withHengshui, Cangzhou was easily influenced by BJTJ and SD,but Hengshui was more easily influenced by SHB and SD. Asfor Langfang, 29.4% of domestic emissions of BJTJ were thelargest contributor, followed by 16.0% of industrial emissionsof BJTJ, 14.9% of domestic emissions of NHB, and 9.1% ofindustrial emissions of NHB. Similar to Cangzhou andHeng-shui, regional joint policy making should be implementedin Langfang, especially for concerning the contributions ofBJTJ.Thus, controls of emissions in the neighborhood regionsshould be further meaningful for mitigating PM
2.5pollution
in Cangzhou, Hengshui, and Langfang.As for Baoding and Tangshan, industrial emissions of
NHB were the most essential contributor, with contributionsof 35.4% and 40.0%, followed by 31.9% and 28.6% of domesticemissions ofNHB and 9.2%of agricultural emissions ofNHB,respectively. Controls of industrial emissions of NHB shouldbe considered firstly, especially for Tangshan.
4. Conclusion
This paper used MM5-CMAQ model to assess the sourcecontributions of PM
2.5in Hebei cities. In southern cities of
Hebei, SHB contributed 70.6%, 70.8%, and 68.5% of PM2.5
toXingtai, Shijiazhuang, and Handan in January, respectively.Because of the geography situation, NHB contributed morePM2.5
to Shijiazhuang, and HN contributed more PM2.5
toHandan and Xingtai. In the three cities, domestic emissionswere the most important contributors in January, with con-tributions of 39.4% to Shijiazhuang, 42.4% to Xingtai, and40.7% toHandan. Simultaneously, industrial and agriculturalemissions were nonignored sources. As for the contributionsof regions and sectors, the local emissions are major sources.
In Zhangjiakou, Chengde, and Qinhuangdao, NHB wasthe most essential spatial contributors, which contributed69.8%, 68.7%, and 57.7% of PM
2.5in January, respectively.
And domestic and industrial emissions were the majorsectoral contributors. Domestic emissions contributed 31.3%and 27.3% of PM
2.5to Zhangjiakou, 43.1% and 36.4% to
Chengde, and 25.3% and 22.9% to Qinhuangdao in Jan-uary and February, respectively. Furthermore, domestic andindustrial emissions of NHB are the most important spatial-sector sources.
NHB was the most significant contributor in Cangzhou,with the fractions of 54.1% and 45.9% of PM
2.5in January
and February.This paper found that BJTJ and SD contributed14.0% and 10.7% of PM
2.5to Cangzhou in January, which
cannot be ignored. Similar to Cangzhou, the outside regionscontributed quite a part of PM
2.5. It was found that more
complicated multiple sources contributions induce the highPM2.5
in the three cities. That was to say, regional transport

10 The Scientific World Journal
Table 4: The average source contributions (%) to PM2.5
concentrations in Hebei cities by source regions and sectors from 1 January to 28February 2013.
IN PO DO TR AG IN PO DO TR AG IN PO DO TR AGShijiazhuang Xingtai Handan
SHB 29.7 0.6 24.6 4.4 9.4 27.3 0.5 27.6 1.8 9.9 28.8 0.6 25.1 3.0 8.8NHB 3.3 0.0 8.0 0.0 2.7 2.2 0.0 5.1 0.0 2.2 1.7 −0.1 4.1 0.0 1.8BJTJ 0.9 0.0 1.5 0.0 0.2 1.0 0.0 1.5 0.0 0.3 0.8 0.0 1.2 0.0 0.2SD 0.4 −0.1 1.3 −0.1 0.9 0.7 −0.1 2.0 0.0 1.3 0.7 −0.1 2.3 0.0 1.4HN 0.3 −0.1 0.7 −0.1 0.7 1.5 −0.1 2.4 0.0 2.7 2.5 −0.2 3.7 0.0 4.1SX 1.5 0.1 1.9 0.0 0.5 1.6 0.1 1.9 0.0 0.5 1.3 0.0 1.6 0.0 0.4Sum 36.1 0.5 38 4.2 14.4 34.3 0.4 40.5 1.8 16.9 35.8 0.2 38 3 16.7
Zhangjiakou Chengde QinhuangdaoSHB 0.2 0.0 0.4 0.0 0.5 0.1 0.0 0.3 0.0 0.3 0.2 0.0 4.2 0.0 0.2NHB 31.2 0.9 26.9 4.0 8.5 16.9 0.6 35.8 2.4 10.8 28.2 1.3 20.1 3.0 8.2BJTJ 0.4 0.0 0.8 0.1 0.4 1.5 0.0 2.8 0.1 1.2 1.0 0.0 1.8 0.0 0.5SD 0.1 0.0 0.2 0.0 0.3 0.2 0.0 0.5 0.0 0.6 0.9 0.0 1.2 0.1 1.4HN 0.1 0.0 0.1 0.0 0.3 0.1 0.0 0.1 0.0 0.3 0.1 0.0 0.2 0.0 0.3SX 0.7 0.1 1.1 0.0 0.7 0.3 0.0 0.4 0.0 0.2 0.2 0.0 0.3 0.0 0.1Sum 32.7 1 29.5 4.1 10.7 19.1 0.6 39.9 2.5 13.4 30.6 1.3 27.8 3.1 10.7
Cangzhou Hengshui LangfangSHB 0.6 −0.1 1.5 −0.1 0.8 2.0 −0.2 4.7 −0.1 1.6 0.5 0.0 1.0 0.0 0.5NHB 14.0 0.3 23.9 0.8 10.4 13.5 0.2 24.6 0.9 11.1 9.1 0.2 14.9 0.3 5.0BJTJ 5.3 0.2 7.5 0.3 1.1 1.9 0.0 2.7 0.0 0.4 16.0 0.2 29.4 1.4 3.6SD 2.9 0.2 5.8 0.1 4.6 2.6 −0.2 6.9 −0.1 4.6 0.7 0.0 1.5 0.0 1.1HN 0.5 −0.2 1.3 −0.1 1.6 0.2 −0.3 2.8 −0.2 2.8 0.1 −0.1 0.3 0.0 0.4SX 0.7 0.0 1.0 0.0 0.3 1.0 −0.1 1.5 0.0 0.4 0.4 0.0 0.7 0.0 0.2Sum 24 0.4 41 1 18.8 21.2 −0.6 43.2 0.5 20.9 26.8 0.3 47.8 1.7 10.8
Baoding TangshanSHB 0.9 −0.1 1.8 −0.1 0.8 0.2 0.0 0.4 0.0 0.2NHB 35.4 0.3 31.9 3.4 9.2 40.0 2.0 28.6 1.7 9.2BJTJ 2.2 0.0 3.3 0.0 0.4 1.5 0.0 3.0 0.0 0.8SD 0.5 −0.1 1.3 0.0 0.9 0.5 0.1 1.0 0.0 1.0HN 0.2 −0.1 0.4 0.0 0.5 0.1 0.0 0.2 0.0 0.3SX 0.5 0.0 0.7 0.0 0.2 0.2 0.0 0.3 0.0 0.1Sum 39.7 0.0 39.4 3.3 12 42.5 2.1 33.5 1.7 11.6
process is the major cause for formation of haze event.Therefore, control strategies should be focused on regionaljoint policy making in here. Additionally, more attentionshould be paid to agricultural emissions in Cangzhou andHengshui, which contributed 20.8% and 24.3% to Cangzhouand 23.7% and 26.7% of PM
2.5to Hengshui in January and
February, respectively.In Baoding and Tangshan, the most essential contrib-
utors of NHB contributed 82.1% and 78.2% of PM2.5
toBaoding and 81.6% and 79.0% to Tangshan in January andFebruary. Domestic and industrial emissions were the largestcontributors in Baoding (42.0% and 38.1% in January) andTangshan (36.4% and 39.8% in January). Industrial anddomestic emissions of NHB were the major contributors,with contributions of 35.4% and 31.9% of PM
2.5to Baoding
and 40.0% and 28.6% of PM2.5
to Tangshan. All in all,industrial and domestic emissions should be considered in
Tangshan and Baoding, especially for industrial emissionscontrols of emissions of NHB.
Conflict of Interests
The authors declare that there is no conflict of interestsregarding the publication of this paper.
Acknowledgments
This study was sponsored by the National Natural ScienceFoundation of China (no. 41475131 and no. 41105105), theState Environmental Protection Key Laboratory of Sourcesand Control of Air Pollution Complex (no. SCAPC201307),the Program for the Outstanding Young Scholars of HebeiProvince, the Excellent Young Scientist Foundation of Hebei
The Scientific World Journal 11
Education Department (no. YQ2013031), and the Environ-mental Protection Bureau of Handan, Hebei, China.
References
[1] H.Wang, J. Y. Xu,M. Zhang et al., “A study of themeteorologicalcauses of a prolonged and severe haze episode in January 2013over central-eastern China,” Atmospheric Environment, vol. 98,pp. 146–157, 2014.
[2] M. H. Tao, L. F. Chen, X. Z. Xiong et al., “Formation process ofthe widespread extreme haze pollution over northern China inJanuary 2013: implications for regional air quality and climate,”Atmospheric Environment, vol. 98, pp. 417–425, 2014.
[3] Y. Zhang, Z. Q. Li, J. Cuesta et al., “Aerosol column sizedistribution and water uptake observed during a major hazeoutbreak over Beijing on January 2013,” Aerosol and Air QualityResearch, vol. 15, no. 3, pp. 945–957, 2015.
[4] Y. R. Yang, X. G. Liu, Y. Qu et al., “Formation mechanismof continuous extreme haze episodes in the megacity Beijing,China, in January 2013,”Atmospheric Research, vol. 155, pp. 192–203, 2015.
[5] X. Han and M. G. Zhang, “Model analysis of Haze formationover the North China Plain in January 2013,” Climatic and Envi-ronmental Research, vol. 19, no. 2, pp. 127–139, 2014 (Chinese).
[6] Y. S.Wang, Y. Li, L. L.Wang et al., “Mechanism for the formationof the January 2013 heavy haze pollution episode over centraland eastern China,” Science China Earth Sciences, vol. 57, no. 1,pp. 14–25, 2014.
[7] X. F.Wang, J. M. Chen, J. F. Sun et al., “Severe haze episodes andseriously polluted fog water in Ji’nan, China,” Science of the TotalEnvironment, vol. 493, pp. 133–137, 2014.
[8] D. S. Ji, L. Li, Y. S. Wang et al., “The heaviest particulate air-pollution episodes occurred in northern China in January, 2013:insights gained from observation,” Atmospheric Environment,vol. 92, pp. 546–556, 2014.
[9] Q. Zhang,D.G. Streets, G. R. Carmichael et al., “Asian emissionsin 2006 for the NASA INTEX-B mission,” Atmospheric Chem-istry and Physics, vol. 9, no. 14, pp. 5131–5153, 2009.
[10] L. T. Wang, J. Yang, P. Zhang et al., “A review of air pollutionand control in Hebei Province, China,” Scientific Research, vol.2, no. 3, pp. 47–55, 2013.
[11] Natural Bureau of Statistics (NBS), China Energy StatisticalYearbook 2012, China Statistical Press, Beijing, China, 2012.
[12] NBS (Natural Bureau of Statistics), China Statistical Yearbook2012, China Statistical Press, Beijing, China, 2012.
[13] Ministry of Environmental Protection (MEP), China NationalAmbient Air Quality Standards, GB3095-2012, Ministry ofEnvironmental Protection, 2012.
[14] S. L. Tian, Y. P. Pan, Z. R. Liu, T. X. Wen, and Y. S. Wang, “Size-resolved aerosol chemical analysis of extreme haze pollutionevents during early 2013 in urban Beijing, China,” Journal ofHazardous Materials, vol. 279, pp. 452–460, 2014.
[15] L. T. Wang, Z. Wei, J. Yang et al., “The 2013 severe haze oversouthern Hebei, China: model evaluation, source apportion-ment, and policy implications,” Atmospheric Chemistry andPhysics, vol. 14, no. 6, pp. 3151–3173, 2014.
[16] L. T. Wang, J. Xu, J. Yang et al., “Understanding haze pollutionover the southernHebei area of China using the CMAQmodel,”Atmospheric Environment, vol. 56, pp. 69–79, 2012.
[17] J. Yang, P. Zhang, C.Meng et al., “Quantifying the sources of thesevere haze over the southern hebei using the CMAQ model,”
The Scientific World Journal, vol. 2013, Article ID 812469, 9pages, 2013.
[18] A. M. Dunker, R. E. Morris, A. K. Pollack, C. H. Schleyer,and G. Yarwood, “Photochemical modeling of the impact offuels and vehicles on urban ozone using auto/oil program data,”Environmental Science & Technology, vol. 30, no. 3, pp. 787–801,1996.
[19] W. Zhang, S. L. Capps, Y. Hu, A. Nenes, S. L. Napelenok, andA. G. Russell, “Development of the high-order decoupled directmethod in three dimensions for particulate matter: enablingadvanced sensitivity analysis in air qualitymodels,”GeoscientificModel Development, vol. 5, no. 2, pp. 355–368, 2012.
[20] M. J. Burr and Y. Zhang, “Source apportionment of fineparticulatematter over the EasternU.S. Part I: source sensitivitysimulations using CMAQwith the Brute Force method,” Atmo-spheric Pollution Research, vol. 2, no. 3, pp. 300–317, 2011.
[21] M. J. Burr and Y. Zhang, “Source apportionment of fine partic-ulatematter over the EasternU.S. Part II: source apportionmentsimulations using CAMx/PSAT and comparisons with CMAQsource sensitivity simulations,” Atmospheric Pollution Research,vol. 2, no. 3, pp. 318–336, 2011.
[22] K. B. He, “Multi-resolution emission inventory for China(MEIC):model framework and 1990–2010 anthropogenic emis-sions,” in Proceedings of the International Global AtmosphericChemistry Conference, Beijing, China, September 2012.
[23] Y. Zhang, P. Liu, B. Pun, and C. Seigneur, “A comprehensiveperformance evaluation of MM5-CMAQ for the Summer 1999Southern Oxidants Study episode. Part I. Evaluation protocols,databases, and meteorological predictions,” Atmospheric Envi-ronment, vol. 40, no. 26, pp. 4825–4838, 2006.
[24] B. Zheng, Q. Zhang, Y. Zhang et al., “Heterogeneous chemistry:a mechanism missing in current models to explain secondaryinorganic aerosol formation during the January 2013 hazeepisode in North China,” Atmospheric Chemistry and Physics,vol. 15, no. 4, pp. 2031–2049, 2015.
[25] F. Q. Su, Q. X. Gao, Z. G. Zhang, Z. H. Ren, and X. X. Yang,“Transport pathways of pollutants from outside in atmosphereboundary layer,” Research Environmental Sciences, vol. 17, no. 1,pp. 26–29, 40, 2004 (Chinese).
[26] Z. H. Chen, S. Y. Cheng, F. Q. Su, Q. X. Gao, T. Yu, and Z.H. Ren, “Analysis of large-scale weather pattern during heavyair pollution process in Beijing,” Research of EnvironmentalSciences, vol. 20, no. 2, pp. 99–107, 2007 (Chinese).

Submit your manuscripts athttp://www.hindawi.com
Hindawi Publishing Corporationhttp://www.hindawi.com Volume 2014
ClimatologyJournal of
EcologyInternational Journal of
Hindawi Publishing Corporationhttp://www.hindawi.com Volume 2014
EarthquakesJournal of
Hindawi Publishing Corporationhttp://www.hindawi.com Volume 2014
Hindawi Publishing Corporationhttp://www.hindawi.com
Applied &EnvironmentalSoil Science
Volume 2014
Mining
Hindawi Publishing Corporationhttp://www.hindawi.com Volume 2014
Journal of
Hindawi Publishing Corporation http://www.hindawi.com Volume 2014
International Journal of
Geophysics
OceanographyInternational Journal of
Hindawi Publishing Corporationhttp://www.hindawi.com Volume 2014
Journal of Computational Environmental SciencesHindawi Publishing Corporationhttp://www.hindawi.com Volume 2014
Journal ofPetroleum Engineering
Hindawi Publishing Corporationhttp://www.hindawi.com Volume 2014
GeochemistryHindawi Publishing Corporationhttp://www.hindawi.com Volume 2014
Journal of
Atmospheric SciencesInternational Journal of
Hindawi Publishing Corporationhttp://www.hindawi.com Volume 2014
OceanographyHindawi Publishing Corporationhttp://www.hindawi.com Volume 2014
Advances in
Hindawi Publishing Corporationhttp://www.hindawi.com Volume 2014
MineralogyInternational Journal of
Hindawi Publishing Corporationhttp://www.hindawi.com Volume 2014
MeteorologyAdvances in
The Scientific World JournalHindawi Publishing Corporation http://www.hindawi.com Volume 2014
Paleontology JournalHindawi Publishing Corporationhttp://www.hindawi.com Volume 2014
ScientificaHindawi Publishing Corporationhttp://www.hindawi.com Volume 2014
Hindawi Publishing Corporationhttp://www.hindawi.com Volume 2014
Geological ResearchJournal of
Hindawi Publishing Corporationhttp://www.hindawi.com Volume 2014
Geology Advances in