Embed Size (px)
Citation preview
941
Sigma J Eng & Nat Sci 37 (3), 2019, 941-952
Research Article
THE EFFECT OF DEPTH OF FUSION ON THE BEHAVIOR OF STEEL
WELDED JOINTS
Umut Yaşar UZUNALI1, Hamdullah CUVALCI
2, Barbaros ATMACA*
3
1Karadeniz Technical University, Department of Metallurgical and Material Engineering, TRABZON;
ORCID: 0000-0003-3081-370X 2Karadeniz Technical University, Department of Metallurgical and Material Engineering, TRABZON;
ORCID: 0000-0002-8257-8310 3Karadeniz Technical University, Dept. of Civil Engineering, TRABZON; ORCID: 0000-0003-3336-2756
Received: 28.05.2019 Revised: 08.07.2019 Accepted: 05.08.2019
ABSTRACT
The aim of this study is to determine the effect of depth of fusion on the behavior of tempered martensite and
thermomechanically rolled steel welded joints. To obtain the effect of depth of fusion on the stress and
displacements, three different welded sample welded to each other by metal active gas welding method applied in PB position were prepared in accordance with the related standard. According to the welding
procedure specification EN ISO 15614-1 which clarifies how samples should be welded, different current,
voltage, travel speed and wire feed speed were selected for each sample. After the welding process, welded samples were subjected to visual and magnetic testing to evaluate quality of the weld seams. After the non-
destructive tests, samples were cut into small pieces to measure the depth of fusion and three samples having
different depth of fusion were obtained. The finite element models of these samples were created in ANSYS to evaluate the stresses and displacements of samples. The models of samples were subjected to the loads
which range from 1000N to 45000N and the results were obtained under lineer- static analysis. The results of
finite element analyses of samples such as stresses and displacements are compared with each other in terms of depth of fusion for each sample. It is seen that depth of fusion has remarkable effect on the behavior of
welded joints.
Keywords: Depth of fusion, finite element analysis, high-strength steel, welded connection, weld design.
1. INTRODUCTION
Over the last decade, the use of both thermomechanically rolled steel (known as hot-rolled
steel) and tempered martensite steel which are widely used in automotive and defense industry
has increased due to their excellent mechanical properties (Spindler, 2005). Thermomechanically
rolled steel and tempered martensite steel are classified to their mechanical properties and
hardness values, however the lowest category of these steels mostly have high strength values in
comparison to non-alloy structural steel. Metal active gas (MAG) is one of the welding methods
that enables it to be preferred in especially mass production owing to robotic welding
applications, high welding speed, deposition rate and non-slag welding etc (Yamamoto, 2017).
* Corresponding Author: e-mail: [email protected], tel: (462) 377 43 88
Sigma Journal of Engineering and Natural Sciences
Sigma Mühendislik ve Fen Bilimleri Dergisi

942
There are lots of factors which affect life span and endurance of welded construction such as
weldability, depth of fusion, weld design etc. All these factors must be considered during the
design stage. Within the scope of the standards, welding procedure specifications (WPS) which
describe how welding is to be performed are determined according to joint type, weld position,
material thickness, chemical and mechanical properties of materials. In addition to this, depth of
fusion, bead width and weld design must be taken into consideration to ensure the durability
conditions of the welded construction. For this reason, depth of fusion must be determined that
provide the forecast of the service life and endurance of the welded construction.
There are many studies on analysis of weld strength, residual stress distributions of welded
joints, finite element analysis of welding process and distortion. Zhou et al. (2003) revealed that
the relationships between quality and attributes of spot welds. Weld diameter, penetration and
indentations were analyzed through the integrated numerical analysis. It was observed that the
size of the heat affected zone plays an important role on weld strength due to occurring high stress
concentration in the heat affected zone. Mert (2009) examined that the effect of weld toe radius
and root gap on fatigue life of T-fillet welded joint by finite element analysis. In this study, it was
obtained that medium sized root gap and biggest toe radius is the best design in terms of
equivalent stresses. Pettersson and Barsoum (2012) presented the finite element analysis and
fatigue design of a welded construction machinery component using different concepts. They
concluded that linear elastic fracture mechanism and effective notch stress are the most accurate
methods for estimating the service life of welded constructions. Deshmukh et al. (2014) presented
the effect of weld penetration levels on fatigue life. In this study, finite element models of welded
joints having different levels of penetration were subjected to the bending and tensile loads. They
concluded that fatigue life of the connections fluctuates with the changing penetration levels.
Dung et al. (2015) investigated the effect of weld penetration on fatigue strength of rib-to-deck
welded joints in orthotropic steel decks. Welded specimens prepared as partial and full joint
penetration were subjected to the fatigue loads and finite element models of the specimens were
analyzed. As a result of this study, it was obtained that welded specimen comprising of complete
joint penetration has shown a positive effect on enhancing the fatigue resistance of rib-to-deck
welded joints. Wang et al. (2015) investigated the fatigue life of welded construction by means of
hot spot stress approach. Test results were compared according to full scale specimen results and
all factors affecting the stress distribution were observed. Joo et al. (2015) studied the moment
redistribution of continuous composite I-girder with high strength steel. Non-linear finite element
analysis for the continuous composite I-girder were analysed in this study. Kainuma et al. (2016)
observed that the fatigue behavior of rib-to-deck weld root in orthotropic steel decks. Welded
specimens were evaluated with regards to local stress near the welded joint, field loading tests,
measurement of residual stress and fatigue tests. This study has clearly highlighted that
penetration rate in the range of 0% to 75% can be beneficial for fatigue durability of this
structural detail. Farafkhah and Liu (2016) investigated the effect of metal inert gas welding on
the behavior and strength of aluminum stiffened plates. 3D simulated MIG welding induced heat
affected zone (HAZ), residual stress and distortion fields was researched in this study. Giri et al.
(2017) studied on the effect of weld groove designs on residual stresses in SS 304LN thick
multipass pipe welds. In this study, finite element model of pipe welds was developed for
estimating temperature distributions during the welding. Cheng et al. (2017) studied on fatigue
failure of rib-to-deck welded connections in orthotropic steel bridge decks. In this study, it was
focused on the fatigue cracking process and two loading cases (centric and eccentric) were
considered. High cycle repeated loading was implemented and crack initiation and propagation of
the specimens were observed. Yang et al. (2017) conducted the fatigue test of high strength bolts
in grid structures. High strength bolts were subjected to constant amplitude fatigue tests and
analyzed in accordance with the stress concentration. It was explained that geometrical stress
concentration causes the fatigue fracture of high strength bolts. Zhongqiu et al. (2018) observed
that the fatigue performance of rib-roof weld in steel bridge decks with corner braces. To assess
U.Y. Uzunali, H. Cuvalcı, B. Atmaca / Sigma J Eng & Nat Sci 37 (3), 941-952, 2019

943
the fatigue life of the construction, FEM models were created and stress distributions taking into
consideration different parameters of corner brace sizes, arrangements and detail types were
analyzed. In this study, it was obtained that stress of roof weld is decreased. Lan et al. (2018)
studied the application of high strength steel in bridge piers under the cycle loads. In this study,
the effects of various parameters including plate width-to-thickness ratio, column slenderness
ratio and axial compression force ratio were investigated. As a result of work, new formulas for
predicting ultimate load and deformation capacities were obtained.
As seen from the references mentioned above, studies on the effect of depth of fusion on
strength and displacement of welded joints are insufficient. This paper aims to fill some of these
gaps on the effect of weld penetration on behavior of the welded connection. For this purpose
three different welded samples were prepared in terms of depth of fusion. Plates of sample
(thermomechanically rolled steel and tempered martensite steel) were welded to each other by
metal active gas welding method applied in PB position. Depth of fusion of each sample was
measured on cross sections taken from the fillet welds. After the measurement, samples are
numerically modeled based on the finite element method (FEM) using ANSYS. The effects of
depth of fusion on joint strength and displacement of tempered martensite and
thermomechanically rolled steel welded joints are identified using linear FE analysis.
2. PREPARATION OF SAMPLES
The samples consist of two steel plates (Hardox450 and Optim700MC) and these plates were
welded to each other with T-fillet weld. Hardox450 and Optim700MC are known as tempered
martensite and thermomechanically rolled steel respectively. Thickness of both Hardox450 and
Optim700MC plates was chosen as thick as possible (8 mm) considering the depth of fusion.
Schematic forms of sample are given Fig.1. Due to its carbon and alloy elements content
Hardox450 has more strength than Optim700MC. Plates of sample prepared according to EN ISO
15614-1(2017) which clarifies all stages of the preparing and welding process were welded to
each other by MAG method applied in PB position. Filler metal was selected according to the
technical procedures recommended by steel manufacturers. In accordance with EN ISO
14175(2008), shielding gas was chosen as mixed shielding gas containing Ar, O2 and CO2.
Welding parameters including current, voltage, travel speed and wire feed speed affect the
amount of heat input, weld shape, process outcome, hardness distribution and the strength of the
weld (Lu, 2005). In this study, three different welding parameters were determined to obtain the
depth of fusion of samples such as 0, 1 and 2 mm. Welding parameters for each sample are given
Table 1.
After the welding process, welded samples were subjected to non-destructive testing which
are visual testing and magnetic testing according to EN ISO 17637(2016) and EN ISO 9934-
1(2016) respectively. Within the scope of ISO 5817(2014), any defects were not observed on the
weld seam and heat affected zone for each welded sample. View of the welded samples is given
Fig 2. For grinding and polishing process, small welded pieces must be prepared and mounted
onto bakelite. For this reason welded samples were cut into small pieces to carry out the mounting
process. Welded pieces of sample C is given Fig 3. In order to observe the welded cross-section
surface by visual inspection, welded cross-sections were mechanically grinded, polished and
etched by nital (%3) etching reagent according to EN ISO 17639(2003) to make the weld zone
visible.
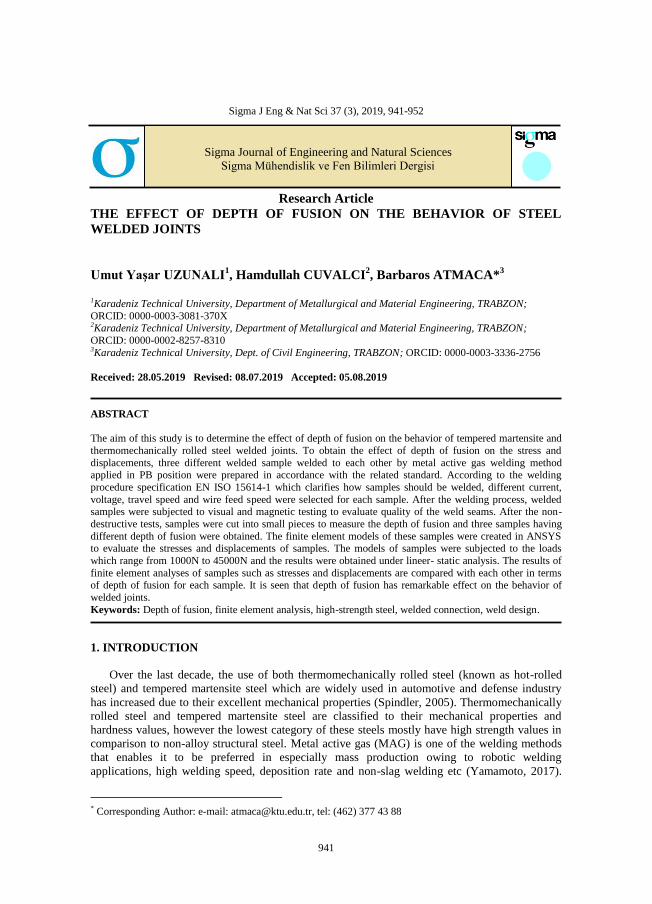
After the etching, weld zone became visible and depth of fusion of each sample was
measured. Based on these cross-sections, points represented the fusion line were marked to
evaluate the depth of fusion of each sample. Primarily, location of the starting point (0,0) was
marked and other points were marked in order to measure the depth of fusion. According to
coordinate of marked points, the depth of fusion was obtained as 0 mm, 1 mm and 2 mm for
sample A, B and C respectively. Welded cross-section of sample C is shown in Fig 4.
The Effect of Depth of Fusion on the Behavior of … / Sigma J Eng & Nat Sci 37 (3), 941-952, 2019

944
Table 1. Welding parameters for each sample
Sample Run Welding
Process
Size of
filler
metal
(mm)
Current
(A)
Voltage
(V)
Type of
current
and
polarity
Wire
feed
speed
(m/min)
Travel
Speed
(mm/sec)
Heat Input
(kj/mm)
(k=0,8)
Preheat
Temperatures
Sample A 1 135 1 140-160 18-20 DC (+) 9 4.15 0.48-0.61 x
Sample B 1 135 1 180-200 22-24 DC (+) 12 4.48 0.71-0.85 x
Sample C 1 135 1 220-240 24-26 DC (+) 14.5 5.16 0.82-0.97 x
Figure 1. Schematic form of sample
(A) (B) (C)
Figure 2. View of the welded samples
Figure 3. Welded pieces of sample C
Hardox450
Op
tim
700M
C
150
mm
8mm
8mm
150mm
U.Y. Uzunali, H. Cuvalcı, B. Atmaca / Sigma J Eng & Nat Sci 37 (3), 941-952, 2019
945
Figure 4. Welded cross-section of sample C (mm).
3. FINITE ELEMENT MODELING
Two dimensional finite element model (FEM) of samples were created by using software
ANSYS (2015) and linear-static analyses of the samples are performed to obtain the stresses and
deflections distribution of the along samples. For this study, Plane 182 defined by four nodes
having two degrees of freedom at each node was determined to create the two dimensional FEM
of samples. Before the welding, even if steel plates are placed as close as possible, the gap
between the plates can be up to 1mm according to surface flatness. In this study, the gap between
two plates (Optim700MC-Hardox450) was taken into consideration as 0,1mm. Welded
connection and FEM of sample C are given in Fig 5 and Fig 6, respectively. According to depth
of fusion three different FEM were created in ANSYS (2015). The mesh size of these FEM was
selected as 1x1mm at x and y direction, since the dimensions of weld zone and depth of fusion are
relatively smaller than the plates. FEM of weld zone of each sample are given in Fig 7. After the
meshing process, FEM of each sample was fixed all degree of freedom at the bottom of
Hardox450 plate. Static load which range from 1000 to 45000 N were applied to the top of
Optim700MC plate along to x direction.
4. NUMERICAL RESULTS
In this section, principal tensile and compressive stress distribution and displacement on the
plates and weld zone of all samples under all static loads were represented with detail and
compared to each other.
4.1. Principal Stresses
The principal tensile and compressive stress contour diagrams of samples under 20000N
along to x direction (+x and –x) is shown Fig 8 and Fig 9, respectively. Region 1 and 2 called
The Effect of Depth of Fusion on the Behavior of … / Sigma J Eng & Nat Sci 37 (3), 941-952, 2019

946
weld toe are the junction between the face of weld and plates. Region 3 is the weld root. Region
1, 2 and 3 are shown in all contour diagrams.
In the +x direction; the maximum tensile stresses were obtained at Region 1 from sample A
and B as 481 MPa and 455 MPa, however, at Region 2 from sample C as 412 MPa. The
maximum tensile stresses have a decreasing trend from sample A to C. It is seen that tensile stress
of sample A is higher than yield strength of weld metal in Region 1. Compressive stresses were
obtained at Region 3 as -165 MPa, -211 MPa and -194 MPa from sample A, B and C,
respectively. It is seen that compressive stresses obtained from all sample do not exceed the yield
strength of weld metal.
Figure 5. Welded connection of sample C
Figure 6. FEM of sample C
Gap
Weld Metal
Optim700MC
Hardox450
8mm
8mm
Gap
Hardox450
Optim700MC
U.Y. Uzunali, H. Cuvalcı, B. Atmaca / Sigma J Eng & Nat Sci 37 (3), 941-952, 2019

947
(A) (B) (C)
Figure 7. FEM of samples
(A) (B)
(C)
Figure 8. Tensile stress distributions of samples (in the +x direction)
Depth of fusion is 0mm Depth of fusion is 1mm Depth of fusion is 2mm
The Effect of Depth of Fusion on the Behavior of … / Sigma J Eng & Nat Sci 37 (3), 941-952, 2019

948
(A) (B)
Figure 9. Compressive stress distributions of samples (in the -x direction)
Figure 10. Principal tensile stress of samples
0 10000 20000 30000 40000 50000
0
100
200
300
400
500
600
700
800
900
1000
1100
1200
1300
1400
1500
Pri
nci
pal
Ten
sile
Str
ess
(MP
a)
Applied Force (N)
A (+Fx)
B (+Fx)
C (+Fx)
A (-Fx)
B (-Fx)
C (-Fx)
U.Y. Uzunali, H. Cuvalcı, B. Atmaca / Sigma J Eng & Nat Sci 37 (3), 941-952, 2019
949
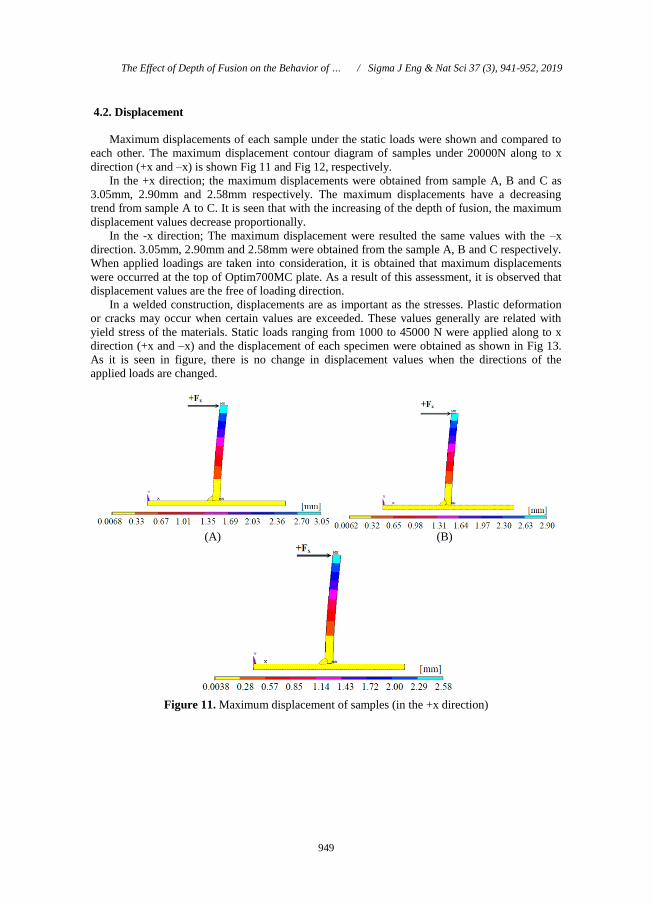
4.2. Displacement
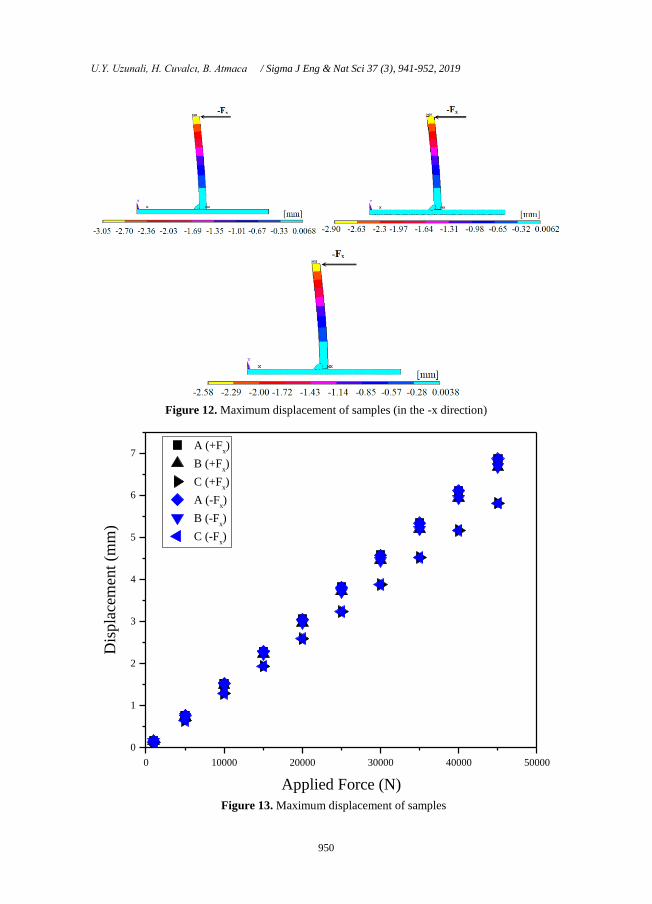
Maximum displacements of each sample under the static loads were shown and compared to
each other. The maximum displacement contour diagram of samples under 20000N along to x
direction (+x and –x) is shown Fig 11 and Fig 12, respectively.
In the +x direction; the maximum displacements were obtained from sample A, B and C as
3.05mm, 2.90mm and 2.58mm respectively. The maximum displacements have a decreasing
trend from sample A to C. It is seen that with the increasing of the depth of fusion, the maximum
displacement values decrease proportionally.
In the -x direction; The maximum displacement were resulted the same values with the –x
direction. 3.05mm, 2.90mm and 2.58mm were obtained from the sample A, B and C respectively.
When applied loadings are taken into consideration, it is obtained that maximum displacements
were occurred at the top of Optim700MC plate. As a result of this assessment, it is observed that
displacement values are the free of loading direction.
In a welded construction, displacements are as important as the stresses. Plastic deformation
or cracks may occur when certain values are exceeded. These values generally are related with
yield stress of the materials. Static loads ranging from 1000 to 45000 N were applied along to x
direction (+x and –x) and the displacement of each specimen were obtained as shown in Fig 13.
As it is seen in figure, there is no change in displacement values when the directions of the
applied loads are changed.
(A) (B)
Figure 11. Maximum displacement of samples (in the +x direction)
The Effect of Depth of Fusion on the Behavior of … / Sigma J Eng & Nat Sci 37 (3), 941-952, 2019
950
Figure 12. Maximum displacement of samples (in the -x direction)
Figure 13. Maximum displacement of samples
0 10000 20000 30000 40000 50000
0
1
2
3
4
5
6
7 A (+F
x)
B (+Fx)
C (+Fx)
A (-Fx)
B (-Fx)
C (-Fx)
Dis
pla
cem
ent
(mm
)
Applied Force (N)
U.Y. Uzunali, H. Cuvalcı, B. Atmaca / Sigma J Eng & Nat Sci 37 (3), 941-952, 2019
951
5. CONCLUSION
This study presents an investigation about the effects of the depth of fusion on principal stress
and displacement distribution of thermomechanically rolled and tempered martensite steel welded
joints. Plates were welded to each other with different welding parameters to obtain different
depth of fusion. After the welding process, cross sections of samples were etched to make the
weld zone visible. According to depth of fusion measurements, FEM of each sample were
designed and loaded by using ANSYS software. Analysis of samples is performed under the
variable static loads to obtain the stress and displacement distribution. The main conclusions
drawn from this analytical study are;
The principal tensile stresses have a decreasing trend in weld zone when the depth of
fusion increases. In addition to that displacements on base metal have a decreasing trend too.
In +x direction, maximum tensile stresses were obtained on weld toe region, however, in
–x direction, maximum tensile stresses were obtained on weld root region.
When the load is applied in –x direction, the obtained tensile stress is higher than when
loads applied in +x direction. However, when the direction of the applied force is changed, the
displacement values remain the same.
Sample is more durable when the load is applied from +x direction.
The displacement values proportionally increase when the applied forces are increased.
When the load is applied in –x and +x direction, the obtained displacement are equal to
each other. Selected welded sample behave like cantilever beam.
To determine the depth of fusion with sufficient accuracy by finite element analysis provides
prediction of the service life and durability of welded construction. As a result of this study, it is
seen that tensile principal stress at weld zone and displacement at base metal decrease with the
increasing of depth of fusion.
REFERENCES
[1] ANSYS, (2015). Swanson Analysis System, USA.
[2] Cheng, B., Ye, X., Cao, X., Mbako, D. D. and Cao, Y. (2017). “Experimental study on
fatigue failure of rib-to-deck welded connections in orthotropic steel bridge decks”,
International Journal of Fatigue, Vol. 103, pp. 157-167, DOI:
10.1016/j.ijfatigue.2017.05.021.
[3] Deshmukh, A. R., Venkatachalam, G., Divekar, H. and Saraf, M. R. (2014). “Effect of
weld penetration on fatigue life”. Procedia Engineering, Vol. 97, pp. 783-789, DOI:
10.1016/j.proeng.2014.12.277.
[4] Dung, C. V., Sasaki, E., Tajima, K. and Suzuki, T. (2015). “Investigations on the effect of
weld penetration on fatigue strength of rib-to-deck welded joints in orthotropic steel
decks”, International Journal of Steel Structures, Vol. 15, No. 2, pp. 299-310, DOI:
10.1007/s13296-014-1103-4.
[5] Farajkhah, V., and Liu, Y. (2016). “Effect of metal inert gas welding on the behaviour and
strength of aluminum stiffened plates”, Marine Structures, Vol. 50, pp. 95-110, DOI:
10.1016/j.marstruc.2016.07.005.
[6] Giri, A., Mahapatra, M. M., Sharma, K., and Singh, P. K. (2017). “A study on the effect
of weld groove designs on residual stresses in SS 304LN thick multipass pipe welds”,
International Journal of Steel Structures, Vol. 17, No. 1, pp. 65-75, DOI:
10.1007/s13296-016-0118-4.
[7] ISO 14175 (2008), Welding consumables. Gases and gas mixtures for fusion welding and
allied processes, International Organization for Standardization, Geneva, Switzerland.
The Effect of Depth of Fusion on the Behavior of … / Sigma J Eng & Nat Sci 37 (3), 941-952, 2019

952
[8] ISO 15614-1 (2017), Specification and qualification of welding procedures for metallic
materials. Welding procedure test. Arc and gas welding of steels and arc welding of nickel
and nickel alloys, International Organization for Standardization, Geneva, Switzerland.
[9] ISO 17637 (2016), Non-destructive testing of welds - Visual testing of fusion-welded
joints, International Organization for Standardization, Geneva, Switzerland.
[10] ISO 17639 (2003), Destructive tests on welds in metallic materials - Macroscopic and
microscopic examination of welds, International Organization for Standardization,
Geneva, Switzerland.
[11] ISO 5817 (2014), Welding - Fusion-welded joints in steel, nickel, titanium and their
alloys (beam welding excluded) - Quality levels for imperfections, International
Organization for Standardization, Geneva, Switzerland.
[12] ISO 9934-1 (2016), Non-destructive testing - Magnetic particle testing - Part 1: General
principles, International Organization for Standardization, Geneva, Switzerland.
[13] Joo, H. S., Moon, J., Sung, I. H. and Lee, H. E. (2015). “Moment redistribution of
continuous composite I-girder with high strength steel”, Steel and Composite Structures,
Vol. 18, No. 4, pp. 873-887 DOI:10.12989/scs.2015.18.4.873.
[14] Kainuma, S., Yang, M., Jeong, Y. S., Inokuchi, S., Kawabata, A. and Uchida, D. (2016).
“Experiment on fatigue behavior of rib-to-deck weld root in orthotropic steel decks”,
Journal of Constructional Steel Research, Vol. 119, pp. 113-122, DOI:
10.1016/j.jcsr.2015.11.014.
[15] Lan Kang, Motoya Suzuki and Hanbin Ge, (2018). “A study on application of high
strength steel SM570 in bridge piers with stiffened box section under cyclic loading”,
Steel and Composite Structures, Vol. 26, No. 5, pp. 583-594, DOI:
10.12989/scs.2018.26.5.583.
[16] Lu, S., Fujii, H. and Nogi, K. (2005). “Influence of welding parameters and shielding gas
composition on GTA weld shape”, ISIJ international, Vol. 45, No. 1, pp. 66-70, DOI:
10.2355/isijinternational.45.66.
[17] Mert, T. (2009). “Finite element analysis of effect of weld toe radius and root gap on
fatigue life of T-fillet welded joint”, Conference of the International Journal of Arts and
Sciences, Vol. 1, pp. 119-127.
[18] Pettersson, G., and Barsoum, Z. (2012). “Finite element analysis and fatigue design of a
welded construction machinery component using different concepts”, Engineering
Failure Analysis, Vol. 26, pp. 274-284, DOI: 10.1016/j.engfailanal.2012.04.014.
[19] Spindler, H., Klein, M., Rauch, R., Pichler, A. and Stiaszny, P. (2005). “High strength and
ultra high strength hot rolled steel grades-Products for advanced applications”,
Proceedings of Super-High Strength Steels, Rome, Italy, Associazione Italian di
Metallurgica.
[20] Wang, B., Lu, P. and Shao, Y. (2015). “Research on rib-to-diaphragm welded connection
by means of hot spot stress approach”, Steel and Composite Structures, Vol. 18, No. 1, pp.
135-148, DOI: 10.12989/scs.2015.18.1.135.
[21] Yamamoto, T., Ohji, T., Miyasaka, F. and Tsuji, Y. (2017). “Mathematical modelling of
metal active gas arc welding”, Science and Technology of Welding and Joining, Vol. 7,
No. 4, pp. 260-264, DOI: 10.1179/174329313X13789830157429.
[22] Yang, X., & Lei, H. (2017). “Constant amplitude fatigue test of high strength bolts in grid
structures with bolt-sphere joints”, Steel and Composite Structures, Vol. 25, No.5, pp.
571-579, DOI: 10.12989/scs.2017.25.5.571.
[23] Zhongqiu Fu, Bohai Ji, Yixun Wang and Jie Xu, (2018). “Fatigue performance of rib-roof
weld in steel bridge decks with corner braces”, Steel and Composite Structures, Vol. 26,
No. 1, pp. 103,113, DOI:
[24] Zhou, M., Zhang, H., and Hu, S. J. (2003). “Relationships between quality and attributes
of spot welds”. Welding Journal, Vol. 82, No. 4, pp. 72-77, DOI:
U.Y. Uzunali, H. Cuvalcı, B. Atmaca / Sigma J Eng & Nat Sci 37 (3), 941-952, 2019