Embed Size (px)
Citation preview
Hindawi Publishing CorporationEvidence-Based Complementary and Alternative MedicineVolume 2013, Article ID 264742, 11 pageshttp://dx.doi.org/10.1155/2013/264742
Research ArticleTongue Color Analysis for Medical Application
Bob Zhang,1,2 Xingzheng Wang,2 Jane You,2 and David Zhang2
1 Department of Electrical & Computer Engineering, Carnegie Mellon University, Pittsburgh, PA 15213, USA2 Biometrics Research Center, Department of Computing, The Hong Kong Polytechnic University, Hong Kong
Correspondence should be addressed to Bob Zhang; [email protected]
Received 6 December 2012; Accepted 3 March 2013
Academic Editor: Jong Yeol Kim
Copyright © 2013 Bob Zhang et al. This is an open access article distributed under the Creative Commons Attribution License,which permits unrestricted use, distribution, and reproduction in any medium, provided the original work is properly cited.
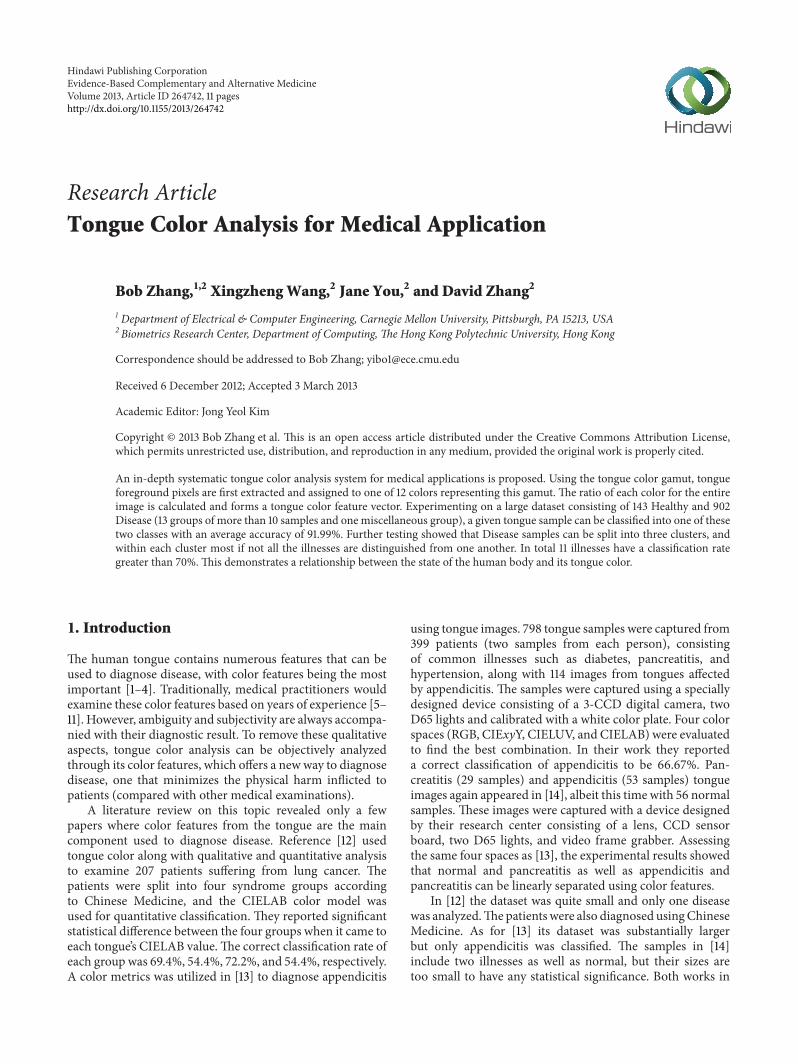
An in-depth systematic tongue color analysis system for medical applications is proposed. Using the tongue color gamut, tongueforeground pixels are first extracted and assigned to one of 12 colors representing this gamut. The ratio of each color for the entireimage is calculated and forms a tongue color feature vector. Experimenting on a large dataset consisting of 143 Healthy and 902Disease (13 groups of more than 10 samples and one miscellaneous group), a given tongue sample can be classified into one of thesetwo classes with an average accuracy of 91.99%. Further testing showed that Disease samples can be split into three clusters, andwithin each cluster most if not all the illnesses are distinguished from one another. In total 11 illnesses have a classification rategreater than 70%. This demonstrates a relationship between the state of the human body and its tongue color.
1. Introduction
The human tongue contains numerous features that can beused to diagnose disease, with color features being the mostimportant [1–4]. Traditionally, medical practitioners wouldexamine these color features based on years of experience [5–11]. However, ambiguity and subjectivity are always accompa-nied with their diagnostic result. To remove these qualitativeaspects, tongue color analysis can be objectively analyzedthrough its color features, which offers a newway to diagnosedisease, one that minimizes the physical harm inflicted topatients (compared with other medical examinations).
A literature review on this topic revealed only a fewpapers where color features from the tongue are the maincomponent used to diagnose disease. Reference [12] usedtongue color along with qualitative and quantitative analysisto examine 207 patients suffering from lung cancer. Thepatients were split into four syndrome groups accordingto Chinese Medicine, and the CIELAB color model wasused for quantitative classification. They reported significantstatistical difference between the four groups when it came toeach tongue’s CIELAB value.The correct classification rate ofeach group was 69.4%, 54.4%, 72.2%, and 54.4%, respectively.A color metrics was utilized in [13] to diagnose appendicitis
using tongue images. 798 tongue samples were captured from399 patients (two samples from each person), consistingof common illnesses such as diabetes, pancreatitis, andhypertension, along with 114 images from tongues affectedby appendicitis. The samples were captured using a speciallydesigned device consisting of a 3-CCD digital camera, twoD65 lights and calibrated with a white color plate. Four colorspaces (RGB, CIExyY, CIELUV, and CIELAB) were evaluatedto find the best combination. In their work they reporteda correct classification of appendicitis to be 66.67%. Pan-creatitis (29 samples) and appendicitis (53 samples) tongueimages again appeared in [14], albeit this time with 56 normalsamples. These images were captured with a device designedby their research center consisting of a lens, CCD sensorboard, two D65 lights, and video frame grabber. Assessingthe same four spaces as [13], the experimental results showedthat normal and pancreatitis as well as appendicitis andpancreatitis can be linearly separated using color features.
In [12] the dataset was quite small and only one diseasewas analyzed.Thepatients were also diagnosed usingChineseMedicine. As for [13] its dataset was substantially largerbut only appendicitis was classified. The samples in [14]include two illnesses as well as normal, but their sizes aretoo small to have any statistical significance. Both works in

2 Evidence-Based Complementary and Alternative Medicine
Figure 1: Tongue capture device.
Table 1: Disease class statistics listing the ID, name, and number ofsamples.
DiseaseID Disease name No. of
samples1 Chronic Kidney Disease 1412 Diabetes 693 Nephritis 104 Hypertension 665 Verrucous Gastritis 256 Pneumonia 107 Nephritic Syndrome 108 Chronic Cerebral Circulation Insufficiency 149 Upper Respiratory Tract Infection 1210 Erosive Gastritis 1011 Coronary Heart Disease 1312 Chronic Bronchitis 1113 Mixed Hemorrhoid 1114 Miscellaneous 500
[12, 14] did not use any image correction to ensure uniformfeature extraction and analysis under different operatingconditions. Also, [12–14] used some variation of the CIE colorspace to embody the tongue colors, which may not be veryaccurate. Therefore, there is a lack of any work on an in-depth systematic tongue color analysis system for medicalapplications, one that accurately captures the images andrepresents its colors using a tongue color gamut [15]. Inthis paper such an application is described to address theseproblems. Tongue images are first captured using a specifi-cally designed device with image correction. Afterwards, theimages are segmented [16] with the background removedand tongue foreground remaining. Color features from eachpixel are then extracted and assigned to 1 of 12 colorssymbolizing the tongue color gamut [15]. This produces thetongue color feature vector. Experimental results were carriedout on a large scale dataset consisting of 143 Healthy and902 Disease samples (diagnosed using Western Medicine)taken from Guangdong Provincial Hospital of TraditionalChinese Medicine, Guangdong, China.The Disease class wascomposed of 13 specific illnesses (with at least 10 samples ineach group) and one sizeable miscellaneous group (made upof various illnesses). Classification was performed betweenthe illnesses in addition to Healthy versus Disease.
0.8
0.7
0.6
0.5
0.4
0.3
0.2
0.1
CIEy
-axi
s
0.80.70.60.50.40.30.20.10−0.1CIEx-axis
The whole and 98% tongue color gamut in CIExyY color space
Figure 2: A color gamut in the CIExyY color space depicting thetongue color gamut inside the red boundary. Furthermore, 98% ofthe tongue color gamut can be located within the black boundary.
0.80.70.60.50.40.30.20.10−0.1
0.8
0.7
0.6
0.5
0.4
0.3
0.2
0.1
The 100% and 98% tongue color gamut in CIExyY color space
CIEx-axis
CIEy
-axi
s
Figure 3: The tongue color gamut can be represented using severalpoints by drawing lines from the RGB color space.
The rest of this paper is organized as follows. An intro-duction to the tongue image acquisition device and datasetused is given in Section 2. Section 3 summarizes the tonguecolor gamut and explains how color features are extractedusing it. In Section 4 classification between the two classesof Healthy and Disease is performed. Following this, illnessesin the Disease class are classified. Finally, concluding remarksare made in Section 5.
2. Materials
The tongue database is composed of 1045 images (one imageper person) split into 143Healthy and 902Disease captured at

Evidence-Based Complementary and Alternative Medicine 3
C (Cyan) R (Red) B (Blue) P (Purple) DR (Deep red) LR (Light red)
LP (Light purple) LB (Light blue) BK (Black) GY (Gray) W (White) Y (Yellow)
Figure 4: 12 colors representing the tongue color gamut with its label on top.
v = (0.001 17.067 0 0 6.004 54.722 0.029 0.205 5.551 4.766 3.711 7.899)
C-0.001% R-17.067% B-0% P-0%
DR-6.004% LR-54.722% LP-0.029% LB-0.205%
BK-5.551% GY-4.766% W-3.711% Y-7.899%
Figure 5: Healthy tongue sample, its tongue color feature vector and corresponding 12-color makeup with most of the pixels classified as LR.

4 Evidence-Based Complementary and Alternative Medicine
C-0.053% R-0.002% B-0.085% P-0%
DR-2.092% LR-0% LP-0.001% LB-0.053%
BK-35.648% GY-61.108% W-0.097% Y-0.853%
v = (0.053 0.002 0.085 0 2.092 0 0.001 0.053 35.648 61.108 0.097 0.853)
Figure 6: Disease tongue sample, its tongue color feature vector and corresponding 12-color makeup with most of the pixels classified as GY.
Guangdong Provincial Hospital of Traditional Chinese Med-icine, Guangdong, China.The patients’ consent was obtainedaccording to the Declaration of Helsinki and the EthicalCommittee of the Institution in which the work was per-formed approved it.The capture device used was a three-chipCCD camera with 8 bit resolution and two D65 fluorescenttubes placed symmetrically around the camera in orderto produce a uniform illumination. The images capturedwere color corrected [17] to eliminate any noise caused byvariations of illumination and device dependency.This allowsconsistent feature extraction and classification in the follow-ing steps. Figure 1 shows the capture device. Healthy sampleswere verified through a blood test and other experiments.If indicators from the tests fall within a certain range theywere deemed fit. In the Disease class, samples were collectedfrom inpatients with illnesses determined by their admissionnote, diagnosed using Western Medical practices. Inpatientssuffering from the same illness were grouped together into asingle class. In total there were 13 ailment groups (with at least10 samples) and one miscellaneous group containing variousillnesses. A summary of the Disease class breakdown is givenin Table 1. Please note any future reference to a specific illnessin Table 1 will be made using its Disease ID.
3. Methods
The following section describes how color features areextracted from tongue images.The tongue color gamut is firstsummarized in Section 3.1. In Section 3.2, every foregroundtongue pixel is compared to 12 colors representing the tonguecolor gamut and assigned its nearest color. This forms thecolor features.
3.1. Tongue Color Gamut. The tongue color gamut [15] rep-resents all possible colors that appear on the tongue surfaceand exists within the red boundary shown in Figure 2 (CIE-xy chromaticity diagram). Further investigation revealed that98% of the points lie inside the black boundary. To representthe tongue color gamut using 12 colors, the RGB color spaceis employed and plotted in Figure 3. On the RG line a point Y(Yellow) is marked. Between RB a point P (Purple) is markedand C (Cyan) is marked between GB. The center of the RGBcolor space is calculated and designated as W (White), thefirst of the 12 colors (see Figure 3). Then, for each R (Red), B(Blue), Y, P, and C point, a straight line is drawn to W. Eachtime these lines intersect the tongue color gamut, a new coloris added to represent the 12 colors.This accounts for R, Y, C, B,

Evidence-Based Complementary and Alternative Medicine 5
Healthy
(a)
Disease
(b)
Figure 7: Three typical Healthy (a) and Disease (b) samples.
0 10 20 30 40 50 60 70 80
020
4060
8005
1015202530
RY
GY
Cluster 1Cluster 2
Figure 8: Plot of Cluster 1 versus Cluster 2.
and P. LR (Light red), LP (Light purple), and LB (Light blue)are midpoints between lines from the black boundary to W,while DR (Deep red) is selected as no previous point occupiesthat area. More details about the tongue color gamut can befound in [15]. GY (Gray) and BK (Black) are not shown inFigure 3 since both belong to grayscale.
The 12 colors representing the tongue color gamut areextracted from Figure 3 and shown in Figure 4 as a colorsquare with its label on top. Correspondingly, its RGB andCIELAB values are given in Table 2.
0 10 20 30 40 50 60 70 80020406080
00.005
0.010.015
0.020.025
0.030.035
0.04
RY
C
Cluster 1Cluster 3
Figure 9: Plot of Cluster 1 versus Cluster 3.
0 10 20 30 40 50 60 70 80
020
4060
800
10203040
RBK
GY
Cluster 3Cluster 2
Figure 10: Plot of Cluster 3 versus Cluster 2.
6 Evidence-Based Complementary and Alternative Medicine
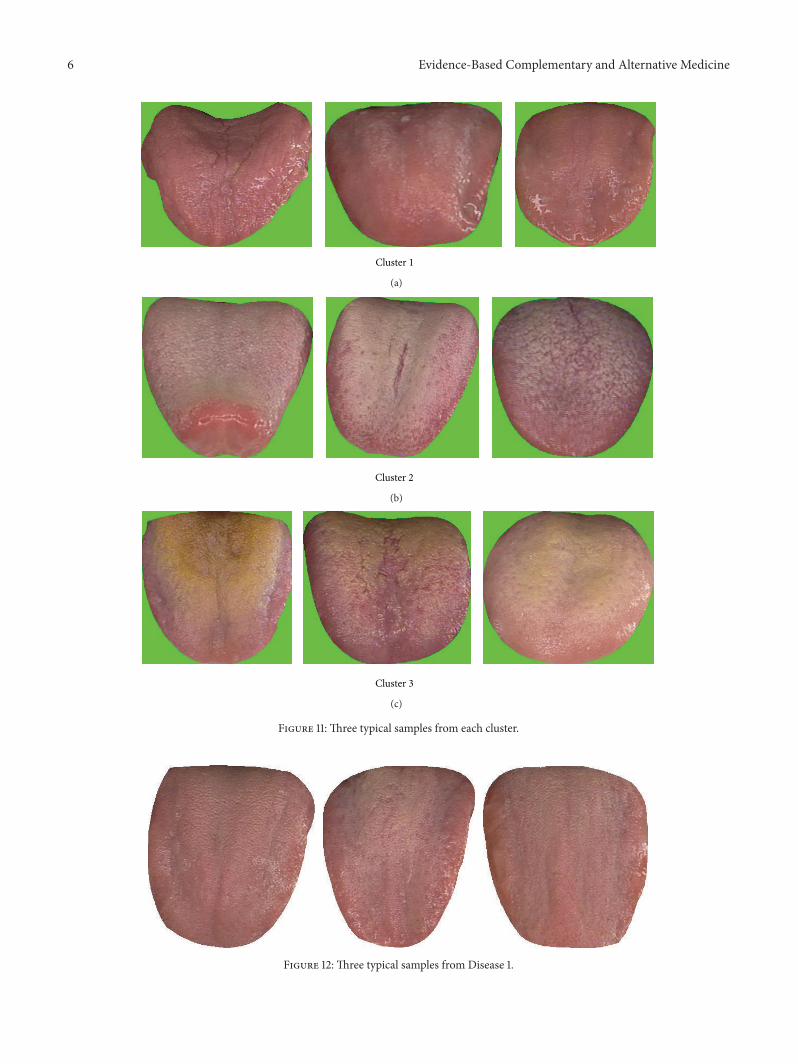
Cluster 1
(a)
Cluster 2
(b)
Cluster 3
(c)
Figure 11: Three typical samples from each cluster.
Figure 12: Three typical samples from Disease 1.

Evidence-Based Complementary and Alternative Medicine 7
Figure 13: Three typical samples from Disease 3.
Figure 14: Three typical samples from Disease 5.
Figure 15: Three typical samples from Disease 6.
Figure 16: Three typical samples from Disease 7.

8 Evidence-Based Complementary and Alternative Medicine
Figure 17: Three typical samples from Disease 8.
Figure 18: Three typical samples from Disease 9.
Figure 19: Three typical samples from Disease 10.
Figure 20: Three typical samples from Disease 11.

Evidence-Based Complementary and Alternative Medicine 9
Figure 21: Three typical samples from Disease 12.
Figure 22: Three typical samples from Disease 13.
3.2. Tongue Color Features. Given a tongue image, segmen-tation is first applied to locate all foreground tongue pixels[16]. Having located each pixel its corresponding RGB valueis extracted and converted to CIELAB [18] by first convertingRBG to CIE𝑋𝑌𝑍 using
[
[
𝑋
𝑌
𝑍
]
]
= [
[
0.4124 0.3576 0.1805
0.2126 0.7152 0.0722
0.0193 0.1192 0.9505
]
]
[
[
RGB]
]
(1)
followed by CIE𝑋𝑌𝑍 to CIELAB via
𝐿∗
= 116𝑓(𝑌
𝑌0
) − 16,
𝑎∗
= 500 [𝑓(𝑋
𝑋0
) − 𝑓(𝑌
𝑌0
)] ,
𝑏∗
= 200 [𝑓(𝑌
𝑌0
) − 𝑓(𝑍
𝑍0
)] ,
where 𝑓 (𝑥) ={
{
{
𝑥1/3
(𝑥 > 0.008856) ,
7.787𝑥 +16
116(𝑥 ≤ 0.008856) .
(2)
In (2), 𝑋0, 𝑌0, and 𝑍
0are the CIE𝑋𝑌𝑍 tristimulus
values of the reference white point. The LAB values arethen compared to 12 colors from the tongue color gamut(see Table 2) and assigned the color which is closest to it(measured using Euclidean distance). After calculating alltongue foreground pixels, the total of each color is summedand divided by the number of pixels. This ratio of the12 colors forms the tongue color feature vector V, where
Table 2: RGB and CIELAB values of the 12 colors.
Color [R G B] [L A B]C (Cyan) [188 188 185] [76.0693 −0.5580 1.3615]R (Red) [189 99 91] [52.2540 34.8412 21.3002]B (Blue) [183 165 180] [69.4695 9.5423 −5.4951]P (Purple) [226 142 214] [69.4695 42.4732 −23.8880]DR (Deep red) [136 72 49] [37.8424 24.5503 25.9396]LR (Light red) [227 150 147] [69.4695 28.4947 13.3940]LP (Light purple) [225 173 207] [76.0693 24.3246 −9.7749]LB (Light blue) [204 183 186] [76.0693 7.8917 0.9885]BK (Black) [107 86 56] [37.8424 3.9632 20.5874]GY (Gray) [163 146 143] [61.6542 5.7160 3.7317]W (White) [200 167 160] [70.9763 10.9843 8.2952]Y (Yellow) [166 129 93] [56.3164 9.5539 24.4546]
V = [𝑐1, 𝑐2, 𝑐3, 𝑐4, 𝑐5, 𝑐6, 𝑐7, 𝑐8, 𝑐9, 𝑐10, 𝑐11, 𝑐12] and 𝑐
𝑖represents
the sequence of colors in Table 2. As an example, the colorfeatures of two tongues are shown in visual form (refer toFigures 5 and 6) along with its extracted tongue color featurevectors, where the original image is decomposed into one ofthe 12 colors. Figure 5 is from a Healthy sample and Figure 6is from a Disease sample. In the Healthy sample the majorityof pixels are LR and for Disease it is GY.
The mean colors of Healthy and Disease are displayedin Table 3 along with three typical samples from each classshown in Figure 7. Disease tongues have a higher ratio in R,DR, BK, GY, and Y according to Table 3. On the other hand,LR and W are greater in Healthy. Only 7 colors are listed outof the 12 as the remaining 5 have ratios less than 1%.

10 Evidence-Based Complementary and Alternative Medicine
Table 3: Mean of the color features for Healthy and Disease.
R DR LR BK GY W YHealthy 20.9284 5.6679 33.8483 8.2356 14.5583 7.9166 8.0485Disease 28.2901 15.5951 11.0277 15.4325 16.2247 2.4990 10.6382
4. Results and Discussion
In this section classification using color features is described.Classification between Healthy versus Disease is first givenin Section 4.1, while illnesses in Disease are classified inSection 4.2.
4.1. Healthy versus Disease Classification. Table 4 shows theclassification rate between Healthy versus Disease on the testdata. Half the images were randomly selected from eitherclass to represent the training set and the remaining samplesassigned to the test set. The training data in each class arethe mean tongue color features of Healthy and Disease. Toreduce the number of tongue color features, feature selectionwith sequential forward search was implemented. Both 𝑘-NN [19] and SVM [19] using a quadratic kernel were testedproducing the same result as can be seen in Table 4. Thismeans for 𝑘-NN and SVM the tongue color feature vectorof the training set consisting of Healthy and Disease wasplaced in an 𝑛-dimensional space. Each tongue color featurevector representing the test set was mapped to this space andclassified depending on its classification rule (𝑘-NNor SVM).
4.2. Typical Disease Analysis. With Healthy versus Diseaseseparated the next step is to examinewhether certain illnesseswithin the Disease class can be distinguished from oneanother. All 13 illnesses were grouped into three clusters byFCM [19], with Table 5 illustrating which cluster each illnessbelongs to. The mean tongue color features of each clusterare shown in Table 6. R, DR, and LR are greater in Cluster 3.Cluster 2 has higher concentrations of GY, BK, and W, whileY is more significant in Cluster 1.
Table 7 shows the classification rate of the three clusterscalculated in groups of two. In each case the two clustersin question are clearly separable as seen in this table andFigures 8, 9, and 10. Three typical samples from each clusterare depicted in Figure 11. From a visual perspective the tonguecolor features in each cluster are quite different compared tothe rest.
Next, each cluster is examined one by one to deter-mine whether illnesses within it can be classified. This isaccomplished by comparing illnesses inside the cluster andremoving the illness with the highest classification. Theprocess is repeated until all illnesses have been classified.The same experimental setup described in Section 4.1 wasapplied, where half the images are randomly selected fortraining and test sets. Both 𝑘-NN and SVM were used as theclassifiers along with sequential forward search for featureselection. An illness is considered successfully classified if itsaverage accuracy is greater than or equal to 70%.The averageaccuracies stated in the following paragraph represents onlySVM. For a complete list of the results please refer to Table 8.
Table 4: Classification result between Healthy versus Disease using𝑘-NN and SVM.
Classification method Average accuracyk-NN 91.99%SVM 91.99%
Table 5: Distribution of the illnesses within the clusters.
Cluster number Disease group1 1 132 5 7 8 9 10 123 2 3 4 6 11
Diseases 1 and 13 in Cluster 1 are separable with anaverage accuracy of 76.08%. In Cluster 2, Disease 7 canbe first removed as its classification rate of 93.06% is thehighest amongst the six illnesses. Diseases 10, 8, and 9 aresubsequently taken out in that order which leaves illnesses5 and 12 (classification rate of 81.45%). Looking at Cluster3, Disease 6 with a classification rate of 74.05% is initiallyremoved from the pack. This is followed by Diseases 3 and 11leaving 2 and 4which produced the lowest classification resultof 54.41%. Table 8 summarizes this result. Diseases 1, 3, 5, 6, 7,8, 9, 10, 11, 12, and 13 achieved an average accuracy greater than70% and therefore deemed successfully classified. Typicalsamples of the successfully classified illnesses are shown inFigures 12, 13, 14, 15, 16, 17, 18, 19, 20, 21, and 22.
As part of the future workwe plan on returning toGuang-dong Provincial Hospital of Traditional Chinese Medicineand collect more diseased tongue images. Color features(discussed in Section 3.2) will be extracted from these newimages before combining it with the previous batch. Theexperimental results in the form of Healthy versus Diseaseclassification and typical disease analysis will be recalculatedin order to further validate its statistical accuracy.
5. Conclusion
Given a tongue image the tongue color analysis system is ableto first distinguish Healthy versus Disease with an averageaccuracy of 91.99%. If the image is from Disease it is furtherassigned to one of three clusters. From these clusters 11illnesses can be successfully classified given a classificationrate of at least 70%. The proposed method uses a specialcapture device with image correction and extracts a tonguecolor feature vector from each image. This vector consistsof 12 color ratios calculated with the tongue color gamut tobetter characterize each foreground tongue pixel. Testing wascarried out on a large dataset collected from Guangdong,China, consisting of 143 Healthy and 902 Disease images

Evidence-Based Complementary and Alternative Medicine 11
Table 6: Mean tongue color features of the three clusters.
Cluster number R DR LR BK GY W Y1 21.561 13.972 12.265 12.535 9.524 3.703 26.1912 17.116 11.980 9.437 15.574 34.733 4.111 6.5393 40.736 15.396 15.872 8.232 10.770 1.668 7.015
Table 7: Classification result between the three clusters comparedin groups of two.
Cluster comparison Average accuracyCluster 1 versus Cluster 2 100%Cluster 1 versus Cluster 3 97.75%Cluster 2 versus Cluster 3 99.63%
Table 8: Classification result of the illnesses.
Disease ID Cluster number k-NN SVM1 1 72.53% 76.08%2 3 54.87% 54.41%3 3 72.97% 75.68%4 3 54.87% 54.41%5 2 81.45% 81.45%6 3 78.61% 74.05%7 2 83.33% 93.06%8 2 72.02% 83.33%9 2 77.78% 83.33%10 2 78.71% 87.10%11 3 72.82% 73.56%12 2 81.45% 81.45%13 1 72.53% 76.08%
(13 specific illnesses with at least 10 samples and a miscella-neous folder).The experimental results showed that there is arelationship between tongue color and the state of the humanbody, which can be used in medical applications to detectvarious illnesses. This can potentially lead to a new painlessand efficient way to examine patients.
Acknowledgments
The work is partially supported by the GRF fund from theHKSAR Government, the central fund from Hong KongPolytechnic University, and the NSFC Oversea fund(61020106004), China.
References
[1] C. C. Chiu, “Development of a computerized tongue diagnosissystem,” Biomedical Engineering, vol. 8, no. 4, pp. 342–350, 1996.
[2] C. C. Chiu, “A novel approach based on computerized imageanalysis for traditional Chinese medical diagnosis of thetongue,” Computer Methods and Programs in Biomedicine, vol.61, no. 2, pp. 77–89, 2000.
[3] R. O. Duda, P. E. Hart, and D. G. Stork, Pattern Classification,Wiley & Sons, 2nd edition, 2000.
[4] B. Kirschbaum, Atlas of Chinese Tongue Diagnosis, EastlandPress, Seattle, Wash, USA, 2000.
[5] B. Li, Q. Huang, Y. Lu, S. Chen, R. Liang, and Z. Wang, “Amethod of classifying tongue colors for traditional chinesemedicine diagnosis based on the CIELAB color space,” in Pro-ceedings of the International Conference on Medical Biometrics,pp. 153–159, 2007.
[6] C. H. Li and P. C. Yuen, “Tongue image matching using colorcontent,” Pattern Recognition, vol. 35, no. 2, pp. 407–419, 2002.
[7] N. M. Li, “The contemporary investigations of computerizedtongue diagnosis,” inThe Handbook of Chinese Tongue Diagno-sis, Shed-Yuan Publishing, 1994.
[8] G. Maciocia, Tongue Diagnosis in Chinese Medicine, EastlandPress, Seattle, Wash, USA, 1995.
[9] N. Ohta and A. Robertson, Colorimetry: Fundamentals andApplications, John Wiley & Sons, 2006.
[10] B. Pang, D. Zhang, and K. Wang, “Tongue image analysis forappendicitis diagnosis,” Information Sciences, vol. 175, no. 3, pp.160–176, 2005.
[11] B. Pang, D. Zhang, and K. Wang, “The bi-elliptical deformablecontour and its application to automated tongue segmentationin chinese medicine,” IEEE Transactions on Medical Imaging,vol. 24, no. 8, pp. 946–956, 2005.
[12] W. Su, Z. Y. Xu, Z. Q. Wang, and J. T. Xu, “Objectified studyon tongue images of patients with lung cancer of differentsyndromes,” Chinese Journal of Integrative Medicine, vol. 17, no.4, pp. 272–276, 2011.
[13] K. Q.Wang, D. Zhang, N.M. Li, and B. Pang, “Tongue diagnosisbased on biometric pattern recognition technology,” in PatternRecognition from Classical to Modern Approaches, S. K. Pal andA. Pal, Eds., pp. 575–598, World Scientific, 1st edition, 2001.
[14] X. Wang and D. Zhang, “An optimized tongue image color cor-rection scheme,” IEEE Transactions on Information Technologyin Biomedicine, vol. 14, no. 6, pp. 1355–1364, 2010.
[15] X. Wang and D. Zhang, “Statistical tongue color distributionand its application,” in Prococeedings of the International Con-ference on Computer and Computational Intelligence, 2011.
[16] D. Zhang, Automated Biometrics: Technologies and Systems,Kluwer Academic Publisher, Boston, Mass, USA, 2000.
[17] D. Zhang, B. Pang, N. Li, K. Wang, and H. Zhang, “Computer-ized diagnosis from tongue appearance using quantitative fea-ture classification,” The American Journal of Chinese Medicine,vol. 33, no. 6, pp. 859–866, 2005.
[18] H. Z. Zhang, K. Q. Wang, X. S. Jin, and D. Zhang, “SVRbased color calibration for tongue image,” in Proceedings of theInternational Conference on Machine Learning and Cybernetics(ICMLC ’05), pp. 5065–5070, August 2005.
[19] Y. Zhang, R. Liang, Z. Wang, Y. Fan, and F. Li, “Analysis of thecolor characteristics of tongue digital images from 884 physicalexamination cases,” Journal of Beijing University of TraditionalChinese Medicine, vol. 28, pp. 73–75, 2005.

Submit your manuscripts athttp://www.hindawi.com
Stem CellsInternational
Hindawi Publishing Corporationhttp://www.hindawi.com Volume 2014
Hindawi Publishing Corporationhttp://www.hindawi.com Volume 2014
MEDIATORSINFLAMMATION
of
Hindawi Publishing Corporationhttp://www.hindawi.com Volume 2014
Behavioural Neurology
EndocrinologyInternational Journal of
Hindawi Publishing Corporationhttp://www.hindawi.com Volume 2014
Hindawi Publishing Corporationhttp://www.hindawi.com Volume 2014
Disease Markers
Hindawi Publishing Corporationhttp://www.hindawi.com Volume 2014
BioMed Research International
OncologyJournal of
Hindawi Publishing Corporationhttp://www.hindawi.com Volume 2014
Hindawi Publishing Corporationhttp://www.hindawi.com Volume 2014
Oxidative Medicine and Cellular Longevity
Hindawi Publishing Corporationhttp://www.hindawi.com Volume 2014
PPAR Research
The Scientific World JournalHindawi Publishing Corporation http://www.hindawi.com Volume 2014
Immunology ResearchHindawi Publishing Corporationhttp://www.hindawi.com Volume 2014
Journal of
ObesityJournal of
Hindawi Publishing Corporationhttp://www.hindawi.com Volume 2014
Hindawi Publishing Corporationhttp://www.hindawi.com Volume 2014
Computational and Mathematical Methods in Medicine
OphthalmologyJournal of
Hindawi Publishing Corporationhttp://www.hindawi.com Volume 2014
Diabetes ResearchJournal of
Hindawi Publishing Corporationhttp://www.hindawi.com Volume 2014
Hindawi Publishing Corporationhttp://www.hindawi.com Volume 2014
Research and TreatmentAIDS
Hindawi Publishing Corporationhttp://www.hindawi.com Volume 2014
Gastroenterology Research and Practice
Hindawi Publishing Corporationhttp://www.hindawi.com Volume 2014
Parkinson’s Disease
Evidence-Based Complementary and Alternative Medicine
Volume 2014Hindawi Publishing Corporationhttp://www.hindawi.com