Embed Size (px)
Citation preview

Publication #2011-25 4301 Connecticut Avenue, NW, Suite 350, Washington, DC 20008
Phone 202-572-6000 Fax 202-362-8420 www.childtrends.org
RESEARCH BRIEFTwo Generations in Poverty: Status and Trends among Parents and Children in the United States, 2000-2010 By Zakia Redd, M.P.P., Tahilin Sanchez Karver, M.P.H., David Murphey, Ph.D.,Kristin Anderson Moore, Ph.D., and Dylan Knewstub, B.A. November 2011
Overview. The release of the most recent official Census poverty data confirms that American familiesare still reeling from the Great Recession. As would be expected during a period of sharp economic
downturn, between 2009 and 2010, rates of poverty and low-income status increased across a wide spec-trum of families in the United States, particularly among those headed by women. In 2010, 15.1 percentof the U.S. population lived in poverty, up from 14.3 percent in 2009.i These numbers reflect broadincreases in poverty rates experienced by Blacks, Hispanics and Whites, as well as by all age cohorts, withthe exception of adults over age 65. The overall rate of poverty masks much higher rates within particu-lar sub-groups, such as single-mother families, with a poverty rate of 40.7 percent in 2010.
As poverty has become more widespread in the United States, it is important to acknowledge the largebody of research documenting the association between poverty or economic hardship and negative out-comes for parents, especially women, and their children. One of the primary concerns about families liv-ing in poverty, particularly single parents and children, is that, due to their limited financial resources,they may experience material hardships and struggle to meet basic needs for food, housing, clothing, andso on. However, research on poverty finds that its effects extend beyond purchasing power and into otheraspects of life.
Adults living in poverty experience a wide range of physical and mental health problems, as well as nega-tive social, education, and employment outcomes.ii Among parents, in particular, poverty and economichardship is associated with psychological distress and parental aggravation, among other negative out-comes.iii Among children, the effects of poverty are potentially even more pervasive and long-lasting,which is significant, given that they are the age group in which poverty is most prevalent. In addition,children in single parent households are increasingly likely to live in poverty.
Indeed, a large body of literature has focused on the relationship between childhood poverty and short-and long-term outcomes in childhood, adolescence and adulthood, and also finds negative effects onsocial,iv health,v and educationalvi outcomes. Children experiencing early poverty, deep poverty, and per-sistent poverty are especially likely to experience deleterious longer- term effects on their development andlife circumstances, such as an increased likelihood of economic hardships in adulthood.vii In fact, severalstudies indicate a strong intergenerational connection, with poor children much more likely to grow up tobe poor themselves.viii Furthermore, individuals living in areas with higher levels of poverty are morelikely than those living in low-poverty neighborhoods to experience negative outcomes, ranging fromhigher levels of low birth weight to other health, social and educational and parenting outcomes.ix
Numerous studies document a consistent set of background factors that have been found to predict one’slikelihood of experiencing poverty. In particular, women, single parents, Black and Hispanic adults, andadults with low levels of educational attainment and/or limited work experience are more likely to bepoor.x Similarly, certain events have been found to be associated with poverty, such as job loss ordivorce.xi
In this brief, we examine recent poverty data and trends over the past decade through a two-generationlens. From this perspective, the increases in poverty experienced by families with children are especially
© 2011 Child Trends 1
Commissioned by: Ascend at the Aspen Institute and Communications Consortium Media Center,Washington, DC
troubling. Given the negative effects of poverty andeconomic hardship on parents and children, theseincreases are most concerning for those groupswhose rates of poverty and low-income status werealready high, such as families headed by singleparents. Poverty affects all individuals within ahousehold; when resources are constrained, fami-lies are forced to make difficult decisions—forinstance, sacrificing the needs of parents to bettermeet those of children. In the long run, such trade-offs are not effective remedies, because, within asystems perspective, children’s well-being is closelytied to that of their parents. Numerous studieshave made clear the negative effects, for example,of parental stress, unemployment, or depressionon both short- and long-term outcomes for chil-dren.xii Likewise, parents’ well-being is directlyaffected by their concerns for their children—which may include the safety of child carearrangements, their school performance, theirhealth, and so on.
This brief draws on data from the U.S. CensusBureau, and presents a sharpened two-generationlens on the poverty and low-income status of chil-dren and families in 2010, and on trends in pover-ty and low-income status among children andfamilies during the first decade of the 21st century.In addition, it presents data on differences inpoverty and low-income status across race and eth-nic origin, age, family structure, gender, educa-tion, full-time employment status, and geography.The brief is organized into four sections and endswith a summary of findings. Following thisoverview and a brief summary of the poverty datareferenced in this brief, the first section focuses onthe two-generation frame of family householdswith children, highlighting the shifting familystructure of families in the United States; the sec-ond section focuses on children; the third sectionfocuses on adults; and the fourth section high-lights geographic areas with a high concentrationof poverty. The brief concludes with a summary ofimportant distinctions in the patterns of povertyand low-income status across a number of differentcategories.
DEFINING POVERTY THRESHOLDSThe data presented in this brief are based on theofficial poverty measure, which varies by familysize and composition, and are updated annually toreflect inflation as measured by the ConsumerPrice Index.xiii In 2010, for instance, the povertythreshold for a family of four with two relatedchildren under 18 years was $22,113.viii People
living in households with incomes below 200 per-cent of the federal poverty line are considered tobe low-income, while those with incomes below 50percent of the federal poverty line are living indeep or extreme poverty.
In October 2011, the Census also published pre-liminary poverty estimates based on the Supple-mental Poverty Measure, which is being developedand refined based on recommendations from aninteragency technical working group with repre-sentatives from the U.S. Census Bureau, theBureau of Labor Statistics and other federal agen-cies.xiv The Supplemental Poverty Measure uses
2© 2011 Child Trends
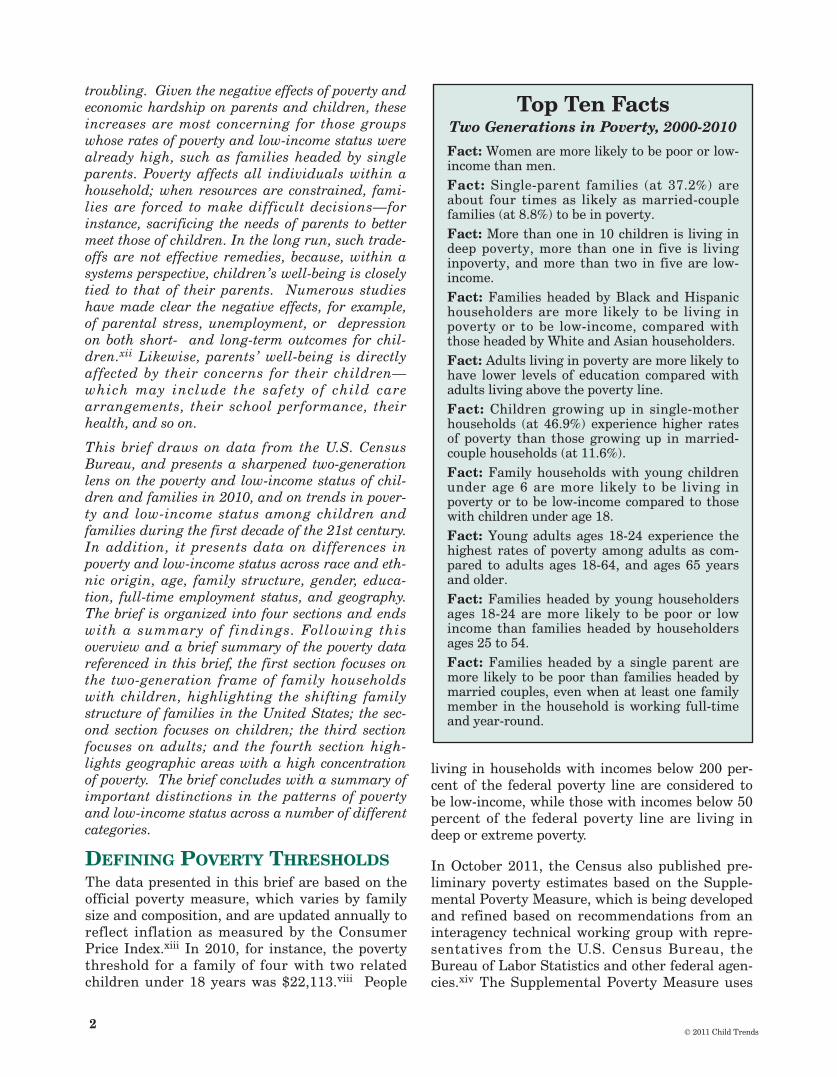
Top Ten FactsTwo Generations in Poverty, 2000-2010
Fact: Women are more likely to be poor or low-income than men.Fact: Single-parent families (at 37.2%) areabout four times as likely as married-couplefamilies (at 8.8%) to be in poverty.Fact: More than one in 10 children is living indeep poverty, more than one in five is livinginpoverty, and more than two in five are low-income. Fact: Families headed by Black and Hispanichouseholders are more likely to be living inpoverty or to be low-income, compared withthose headed by White and Asian householders. Fact: Adults living in poverty are more likely tohave lower levels of education compared withadults living above the poverty line.Fact: Children growing up in single-motherhouseholds (at 46.9%) experience higher ratesof poverty than those growing up in married-couple households (at 11.6%).Fact: Family households with young childrenunder age 6 are more likely to be living inpoverty or to be low-income compared to thosewith children under age 18.Fact: Young adults ages 18-24 experience thehighest rates of poverty among adults as com-pared to adults ages 18-64, and ages 65 yearsand older.Fact: Families headed by young householdersages 18-24 are more likely to be poor or lowincome than families headed by householdersages 25 to 54.Fact: Families headed by a single parent aremore likely to be poor than families headed bymarried couples, even when at least one familymember in the household is working full-timeand year-round.

© 2011 Child Trends 3
poverty thresholds that are based on the Con-sumer Expenditure Survey data and that areadjusted to account for in-kind benefits, as well astaxes, work and out-of-pocket medical expenses,the cost of basic living expenses, such as housingand food. The number and percent of people livingin poverty vary across the two measures. Forinstance, in 2010, 15.1 percent of all people and21.0 percent of children in the U.S. were livingbelow poverty using the official poverty measure.xv
By comparison, 16 percent of all people and 18.2percent of all children were living below povertyusing the Supplemental Poverty Measure.
In addition to the Supplemental Poverty Measure,over the past several years, the Census hasreleased poverty estimates for alternative or exper-imental poverty measures that were developedbased on recommendations from a 1995 NationalAcademy of Sciences (NAS) report, MeasuringPoverty: A New Approach.xvi While many debatewhich poverty measure provides the most accurateportrait of poverty in the U.S., each of the povertymeasures provide unique and useful informationabout the financial well-being of families in theU.S. In 2010, the official poverty measure pro-duced estimates that fell in the middle range of theeight poverty estimates produced using the NASbased measures. However, earlier in the decade,the poverty estimates based on the official povertymeasure tended to be lower than those producedusing the NAS based estimates.xvii
POVERTY AND LOW-INCOME STATUSAMONG FAMILY HOUSEHOLDS WITHCHILDRENStatus and Trends across Poverty Thresholds by Family Structure
Poverty Status and Trends
n Between 2009 and 2010, poverty rates for family households increased across different types of families. In 2010, 37.2 percent of single-parent families were living in poverty, up from 35.2 percent in 2009. In 2010, 8.8 percent of married-couple households were in poverty, up from 8.3 percent in 2009. (Figure 1)
Low-Income Status and Trends
n Similarly, the percentage of families who were low-income increased across different family-
structure types. In 2010, 64.3 percent of single-parent families were low-income, up from 62.8 percent in 2009. In 2010, 25.2 percent of married-couple households were low-income, up from 24.5 percent in 2009. (Figure 1)
DIFFERENCES BY MAJORSUB-POPULATIONSDifferences by Family Structure
n Overall, single-parent families were about fourtimes as likely to be in poverty and more than twice as likely to be low-income, compared to married-couple families.
n As seen above, family structure is strongly related to poverty status and low-income status,with single-parent families—and those familiesheaded by single mothers in particular—having higher levels of poverty than married-couple families. (Figure 2)
n This difference has important implications,given that the proportion of families headed by single mothers has followed an upward trend across the past decade. (Figure 3)
Differences by Race and Hispanic Origin
n Racial and ethnic disparities in poverty levels persist across family-structure types.
n Over the past decade, the poverty rate among Black and Hispanic single-mother families has been consistently higher than the rates of their White and Asian counterparts.1 For instance, in 2010, 47.6 percent of Black, and 50.3 percent of Hispanic single-mother families were in poverty, compared with 32.7 percent of White, and 30.1 percent of Asian single-mother families. (Figure 2)
Differences by Age of Child or Householder
n Families with the youngest children are most likely to be poor.
n Families living with children under age six experience higher rates of poverty, compared with all families with children under age 18, and this is especially pronounced among families headed by single-mothers. This trend has been consistent throughout the past decade. In 2010, the poverty rate among single-mother families with children under age six was 54.0 percent, while the poverty rate among
1Poverty estimates for Native Americans (American Indian and Alaska Natives) are not included in this brief due to the limited sample sizes in the U.S. Census Bureau Current Population Survey. However, according to data from the U.S. Census Bureau American Community Survey, which surveys a larger sample, American Indian and Alaska Natives experience high levels of poverty. For instance, in 2010, 47 percent of American Indian and Alaska Native single-mother families with related children under age 18 were living below the poverty level.
all single-mother families with children under age 18 was 40.7 percent. (Figure 4)
Families headed by younger single parents experi-ence more economic hardships.
n Families headed by householders aged 18-24 have higher rates of poverty and low-income compared to families headed by householders 25 and older, especially among single-mother families. For instance, in 2010, the poverty rate for single-mothers aged 18-24 was 67 percent, compared to 27.9 percent among married-couple families with the householder aged 18-24. In addition, single mothers aged 18-24 had a higher poverty rate when compared to single mothers in the 25-34 age group (at 48.7 percent), the 35-44 age group (at 33.8 percent), and the 45-54 age group (at 30.1 percent). Similarly, the low-income rate for single-mothers within this age group was 88.5 percent, compared with 59.5 percent among married-couple families with the householder aged 18-24. (Figure 5)
Differences by Employment Status of Householder
Families headed by a single parent are more likely tobe poor than families headed by married couples, evenwhen at least one family member in the household isworking full-time and year-round.
n Single-parent families with children are more likely to be living in poverty or to be low-income, despite having one member of the family working full-time and year-round, than are their married-couple counterparts. This pattern, which has been consistent across the past decade, holds across racial and ethnic groups. For example, in 2010, the poverty rate (at 13 percent) for single-mother families with at least one member of the family working full-time and year-round was more than threetimes higher than the rate (at 3.9 percent) for married-couple families with at least one family member working full-time and year-round. (Figure 6)
POVERTY AND LOW-INCOME STATUSAMONG CHILDRENStatus and Trends across Poverty Thresholds
More than one in five children in the United Stateslived in poverty in 2010.
n In 2010, the percentage of children living in poverty reached nearly 22 percent, up from 15.6 percent in 2000 (Figure 7).
n The percentage of children living in poverty remained relatively stable during the first half of the decade, but has increased each year since 2006. (Figure 7)
One in ten children in the United States were indeep or extreme poverty in 2010.
n In 2010, approximately one in ten children lived in deep poverty. (Figure 7)
n The percentage of children living in deep poverty remained relatively stable throughout the earlier part of the decade, but began to swing upward after the recession began, with the proportion of children living in deep poverty approximately 8 percent in 2008, almost 9 percent in 2009, and nearly 10 percent in 2010. (Figure 7)
More than two in five children in the UnitedStates were low-income in 2010.
n In 2010, approximately 43 percent of children were low-income. Mirroring recent trends in child poverty, the percentage of children who are low-income increased since the recession hit in 2007, after remaining stable throughout much of the decade. (Figure 7)
DIFFERENCES BY MAJORSUB-POPULATIONS2
Differences by Race and Hispanic Origin
Black and Hispanic children are disproportionatelypoor.
n In 2010, poverty levels among Black and Hispanic children (39.1 and 35.0 percent, respectively) were higher than those for White (12.4 percent) and Asian (14.4 percent) children. (Figure 8)
Differences by Age of Child
The youngest children are disproportionately poor.
n Young children under age 5 experience higher levels of poverty compared with children ages 5 to 17 (25.9 versus 20.5 percent in 2010). (Figure 9)
2 It is important to note that within racial and ethnic groups there are variations in poverty and low-income rates among subgroups. For example, the poverty rates for people living inthe United States who are of Vietnamese or Korean backgrounds may or may not differ from the rates of those from Indian or Japanese backgrounds. Variations among racial and eth-nic subgroups are not included in this report.
4© 2011 Child Trends
Differences by Family Structure
Children in single-mother households are fourtimes more likely to be poor, and twice as likely tobe low-income, as children in households with twomarried parents.
n Family structure is also a strong determinant of children’s poverty and low-income status. Children growing up in single-mother house-holds experience higher rates of poverty than those growing up in married-couple households (46.9 versus 11.6 percent, in 2010). (Figure 10)
n In 2010, children from single-mother households were more than twice as likely to be living in low-income households as were children from married-couple households (73.6 versus 30.7 percent). (Figure 10)
Differences by Employment Status of Householder
Children living in families headed by a single parent are more likely to be poor than children infamilies headed by a married couple, even when atleast one family member in the household is working full-time and year-round.”
n Children living in single-mother families are more likely to be living in poverty or to be low-income despite having at least one family member working full-time and year-round, in comparison with children in married-couple families with at least one family member working full-time and year-round. For example, in 2010, the poverty rate (at 17.5 percent) for children in single-mother families with at least one member of the family working full-time and year-round was more than three times higher than the rate (at 5.7 percent) for children in married-couple families with at least one family member working full-time and year-round. (Figure 11)
POVERTY AND LOW-INCOME STATUSAMONG ADULTSStatus and Trends across Poverty Thresholds
Nearly one in seven working-age adults is poor.
n In 2010, 13.7 percent of working-age adults (ages 18-64) were living in poverty (Figure 12).
n After remaining relatively stable for most of the decade, the poverty rate for this group has followed an upward trend since 2007, the year the recession began. Specifically, the poverty
rate among adults ages 18-64 was 10.9 percent in 2007; 11.7 percent in 2008; 12.9 percent in 2009; and 13.7 percent in 2010. (Figure 12)
n More than one in twenty working-age adults lives in deep poverty. In 2010, 6.3 percent of adults ages 18-64 lived in deep poverty, up from 3.9 percent in 2000. (Figure 12)
n Similar to the trend for children, the percentage of adults living in deep poverty remained stable throughout most of the decade, but began to swing upward after the recession began. (Figure 12)
n Almost one in three working-age adults is low-income. In 2010, approximately 30 percent of adults ages 18-64 were low-income, up from 24.2 percent in 2000. (Figure 12)
DIFFERENCES BY MAJORSUB-POPULATIONS ANDEDUCATION STATUS
Differences by Gender
n Women are more likely than men to be poor orlow-income. This holds across most age groups and major racial and ethnic subgroups. For instance, in 2010, 15.3 percent of women were living in poverty, compared with 12 percent of men. Likewise, 32.1 percent of women were low-income, compared with 27.9 percent of men. (Figure 13) This pattern has remained consistent over the past decade. (Figure 13)
Differences by Race and Hispanic Origin
n Black and Hispanic adults are more likely to be poor than are White and Asian adults.
n Similar to the pattern found for children, poverty levels among Black and Hispanic adults are higher than those for their White and Asian counterparts. (Figure 14)
Differences by Age
n The highest rates of poverty among adults arefound for young adults. Young adults (ages 18-24) have higher rates of poverty than older adults (ages 25 and older). Across all age groups, older adults (ages 65 and older) have the lowest levels of poverty, and rates for this group have remained relatively stable in recent years. (Figure 15)
© 2011 Child Trends 5
Differences by Educational Status
n Adults living in poverty are more likely to have lower levels of education compared with adults living above the poverty line. Among adults living in poverty, almost two-thirds have a high school diploma or less and only 10.4 percent ofthem have a Bachelor’s degree or higher. By contrast, among adults living above the poverty line, 39.5 percent have a high school diploma or less education and 30.9 percent ofthem have a Bachelor’s degree or higher.(Figure 16).
GEOGRAPHIC “HOT SPOTS” FORPOVERTYDifferences by State
Among the top 10 states with the highest povertyrates in the U.S., all but one are in the South.
n Poverty rates have been highest among the southern states, with Mississippi consistently having the highest poverty rate from 2005 to 2010. In 2010, Mississippi had a poverty rate of 22.4 percent up from 21.3 percent in 2005. (Figure 17)
n Similar patterns are found in state-level child poverty rates, with southern states consistently found to have higher child poverty rates. In addition, Mississippi experienced the highestchild poverty rate in the nation in the past five years, with a rate of 32.5 percent of Mississippi’s children living in poverty in 2010, up from 30.9 percent in 2005. (Figure 18)
Differences by Large Metropolitan Area
Metropolitan areas in California and Texas havethe highest rates of poverty among large metropol-itan areas.
n In 2010, the McAllen-Edinburg-Mission, Texas Metropolitan area and the Fresno, California Metropolitan area had the highest rates of poverty (at 33.4 and 26.8 percent, respectively). (Figure 19)
SUMMARY OF FINDINGS ANDCOMMON THEMES:n In the wake of the recent recession which has
resulted in persistently high rates of unemployment, poverty among two generation of families, that is working-age adults and their children, rose in the U.S. Overall, rates
increased among almost all demographic groups between 2007, when the recession began, and 2010.
n Though the recent increases in poverty and low-income status were widespread, groups with historically high levels of risk for poverty—including children, young adults, young parents, single-mother families, and Blacks and Hispanics—experienced larger percentage point increases in rates of poverty or low-income during this time period.
n Poverty and low-income status vary greatly by age, racial and ethnic origin, gender, family structure, and geography.
—As individuals age, they are generally less likely to live in poverty. Children have the highest prevalence of poverty across all age groups, especially young children. Likewise, younger parents have higher poverty rates than older parents. And among adults, young adults ages 18-24 have the highest poverty rates, while older adults ages 65 and older have the lowest. These data pat-terns may be related, as the youngest children are more likely to have young parents who may not have completed their education or found steady employment. Likewise, the presence of children in these young households, particularly for single parents, is likely to exacerbate poverty.
—Blacks and Hispanics have higher levels of poverty and low-income status than their White and Asian counterparts. This finding holds across almost all age groups, family-structure types, and by gender.
—Women have higher levels of poverty than men. This finding holds across most age groups and major racial and ethnic groups.
—Among families living with related children, single-parent house-holds—and especially single-mother house-holds have higher levels of poverty than house-holds headed by married couples.
—Poverty is highly concentrated in the southern region of the United States.
6© 2011 Child Trends

REFERENCESiDeNavas-Walt, C., Proctor, B.D., & Smith, J.C. (2011). U.S. Census Bureau,Current Population Reports, P60-239, Income, Poverty, and Health InsuranceCoverage in the United States: 2010. Washington, DC: U.S. Government Print-ing OfficeiiBoushey, H., Brocht, C., Gundersen, B., & Bernstein, J. (2001). Hardships inAmerica: The real story of working families. Washington, D.C.: Economic PolicyInstitute.iiiEdin, K. & Lein, L. (1997). Making ends meet: How single mothers survive wel-fare and low wage work. New York: Russell Sage Foundation.; McLoyd, V.(1997). The impact of economic hardship on black families and children: Psy-chological distress, parenting and socioemotional development. Child Develop-ment, 61(2), 311-346.; Vandivere, S., Moore, K., & Zaslow, M. (year). Children’sfamily environment: Findings from the National Survey of America’s Families.Snapshots of America’s Families II. Washington, DC: Child Trends and TheUrban Institute.ivMoore, K.A., Redd, Z., Burkhauser, M., Mbwana, K., & Collins, A. (2009). Chil-dren in poverty: Trends, consequences, and policy options. Retrieved fromhttp://www.childtrends.org/Files//Child_Trends-2009_04_07_RB_Childrenin-Poverty.pdf; Wadsworth, M.E., Raviv, T., Reinhard, C., Wolff, B., Santiago, C.D.,& Einhorn, L. (2008). An indirect effects model of the association between pover-ty and child functioning: The role of children’s poverty related stress. Journal ofLoss and Trauma, 13, 156-185. vWood, D. (2003). Effect of child and family poverty on child health in the UnitedStates. Pediatrics, 112(3), 707-711; Bronte-Tinkew, J., Zaslow, M., Capps, R., &Horowitz, A. (2007). Food insecurity and overweight among infants and tod-dlers: New insights into a troubling linkage. Washington, DC: Child Trends.;Klerman, L. V. (1991). The health of poor children: Problems and programs. InA. Huston (Ed.), Children and poverty: Child development and public policy (pp.136-157). New York: Cambridge University Press.; Lowry, R., Kann, L., Collins,J. L., & Kolbe, L. J. (1996). The effect of socioeconomic status on chronic diseaserisk behaviors among U.S. adolescents. Journal of the American Medical Associ-ation, 276(10), 792-797.viBrooks-Gunn & Duncan, 1997; Duncan, G. J. & Brooks-Gunn, J. (1997).Income effects across the life span: Integration and interpretation. In G. J. Dun-can & J. Brooks-Gunn (Eds.), Consequences of growing up poor (pp. 596–610).New York: Russell Sage Foundation.; Brooks-Gunn, J., & Duncan, G.J., (1997).The effects of poverty on children. The Future of Children: Children and Pover-ty, 7, 55-71.; Duncan, G.J., Yeung, J. W., Brooks-Gunn, J., Smith, J.R. (1998).Guo, G. (1998). The timing of the influences of cumulative poverty on children’scognitive ability and achievement. Social Forces, 77, 257-287.; Haveman, R.H., &Wolfe, B.S.(1994). Succeeding generations: On the effects of investment in chil-dren. New York, NY: Russell Sage Foundation.; Smith, J. R., Brooks-Gunn, J., &Klebanov, P.K., (1997). Consequences of living in poverty for young children’scognitive and verbal ability and early school achievement. In G. J. Duncan & J.Brooks-Gunn (Eds.), Consequences of growing up poor. New York: Russell SageFoundation. 598.viiBrooks-Gunn & Duncan, 1997; Duncan, G. J. & Brooks-Gunn, J. (1997).Income effects across the life span: Integration and interpretation. In G. J. Dun-can & J. Brooks-Gunn (Eds.), Consequences of growing up poor (pp. 596–610).New York: Russell Sage Foundation.; Brooks-Gunn, J., & Duncan, G.J., (1997).The effects of poverty on children. The Future of Children: Children and Pover-ty, 7, 55-71.; Duncan, G.J., Yeung, J. W., Brooks-Gunn, J., Smith, J.R. (1998).Guo, G. (1998). The timing of the influences of cumulative poverty on children’scognitive ability and achievement. Social Forces, 77, 257-287.; Haveman, R.H., &Wolfe, B.S.(1994). Succeeding generations: On the effects of investment in chil-dren. New York, NY: Russell Sage Foundation.; Smith, J. R., Brooks-Gunn, J., &Klebanov, P.K., (1997). Consequences of living in poverty for young children’scognitive and verbal ability and early school achievement. In G. J. Duncan & J.Brooks-Gunn (Eds.), Consequences of growing up poor. New York: Russell SageFoundation. viiiDuncan, G.J., Ziol-Guest, K.M., & Kalil, A. (2010). Early-childhood povertyand adult attainment, behavior, and health. Child Development, 81(1), 306-325;Rodgers, J.R. (1995). An empirical study of intergenerational transmission ofpoverty in the United States. Social Science Quarterly, 76(1), 178-194.; Corcoran,M. and Chaudry, A. (1997). The dynamics of childhood poverty. The Future ofChildren, 7(2), 40-54; Vartanian, T. P. (1999).ixFauth, R.C., Leventhal, T., & Brooks-Gunn, J. (2007). Welcome to the neigh-borhood? Long-term impacts of moving to low-poverty neighborhoods on poorchildren’s and adolescents’ outcomes. Journal of Research on Adolescence, 17(2),249-284.; National Research Council and Institute of Medicine (2000). From neu-rons to neighborhoods: The science of early childhood development. Committeeon Integrating the Science of Early Childhood Development. Jack P. Shonkoffand Deborah Philips (Eds.). Board on Children, Youth, and Families, Commis-sion on Behavioral and Social Sciences and Education. Washington, DC: Nation-al Academy Press.; Brooks-Gunn, J., Duncan, G.J., Leventhal, T., & Aber, J.L.(1997). Lessons learned and future directions for research on neighborhoods inwhich children live. In J. Brooks-Gunn, G.J. Duncan, & J.L. Aber (Eds.). Neigh-borhood poverty: Context and consequences for children, Volume 1 (pp. 279-297).New York, NY: Russell Sage.; Klebanov, P., Brooks-Gunn, J., & Duncan, G.(1994). Does neighborhood and family poverty affect mothers' parenting, mentalhealth, and social support? Journal of Marriage and Family, 56(2), 441-455.
xMoore, K., Glei, D., Driscoll, A., Zaslow, M, & Redd, Z. (2002). Poverty and wel-fare patterns: Implications for children. Journal of Social Policy, 31(2), 207-227.; Nichols-Casebolt, A., & Krysik, J. (1997). The economic well-being ofnever-and ever-married single mother families: A cross-national comparison.Journal of Social Service Research, 23(1), 19-40.; Hernandez, D. (1997). Povertytrends. In G. J. Duncan & J. Brooks-Gunn (Eds.), Consequences of growing uppoor. New York: Russell Sage FoundationxiLee, S., & Shaw, L. (2008). From work to retirement: Tracking changes inwomen's poverty status. Washington, DC: Institute for Women’s PolicyResearch.; McKernan, S-M., Ratcliffe, C., & Vinopal, K. (2009). Do assets helpfamilies cope with adverse events? Washington, D.C.: The Urban Institute.; Ahi-tuv, A. & Lerman, R. (2004). Job turnover, wage rates, and marital stability:How are they related? Washington, D.C.: The Urban Institute. xiiHair, E. C., McGroder, S. M., Zaslow, M. J., Ahluwalia, S. K., & Moore, K. A.(2002). How Do Maternal Risk Factors Affect Children in Low-Income Fami-lies?: Further Evidence of Two-Generational Implications. Journal of Preven-tion and Intervention in the Community, 23(12), 65-94.; National Research Coun-cil and Institute of Medicine (2000). From neurons to neighborhoods: The scienceof early childhood development. Committee on Integrating the Science of EarlyChildhood Development. Jack P. Shonkoff and Deborah Philips (Eds.). Boardon Children, Youth, and Families, Commission on Behavioral and Social Sci-ences and Education. Washington, DC: National Academy Press.; Lempers, J.,Clark-Lempers, D., & Simons, R. (1989). Economic hardship, parenting, and dis-tress in adolescence. Child Development, 60 (1), 25-39.; Child Trends. (1999).Children and Welfare Reform: A Guide to Evaluating the Effects of State WelfarePolicies on Children. Washington, DC: Author.; Conger, R.D., K.J. Conger, G.H.Elder Jr., F.O. Lorenz & R.L. Simons (1994) Economic stress, coercive familyprocess and developmental problems of adolescents, Child Development, 65,541 -561.xiiiChild Trends (2011). Children in Poverty. Retrieved from www.childtrendsdatabank.org/?q=node/221. xivDeNavas-Walt, Proctor, , & Smith, 2011; Short, K. (2011). The Research Supplemental Poverty Measure: 2010. Retrieved from: http://www.census.gov/prod/2011pubs/p60-241.pdf xvShort, 2011.xviCitro, C. & Michael, R.(Eds.). (1995). Measuring Poverty: A New Approach.Washington, DC: National Academy Press.xviiOfficial and National Academy of Sciences-based Poverty Rates, 1999-2000. Retrieved from: http://www.census.gov/hhes/povmeas/data/nas/tables/2010/index.html
ACKNOWLEDGEMENTSThe authors wish to thank the following people who contributed to this researchbrief by helping to conceptualize, review and provide comments and suggestionsfor consideration by the report authors: Sarah Haight, Anne Mosle, and NishaPatel from The Aspen Institute; Andrea Camp from Communications Consor-tium Media Center; and Carol Emig and Marci McCoy-Roth from Child Trends.
ABOUT CHILD TRENDSChild Trends is a nonprofit, nonpartisan research center that studies children atall stages of development. Our mission is to improve outcomes for children byproviding research, data, and analysis to the people and institutions whose deci-sions and actions affect children. For additional information on Child Trends,including publications available to download, visit our Web site atwww.childtrends.org. For the latest information on more than 100 key indica-tors of child and youth well-being, visit the Child Trends DataBank atwww.childtrendsdatabank.org.
ABOUT ASCEND AT THEASPEN INSTITUTEAscend, the Family Economic Security Program at the Aspen Institute, is a hubfor breakthrough ideas and proven strategies that move parents, especiallywomen, and their children beyond poverty toward educational success and eco-nomic security. The program focuses on three key areas - education, economics,and social capital - to: fundamentally change the conversation around low-income families; engage across diverse sectors to develop a network of leadersand political will; and convene forums and create platforms to elevate effectivetwo-generation policies and community solutions. Ascend takes a "two-genera-tion" approach in its strategy, focusing on both parents and their children.
The Aspen Institute mission is twofold: to foster values-based leadership,encouraging individuals to reflect on the ideals and ideas that define a good soci-ety, and to provide a neutral and balanced venue for discussing and acting oncritical issues.
© 2011 Child Trends 7
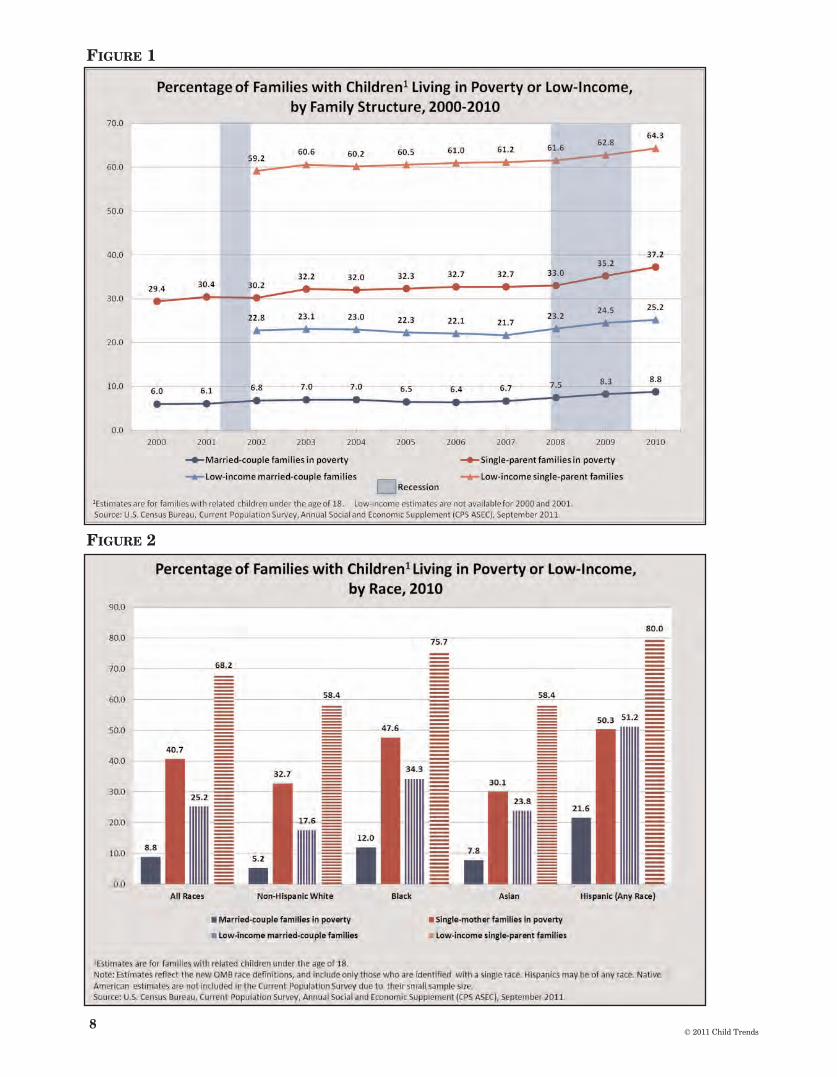
FIGURE 2
FIGURE 1
8© 2011 Child Trends
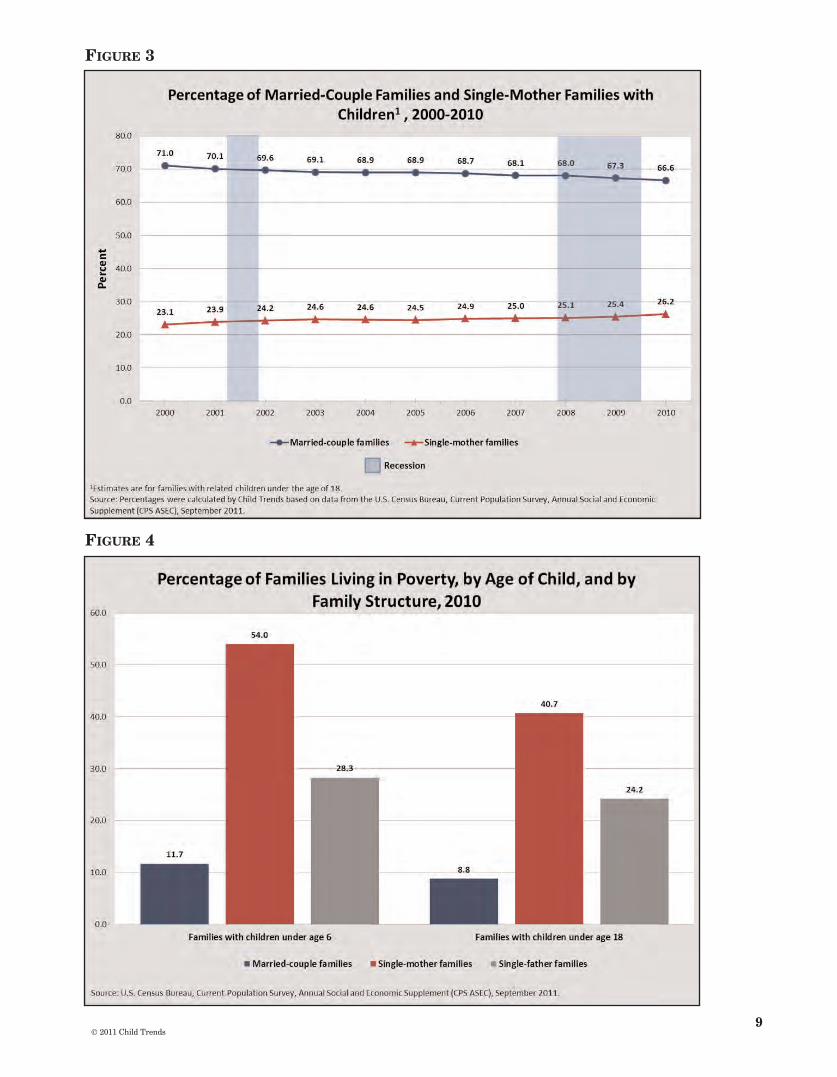
FIGURE 4
FIGURE 3
© 2011 Child Trends 9
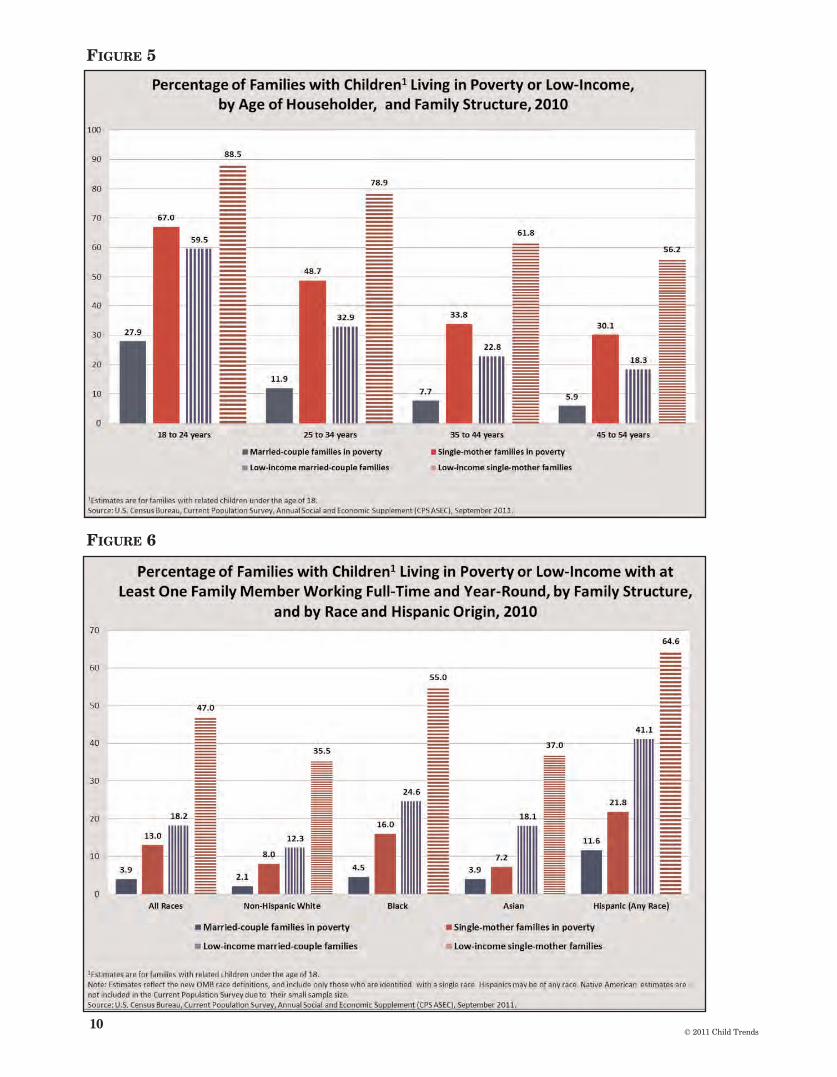
FIGURE 6
FIGURE 5
10© 2011 Child Trends
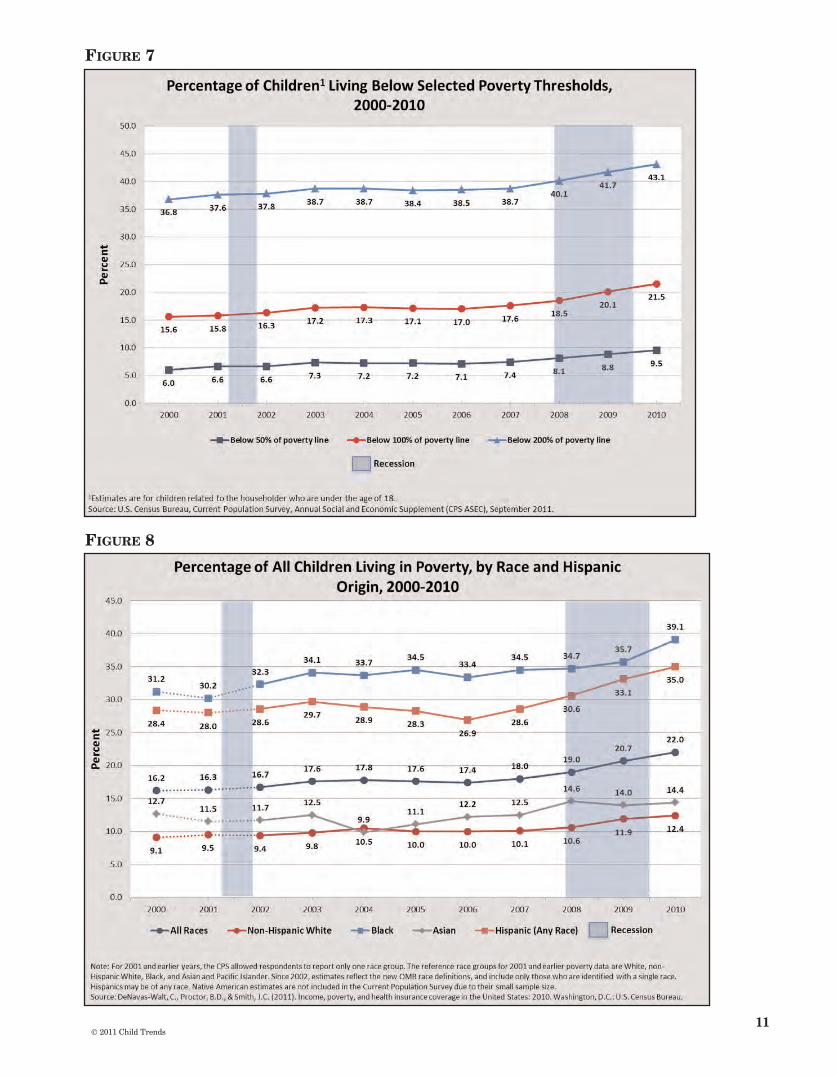
FIGURE 8
FIGURE 7
© 2011 Child Trends 11

FIGURE 10
FIGURE 9
12© 2011 Child Trends

FIGURE 12
FIGURE 11
© 2011 Child Trends 13

FIGURE 14
FIGURE 13
14© 2011 Child Trends

FIGURE 16
FIGURE 15
© 2011 Child Trends 15
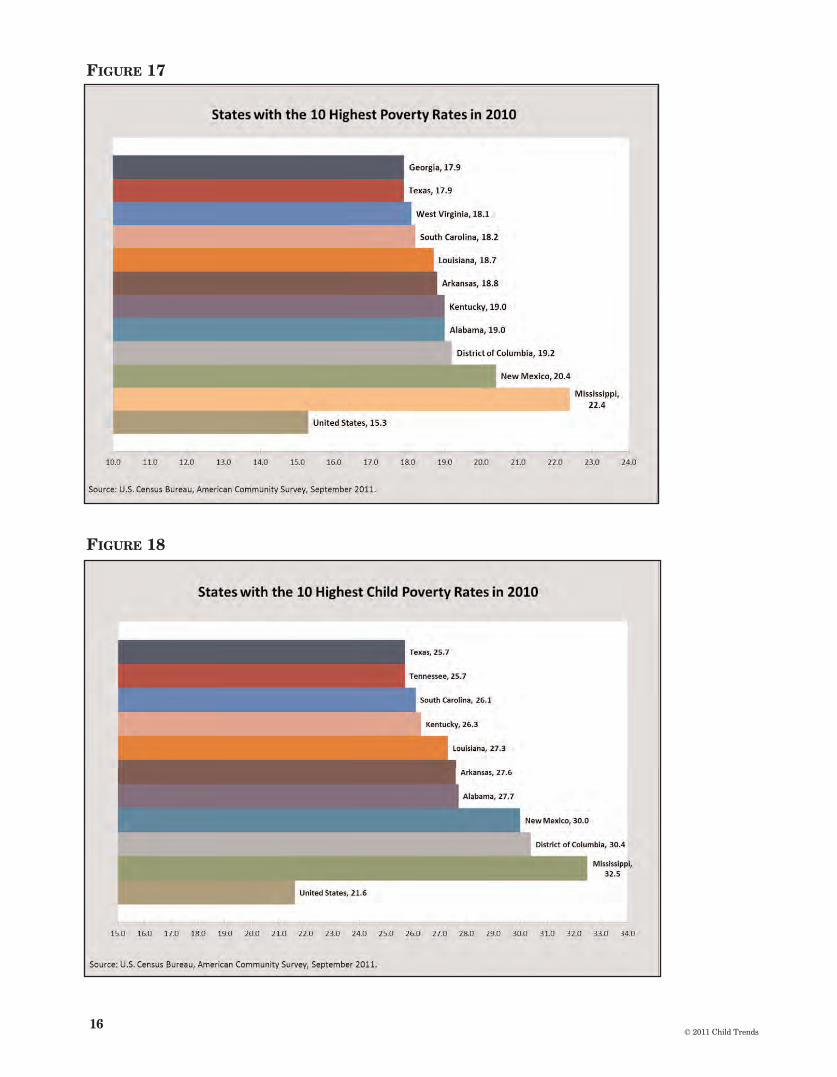
FIGURE 18
FIGURE 17
16© 2011 Child Trends

FIGURE 19
© 2011 Child Trends 17