Embed Size (px)
Citation preview

Technical Report 2101 I - >, '1' {' j - ,-
I ~_.. i_I -..., I~~ _ /" : of .... / .... ~ -
i J~ I'~"''' - l 1_ ' ___ -"
NASA-CR-169875 19830009183
Researc:h alrldll·e.~hnCltllogy Plrol~lrlam lPerspec~tivE~:S f(Jtr IGen.:l~ral Aviati(,n and Cornml~ltter A.ircrCJl'ft
Final Report
James s. Bauchspie's William E. Simpson
September 198~~
1111111111111 1111 11111 1111111111 1111111111111 NF02604
Prepared Under Contract No. NASW-3::554
for
National Aeronautics and Space Administration Washington, D.C. 203m,
https://ntrs.nasa.gov/search.jsp?R=19830009183 2018-07-11T18:29:13+00:00Z
ORI Silver Spring, Maryland 20910
RESEARCH AND TECHNOLOGY PROGRAM PERSPECTIVES FOR GENERAL
AVIATION AND COMMUTER AIRCRAFT
FINAL REPORT
JAMES S. BAUCHSPIES WILLIAM E. SIMPSON
SEPTEMBER 1982
PREPARED UNDER CONTRACT NASH-3554 FOR
NATIONAL AERONAUTICS AND SPACE ADMINISTRATION HASHINGTON J D.C. 20305
PREFACE
This report on "Research and Technology Program Perspectives for General Aviation and Commuter Aircraft" presents the results of ORIls data collection efforts and analysis of the uses, benefits and technology needs of the U.S. general aviation industry in light of growing competition from foreign general aviation manufacturers, especially in the commuter and business jet aircraft markets.' This work was conducted to support continuing assessments by NASAls Office of Aeronautics and Space Technology (OAST) of factors affecting the need for aeronautical research applicable to general aviation technology and related planning of research and technology (R&T) programs.
The scope of this effort was limited to the review and analysis of available published information. This information was supplemented by discussions with members of the General Aviation Manufacturers Association (GAMA) and the U.S. aircraft industry. However, it became readily apparent more indepth investigation is required especially in the areas of the ability of U.S. manufacturers to conduct needed research in-house and the capabilities of foreign manufacturers as well as the support they receive from their governments.
Conclusions and recommendations for further effort are presented. This effort was accomplished by ORI, Inc. under NASA Contract NASW-3554. Contributions by Dr. Jan Roskam on technology needs and capabilities of U.S. general aviation manufac+urers are gratefully acknowledged.
i

This Page Intentionally Left Blank
1.
II.
III •
IV.
PREFACE. • • • . •
TABLE OF CONTENTS.
LIST OF FIGURES. •
TABLE OF CONTENTS
. . . . . . . . . . . . . . . . . .
. . . . . . . . LIST OF TABLES •
EXECUTIVE SUMMARY.
. . . . . . . . . . . . . . . . . . . . . . .
INTRODUCTION • • • • • • • • • • • • • • • • • •
MAJOR ELEMENTS IN GENERAL AVIATION • • • • • • •
COMPOSITION OF GENERAL AVIATION • •
GROWTH OF GENERAL AVIATION. • •
USES OF GENERAL AVIATION. . •
ECONOMIC FACTORS IN GENERAL AVIATION • •
GENERAL AVIATION EMPLOYMENT • •
AIRCRAFT PRODUCTION AND SALES • .
FUEL PRICES AND DISTRIBUTION. .
SAFETY FACTORS IN GENERAL AVIATION • .
INTRODUCTION. • • • • • .
ACCIDENT STATISTICS • •
iii
. . .
Page
i
iii
vi
viii
ES-l
1-1
2-1
2-1
2-4
2-6
3-1
3-1
3-2
3-6
4-1
4-1
4-1
V.
VI.
VII.
VIII.
TABLE OF CONTENTS (CONTINUED)
ACCIDENT CAUSAL FACTORS. • • • •
IMPACT OF U.S. GOVERNMENT POLICIES ••
. . . . . .
AIRLINE DEREGULATION • • •
ENVIRONMENTAL CONTROL ••• . . . . . . . IMPACT OF INCREASING FOREIGN COMPETITION. • •
OVERVIEW OF CURRENT AND PROJECTED GENERAL
· . . . · . .
Page
4-7
5-1
5-1
•• 5-9
6-1
AVIATION AND COMMUTER MARKETS. • • • • • • • • • •• 6-2
FOREIGN GENERAL AVIATION AIRCRAFT.
FOREIGN GOVERNMENT SUPPORT • • • • •
U.S. MANUFACTURERS TECHNOLOGICAL NEEDS AND CAPABILITIES. • • • • • • • • • • • • • •
. . .
· . . .
6-10
6-19
7-1
U.S. MANUFACTURERS TECHNOLOGY NEEDS. • • • •• 7-1
U.S. MANUFACTURERS CAPABILITIES TO CONDUCT NEEDED RESEARCH AND DEVELOPMENT IN-HOUSE • • 7-3
NASA'S ROLE IN GENERAL AVIATION TECHNOLOGY. • • 7-5
CONCLUSIONS AND RECOMMENDATIONS • • . • • • • • • • •
CONCLUSIONS. • .
RECOMMENDATIONS. •
. . . . . . . .
APPENDIX A: OVERVIEW OF FOREIGN GENERAL AVIATION
8-1
8-1
8-2
AIRCRAFT MANUFACTURERS • • • • • • • •• A-I
APPENDIX B: AIRCRAFT CHARACTERISTICS AND PERFORMANCE FACTORS. • • • • •
iv
B-1
TABLE OF CONTENTS (CONTINUED)
APPENDIX C: GROUP FOR AERONAUTICAL RESEARCH AND TECHNOLOGY -- EUROPE (GARTEUR). • . • C-1
APPENDIX D: EXCERPT FROM THE REPORT TO THE WORKSHOP BY THE PANEL ON GENERAL AVIATION, AERONAUTICS AND SPACE ENGINEERING BOARD, ASSEMBLY OF ENGINEERING NATIONAL RESEARCH COUNCIL: ENTITLED: NASAls ROLE IN AERONAUTICS: A WORKSHOP VOLUME IV - GENERAL AVIATION •• D-1
v

vi

Figure
ES.1
ES.2
ES.3
ES.4
ES.5
2.1
2.2
2.3
2.4
2.5
3.1
3.2
LIST OF FIGURES
u.S. General Aviation Aircraft Unit Shipments 1970-1981. • • • • • • • • • . . . . . . . . . U.S. General Aviation Aircraft Factory Sales 1970-1981 •••••••••••• . . . General Aviation Accident Rates Per 100,000 Aircraft - Hours Flown by Kind of Flying 1976-1979 •.•••••••••••••
U.S. and Foreign Commuter Aircraft in Production or Development •••.•••
General Aviation Contributions to U.S. Trade Balance •••••••••••
Major Elements in General Aviation •
Growth of General Aviation Fleet and Annual Hours Flown, 1975-1982 .••
Major Uses of General Aviation ••.
Commuter Passenger Enplanements 1970-1981 ••
Commuter Cargo Loadings 1970-1981. .
. . . . . .
U.S. General Aviation Aircraft Unit Shipments 1970-1981 ••••••••• . . . . . . . . . . U.S. General Aviation Aircraft Factory Sales 1970-1981 ••.••.•...•.
vii
ES-4
ES-5
ES-8
ES-13
ES-15
2-2
2-5
2-6
2-14
2-14
3-3
3-4
Figure
3.3
4.1
4.2
4.3
5.1
6.1
6.2
LIST OF FIGURES (CONTINUED)
Trends in Aviation Fuel Prices. . • •.•••••
General Aviation Accident Rates Per 100,000 Aircraft - Hours Flown by Kind of Flying 1976-1979 •
Ten Most Prevalent Accident Types for U.S. General Aviation 1979 VS. 5-Year Average. • •
Ten Most Prevalent Fatal Accident Types for U.S. General Aviation 1979 VS. 5-Year Average
Safety Regulations Related to Aircraft Size.
General Aviation Contributions to U.S. Trade Balance •••••••••••••
U.S. and Foreign Commuter Aircraft in Production or Development •.•••.
v;;;
. . .
. . .
Page
3-7
4-6
4-10
4-11
5-7
6-8
6-11

ix
Table
ES.1
ES.2
ES.3
ES.4
ES.5
ES.6
2.1
2.2
2.3
2.4
LIST OF TABLES
Estimated U.S. General Aviation Active Fixed-Wing Aircraft by Aircraft Category (Number in Thousands) ••••••••••.•••••••••
Accidents, Fatalities, Rates U.S. General Aviation 1972-1981 • • • • • • • • • • • • • • • • • • •
Ten Most Frequently Cited Cause Factors of Nonfatal Accidents in 1979 • • • • • • • • • •
. . .
Ten Most Frequently Cited Cause Factors of Fatal Accidents in 1979 •••••••••• . . . . U.S./World Market Forecast for Light Transport Aircraft 1980-2000 ••••••.•.•••••
U.S. Market Share of Li~ht Transport Aircraft (Percent of Total Units) ••••••••••••
Estimated U.S. General Aviation Active Fixed-Wing Aircraft by Aircraft Category (Number in Thousands) •..••....•..•...•.••
Number of Fixed-Wing Business Aircraft in Service by Calendar Years 1976-1980 •..•••..
Regional/Commuter Passenger Aircraft Fleet in 1981 . . . . . . . . . . . . . . . . . . . . . . . . Commuter Cargo Fleet in 1981 •......••
x
ES-3
ES-7
ES .. 9
ES-9
ES-12
ES-12
2-3
2-8
2-12
2-13

Table
3.1
4.1
4.2
4.3
4.4
4.5
6.1
6.2
6.3
6.4
6.5
LIST OF TABLES (CONTINUED)
Summary of 1981 Shipments and Billings of Business and Utility Fixed-Wing Aircraft U.S. Manufacturers.
Accidents, Fatalities and Rates Commuter Air Carriers 1977-1981 ••••••.•••••••
Accidents, Fatalities, and Rates On-Demand Taxis 1977-1981 •••••.•••.•••
Accidents, Fatalities, Rates U.S. General Aviation 1972-1981 •••••••••••••
Ten Most Frequently Cited Cause Factors of Nonfatal Accidents in 1979 •••.•.•••
Ten Most Frequently Cited Cause Factors of Fatal Accidents in 1979 •••.••••.•
Light Transport Market Share (Percent of Total)
U.S./World Market Forecast for Light Transport Aircraft 1980-1000 .•••.•••.•.••••
U.S. Market Share of Light Transport Aircraft (Percent of Total Units).
Commuters . • . . . . . . • .
Turboprop Business Aircraft.
xi
3-5
4-2
4-3
4-4
4-8
4-9
6-3
6-5
6-5
6-12
6-14

Table
6.6
6.7
6.8
6.9
A.I
A.2
A.3
B.1
B.2
B.3
LIST OF TABLES (CONTINUED)
Turbojet/Turbofan Business Aircraft •••••••
Survey of Current and Prototype Foreign Commuter Ai rcraft . . . . . . . . . . . . . . . . . . . .
Foreign Commuter A1rcraft Manufacturers and the Nature of the1r Government Aviation Pol1cies and Influence ••••••••••••••••••
· . . · . .
· . . Government Part1c1pat1on 1n Foreign Aeronautics Industr1es •••••••••••• . . . . EMBRAER Aircraft Product1on •••••••
EMBRAER's Evolut1on (1970-1981).
. . . .
EMBRAER Production Forecast (Summary for 1981-1985) .•
Commuters ..•••
Turboprop Business Aircraft.
Turbojet/Turbofan Business Aircraft.
xii
. . . .
Page
6-16
6-18
6-21
6-23
A-5
A-6
A-7
B-5
B-6
B-7
EXECUTIVE SUMMARY
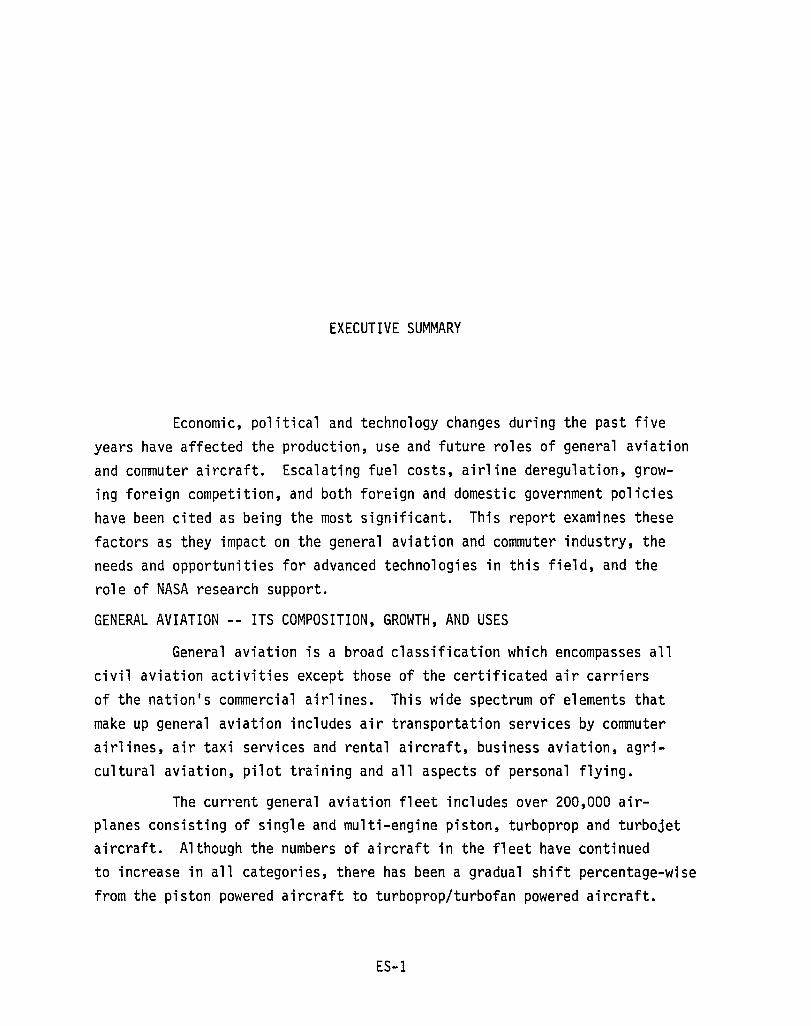
Economic, political and technology changes during the past five years have affected the production, use and future roles of general aviation and commuter aircraft. Escalating fuel costs, airline deregulation, growing foreign competition, and both foreign and domestic government policies have been cited as being the most significant. This report examines these factors as they impact on the general aviation and commuter industry, the needs and opportunities for advanced technologies in this field, and the role of NASA research support.
GENERAL AVIATION -- ITS COMPOSITION, GROWTH, AND USES
General aviation is a broad classification which encompasses all civil aviation activities except those of the certificated air carriers of the nation's commercial airlines. This wide spectrum of elements that make up general aviation includes air transportation services by commuter airlines, air taxi services and rental aircraft, business aviation, agricultural aviation, pilot training and all aspects of personal flying.
The current general aviation fleet includes over 200,000 airplanes consisting of single and multi-engine piston, turboprop and turbojet aircraft. Although the numbers of aircraft in the fleet have continued to increase in all categories, there has been a gradual shift percentage-wise from the piston powered aircraft to turboprop/turbofan powered aircraft.
ES-1
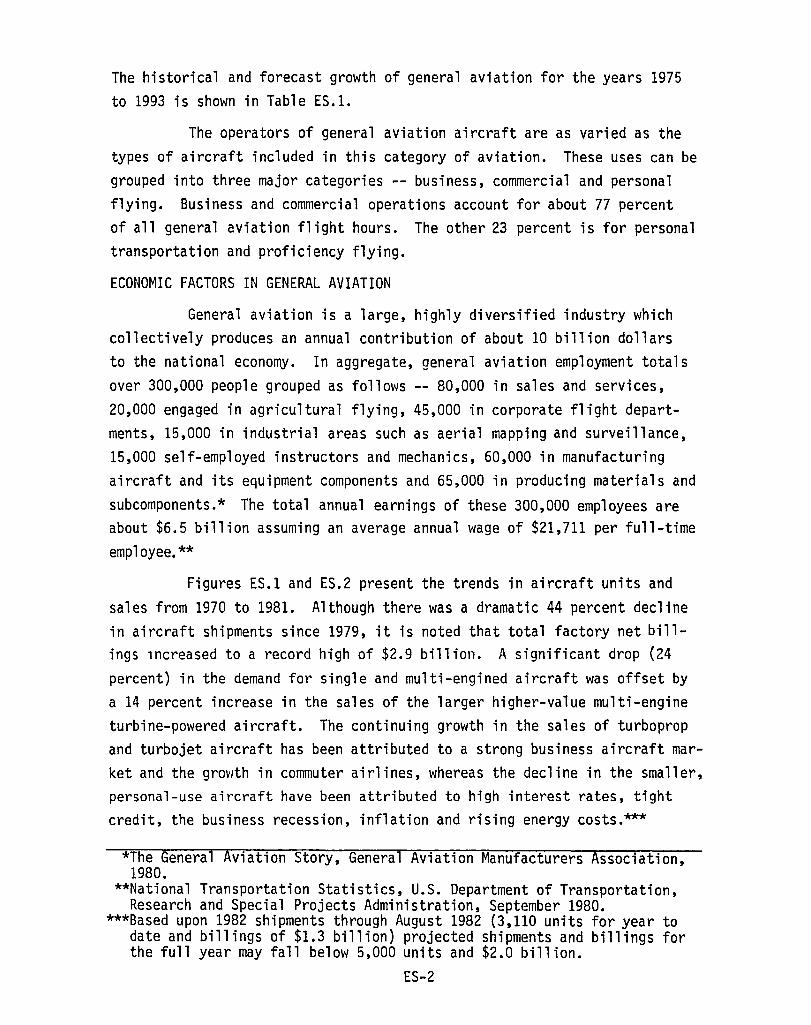
The historical and forecast growth of general aviation for the years 1975 to 1993 is shown in Table ES.1.
The operators of general aviation aircraft are as varied as the types of aircraft included in this category of aviation. These uses can be grouped into three major categories -- business, commercial and personal flying. Business and commercial operations account for about 77 percent of all general aviation flight hours. The other 23 percent is for personal transportation and proficiency flying.
ECONOMIC FACTORS IN GENERAL AVIATION
General aviation is a large, highly diversified industry which collectively produces an annual contribution of about 10 billion dollars to the national economy. In aggregate, general aviation employment totals over 300,000 people grouped as follows -- 80,000 in sales and services, 20,000 engaged in agricultural flying, 45,000 in corporate flight departments, 15,000 in industrial areas such as aerial mapping and surveillance, 15,000 self-employed instructors and mechanics, 60,000 in manufacturing aircraft and its equipment components and 65,000 in producing materials and subcomponents.* The total annual earnings of these 300,000 employees are about $6.5 billion assuming an average annual wage of $21,711 per full-time employee.**
Figures ES.1 and ES.2 present the trends in aircraft units and sales from 1970 to 1981. Although there was a dramatic 44 percent decline in aircraft shipments since 1979, it is noted that total factory net billings lncreased to a record high of $2.9 billion. A significant drop (24 percent) in the demand for single and multi-engined aircraft was offset by a 14 percent increase in the sales of the larger higher-value multi-engine turbine-powered aircraft. The continuing growth in the sales of turboprop and turbojet aircraft has been attributed to a strong business aircraft market and the gro~lth in commuter airlines, whereas the decline in the smaller, personal-use aircraft have been attributed to high interest rates, tight credit, the business recession, inflation and rising energy costs.***
*The General Aviation Story, General Aviation Manufacturers Association, 1980.
**National Transportation Statistics, U.S. Department of Transportation, Research and Special Projects Administration, September 1980.
***Based upon 1982 shipments through August 1982 (3,110 units for year to date and billings of $1.3 billion) projected shipments and billings for the full year may fall below 5,000 units and $2.0 billion.
ES-2

Year as of
TABLE ES.1
ESTIMATED U.S. GENERAL AVIATION ACTIVE FIXED WING AIRCRAFT BY AIRCRAFT CATEGORY (Number in Thousands)
Piston Powered Total Fixed Single Multi-
January 1 \~ing Engine Engine Turboprop Turbojet
Historical
1975 154.9 131. 5 19.7 2.1 1.6 1976 161.1 136.6 20.3 2.5 1.7 1977 170.5 144.8 21.3 2.5 1.9 1978 176.0 149.3 21.5 2.9 2.3 1979 189.5 160.7 23.2 3.1 2.5 1980 199.7 168.4 25.1 3.5 2.7 1981E 203.1 170.2 25.4 4.3 3.2
Forecast
1982 208.6 173.9 26.6 4.8 3.3 1983 214.2 178.0 27.6 5.2 3.4 1984 220.5 182.7 28.6 5.6 3.6 1985 228.3 188.9 29.6 6.0 3.8 1986 236.3 195.2 30.7 6.4 4.0 1987 245.8 203.0 31.8 6.8 4.2 1988 255.9 211.2 33.1 7.2 4.4 1989 268.0 221.1 34.6 7.6 4.7 1990 282.5 233.0 36.4 8.0 5.1 1991 298.2 245.8 38.4 8.5 5.5 1992 314.3 259.0 40.4 9.0 5.9 1993 330.9 272.7 42.4 9.5 6.3
SOURCE: FAA E - Estimate
ES-3

Scale In
Thousands
20
18
16 f-u. <x: a: 14 u a: ~ u. 12 0 a: 10 UJ co ~ ::J 8 z
6
4
2
0 1970 1971
Source GAMA
TOTAL FACTORY 17,811
SHIPMENTS ~ 15,449
14,166 14,056 13,646
DOMESTIC MARKET
4,248
1972 1973 1974 1975 1976 1977 1978
CALENDAR YEARS
FIGURE ES.l. U.S. GENERAL AVIATION AIRCRAFT UNIT SHIPMENTS 1970-1981
ES-4
1979 1980 1981

CJ)
z 0 :J .....I
~ z -0
3000
2800
2600
2400
2200
2,000
1800
1600
1400
1200
1000
800
600
400
200
TOTAL FACTORY BILLINGS
DOMESTIC MARKET
1970 1971 1972 1973 1974 1975 1976 19n 1978 1979 1980 1981
CALENDAR YEARS Source: GAM A
FIGURE ES.2. U.S. GENERAL AVIATION AIRCRAFT FACTORY SALES 1970-1981
ES-5

SAFETY FACTORS IN GENERAL AVIATION
The accident rate for general aviation (excluding commuter air carriers and air taxi) was 10.0 acciden~~ per 100,000 aircraft flight hours in 1981, an increase from the record low of 9.6 achieved in 1980 ending a continuous decline from 16.8 in 1972 (Table ES.2). In 1981, the National Transportation Safety Board (NTSB) reported commuter air carrier and ondemand air taxi accidents as separate categories from general aviation. The 1981 accident rates for commuter air carriers and air taxis were 2.59 and 3.74, respectively.
Accident rates for commuter air carriers and corporate/executive aircraft flying with professional crews are significantly lower than the totals for all general aviation flying (see Figure ES.3). Personal transportation and aerial application had the highest accident rates.
The cause of general aviation accidents continue to be dominated by weather and pilot error (Tables ES.3 and ES.4). These tables summarize the NTSB findings of the ten most frequently cited factors for both nonfatal and fatal general aviation accidents in 1979, the most recent annual accid~nt ~ata analyzed hy the National Transportation Safety Qoard.
IMPACT OF U.S. GOVERNMENT POLICIES
Airline deregulation and environment controls are two areas where recently enacted government policies have had an impact on the composition of the general aviation fleet and/or needs for improved technology. The greatest impact on general aviation from the Airline Deregulatlon Act of 1978 is on the high performance segments of the market -- business aviation and the commuter airlines. To some extent the strong market for business aircraft is partially attributed to reduced airline services, but probably more directly related to time efficient direct routings and travel flexibility. The policy changes which have major impact on commuter airlines appear to include the following areas:
• Liberalized process for market entry and exit, • Essential air services to small communities, • Increased allowable commuter aircraft size, and • Guaranteed aircraft loans.
ES-6

ACCIDENTS
YEAR TOTAL2 FATAL2
TABLE ES.2
ACCIDENTS, FATALITIES, RATES U. S. GENERAL AVIATION1
1972 - 1981
AIRCRAFr4 FATALITIES HOURS FLOWN
ACCIDENT RATES PER 100,000
AIRCRAFT HOURS FLOWN
TOTAl FATAL
1
1972 4109 653 130503 24,419,000 16.8 2.67
1973 4090 679 1299 26,907,800 15.2 2.52 , 1974 4234 689 1327 27,773,500 15.2 2.47
1975 4034 638 1247 28,335,700 14.2 2.24
1976 4005 648 1187 29,975,200 13.3 2.15
1977 4069 658 1281 31,584,600 12.9 2.08
1978 4223 723 15633 34,985,399 12.1 2.07
1979 3800 629 1219 38,767,481 9.8 1.62
1980P 3599 629 1264 37,480,076 9.6 1.68
1981P 3634 662 1265 36,280,000 10.0 1.82
P Preliminary Data
1 Table does not include accidents for Air Taxi and Commuter Air Carrier aircraft.
2 Suicide/sabotage accidents included in all computations except rates {1972-3, 1973-2, 1974-2, 1975-2, 1976-4, 1977-1, 1978-2, 1979-0}.
3 Includes air carrier fatalities {1972-5, 1978-142} when in collision with General Aviation aircraft.
4 Source of estimate: FAA
SOURCE: National Transportation Safety Board, Safety Information Release, January 28, 1982.
ES-7

w
~ ~ z w C U u c:t ....... ~ o ~
350~----------------------------------------------~
30.0
250
Pleasure
200 2037 '\. --____ " 1845 19.13
~~~~---------~~~ --__ 17.40 ---1697
I 1644
150 Aenal Application
U.S General AVIation-
100
12.6 I __ .... ,....-- ____ ~ 11.4 - -----..IlL InstructIOnal ~ _
~9 ___ ~ __ ~ _______ ~~ _________ 928
------
12.0
~r Taxi 2 606 7.85 4 76 \. 5 16 • _ • _ • _ • .-.- • _ • _ • _ • 488
50 ~ ~.--- ----• - • - • • - • - • 3 89 3.49 BUSIness
4 06 It 0 / 2.80 Corporate/ExecUtIve 1 51 1 78
143" __. 1)--- _ - ~ __ -"-4lI---- 1 68 ------4
1976 1977 1978 1979
YEARS
SOURCE: ~Jational Transportation Safety Board. November 5, 1981 Analysis.
1Includes Commuter Air Carrier and Air Taxi Accidents. 2Includes Commuter Air Carrier Accidents.
FIGURE ES.3. GENERAL AVIATION ACCIDENT RATES PER 100,000 AIRCRAFT - HOURS FLOWN BY KIND OF FLYING
1976 - 1979
ES-8

TABLE ES.3
TEN MOST FREQUENTLY CITED CAUSE FACTORS OF NONFATAL ACCIDENTS IN 1979
Cause Factors Freguency Percent
Pilot - Inadequate Preflight Preparation or Planning 399
Miscellaneous Acts, Conditions Overload Failure 334
Terrain - High Obstructions 293 Weather - Unfavorable Wind Conditions 263 Pilot - Mismanagement of Fuel 245 Pilot - Failed to Obtain/Maintain
Flying Speed 240 Pilot - Selected Unsuitable Terrain 224 Powerplant - Failure for Undetermined
Reasons 208 Miscellaneous Acts, Conditions
Fuel Exhaustion 208 Miscellaneous Acts, Conditions
Material Failure 203
TABLE ES.4
TEN MOST FREQUENTLY CITED CAUSE FACTORS OF FATAL ACCIDENTS IN 1979
11.93
9.99 8.76 7.86 7.32
7.17 6.70
6.22
6.22
6.07
Cause Factors Freguency Percent
Weather - Low Ceiling 170 Pilot - Continued VFR Flight
Into Adverse Weather Conditions 131 Pilot - Failed to Obtain/Maintain
Flying Speed 131 Weather - Fog 122 Pilot - Inadequate Preflight Preparation
or Planning 90 Pilot - Spatial Disorientatlon 86 Terrain - High Obstructions 77 Miscellaneous Acts, Conditions
Unwarranted Low Flying 58 Weather - Rain 49 Pilot - Improper Inflight Decisions or
Pl anm ng 44
SOURCE: National Transportation Safety Board, Annual Review of Aircraft Accident Data-U.S. Gener~l Avi~tion, r~l@nrlar yp~r 1~;S Data, Published November 5, 1981.
ES-9
25.07
19.32
19.32 17.99
13.27 12.68 11.37
8.55 7.23
6.49

The principal environmental concern impacting on general aviation is associated with noise. Public objections to high-noise areas near major air carrier airports provided impetus in the 1970's for the Federal government to include noise abatement measures in aircraft airworthiness standards and airport approach and departure paths to reduce the impact of aircraft noise around those airports. Such regulatory measures and implementations of noise reduction technology have been primarily oriented toward reducing the impact of noise around commercial air carriers airports, but general aviation airport noise is also a growing environmental concern.
The FAA has established noise standards (FAR Part 36) to limit the noise levels of new design and new production aircraft, including small propeller-driven aircraft as well as jet aircraft. Although there is a considerable body of aircraft noise technology, with much of this technology based on research and technology sponsored by NASA and other government agencies, it is considered vital that cont~nued progress be made on research efforts for reducing engine noise.
IMPACT OF INCREASING FOREIGN COMPETITION
The United States general aviation industry is experiencing very challenging international competition, particularly in the commuter aircraft and business Jet areas. Foreign governments have targeted these areas as matters of national priority. Manufacturers in eleven countries have announced plans for new larger aircraft and are aggressively marketing the U.S. since they see the majority of these sales will be here.
Virtually all foreign manufacturers receive the strong support of their governments. This assistance takes a number of forms -- research and development grants, loans, provision of facilities, funding incentives, etc. Consequently, U.S. manufacturers are competing against foreign manufacturers who, since they are underwritten by their governments, are able to undertake the economic risk in the development of new aircraft types when the market is still ill-defined or when the necessary investment is above that which the U.S. private sector is able or willing to meet.
A review of the current commuter aircraft fleet both U.S. and worldwide indicates the major competitors to the U.S. commuter aircraft
ES-10

industry are France, Great Britain, Spain, Canada, the Netherlands and Brazil. Future commuter aircraft, currently under development, will bring strong competition from Great Britain, Canada, Germany, Brazil, Sweden, a team of France and Italy, and a team of Spain and Indonesia.
A forecast of the market for light transports for the years 1980-2000 is sho\~n in Tables ES.5. The U.S. made up 28 percent of this market in 1978 as shown in Table ES.6. The most dramatic increase in the U.S. commuter market \~ill be in the 20-40 passenger aircraft. Figure ES.4 presents a scattergram of current and future aircraft options for the commuter market by number of seats and year of introduction. U.S. aircraft are shown by a solid circle, foreign aircraft by an open circle and a joint U.S./ Sweden venture by a half circle. It is readily apparent that the larger (>19 seats) market is dominated by the foreign manufacturers with the only new U.S. models envisioned for the eighties being the CAC-100, the Ahrens 404 and the joint U.S./Sweden SF-340. The situation becomes even more serious when one considers there are no confirmed orders for either the CAC-100 or the Ahrens 404.
The business aircraft picture is much more encouraging than the commuters with manufacturers from France, Great Britain, Israel, Canada, and Japan presenting the greatest challenge to the U.S. Of seventeen current and projected turboprops, thirteen are manufactured in the U.S. Of the four foreign aircraft, two will be assembled in the U.S. and one, the Lear Fan, is a U.S. design to be built in Northern Ireland. Half of the turbofan designs available to the business customer are to be built in the U.S. Of the foreign models, the Falcon and Diamond I are to be assembled in the U.S. and the CL-600 is based upon a Lear design.
The production of light general aviation aircraft is dominated by three firms, Cessna Aircraft Company, Beech Aircraft Corporation and Aircraft Corporation. In 1980, these manufacturers accounted for 92 cent of the new aircraft shipped and 67 percent of the net billings.
Piper perU.S.
worldwide sales in 1980 consisted of 11,877 units. France, second to the U.:. in worldwide sales, delivered 591 light piston aircraft in 1980.
ES-11

TABLE ES.5
U.S./WORLD MARKET FORECAST FOR LIGHT TRANSPORT AIRCRAFT 1980-2000
PASSENGER TOTAL VALUE OF SEATING U.S. UNIT INTERNATIONAL UNIT SHIPMENTS 1
CAPACIY SALES UNIT SALES WORLDWIDE $ MILLIONS
15-19 1,050 1,137 2,187 3,065
20-40 898 1,098 1,996 6,895
41-60 425 790 1,215 6,685
Total All Aircraft 2,373 3,025 5,398 16,645
1CAA Estimated value in constant 1980 U.S. Dollars
SOURCE: Light Transport Market Forecast Report prepared for the Office Of Aviatl0n Policy, Federal Aviation Administration, Washington, D.C. by the Aerospace Corporation, July 1979.
saURCE:
TABLE ES.6 U.S. MARKET SHARE OF LIGHT TRANSPORT AIRCRAFT
(Percent of Total Units) Passenger Seating Capacity 1978 1980-2000
15-19 44 48
20-40 25 45
41-60 22 35
TOTAL 28 44
Lioht Transport MarKet Forecast Reiort prepared for the Office of Aviation Po' icy, Federal Aviationdministration, Washington, D.C. by the Aerospace Corporation, July 1979.
ES-12

60 .US o Foreign
50 1 ® ® • 24
~ 40 (J co
~ ~~ ~ 30 -.-.-.-.-.-.-.-.-.-.-.-.-.-.-.-.-.~.-.-.-.-.-... -.~
en @ 14
20 -------------W--~-,.®-0---®-@"---~----
o
1960 1965 1970 1975 1980 1985
Year Aircraft Went or Will Go Into Service
1. Fokker F·27 (Netherlands) 13. Arava 101 B (Israel)
2. BAe 748 (UK) 14. AR 404 (US)
3. OHC-6 (Canada) 15. Do 228·100 (W. Germany)
4. Beech 99 (US) 16. Do 228·200 (W. Germany)
5. Metro (US) 17. BAe Jetstream 31 (UK)
6. BN Trislander (UK) 18. SO 360 (UK)
7. EMB 110 (Brazil) 19. OHC-8 (Canada)
8. SO 330 (UK) 20. SF-340 (Sweden/US)
9. OHC-7 (Canada) 21. EMB 120 (Brazil)
10. Nomad 22B (Australia) 22. ATR 42 (France/ltaly)
11. Nomad 24A (Australia) 23. CN 235 (Spain/lndonesia)
12. CAS A 212-200 (Spain) 24. CAC 100 (US)
FIGURE ES.4. U.S. AND FOREIGN COMMUTER AIRCRAFT IN PRODUCTION OR DEVELOPMENT
ES-13

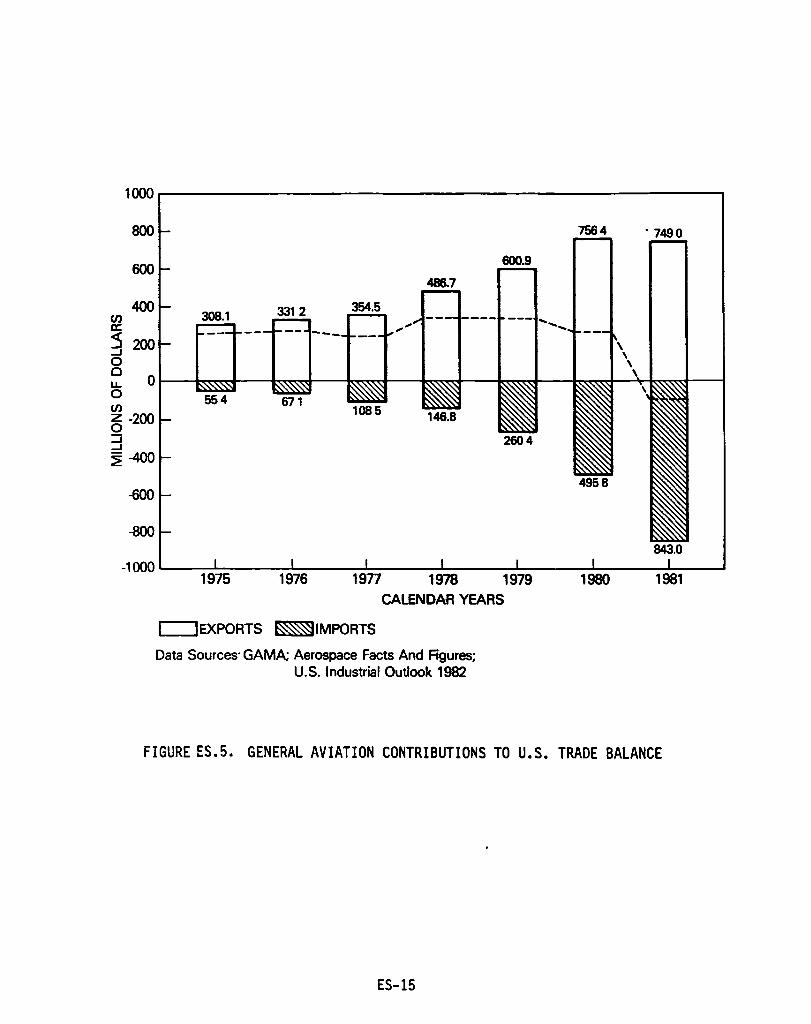
Over 90 percent of the 280,000 general aviation aircraft in the worldwide civil aircraft fleet were manufactured in the United States. In 1981, American manufacturers exported about 24 percent of the general aviation aircraft produced in the United States. The value of these general aviation exports was $749 million in 1981, a slight decrease of about one percent compared to the value of 1980 exports.
General aviation aircraft imports in 1981 reached a record level of $843 million. As indicated in Figure ES.5, general aviation exports contribute to the U.S. trade balance, but in recent years the net value of that contribution has declined from about $340 million in 1978 and 1979 to a deficit in 1981. This decline in trade balance is largely attributed to increases in imported aircraft deliveries to U.S. operators of multi-engine light transport aircraft and business jets which are the high value general aviation aircraft.
An in-depth analysis of the foreign aircraft was considered beyond the scope of this report. However a review of available literature reveals that the technology currently incorporated into the foreign built aircraft does not appear to surpass that which is now incorporated in the U.S. products. Instead, the greatest threat to the U.S. manufacturers is for markets for which the U.S. has previously offered no new developments -e.g., the 20-40 passenger aircraft for the emerging commuter market. The most common reason given for not venturing into some of the new market areas has been the inability or unwillingness of the U.S. private sector to accept the risk -- preferring instead to stay with proven aircraft concepts or product improvements to existing designs.
U.S. MANUFACTURERS TECHNOLOGY NEEDS
The needs of the general aviation industry for new technology have been identified by industry representatives at Congressional Hearings, industry meetings and workshops. The Workshop on the Role of NASA in Aeronautics which took place at Woods Hole, Massachusetts in 1980 pointed out that the U.S. preeminence in general aviation is being seriously challenged in the 1980's. The report cited several technological developments being
ES-14
1~~---------------------------------------------------.
800 7564 ·7490
600 600.9
486.7
400 308.1
354.5
-600
-800
-1~~--~------~------~----~------~------~------~--~ 1975 1976 19n 1978 1979 1980 1981
CALENDAR YEARS
c::::JEXPORTS ~IMPORTS
Data Sources· GAMA; Aerospace Facts And Figures; U.S. Industrial Outlook 1982
FIGURE ES.5. GENERAL AVIATION CONTRIBUTIONS TO U.S. TRADE BALANCE
ES-15

incorporated in the foreign designs and concluded that the U.S. must develop new technology if the U.S. general aviation industry is to produce technically superior aircraft to offset the subsidies granted the foreign manufacturers. The primary requirements for new technology for general aviation aircraft cited by the workshop are significant improvements in the areas of flight safety and fuel efficiency.
In Congressional testimony, the General Aviation Manufacturers Association has highlighted turbine engines, piston engines, propellers, spin research and low speed aerodynamics as critical areas for NASA to provide assistance to the general aviation industry. Avionics research was specifically excluded as being within its members I capability to conduct the needed research.
CAPABILITY OF U.S. MANUFACTURERS TO DEVELOP ADVANCED TECHNOLOGY IN-HOUSE
The U.S. general aviation industry has achieved a position of leadership in producing general aviation aircraft. To a large extent, this position of leadership is attributed to technical superiority achieved by its ability to effectively capitalize on NASA research results and applicable fall-out from military R&D. Further improvements are possible, however, the individual manufacturers have stated they are unable to commit adequate resources to high risk technology programs or to fulfill advanced technology needs due to their lack of the unique facilities and expertise which are available in NASA.
NASAlS ROLE IN GENERAL AVIATION
NASA is the logical organization to conduct general aviation research. It has the facilities, technical expertise and prestige necessary for such programs. Existing NASA facilities are applicable, the expertise is available in all the pertinent disciplines, and the agency has had great success in acting as a catalyst in assembling teams involving industry, government and the academic community to address specific problems of general interest.
The role of NASA in general aviation has diminished over the past few years with reductions in many of the aeronautical research programs directed specifically towards general aviation. A viable program
ES-16
which adequately supports the general aviation industry's needs for ad-vanced technology is required to counter the threat from foreign manufacturers.
CONCLUSIONS
Based on the above, it is concluded that:
1. The U.S. general aviation industry provides a significant contribution to the national transportation system, the national economy, employment, and until last year, the balance of trade.
2. The preeminence of U.S. manufacturers of general aviation aircraft in world competitive markets is being eroded in the high-value business jet and light transport segments by competition from foreign manufacturers stimulated by foreign government support.
3. U.S. general aviation aircraft must incorporate advanced technology in their new developments to compete effectively for future markets at home or abroad.
4. A major problem facing the u.S. general aviation industry is an inability or unwillingness of the private sector to accept substantial risks associated with the development of advanced technology.
5. Available information does not provide a complete understanding of the U.S. general aviation industry's in-house capa
bilities, but it does indicate that the general aviation industry is unable to meet all of its needs for new technology in-house. Therefore, in order to meet its long term and high risk basic technology needs, this industry will require continued support from NASA's unique facilities and expertise.
ES-17

6. During the past few years, NASA's aeronautics efforts directed specifically toward general aviation issues and applications have declined, and remaining efforts are not currently adequate to support all known areas of technology needs or opportunities.
7. More extensive analysis is required to fully understand the support foreign governments give to their general aviation industries and its effect on U.S. competition. More analysis is also needed to evaluate properly the factors which may limit the incorporation of advanced technology in future U.S. aircraft.
RECOMMENDATIONS
Based on the above conclusions, it is recommended that:
1. An in-depth analysis be performed of the factors which may limit the U.S. general aVlation industry's future use of advanced technology. This analysis would also better ldentify areas of aeronautical R&T beyond the U.S. general aviation industry's capability to conduct in-house research.
2. An in-depth analysis of the foreign general aviation industry be accomplished to identify the total governmental support provided those manufacturers, the state-of-the-art of their general aviation/commuter aircraft capabilities, and a better assessment of their potential impact on the U.S. general aviation industry.
3. A comprehensive identification be made of the need for and importance of U.S. government (NASA) R&T which specifically addresses unique general aviation and commuter aircraft industry lssues and potentials, and which must be supported in order for the U.S. industry to achieve healthy and competitive capabilitles for the future.
ES-18

I. INTRODUCTION
This report presents an analysis of current factors influencing the outlook for general aviation and commuter aircraft, provides an overview of the needs and opportunities for advanced technologies in this field of aeronautics, and addresses the role of the National Aeronautical and Space Administration (NASA) in carrying out research activities oriented toward general aviation and commuter aircraft technology. In 1976, ORI, Inc. performed a general aviation analysis which concentrated on identification of major areas of emphasis for NASA research and technology programs in general aviation. 1 Changes in the economic environment, national policies, and technology during the past six years have affected the production, use, and outlook for general aviation and commuter aircraft. Factors of increasing significance in the 1980s include the cost and availability of aviation fuels, effects of airline deregulation on commuter air carriers and other elements of general aviation, growing foreign competition in business and commuter aircraft development, and both foreign and U.S. government policies which affect general aviation.
This analysis of general aviation, including the growing segment of commuter aircraft, is provided to support continuing assessments by NASA's Office of Aeronautics and Space Technology COAST) of factors
IGeneral Aviation Advocacy Theme, Office of Aeronautics and Space Administration, National Aeronautics and Space Administration, August 1976.
1-1
affecting the need for aeronautical research applicable to general aviation technology and related planning of research and technology (R&T) programs.
This report consists of eight chapters, including the introduction. Chapter II presents an overview of the composition of the various elements, growth, and uses of general aviation. Chapter III discusses economic factors related to general aviation. Chapter IV discusses recent accident statistics and major causes of accidents in general aviation. Chapter V discusses recently enacted government policies which impact on the planning of general aviation technology programs. The impact of increasing foreign competition on the general aviation industry in the United States is discussed in Chapter VI. This section of the report concentrates on the challenge to U.S. industry of foreign airframe manufacturers' developments in new aircraft for the commuter and business aviation markets. Chapter VII discusses the technology needs of U.S. manufacturers, their capabilities to conduct needed research and development in-house, and perceptions on NASA's role in general aviation technology. Conclusions and recommendations are presented in Chapter VIII.
1-2

II. MAJOR ELEMENTS IN GENERAL AVIATION
COMPOSITION OF GENERAL AVIATION
As illustrated in Figure 2.1, general aviation is a broad classification which encompasses all civil aviation activities except those of the certificated air carriers of the nation's commercial airlines. The wide spectrum of elements that make-up general aviation includes scheduled air transportation services by commuter airlines, air taxi services and rental aircraft, business aviation, agricultural aviation, pilot training, and all aspects of personal flying.
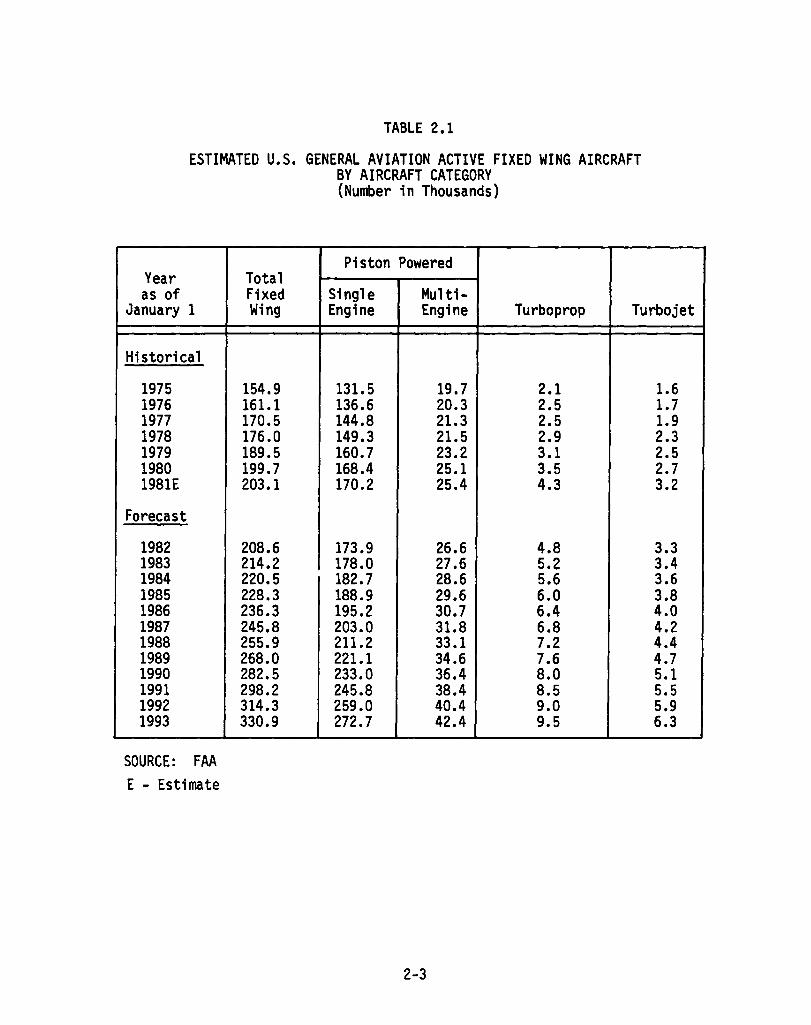
The types of aircraft used in general aviation activities also cover a wide operational spectrum from multi-engine jet-powered aircraft piloted by professional crews to amateur-built single-engine, piston-powered sport airplanes. Some elements of general aviation also use rotorcraft, but the scope of this report is limited to fixed-wing aircraft. Presently, the active general aviation fleet of over 200,000 airplanes accounts for about 98 percent of the active civil airplanes registered in the United States. A large majority of these aircraft are single-engine piston aircraft which comprise about 84 percent of the general aviation fixed-wing fleet. Higher performance and more costly mUlti-engine piston and turbine powered aircraft comprise the other 16 percent of the fleet. Table 2.1 presents annual estimates by aircraft categories for the period 1975-1993.
2-1

TRAINING
). ~)~rrlr· I 1f"7' 1
PERSONAL ~ ~ TRANSPORTATION AGRICULTURAL AVIATION
FIGURE 2 .. 1. MAJOR ELEMENTS IN GENERAL AVIATION
2-2
Year as of
TABLE 2.1
ESTIMATED U.S. GENERAL AVIATION ACTIVE FIXED WING AIRCRAFT BY AIRCRAFT CATEGORY (Number in Thousands)
Piston Powered Total Fixed Single Multi-
January 1 Wing Engine Engine Turboprop Turbojet
Historical
1975 1976 1977 1978 1979 1980 1981E
Forecast
1982 1983 1984 1985 1986 1987 1988 1989 1990 1991 1992 1993
SOURCE: FAA E - Estimate
154.9 131.5 161.1 136.6 170.5 144.8 176.0 149.3 189.5 160.7 199.7 168.4 203.1 170.2
208.6 173.9 214.2 178.0 220.5 182.7 228.3 188.9 236.3 195.2 245.8 203.0 255.9 211.2 268.0 221.1 282.5 233.0 298.2 245.8 314.3 259.0 330.9 272.7
19.7 2.1 1.6 20.3 2.5 1.7 21.3 2.5 1.9 21.5 2.9 2.3 23.2 3.1 2.5 25.1 3.5 2.7 25.4 4.3 3.2
26.6 4.8 3.3 27.6 5.2 3.4 28.6 5.6 3.6 29.6 6.0 3.8 30.7 6.4 4.0 31.8 6.8 4.2 33.1 7.2 4.4 34.6 7.6 4.7 36.4 8.0 5.1 38.4 8.5 5.5 40.4 9.0 5.9 42.4 9.5 6.3
2-3

GROWTH OF GENERAL AVIATION
General aviation is growing. Figure 2.2 shows the growth in the aviation fleet and annual hours flown for calendar years 1975-1981. The need for versatile and time efficient transportation is certainly a major factor in the growth of general aviation. It contributes to meeting this need through a variety of operators with access to nearly 13,000 landing facilities (including airports, stolports, and seaplane bases) within the United States and many more in other countries. At the end of 1980, there were 12,788 airports in the United States on record with the FAA.2 About 32 percent of these airports are publicly owned. Over 5,000 airports have runway lengths of 3,000 feet or more and about 500 have air traffic control towers.
The Federal Aviation Administration estimates that general aviation aircraft (including commuters and air taxis) accounted for about 84 percent of the 59 million civil aircraft operations (landings and take-offs) conducted during fiscal year 1981 at airports with FAA control towers. 3
In addition, it is estimated that about twice as many more general aviation operations were conducted at the many nontowered airports used by general aviation aircraft. Total civil aviation operations at airports with FAA
control towers are expected to increase about 79 percent to 107.9 million operations in fiscal year 1993. During the 1981-1993 time period, general aviation operations (including commuters and air taxis) are expected to increase from 49.5 million operations to 96.2 million operations annually, comprising about 95 percent of the expected growth in civil aircraft operations at airports with FAA traffic control services.
2FAA Statistical Handbook of Aviation, Calendar Year 1980. 3FAA Aviation Forecasts, Fiscal Years 1982-1983, FAA, February 1982.
2-4

230,000
220,000
200,000 ~ LL. <{ a: u a: 180,000 < LL. 0 a: w
160,000 ID ~ => z
140,000
01
I
I I 1 ~S~ .... I .........
1 .... '1 .... - .............. 1
I I Total Hours I I
Flown I
\/1 I
Total Active I /
" " 1975
,/
" /
I ,/
/
1976 1977 1978 1979
CALENDAR YEAR
1980 1981
Data Source FAA, AViation Data Service, Inc
FIGURE 2.2. GROWTH OF GENERAL AVIATION FLEET AND ANNUAL HOURS FLOWN, 1975-1982
2-5
1982
42,000,000
40,000,000
38,000,000
z ~
36,000,000 0 -I LL.
(f) a: => 0
34,000,000 :I: LL. 0 a: w
32,000,000 ID :::!!: => z
30,000,000
y;
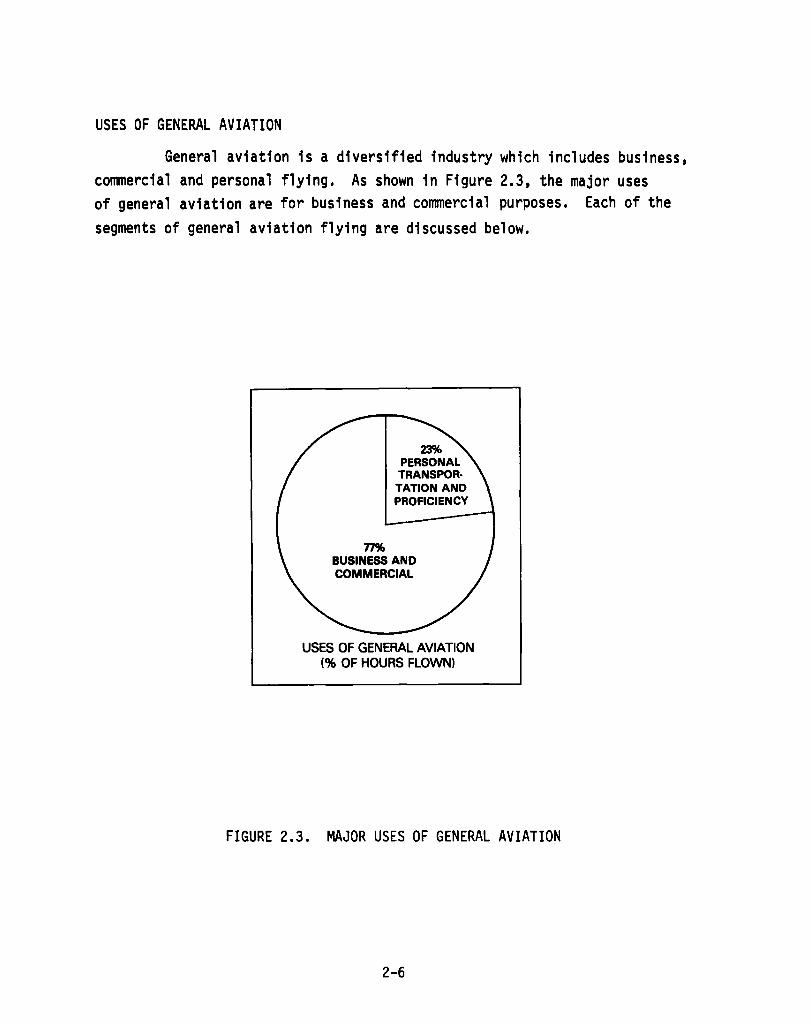
USES OF GENERAL AVIATION
General aviation is a diversified industry which includes business, commercial and personal flying. As shown in Figure 2.3, the major uses of general aviation are for business and commercial purposes. Each of the segments of general aviation flying are discussed below.
23% PERSONAL TRANSPOR· TATION AND PROFICIENCY
77% BUSINESS AND COMMERCIAL
USES OF GENERAL AVIATION (% OF HOURS FLOWN)
FIGURE 2.3. MAJOR USES OF GENERAL AVIATION
2-6
Bus1ness Av1at1on
Business flying; which includes all not-for-hire general aviation operations conducted for business reasons, constitutes the largest segment of general aviation flying. It accounted for about 34 percent of the hours flown in 1980.4 There are over 62,000 aircraft operated primarily for business reasons. About 22 percent of these business aircraft are corporate aircraft operated by professional crews. Business flying in general aviation aircraft provides flexible air transportation, time and fuel efficient direct routings, and access to many communities that lack adequate airline services.
In 1980, the over 62,000 business aircraft were operated by 36,000 companies. According to the National Business Aircraft Association (NBAA) a majority of the leading industrial companies in the United States operated aircraft as company owned and/or operated transportation vehicles dedicated to business activities. 5 These aircraft range in size from small single-engine piston-powered aircraft to large multi-engine jet transports. Two-thirds of the aircraft are single-engine piston-powered aircraft. While some large corporations operate several aircraft (the highest is 38), more than 60 percent of the 2,500 member companies of NBAA operate one aircraft. The company owned and/or operated aircraft is viewed by the business aviation industry as a practical business investment to provide on-demand transportation services which save time, improve efficiency, and reduce transportation costs.
Table 2.2 presents the number of business aircraft in service for years 1975-1980. The four-seat or more single-engine piston-powered airplane comprises the largest (over half) category of business aircraft, however, the highest rate of growth has been in mUlti-engine turbine-powered aircraft. During this six-year period the number of turboprop aircraft has doubled and the number of business jets has increased by 97 percent.
4General Aviation Activity and Avionics Survey, Annual Summary Report, (1980 Data), Report No. FAA-MS-81-5, Federal Aviation Administration, December 81.
5Business Flying, 1982-Section 1, National Business Aircraft Association, Inc.
2-7

TABLE 2.2
NUMBER OF FIXED-WING BUSINESS AIRCRAFT IN SERVICE BY CALENDAR YEARS 1976-1980
Al rcraft Category 1975 1976 1977 1978 1979
Single Engine Piston 1 to 3 seats 3,532 3,377 3,506 4,386 5,336 (% of Fleet) (7.2 ) (6.5) (6.3 ) (8.1 ) (8.7)
Single Engine Piston 4 Seats and CNer 30,428 32,060 34,094 30,378 36,128 (% of Fleet) (62.1 ) (61.4 ) (61.2 ) (56.2 ) (58.6 )
Multi-Engine Piston 12,273 13,193 14,055 14,840 15,277 (% of Fleet) (25.1 ) (25.2 ) (25.2) (27.4) (24.8)
Turboprops 1,508 1,942 2,138 2,500 2,800 (% of Fleet) (3.1 ) (3.7) (3.9) (4.6) (4 5)
TurboJet/Fan 1,249 1,666 1,914 2,028 2,075 (% of Fleet) (2.5) (3 2) (3.4) (3.7) (3.4)
Total No Aircraft 48,990 52,238 55,707 54,132 61 ,616 (100%) (100%) (100%) (100%) (100%)
Data Source 1978-1980, General Aviation Activity and Avionics, FAA 1975-1977, Aviation Data Service, Inc.
1980
4,985 (8.0)
36,589 (59 0)
14,988 (24.1 )
3,020 (4.9)
2,460 (4.0)
62,042 (100%)
6-Year % Chan~e
+41%
+20%
+22%
+100%
+97%
+27%
The continued growth in business aviation can be attributed to several factors. Some of the key factors are:
• Industrial decentralization
• Time-efficient, on-demand air transportation
• Effects of deregulation on airline services
• Cost effectiveness of company airplanes.
2-8
1

Industrial Decentralization. For the period 1975-1980, more than 1,000 new planes were located in small communities remote from convenient ground access to the nation's principal transportation hubs. This continuing trend of industrial decentralization to smaller cities and towns is attributed to local government industrial tax incentives, lower investment costs, availability of high quality labor, attractive living environment, and mobility provided by private as well as public conveyances. An important factor in industrial site selection is convenient access to air transportation facilities for business aviation, commercial airlines or both. With greater industrial decentralization the use of a company airplane for business travel becomes an attractive business investment. The business community pOints out that business aviation can make it possible to bring industrial prosperity to communities remote from principal distribution and communication centers. 6
Time Efficient Transportation. The company airplane is a flexible business tool that can save time on required business travel. It provides both route and schedule flexibility to meet management priorities for "ondemand" place-to-place transportation. 7
Effects of Airline Deregulation. Scheduled airline services are attracted to high density routes to facilitate aircraft utilization with high load factors. With airline deregulation the certificated airlines have reduced air services to many communities. Essential air services to small communities are being continued to a large extent by commuter airlines. The effects of these adjustments to commercial airline service patterns appear to be influencing some companies towards expanded use of company aircraft for business travel. The convenience of timely point-to-point flights to a wide variety of airports provides incentives
6Background Report: Business Aviation, National Business Aircraft Association, Inc., January 1981.
7Ibid •
2-9

for business aviation. But. business aircraft are also extensively used to interconnect passengers with scheduled air carrier services at air transportation hubs. Industry estimates indicate that about 30 percent of all business flights are conducted for this purpose. 8
Cost Effective Transportation. In 1980, 541 of the 1,000 largest industrial companies identified by Fortune magazine operated business aircraft. At the beginning of 1981, this business fleet had a total of 2,012 aircraft valued at $3.21 billion. Compared to 1979, there was an increase of seventeen companies and 170 aircraft. 9 This growth in the size of the business aircraft fleet (see Table 2.3) and trends toward turbine-powered aircraft give some indication of the cost-effectiveness of these aircraft. An analysis by NBAA of the top 1.000 industrial companies reveals that the 541 companies which operate aircraft out performed the 459 non-operators in such categories as employees, net sales, assets, stockholders equity and net income. NBAA cautions that the use of aircraft is not the only measure of success in business, but notes that those companies which use aircraft do fare better than those companies that do not use aircraft, by whatever standard of measurement is used. 10
Commercial Air Transportation
Commercial air transportation activities, which include air taxi and commuter airline operations, accounted for about 11 percent of the general aviation hours flown in 1980. These carriers are required to register with the Civil Aeronautics Board (CAB) as commercial operators, but primarily operate small transport aircraft exempted from the CAB certification required for large transports (over 60 passenger seats).
8Ibid•
911Business Aviation and the FORTUNE 1,000 Industries 1980", Business Flying, 1982-Section 1, National Business Aircraft Association, Inc.
10ilLeading Industrial Aircraft Analysis, the FORTUNE 1,000: 1978 Update", Business Flying, 1980-Section 1, National Business Aircraft Asso., Inc.
2-10
Air taxi operators provide services on demand in response to special flight requests. It is estimated that they provided transportation services for about five million passengers in 1980. 11 Most of the aircraft used for air taxi services are small single-engine piston and light twin-engine piston aircraft with less than 10 seats.
The commuter airlines (now termed regional airlines) provide regularly scheduled services. Their route structurers primarily provide connecting services on low-density shorthaul routes from outlying communities to hub air carrier airports in the air transportation system. A typical stage length is a distance of 100 to 300 miles and the route is flown between 5,000 and 14,000 feet predominantly in multi-engine light transport aircraft. Nearly 7S oercent of the available seating capacity in the commuter fleet is provided by turbinepowered aircraft which seat 10 or more passengers. 12 Commuter passenger traffic in 1981 was about 12.9 million passenger enp1anements. 13
Although over half (56%) of the commuter airline fleet is pistonpowered single-engine and twin-engine aircraft, the trend is toward large capacity multi-engine turboprop aircraft. Table 2.3 lists the top ten aircraft models in the 1981 passenger fleet in terms of commuter airline available seat capacity. The top ten models in all cargo service are listed in Table 2.4 in terms of numbers of aircraft. All-cargo carri~rs may operate aircraft up to 18,000 pounds payload under Part 298 regulations without route restrictions. They may also operate larger aircraft under a Section 418 certifi~ate established by the Dereau1ation Act but must como1y with additional CAB reporting requirements.
As shown in Figures 2.4 and 2.5 the commuter air carriers have experienced consistent growth in both passenger enp1anements and cargo
ll"NATA' s Burian Eyes the Future for Commercial Operators", Business and Commercial Aviation, 1981 Planning and Purchasing Handbook, April 1982, p. C11.
121981 Annual Report, Regional/Commuter Airline Industry, Regional Airline Association, February 1982.
13FAA Aviation Forecasts, Fiscal years 1982-1993.
2-11

TABLE 2.3
REGIONAL/COMMUTER PASSENGER AIRCRAFT FLEET IN 1981
TOP TEN MODELS* (B/CA EQPD PRICE)·
1. Swearlngen Metro ($1 ,845,500)
2 De Havlll and Twln Otter ($1,170,000)
3 De Hav 111 and Dash 7 ($5,020,000)
4 Shorts 330 S03-30 ($2,870,000)
5. Beech 99 ($1,335,000 )
6 Embraer Bandelrante ($1,495,998)
7 Convalr 580/ 600
8. Fokker F-28, MK4000 ($10,550,000)
9. Pl per Navajo (PA-31 ) ($377 ,620)
10 Cessna 402 ($333,606 )
TYPE AIRCRAFT
Twln Turboprop
Twln Turboprop
Mu 1 tl- Eng Turboprop
Twln Turboprop
Twln Turboprop
Twln Turboprop
Twl n Turboprop
Twln-Jet
Twln Plston
Twln Piston
PASSENGER CAPACITY
19 (Pressurlzed)
19
50 (Pressurized)
30
15
18 ( Pressurized)
40 (Pressurlzed)
85 (Pressurized)
8
8
Total Top Ten Alrcraft (By Seats In Servlce) Mlsc. Others* (Includes 20 Hellcopters)
DATE OF INITIAL PRODUCTI~
1970
1966
1977
1976
1968
1973
1965
1976
1966
1964
TOTAL All Passenger Alrcraft (Includes 20 Hellcopters)
PERCENT OF TOTAL COMMUTER
INDUSTRY SEAT CAPACITY
14.0%
9.6%
9.U
9 0%
83%
6 6%
5 9%
47%
4 3%
4 01
75.5% 24 51
1001
TOTAL C(Jo1MUTER
AIRCRAFT IN U.S. OPERATIONS
135
102
30
51
106
65
33
9
170
162
863 (591) 600 (411)
1463 (100%)
*Notes (1) Ten Top Models are rank by total avallable passenger seats provlded by the Reglonal/ Commuter Alrllne Industry
(2) B/CA EQPD Prlce - Buslness and Commerclal Avlatlon, 1981 Plannlng and Purchaslng Handbook, April 1981
(3) Mlsc Others 195 Slngle-Englne Plston, 296 Multl-Englne Plston, 84 Turboprop and 5 Jet alrcraft plus 20 hellcopters by the followlng manufacturers Aerospatlale (19), Augusta (3), Beech (38), Bell (10), Bellanca (1). Brltish Aerospace (20), Brltten Norman (56), Cessna (175), CASA (11), Convalr (8), de Havllland (35), Dornler (3), Douglas (30), Enstrom (I), Fokker/Falrchlld (13), Gov't. Alrcraft Factorles (10), Grumman (16), Hello (2), Lear (4), Martln (19), Mooney (I), Nlhon (7), North lcnerican Rockwell (8), Plper (106), Shorts (1) and Slkorsky (3)
Source RAA 1981 Annual Report, Reglonal/Commuter Alrllne Industry
2-12

,
TABLE 2.4
COMMUTER CARGO FLEET IN 1981
TOP TEN AIRCRAFT MODELS* NUMBER IN FLEET
1. Beech 18 45
2. Convair 580/600 28
3. Douglas DC-3 17
4. Cessna 402 15
5. Aero Commander 680FL 14
6. Nihon YS-ll 14
7. Piper Navajo 13
8. Convair 240 12
9. Cessna 207/208 12
10. Piper Cherokee 6 Series 9
Total: Top Ten Models 179 (64%) Other: Misc. Aircraft 101 (36%)
TOTAL: All Cargo Aircraft 280 (100%)
SOURCE: RAA 1981 Annual Report, Regional/Commuter Airline Industry
*Top Ten Models ranked by number in all cargo fleet.
2-13

(J) 0 Z ::::l
2 .. 0 (J) Z 0 ::::i ...J
~
16
14 (J) Z 012 ::::i ...J
~ 10 ~ (J) 8 f-Z w ~ 6 w Z
::5 4 a.. Z w
2
68
53
1970 1971 1972 1973 1974 1975 1976 1977 1978 1979 1980 1981
Source Regional Alrhne Association 1981 Annual Report
CALENDAR YEAR
FIGURE 2.4. COMMUTER PASSENGER ENPLANEMENTS 1970-1981
600
500
400
300
200
100
1970 1971 1972 1973 1974 1975 1976
CALENDAR YEAR
Source Regional Alrhne Association 1981 Annual Report
FIGURE 2.5. COMMUTER CARGO LOADINGS 1970 - 1981
2-14
5663(EST)

during the past decade. Under deregulation, the commuter airlines have an increasingly important role in providing essential air services to small communities where air services are being abandoned by trunk and local services air carriers equipped with larger jet transport aircraft. The 10ngterm outlook is that commuter passenger enp1anements and revenue passenger miles will more than double over the next 10 years to 32 million passenger enplanements and 5.2 billion revenue passenger miles in 1992. 14 The growth in cargo carried is also forecast to double over the next ten years. 15
Other Commercial Uses
Other commercial flying activities in general aviation include instructional, industrial, and agricultural uses (e.g., aerial applications) and rental aircraft. These uses and other special purpose flights, (e.g., R&D, air shows, sales) are primarily conducted in single-engine aircraft. Most of the flight hours involved rental aircraft (9.7 percent) and instructional flying (14.5 percent).
Personal Use
Personal flying, which includes pilot proficiency and personal transportation comprises another major segment of general aviation. In 1980, personal transportation and proficiency flying accounted for about 23 percent of all general aviation flying. About 95 percent of the aircraft operated for these functions are single-engine piston air-craft. Personal flying increased at an average annual rate of about 4.4 percent to about 9.4 million hours in 1978 but subsequently has declined to 8.7 million hours in 1980. 16 This decrease has been attributed to the increased cost of aviation gasoline and the recession.
14FAA Aviation Forecasts, Fiscal Years 1981-1993. 15Commuter Airline Forecast, Final Report, FAA, May 1981.
16Genera1 Aviation Activity and Avionics Survey, FAA, ~. Cit.
2-15
III. ECONOMIC FACTORS IN GENERAL AVIATION
GENERAL AVIATION EMPLOYMENT
General aviation is a large, highly diversified industry which collectlvely produces an annual contribution of about 10 billion dollars to the national economy. In the aggregate, general aviation employment totals over 300,000 people. According to industry estimates, this total lncludes 80,000 people in sales and services, 20,000 engaged in agriculture flying, 45,000 in corporate flight departments, and 15,000 in industrial
uses such as aerial mapping and surveillance. Self-employed instructors and mechanics are estimated to number about 15,000. On the manufacturing side, 60,000 are employed in manufacturing aircraft and its equipment components and 65,000 others are engaged in produclng materials and subcomponents (e.g., aluminum, fuel, oil, and brakes, tlres and wheels) used in general aviation aircraft.17 The total annual earnings of these 300,000 employees are about $6.5 billion based on an average annual earnings per full-time employee in the Air Transportation Sector of $21,711.1~
17 The General Aviation Story, General Aviation Manufacturers Association, 1980. 18National Transportation Statistics, U.S, Department of Transportation,
Research and Special Projects Administration, September 1980, page 70.
3-1

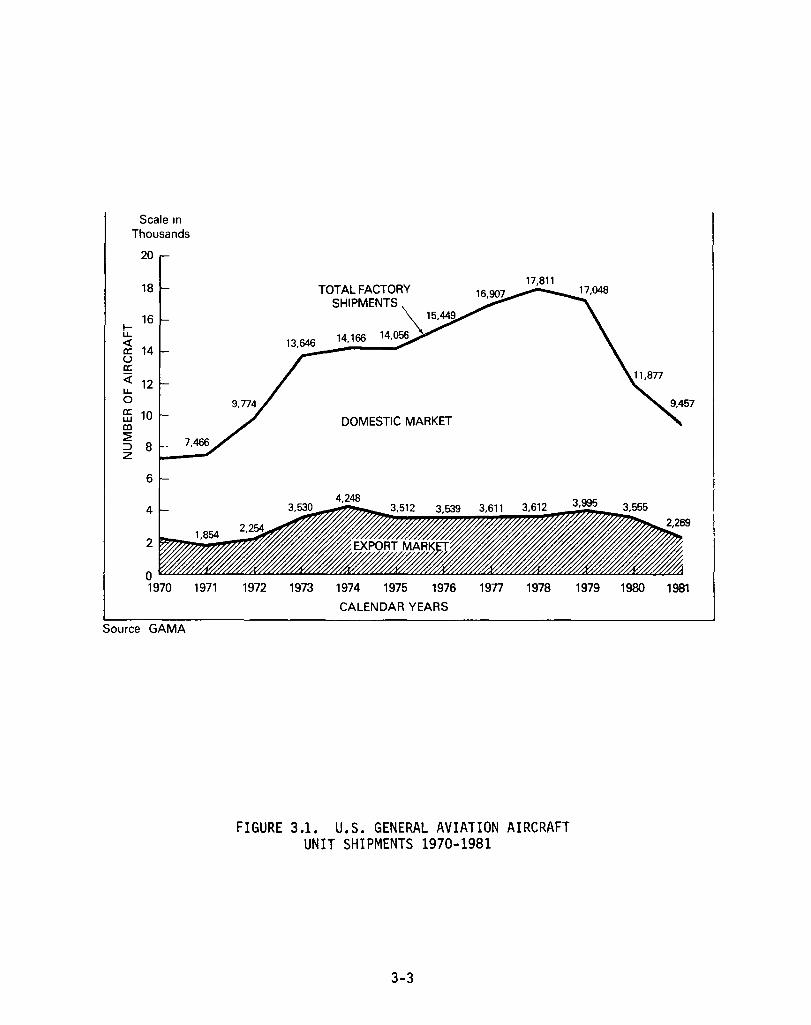
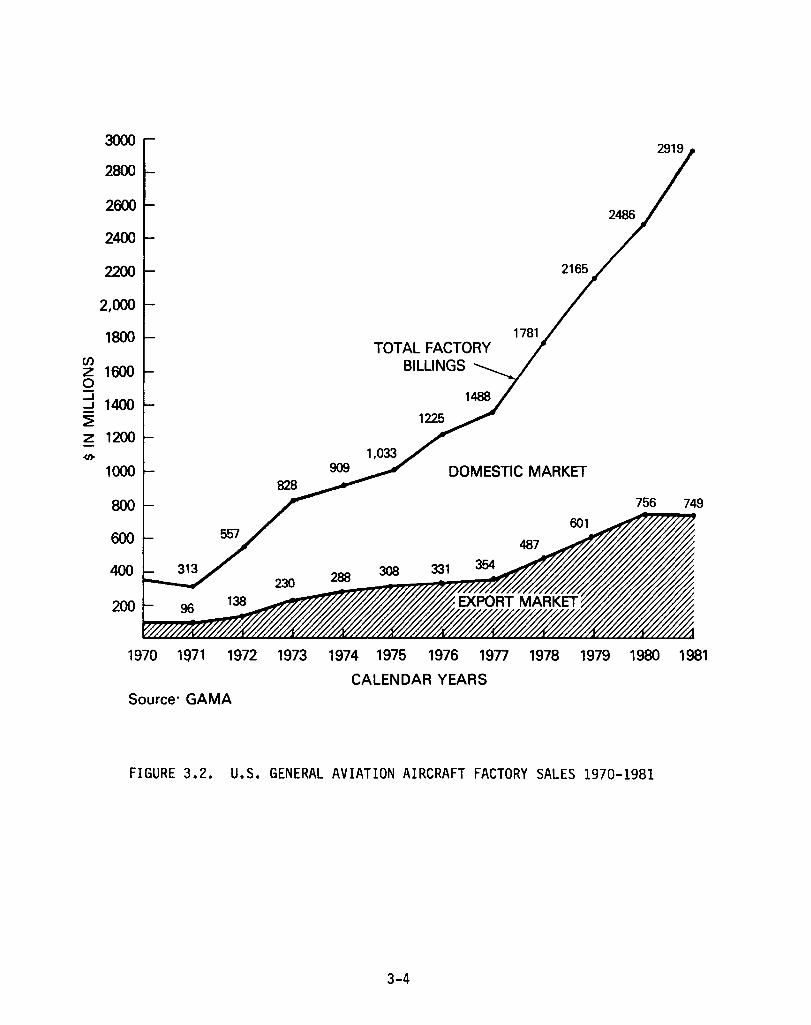
AIRCRAFT PRODUCTION AND SALES
Trends in shipments and sales of general aviation fixed-wing aircraft by U.S. manufacturers are presented in Figures 3.1 and 3.2. In 1981, the market continued to decline by about 20 percent in total shipments to 9,457 units compared to 11,877 units in 1980, but total factory net billings increased to a record high of $2.92 billion. This variance in market trends reflects the change in aircraft sales. Lower sales of the small less expensive aircraft are being offset by growing sales of higher priced turbine-powered aircraft. Since the 1978 production peak of 17,811 general aviation aircraft there has been a significant drop in the market for sing1eengine piston and light twin-engine piston aircraft. Single-engine aircraft deliveries in 1981 of 6,268 units were about 54 percent below 1978 peak-year shipments of 13,651 single-engine units. The industry attributes the sharp decline in sales of the smaller, personal use type aircraft to high interest rates, business recession and higher energy costs.
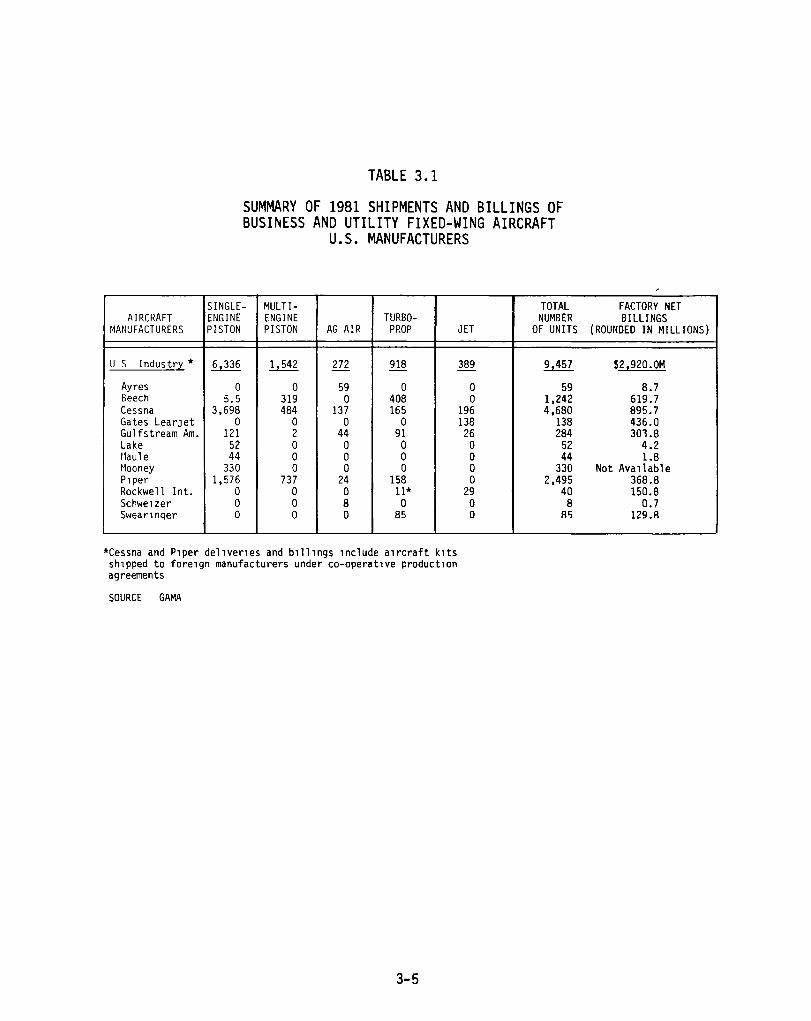
Table 3.1 presents a summary of 1981 shipments and billings of general aviation aircraft by manufacturer and type of aircraft. GAMA estimates that total factory billings in 1982 will increase to $3.2 billion for delivery of 8,200 aircraft in all categories. 19 Based on actual 1982 factory deliveries through August 0& 3,110 units an~ ~illings of ~1.3 billion, it now appears that full year deliveries will be lower than the GAMA forecast and may fall below a total of 5,000 units and $2.0 billion for 1982.
In contrast to the decline in sales of the small piston airplanes, sales of the larger, higher-value turbine-powered aircraft continued to grow in 1981. Shipments of 198 turboprop aircraft in 1981 by U.S. manufacturers was an increase of about 15 percent over 1980 shipments. Deliveries of jet aircraft also increased by about 19 percent to 389 units. Annual shipments by U.S. manufacturers of turbine-powered business aircraft are expected to increase to about 2,300 units by 1985 and have a sales value of about $3.3 bi1lion. 20
19Edward W. Stimpson, President of GAMA, Remarks before the New York Society of Security Analysts, January 4, 1982.
20John H. Winant, President of NBAA, Remarks at the International Aerospace Symposium, Le Bourget Airport, Paris, France, June 3, 1982, "An Overview of General Aviation and the Future of the Business Aircraft."
3-2
Scale In
Thousands
20
18
16 l-LL. <i a: 14 u a: <{ LL.
12 0 a: 10 w co :::2: :::l 8 z
6
4
2
0 1970 1971
Source GAMA
TOTAL FACTORY 17,811
SHIPMENTS
14,166 1 13,646
DOMESTIC MARKET
4,248
1972 1973 1974 1975 1976 1977 1978
CALENDAR YEARS
FIGURE 3.1. U.S. GENERAL AVIATION AIRCRAFT UNIT SHIPMENTS 1970-1981
3-3
1979 1980 1981
CJ)
z 0 ::J ....J
~ z <0
3000
2800
2600
2400
2200
2,000
1800
1600
1400
1200
1000
800
600
400
200
TOTAL FACTORY BILLINGS
DOMESTIC MARKET
756 749
1970 1971 1972 1973 1974 1975 1976 19n 1978 1979 1980 1981
CALENDAR YEARS Source· GAMA
FIGURE 3.2. U.S. GENERAL AVIATION AIRCRAFT FACTORY SALES 1970-1981
3-4
AIRCRAFT MANUFACTURERS
U S Indus tr,l *
Ayres Beech Cessna Gates learJet Gulfstream Am. lake t1aul e Mooney Plper Rockwe 11 Int. Schwelzer Swearlnqer
I
TABLE 3.1
SUMMARY OF 1981 SHIPMENTS AND BILLINGS OF BUSI~ESS AND UTILITY FIXED-WING AIRCRAFT
U.S. MANUFACTURERS
SINGlE- MUl TI- TOTAL ENGINE ENGINE TURBO- NUMBER PISTON PISTON AG AIR PROP JET OF UNITS
6,336 1,542 272 918 389 9,457
0 0 59 0 0 59 5.5 319 0 408 0 1,242
3,698 484 137 165 196 4,680 0 0 0 0 138 138
121 2 44 91 26 284 52 0 0 0 0 52 44 0 0 0 0 44
330 0 0 0 0 330 1,576 737 24 158 0 2,495
0 0 0 11* 29 40 0 0 8 0 0 8 0 0 0 85 0 Ali
*Cessna and Plper dellverles and bllllngS lnclude alrcraft kltS shlpped to forelgn manufacturers under co-operatlve productlon agreements
SOURCE GAMA
3-5
FACTORY NET BILLINGS
(ROUNDED IN MIllIONS)
$2,920.0M
8.7 619.7 895.7 436.0 301.8
4.2 1.8
Not Avallable 368.8 150.8
0.7 129.8
The continuing growth in sales of turboprop and jet aircraft is attributed to a strong business aircraft market and growth in commuter airlines. According to GAMA, purchases (including leases) of general aviation aircraft for business purposes account for at least 90 percent of current industry sales. The key reasons attributed to the continued growth in sales for business aviation are dispersal of company plants to smaller communities; need for flexible travel schedules; effect of airline deregulation on airline services and cost efficiency of using business aircraft as a selected mode of transportation for business travel. 21
FUEL PRICES AND DISTRIBUTION
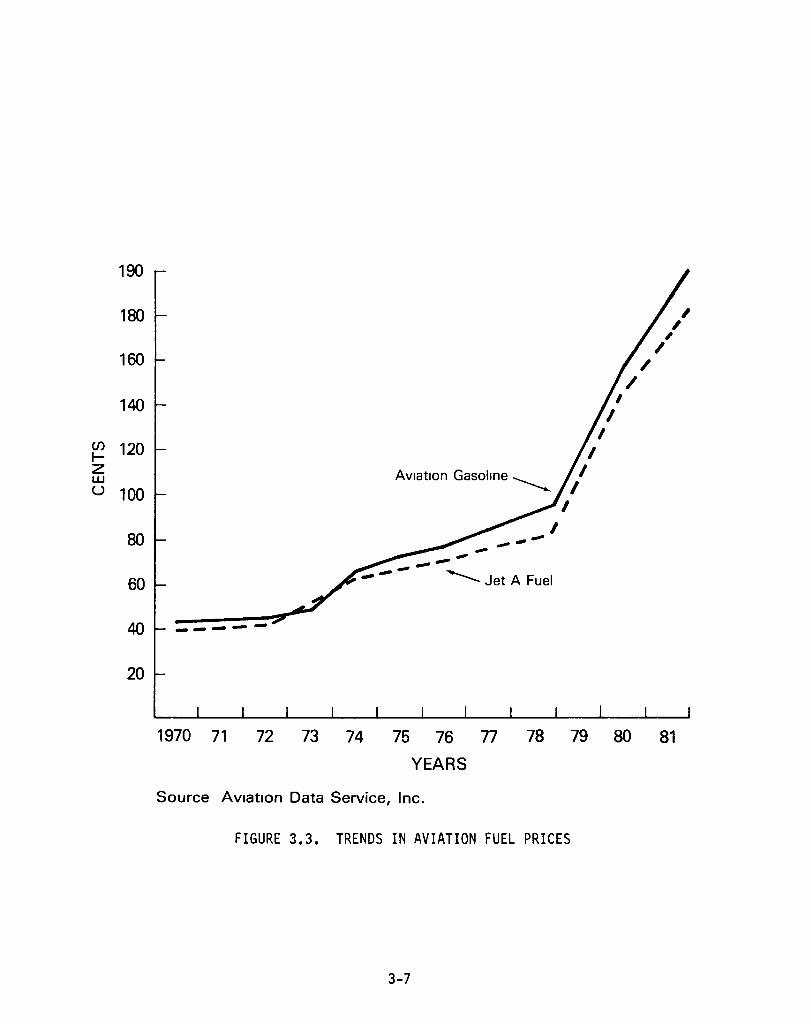
Current prices for aviation fuels are over four times the average fuel prices in the early 1970's and have more than doubled since 1978. The 10-year trends in average prices for aviation gasoline and Jet A fuel are shown in Figure 3.3. The average retail price in 1978 was about 91 and 79 cents per gallon for 100 octane aviation gasoline and Jet A fuel respectively. According to fuel surveys by the Aircraft Owners and Pilots Association (AOPA) the average retail price in 1981 was $1.92 per gallon for 100 octane aviation gasoline and $1.70 per gallon for Jet A fuel.
In addition to steep increases in fuel prices in recent years, the availability of ample supplies of aviation gasoline has been a concern to general aviation. Spot shortages occur occassionally at some general aviation airports which do not have large storage facilities. More or less chronic shortages of aviation gasoline are expected to become a growing problem at the smaller general aviation airports. 22
The relatively small market and high production costs for aviation gasoline are key factors which contribute to the supply and distribution problems. The demand for aviation gasoline amounts to only one-half
21Russell W. Meyer, Jr., Vice Chairman of GAMA, Chairman and President of Cessna Aircraft Co., Remarks before the New York Society of Security Analysts, January 16, 1981.
22Airport Services Management, June 1981, page 16.
3-6
190
180
160
140
(J) 120 ~ z w u 100
80
60
40
20
AViation Gasoline -----....
I I ------ ---- Jet A Fuel
-----
I I
, I
I I
/
/ /
, , ,
1970 71 72 73 74 75 76 77 78 79 80 81
YEARS
Source AViation Data Service, Inc.
FIGURE 3.3. TRENDS IN AVIATION FUEL PRICES
3-7

of one percent of the nation's annual usage of all types of gasoline and accounts for only four percent of the domestic consumption of aviation fuels. 23 The relatively low market demand and higher refining costs for aviation gasoline, as compared to jet fuels and automotive gasoline, has resulted in the major oil refiners producing limited supplies for this thin, widely scattered market. This has raised a critical concern to the general aviation industry that its future growth may be constrained by inadequate fuel supplies to meet future demand at reasonable prices. As such, there is a critical need to seek a suitable substitute fuel for aviation gasoline as well as to develop new engine technology for the smaller, piston-powered aircraft segment of the general aviation market.
23National Transportation Statistics, Annual Report, September 1980, Research and Special Projects Administration, Transportation Systems Center, Cambridge, MA, page 144.
3-8
IV. SAFETY FACTORS IN GENERAL AVIATION
INTRODUCTION
Continued improvements in flight safety are important considerations in planning research and technology programs for general aviation. This section discusses safety factors in general aviation in terms of recent accident statistics and the major causes of accidents.
ACCIDENT STATISTICS
In 1981, the National Transportation Safety Board (NTSB) reported commuter air carrier and on-demand air taxi accidents as separate categories from general aviation. 24 Accident statistics on commuter air carrier, air taxi, and general aviation are presented in Tables 4.1, 4.2 and 4.3, respectively.
In 1981, the commuter air carriers had a total of 28 accidents which included 9 fatal accidents involving 35 fatalities. This resulted in 1981 accident rates of 2.59 accidents per 100,000 aircraft hours flown and 1.64 accidents per 100,000 departures for all scheduled services. Comparable rates over the reported five-year period ranged from a high of 55 accidents in 1978 resulting in rates of 4.27 per 100,000 aircraft hours and
24NTSB Safety Information, SB 82-4, National Transportation Safety Board, January 28, 1982.
4-1

TABLE 4.1
ACCIDENTS, FATALITIES AND1RATES COMMUTER AIR CARRIERS
1977 - 1981
Data CALENDAR YEARS .lli!!!!!1 1977 1978 1979 1980 198'
Accidents
Total 42 55 51 37 28 Fatal 9 13 14 7 9
Fatalities 33 47 65 36 35
Aircraft Hours Flown 1.143.651 1.288.480 1.261.500 1.263.200 1.082.600
D!pIrtures 1.728.948 1.978.483 2.005.800 1.895.400 1.708.800
Accident Rate Per l!!!!.OOO Hours Flown
Total 3.67 4.27 4.04 2.93 2.59 Fatal 0.79 1.01 1.11 0.55 0.83
Accident Rate Per 100.000 Del!!rtures
Total 2.43 2.78 2.54 1.95 1.64 Fatal 0.52 0.66 0.70 0.37 0.53
11ncludes all scheduled service under Part 135. Federal Air Regulations. All 1981 data is preli.inary.
SOURCE: National Transportat1on Safety Board. January 28. 1982.
4-2

ACCIDENTS
TABLE 4.2
ACCIDENTS. FATALITIES. AND RATES ON-DEMAND AIR TAXIS!
1977 - 1981
AIRCRAFT YEAR TOTAL FATAL FATALITIES HOURS FLOWN
1977 175 35 122 3,063,749
1978 216 57 160 3,135,121
1979 173 36 84 3,373,901
1980 164 42 88 3,535,466
1981P 138 34 95 3,690,000
P Preliminary Data
ACCIDENT RATES PER 100.000
AIRCRAFT HOURS FLOWN
TOTAL FATAL
5.71 1.14
6.89 1.82
5.13 1.07
4.64 1.19
3.74 0.92
1 Includes non-scheduled operations by on-demand air-taxi aircraft.
SOURCE: National Transportation Safety Board, January 28, 1982.
4-3

ACCIDENTS
YEAR TOTAL2 FATAL2
1972 4109 653 1973 4090 679 1974 4234 689 1975 4034 638 1976 4005 648 1977 4069 658 1978 4223 723 1979 3800 629 1980P 3599 629 1981P 3634 662
P Preliminary Data
TABLE 4.3
ACCIDENTS, FATALITIES, RAIES U. S. GENERAL AVIATION
1972 - 1981
AI RCRAFr4 FATALITIES HOURS FLOWN
1305J 24,419,000 1299 26,907,800 1327 27,773,500 1247 28,335,700 1187 29,975,200 1281 31,584,600 156~ 34,985,399 1219 38,767,481 1264 37,480,076 1265 36,280,000
ACCIDENT RATES PER 100,000
AIRCRAFT HOURS FLOWN
TOTAL FATAL
16.8 2.67 15.2 2.52 15.2 2.47 14.2 2.24 13.3 2.15 12.9 2.08 12.1 2.07 9.8 1.62 9.6 1.68
10.0 1.82
1 Table does not include accidents for Air Taxi and Commuter Air Carrier aircraft.
2 Suicide/sabotage accidents included in all computations except rates (1972-3, 1973-2, 1974-2, 1975-2, 1976-4, 1977-1, 1978-2, 1979-0).
3 Includes air carrier fatalities (1972-5, 1978-142) when in collision with General Aviation aircraft.
4 Source of estimate: FAA
SOURCE: National Transportation Safety Board, Safety Information Release, January 28, 1982.
4-4
2.78 per 100,000 departures to the low rates achieved in 1981. Annual fatalities for scheduled serv1ces ranged from a high of 65 in 1979 to a low of 33 1n 1977.
Accident statistics for on-demand (non-scheduled) air tax; operations for the five-year period reported 1n 1981 by the NTSB are shown in Table 4.2. In 1981, air taxi accidents were low for the five-year period with 138 accidents which included 34 fatal accidents involving 95
fatalities. The accident rates over the five-year period 1977-1981 ranged from a low of 3.74 accidents per 100,000 aircraft flight hours in 1981 to a high of 6.89 accidents per 100,000 aircraft flight hours in 1978.
Accident statistics for the ten-year period 1972-1981 for general aviation (excluding commuter air carriers and air taxi) are shown in Table 4.3. In 1981 general aviation had 3,634 accidents which included 662 fatal accidents with 1,265 fatalities. The accident rate of 10.0 accidents per 100,000 aircraft flight hours in 1981 was up from the record low of 9.6 achieved in 1980 after a continuous decline from 16.8 in 1972.
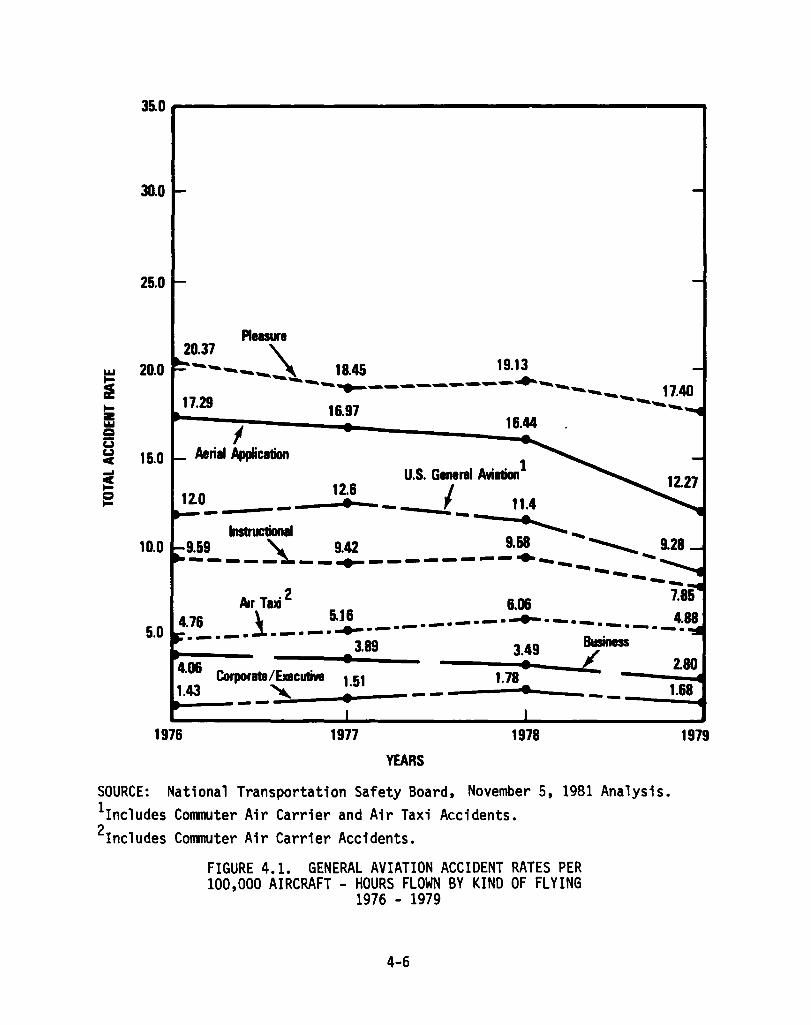
The annual accident rates for general aviation listed in Table 4.3 presented an overall summary that does not show the wide variations in accident rates attributed to each of the various elements or types of flying in general aviation. The accident rates for corporate executive flying with professional crews are significantly lower than the totals for all general aviation flying. For example, an analysis by the NTSB of accident rates in 1979 for the various types of flying indicated that the personal transportation or so-called pleasure flying sector experienced the highest accident rate involving 17.40 accidents per 100,000 flight-hours as compared to an overall rate of 9.8 in 1979 shown in Table 4.3. Aerial application (includes AgAir spraying) had the second highest rate (12.27), followed by instructional flying (7.85), on-demand air taxi (5.13), commuters (4.04), business (2.80) and corporate/executive (1.68). Figure 4.1 summarizes the NTSB analysis of general aviation accidents by the type of flying for years 1976-1979. 25
25Annual Review of Aircraft Accident Data, U.S. General Aviation, Calendar Year 1979, NTSB-ARG 81-1, National Transportation Safety Board, Washington, D.C., November 5, 1981.
4-5
~O~--------------------------------------------~
30.0
25.0
Pleasure
20.0 20.37 '\ --____ , 18.45 19.13
~,.... ..... ----.~~~~~ ................ ~................ 40 ~ -- 17.
17.29 16.97 ----.-.
I 16.44
15.0 Aerial AppIicl1ion U.S. General Avildion 1
11.4 _--- 12: _____ ..... 1 - Instructional - - • '-...... .....
~9 ___ ~ __ !!. _______ .!.=-__ .................... 9.28 ------10.0
~~2 ~ ~ 476 1 5.16 _._._ ....... -._._ 4.88
50 . -.-.~.-.-. -----. • - • - • • Business .189 3:9 t..
2.80 4.06 Corporate/Exacutive 1 51 1.78 143 """'. • 168 • __ "'" • - - _--.... 100.-. __ - - ___ • -4
1976 1977 1978
YEARS
SOURCE: National Transportation Safety Board, November 5, 1981 Analysis. 1Includes Commuter Air Carrier and Air Taxi Accidents. 2Includes Commuter Air Carrier Accidents.
FIGURE 4.1. GENERAL AVIATION ACCIDENT RATES PER 100,000 AIRCRAFT - HOURS FLOWN BY KIND OF FLYING
1976 - 1979
4-6
1979
ACCIDENT CAUSAL FACTORS
The review of 1979 aircraft accident data (most recent NTSB analysis) for U.S. general aviation by the National Transportation Safety Board (NTSB) indicated that weather factors and pilot performance factors continued, as in past reviews, to be predominantly involved in most general aviation accidents. Tables 4.4 and 4.5 summarize the NTSB findings as to the ten most frequently cited cause factors in 3,345 nonfatal accidents and 678 fatal accidents in 1979. 26 The pilot was cited as a causal factor in 482 of the 678 fatal accidents analyzed (71.09 percent cause factor) and 1,108 of the 3,345 nonfatal accidents (33.12 percent cause factor). Weather was cited as a causal factor in 341 of the fatal accidents (50.29 percent cause factor). As noted in the tables, more than one cause can be cited as the major contributing factors in an accident.
The ten most prevalent types of accidents in general aviation are presented in Figures 4.2 for total accidents and Figure 4.3 for fatal accidents. Engine failure or malfunction is the leading type of accident, accounting for about 24 percent of the total accidents recorded. The other most common types of accidents are ground/water loop or swerve, hard landings, or collisions with the ground/water and projecting objects (trees, poles, or wires) near the ground. Stalls and stall~spins also account for a significant number (6.49 percent and 9.90 percent respectively) of the fatal accidents over the 5-year period. Most (over 40 percent) of the total accidents occur during the landing phase of flight while the majority (over 60 percent) of the fatal accidents occur in-flight.
26 Ibid •
4-7

TABLE 4.4
TEN MOST FREQUENTLY CITED CAUSE FACTORS OF NONFATAL ACCIDENTS IN 1979
Cause Factors Frequency
Pilot - Inadequate Preflight Preparation or Planning 399
Miscellaneous Acts, Conditions Overload Failure 334
Terrain - High Obstructions 293 Weather - Unfavorable Wind Conditions 263 Pilot - Mismanagement of Fuel 245 Pilot - Failed to Obtain/Maintain
Flying Speed 240 Pilot - Selected Unsuitable Terrain 224 Powerp1ant - Failure for Undetermined
Reasons 208 Miscellaneous Acts, Conditions
Fuel Exhaustion 208 Miscellaneous Acts, Conditions
Material Failure 203
Percent
11.93
9.99 8.76 7.86 7.32
7.17 6.70
6.22
6.22
6.07
SOURCE: National Transportation Safety Board, Annual Review of Aircraft Accident Data - U.S. General Aviation, Calendar Year 1979 Data, Published November 5, 1981.
4-8
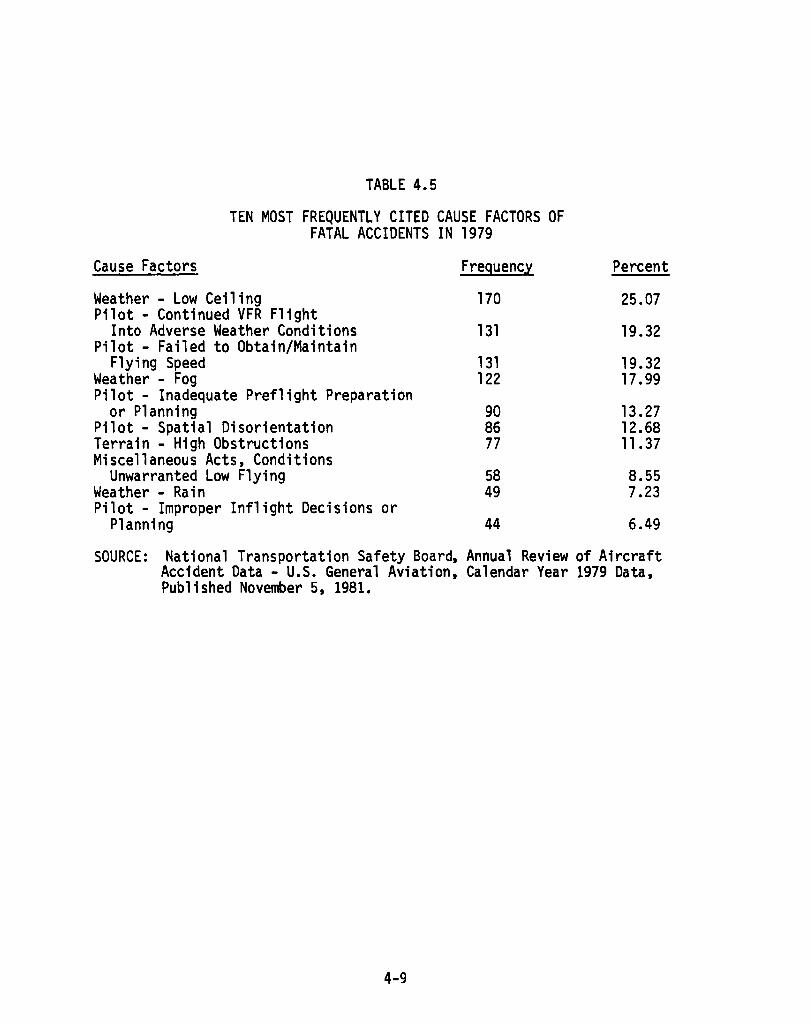
TABLE 4.5
TEN MOST FREQUENTLY CITED CAUSE FACTORS OF FATAL ACCIDENTS IN 1979
Cause Factors Frequency
Weather - Low Ceiling 170 Pilot - Continued VFR Flight
Into Adverse Weather Conditions 131 Pilot - Failed to Obtain/Maintain
Flying Speed 131 Weather - Fog 122 Pilot - Inadequate Preflight Preparation
or Planning 90 Pilot - Spatial Disorientation 86 Terrain - High Obstructions 77 Miscellaneous Acts, Conditions
Unwarranted Low Flying 58 Weather - Rain 49 Pilot - Improper Inf1ight Decisions or
Planning 44
Percent
25.07
19.32
19.32 17.99
13.27 12.68 11.37
8.55 7.23
6.49
SOURCE: National Transportation Safety Board, Annual Review of Aircraft Accident Data - U.S. General Aviation, Calendar Year 1979 Data, Published November 5, 1981.
4-9

% OF TOTAL ACCIDENTS 10% 20% 30%
~----------------~------~I--, __ ~I ______ ~ ENG IN E FA ILU R E /MA LFUNC TI 0 N ~:~?):~t::m~})tm%~lff~jjmttK:jtmjil::tmmt~ 23.82
. ' ~24.30
HARD LANDINIG
~----------.----~.---------------~.--------------------------------~
STALL MUSH ~Illiill 4.36
1~3.79
COLLISION WIITH GROUND / @mmm~IlI4.76 WATER CONTROlLE[) __ ~~~6.0~1 ----~--~J COLLISION WITH GROUND/ WATER UNCONTROLILED
ililrrmill 3.89
!m3.20 ......... --_. __ ._---+._----_ .. _------1 @rrfI 4.08
COLLIDED WITH TRIEES m~5.00
OVERSHOOT
COLLIDED WrfH WIRES/POLES
NOSE OVER/DOWN
ft:tttJ 4.38
.3.89
.3.81
m 3.67
)tt13.25 m3.37
SOURCE: Nafi ana 1 l'ranspartati on Safety Board, November' 5, 1931.
1974--1978 AVERAGE- [ft@flIJ 1979-~
FIGUIRE 4.2.. TEN MOST PREVALENT ACCIDENT TYPES FOR U.S. GENERAL AVIATION 1979 VS. 5-YEAR AVERAGE
4 .. 10
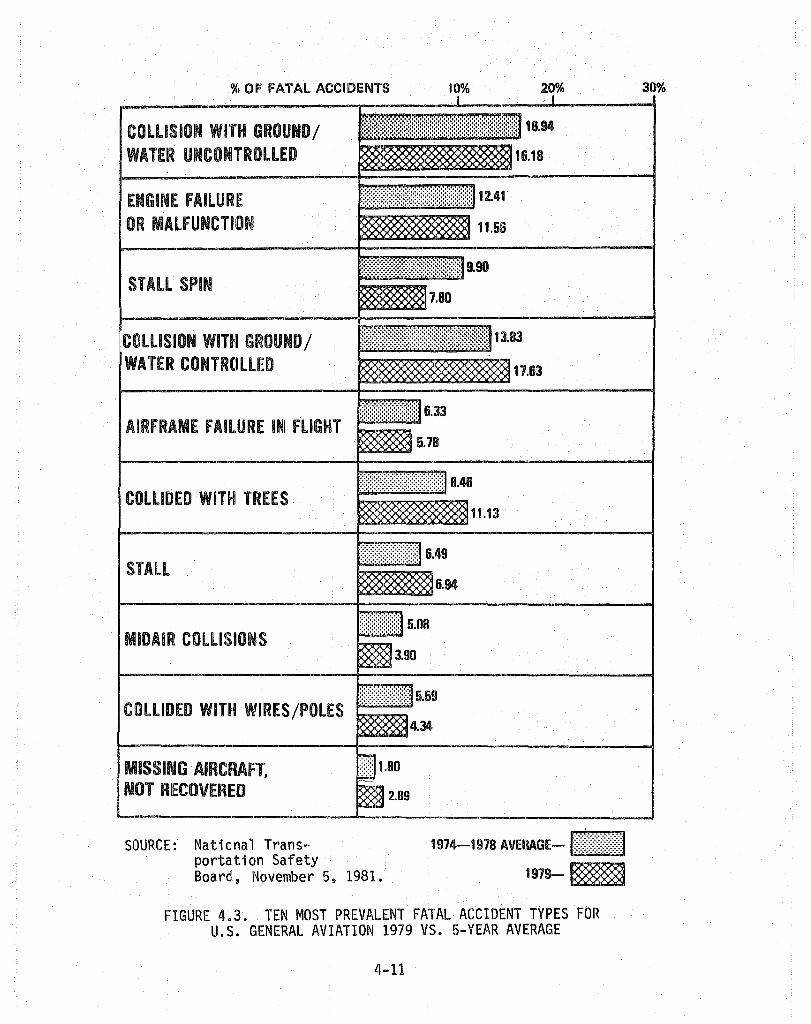
ENGINE FAILURIE OR MALFUNCTION
STALL SPIN
COLLISION WITH GROUND / WATER CONTROLLED
AIRFRAME FAIL.URE INI FLIGHT
COLLIDED WIT~I TREES
STALL
MIDAIR COLLISIONS
1~frrrr1~1IItttffJ 12.41
~ 11.56
~~~~~~~~~~~~~~r~~~~tfrtf~~~~tI9.90
7.80
:~:~;~:~f~l~ft~~r1f~r§ft~I] 13.83 ········:·:·:·······:·:·····:·:·:·:·····;········~·i·;.j •••..•
tttttft] 6.33
'>Qi 5.78
(((((1 5.08
m3.90
COLLIDED Wlnt WIRES/POLES tl1fififid 5.59
.~4.34
MISSING· AIRCBAfT, NOT RECOVERI:[)
SOURCE: National Transportation Safety
w······ :::::::.1.80 ...
~2.89
Board, November 5, 1981.
1974--1978 AVEllAGE- tfiilII%1] 1979-00@
FIGURE 4·.3. TEN MOST PREVALENT FATAL ACCIDENT TYPES FOR U.S. GENERAL AVIATION 1979 VS. 5-YEAR AVERAGE
4-11
V. IMPACT OF U.S. GOVERNMENT POLICIES
Several recently enacted government policies have had an impact on the composition of the general aviation fleet and needs for improved technology. Two of these areas are discussed here -- airline deregulation and environmental controls.
AIRLINE DEREGULATION
The Airline Deregulation Act of 1978 (Public Law 95-504, October 24, 1978) provides for the systematic phase-out by January 1985 of the Civil Aeronautics Board (CAB) and its authority over air transportation fares and the route structure of the domestic airlines. In its implementation of the provisions of the Act, the CAB has taken actions to reduce government restrictions on airline management discretion to make changes in domestic routes, service points, types of service, and ticket prices within a defined zone of reasonableness.27 During implementation of these competitive oriented policies, the CAB is guided by the Declaration of Policy (Section 102) in the Act also to consider areas that might be adversely affected by
27Graham, D. R. and D. P. Kaplan, Developments in the Deregulated Airline Industry, Office of Economic Analysis, Civil Aeronautics Board, June 1981.
5-1

deregulation, such as: safety implications of new services, serv1ce to small communities and isolated areas, and monopolistic market concentration.
The greatest impact on general av1at10n from the A1rl1ne Deregulation Act is on the h1gh performance segments of the market -- business av1at10n and the commuter airlines. To some extent the strong market for business aircraft is partially attributed to reduced air11ne services. but probably more directly related to time effic1ent direct routings and travel flex1bility. The pol1cy changes which have major impact on commuter airlines appear to include the following areas:
• Liberalized process for market entry and exit,
• Essential air services to small communities,
• Increased allowable commuter aircraft size. and
• Guaranteed aircraft loans.
Liberalized Market Entry and Exit
Provisions under the law reduced constraints on air carr1ers to enter new markets and to exit markets no longer considered economic for the type of aircraft and route structure preferences of individual airlines. The liberalized market entry and exit policy has permitted economically healthy air carriers to enter new markets and realign routes to better match traffic demands with airline fleet mixes. The general trend during the three year interval since deregulation has been for the major trunk carriers and local service carriers to withdraw from the uneconomic use of their commercial jet fleets on short-haul (less than 200 miles) low-density markets. Commuter airlines have moved in to many of the low-density markets being dropped by the trunk/local service air carriers. Air taxi operators also experienced increases in requests for on-demand air transportation to provide connections with scheduled air carriers as well as to provide point-to-point services.
Small Community Air Service
The Small Community Air Service Program guarantees continuation of essential levels of air transportation for a period of ten years to communities designated as eligible for such service under criteria
5-2

established under Section 419 of the Act. The CAB guidelines for essential air service guarantee that eligible communities receive at least two welltimed round trips daily to its connecting hub or hubs served by the national air transportation system. This service can be provided by twinengine commuter aircraft with 8 or more passenger seats. The CAB has certified 560 eligible communities, 337 of which are located in the conterminous United States and Hawaii. 28
Since passage of the Airline Deregulation Act the structure of the airline industry has been changing in response to market perspectives of individual airlines and essential services determinations. According to the General Accounting Office, various airlines have filed 398 notices with the CAB terminating air services affecting 287 communities, but 139 of these communities were still being served by at least on certificated carrier. Service for the remaining 148 communities is being provided by commuter airlines except for 7 communities where the CAB has required continuation of certificated air carrier service until replacement service is arranged. Essential air services are being supported at 44 of these communities by subsidies under the Small Communities Air Service Program. A review of airline operations subsequent to deregulation concluded that the full impact of deregulation on small communities cannot be judged until the airline industry has more operating experience under deregulation. 29
Commuter Aircraft Size
Historically, the size of commuter aircraft has been influenced by Federal economic and safety regulation of airlines engaged in providing commercial air transportation as common carriers. Federal Air Regulations applicable to flight safety are discussed later in the section. Economic regulation of the airlines by the Civil Aeronautics Board (CAB) are
28Air Service to Small Communities After Two Years of Deregulation (Level of Service After Two Years)", CAB Chairman, January 1980.
29The Changing Airline Industry: A Status Report Through 1980, CED-81-103, U.S. General Accounting Office, June 1, 1981.
5-3
established by the Civil Aeronautics Act of 1938. The trunk airlines developed as certificated air carriers under fares and routes regulated by CAB operating certifications granted under Section 401 of the Act.
Small air taxi operators who provided non-scheduled services in small aircraft (gross take-off weight of 10.000 lbs. or less) under Part 298 of the CAB Economic Regulations were exempt from Section 401 operating certificate requirements. In 1969. the CAB amended Part 298 to establish commuter air carriers as a class of operators authorized to use small transports (take-off gross weight of 12.500 lbs. or less) for scheduled services without Section 401 certification requirements. Subsequently. in 1972. the CAB authorized commuter air carriers to operate aircraft with 30 passenger seats and maximum payloads of 7.500 pounds.
Provisions under Section 416 of the A~rline Deregulation Act and subsequent CAB actions exempt from CAB certificate requirements under Section 401(a) any air carrier that operates aircraft with 60 passengers seats or less or cargo payload capacity of less than 18.000 pounds. This change in policy modified the former limit of 30 passenger seats imposed on commuter air carriers operating under Part 298 of CAB Economic Regulations. According to the commuter airline industry this policy change has had a beneficial impact on commuter service by improving air carrier efficiency on the denser traffic routes and providing flexibility for use of small aircraft in the fleet to improve service on the less dense routes. 30
Flexible Fare Pricing
The Airline Deregulation Act provides flexible market pricing of air carrier passenger fares within a zone of reasonableness based upon standard industry fare levels and non-predatory pricing. Initially, the lower limit was set at 50 percent below the standard industry fares in effect on July 1, 1977. The upper limit was set at 5 percent above the standard fare level for the same or essentially similar class of service. The Civil Aeronautics Board (CAB) must adjust the standard industry fare
30RAA 1981 Annual Report, page 22.
5-4

level for each class of serv1ce at least tw1ce a year by the percentage change, since the prev10us adjustment, 1n the industry's average operating cost per available seat-m1le for 1nterstate and overseas a1r transportation.
The Board has authority to disallow rates that are considered to be predatory. Under sunset provisions of the Act, CAB authority over domestic fare pricing will expire on January 1, 1983.
Related provisions under the Act and CAB orders require the certificated air carriers to extend joint fare programs to include commuter air carriers. The inclusion of commuter airlines in the industry structure enables joint fares for through-service with single-point ticketing and baggage handling facilities, thereby integrating the commuter air carriers into the national air transportation system.
Guaranteed Commuter Aircraft Loans
Under provisions of the Airline Deregulation Act the commuter air carriers become eligible for Federal guarantees on loans for aircraft acquisitions. A loan guarantee may not exceed 90 percent of the face value of the loan, which can not exceed 90 percent of the purchase price of the aircraft including engines and spare parts. The aircraft loan guarantee program is administered by the Federal Aviation Administration. 31
Federal Air Regulations
Federal regulations applicable to the flight and safety aspects of aviation are set forth in the Federal Air Regulations (FAR) which are promulgated by the Federal Aviation Administration (FAA). The Federal Air Regulations do not strictly define "general aviation" as a segment of aviation but prescribe aircraft airworthiness standards and operating standards applicable to aircraft of varying sizes and purposes of flight. Thus, in its broadest context, general aviation normally refers to all civil aircraft operations in the United States except for large transport aircraft and helicopers operated under Parts 121 and 127 of the Federal Air Regulations.
31Commuter Air Carrier Loan Guarantee Study, Report No. FAA-AVP-80-1, Federal Aviation Administration, January 1980.
5-5

The FAA safety requirements impact most directly on small transport aircraft and operations of the commercial air carrier segments of general aviation, i.e., on-demand air taxi operators and the commuter airlines as specified in Parts 23 and 135 of the Federal Air Regulations. Figure 5.1 presents a matrix of various aircraft sizes used in air taxi and commuter airline operations and related safety regulations. These safety regulations are defined in Federal Air Regulations pertaining to aircraft airworthiness standards applicable to various categories of civil aircraft and to operating procedures for air carriers and other operators engaged in air commerce.
Airworthiness standards have been defined for two basic categor-ies of airplanes: Part 23 for normal, utility and acrobatic category airplanes and Part 25 for the transport type category which has more stringent provisions than Part 23. For many years, the FARs relating to aircraft certification classified civil aircraft as either small or large based on maximum certified take-off weight (MCTW), using 12,500 pounds as the demarcation between small and large airplanes. In addition, the International Civil Aviation Organization (ICAO) uses a similar weight distribution of 5,700 kg (12,566 pounds). As heavier fuel loads increased the take-off weights of business jets and commuters were permitted to use larger aircraft, the FAA took steps to upgrade the safety regulations applicable to small transport aircraft and commuter operations. In 1969, Special Federal Air Regulation 23 established additional airworthiness standards for small multiengine piston and turboprop airplanes capable of carrying more than 10 occupants including the flight crew. In 1971, the FAA amended Part 23 (amendment 23-10) to limit its applicability to small airplanes by limiting the passenger seating configuration to nine seats or less, excluding pilot seats, rather than using aircraft weight limitation as the demarcation between Part 23 and Part 25.
Special Federal Aviation Regulation 41, was subsequently issued in 1979 to allow type and airworthiness certification of small multiengine propel lor-driven airplanes with 10 or more passenger seats (but not more than 19 seats), excluding pilot seats, for use in U.S. domestic commuter services provided the maximum zero fuel weight does not exceed 12,500 pounds. Aircraft
5-6
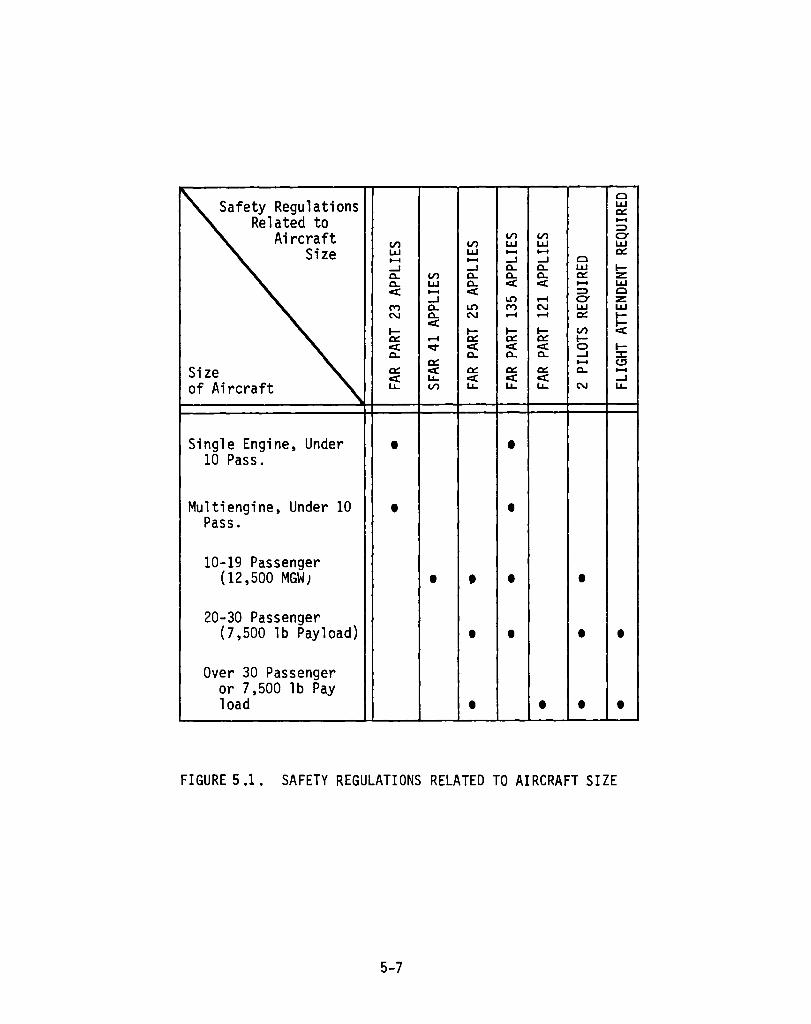
Q
Safety Regulations LLI ~
Related to ..... :::>
Aircraft V) V) 0' V) V) LLI LLI LLI
Size LLI LLI ..... ..... ~ ..... ..... -l -l Q -l -l 0- 0- LLI I-0- V) 0- 0- 0- ~ z: 0- LLI 0- ex: ex: ..... LLI ex: ..... ex: :::> Q
-l LO .-t 0' z: M 0- LO M N LLI LLI N 0- N .-t .-t ~ I-ex: ~ l- I- l- I- V)
~ .-t ~ ~ ~ I-ex: o::t" ex: ex: ex: a I-0- 0- 0- 0- -l :::I:
~ ..... <.!l Size c::: ex: c::: ~ c::: 0- ......
ex: u. ex: ex: ex: -l
of Aircraft u. V) u. u. U. N u.
Single Engine, Under • • 10 Pass.
Multiengine, Under 10 • • Pass.
10-19 Passenger (12,500 MGW) • • • •
20-30 Passenger (7,500 lb Payload) • • • •
Over 30 Passenger or 7,500 lb Pay load • • • •
FIGURE 5.1. SAFETY REGULATIONS RELATED TO AIRCRAFT SIZE
5-7
eligible for compliance with SFAR 41 must have been certified to FAR 23 prior to October 1979 and an application for certification to SFAR 41 filed prior to October 17, 1981. The production of aircraft certified to SFAR 41 are limited to 10 years but no limitation has been established for the operational life of individual aircraft. In addition, aircraft certified under SFAR 41 are required to meet some specific standards of FAR 25 in order to meet ICAO Annex 8 requirements for international acceptance. The objective of SFAR 41 is to allow the design capabilities of certain existing small airplanes to be available for use under Part 135 operations in the domestic commuter market stimulated by enactment of the Airline Deregulation Act of 1978.
It is noted that some of the past relationships between FAA safety regulations and CAB economic regulation of domestic air carriers are undergoing change in the wake of Airline Deregulation. Historically, FAR Part 23 has been applicable to small aircraft operated under Part 135 operating certificates but exempted from the additional complexities of CAB economic regulation. The generally more stringent provisions of FAR 25 applied to larger transport aircraft operated under Part 121 operating certificates applicable to commercial air carriers. Currently, commuter operations can be carried out under FAR Part 135 in aircraft which can seat up to 30 passengers and have maximum payloads of 7,500 pounds. But under economic deregulation the CAB has amended Part 298 of the economic regulations to permit commuter airlines to operate aircraft seating up to 60 passengers and having a maximum payload capacity of 18,000 pounds. The FAA is considering the suitability of modifying Part 25 certification standards to accommodate certain aspects of these medium size commuter transports, such as aisle widths and control system requirements which differ from those needed for wide-body jet transports. 32
32Aviation Week and Space Technology, Volume 113, Number 19, November 10, 1980, page 25.
5-8

ENVIRONMENTAL CONTROL
The principal environmental concern impacting on general aviation is associated with aircraft noise. In 1971, the joint DOT-NASA Civil Aviation Research and Development (CARD) Policy Study highlighted aircraft noise as the most critical environmental problem impeding aviation growth. Public objections to high-noise areas near major air carrier airports provided impetus in the 1970s for the Federal government to include noise abatement measures in aircraft airworthiness standards and airport approach and departure paths to reduce the impact of aircraft noise around those airports. Such regulatory measures and implementations of noise reduction technology have been primarily oriented toward reducing the impact of noise around commercial air carrier airports, but general aviation airport noise is also a growing environmental concern. 33
Aviation noise abatement efforts have primarily been focused on reducing noise exposure levels in the vicinity of the larger air carrier airports. These efforts have involved both government and industry initiatives to identify sources of aircraft noise, measure the exposure levels around airports, reduce sources of aircraft noise, devise operating procedures to minimize noise impacts, foster land use planning, and develop new noise abatement technology. The FAA has established noise standards (FAR Part 36) to limit the noise levels of new design and new production aircraft, including small propeller-driven aircraft as well as jet aircraft. Through these initiatives in both the public and private sectors, progress has been made in reducing some aspects of aircraft noise, primarily in the vicinity of air carrier airports, but the extent and severity of general aviation contributions to airport noise is an area of growing concern. 34
There is a considerable body of aircraft noise technology. Much of this technology is based on research and technology sponsored by NASA and other government agencies. The aircraft industry makes use of advances in
33Conference on General Aviation Airport Noise and Land Use Planning, Georgia Institute of Technology, October 3-5, 1979.
34Report on Conference on General Aviation Airport Noise and Land Use Planning, Georgia Institute of Technology, October 3-5, 1979, Volume II-Prepared Papers.
5-9
technology to lower aircraft noise emissions to meet regulatory standards and to improve aircraft performance where economically justifiable. For example. the application of high bypass ratio turbofan engines has reduced noise and improved fuel economy of new jet-powered aircraft. But aircraft noise is still a major public concern and is viewed as a potential impediment to the continued growth of general aviation.
It is considered vital that continued progress be made on research efforts for reducing engine noise. New technology is needed to reduce future aircraft noise levels below the standards specified for FAR 36 (Stage 3). Fruitful areas for research on general aviation noise problems are demonstration of noise reduction concepts in new propeller designs. evaluation of innovative propulsion designs. methods for predicting propel lor installation effects and noise of turboshaft engines. and investigation of airframe noise reduction methods.35
35 Noise Technology Research Needs and the Relative Roles of the Federal Government and the Private Sector, Proceedings of the EPA Noise Technology Research Symposium, January 29-31,1979, Dallas, Texas.
5-10
VI. IMPACT OF INCREASING FOREIGN COMPETITION
In the past, U.S. manufacturers of general aviation aircraft dominated the world market largely because of technical superiority, pricing policies, marketing techniques, and after sales support of their products. This technical superiority was due in great part to the large bank of available R&D data that existed at the end of World War II and which the aircraft and component manufacturers were able to develop quickly and economically into commercial products. 36
Today, the dominant position of the United States general aviation industry is being challenged by the dynamic efforts of international competitors, particularly Canada, the United Kingdom, France, Spain, Italy, Germany, Israel, Australia, Japan, Brazil and Indonesia. The greatest challenge has been in the areas of commuter and business jet aircraft. Foreign governments have targeted these areas as matters of national priority. A primary target for the foreign competitors marketing efforts has been the United States since they see that the majority of future sales will be here.
36Civil Aviation Research and Development Policy Study, DOT TST-10-4, NASA SP-265, a Joint DOT-NASA Report, March 1971.
6-1

This section examines the impact of increasing foreign competition in the general aviation and commuter industries. Its objective is to determine the implications to the U.S. industry's current and future posture. The section includes an overview of current and projected general aviation and commuter markets and the impact foreign competition is having on the historical U.S. market share. Individual foreign manufacturers of general aviation are discussed with respect to their current and future products and the amount of advanced technology incorporated into their aircraft designs. In view of the limited scope of this effort, areas requiring a more in-depth analysis have been highlighted. The impact of foreign government aviation policies have been investigated and their influence on general aviation and commuter aircraft development, technology levels and marketing are reported.
OVERVIEW OF CURRENT AND PROJECTED GENERAL AVIATION AND COMMUTER MARKETS
The 1981 world-wide sales of 20 manufacturers of general aviation and commuter aircraft consisted of about 9,800 units of various sizes and uses. 37 Historically. the u.s. manufacturers have held a 90 percent share of this market. Foreign manufacturers now dominate the 15~60 passenger light transport segment and new competitors, i.e., Japan and Canada have entered the business jet market. The u.s. continues to dominate the light single- and multi-engine piston aircraft markets.
Commuter Market
Table 6.1 presents the 1978 distribution of the worldwide inventory for light transport in terms of units and percent of the market. It is readily apparent that the United States contains the largest share
37Susiness Aviation, January 11, 1982, page 13.
6-2

TABLE 6.1
LIGHT TRANSPORT MARKET SHARE (Percent of Total)
15-19 20-40 41-60 TOTAL
United States 255(44) 124(25) 353(22) 732(28)
West Europe 63(11 ) 80(16) 208(13) 351 (13)
South Asia 63(12) 29( 6) 223 (15) 315(12)
Latin America 75(13) 65(13) 143( 9) 283(11)
Africa 33( 6) 62(13) 161(10) 256(10)
Canada 41( 7) 79(16) 102( 6) 222( 9)
East Asia 2( 1) 10( 2) 158(10) 170( 6)
South Pacific 14( 2) 18( 4) 102( 7) 134( 5)
Middle East 24( 4) 11( 2) 50( 3) 85( 3)
South Atlantic 8( 1) 13( 3) 41( 3) 62( 2)
East Europe QLO) QLO) 3~2) 321-1)
TOTAL 578(100) 491(100) 1580(100) 2649(100)
SOURCE: Light Transport Market Forecast Report prepared for the Office of Aviation Policy, Federal Aviation Administration, Washington, D.C. by the Aerospace Corporation, July 1979.
6-3

of this market (28 percent) especially in the 15-19 seat category where 44 percent of the aircraft are located.
The units shown in Table 6.1 include the aircraft used for such missions as commuter, regional and supplemental airlines; government and military; as well as other operators (corporate, lease companies, manufacturers, etc.). Since the same basic aircraft is used for these various missions, it is important that the manufacturers consider the entire potential market in determining whether or not to proceed with a new aircraft development. The demand for the larger light transport aircraft is greater in the non-U.S. markets for regional and supplemental airlines missions where limited runway lengths preclude the use of jet aircraft. This market is currently serviced in the U.S. by B 737 and DC 9-type aircraft. As the commuter airlines establish themselves and take over the routes previously serviced by the air carrier airlines prior to deregulation, the market for larger light transports in the U.S. will increase.
The forecast for light transports for the years 1980-2000 is shown in Table 6.2. The trend towards a larger share of the world market of larger light transport aircraft is evident in Table 6.3 with the most dramatic increase in the 20-40 passenger range. This potential 199638 aircraft market is the target of several new commuter aircraft such as the de Havilland Dash 8, the Saab-Fairchild 340, EMBRAER Brasilia (EMB-120), Shorts SD 360 and CASA-Nurtanio CN-235. Of these aircraft only the Saab-Fairchild 340 can claim some U.S. origin.
38This is a composite of many manufacturers forecasts. For example: CASANurtanio forecasts a requirement for 1800 of the 30-40 seat aircraft between 1984 and 1994 plus 600 for military applications. Saab-Fairchild forecasts a minimum of 1600 and de Havilland 2000 of these aircraft to meet the worldwide market. SOURCE: Interavia, 8/1981, p. 819.
6-4
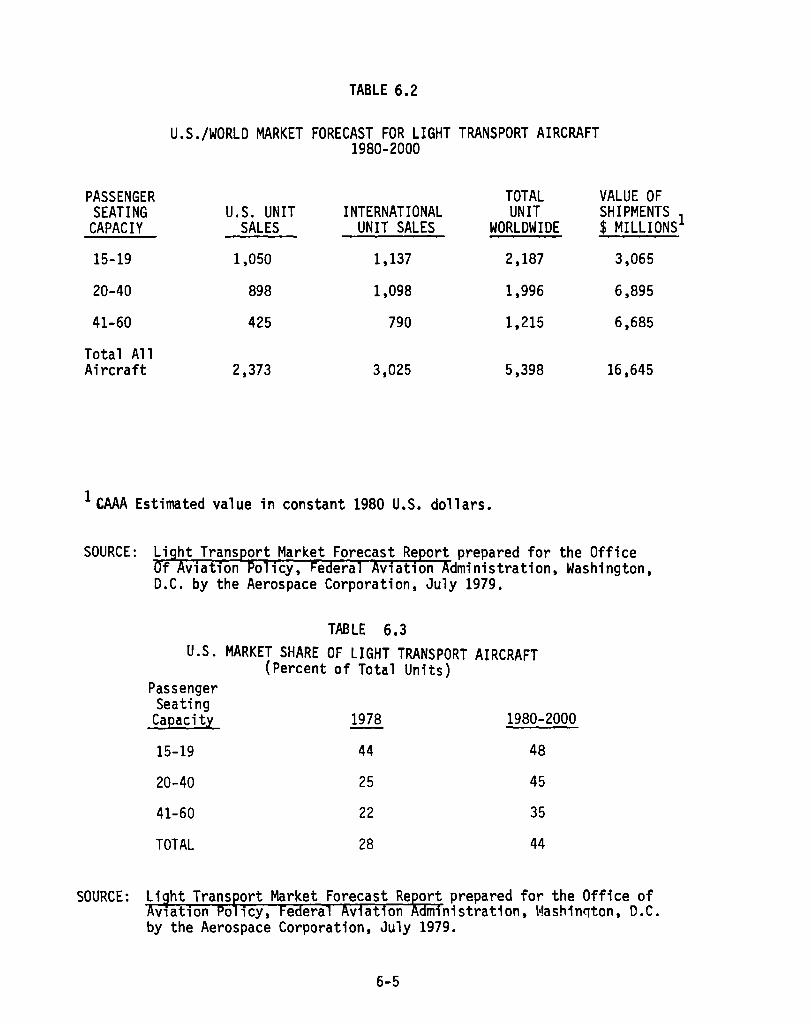
TABLE 6.2
U.S./WORLD MARKET FORECAST FOR LIGHT TRANSPORT AIRCRAFT 1980-2000
PASSENGER TOTAL VALUE OF SEATING U.S. UNIT INTERNATIONAL UNIT SHIPMENTS 1
CAPACIY SALES UNIT SALES WORLDWIDE $ MILLIONS
15-19 1,050 1,137 2,187 3,065
20-40 898 1,098 1,996 6,895
41-60 425 790 1,215 6,685
Total All Aircraft 2,373 3,025 5,398 16,645
1CAAA Estimated value in constant 1980 U.S. dollars.
SOURCE: Light Transport Market Forecast Report prepared for the Office Of Aviation Policy, Federal Aviation Administration, Washington, D.C. by the Aerospace Corporation, July 1979.
TABLE 6.3 u.S. MARKET SHARE OF LIGHT TRANSPORT AIRCRAFT
(Percent of Total Units) Passenger Seating Capacity 1978 1980-2000
15-19 44 48
20-40 25 45
41-60 22 35
TOTAL 28 44
SOURCE: li~ht Trans~ort Market Forecast Re~ort prepared for the Office of AV1ation Po icy, Federal Aviationdministration, Wash1nQton, D.C. by the Aerospace Corporation, July 1979.
6-5
Business Jet Market
The United States also represents the largest segment of the business aircraft market comprising 69 percent of all business aircraft in service around the world. Europe makes up 18 percent of the market with 13 percent distributed among other countries. However, unlike the commuter market, American manufactured aircraft dominate with nearly 66 percent of the business aircraft in service today produced in the United States.
In the past ten years, the sale of business jets has skyrocketed. In 1978, 270 new business jets built by U.S. and European manufacturers joined the some 4,000 business aircraft in service around the world. The 1979 deliveries showed a 38 percent growth rate compared to 1978 with 280 U.S. and 50 European aircraft placed into service. The 1980 deliveries rose by 15 percent compared with 1979 despite the fact the world was in a relatively severe recession.
Current market forecasts envision particular strength in the turboprop field as well as for slightly less dramatic yet steady growth in turbojets. One recent long-range market forecast39 revealed that sales of U.S. manufactured business turboprops and turbojets are expected to double from 1980 totals of 1,100 to about 2,300 by 1985 with a value of $3.3 billion. All aircraft manufacturers, however, are not in agreement and at least one manufacturer believes sales will actually drop in the near future with the increase in deliveries an illusionary figure resulting from aircraft ordered several years ago.
Other General Aviation Aircraft
The production of general aviation aircraft (other than the commuter and business aircraft described above), is dominated by three firms, Cessna Aircraft Company, Beech Aircraft Corporation (a subsidiary of Raytheon) and Piper Aircraft Corporation (a subsidiary of Bangor Punta). In
39John H. Winant, President of NBAA, Remarks at the International Aerospace Symposium, Le Bourget Airport, Paris, France, June 3, 1981.
6-6

1980, these manufacturers accounted for 92 percent of the new aircraft shipped and 67 percent of the net billings. Cessna had the largest share of the market with 57 percent of all shipments and 32 percent of net billings. Piper and Beech had 27 and 9 percent of unit shipments, respectively. Historically, Cessna and Piper have been the major producers of the light, less costly, single-engine and multi-engine piston aircraft -- Beech has had the major share of the market for the larger, more sophisticated, aircraft. In 1980, Cessna produced 62 percent of the single-engine piston aircraft, Piper built 22 percent. In other categories, Cessna, Piper, and Beech accounted for 98 percent of the twin-engine piston units shipped.
Foreign Trade Ba]anace
Over 90 percent of the 280,000 general aviation aircraft in the world-wide civil aircraft fleet were manufactured in the United States. In 1981, American manufacturers exported about 24 percent of the general aviation aircraft produced in the United States. The value of these general aviation exports were $749 million in 1981, a slight decrease of about one percent compared to the value of 1980 exports.
General aviation aircraft imports in 1981 reached a record level of $843 million. As indicated in Figure 6.1, general aviation exports contribute to the U.S. trade balance, but in recent years the net value of that contribution has declined from about $340 million in 1978 and 1979 to a deficit in 1981. This decline in trade balance is largely attributed to increases in imported aircraft deliveries to U.S. operators of multi-engine light transport aircraft and business jets which are the high value general aviation aircraft.
Of course these figures give only an indication of the true balance of payments situation. A more accurate accounting of the impact from the sales of foreign general aviation aircraft requires an in-depth analysis of each aircraft to determine the degree to which it incorporates U.S. technology, labor and components. The effort required for such an analysis is beyond the scope of this study; however, an indication of the complexity is illustrated by the many situations which now exist. These situations are presented below:
6-7
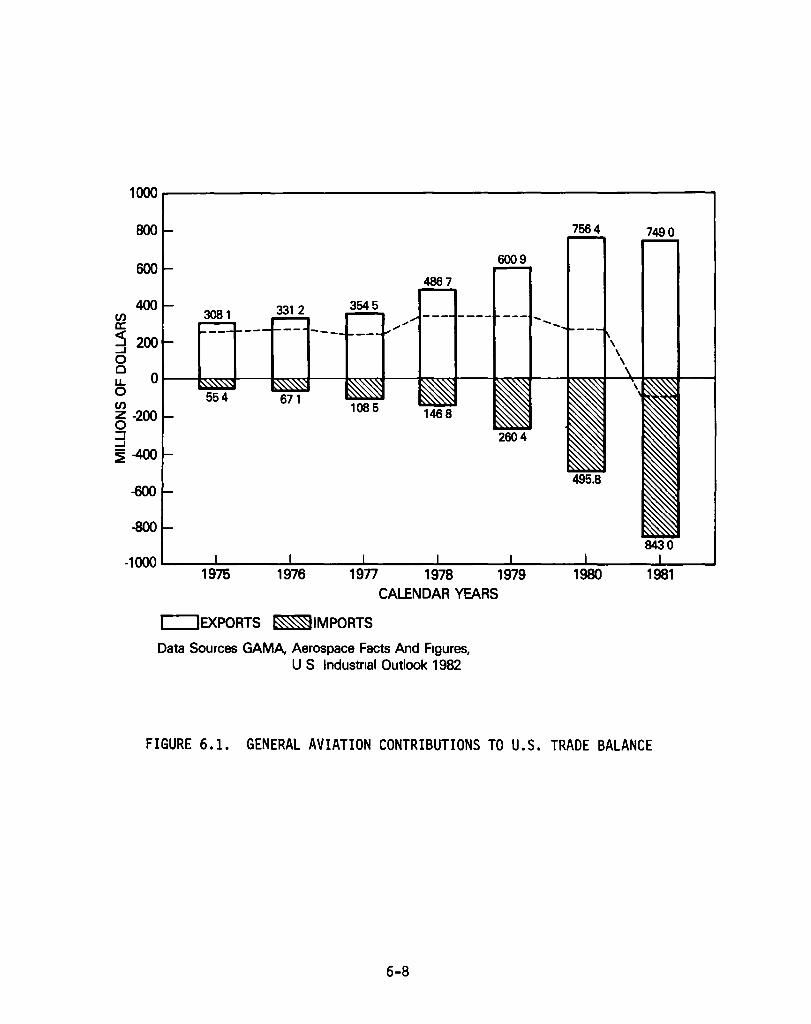
1~----------------------------------------------------~
en a::
800
600
400
7564 7490
6009
4867
~ 200 ....J o o LL o en z -200 o ~ ....J
~-400
-600
-1~~--~------~----~------~------~----~------~--~ 19n 1978 1979 1980 1981 1975 1976 CALENDAR YEARS
c::::::JEXPORTS ~IMPORTS
Data Sources GAMA, Aerospace Facts And Figures, U S Industrial Outlook 1982
FIGURE 6.1. GENERAL AVIATION CONTRIBUTIONS TO U.S. TRADE BALANCE
6-8

• U.S. product: the aircraft and all its components are designed, built and assembled in the United States (e.g., Cessna aircraft).
• U.S. product with foreign components: the aircraft is designed and assembled in the United States but some components are built outside the U.S. (e.g., aircraft with P&WAC PT6 engines).
• U.S. product assembled in a foreign country: the aircraft is designed and the components built in the U.S. but the aircraft is assembled in a foreign country (e.g., Piper alc kits assembled in Braz1l).
• Joint production: the design, manufacture and assembly of the aircraft is a joint venture with a foreign country (e.g., SF 340).
• Foreign product assembled under license in U.S. using compone~ts made primarily in a foreign country (e.g., Dassault Falcons).
• Product designed in the U.S. but built in a foreign country (e.g., Lear Fan in Ireland).
• Foreign product assembled outside the U.S. using many U.S. components (e.g., EMBRAER Bandeirante).
• Foreign product designed, built and assembled using all foreign parts (e.g., none identified since at least the avionics package is manufactured in the U.S.).
• U.S. desi"n morlified as a rlifferent aircraft and built in a foreign country (e.g., Aero Commander in Israel) using many U.S. components.
6-9

FOREIGN GENERAL AVIATION AIRCRAFT
A review of the current commuter aircraft. both U.S. and foreign. indicates that the major competitors to the U.S. commuter aircraft industry are France. Great Britain. Spain. Canada. the Netherlands and Brazil. Future commuter aircraft. currently under development will bring strong competition from Great Britain, Canada. Germany, Brazil, a team of France and Italy, a team of Spain and Indonesia, and Sweden who is in a joint venture with Fairchild. The European Communist Bloc Countries, particularly Czechoslvakia and the USSR. appear content to market within their own sphere of influence. However, the Czech LET L-410 UVP twin-turboprop is reported to be aimed at the Western market and the Third World countries although it is principally intended for the European Communist Bloc countries. 40
Japan appears to be concentrating on business jets with the emerging nations building small personal type aircraft.
Current and Projected Commuter Aircraft
Figure 6.2 presents a scattergram of current and future aircraft options for the commuter market by number of seats and year of introduction. U.S. aircraft are shown by a solid circle. foreign aircraft by an open circle and the joint U.S./Sweden venture by a half circle. It is readily apparent that the larger (>19 seats) market is dominated by the foreign manufacturers with the only new U.S. models envisioned for the eighties being the CAC 100, the Ahrens 404 and the joint U.S./Sweden SF 340. The situation becomes even more serious when one considers there are no confirmed orders for either the CAC 100 or the Ahrens 404.
The major characteristics and performance parameters for each of these aircraft are shown in Table 6.4.
40Interavia, 9/1979.
6-10
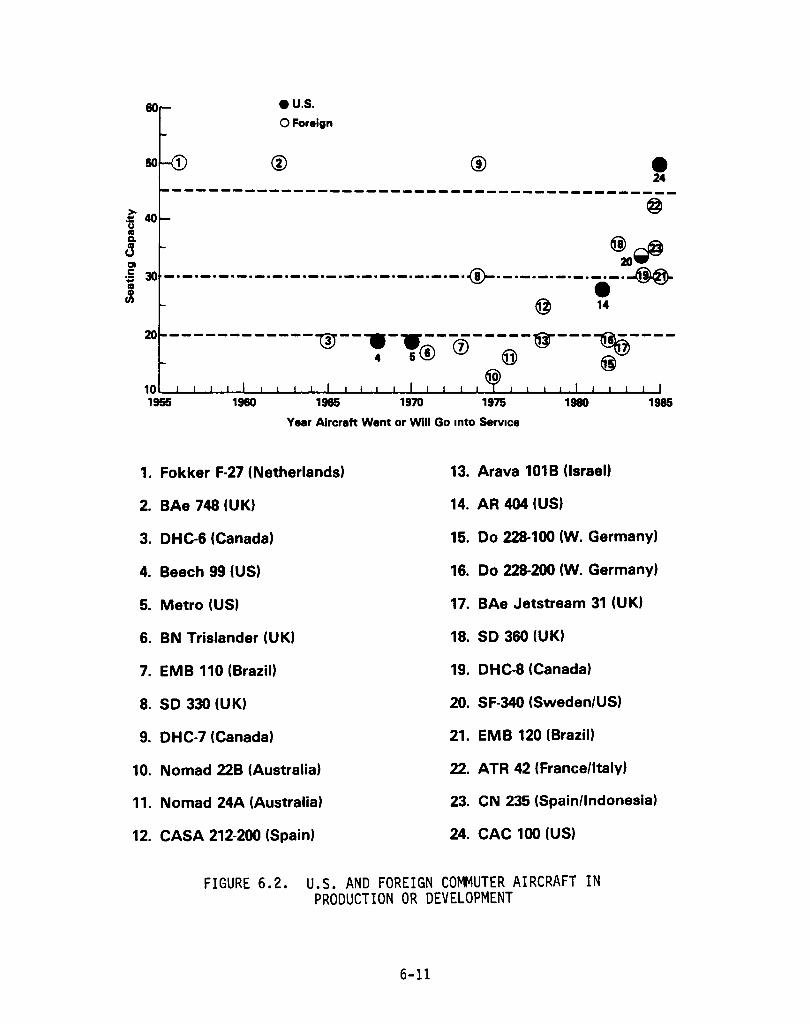
80 • u.s. o Foreign
• 24 ------------------------------------------
.~ 40 u ftI
~ ~~ J ~ -·-·-·-·-·-·-·-·-·-·-·-·-·-·-·-·-·~·-·-·-·-·-·tt-·~ @ 14
~ ------------~--~-lf@-(6--~-~---~----
o
1960 1965 1970 1975 1980 1985
Year Aircraft Went or Will Go Into Service
1. Fokker F·27 (Netherlands) 13. Arava 101B (Israel)
2. BAe 748 (UK) 14. AR 404 (US)
3. OHC-6 (Canada) 15. Do 22S-1OO (W. Germany)
4. Beech 99 (US) 16. Do 228-200 (W. Germany)
5. Metro (US) 17. BAe Jetstream 31 (UK)
6. BN Trislander (UK) 1S. SO 360 (UK)
7. EMB 110 (Brazil) 19. OHC-S (Canada)
S. SO 330 (UK) 20. SF-340 (Sweden/US)
9. OHC-7 (Canada) 21. EMB 120 (Brazil)
10. Nomad 22B (Australia) 22. ATR 42 (France/Italy)
11. Nomad 24A (Australia) 23. eN 235 (Spain/Indonesia)
12. CASA 212-200 (Spain) 24. CAC 100 (US)
FIGURE 6.2. U.S. AND FOREIGN COMMUTER AIRCRAFT IN PRODUCTION OR DEVELOPMENT
6-11

TABLE 6.4
COMMUTERS
MANUFACTURER AIRCRAFT COST SEAT· CABIN ENGINES WE IGHT CRUISE CE lUNG 8REAK EST DEL PRESS ING LIH/W MAX TO SPEED EVEN DATE
100S LF
P ILATUS 8·N 8N·2B· \' S 301,930 2+8 10/3 9/3 6 (2) Lyc IO·540·KI85 300 hp ea 6,600 137 18,000 o 217 No IS1 andE'r
CESSNA CE·402C S 333,606 2+8 15 8/4 2/4 7 (2) Cont TS 10· 502V8 lZS hp .a 6,850 174 26,900 o 245 No
Ul trill ner
PIPER PA 31-3~O S 377 ,620 2+8 la 1/4 3/4 2 (2) LYC TlO·540-J'11D 350 hp •• 7 000 163 24,000 o 242 No Navajo Chi eft.,
CESSNA CE 404 S 478,910 2+9 13 8/4 3/4 7 (2) Cont GTSIO·51OM 375 hp •• 8 400 174 26,000 o 262 No Titan Courier II
PILATUS 8·N 8N·2A-III·' S 514,120 2+16 21 5/3 9/3 6 (3) Ly<: 0-540·E4·C5 260 hp •• 10,000 145 12,400 o 144 No Trisl ande'"
de HAV ILLANO DlTL·6·30) S 1,170,000 2+19 18 4/4 9/5 3 (2) PlW PT6A-27 620 shp ea 12,SOO 172 26,700 o 187 No Twl n Otte'"
GAF N24A S 1,196,308 2+16 21 3/5 2/4 3 (2) All 250·B-l7C 385 ,hp .a 9,400 163 20,500 o 239 No Nomad
BEECH 8E·C99 S 1,335,000 2+15 18 7/4 8/4 5 (2) PlW PT6A·36 750 shp •• 11,300 249 28,080 o 209 No C8 99
EMBRAER EMS·II0PI S 1,495,998 2+18 31 2/5 3/5 3 (2) PlW PT6A-34 750 shp .a 12,SOO 224 22, SOO o 244 No Bandarante
ISRAEL IAI·IOI8 S 1,650,000 2+18 22 4/5 8/7 7 (2) PlW PT6A.36 750 Shp ea 15,140 139 23,600 o 268 No AIRCRAFT AraYI IND
SWEARINGEN SA227·AC S 1,845,000 2+19 25 4/4 8/5 2 (2) AR TPE·331·110 1,000 shp ea 14,000 2SO 30,\00 o 221 Yes Metro III
CASA C212·200 S 2 121,700 3+26 26 1/5 9/6 8 (2) AR TPE 331·10 900 shp e. 16,427 185 25,000 o 216 No COtIIIIuter
SI«lRT BROS SO 3·30 S 2,870,000 3+30 31 0/6 5/6 5 (2) PlW PT6A.458 1,156 .hp e. 22,900 165 20,000 o 212 No LTO Shorts 330
GULFSTREAM Gulfstream S 3,000,000 3+37 41 0/6 1/7 5 (2) RR Dart 7 It( 529·8x 1,910 shp .. 36,000 300 30,000 o 218 Yes AM IC
de HAVILLAND IlHC·7 S 5,020,000 3+50 39 5/6 4/7 0 (4) PlW PT6A·SO 1,120 .hp e. 44,000 230 21,000 o ISO YIS Dash 7
FOICKER F27 It( SOO S 6,350,000 3+50 52 4/6 8/8 5 (2) RR Dart 7 It( 535·7 2,020 .hp ea 45,000 259 ~;,q;xl o 193 Yes Frtendsl"lp
8RlTlSH HS 748·28 S 6,500,000 3+48 46 6/6 3/8 I (2) RR Dart 7 It( 535·2 2,2SO .hp ea 46,500 234 25,000 o 227 Yes AfROSPACE Intercity
FQI(J(ER F28 It( 4000 SlO,550,OOO 4+85 50 3/6 7/10 2 (2) RR RB 183·1t( 555-15 9,900 lb. .. 73,000 437 35 000 o 133 Yes Fellowship
AIilENS 402 S 2,000,000 +27 N/A (2) AR TPE 331·U 1,100 ,hp .a 16,000 170 NA NA 1982 No
AHRENS 404 S 1,8· +30 8 0/6 0/6 0 (4) 2,000 000
All 2SO·8178 440 shp ea l7 ,000 170 18,000 NA 1981 No
8RITISH Jetstream 31 S 1,800,000 +19 4 0/6 0/5 9 (2) AfROSPACE
AR TPE 331-10 900 shp ea 14,110 263 31,000 NA 1962 Yes
BEECH 1900 S 1,600,000 +19 N/A (2) P&W PT6A 1,000 shp ea 15,245 263 NA NA 1963 Ves
COlMJTER CAC·lOO S 3,000,000 +44 N/A (4) PlW PT6A·41 850 shp ea 28,900 287 1982 No AIRCRAFT CORP
de HAVILLAND Dash 8 S 4,000,000 +32·36 N/A (2) PlW PT 7A-l 1,700 'hp .a 29 000 260 25,000 NA 1964 Yes
OORNIER 228-100 S 1,400,000 +15 a/4 5/5 3 (2) AR TPE 331·5 71~ .. hp ea 12,568 233 29,6:>0 NA 1981 Ve,
DORNIER 228-200 S 1,500,000 +19 6/4 5/5 3 (2) AR TPE 331·, 715 shp ea 14,500 233 27,6CC NA 1981 Ves
EHBRAfR 1l0P-3 11 550 000 +19 N/A (?, Plio! PTf::II.."C; ',17" .......... ~ 15 440 300 ". .. 1983 Ves Bandlerante
EMIIRAER 120 S 3 200,000 +30 9 8/7 1/5 7 (2) PlW PT 7A-1 1 500 ,hp e. 20,000 287 35,500 NA 1985 Ve, Brasll'l
FAIRC"ILD/ SF 340 I 3,450,000 3 +34 33 7/7 1/6 ~ (2) GE CT 7-5 1 650 shp ea 25 000 360 N~ NA 1984 Yes SAAB Ccmnuter
SffJRT BROS 360 S 3 400 000 3 +26 3E 1/6 3/6 3 (2) P&" PT6A-65' 1 294 shp ea 25 700 IO(J NA NA 1982 No LTD
AERO- AS 35 I 5 000 000 +40-46 ~A NA NA NA NA NA 1985 NA SPATIALEI AGRITALIA
BRlTl SH BAE 146-100 110 000 000 4/5+ ,0 5/11 0/6 2 4 Ly<: ALF 502 R-3 6,700 lhs ea 78 850 434 22 000 ~A 1982 Yes AfROSPACE 71
BRlTISH 8Af 146-200 ~A 4/5+ 58 5/11 "IE 24 Ly<: AFL Aerospace 100
502 R-3 6 700 lbs ea 87 500 424 24,000 .. 19B3 Yes
6-12
Current and Projected Business Aircraft
In the business aircraft field, products from France, Great Britain, Israel, Canada and shortly Japan are making inroads into the U.S. business turbojet fleet. Japan is already a factor in the turboprop field.
Of the 1680 turbojets operated by the 2500 member companies of NBAA, 31 percent were manufactured outside the U.S. Three aircraft types made up this 31 percent: the several models of Falcons produced in France; the British Aerospace HS lines manufactured in Great Britain and the Jet Commander/Westwind series from Israel. New products will come in the form of the Challenger lines from Canada and the Diamond I turbojets from Japan.
The British report that the 125 series is a sellout in the U.S. market for the next two years. Canadair has delivered 16 Challengers to completion centers in the U.S. and reports its on order backlog lists 125 Standard models, 75 IE"41 (extended models), along with 11 GE powered standard models.
Israel expects to have placed 400 Westwind aircraft in the U.S. by 1985. By that time they hope to introduce their new Astra model.
Falcon looks for an increase in the monthly production rate from 8 to 10 units consisting of Models 10, 20, 200 and 50.
Japan has 121 orders for the Diamond I and regards the Diamond II as a natural follow-on by mid 1985.
Table 6.5 presents the principal characteristics and performance parameters for the current and projected business turbojet/turbofan aircraft. Here over half of the options available to the potential business jet customer are manufactured in the U.S. of the foreign models, the Falcon and the Diamond I are, or will be, assembled in the U.S. In addition, the CL 600 is a Lear designed aircraft.
The U.S. turboprop market is brighter with 87 percent of the 1029 aircraft registered to NBAA members manufactured in the U.S., Japan and Canada are the only notable foreign competitors.
41Canadair has recently announced cancellation of the "E" model. Canadair hopes to convert these "E" model orders to orders for standard models.
6-13
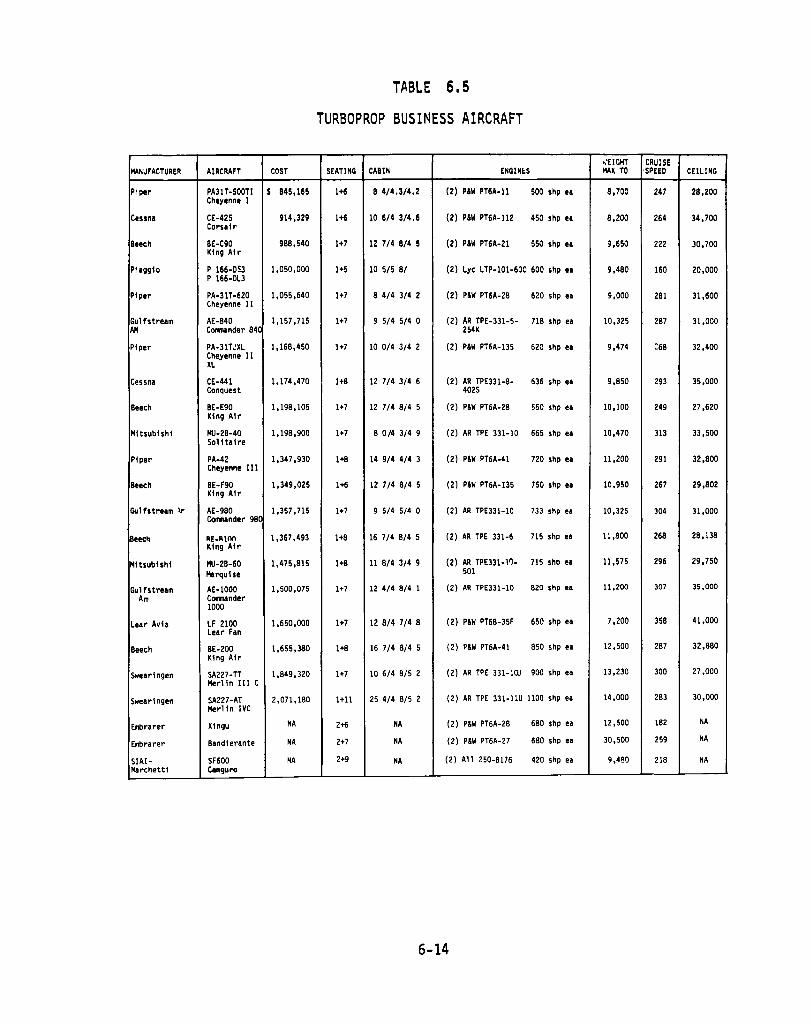
TABLE 6.5
TURBOPROP BUSINESS AIRCRAFT
,EIGHT CRUISE MANUFACTURER AIRCRAFT COST SEATING CABIN ENGIN~S MAX TO ' SPEED CEILING
Piper PA31 T-500Tl S 845,165 1+6 8 4/4.3/4.2 (2) paw PT6A-ll 500 shp .. 8,700 247 28,200 Cheyenne I
Cessnl CE-425 914,329 1+6 10 6/4 3/4.6 (2) paw PT6A-1l2 450 shp .. 8,200 264 34,700 CorSI I r
Beech BE-C90 988,540 1+7 12 7/48/4 5 (2) paw PT6A-21 550 shp ea 9,650 222 30,700 KIn9 Air
PIlgglo P 166-053 1,050,000 1+5 10 5/5 8/ (2) Lyc LTP-I01-60C 600 shp el 9,480 160 20,000 P 166-0L3
Piper PA-31T-620 1,055,640 1+7 8 4/4 3/4 2 (2) paw PT6A-28 620 shp el 9,000 281 31,600 Cheyenne II
Gulfstrelm AE-840 1,157,715 1+7 9 5/4 5/4 0 (2) AR TPE-331-5- 718 shp el 10,325 287 31,000 AM Comnander 84C 254K
Piper PA-3lT~XL 1,168,450 1+7 10 0/4 3/4 2 (2) paw PT6A-135 620 shp e. 9,474 :68 32,400 Cheyenne II XL
Cessna CE-441 1,174,470 1+8 12 7/4 3/4 6 (2) AR TPE331-8- 636 shp ea 9,850 293 35,000 Conquest 4025
Beech BE-E90 1,198,105 1+7 12 7/4 8/4 5 (2) paw PT6A-28 550 shp el 10,100 249 27,620 King Air
Hitsubishi HU-2B-40 1,198,900 1+7 8 0/4 3/4 9 (2) AR TPE 331-10 665 shp el 10,470 313 33,500 Solitlire
Piper PA-42 1,347,930 1+8 14 9/4 4/4 3 (2) paw PT6A-41 720 shp el 11,200 291 32,800 Cheyenne III
Beech BE-F90 1,349,025 1+6 12 7/4 8/4 5 (2) paw PT6A- 135 750 shp el 10,950 267 29,802 King Air
Gul fstrelm .\r' AE-980 1,357,715 1+7 9 5/4 5/4 0 (2) AR TPE331-10 733 shp el 10,325 304 31,000 Comnander 98C
Beec~ RE-RIM 1,367,493 1+8 16 7/4 8/4 5 (2) AR TPE 331-6 715 shp el 11,800 268 28,138 King Air
Hitsublshi HU-2B-60 1,475,815 1+8 11 8/4 3/4 9 (2) AR TPE331-l~- 715 shp el 11,575 296 29,750
Marquise 501
Gulfstrelm AE-I0oo 1,500,075 1+7 12 4/4 8/4 1 (2) AR TPE331-10 820 shp e. 11,200 307 35,000 Am Comnander
1000
Lear Avia LF 2100 1,650,000 1+7 128/4 7/4 8 (2) paw PT68-35F 650 shp el 7,200 358 41,000 Lelr Fan
Beech BE-200 1,655,380 1+8 16 7/4 8/4 5 (2) paw PT6A-41 850 shp ea 12,500 287 32,880 Kin9 Air
Swearingen SA227-TI 1,849,320 1+7 10 6/4 8/5 2 (2) AR TPE 331-lUJ 900 shp ea 13,230 300 27,000 Merlin III C
Swearingen SA227-AT Merlin IYC
2,071,180 1+11 25 4/4 8/5 2 (2) AR TPE 331-11U 1100 shp ea 14,000 283 30,000
Embrarer Xingu NA 2+6 NA (2) paw PT6A-28 680 shp ea 12,500 182 NA
Embrarer 8andi erante NA 2+7 NA (2) paw PT6A-27 680 shp ea 30,500 259 NA
SIAI- SF600 NA 2+9 NA (2) All 250-8176 420 shp ea 9,480 218 NA Marchetti c.nguro
6-14

Table 6.6 presents the principal characteristics and performance paremeters of the current and projected business turboprop aircraft. It is readily apparent that sixteen of the aircfaft are manufactured in the U.S. whereas only seven are foreign built. Of these seven, two are assembled in the U.S. and one, the Lear Fan, is a U.S. design to be built in Ireland.
Use of Advanced Technology
An examination was made of available information to determine the extent of advanced technology incorporated into the foreign general aviation aircraft. The major difficulty in identifying this data was in deriving an acceptable definition for lIadvanced technologyll. Aircraft are currently being touted as having lIadvanced technologyll by one manufacturer whereas another manufacturer may have been incorporating this same technology for years.
The report by the panel on General Aviation presented at the Workshop on the Role of NASA in Aeronautics42 cited the technical developments in advanced airfoils being made through the work of Eppler and Wortman for use in the Dornier TNT wing on the Do 228-100 and -200. Also mentioned were the use of computer-aided design and supercritical aerodynamics by Dassault in its Falcon 50 and Dowty Rotolls advanced technology propellers now standard equipment on several U.S. turboprops. Examples of technology by discipline which were included in ORlis definition as advanced technology include:
• Aerodynamics
Supercritical wing Winglets Natural Laminar Flow TNT wing (Oornier) Canards and multiple surface configurations Forward swept wing configurations.
42NASAIs Role in Aeronautics: A Workshop, Volume IV, General Aviation, Aeronautics and Engineering Board, National Research Council, 1981.
6-15
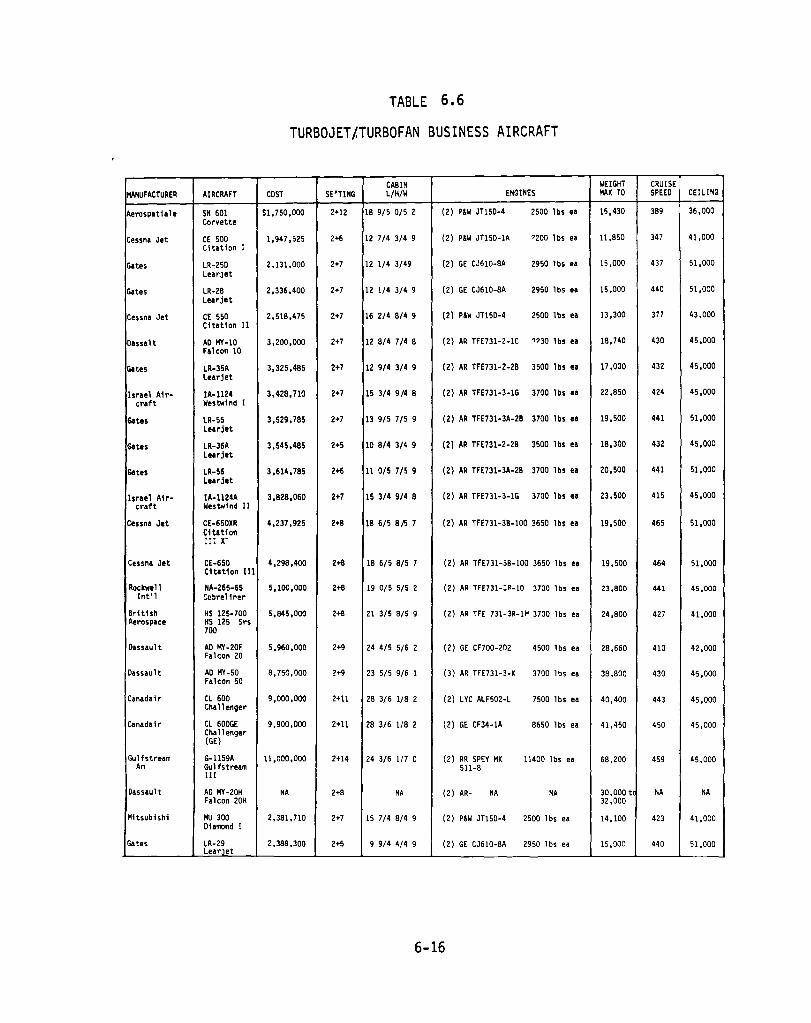
TABLE 6.6
TURBOJET/.TURBOFAN BUSINESS AIRCRAFT
CABIN WEIGHT CRUISE MANUFACTURER AIRCRAFT COST SE'TING L/H/W ENGINES MAX TO SPEEO CEILING
lAerospathle SN 601 $1,750,000 2+12 18 9/5 0/5 2 (2) P&W JTl50-4 2500 I bs ea 15,430 389 36,000 Corvette
Cessna Jet CE 500 1,947,525 2+6 12 7/4 3/4 9 (2) P&W JTl50-IA '200 lbs eo 11,850 347 41,000 Citation I
Gates LR-25D 2,131,000 2+7 12 1/4 3/49 (2) GE CJ610-8A 2950 lbs ea 15,000 437 51,000 LearJet
Gates LR-28 2,336,400 2+7 12 1/4 3/4 9 (2) GE CJ610-8A 2950 I bs ea 15,000 440 51,000 Learjet
Cessna Jet CE 550 2,518,475 2+7 16 2/4 8/4 9 (2) P&W JTl5D-4 2500 I bs ea 13,300 377 43,000 Citation 11
Dassalt AD MY-IO 3,200,000 2+7 12 8/4 7/4 8 (2) AR TFE731-2-IC 1'30 lbs ea 18,740 430 45,000 Falcon 10
Gates LR-35A 3,325,485 2+7 12 9/4 3/4 9 (2) AR TFE731-2-2B 3500 I bs ea 17 ,000 432 45,000 Learjet
Israel A1r- lA-1124 3,428,710 2+7 15 3/4 9/4 8 (2) AR TFE731-3-IG 3700 lbs ea 22,850 424 45,000 craft Westwind I
Gates LR-55 3,529,785 2+7 13 9/5 7/5 9 (2) AR TFE731-3A-2B 3700 I bs ea 19,500 441 51,000 Learjet
Gates LR-36A 3,545,485 2+5 10 8/4 3/4 9 (2) AR TFE731-2-2B 3500 I bs ea 18,300 432 45,000 Lllrjet
Gates LR-56 3,614,785 2+6 11 0/5 7/5 9 (2) AR TFE731-3A-2B 3700 I bs ea 20,500 441 51,000 Learjet
Israel A1r- IA-1124A 3,828,060 2+7 15 3/4 9/4 8 (2) AR TFE731-3-IG 3700 lbs ea 23,500 415 45,000 craft Westwlnd 11
Cessna Jet CE-650XR 4,237,925 2+8 186/58/5 7 (2) AR TFE731-3B-IOO 3650 lbs ea 19,500 465 51,000 C1tat1on !~: X-
Cessna Jet CE-650 4,298,400 2+8 18 6/5 8/5 7 (2) AR TFE731-3B-IOO 3650 I bs II 19,500 464 51,000 C1 tlt10n III
Rockwell NA-265-65 5,100,000 2+8 19 0/5 5/5 2 (2) AR TFE731-:~-10 3700 lbs ea 23,800 441 45,000 Int'l !:il~rel1rer
Britlsh HS 125-700 5,845,000 2+8 21 3/5 8/5 9 (2) AR TFE 731-3R-IH 3700 lbs ea 24,800 427 41,000 Aerospace HS 125 Srs
700
Oassault AD MY-20F 5,960,000 2+9 24 4/5 5/6 2 (2) GE CF700-2D2 4500 lbs eo 28,660 410 42,000 Falcon 20
Dassault AD MY-50 8,750,000 2+9 23 5/5 9/6 1 Falcon 50
(3) AR TFE731-3-K 3700 I bs eo 38,800 430 45,000
Canadal r CL 600 9,000,000 2+11 28 3/6 1/8 2 (2) LYC ALF502-L 7500 I bs ea 40,400 443 45,000 Challenger
Canadalr CL 600GE 9,900,000 2+11 Challenger (GE)
28 3/6 1/8 2 (2) GE CF34-lA 8650 I bs ea 41,450 450 45,000
Gulfstream G-1159A 11,000,000 2+14 24 3/6 1/7 a (2) RR SPEY MK 11400 lbs ea 68,200 459 45,000 AM Gul fstream 511-8
III
Dassaul t AD MY-20H NA 2+8 NA (2) AR- NA NA 30,000 tc NA NA Falcon 20H 32,000
Mltsubhhl MU 300 2,381,710 2+7 15 7/48/4 9 (2) P&W JTl5D-4 2500 I bs eo 14,100 423 41,000 Dlamond I
Gates LR-29 2,388,300 2+5 9 9/4 4/4 9 (2) GE CJ610-8A 2950 I bs eo 15,000 440 51,000 LearJet
6-16
• Propulsion
High By Pass Ratio engines Rotary enoines Diesel engines Internal combustion engines for multiple fuels Improved SFC.
• Materials and Structures
Composites Advanced metals and metal composite hybrids.
• Propellers
Advanced designs (propfans) Improved materials (composites).
Others
• Avionics and Controls
Combined flight and propulsion controls Automatic flight performance management Digital Controls Advanced displays Ride control.
• Subsystems
All electric (e.g., no hydraulics or pneumatics).
It is noted that much of this technology had its beginnings in the NASA Aircraft Energy Efficiency (ACEE) program but has found initial application in general aviation aircraft (e.g., composites and winglets).
Those commuter and business aircraft which appear to contain some advanced technology in their designs are listed in Table 6.7. The absence of an aircraft from the list does not imply that it does not incorporate advanced technology, only that available literature does not highlight any of the items identified above. An indepth investigation of each aircraft is suggested to assure that an accurate listing is presented.
6-17
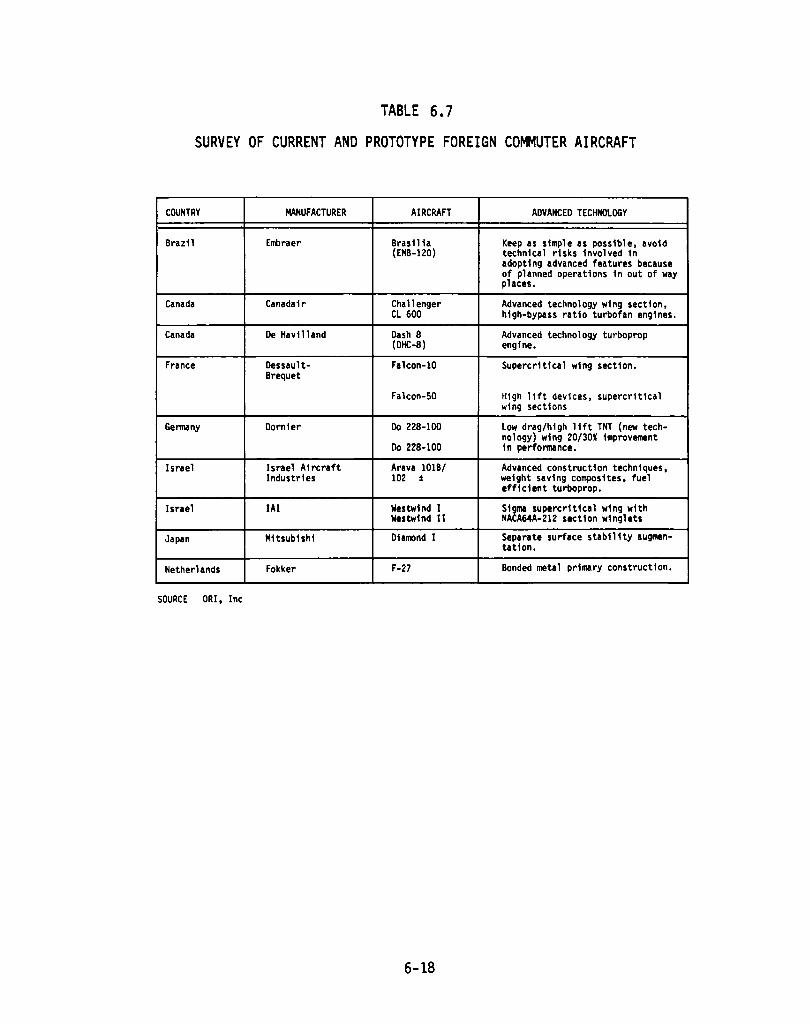
TABLE 6.7
SURVEY OF CURRENT AND PROTOTYPE FOREIGN COMMUTER AIRCRAFT
COUNTRY MANUFACTURER AIRCRAFT ADVANCED TECHNOLOGY
Brazil Embraer Brasilia Keep as simple as possible, avoid (EMB-120) technical risks involved in
adopting advanced features because of planned operations in out of way places.
Canada Canadair Challenger Advanced technology wing section, Cl 600 high-bypass ratio turbofan engines.
Canada De Havilland Dash 8 Advanced technology turboprop (DHC-8) engine.
France Dessault- Falcon-10 Supercritical wing section. Brequet
Falcon-50 High lift devices, supercritica1 wing sections
Germany Dornier Do 228-100 low drag/high lift TNT (new tech-nology) wing 20/30~ improvement
Do 228-100 in performance.
Israel Israel Ai rcraft Arava 101B/ Advanced construction techniques, Industries 102 :t weight saving composites, fuel
efficient turboprop.
Israel IAI Westwind I Sigma supercritical wing with Westwind II NACA64A-212 section winglets
Japan Mitsubishi Diamond I Separate surface stability augmen-tation.
Netherlands Fokker F-27 Bonded metal primary construction.
SOURCE ORI, Inc
6-18

An analysis of the foreign aircraft reveals that currently the technology being incorporated into the foreign built aircraft does not appear to surpass that which is now incorporated in the U.S. produced aircraft. Instead, the areas posing the greatest threat to the U.S. manufacturers are in markets for which the U.S. has previously offered no new developments -- e.g., the 20-40 passenger aircraft for the emerging commuter market. The most common reason given for not venturing into some of the new market areas has been the inability of the U.S. financial community to accept the risk -- preferring instead to stay with proven aircraft concepts or product improvements to existing designs.
Two new aircraft sharing a common heritage are the Challenger and the Lear Fan -- both designed by the U.S. aeronautical innovator, William Lear. Both aircraft are departures from current designs. The Challenger offers the business executive the comforts of a wide body for his business travel. By building the Challenger to the strict standards of FAR 25, Canadair was required to increase the weight, thereby lowering the anticipated performance from the attractive specifications first offered in the initial design. Whether the Challenger can overcome these deficiencies remains to be seen.
The second aircraft is the Lear Fan. The British government has taken over the manufacture and marketing of this twin-engine, singlepusher-propeller, all composite business turboprop to bring much needed industry into Northern Ireland. Although preproduction sales have been encouraging, the aircraft has yet to be proven successful.
If these two aircraft succeed, the point will not be the lack of technology but non-availability of risk capital within the U.S.
FOREIGN GOVERNMENT SUPPORT
Many of the foreign manufacturers are government owned and virtually all receive strong support from their governments. This support takes a number of forms -- research and development grants, loans, provision of facilities, funding incentives, etc.
6-19

Government support has enabled the foreign manufacturers to undertake the development of new aircraft, particularly in the commuter field, at a time when the market was still ill-defined and the necessary investment risk was beyond that which the U.S. private sector was able or willing to meet. As a result several new foreign commuter aircraft are expected to enter service during the mide-l9S0's, when the market is expected to peak.
The impact of the U.S. default to the light transport market could have far reaching effects since airlines are prone to commit to a particular aircraft and then build a fleet of various sized aircraft around it. An example is the de Havilland of Canada offering a full spectrum of commuter aircraft consisting of the popular 19-passenger Twin Otter (DHC-6), the mid-sized, 32-passenger Dash S (DHC-S), and the 50-passenger Dash 7 (DHC-7).
Another area which has caused great concern to the U.S. general aviation industry has been the ability of foreign governments to offer attractive financing for their products. The country most cited for this practice is Brazil which made large inroads into the U.S. market with the sale of their Bandeirante (EMP-llOP) by offering financing at 71 to Sl percent interest with an S- to lO-year payback period, often with no down payment.
Table 6.S presents an overview of the support foreign manufacturers receive from their governments in the areas of development, technology and marketing. Table 6.9 presents a synopsis of the various foreign aviation industries. A more detailed discussion is included in Appendix A.
6-20
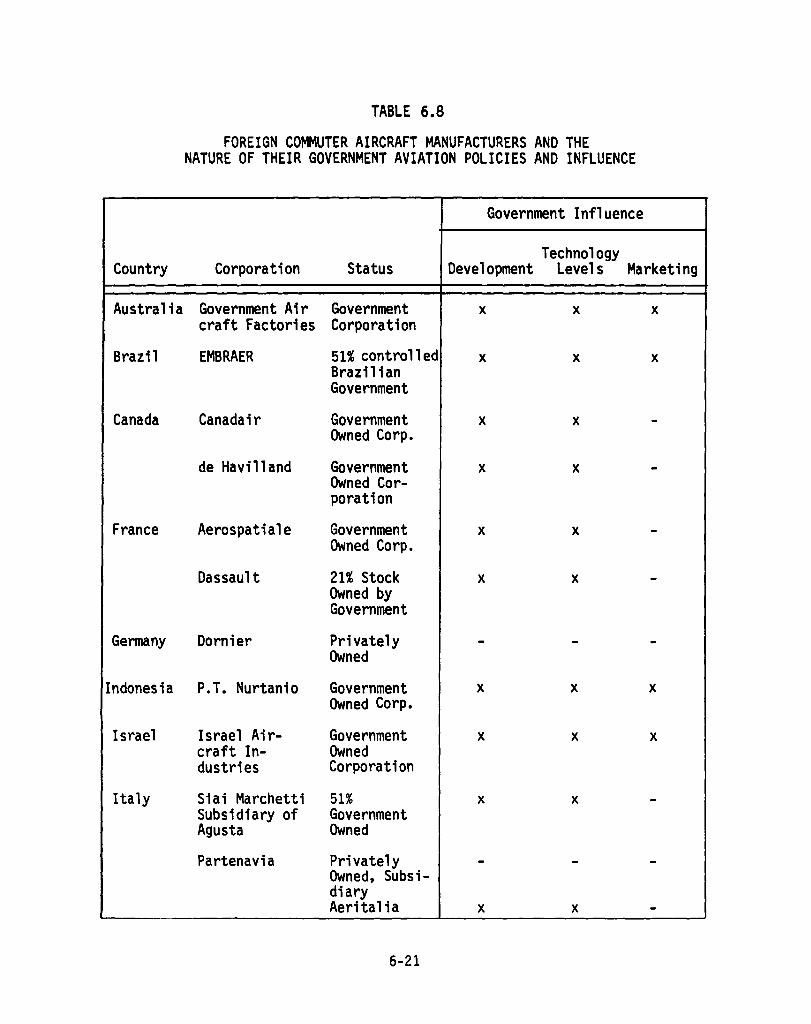
Country
Australia
Brazil
Canada
France
Germany
Indonesia
Israel
Italy
TABLE 6.8
FOREIGN COMMUTER AIRCRAFT MANUFACTURERS AND THE NATURE OF THEIR GOVERNMENT AVIATION POLICIES AND INFLUENCE
Government Influence
Technology Corporation Status Development Levels Marketing
Government Air Government x x x craft Factories Corporation
EMBRAER 51% controlled x x x Brazilian Government
Canadair Government x x -Owned Corp.
de Havilland Government x x -Owned Cor-poration
Aerospatiale Government x x -Owned Corp.
Dassault 21% Stock x x -Owned by Government
Dornier Privately - - -Owned
P.T. Nurtanio Government x x x Owned Corp.
Israel Air- Government x x x craft In- Owned dustries Corporation
Siai Marchetti 51% x x -Subsidiary of Government Agusta Owned
Partenavia Privately - - -Owned, Subsi-diary Aeritalia x x -
6-21

Country Corporation
Italy (Continued)
Aeritalia
Japan Mitsubish1
Nether- Fokker lands
Puerto Ahrens Rico
Spain CASA
Sweden Saab-Scania
United British Kingdom Aerospace
Corporation
Pilatus Britten-Norman
Short Brothers
Lear Avia
TABLE 6.8
(Continued)
Status
Government Owned
Privately Owned
49-51% Government Owned
Privately Owned
65.5% Government Owned
Privately Owned
Government Owned
Privately Owned
Government Owned 49% Government Owned
6-22
Government Influenced
Technology Development Levels Marketing
x x -
- - x
x x ?
- - -x x -
- - -
x x -
- - -
x x -
x x -
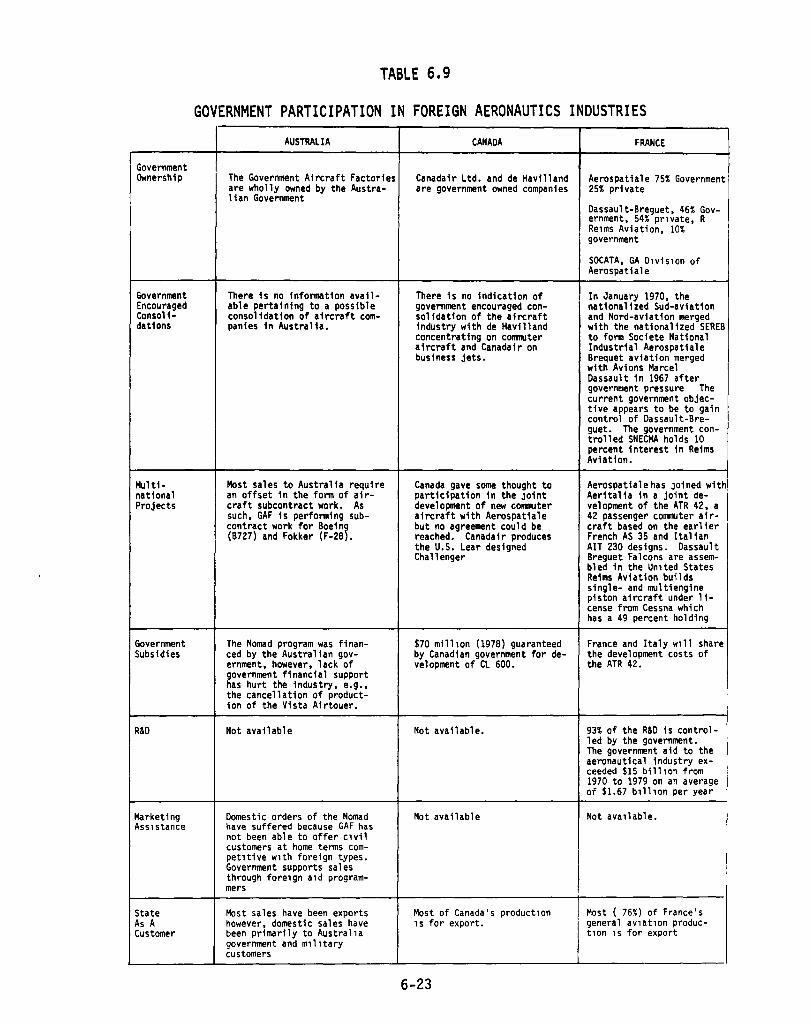
Government Ownership
Government Encouraged Consolidations
Multinational Projects
Government Subsidies
R&D
Marketing Asslstance
State As A Customer
TABLE 6.9
GOVERNMENT PARTICIPATION IN FOREIGN AERONAUTICS INDUSTRIES
AUSTRALIA
The Government Aircraft Factories are wholly owned by the Australian Government
There is no information available pertaining to a possible consolidation of aircraft companies in Australia.
Most sales to Australia require an offset in the form of aircraft subcontract work. As such, GAF is performing subcontract work for Boein9 (B727) and Fokker (F-28).
The Nomad program was financed by the Australian government, however, lack of government financial support has hurt the industry, e.g., the cancellation of production of the Vista Airtouer.
Not available
Domestic orders of the Nomad have suffered because GAF has not been able to offer c1vil customers at home terms compet1tive wlth foreign types. Government supports sales through fore1gn a1d programmers
Most sales have been exports however, domestic sales have been primarily to Austral1a government and m111tary customers
CANADA
Canadair Ltd. and de Havilland are government owned companies
There is no indication of government encouraged consolidation of the aircraft industry with de Havilland concentrating on commuter aircraft and Canadair on business jets.
Canada gave some thought to participation in the Joint development of new commuter aircraft with Aerospatiale but no agreement could be reached. Canadair produces the U.S. Lear designed Challenger
$70 mill10n (1978) guaranteed by Canadian government for development of CL 600.
Not available.
Not available
Most of Canada's product10n 1S for export.
6-23
FRANCE
Aerospatiale 75% Government 25% private
Dassault-Breguet, 46% Government, 54% prlvate, R Relms AViation, 10% government
SOCATA, GA Dlvis10n of Aerospatiale
In January 1970, the nationalized Sud-aviation and Nord-aviation merged with the nationalized SEREB to form Societe National Industrial Aerospatiale Brequet aviation merged with Avions Marcel Dassault in 1967 after government pressure The current government objective appears to be to gain control of Dassault-Breguet. The government controlled SNECMA holds 10 percent interest in Reims Aviation.
Aerospatialehas Joined with Aeritalia in a joint development of the ATR 42, a 42 passenger commuter aircraft based on the earlier French AS 35 and Italian AIT 230 designs. Dassault Breguet Falcons are assembled in the Un1ted States Reims Aviation builds single- and multi engine piston aircraft under license from Cessna which has a 49 percent holding
France and Italy w1ll share the development costs of the ATR 42.
93% of the R&D is controlled by the government. The government aid to the aeronautical industry exceeded $15 billlon from 1970 to 1979 on an average of $1.67 b11110n per year
Not ava11able.
Most ( 76%) of France's general aVlat10n product10n 1S for export
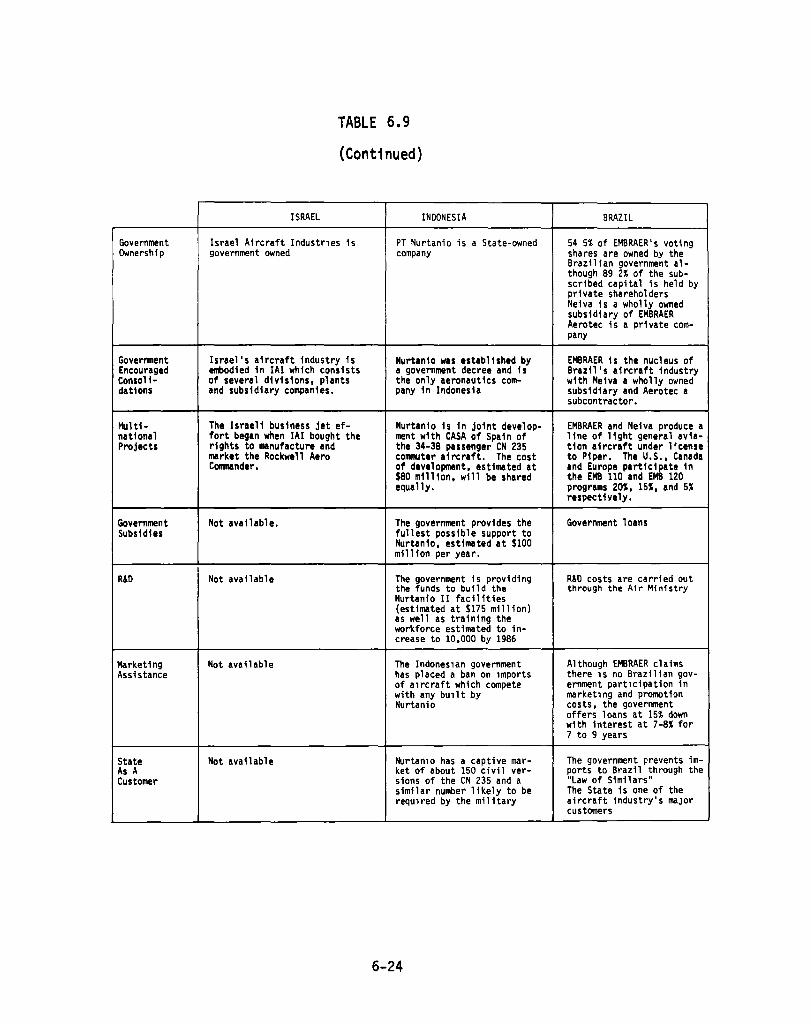
TABLE 6.9
(Continued)
ISRAEL INDONESIA BRAZIL
Government Israel Aircraft Industr1es is PT Nurtanio is a State-owned 54 5% of EMBRAER's voting Ownership government owned company shares are owned by the
Brazilian government al-though 89 2% of the sub-scribed capital is held by private shareholders Neiva is a wholly owned subsidiary of EMBRAER Aerotec is a private com-pany
Government Israel's aircraft industry is Nurtanio was established by EMBRAER is the nucleus of Encouraged embodied in IAI which consists a government decree and is Brazil's aircraft industry Conso11- of several divisions, plants the only aeronautics com- with Neiva a wholly owned datlons and subsidiary companies. pany in Indonesia subsidiary and Aerotec a
subcontractor.
Mu1t1- The Israeli business jet ef- Nurtanio is in jOint develop- EMBRAER and Neiva produce a natlonal fort began when IAI bought the ment with CASA of Spain of line of l1ght general avia-Projects rights to manufacture and the 34-38 passenger CN 235 tion aircraft under license
market the Rockwell Aero commuter aircraft. The cost to Piper. The U.S., Canada Corrmander. of development, estimated at and Europe participate in
$80 million, will be shared the EMB 110 and EMB 120 equally. programs 20%, 15%, and 5%
respectillely.
Government Not available. The government provides the Government loans Subsidies fullest possible support to
Nurtanio, estimated at $100 mil110n per year.
R&D Not available The government is providing R&D costs are carried out the funds to bulld the through the A1r M1n1stry Nurtanio II facilities (estimated at $175 million) as well as training the workforce estimated to in-crease to 10,000 by 1986
Marketing Not available The Indones1an government Although EMBRAER claims Assistance has placed a ban on 1mports there 1S no Brazilian gov-
of a1rcraft which compete ernment part1cipation in with any bU1lt by market1ng and promotion Nurtanio costs, the government
offers loans at 15% down with interest at 7-8% for 7 to 9 years
State Not available Nurtan10 has a captive mar- The government prevents im-As A ket of about 150 civil ver- ports to Brazil through the Customer sions of the eN 235 and a "Law of Simil ars"
similar number likely to be The State is one of the requ1red by the military aircraft industry's maJor
customers
6-24

TABLE 6.9
(Continued)
SPAIN JAPAN ITALY
Government The government is the majority The aircraft industry in Japan Aerltalia-100% government Ownership shareholder of Construcciones is privately owned. Partenavia-absorbed by
Aeronauticas SA (CASA). Aeritalia in 1981.
Government The bulk of Spanish aerospace The Japanese government en- Italian Aerospace industry Encouraged industry activity is under- courages the private companies was divided into two groups Consol1- taken by CASA. In 1972/73 the to Join together for the de- in July 1981. Aerital1a dations company absorbed Hlspano Avia- velopment of new aircraft and was assigned the respon-
cion, another alrcraft com- forms a project organization slb1l1ty for heavy aircraft pany, and ENMASA, an engine (e.g., CToC for the YS-11 and Agusta responsibl1ity company program) to oversee the for helicopters and light
concerted effort. aircraft.
Mul ti- Joint development, with Japan encourages multinatlonal Aeritalia has joined wlth national Nurtanio of the CN 235. projects to reduce risk and Aerospatiale to build the Projects Member of Airbus Industrles galn needed technology. ATR 42.
Subcontract and overhaul of Projects include Joint ven-aircraft. tures (e.g., B767) and pro-
duction of aircraft under license. The MU2 and MU300 are assembled in the U S. from klts produced in Japan
Government Not available. Japan limits lts support to France and Italy will share Subsidies the development stage con- the development costs for
sidering the funding a loan the ATR 42. rather than a subsidy to be paid back if the venture is successful.
R&D Not available. R&D is conducted through the Not available. National Aerospace Labora-tory, the Research Coordina-tlon Bureau, and the National Research Institute for Metals
Marketing Not available. Japan considers the ultimate A law was passed in 1978 to Assistance commercial risk to be that provide assistance for
of business and does not aerospace exports. provide funds for marketing.
State The State is a principal cus- The State is a maJor customer Aeritalia is a nationalized As A tomer of CASA's products. of the aircraft industry. company and military, gov-Customer ernment funded business
currently accounts for between 60 and 70 percent of total production.
6-25

TABLE 6.9
(Cont1nued)
UNITED KINGDOM
Government British Aerospace-50% Government, Ownership 50% private
Short Brothers-IOO% Government owned. Pilatus Britten/Norman-IOO% private owned. Lear Fan Ltd.-49% Government owned.
Government In the late fifties and early Encouraged sixties, the British began Consoll- nationalizing their aerospace dations industry. The trend appears
to be reversing with the re-cent offering of stock in British Aerospace with the aim to divest 50% of the shares.
fo\Ilti- Concorde with France and national participation in Airbus Projects Industries.
Government Not available. Subsid1es
R&D Not available.
Market1ng Not ava1lable. Assistance
State Not available As A Customer
6-26
VII. U.S. MANUFACTURERS TECHNOLOGICAL NEEDS AND CAPABILITIES
The preceding sections of this report discussed factors in economics, safety and both U.S. and foreign government policies which influence technology needs for general aviation. This section addresses the capability of U.S. general aviation manufacturers to meet these needs as well as NASA's role in those areas beyond the manufacturers capabilities.
U.S. MANUFACTURERS TECHNOLOGY NEEDS
The needs of the general aviation industry for new technology have been identified by industry representatives at Congressional Hearings, industry meetings and workshops. In testimony at Congressional Hearinqs, GAMA witnesses have identified areas where NA~A assistance is needed in general aviation technology. These areas are:
• Turbine engines,
• Piston engines,
• Propellers,
• Spin research, and
• Low speed aerodynamics.
GAMA specifically excluded avionics as being within its members capability to conduct needed research.
7-1

In testimony before a joint Senate and House of Representatives Subcommittee hearing on general aviation and commuter aircraft at Wichita, Kansas, August 27, 1981, industry witnesses stressed the need for Federally sponsored research in high risk technology programs that could help U.S. manufacturers meet strong competition from nationalized or subsidized foreign manufacturers. Interactions between the manufacturers and NASA were mentioned as necessary to facilitate the application of advanced technologies in aircraft developments. The application of area rule and winglet technology were cited as examples. Specific needs for research identified in the Wichita hearings were:
• Research in composites, including techniques in fabrication of composite structural components, properties and physical characteristics of composite materials, environmental impact and long-term effects, as well as suitability for use as primary structures of transport type aircraft,
• Investigation of alternative aircraft fuels such as hydrogen and alcohol, and
• Improvements in propulsion energy efficiency.
During the summer of 1980, the National Research Council IS Aeronautics and Space Engineering Board (ASEB) convened a workshop at the Woods Hole Study Center to examine the status of U.S. aviation relative to foreign activities and NASAls role in aeronautics. The report of the general aviation panel asserted that the U.S. general aviation industry must produce technically superior aircraft to offset subsidy advantages of foreign manufacturers in world market competition. Among its conclusions, the panel concluded that the general aviation industry cannot generate the required technology by itself.
The primary requirements for new technology for general aviation aircraft cited by the workshop are significant improvements in the areas of flight safety and fuel efficiency. Other important objectives cited for general aviation technology are: 43
43Report by the Panel on General Aviation to the Workshop on NASAls Role in Aeronautics, Volume IV, National Academy Press, Washington, D.C., 1981.
7-2

• Reduced interior and exterior noise levels, • Reduced maintenance, • Reduced cost of ownership, particularly operating costs, and • Improved reliability.
U.S. MANUFACTURERS CAPABILITIES TO CONDUCT NEEDED RESEARCH AND DEVELOPMENT IN-HOUSE
The U.S. general aviation industry has achieved a position of leadership in producing general aviation aircraft through the ability to effectively capitalize on NASA research results and applicable fall-out from military R&D. An area of current interest is industry's ability to maintain its dominant position in general aviation in an atmosphere of increasing foreign competition and reduced government research and technology programs.
The scope of effort of this report prevented an in-depth analysis of industry's capabilities to meet this challenge; however, review of available industry reports did provide some insight into the nature of R&D activities being pursued as part of the U.S. manufacturers' in-house initiatives. For example, one manufacturer has stated that his company spent approxi-mately $50 million on research and development over the past five years. This representated more than 3.3 percent of the company's annual sales.
The nature of the in-house R&D activities appear to be oriented towards improving the safety, comfort, reliability, fuel efficiency and sound levels of existing designs as well as future products. Specific IR&D efforts include:
• Use of computer graphics for conceptual definition of new products.
• Use of comprehensive wind-tunnel testing utilizing scale models to provide data which is assimulated to form a basis for refinement and development of configurations to achieve performance and fuel-efficiency goals.
7-3
• Use of a flight simulator as a design aid to provide accurate aircraft response throughout the flight regime with cockpit instruments in the simulator. This enables airplane parameters to be changed to permit testing of various model configurations.
• Use of rotary balance scaled models in wind tunnel tests to define spin characteristics.
• Use of a ground vibration survey to obtain critical vibration resonance in order to accurately define the flight test envelope prior to initial flight of new models.
• Development of sophisticated printed circuit board arrangements.
In addition to reviewing available industry literature, ORI queried several of the primary general aviation aircraft manufacturers to obtain specific answers to questions relating to their technological capabilities, the extent of their in-house R&D activities, the use and need for NASA technological assistance and their view of foreign competition. The responses to these questions are summarized below.
Key Factors Limiting Industry's Ability to Incorporate Advanced Technoloay
U.S. industry is limited in its ability to expeditiously incorporate technological advances in aircraft developments because of a lack of complete data, lack of time and/or the cost required to develop sufficient data needed to adequately address the:
• Evaluation of risk (i.e., is the risk acceptable), • Safety aspects of new technology applications, • Airworthiness certification requirements, and/or • Manufacturing variables.
Extent of the U.S. Industry's Activities
The primary focus of the IR&D efforts are directed towards product improvement of existing designs and manufacturing methods/tooling. Major
7-4
efforts are on near-term projects which have reasonably good assurance of being successful as product or manufacturing improvements. No basic research is conducted.
Investment figures vary by company and from year to year, and are considered proprietory. Orders of magnitude allocations for IR&D represent a range of three to ten percent of sales and approximately ten p~rcent of the company's personnel.
Use and Need of NASA Research
Manufacturers make use of NASA research and technology efforts in their developments of new product lines. Key factors in the use of technology advances are cost and product development risks. Specific examples of benefits from NASA research include winglets, supercritical airfoil, GAW airfoil, and propeller technology.
Future NASA research activities required for the U.S. manufacturers to maintain a strong competitive position relative to foreign manufacturers include:
• Composites and materials, • Airframe and propulsion aerodynamics, and
• Propulsion.
NASA'S ROLE IN GENERAL AVIATION TECHNOLOGY
NASA is the logical organization to conduct general aviation research. It has the facilities, technical expertise and prestige necessary for such programs. Existing NASA facilities are applicable, the expertise is available in all the pertinent disciplines, and the agency has had great success in acting as a catalyst in assembling teams involving industry, government, and academe to address specific problems of general interest.
The general aviation panel at the Woods Hole Workshop recommended that NASA develop a strategic plan for, and aggressively pursue, a technology progra~ to assure U.S. supremacy in general aviation. Excerpts from the panel's report addressing specific technology needs and related NASA activities are included as Appendix 0 of this report.
7-5
The role of NASA in general aviation has diminished over the past few years. NASA's aeronautics research efforts directed specifica1ly toward general aviation issues and applications have been reduced and a recent reorganization at NASA Headquarters has eliminated general aviation as a separate aeronautics technology office.
In the past, the general aviation industry faced negligible foreign competition and U.S. firms were able to successfully market their products without a need for advancing the state-of-the-art. Two new factors -- heavily subsidized foreign competition and quintupling of the cost of fuel -- now require significant technological advances in U.S. aircraft if they are to compete effectively in the future, either at home or abroad. These advances will not take place without the active participation of NASA using their unique facilities and expertise.
7-6

VIII. CONCLUSIONS AND RECOMMENDATIONS
CONCLUSIONS
Based on the information presented in this report of factors influencing the current and future status of general aviation, it is concluded that:
1. The U.S. general aviation industry provides a significant contribution to the national transportation system, the national economy, employment and until last year, the balance of trade.
2. The preeminence of U.S. manufacturers of general aviation aircraft in world competitive markets is being erroded in the high-value business jet and light transport segments by competition from foreign manufacturers stimulated by-foreign government support.
3. U.S. general aviation aircraft must incorporate advanced technology in their new developments to compete effectively for future markets at home or abroad.
4. A major problem facing the U.S. general aviation industry is an inability or unwillingness of the private sector to accept substantial risks associated with the development of advanced technnloqy.
8-1
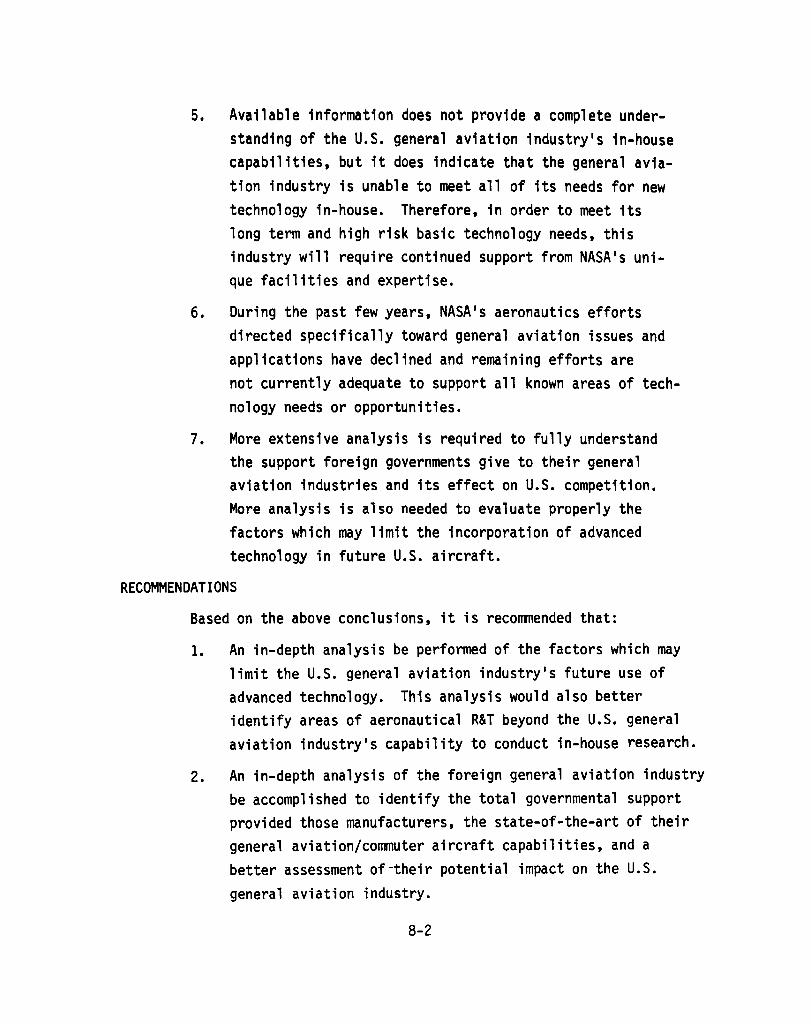
5. Available information does not provide a complete understanding of the U.S. general aviation industry's in-house capabilities, but it does indicate that the general aviation industry is unable to meet all of its needs for new technology in-house. Therefore, in order to meet its long term and high risk basic technology needs, this industry will require continued support from NASA's unique facilities and expertise.
6. During the past few years, NASA's aeronautics efforts directed specifically toward general aviation issues and applications have declined and remaining efforts are not currently adequate to support all known areas of technology needs or opportunities.
7. More extensive analysis is required to fully understand the support foreign governments give to their general aviation industries and its effect on U.S. competition. More analysis is also needed to evaluate properly the factors which may limit the incorporation of advanced technology in future U.S. aircraft.
RECOMMENDATIONS
Based on the above conclusions, it is recommended that:
1. An in-depth analysis be performed of the factors which may limit the U.S. general aviation industry's future use of advanced technology. This analysis would also better identify areas of aeronautical R&T beyond the U.S. general aviation industry's capability to conduct in-house research.
2. An in-depth analysis of the foreign general aviation industry be accomplished to identify the total governmental support provided those manufacturers, the state-of-the-art of their general aviation/commuter aircraft capabilities, and a better assessment of-their potential impact on the U.S. general aviation industry.
8-2

3. A comprehensive identification be made of the need for and importance of U.S. government (NASA) R&T which specifically addresses unique general aviation and commuter aircraft industry issues and potent1als, and wh1ch must be supported 1n order for the U.S. industry to achieve healthy and competitive capabilities for the future.
8-3

APPENDIX A
OVERVIEW OF FOREIGN GENERAL AVIATION AIRCRAFT MANUFACTURERS
A-I

A-2
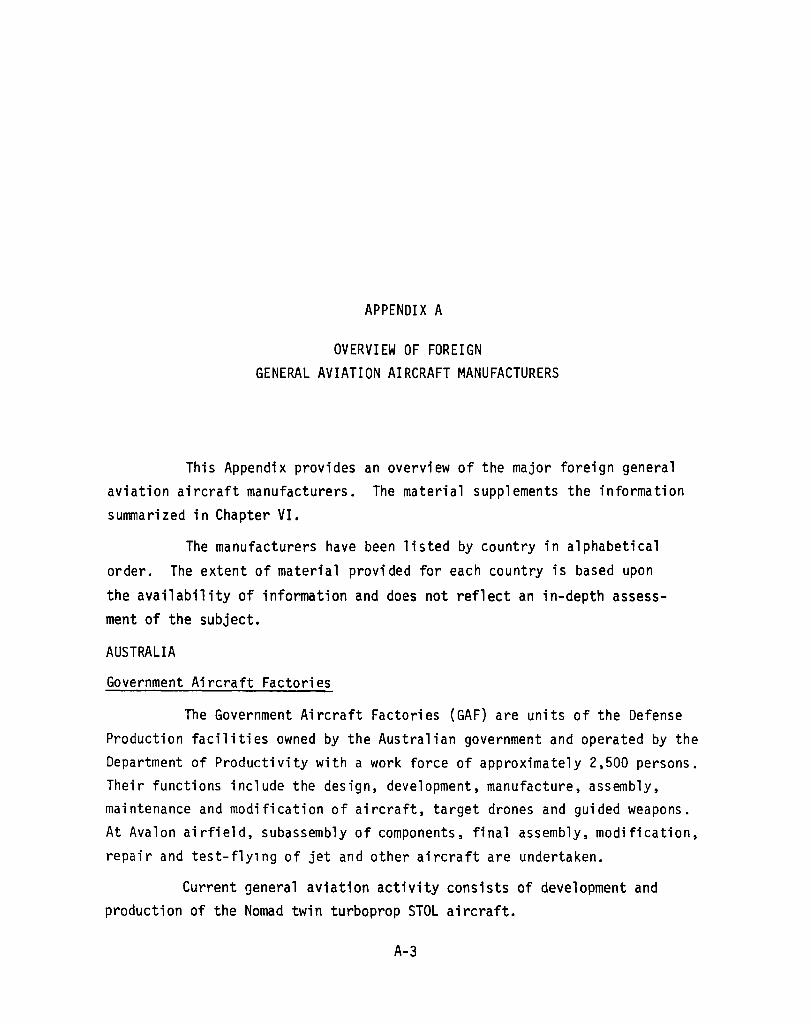
APPENDIX A
OVERVIEW OF FOREIGN GENERAL AVIATION AIRCRAFT MANUFACTURERS
This Appendix provides an overview of the major foreign general aviation aircraft manufacturers. The material supplements the information
summarized in Chapter VI.
The manufacturers have been listed by country in alphabetical
order. The extent of material provided for each country is based upon
the availability of information and does not reflect an in-depth assessment of the subject.
AUSTRALIA
Government Aircraft Factories
The Government Aircraft Factories (GAF) are units of the Defense
Production facilities owned by the Australian government and operated by the Department of Productivity with a work force of approximately 2,500 persons. Their functions include the design, development, manufacture, assembly, maintenance and modification of aircraft, target drones and guided weapons. At Avalon airfield, subassembly of components, final assembly, modification,
repair and test-flYlng of jet and other aircraft are undertaken.
Current general aviation activity consists of development and production of the Nomad twin turboprop STOL aircraft.
A-3

BRAZIL
EMBRAER
EMBRAER (Empresa Brasileira de Aeronautica, S.A.), a joint government/private company was created by the Presidential Decree No. 770 dated August 19, 1969 lito promote the development of the Brazilian aircraft industry and of similar activities, including the design and construction of aircraft."
The company officially began its activities in January 1970 and by 1973 had produced its 100th aircraft. At that time, it occupied over 2.4 million square feet of area near Sao Jose dos Compos airfield with 670,000 square feet of buildings and 2,400 employees. Production has now increased to over 2,700 aircraft consisting of twelve models as shown in Table A.1. There are now (1981) 6,582 employees with 1,562,180 square feet of building area. The growth of EMBRAER is shown in Table A.2 EMBRAER's forecast production for the years 1981-1985 are shown in Table A.3.
Brazil's EMBRAER has emerged as a significant supplier of commuter and training aircraft to the international market. However, the rise in international sales is causing delays in the development of air-craft programs already underway. The primary slippage in the Brasilia 30-passenger commuter and Xingu 2 business aircraft programs has been attributed to the inability of the engineering workforce to assimu1ate all the new programs.
Countering the international growth is the general economic climate in Brazil that is holding production of EMBRAER agricultural, single-, and twin-engine general aviation aircraft to fewer than 35 per month. Sales of these aircraft are less than the production rate and the company is considering whether a reduction is in order.
The workload on EMBRAER's engineering team as well as the large buy of Xingu lis by the French has delayed introduction of the PT6A-42 powered Xingu 2 by at least six months. The Xingu 2 is flying in Brazil but with a production rate of two Xingu lis per month, the Xingu 2 ;s not expected to be ready for production until early 1983. EMBPAER expects to
A-4
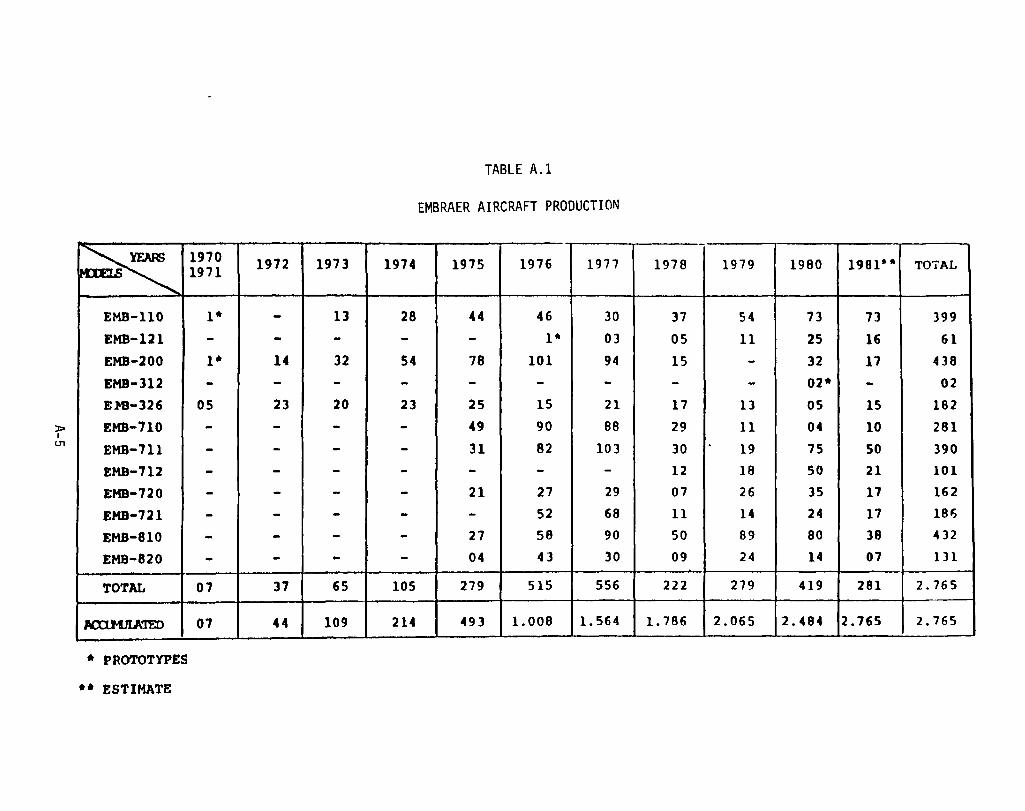
l> I
U1
~ EMS-II0
EMB-121
EMB-200
EMB-312
EJoB-J26
EMB-7l0
EMS-7l1
EMS-7l2
EMB-720
EMS-72l
EMS-810
EMS-820
TOTAL
1tO:l.MJlA'IED
• PROTOTYPES
.. ESTIMATE
1970 1971
1·
-1*
-OS
-------
07
07
1972 1973 1974
- 13 28
- - -14 32 S4
- - -23 20 23
- - -- - -- - -- - -- - -- - -- - -37 6S 105
44 109 214
TABLE A.1
EMBRAER AIRCRAFT PRODUCTION
1975 1976 1977 1978 1979 1980 1981" TOTAL
44 46 30 37 54 73 73 399
- 1* 03 05 11 2S 16 61
78 101 94 15 - 32 17 438
- - - - - 02· - 02
25 15 21 17 13 05 15 182
49 90 88 29 11 04 10 281
31 82 103 30 19 75 50 390
- - - 12 18 50 21 101
21 27 29 07 26 35 17 162
- 52 68 11 14 24 17 186
27 58 90 50 89 80 38 432
04 43 30 09 24 14 07 1]1
279 515 556 222 279 419 281 2.765
493 1.008 1. 564 1.786 2.065 2.484 2.765 2.765

TABLE A.2
EMBRAER'S EVOLUTION (1970-1981)
~ ITENS 1970 1971 1972 1973 1974 1975 1976 1977 1978 1979 H80 1981·
1. PJO)(D'l(N 2 5 37 65 105 279 515 556 222 279 419 281
2. SALES (Crt 1Id.ll.1OO5) 2,7 30,9 172,9 222,5 363,7 643,9 1.198,9 1.453,5 2.078,2 4.624,5 9.028,8 21.935,9
3. EXPCRl' (tE$ 111111005) - - - - - 5,039 20,700 12,676 38,287 70,004 84,U8 100,000
4. Capt t:al Stock (Crt Il1Woos) 6,1 56,3 101,1 145,7 193,7 198,3 283,7 359,0 842,1 1.285,3 2.678,1 6.015,4
5. Shareholden' equ1 ty (crt lftil..Uaw) 5,2 57,6 123,3 216,8 423,7 736,4 1.159,7 1.360,0 2.353,4 4.150,4 6.988,1 15.403,2
6. Net lncxIIe (cr$ millions) - 2,3 ~.6, 7 21,4 49,7 61,1 55,6 - 63,7 252,8 ( 257,5) 1.697,2
7. Per'llamel S89 1.128 2.031 2.621 3.323 3.553 4.22S 4.104 4.300 4.887 5.957 6.582
•• Q:lvJt:r\I:t.ed l'rea
(Jrl2) 18.366 46.185 53.616 63.206 67.480 96.340 111.014 116.426 117.821 124.219 132.260 144.560
9. NI.II'ber of stock-holder_ 1.035 45.509 73.029 95.462 117.932 117.504 126.156 162.276 176.758 183.997 222.481 246.953
10. Ina::me per Share - 0,04 0,17 0,15 0,26 0,31 0,20 - 0,08 0,20 - 0,98

PROGRAM I EMB-IIO
EMB-120 I
EMS-121 A II I
EMB-12IS
If SUB-TOTAL
EMB-810
EMB-820
SUB-TOTA L
EMS-312
EMS-326
I SUS-TOTAL II EMB-720
EMS -721
I SUB-TOTAL I EMB-710
EMB-711
EMB-712
! SUB-TOTAL II EMS- 201
I TOTAL I
TABLE A.3
EMBRAER PRODUCTION FORECAST (SUMMARY FOR 1981-1985)
198' 1982 1983 I
73 70 70
16 28 28
6
89 98 104
38 60 60
7 6 8
45 6S sa
13 56
15
15 I 13 I 56 I 17 30 30
17 24 24
34 54 54
10 18 18
50 50 50
21 24 24
81 I 92 ! 92 I 17 36 36
281 359 410
A-7
1984 1985
70 70
10
12 12
12 12
94 \04
60 60
• 8
68 68
84 14
84 I 84 1
30 30
24 24
54 54 J 18 18
50 50
24 24
92 ! 92 J
36 36
4Z8 438

keep the Xlngu productlon llne at two per month until lt can better deflne the market for the STX- to nlne-place turboprop.
EMBRAEP's new EMB-120 Brasilia is being delayed by at least one year from recent estimates and more than two years from the optimistic schedule established at the onset of the program. Contributing to the delay of the 30-passenger commuter aircraft from an expected production in 1982 to an estimate now of early 1985 has been the slow development of the Pratt and Whitney of Canada PW-100 series turboprop engines. The
conflguratlon of the Brasilla wlng and fuselage are being deflned and EM6RAER has settled on tne aVlonics pac~ages it wl11 offer with the aircraft. The alrcraft wlll be built to FAA Regulation, Part 25 in light of the FAA's decision to scrap a proposed Part 24 covering commuter aircraft.
At the end of December 1980, EMBRAER held 120 options for the Brasilia of which 25 have been converted into paid options by
international operators and 15 into paid options by Brazilian commuter operators. These options were from operators in the United States, the United Kingdom, Canada, France, Australia, New Guina and Brazil. The largest orders are from the Brazilian Air Force. EMBRAER sees a market of from 600 to 800 EMB-120's over the next twenty years.
The most successful aircraft program at Embraer in terms of production rate and sales remains the EMB-11D Bandeirante commuter aircraft. Launched with a production rate of two units per month in 1973, the figure rose to three per month in 1976. The Bandeirante has now sold 399 units worldwide and is flying in more than 22 countries. It is being produced
at a rate of six aircraft per month.
The largest market for the 19-passenger commuter aircraft has been the U.S. with 45 Bandeirantes in service, followed by the United Kingdom with 23 in operation. EMB-110's are also flying in Australia, France, North Africa, Fiji and other countries.
A plan to produce a pressurized version of the EMS-lID has been
put on hold both because of the englneering workload and the concern for the higher fuel flows for a heavier aircraft that might rarely fly the stage lengths requlred for ~lgher altltudes.
A-8

Brazil, as part of its effort to reduce its trade imbalance, imposes barriers to the sale of U.S. general aviation aircraft. Though a signator to the general agreements of the Multilateral Trade Negotiations, but not the aircraft agreement, Brazil is able to sell ~MBRAER aircraft in the U.S. without restraints.
Financing for the commuter aircraft consists of 15 percent down, with semi-annual payments for seven to nine years. The minimum financing
interest rate is 7-5/9 percent for well-qualified customers.
EMBRAER delivered 436 aircraft 1n 1979, 388 to the domestic market and 48 for export. Single engine piston aircraft accounted for the largest percentage of deliveries with 329 EMB 201 Ipanem~ ~qricultural
aircraft and Piper aircraft delivered to the domestic market. One singleengine aircraft was delivered for export.
Twin engine piston aircraft, the Piper Navajo and Seneca 2,
assembled in Brazil, accounted for 125 domestic sales. Embraer also delivered 62 Xavante EMB-326 trainers to the Brazilian Air Force and three for the export market.
All versions of the EMB-lIO, such as the Bandeirante, the maritime partrol EMB-Ill, and the Xingu, accounted for 56 aircraft, 12 for the domestic market and 44 for the export market. The Brazilian market is almost totally protected against rival imports, yet out of the 6,OOO-strong Brazilian general aviation fleet, only about one-third are Pipers. EMBRAER claims to have only 33 unsold Pipers on its hands in April.
Despite the downturn in the sale of light, single engined aircraft in Brazil, EMBpnER is looking at the possibility of producing the Piper Tomahawk at San Jose dos Campos. One aircraft is already there.
Aerntec
The smallest of the Brazilian aircraft industries is Sociedade Aerotec Limitada with headquarters and production facilities in Sao Jose dos Compos. The company occupies a covered area of 61,350 square feet and
A-9
employees about 200 people. Its first project to achieve series manufacture was the A-122 Uirapuru two-seat, all-metal lightplane, the prototype of which flew for the first time on June 2, 1965.
Another Aerotec activity is the subcontract work it does for EMBRAER, e.g., fuselages for the Seneca and Lance as well as wings for the Ipanema. Despite the subcontract work, Aerotec is continuing with its own designs and is now half way through the development of the new A-132 Tangara which first flew on February 27, 1981. When the aircraft enters production, a peak rate for four aircraft per month is planned.
Though resembling the earlier Uirapuru, the Tangara is a completely new side-by-side two-seat fully aerobatic trainer powered by a 160 HP Lycoming 0-320 engine with fixed-pitch propeller. The Tangara wing is a parallel-chord NASA 2415 section with flaps and two integral fuel tanks. The rear fuselage has been designed with flap sides and top to improve spin characteristics and a smoothly rounded sliding canopy.
CANADA
de Havilland Aircraft of Canada
de Havilland is Canada's oldest and largest aircraft producer. The company was incorporated in 1928 as a subsidiary of the de Havilland Aircraft Company of England and has become one of Canada's major exporters. On 26 June 1974 ownership was transferred to the Canadian government. De Havilland of Canada has built and delivered more than 3,500 aircraft of its own design to 96 countries throughout the world since 1946.
A recently completed expansion program at de Havilland's Downview facilities has increased the company's manufacturing and office space to 1.4 million sq. ft. A new facility will be added to handle production of the Dash 8. DHC currently employs 5,000 people. When the Dash 8 program is in full swing, the company plans to increase the work force by between 2,500 and 3,000 people even though there will be a slight cutback 1n production of the Twin Otter.
De Hav1lland's sales for 1980 totalled about $250 m1ll10n and are expected to double over the next several years and exceed $900 million annually by 1990.
A-I0

Current production of the DHC-6 is running at seven units per month. For the last fifteen years, de Havilland has dominated the commuter aircraft market with the popular 19-seat Twin Otter turboprop. Almost 780 Twin Otters have been sold to date. During the past two years de Havilland has improved its sales position even more with the introduction of the four-engined, 50-seat Dash 7 which has already won over 130 orders and options. The Dash 7 has captured about 45 percent of total sales in the 50-seat category and production has recently increased from two to three aircraft per month.
De Havilland has stated its desire to become to the commuter market what Boeing is to the trunk airlines. Being fully aware of a gap between the Twin Otter and Dash 7 and that the regional carriers wanted a 30-40 seat aircraft, de Havilland began development of the Dash 8 in 1979. De Havilland estimates that between now and 1995 the potential sales of commuter aircraft will reach 1,300 units, not the 2,000 envisioned by the competitors, who base their figures on a recent study by the RAND corporation. DHC hopes to capture 40-45 percent of this market. The planned rate of production of the Dash 8 is six aircraft per month, to begin one and a half years after the start up of production, at end-1985. DHC is also studying the possibilities for increasing the rate to eight per month in July 1986 in order to meet the expected demand. It is highly likely DHC will opt for the higher production rate given the expansion of the commuter market and the necessity of reducing delivery deadlines to a minimum to avoid missing potential sales.
De Havilland is not involved in any joint development ventures although during one period they had numerous discussions with Aerospatiale which was also planning development of a commuter aircraft in the same category - the AS 35 - but no common agreement could be met.
De Havilland also sees potential for the Dash 8 for the top of the range twin turboprop business aircraft with a 12-16 seat version developed by Innotech in Montreal for executive transportation. The cabin of the Dash 8 has practically the same dimensions as the Canadair Challenger twin business jet. DHC is relying upon the expected economy of the turboprop to appear to customers for routes less than 1000 km.
A-II

Other potential markets envisioned by DHC for the Dash 8 include personal transport (for example the oil companies or mining research and prospecting companies which have to send their technicians to out-of-the-way regions with unprepared airstrips) and various military requirements. DHC visualizes as many as 200 units for the military during the next 20 years.
De Havilland believes sales of the Dash 8 could climb as high as 650 units with the main customers as follows:
U.S. commuter airlines 32% Canada 12% Africa 12% South America 16% Far East 11% Europe 10% Middle East 7%
There are currently 93 orders and options for the Dash 8 from 26 operators in the U.S., Canada, Europe and Australasia.
For the future, DHC does not exclude the possibility of a stretched version of the Dash 8 during the second half of the decade, which would carry 40-50 passengers. But to maintain the right size in relation to the other models in the range, such a decision would imply the development of a stretched version of the Dash 7, designed to carry 70-75 passengers.
FRANCE
Aerospatiale
Aerospatiale was formed on 1 January 1970 as a result of the merger of the former Sud Aviation, Nord Aviation, and SEREB companies. It is the largest aerospace company in the Common Market with a registered capital of 447,400,000 francs, facilities extending over a total area of 9,790,000 sq. meters (105,380,000 sq. feet) of which 1,778,000 square meters (19,138,000 sq. feet) are covered, and a staff of 38,173 persons at the beginning of 1980.*
*Jane's, 1980-81.
A-12
Aerospatiale is divided into four divisions -- Aircraft Division, Helicopter Division, Tactical Missiles Division, and Space and Ballistic Systems Division. France has made investments recently in two principal sectors: the general computerization of the firms activities, not only in the area of computation and administration, but also computer-assisted design and manufacture. The second sector was the re-equipment of their machine shops with replacement of old machines and increasing adoption of numerically controlled machines.**
In the autumn of 1981 the French and Italian governments signed an agreement for the joint development and production of the ATR 42, a 42 seat commuter turboprop aircraft.
Dassault-Breguet
Formed as a result of a merger of the Avionics Marcel Dassault and Breguet Aviation companies on 14 December 1971, 21 percent of the stock was transferred to the French Government* on 1 January 1979. The current government favors nationalization of the company in part because of its monopoly'on the development of fighter aircraft.**
Dassault-Breguet is engaged in the development and production of military and civil aircraft, guided missiles and servo control equipment. Series production of its aircraft is undertaken under a widespread subcontracting program with final assembly and flight testing handled by the company. Its 16 separate works and facilities covers 620,800 square meters (6,682,300 sq. feet) with a total of 15,553 employees, including 2,259 engineers at the beginning of 1980.*
Light Aviation
The French light aviat10n industry is made up of four manufacturers SOCATA, Avions Pierre Robin, Avions Mudry and the Cessna associate Reimes Aviation. Reims Aviation, a Cessna subsidiary, is the largest light aircraft
* Jane1s, 1980-1981. **Interavi a, 5/1981.
A-13
manufacturer in France. It produces two s1ngle-eng1ned models. the FA152 and FR172. together with the twin engined FTB 337 exporting 85 percent of
its output.
Avions Robins produced 104 aircraft in 1980. Among its products, are the Rl180, DR 400, R 2160, and R2212. It is currently developing the R3140, a new economical four-seater with a T-tail and fixed under carriage. It will be powered by a 143 HP engine with a projected payload of 1050 pounds.
Avions Mudry is currently developing the CAP, a low-cost single
engined aircraft with two side by side seats built largely from composite materials to help keep down maintenance costs. With a fuel consumption of 4-5 gal. per hr, Avions Mudry hopes to discover a new market slot which the CAP could fill. The low-wing aircraft is intended primarily for use by flying schools with an expected performance of 102 km/hr cruise speed and 405 nmi range.
In cooperation with the Buchoux Company, Mudry is developing the MB-4-80 engine, an air cooled four-stroke piston power-plant developing 80 HP destined to power both the CAP and another projected design. an economy optimized aerobatic single-seater designated the Mini-CAP. The new engine will run on either 100 octane AvGas or on "Super" automobile gasoline.
ISRAEL
Israel Aircraft Industries
Israel Aircraft Industries (IAI) entered the business aircraft market in 1976 as a result of U.S. antitrust legislation which required North American Rockwell to give up one of the business jets previously produced by North American Aviation and Rockwell-Standard Corporation at the time the two corporations merged. The new corporation opted for North American's Sabreliner and IAI bought the rights to manufacture and market Rockwell's Aero Commander.
A-14

Renamed variously the Commodore Jet and Jet Commander 1121, the former Aero Commander was subsequently developed into the 1122 and 1123 versions. A total of 186 of these various units were sold. In 1976, IAI launched the Westwind 1124 with turbofan engines and an enlarged fuselage. In 1978 this aircraft was succeeded by the Westwind I and in 1979 IAI commenced fullscale development of the Westwind II (the winglet West~ind).
Israel Aircraft Industries ranks only sixth in the world in numbers of business jets delivered. The long Arab-Israeli war closed much of the European market and IAI looks at the United States and Latin American as their prime sales areas.
ITALY
The Italian aerospace industry employs 40,700 people of whom 39
percent are in the South of the peninsula* and achieved a turnover of 1,500,000 hire in 1980.* 1981 sales were probably in the region of 2,000,000 Lire with exports representing 60 percent of the total.* Italy ranks fourth in terms of aerospace employment in Europe.
companies: Most of the Italian aerospace industry is controlled by two holding
IRI - Finmeccanica EFIM
The Italian government stepped in to bring order to the "open warfare" between IFI and ERIM and defined the aerospace business into two sectors:
IRI - Aeritalia -- Heavy aircraft EFIM - Agusta -- Helicopters and Light Aircraft.
IRI is a 100 percent government owned holding company which, according to the Italian embassy, makes Aeritalia 100 percent government owned. Although Aeritalia absorbed Partenavia in 1981, it and all other aerospace companies are considered to be privately owned.
*Interavia 2182.
A-IS
Aeritalia
Formed on 12 November 1969 to combine Fiat's aerospace activities (except those which concerned aero-engines) with those of Aerfer and Salmoiraghi of the Finmeccanica group. The company consists of four groups:
Combat Aircraft Group Transport Aircraft Group Equipment Group Space and Alternative Energy Group
The company employs 11,500 people and operates six plants -- three at Turin, two at Naples, one at Milan. Considerations are being given to opening a plant in Southern Italy at Foggia.
Aeritalia engineers have worked closely with the Boeing research department to define the B767 specification and to incorporate advanced technology in the aircraft.* Their work consists of 15 percent of the total value of the project.
An Italian team of engineers, headed by S. Ruocco has developed the high-lift devices (flaps, etc.) for the 8767 wing.
One third of Aeritalia's workforce is engaged in the production of 8767 components with responsibility for the tailfin, rudder inner and outer spoilers, outer aelerions and the inner and outer trailing edge flaps.
Aeritalia plans to invest up to $100 million by 1985 on factory modernization, the purchase of new numerically - controlled machine tools, and on other improvements to the production plant. Over the past few months, the firm has become highly skilled in the production of epoxy/carbon fiber components. It produces the six-meters-long B767 rudder which is currently the worlds largest aircraft component made from composite materials.*
Agusta
Formed in 1907 by Giovanni Agusta, Agusta is now part of the Agusta group consisting of helicopter, aircraft and other groups under the control of two holding companies, Agusta and SIAl.
*Interavia, 7/1981.
A-16
The company employs 9,500 people. The helicopter division consists of Costruzioni Aeronautiche Giovanni Agusta, Elicotteri Meridionali, Agusta Aviation, the subsidiary representing Agusta helicopters in North America, and European Helicopter Industries.*
According to Mr. Pietro Fascione (Vice President of Agusta), a reoreganization of the Italian helicopter industry is being planned.
During the early 1970's Agusta considerably improved its production facilities making for greater use of numerically controlled machine tools. At that time they planned to expand the EMA facilities to about 100,000 square meters for production of light helicopters.**
Between now and 1984, the Agusta Group plans to devote 214,000 million Lire to the improvement of the present range of products. The company plans a systematic program of modernization to meet current market requirements.*
Partenavia
Founded in 1957 by Prof. Ing Luigi Pascale and his brother Ing Nino Pascale, Partenavia occupies a 129,165 square ft. facility on Capodichino Airport, Naples. In 1981, Partenavia was absorbed by Aeritalia.* Partenavia has one of the finest facilities in the Naples area employing about 160 people.*
JAPAN
Mitsubishi Heavy Industries Ltd.
Mitsubishi Aircraft International, Inc. is a wholly-owned subsidiary of Mitsubishi Heavy Industries, Ltd. of Japan. It was established in 1965 at San Angelo, Texas to undertake final assembly and flight testing of the MU-2 twin turboprop STOL multi-purpose transport aircraft designed by the parent company. The head office was moved to Dallas in 1977.
*Interavia, 2/1974. **Interavia, 2/1982.
A-17

Two MU-2 I s are currently being assembled in San Angelo - the Marquise (MU-2B-40) and Solitaire (MU-2B-60). The aircraft are manufactured in the parent company's Komaki plant and shipped in semi-completed form to MAl for assembly and delivery to customers in the U.S., Canada and Latin America. By 1 January 1980 total orders for all versions of the MU-2 had reached 623 including 574 for export and 49 for Japanese customers.
MAl will also be responsible for assembly of the New Diamond I (MU-300).
WEST GERMANY
Dornier
Dornier's market analysis reveals that the need for 30+ commuter aircraft will not materialize until the mid 1980 ' s but that the need for
the 15-19 seat aircraft is now. Therefore Oornier accelerated its efforts to enter its two contenders, the 00-228-100 and 00-228-200 into the market in 1981. The aircraft incorporate the new TNT (TragfeUgel Neuer Technoloq1e) advanced wing and fuselage cross section of the Skyservant.
Dornier has been flying the low drag/high lift TNT wing since June 1979 and claims a 20 to 30 percent fuel saving on a typical commuter stage length. With the German government research establishment, DFVLR, Dornier is developing an Open Loop Gust Alleviation (OLGA) system. Gusts are sensed by an angle of attack vane at the nose~ pitch rate gyro and vertical accelerometer. Gust responses are damped by moving both ailerons up or down simultaneously in association with the elevator. Successful gust alleviation, particularly dampinq G-cycles occurring at between one Hertz and five Hertz, can go a long way towards avoiding airsickness in aircraft forced to operate in the turbulent airspace.
Dornier claims three firm sales and 35 paid options. The initial production will be 10 to 15 units split half and half -100's and _200'S. A production rate of two per month is planned with tooling for three.
A-IS

In addition to the above. Dornier claims to be using new advanced
production techniques which will result in weight savings. smoother surface and less maintenance.
Dornier will also offer a special support program. training and turn-key operating consultancy.
A-19

A-20

APPENDIX B
AIRCRAFT CHARACTERISTICS AND PERFORMANCE FACTORS
B-1

B-2

APPENDIX B
AIRCRAFT CHARACTERISTICS AND PERFORMANCE FACTORS
Tables B.1 through B.3 present the key parameters of those aircraft which currently dominate or are expected to enter the commuter and business jet/turboprop markets. Each of the tables presents the manufacturer, aircraft name and designator, cost, seating (both crew and passengers), cabin dimensions - length, height and width (in feet), number and type of engines as well as thrust or shaft horsepower, maximum takeoff weight, cruise speed, and service ceiling. The commuter chart also shows the breakeven point (in cents per seat mile) assuming a 100 percent load factor. This value was determined by Business and Commercial Aviation as reported in their April 1981 issue. The breakeven yield was determined by taking the total operating costs for a block segment (B/CA used 100 sm) and calculating what it would cost per passenger seat per statute mile to break even on the segment.
Direct operating costs were established by assuming that each alrcraft was in its first year of operation, a four-alrplane fleet and that most of the maintenance was performed in-house. Each aircraft was equipped to meet FAA Part 135 requirements. The aircraft was depreciated over ten years to a IS-percent residual value. The down payment is ten percent with 90 percent financed over ten years at 12.5 percent interest and the first year's principal is deferred.
B-3
Crew salaries were $36 per block hour for unpressurized turboprops with up to 19 passenger seats; $40 per hour for pressurized turboprops with up to 19 passenger seats; $50 per hour for aircraft with 20-19 passenger seats; $70 per hour for aircraft with 30 to 49 passenger seats; $85 per hour for aircraft with 50 or more passenger seats and $120 per hour for turbojet aircraft.
Personnel expenses, employee benefits and payroll taxes totaled 38.7 percent of salaries, while annual insurance costs and taxes on the aircraft amounted to 3.5 percent of the airframe price. For aircraft supplies 8/CA charged $1 per seat for up to 19 passengers and $1.25 per seat for 20 or more passengers. Into-plane contract fuel was estimated at $1.25 per gallon for jet A and $1.30 per gallon for avgas.
Maintenance costs were actual costs determined through conversations with aircraft operations plus a 25 percent maintenance burden.
Indirect operating costs were 50 percent of direct operating costs.
New aircraft do not have breakeven costs shown.
8-4

TABLE B.1
COMMUTERS
MANUFACTURER AIRCRAFT COST SEAT- CABIN ENGINES WEIGHT CRUISE CE ILING BREAK EST DEL PRESS ING L/H/W MAX TO SPEEO EVEN OATE
100~ LF
P ILATUS B-N BN-1B-20 S 301,930 1+8 10/3 9/3 6 (1) Lye IO-S40-KIBS 300 hp e. 6,600 137 18,000 o 117 No Islander
CESSNA CE-401C S 333,606 1+8 15 8/4 1/4 7 (1) Cont TSIO-501VB 31, hp e. 6 850 174 16,900 o 145 No Ultrallner
PIPER PA 31-350 S 377 610 1+8 13 1/4 314 1 (1) L 'C TIO-5'0- I?I!O 350 hp e. 7 000 1Ii3 24 000 o 141 No NavaJO Chleften
CESSNA CE 404 S 478,910 1+9 13 8/4 3/4 7 (1) Cont GTS IO-51OM 375 hp e. 8 400 174 16,000 o 161 No Tltan Courter II
PILATUS B-N BN-1A-1I1-1 S 514,110 2+16 11 5/3 9/3 6 (3) Lye 0-540-E4-C5 260 hp e. 10,000 145 12,400 o 144 No Trls1ander
de HAV ILLANO DITL-6-300 S 1,170,000 2+19 18 4/4 9/5 3 (2) P&W PT6A-27 620 shp e. 12,500 172 26,700 o IB7 No TWl n Otter
GAF N24A S 1,I96,30B 2+16 21 3/5 2/4 3 (2) All 250-B-llC 385 shp ea 9,400 163 20,500 o 239 No NOOIad
BEECH BE-C99 S 1,335,000 2+15 18 7/4 8/4 5 (1) P&W PT6A-36 750 shp e. 11,300 249 28,080 o 209 No C8 99
EMBRAER EMB-1I0Pl S 1 495,99B 2+18 31 2/5 3/5 3 (2) P&W PT6A-34 750 shp e. 12,500 224 22,500 o 244 No Bandl erante
ISRAEL IAI-I0IB S 1,650,000 2+18 22 4/5 8/7 7 (2) P&W PT6A-36 750 shp e. 15 140 139 23,600 o 268 No AIRCRAFT Arava INO
SWEARINGEN SA227-AC S 1,845,000 2+19 25 4/4 8/5 2 (2) AR TPE-331-110 1,000 shp e. 14,000 280 30,000 o 221 'es Metro III
CASA C212-200 S 2 121,700 3+26 26 1/5 9/6 8 (2) AR TPE 331-10 900 shp e. 16,427 185 25,000 o 216 No Conmuter
SHORT 8ROS SO 3-30 S 2,870,000 3+30 31 0/6 5/6 5 (2) P&W PT6A-45B 1,156 shp e. 22,900 165 20,000 o 212 No LTD Shorts 330
GULFSTREAM Gulfstream I 3,000,000 3+37 41 0/6 1/7 5 (2) RR Dart 7 MK 529·8x 1 910 shp ea 36,000 300 30,000 o 218 'es AM lC
de HAV ILLANO OOC-7 I 5 020,000 3+50 39 5/6 4/7 0 (4) P&W PT6A-50 1,120 shp e. 44,000 230 21,000 0180 'es Dash 7
FOKKER F27 MK 500 I E ,350,000 3+50 52 4/6 8/8 5 (2) RR D.rt 7 MK 535-7 2,020 shp e. 45,000 259 ~ o 193 'es Frtendshlp
BRITISH HS 748-28 I 6 500 000 3+48 46 6/6 3/8 1 (1) RR O.rt 7 MK 535-2 1,280 shp e. 46,500 234 25,000 o 227 'es AEROSPACE Interclty
FOKKER F28 MK 4000 SID, 550, 000 4+85 50 3/6 7/10 2 (2) RR RB 183-MK 555-15 9,900 lbs e. 73,000 437 35,000 o 133 'es Fell OWShl P
AHRENS 402 I 2 000 000 +27 N/A (2) AR TPE 331-11 1,100 shp e. 16,000 170 NA NA 1982 No
AHRENS 404 S _,8- +30 8 0/6 0/6 0 (4) 2,000,000
All 250-B17B 440 shp e. 17,000 170 IB,OOO NA 1981 No
BRITI SH Jetstream 31 I .,800,000 +19 4 0/6 0/5 9 (2) AR TPE 331-10 900 shp e. 14,110 263 31,000 NA 19B2 'es AEROSPACE
BEECH 1900 I ,600,000 +19 N/A (2) P&W PT6A 1,000 shp e. 15,245 263 NA NA 1983 'es
COMMUTER CAC-l00 S 3 000 000 +44 N/A (4) P&W PT6A-41 B50 shp e. 28,900 2B7 1982 No AIRCRAFT CORP
de HAV ILLAND Dash 8 I 4 000,000 +32-36 N/A (2) P&W PT 7A-l 1,700 shp e. 29,000 260 25,000 NA 1984 'es
DORNIER 228-100 S 1 400 000 +15 8/4 5/5 3 (1) AR TPE 331-5 71!:l .,hp ea 12,568 233 29,600 NA 1981 'es
DORNIER 22S-200 I 1,500 000 +19 6/4 ,/5 3 (1) AR TPE 331-' 715 shp ea 14,500 233 27,60C NA 1981 'es
EMBRAER 110P-3 II 550 000 +19 N/A (?\ P1W DTl:::ILj:;';; 1 ,., .. ~ ..... '" 15,440 300 ." '" 19B3 'es Bandlerante
EMBRAER 120 $ I 200 000 +30 9 8/7 1/5 7 (2) P&W PT 7A-1 1,500 shp e. 20 000 2B7 35,500 NA 1985 'es Brasllld
FAIRCHILD/ SF 340 $ I 450,000 3 +34 33 7!7 1/6 0 (1) GE CT 7-5 1,650 shp ea 25,000 360 N~ NA 1984 'es 5MB CCH11lluter
SHORT BROS 360 $ J 400,000 3 +26 3E 1/6 3/6 3 (1) P&I~ PT6A-65R 1,294 shp ea 15,700 190 NA NA 1982 No LTD
AERO- AS 35 $ 5 000 000 +40-46 NA NA NA NA NA NA 1985 NA SPATlALE/ AGRlTAllA
BRIT! SH BAE 146-100 110 000 000 4/5+ 50 5/11 0/6 2 4 Lye ALF 502 R-3 6,700 lhs ea 78,850 434 22,000 NA 1982 Yes AEROSPACE 7l
BRIT! SH BAE 146-100 NA 4/5+ 5B 5/11 0/6 1 4 Lye AFl 502 R-3 6 700 lbs ea 87,500 424 24,000 NA 1983 Yes Aerospace 100
B-5
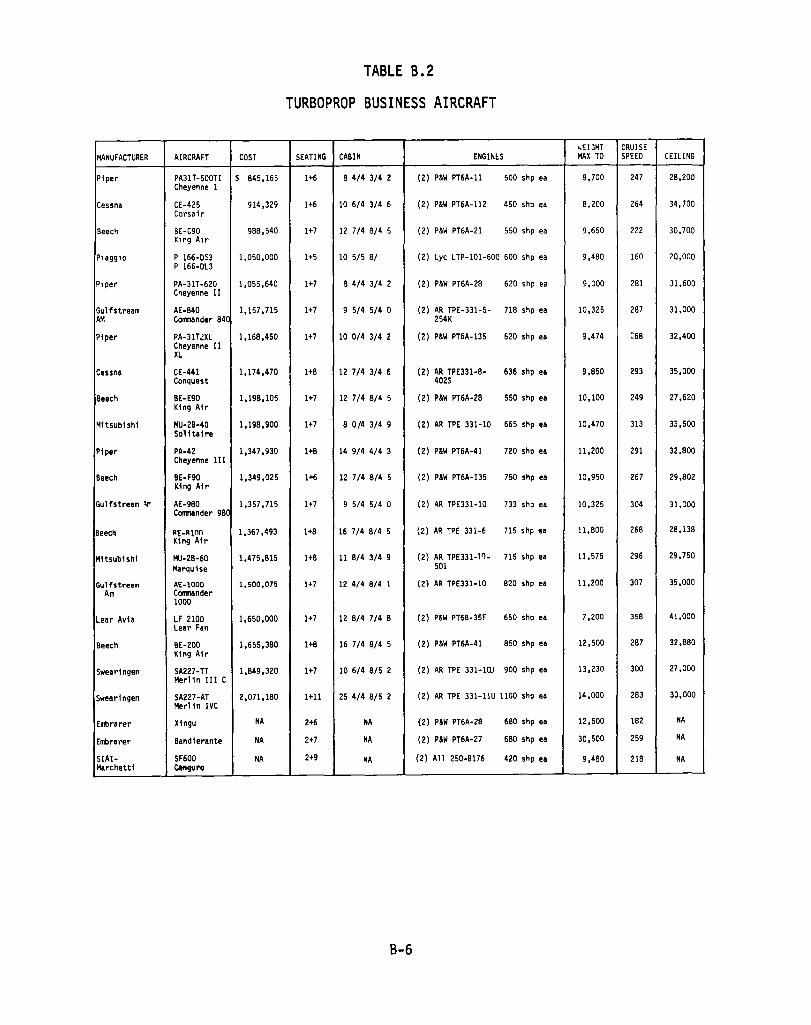
TABLE B.2
TURBOPROP BUSINESS AIRCRAFT
,EL,HT CRUISE MANUFACTURER AIRCRAFT COST SEATING CABIN ENGINlS MAX TO SPEED CEILING
Piper PA31 T-500TI $ 845,165 1+6 8 4/4 3/4 2 (2) P&W PT6A-11 500 shp ea 8,700 247 28,200 Cheyenne I
Cessna CE-425 914,329 1+6 10 6/4 3/4 6 (2) P&W PT6A-112 450 shp ea 8,200 264 34,700 Corsai r
Beech BE-C90 988,540 1+7 12 7/4 8/4 5 (2) P&W PT6A-21 550 shp ea 9,650 222 30,700 Klng A,r
PUggl0 P 166-0S3 1,050,000 1+5 10 5/5 8/ (2) Lyc LTP-IOI-600 600 shp ea 9,480 160 20,000 P 166-0L3
Plper PA-3lT -620 1,055,640 1+7 8 4/4 3/4 2 (2) P&W PT6A-28 620 shp ea 9,000 281 31,600 Cheyenne II
Gul fstream AE-840 1,157,715 1+7 9 5/4 5/4 0 (2) AR TPE-331-5- 718 shp ea 10,325 287 31,000 AM Cornnander 84 254K
Piper PA-3lT ~XL 1,168,450 1+7 10 0/4 3/4 2 (2) P&W PT6A-135 620 shp ea 9,474 268 32,400 Cheyenne II XL
Cessna CE-441 1,174,470 1+8 12 7/4 3/4 6 (2) AR TPE331-8- 636 shp ea 9,850 293 35,000 Conquest 402S
Beech BE-E90 1,198,105 1+7 12 7/4 8/4 5 (2) P&W PT6A-28 550 shp ea 10,100 249 27,620 King A1r
Mitsubishi MU-2B-40 1,198,900 1+7 8 0/4 3/4 9 (2) AR TPE 331-10 665 shp ea 10,470 313 33,500 Sol1taire
Piper PA-42 1,347,930 1+8 14 9/4 4/4 3 (2) P&W PT6A-41 720 shp ea 11,200 291 32,800 Cheyenne I II
Beech BE-F90 1,349,025 1+6 12 7/48/4 5 (2) P&W PT6A-I35 750 shp ea 10,950 267 29,802 King Air
Gulfstream ~ AE-980 1,357,715 1+7 9 5/4 5/4 0 (2) AR TPE331-10 733 shp ea 10,325 304 31,000 Cornnander 980
Beec~ RE-Rlnn 1,367,493 1+8 16 7/4 8/4 5 (2) AR TPE 331-6 715 shp ea 11,800 268 28,138 K1ng A1r
Mitsub1sh1 MU-2B-60 1,475,815 1+8 11 8/4 3/4 9 (2) AR TPE331-1~- 715 shp ea 11,575 296 29,750
Marquise 501
Gulfstream AE-I000 1,500,075 1+7 12 4/4 8/4 1 (2) AR TPE331-10 820 shp ea 11,200 307 35,000 Am Cornnander
1000
Lear Avia LF 2100 1,650,000 1+7 12 8/4 7/4 8 (2) P&W PT6B-35F 650 shp ea 7,200 358 41,000 Lear Fan
Beech BE-200 1,655,380 1+8 16 7/48/4 5 (2) P&W PT6A-41 850 shp ea 12,500 287 32,880 King Air
Swearingen SA227-TT Merlin III C
1,849,320 1+7 10 6/4 8/5 2 (2) AR TPE 331-1(1) 900 shp ea 13,230 300 27,000
Swearingen SA227-AT Merlin IVC
2,071,180 1+11 25 4/4 8/5 2 (2) AR TPE 331-11U 1100 shp ea 14,000 283 30,000
Embrarer Xingu NA 2+6 NA (2) P&W PT6A-28 680 shp ea 12,500 IB2 NA
Embrarer Bandi erante NA 2+7 NA (2) P&W PT6A-27 680 shp ea 30,500 259 NA
SIAI- SF600 NA 2+9 NA (2) All 250-B176 420 shp ea 9,480 218 NA Marchetti c.nguro
8-6

TABLE B.3
TURBOJET/.TURBOFAN BUSINESS AIRCRAFT
CABIN WEIGHT CRUI SE
MANUFACTURER AIRCRAFT COST SE'T1NG L/H/W ENGINES MAX TO SPEED CEILING
Aerospatiale SN 601 $:,750,000 2+12 18 9/5 0/5 2 (2) P&W JTl5D-4 2500 1 bs ea 15,430 389 36,000
Corvette
Cessna Jet CE 500 1,947,525 2+6 12 7/4 3/4 9 (2) P&W JTl5D-IA '200 1 bs ea 11,850 347 41,000
C,tat,on I
Gates LR-250 2,131,000 2+7 12 1/4 3/49 (2) GE CJ610-8A 2950 1 bs ea 15,000 437 51,000
LearJet
Gates LR-28 2,336,400 2+7 12 1/4 3/4 9 (2) GE CJ610-8A 2950 1 bs ea 15,000 440 51,000
LearJet
Cessna Jet CE 550 2,518,475 2+7 16 2/4 8/4 9 (2) P&W JTl5D-4 2500 lbs ea 13,300 377 43,000
C,tat,on II
Dassa 1 t AD MY-I0 3,200,000 2+7 128/47/48 (2) AR TFE731-2-1C 1730 1 bs ea 18,740 430 45,000
Falcon 10
Gates LR-35A 3,325,485 2+7 12 9/4 3/4 9 (2) AR TFE731-2-2B 3500 1 bs ea 17,000 432 45,000
LearJet
Israel A,r- IA-1l24 3,428,710 2+7 15 3/4 9/4 8 (2) AR TFE731-3-lG 3700 1 bs ea 22,850 424 45,000
craft Westw,nd I
Gates LR-55 3,529,785 2+7 13 9/5 7/5 9 (2) AR TFE731-3A-2B 3700 1 bs ea 19,500 441 51,000
LearJet
Gates LR-36A 3,545,485 2+5 10 8/4 3/4 9 (2) AR TFE731-2-28 3500 1 bs ea 18,300 432 45,000
LearJet
Gates LR-56 3,614,785 2+6 11 0/5 7/5 9 (2) AR TFE731-3A-2B 3700 1 bs ea 20,500 441 51,000
Leaqet
Israel A, r- IA-1l24A 3,828,060 2+7 15 3/4 9/4 8 (2) AR TFE731-3-1G 3700 1 bs ea 23,500 415 45,000
craft Westw,nd II
Cessna Jet CE-650XR 4,237,925 2+8 18 6/5 8/5 7 (2) AR TFE731-3B-IOO 3650 lbs ea 19,500 465 51,000 C,tat,on i i: X-
Cessna Jet CE-650 4,298,400 2+8 18 6/S 8/5 7 (2) AR TFE731-3B-IOO 36S0 lbs ea 19,5OO 464 51,000 Citat,on III
Rockwell NA-265-6S 5,100,000 2+8 19 0/5 5/5 2 (2) AR TFE731-:R-ID 3700 1 bs ea 23,800 441 45,000 Int'l ~c~rel1rer
Br,t,sh HS 125-700 5,845,000 2+8 21 3/5 8/5 9 (2) AR TFE 731-3R-IH 3700 lbs ea 24,800 427 41,000 Aerospace HS 125 Srs
700
Dassault AD MY-20F 5,960,000 2+9 24 4/5 5/6 2 (2) GE CF700-2D2 4500 1 bs ea 28,660 410 42,000 Falcon 20
Dassault AO MY-SO 8,7S0,OOO 2+9 23 5/5 9/6 1 (3) AR TFE731-3-K 3700 1 bs ea 38,800 430 45,000 Falcon 50
Canada, r CL 600 9,000,000 2+11 28 3/6 1/8 2 (2) LYC ALFS02-L 7500 1 bs ea 40,400 443 45,000 Challenger
Canada, r CL 600GE 9,900,000 2+11 28 3/6 1/8 2 (2) GE CF34-1A 8650 1 bs ea 41,450 450 45,000 Cha 11 enger (GE)
Gulfstream G-1159A 11,000,000 2+14 24 3/6 1/7 0 (2) RR SPEY MK 11400 1 bs ea 68,200 459 45,000 Aro Gul fstream Sl1-8
III
Dassaul t AD MY-20H NA 2+8 NA (2) AR- NA NA 30,000 tc NA NA Falcon 20H 32,000
M,tsub,sh, MU 300 2,381,710 2+7 15 7/4 8/4 9 (2) P&W JTlSD-4 2500 1 bs ea 14,100 423 41,000 D,amond I
Gates LR-29 2,388,300 2+5 9 9/4 4/4 9 (2) GE CJ610-8A 2950 1 bs ea 15,000 440 SI,OOO LearJet
B-7

8-8
APPENDIX C
GROUP FOR AERONAUTICAL RESEARCH AND TECHNOLOGY -EUROPE (GARTEUR)
C-l

C-2

Group for Aeronautical Research and Technology-Europe (GARTEUR)
In a recent article in the Dutch magazine, Avia, some insight into the realizatlon of a European effort to pool their aeronautical R&D resources was presented. Although this subject has been mentioned for some time, this article presented the first details of the proposed organization.
GARTEUR is a cooperative group composed of representatives from France, Germany, England and the Netherlands. It had its start in 1973 with three members -- Germany, France and England. The Netherlands became a member in 1977.
GARTEUR consists of three elements -- a Counc~l, Groups of Responsib les and' ,Working Groups.
The members of the Council are appointed by the various governments and set policy for the organization.
The Groups of Responsibles (literal translation from the Dutch) determine the details of the effort to be performed. Four areas have been highlighted:
• Aerodynamics • Flight Mechanics • Strength and Materials • Helicopters.
It is of interest to note helicopters having such a prominent posltion in the organization. This can be attributed to Europe's opinion that they are number one in rotorcraft technology and plan to stay there.
Under the Groups of Responsibles are the Working Groups. These can be likened to the Branches within NASA. The Working Groups perform the actual research. Areas in which the artlcle claims strong activities are underway include:
• Wing/body aerodynamics, especially at transonic speeds.
• Impact damage and tolerance studles-especlally composite materials. The artlcle hlghllghted the aluminum alloy
C-3

7010 which has a high strength to weight ratio and fatigue resistance.
SOURCE: Jan Roskam, 15 August 1981.
C-4
APPENDIX 0
EXCERPT FROM THE REPORT TO THE WORKSHOP BY THE PANEL ON GENERAL
AVIATION, AERONAUTICS AND SPACE ENGINEERING BOARD, ASSEMBLY OF ENGINEERING
NATIONAL RESEARCH COUNCIL, ENTITLED:
NASA's Role in Aeronautics: A Workshop Volume IV - General Aviation
0-1

0-2

RESEARCH AND TECHNOLOGY NEEDS IN GENERAL AVIATION
The primary requirements of general aviation aircraft are significant improvements in flight safety and fuel efficiency. The need for safety is clearly indicated because fatality rates are worse in general aviation than motor vehicle fatali ty rates and are two orders of magnitude poorer than the safety record of the trunk airlines. Even though corporate and business flying is an order of magnitude better than the overall general aviat ion record, it also should be significantly improved.
Fuel economy is important for general aviation. Representative fuel efficiency data, as reported by individual manufacturers, are shown in Table 2. The "mpg" ratings compare favorably with domestic cars and commercial airplanes in use today, but not with the automobiles and aircraft that are under development.
TABLE 2 General AVIatIOn Fuel EffiCIency TypICal 1980 Alrcraft
Model Statute Mlles per Gallon Sea t Mlles per Gallon
Mooney 201 195 78 Cessna P210 147 88 Beech A36 144 86 PJper Sara toga 5P 126 76 Cessna 421 70 49 Cessna 441 55 55 Gates LearJet 35A 35 28
Source Each manufacturer
Add1tional important objectives for general aviation aircraft are:
o Reduce 1nterior and exterior noise levels;
o Reduce maintenance;
o Reduce cost of ownership, particularly operat1ng costs; and
o Improve relIabIlity.
0-3

:'be ne~ tt;:chn(lof'.(~'" nqulred tv acbleVe these crltic.:::: objectlves are brlefly aescrlh~d below.
Aerodynamic s
Enhanced flight new configurations small aircraft are aviation.
characteristics to improve operational safety and to reduce the propulsive energy requi rements of the most cri tical aerodynamic needs of general
New or improved airfoils, coupled with developments in wing and wing/body conf1gurations and/or control capabilities, will improve aerodynamic effic1ency while reduc1ng requ1rements for piloting skills in general aviat10n aircraft. Such achievements, which are applicable to single- and multi-eng1ne aircraft, also will improve safety.
Structures and Materials
The dominant need in new structural technology is to develop the ncessary knowledge to make full use of advanced composite materials for general aV1ation, with special emphasis on Kevlar or aramid fibers. It is feasible to obtain a 3S percent reduction in structural weight, plus reduced interior noise, improved structural life and cleaner contours for reduced drag. The greater use of Kevlar in tires in 10 to 20 years, if the material proves successful, should reduce its price, making it practical for wider use in aircraft and resulting in higher quality aircraft.
Crashworthiness design also is an important requirement in general aviation aircraft. Such technology will be particularly necessary when composite structures are widely incorporated into general aviation aircraft - the knowledge base for crashworthy design using the materials does not exist today.
Propulsion: Turbine
Because general aviation turbine engines are small 1n comparison to transport and military power plants, unique technologies are required to achieve higher pressure ratios and higher efficiency centrifugal compressors, as well as higher turbine-inlet temperature capabilities with lower cost turb1ne construction. The technologies are essential to achieving reduced fuel consumption and lower cost engines, and they should be obtained while maintain1ng a multi-fuel capability.
Propulsion: Intermittent Combustion Engines
The dominant need 1n general aviation is 1mproved fuel efficiency; 1ncreased reliability and the ability to use middle distillates are secondary objectives, though important. Since several years will be needed to achieve these goals by develop1ng new engine types, 1mprovements are needed in current engines.
Electronic fuel controls, as well as turbochargers with improved durability, higher pressure ratios, higher efficiency, and lighter
0-4

weight will improve fuel efficiency Fabrication and design methods employing be developed, with the goal being a 30 weight.
Propulsion: Propellers
and increase reliability. lightweight materials should percent reduction in engine
Because of their inherent propulsive efficiency, propellers will be used on nearly 95 percent of present and future general aviation aircraft.
Yet, Ii ttle advancement in general aviation propeller technology has been evident in this country since World War II, in spite of the serious need for propellers of higher efficiency for commuter and business aircraft. The need for propeller research has been stimulated by the high cost of fuel, more stringent noise requirements, and increasing emphasis on safety.
High propeller efficiency must be developed over a wide range of operating conditions. Lower noise levels, longer structural life for blades, lower cost (including maintenance costs), and lower weight are required if the United States is to retain its competitive edge in the world market for general aviation products.
Electronics and Avionics
Most general aviation flying is done by businessmen-pilots. Since they must operate in the same complex air traffic environment as professional executive and air transport crews, a special need exists in general aviation to reduce the pilot's workload and to simplify the pilot's flight control, navigation, communications, and weatherrelated tasks. Improvements in reduced workload will apply equally to personal pilots and to the two-person crews for commuter airlines.
Operations
To improve general aviation safety, research is needed to detect and disseminate real-time weather information, particularly thunderstorm information, winds aloft, and atmospheric lclng conditions. Improved technologles also are needed to protect the general aviation airframe, propeller, and engine from the accumulation of ice in flight.
Research should be conducted to 1mprove the operational efficiency of Air Traffic Control (ATC) systell's. Inefficlencles in ATC systems can cause delays that could offset the gains in fuel efficiency made possible by research in NASA's tradltlonal areas of work.
Human Engineerlng
Because general aVlation a1rcraft are flown by the most diverse and often least experienced members of the aviation community, a unique need exists for advances 1n human engineerlng. Enhanced general aV1ation safety and effic1ency will result from slmplifY1ng COCkP1ts, 1'llprOv1ng the readah111ty of instruments, and lmprov1ng
0-5

aVlOnlCS, cU'itrols, and displAY!:> that reduce pilot I1orkloar .wei the consequences of human error· Easier mean& for accurate fu(;:l management and improved flight control systems, including stability augmentation, also will lead to higher levels of flight safety and fuel efficiency. Human engineering research should be conducted in the area of designs for maintenance simplicity, including maintenance monitoring and diagnostic techniques. particularly because the industry anticipates increasing shortages in the number of skilled mechanics.
D-6

EVOLUTION OF NASA'S ROLE IN GENERAL AVIATION AERONAUTICS
From its inception in 1915 to the start of World War II, the research work of the National Advisory Committee for Aeronautics (NACA) was of great benefit to the entire aeronautical community -although primarily conducted to support military aviation. In many cases, the performance of military and commercial aircraft was nearly identical, the problems confronted in the development of each were quite similar, and not infrequently both types were designed by the same staff.
With World War II came an immense expansion of aeronautical development in the United States. By 1945, aircraft production capacity had increased vastly, and a network of airfields with paved runways had been constructed. Technology had advanced to the point where airliners could fly at speeds that only five years earlier were the sole province of fighter aircraft, and some fighter planes were flirting with the speed of sound. During the next decade, the jet engine pushed military aircraft to supersonic speeds, and the airlines wrested the long-range passenger market from t rains and ocean liners. The airframe companies found 1t desirable to split their activities into commerc1al and military divisions. The NACA found that the frontiers of aerodynamics and propulsion technology for military aircraft, pressing into the realm of supersonic flight, had extended beyond commercial aviation. For the first t1me, the research and development needs of the two segments of the ~ndustry were substantially different.
In the 1950s, general aviation began to emetge as a s1gn1ficant mode of transportation. Even so, the technology for general aviation was far from the aeronaut1cal frontiers be1ng explored in the 1950s and 1960s. The 1971 C1v1l Aviat1.on Research and Development (CARD) study, conducted Jointly by the Department of Transportation (DOT) and NASA, recommended that NASA limit 1.ts research in general aviation to factors relat ing to safety. Consequent ly, NASA's at tempts to introduce other research activit1es related to general aviation were unsuccessful.
As important as safety is, product improvement in general aviation demands both the application of eX1sting advanced technologies and the generation of new research relatln~ especIally to ~irfnils, orope11ers,
0-7

r1dl:-lrtl~, a.,d pr()1JU1SlOr c,vste'lls. WIthout the necessary In-house c2rahIllty, and wIthout specIfIc NASA ass1stance, the general aviatIon Industry's development of these technologies has been a slow and difficult process. The result has been that today's general aviation products have yet to reach their full potential.
0-8

NASA'S ROLE IN GENERAL AVIATION AERONAUTICS: 1980 AND BEYOND
General aviation needs substantial new technology development to fulfill the technology needs previously outlined. In particular, an order of magnitude improvement in safety and a 50 percent increase in mpg are needed for future models.
NASA aerodynamics and avionics research on commercial airliners benefits business-jet technology. That is about the only benefit obtained from the NASA research conducted for large airliners and military aircraft. The great differences in size between general aviation aircraft and the wjde-body transports result in almost completely different structural design parameters. Moreover, the bulk of general aviation aircraft will always be propeller driven and smaller than the commercial transport, necessitating entirely dlfferent lines of research.
NASA's general aviation effort, in 1980, is less than 3 percent of its aeronautical research and technology (R&T) budget and only 175 out of 4000 people working in aeronautics were devoted to general aviation research.
The panel's recommendations regarding the roles that NASA should play In the 1980s and beyond are summarIzed in Figure 5. The following sections describe the types of effort that NASA could provide for the future design and development of general aviation aIrcraft, within the context of the general technology needs prevIously outlined.
AerodynamICs
Because flIght safety and fuel effIcIency are of primary concern, the aerodynamIcs research and development reqUIrements for general aVIation fall Into three major categories: high-lift consIderatIons (includIng cont rol systems), low drag, and hand11ng qualities. The small size and configurat Ions of typIcal general aVIatIon machines present particular aerodynamIc conditions that require special consIderatIon.
OperatIonal between flight
experIence has demonstrated a strong relatlonshlp safety and the aIrcraft's abIlity to fly slowly whIle
malntaInIn:j strong, POSItIve control -iurlng land 1 ng approach
D-9

PROPULSION
DISCIPLINES IrJ NASA ROLE eOOE I'" (J 1 Mo,o' Rof. I'" ~ "
~ ~ &'p. ·2 MocMf.t. ROI. I.;. (1 ~ 0 ~ ·3 MinOt Rol. /~",:J $ ., ~,: - No Aol. til '" ~... (J'" (1:" ~
~/,:J ~ ~ ~ & ~/~,; $ § & • ,J.;,/ ... .::i,'" ~,,~ Ie,. '" ~/r.,/~8~ ... rJ't 0~ / ~... <§ ¢' ~ ~
ROLES ~ tfj~ ~/ tt~ ~ .:!I.'" ~ NATIONAL FACILITIES IIr EXPERTISE 1 1 1 1 1 3 1 1
RESEARCH 1 1 1 1 1 - 1 1
GENERIC TECHNOLOGY EVOLUTION 1 , 1 1 1 3 1 -VEHICLE CLASS TECHNOLOGY EVOLUTION 2 1 1 1 1 3 1 1
TECHNOLOGY DEMONSTRATION 1 1 1 1 1 3 1 -TECHNOLOGY VALIDATION - 2 2 2 2 - 1 -PROTOTYPE DEVELOPMENT - - - - - - - -OPERATIONS FEASIBILITY - - - - - - - -
-If • propOMd prOlec. or prOirem Inlll.lIy f.lI. ,n • recommended m_rl" minor I or "0.,01, cltegory but fQllowl"l review of It. ".., .. , on In ,nd"m.,.'t;tM bill, II dHfnId to be .... .,abl. undlrt.klng by Virtue of ,,, belno 'n th. MUOMI In",., or mand.ttd by the Coner •• Or I •• ,"ult of review I' 'I COrteludid ,h.r. ar. other ove"Jdlng Clrcum.t.nc:ft then NASA. '0'. 'D. Ihil prO,..' D ........ m wou'd 1M ."'.,011,0 ..... '0. 0 ... 10. ClI .... rv 1 I
FIGURE 5 GENERAL AVIATION Role/Discipline Matrix
maneuvers. Nearly 50 percent of all general aviation accidents occur during the final phase of flight. Thus, particular interest is focused on the development of high-11ft systems that can be utilized with high-aspect-ratio wings employing low-drag airfoils. Such airfoils are typical of those that will be employed by energy-efficient aircraft.
Low-drag research must be directed toward systems that increase the extent of laminar flow over both wing and fuselage surfaces, toward interference between wing and body surfaces, and toward powerp1ant/airframe integration (particularly engine cooling drag and l- )undary layer-slipstream or propeller inflow interactions). Vortex modifiers such as w!nglets also need continued development.
Much still remains to be done to improve the handling qualities of general aviation aircraft in order to simplify piloting tasks. Systems that provide stall-l;lvoidance and improve flight-path control also are needed.
Structures and Materials
The timely development of advanced composite technology for general aviat ion is dependent on NASA's performance of the follow! ng types of efforts:
0-10

o Improve the compressive strength of Kevlar;
o Find a new matrix material that will cure well below 3500 F and as close to room temperature as possible;
o Develop improved design approaches composites;
o Reduce manufacturing costs;
for using advanced
o Develop low cost and effective inspection techniques;
o Develop strength analysis techniques; and
o Establish data on fatigue and damage tolerance.
NASA's investigations of the applications of composites should include not only major airframe structures but also propellers and landing gear. In addition, extensive research 1.S needed in the area of the crashworthiness characteristics of composite structures, because such materials are significantly different from aluminum. Full-scale structural mockup testing will be required, as well as material and component testing. In doing this, the research will need to extend through the Technology Validation phase, with extensive NASA work in-house and contract projects with universities and the industry.
Propulsion: Turbine
General aviation propulsion systems must meet the following challenges in the 1990s:
o Improved fuel economy and performance;
o Increased reliability and safety;
o Lower manufacturing cost;
o Improved material technology; and
o Durability and lower maintenance.
NASA can best contribute to finding answers to these challenges in small propulsion turbines for general aviation by conducting programs in the following areas:
o Component technology of compressors. combustors. turbines, seals, and nozzles;
o Mater1.als for advance turbine engines;
o Alternative fuels;
0-11

() Ll\.-::llS~ manufactunng LE::chnology, c;uch as la"linated turbine cons~ruction;
o Ceramlcs for turbines;
o Engine aeroelastic and aerodynamic measurement techniques; and
o Advanced codes and numerical methods.
The u.s. gas turbIne manufacturers have a significant share of the worldwide turboprop market and dominate the turbofan market. If this posItIon 1S to be maintained, it is necessary to maintain a superior technical capability in these disciplines. NASA has the requisite skills and facilities that, together with the universities and industry, can contribute significantly to the technical superiority of small aircraft propulsion systems.
Propulsion: Intermittent Combustion Engines
The current concern for fuel cost and fuel availability is a motivating force in the pursuit of technological leads toward engines with substantially better fuel efficiency and broad-specification fuel capability. All known alternative engine systems should be analyzed for the most promising concepts. The alternatives already identified are a diesel engine, a rotary engine, and an ~vanced concept spark-ignition engine. Turbochargers of higher pressure ratio and higher overall efficiency with lower weight also are required. The basic technologies essential to the success of the selected systems should be developed to the level that soundness is demonstrated.
The properties of engine components fabricated in advanced materials need to be determined; in addition, manufacturing and design methods need to be developed. Weight reductions of ]0 percent might be achieved using fiber composite structures and powder metallurgy developments.
The cost of airplane maintenance can be reduced and safety improved by electronic diagnostic systems, which could be applied to indicate engine condition. This will help alleviate a future maintenance problem that is likely to occur with the expected shortage of mechanics in the next decade.
Propulsion: Propellers
Studies conducted by NASA and the industry show that the application of advanced technology to general aviation propellers could result in reducing fuel consumption by approximately 10 percent. This benefit will be sought by utilizing new aerodynamic technology such as improved aIrfoils; proper thickness distribution and planform; and propeller Innovations such as proplets, smooth surface finishes, and suitable propeller/nacelle integration. Furthermore, noise levels can be considerably lowered (approximately 5 dB) by proper acoustic design. Lower weight, lower manufacturIng cost, and enhanced safety are achievable by replacing the present aluminum blades with new
0-12
materials such as advanced composites. NASA has a role in the development and demonstration of such technologies. In developing the technologies, flight tests are essential. Ground and wind-tunnel tests cannot fully demonstrate propeller characteristics because of flow interference effects.
Electronics and Avionics
The general aviation avionics industry, spurred by active competition and breakthroughs in digital electronics technology (e.g., large-scale integrated circuits, microprocessors, and microcomputers), has demonstrated an aggressive and effective responsiveness to the increasing needs of p1lots for the integrated and simplified display of weather and operational data in today's complex air traffic system.
While NASA is unlikely to make major contributions in avionics for general aviation, the avionics community has limited capability to develop basic sensors and display components vital to optimum use of the technology. In the area of basic sensors that measure such things as altitude, pressure, engine temperatures and vibration, NASA should provide research help in developing low-cost, reliable units with digital outputs.
Vehicle Operations
NASA scient1sts and facilities could be important in developing an improved definition of atmospheric icing conditions in detectable and reportable gradations of severity. The agency also should place a high priority on enhancing the technology of in-flight ice protection for use on general aviation aircraft.
Moreover, NASA should maintain its existing facilities and expertise and undertake basic research toward improving the efficiency of the Air Traffic Control (ATC) system. NASA's technical capabilities can be of value to Federal Aviation Administrat10n (FAA).
To enhance safety and aid pilots in lowering fuel consumption, NASA should prov1de 1nformation to the National Oceanic and Atmospheric Admin1strat10n (NOAA) and the FAA on techniques for measuring and d1ssem1nat1ng winds-aloft data and other real-time weather information.
Human Eng1neering
The field of human eng1neering 1S increasingly important in the design of all categorl_es of aircraft. Th1s technology can have a particularly s1gn1ficant 1mpact in general aV1at10n because many general aviation pilots have limited opportun1ties to maintain their profic1ency. To 1ncrease the safety of flight under these circumstances, NASA should conduct investigations of cockpit controls and displays from baslc Research through Technology Evolutlon to reduce the p110t's workload slgnlficantly.
The efflciency and operating costs of general aviation alrcraft can be improved si~nlflcantly by designs that use human ':1gi",--2ring to achleve maintenance slnpllclty. Improved alrcraft ~alntenance may be
0-13

C'p('C'lt'd fro~ the devt.]oPi"H:nl of monltonrf., dne cldgnostlc equlpmf::!nt and technIques.
Why NASA?
The last few years have seen a loss of U.S. dominance in some industries in which, at one time, the nation was the world leader. Many reasons have been advanced, post facto, including inadequate productivity, increasing labor costs, loss of U.S. lnnovation capacity and/or ability to brIng new or improved products to market, real or alleged predatory practices on the part of foreign governments with mIxed economIes, rapidly escalating social programs and large social costs. Whatever the reason, the effects are real. The United States can no longer expect to maintain superiority, or, in some cases, parity in world markets in all fields through the efforts of individual companies.
Foreign competitors have made impressive inroads in U.S. international and domestic markets by focusing on selected fields and products. The most current example is the rapid rise in imports of Japanese cars.
How does this apply to general aviation? This industry has always been a very difficult business in which the few have succeeded, principally because these companies have been able to run austere operations. Based on sales of aircraft models, the industry is characterized as low-volume and subject to cyclic fluctuations in demand. Investment in tooling, along with the most straightforward design development for a new model, can pose a risk to a company's existence. Consequently, technological risk has been avoided and only well-proven technology has been used. Almost all "new" models have been derivatives of previous aircraft, which retained much of the previous engineering and tooling. Even the successful companies have limited facilities and technical expertise for developing advanced designs. These companies simply cannot afford the risk of incorporating unproven new technology in their products.
NASA is the logical organization to conduct general aviation research. It has the facilities, expertise, and prestige necessary for such programs. Existing NASA facilities are applicable; the expertise is available in all of the pertinent disciplines; and the agency has experience in assembling an efficient team involving industry, government, and academe. Whatever questions have been asked about NASA's role in aeronautics in the past, it is imperative to maximize utilization of the agency in support of the domestic industry immediately.
Also, in the past, facing negligible foreign competition, U.S. firms have been able to proceed without advancing the state of the art. However, two new factors heavily subsidized foreign competition and quintupling of the cost of fuel -- require significant technological advances in order for U. S. aircraft to compete effectively in the future, either at home or abroad.
In the past, general aviation has benefited from Jald geuc:rated by NACA and NASA for the military and for commercial transports. At present, general aviation requires new NASA technology specifically
0-14

for general aviation. The industry accepts foreign competition; but, in view of heavy foreign government subsidies and the realities of the marketplace, advanced technology to retain the U.S. lead in general aviation is imperative.
0-15

End of Document