Embed Size (px)
Citation preview
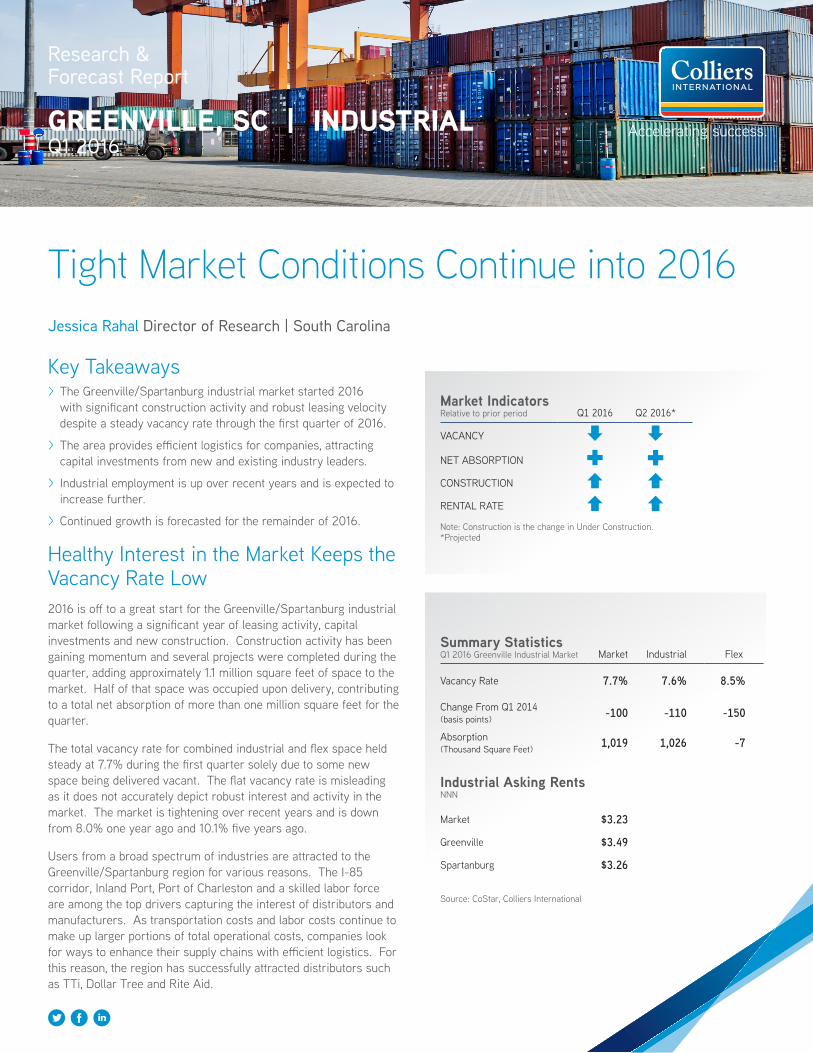
Research & Forecast Report
GREENVILLE, SC | INDUSTRIALQ1 2016
Tight Market Conditions Continue into 2016 Jessica Rahal Director of Research | South Carolina
Key Takeaways > The Greenville/Spartanburg industrial market started 2016 with significant construction activity and robust leasing velocity despite a steady vacancy rate through the first quarter of 2016.
> The area provides efficient logistics for companies, attracting capital investments from new and existing industry leaders.
> Industrial employment is up over recent years and is expected to increase further.
> Continued growth is forecasted for the remainder of 2016.
Healthy Interest in the Market Keeps the Vacancy Rate Low2016 is off to a great start for the Greenville/Spartanburg industrial market following a significant year of leasing activity, capital investments and new construction. Construction activity has been gaining momentum and several projects were completed during the quarter, adding approximately 1.1 million square feet of space to the market. Half of that space was occupied upon delivery, contributing to a total net absorption of more than one million square feet for the quarter.
The total vacancy rate for combined industrial and flex space held steady at 7.7% during the first quarter solely due to some new space being delivered vacant. The flat vacancy rate is misleading as it does not accurately depict robust interest and activity in the market. The market is tightening over recent years and is down from 8.0% one year ago and 10.1% five years ago.
Users from a broad spectrum of industries are attracted to the Greenville/Spartanburg region for various reasons. The I-85 corridor, Inland Port, Port of Charleston and a skilled labor force are among the top drivers capturing the interest of distributors and manufacturers. As transportation costs and labor costs continue to make up larger portions of total operational costs, companies look for ways to enhance their supply chains with efficient logistics. For this reason, the region has successfully attracted distributors such as TTi, Dollar Tree and Rite Aid.
Summary Statistics Q1 2016 Greenville Industrial Market Market Industrial Flex
Vacancy Rate 7.7% 7.6% 8.5%
Change From Q1 2014 (basis points) -100 -110 -150
Absorption (Thousand Square Feet) 1,019 1,026 -7
Industrial Asking Rents NNN
Market $3.23
Greenville $3.49
Spartanburg $3.26
Market IndicatorsRelative to prior period Q1 2016 Q2 2016*
VACANCY
NET ABSORPTION
CONSTRUCTION
RENTAL RATE Note: Construction is the change in Under Construction. *Projected
Source: CoStar, Colliers International
Additionally, the future openings of Mercedes-Benz Vans and Volvo Cars in Charleston have the potential to bring additional business to automotive suppliers located in the Upstate. Some BMW suppliers are already looking to increase capacity in order to accommodate Mercedes and Volvo and may need to expand their existing facilities or relocate into larger space.
Industrial Market
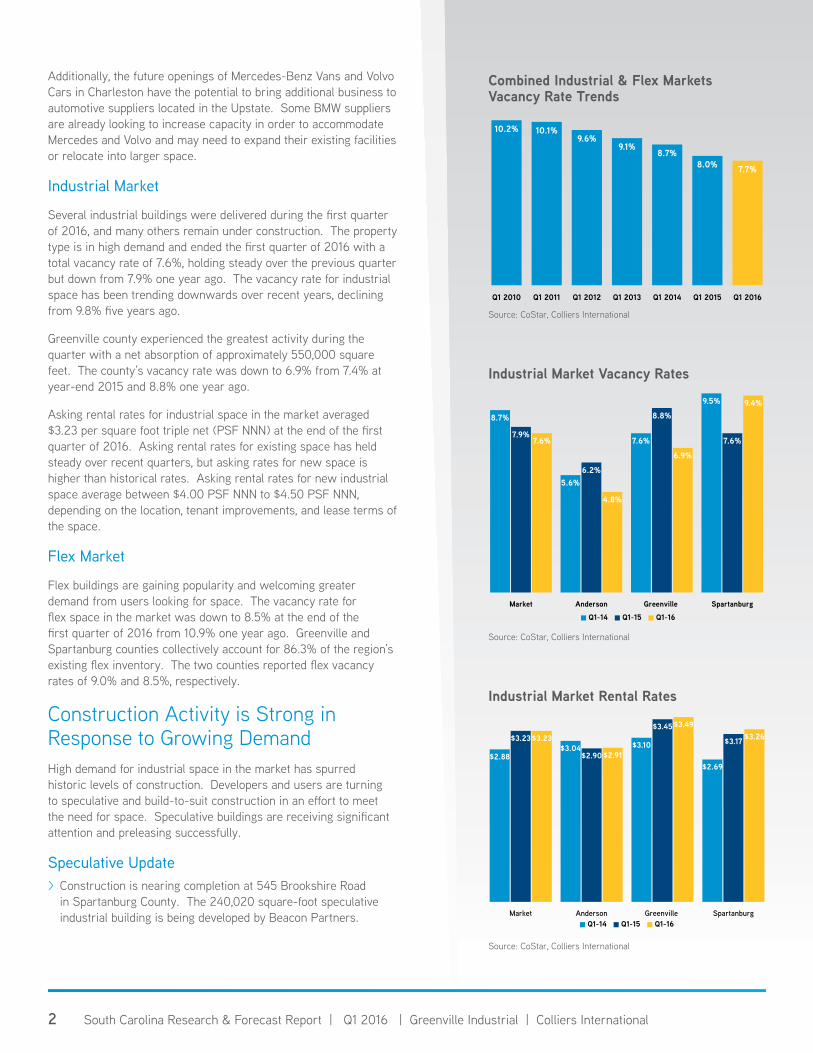
Several industrial buildings were delivered during the first quarter of 2016, and many others remain under construction. The property type is in high demand and ended the first quarter of 2016 with a total vacancy rate of 7.6%, holding steady over the previous quarter but down from 7.9% one year ago. The vacancy rate for industrial space has been trending downwards over recent years, declining from 9.8% five years ago.
Greenville county experienced the greatest activity during the quarter with a net absorption of approximately 550,000 square feet. The county’s vacancy rate was down to 6.9% from 7.4% at year-end 2015 and 8.8% one year ago.
Asking rental rates for industrial space in the market averaged $3.23 per square foot triple net (PSF NNN) at the end of the first quarter of 2016. Asking rental rates for existing space has held steady over recent quarters, but asking rates for new space is higher than historical rates. Asking rental rates for new industrial space average between $4.00 PSF NNN to $4.50 PSF NNN, depending on the location, tenant improvements, and lease terms of the space.
Flex Market
Flex buildings are gaining popularity and welcoming greater demand from users looking for space. The vacancy rate for flex space in the market was down to 8.5% at the end of the first quarter of 2016 from 10.9% one year ago. Greenville and Spartanburg counties collectively account for 86.3% of the region’s existing flex inventory. The two counties reported flex vacancy rates of 9.0% and 8.5%, respectively.
Construction Activity is Strong in Response to Growing DemandHigh demand for industrial space in the market has spurred historic levels of construction. Developers and users are turning to speculative and build-to-suit construction in an effort to meet the need for space. Speculative buildings are receiving significant attention and preleasing successfully.
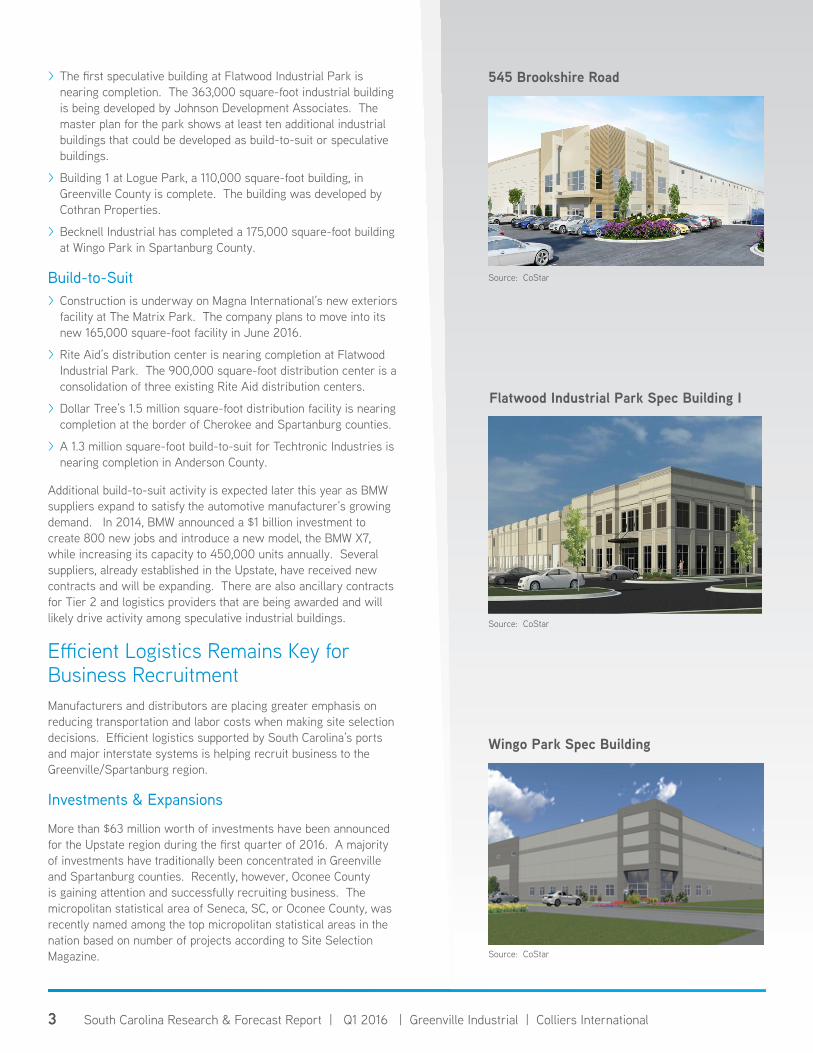
Speculative Update > Construction is nearing completion at 545 Brookshire Road in Spartanburg County. The 240,020 square-foot speculative industrial building is being developed by Beacon Partners.
Industrial Market Vacancy Rates
Source: CoStar, Colliers International
8.7%
5.6%
7.6%
9.5%
7.9%
6.2%
8.8%
7.6%7.6%
4.8%
6.9%
9.4%
Market Anderson Greenville SpartanburgQ1-14 Q1-15 Q1-16
Combined Industrial & Flex Markets Vacancy Rate Trends
Source: CoStar, Colliers International
10.2% 10.1%9.6%
9.1%8.7%
8.0% 7.7%
Q1 2010 Q1 2011 Q1 2012 Q1 2013 Q1 2014 Q1 2015 Q1 2016
Industrial Market Rental Rates
Source: CoStar, Colliers International
$2.88$3.04 $3.10
$2.69
$3.23
$2.90
$3.45
$3.17$3.23
$2.91
$3.49$3.26
Market Anderson Greenville SpartanburgQ1-14 Q1-15 Q1-16
2 South Carolina Research & Forecast Report | Q1 2016 | Greenville Industrial | Colliers International
3
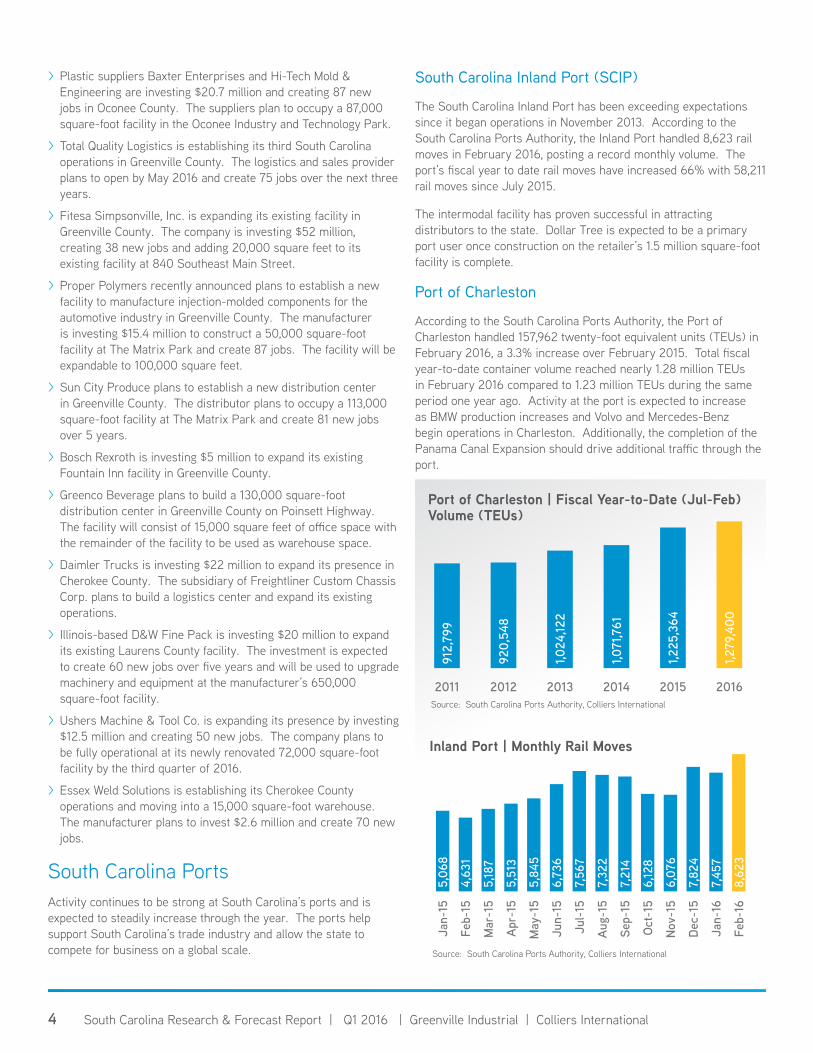
> The first speculative building at Flatwood Industrial Park is nearing completion. The 363,000 square-foot industrial building is being developed by Johnson Development Associates. The master plan for the park shows at least ten additional industrial buildings that could be developed as build-to-suit or speculative buildings.
> Building 1 at Logue Park, a 110,000 square-foot building, in Greenville County is complete. The building was developed by Cothran Properties.
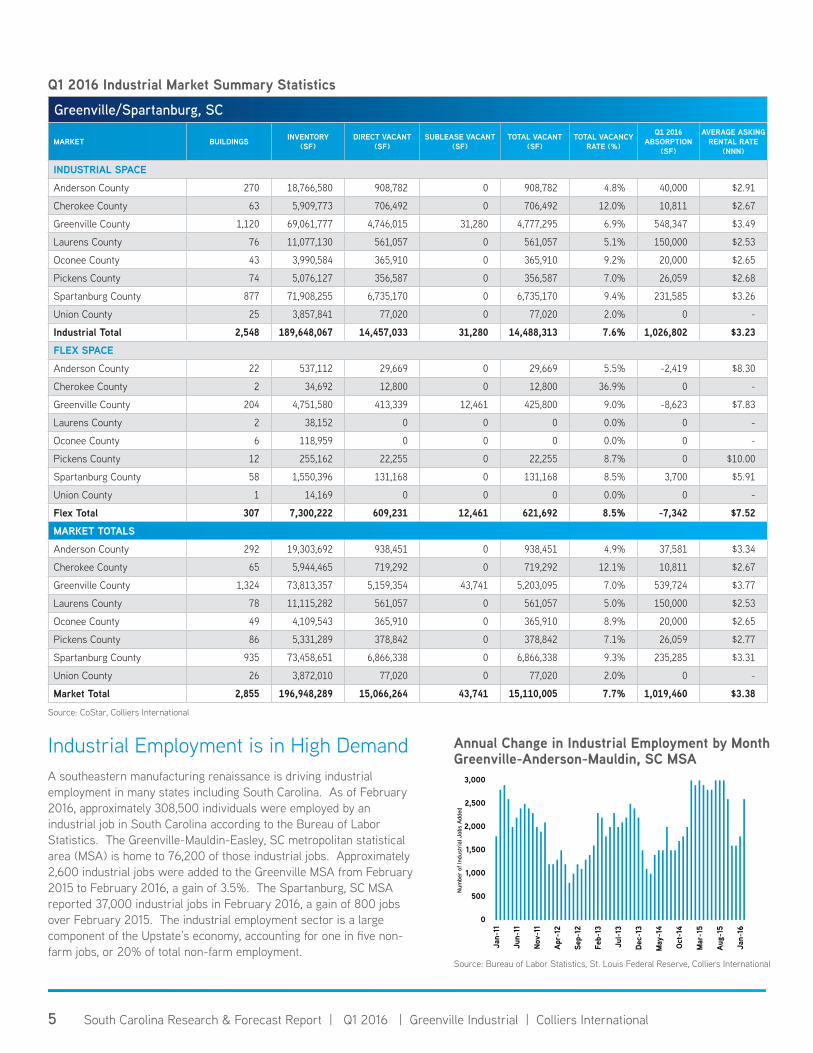
> Becknell Industrial has completed a 175,000 square-foot building at Wingo Park in Spartanburg County.
Build-to-Suit > Construction is underway on Magna International’s new exteriors facility at The Matrix Park. The company plans to move into its new 165,000 square-foot facility in June 2016.
> Rite Aid’s distribution center is nearing completion at Flatwood Industrial Park. The 900,000 square-foot distribution center is a consolidation of three existing Rite Aid distribution centers.
> Dollar Tree’s 1.5 million square-foot distribution facility is nearing completion at the border of Cherokee and Spartanburg counties.
> A 1.3 million square-foot build-to-suit for Techtronic Industries is nearing completion in Anderson County.
Additional build-to-suit activity is expected later this year as BMW suppliers expand to satisfy the automotive manufacturer’s growing demand. In 2014, BMW announced a $1 billion investment to create 800 new jobs and introduce a new model, the BMW X7, while increasing its capacity to 450,000 units annually. Several suppliers, already established in the Upstate, have received new contracts and will be expanding. There are also ancillary contracts for Tier 2 and logistics providers that are being awarded and will likely drive activity among speculative industrial buildings.
Efficient Logistics Remains Key for Business RecruitmentManufacturers and distributors are placing greater emphasis on reducing transportation and labor costs when making site selection decisions. Efficient logistics supported by South Carolina’s ports and major interstate systems is helping recruit business to the Greenville/Spartanburg region.
Investments & Expansions
More than $63 million worth of investments have been announced for the Upstate region during the first quarter of 2016. A majority of investments have traditionally been concentrated in Greenville and Spartanburg counties. Recently, however, Oconee County is gaining attention and successfully recruiting business. The micropolitan statistical area of Seneca, SC, or Oconee County, was recently named among the top micropolitan statistical areas in the nation based on number of projects according to Site Selection Magazine.
Source: CoStar
545 Brookshire Road
Source: CoStar
Flatwood Industrial Park Spec Building I
Source: CoStar
Wingo Park Spec Building
3 South Carolina Research & Forecast Report | Q1 2016 | Greenville Industrial | Colliers International
> Plastic suppliers Baxter Enterprises and Hi-Tech Mold & Engineering are investing $20.7 million and creating 87 new jobs in Oconee County. The suppliers plan to occupy a 87,000 square-foot facility in the Oconee Industry and Technology Park.
> Total Quality Logistics is establishing its third South Carolina operations in Greenville County. The logistics and sales provider plans to open by May 2016 and create 75 jobs over the next three years.
> Fitesa Simpsonville, Inc. is expanding its existing facility in Greenville County. The company is investing $52 million, creating 38 new jobs and adding 20,000 square feet to its existing facility at 840 Southeast Main Street.
> Proper Polymers recently announced plans to establish a new facility to manufacture injection-molded components for the automotive industry in Greenville County. The manufacturer is investing $15.4 million to construct a 50,000 square-foot facility at The Matrix Park and create 87 jobs. The facility will be expandable to 100,000 square feet.
> Sun City Produce plans to establish a new distribution center in Greenville County. The distributor plans to occupy a 113,000 square-foot facility at The Matrix Park and create 81 new jobs over 5 years.
> Bosch Rexroth is investing $5 million to expand its existing Fountain Inn facility in Greenville County.
> Greenco Beverage plans to build a 130,000 square-foot distribution center in Greenville County on Poinsett Highway. The facility will consist of 15,000 square feet of office space with the remainder of the facility to be used as warehouse space.
> Daimler Trucks is investing $22 million to expand its presence in Cherokee County. The subsidiary of Freightliner Custom Chassis Corp. plans to build a logistics center and expand its existing operations.
> Illinois-based D&W Fine Pack is investing $20 million to expand its existing Laurens County facility. The investment is expected to create 60 new jobs over five years and will be used to upgrade machinery and equipment at the manufacturer’s 650,000 square-foot facility.
> Ushers Machine & Tool Co. is expanding its presence by investing $12.5 million and creating 50 new jobs. The company plans to be fully operational at its newly renovated 72,000 square-foot facility by the third quarter of 2016.
> Essex Weld Solutions is establishing its Cherokee County operations and moving into a 15,000 square-foot warehouse. The manufacturer plans to invest $2.6 million and create 70 new jobs.
South Carolina PortsActivity continues to be strong at South Carolina’s ports and is expected to steadily increase through the year. The ports help support South Carolina’s trade industry and allow the state to compete for business on a global scale.
South Carolina Inland Port (SCIP)
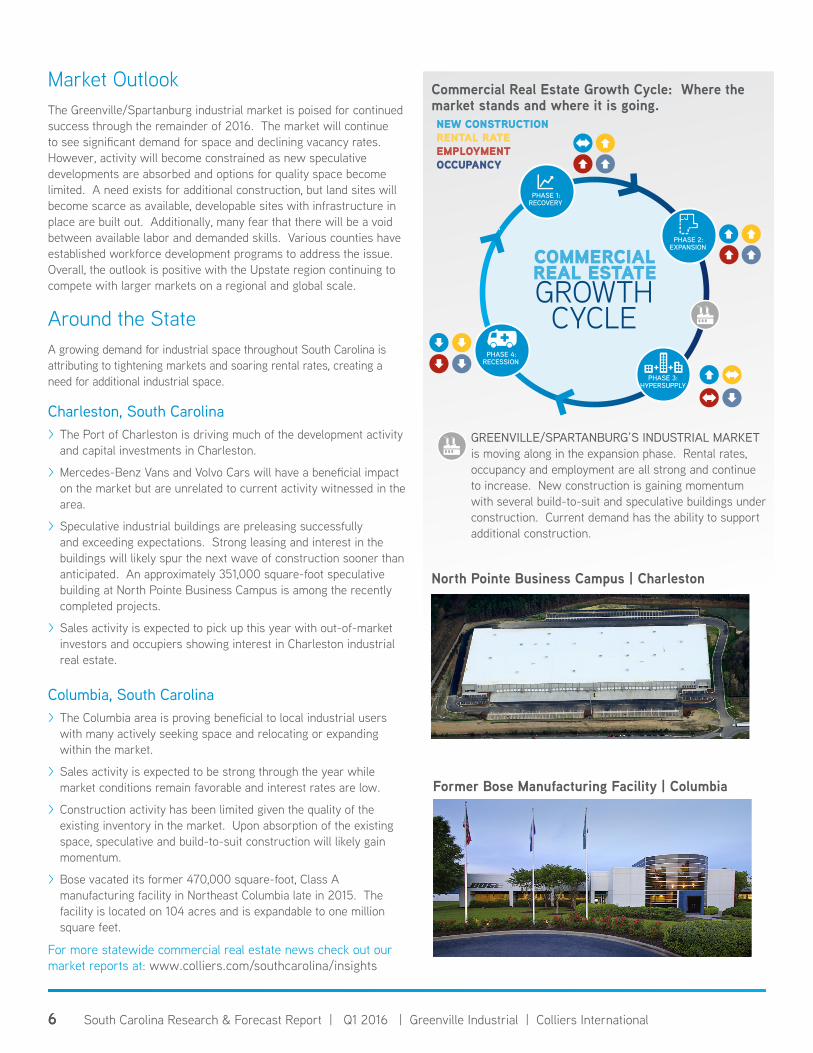
The South Carolina Inland Port has been exceeding expectations since it began operations in November 2013. According to the South Carolina Ports Authority, the Inland Port handled 8,623 rail moves in February 2016, posting a record monthly volume. The port’s fiscal year to date rail moves have increased 66% with 58,211 rail moves since July 2015.
The intermodal facility has proven successful in attracting distributors to the state. Dollar Tree is expected to be a primary port user once construction on the retailer’s 1.5 million square-foot facility is complete.
Port of Charleston
According to the South Carolina Ports Authority, the Port of Charleston handled 157,962 twenty-foot equivalent units (TEUs) in February 2016, a 3.3% increase over February 2015. Total fiscal year-to-date container volume reached nearly 1.28 million TEUs in February 2016 compared to 1.23 million TEUs during the same period one year ago. Activity at the port is expected to increase as BMW production increases and Volvo and Mercedes-Benz begin operations in Charleston. Additionally, the completion of the Panama Canal Expansion should drive additional traffic through the port.
Port of Charleston | Fiscal Year-to-Date (Jul-Feb)Volume (TEUs)
1,279
,400
1,225
,364
1,071
,761
1,024
,122
920,
548
912,
799
201620152014201320122011Source: South Carolina Ports Authority, Colliers International
5,06
8
4,63
1
5,18
7
5,51
3
5,84
5
6,73
6
7,56
7
7,32
2
7,21
4
6,12
8
6,07
6
7,82
4
7,45
7
8,62
3
Jan-
15
Feb-
15
Mar
-15
Apr-
15
May
-15
Jun-
15
Jul-1
5
Aug-
15
Sep-
15
Oct-
15
Nov-
15
Dec-
15
Jan-
16
Feb-
16Inland Port | Monthly Rail Moves
Source: South Carolina Ports Authority, Colliers International
4 South Carolina Research & Forecast Report | Q1 2016 | Greenville Industrial | Colliers International
Q1 2016 Industrial Market Summary Statistics
Greenville/Spartanburg, SC
MARKET BUILDINGS INVENTORY (SF)
DIRECT VACANT (SF)
SUBLEASE VACANT(SF)
TOTAL VACANT(SF)
TOTAL VACANCY RATE (%)
Q1 2016 ABSORPTION
(SF)
AVERAGE ASKING RENTAL RATE
(NNN)
INDUSTRIAL SPACEAnderson County 270 18,766,580 908,782 0 908,782 4.8% 40,000 $2.91
Cherokee County 63 5,909,773 706,492 0 706,492 12.0% 10,811 $2.67
Greenville County 1,120 69,061,777 4,746,015 31,280 4,777,295 6.9% 548,347 $3.49
Laurens County 76 11,077,130 561,057 0 561,057 5.1% 150,000 $2.53
Oconee County 43 3,990,584 365,910 0 365,910 9.2% 20,000 $2.65
Pickens County 74 5,076,127 356,587 0 356,587 7.0% 26,059 $2.68
Spartanburg County 877 71,908,255 6,735,170 0 6,735,170 9.4% 231,585 $3.26
Union County 25 3,857,841 77,020 0 77,020 2.0% 0 -
Industrial Total 2,548 189,648,067 14,457,033 31,280 14,488,313 7.6% 1,026,802 $3.23FLEX SPACEAnderson County 22 537,112 29,669 0 29,669 5.5% -2,419 $8.30
Cherokee County 2 34,692 12,800 0 12,800 36.9% 0 -
Greenville County 204 4,751,580 413,339 12,461 425,800 9.0% -8,623 $7.83
Laurens County 2 38,152 0 0 0 0.0% 0 -
Oconee County 6 118,959 0 0 0 0.0% 0 -
Pickens County 12 255,162 22,255 0 22,255 8.7% 0 $10.00
Spartanburg County 58 1,550,396 131,168 0 131,168 8.5% 3,700 $5.91
Union County 1 14,169 0 0 0 0.0% 0 -
Flex Total 307 7,300,222 609,231 12,461 621,692 8.5% -7,342 $7.52MARKET TOTALSAnderson County 292 19,303,692 938,451 0 938,451 4.9% 37,581 $3.34
Cherokee County 65 5,944,465 719,292 0 719,292 12.1% 10,811 $2.67
Greenville County 1,324 73,813,357 5,159,354 43,741 5,203,095 7.0% 539,724 $3.77
Laurens County 78 11,115,282 561,057 0 561,057 5.0% 150,000 $2.53
Oconee County 49 4,109,543 365,910 0 365,910 8.9% 20,000 $2.65
Pickens County 86 5,331,289 378,842 0 378,842 7.1% 26,059 $2.77
Spartanburg County 935 73,458,651 6,866,338 0 6,866,338 9.3% 235,285 $3.31
Union County 26 3,872,010 77,020 0 77,020 2.0% 0 -
Market Total 2,855 196,948,289 15,066,264 43,741 15,110,005 7.7% 1,019,460 $3.38
Industrial Employment is in High DemandA southeastern manufacturing renaissance is driving industrial employment in many states including South Carolina. As of February 2016, approximately 308,500 individuals were employed by an industrial job in South Carolina according to the Bureau of Labor Statistics. The Greenville-Mauldin-Easley, SC metropolitan statistical area (MSA) is home to 76,200 of those industrial jobs. Approximately 2,600 industrial jobs were added to the Greenville MSA from February 2015 to February 2016, a gain of 3.5%. The Spartanburg, SC MSA reported 37,000 industrial jobs in February 2016, a gain of 800 jobs over February 2015. The industrial employment sector is a large component of the Upstate’s economy, accounting for one in five non-farm jobs, or 20% of total non-farm employment.
Source: CoStar, Colliers International
Annual Change in Industrial Employment by Month Greenville-Anderson-Mauldin, SC MSA
0
500
1,000
1,500
2,000
2,500
3,000
Jan-
11
Jun-
11
Nov-
11
Apr-
12
Sep-
12
Feb-
13
Jul-1
3
Dec-
13
May
-14
Oct-
14
Mar
-15
Aug-
15
Jan-
16
Num
ber o
f Ind
ustr
ial J
obs
Adde
d
Source: Bureau of Labor Statistics, St. Louis Federal Reserve, Colliers International
5 South Carolina Research & Forecast Report | Q1 2016 | Greenville Industrial | Colliers International
For more statewide commercial real estate news check out our market reports at: www.colliers.com/southcarolina/insights
PHASE 2: EXPANSION
PHASE 3: HYPERSUPPLY
PHASE 4: RECESSION
PHASE 1: RECOVERY
NEW CONSTRUCTION RENTAL RATE EMPLOYMENT OCCUPANCY
COMMERCIALREAL ESTATEGROWTH CYCLE
GREENVILLE/SPARTANBURG’S INDUSTRIAL MARKET is moving along in the expansion phase. Rental rates, occupancy and employment are all strong and continue to increase. New construction is gaining momentum with several build-to-suit and speculative buildings under construction. Current demand has the ability to support additional construction.
Commercial Real Estate Growth Cycle: Where the market stands and where it is going.
Market OutlookThe Greenville/Spartanburg industrial market is poised for continued success through the remainder of 2016. The market will continue to see significant demand for space and declining vacancy rates. However, activity will become constrained as new speculative developments are absorbed and options for quality space become limited. A need exists for additional construction, but land sites will become scarce as available, developable sites with infrastructure in place are built out. Additionally, many fear that there will be a void between available labor and demanded skills. Various counties have established workforce development programs to address the issue. Overall, the outlook is positive with the Upstate region continuing to compete with larger markets on a regional and global scale.
Around the StateA growing demand for industrial space throughout South Carolina is attributing to tightening markets and soaring rental rates, creating a need for additional industrial space.
Charleston, South Carolina > The Port of Charleston is driving much of the development activity and capital investments in Charleston.
> Mercedes-Benz Vans and Volvo Cars will have a beneficial impact on the market but are unrelated to current activity witnessed in the area.
> Speculative industrial buildings are preleasing successfully and exceeding expectations. Strong leasing and interest in the buildings will likely spur the next wave of construction sooner than anticipated. An approximately 351,000 square-foot speculative building at North Pointe Business Campus is among the recently completed projects.
> Sales activity is expected to pick up this year with out-of-market investors and occupiers showing interest in Charleston industrial real estate.
Columbia, South Carolina > The Columbia area is proving beneficial to local industrial users with many actively seeking space and relocating or expanding within the market.
> Sales activity is expected to be strong through the year while market conditions remain favorable and interest rates are low.
> Construction activity has been limited given the quality of the existing inventory in the market. Upon absorption of the existing space, speculative and build-to-suit construction will likely gain momentum.
> Bose vacated its former 470,000 square-foot, Class A manufacturing facility in Northeast Columbia late in 2015. The facility is located on 104 acres and is expandable to one million square feet.
Former Bose Manufacturing Facility | Columbia
North Pointe Business Campus | Charleston
66 South Carolina Research & Forecast Report | Q1 2016 | Greenville Industrial | Colliers International
Copyright © 2015 Colliers International.
The information contained herein has been obtained from sources deemed reliable. While every reasonable effort has been made to ensure its accuracy, we cannot guarantee it. No responsibility is assumed for any inaccuracies. Readers are encouraged to consult their professional advisors prior to acting on any of the material contained in this report.
502 offices in 67 countries on 6 continentsUnited States: 140 Canada: 31 Latin America: 24 Asia Pacific: 199 EMEA: 108
$2.3billion in annual revenue
1.7billion square feet under management
16,300professionals and staff
FOR MORE INFORMATION:Liz H. McCaryDirector of Marketing | South Carolina+1 803 401 [email protected]
Jessica D. Rahal, CPRCDirector of Research | South Carolina+1 803 401 [email protected]
GREENVILLE INDUSTRIAL PROFESSIONALS:Givens Stewart, SIOR | Principal +1 864 527 [email protected]
Garrett Scott | Brokerage Associate+1 864 527 [email protected]
Brockton Hall, MRED | Brokerage Associate+1 864 527 [email protected]
Richard Jackson | Brokerage Associate+1 864 527 [email protected]
Richard Barrett | Brokerage Associate+1 864 527 [email protected]
Colliers International | Greenville55 E. Camperdown Way, Suite 200Greenville, South Carolina | USA
+1 864 297 4950
About Colliers InternationalColliers International Group Inc. (NASDAQ: CIGI; TSX: CIG) is a global leader in commercial real estate services with more than 16,300 professionals operating from 502 offices in 67 countries. With an enterprising culture and significant insider ownership, Colliers professionals provide a full range of services to real estate occupiers, owners and investors worldwide. Services include brokerage, global corporate solutions, investment sales and capital markets, project management and workplace solutions, property and asset management, consulting, valuation and appraisal services, and customized research and thought leadership. Colliers International has been ranked among the top 100 outsourcing firms by the International Association of Outsourcing Professionals’ Global Outsourcing for 10 consecutive years, more than any other real estate services firm.
For the latest news from Colliers International, visit Colliers.com or follow us on Twitter (@ColliersIntl) and LinkedIn.
colliers.com