Embed Size (px)
Citation preview

http://www.tytlabs.com/review/© Toyota Central R&D Labs., Inc. 2016
Special Review
61R&D Review of Toyota CRDL, Vol.47 No.3 (2016) 61-97
1. Introduction
It almost goes without saying that continuous change occurs in every age. One example is the current business world, which has come to place great value on information. This world is experiencing a wave of change from the old model of manufacturing and selling products (monozukuri) to a new model that creates value for the customer through the provision of objects imbued with services (kotozukuri). The world of automotive technology is also on the verge of a major wave of change arising from the cutting edge development of artificial intelligence (AI) and AI-based autonomous driving systems, as well as from the processing of information obtained through observing and monitoring the driver’s condition based on driving operations with the aim of providing alerts or assistance to the driver. For powertrains, change is not an exceptional matter. The twentieth century was dominated by technology that transforms fossil fuel energy into mechanical driving power using an internal combustion engine. However, the end of the century saw the practical adoption of the hybrid vehicle (HV), which utilizes electrical energy to dramatically improve vehicle fuel economy. Now, in the twenty-first century, electrical technologies that drive vehicles by the power stored in batteries and fuel cell technology that converts hydrogen energy into electricity are seen by some people as the only possible solutions for global warming and other
environmental issues. Subsequently, many observers have started to predict the coming of an age when vehicles will be driven by the integration of electrical technologies with electronic technologies as media for information-gathering sensor systems.
Amid all these waves of change, the role of mechanical technologies might seem to have become relatively devalued or reduced, with mechanical components regarded as mere commodities. How should mechanical engineers confront these changes ? Although some of these changes are highlighted clearly by dramatic events, the turning points of others can only be revealed by looking back on history. In the world of mechanical engineering, the invention of new things is the result of the accumulation of steady efforts, not by sudden mutation or accident. The same is true for the development of new machines or mechanisms as well as for improvements based on steady analysis.
Rather than simply being swept along, one solution is to be the cause of the wave, ride at its head, and direct the changes that occur in its wake. Although this is something that is clearly easier to say than to put into practice, over the course of writing this paper, I realized that the history of Toyota Central R&D Labs., Inc. (TCRDL) is full of engineers and researchers who achieved just that through a passion to pioneer new concepts and technologies. This paper starts by describing a historical example of the passionate research and development carried out at TCRDL. Then, by introducing how this development formed
Transmission, Hydraulic System, Analysis, Control, Torque Converter, Tribology, Metal V-belt, Motor System
Transmission development encompasses the whole field of mechanical engineering and requires a wide range of basic technologies. Toyota Central R&D Labs., Inc. (TCRDL) has been engaged in the development of innovative technologies since its foundation and has built up a wide range of basic drivetrain technologies. This paper looks back over the history of this research at TCRDL to provide hints for the future development of mechanical engineering.
Report received on Aug. 29, 2016
Masataka Osawa
Research History of Drivetrain Technology at Toyota Central R&D Labs., Inc.
Review
http://www.tytlabs.com/review/
62
© Toyota Central R&D Labs., Inc. 2016
R&D Review of Toyota CRDL, Vol.47 No.3 (2016) 61-97
Furthermore, in the first half of the 1960s, the Society of Automotive Engineers of Japan (JSAE) gathered together more than 30 companies and research institutions and began cooperating on a joint research and study program.(5)
Before work started in Europe, Dr. Akira Kobayashi, the first president of TCRDL, conceived this transmission as a professor at Nagoya University,(2) and research began in earnest at the same time as the founding of TCRDL (autumn of 1960). From the standpoint of the timing of the joint research and study program mentioned above, this is a good example of research carried out ahead of the times.
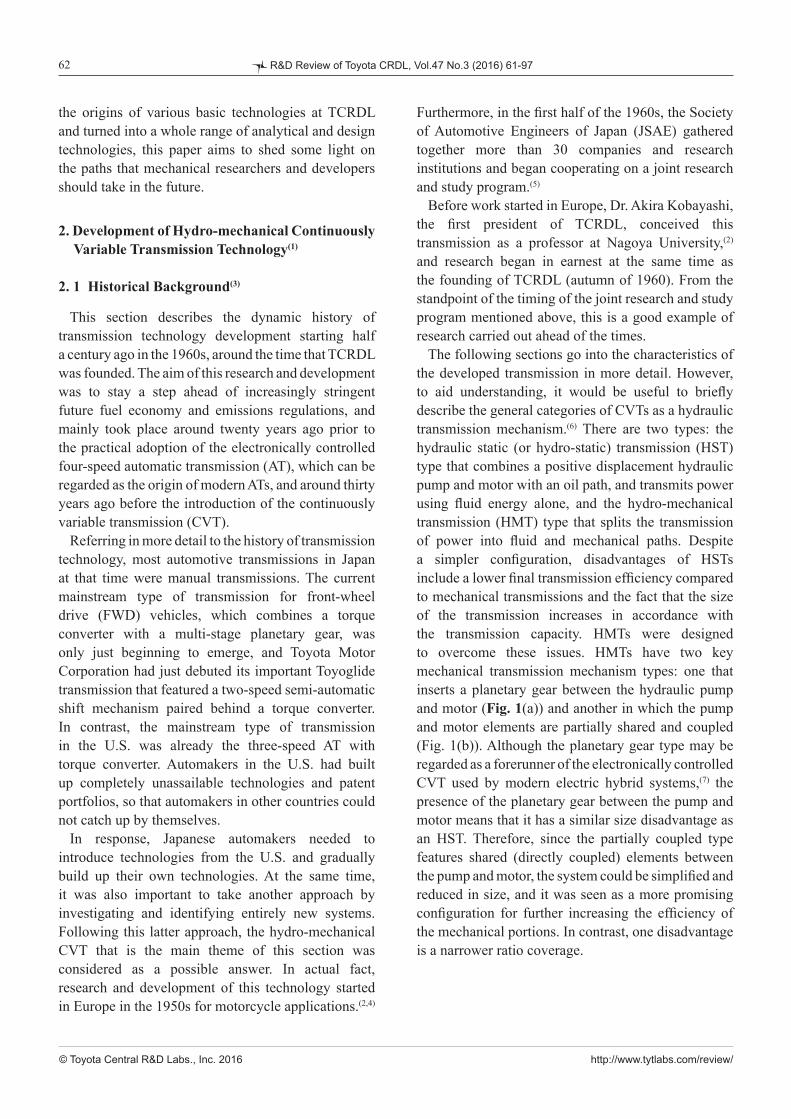
The following sections go into the characteristics of the developed transmission in more detail. However, to aid understanding, it would be useful to briefly describe the general categories of CVTs as a hydraulic transmission mechanism.(6) There are two types: the hydraulic static (or hydro-static) transmission (HST) type that combines a positive displacement hydraulic pump and motor with an oil path, and transmits power using fluid energy alone, and the hydro-mechanical transmission (HMT) type that splits the transmission of power into fluid and mechanical paths. Despite a simpler configuration, disadvantages of HSTs include a lower final transmission efficiency compared to mechanical transmissions and the fact that the size of the transmission increases in accordance with the transmission capacity. HMTs were designed to overcome these issues. HMTs have two key mechanical transmission mechanism types: one that inserts a planetary gear between the hydraulic pump and motor (Fig. 1(a)) and another in which the pump and motor elements are partially shared and coupled (Fig. 1(b)). Although the planetary gear type may be regarded as a forerunner of the electronically controlled CVT used by modern electric hybrid systems,(7) the presence of the planetary gear between the pump and motor means that it has a similar size disadvantage as an HST. Therefore, since the partially coupled type features shared (directly coupled) elements between the pump and motor, the system could be simplified and reduced in size, and it was seen as a more promising configuration for further increasing the efficiency of the mechanical portions. In contrast, one disadvantage is a narrower ratio coverage.
the origins of various basic technologies at TCRDL and turned into a whole range of analytical and design technologies, this paper aims to shed some light on the paths that mechanical researchers and developers should take in the future.
2. Development of Hydro-mechanical ContinuouslyVariable Transmission Technology(1)
2. 1 Historical Background(3)
This section describes the dynamic history of transmission technology development starting half a century ago in the 1960s, around the time that TCRDL was founded. The aim of this research and development was to stay a step ahead of increasingly stringent future fuel economy and emissions regulations, and mainly took place around twenty years ago prior to the practical adoption of the electronically controlled four-speed automatic transmission (AT), which can be regarded as the origin of modern ATs, and around thirty years ago before the introduction of the continuously variable transmission (CVT).
Referring in more detail to the history of transmission technology, most automotive transmissions in Japan at that time were manual transmissions. The current mainstream type of transmission for front-wheel drive (FWD) vehicles, which combines a torque converter with a multi-stage planetary gear, was only just beginning to emerge, and Toyota Motor Corporation had just debuted its important Toyoglide transmission that featured a two-speed semi-automatic shift mechanism paired behind a torque converter. In contrast, the mainstream type of transmission in the U.S. was already the three-speed AT with torque converter. Automakers in the U.S. had built up completely unassailable technologies and patent portfolios, so that automakers in other countries could not catch up by themselves.
In response, Japanese automakers needed to introduce technologies from the U.S. and gradually build up their own technologies. At the same time, it was also important to take another approach by investigating and identifying entirely new systems. Following this latter approach, the hydro-mechanical CVT that is the main theme of this section was considered as a possible answer. In actual fact, research and development of this technology started in Europe in the 1950s for motorcycle applications.(2,4)

http://www.tytlabs.com/review/
63
© Toyota Central R&D Labs., Inc. 2016
R&D Review of Toyota CRDL, Vol.47 No.3 (2016) 61-97
1) A continuously variable variator with two-mode shift mechanics driven by a hydraulic switching device2) An automatic control system using hydraulic circuits
(1) Continuously variable variatorFigure 3 shows the details of the key variator
mechanism of the transmission. To overcome the issue of narrower ratio coverage, this mechanism features clutches F1 and F2 that switch between two modes: underdrive mode (F1 on, F2 off) and overdrive mode (F1 off, F2 on). These are engagement-type clutches (i.e., dog clutches) and there is no synchromesh
2. 2 System Characteristics
Figure 2 shows an overall view of the developed transmission. This transmission was designed with the torque capacity to be paired with a contemporary 2000 cc class engine. The total length of the transmission is 945 mm, which is much longer than a modern transmission. This drawing is a rare case of an original transmission designed by TCRDL and it includes the following two innovative ideas for a transmission system.
Fig. 1 Hydro-mechanical transmission mechanisms.
(a) Planetary gear type
Sun
Planet
Ring
Engine
Input shaft
Pump MotorOutput shaftγ 2
γ 1
Ring
Planet
Sunn1, T1
n, T
nr, Tr
np, Tp ns, Ts n2, T2
n', T'
Engine
Input shaft
Pump MotorOutput shaftγ 2
γ 1
n1, T1
n2, T5
n1, T3n2, T4 n2, T2
Pump Motor
Fig. 2 Developed hydro-mechanical CVT.
945
Input shaft speed governor
Auxiliary pump
Control motor portion
Input pump portion
Output shaft speed governor
Reverse gear portion
Mode switching clutch portion
Free joint
Shift control portion
(b) Partially coupled type

http://www.tytlabs.com/review/
64
© Toyota Central R&D Labs., Inc. 2016
R&D Review of Toyota CRDL, Vol.47 No.3 (2016) 61-97
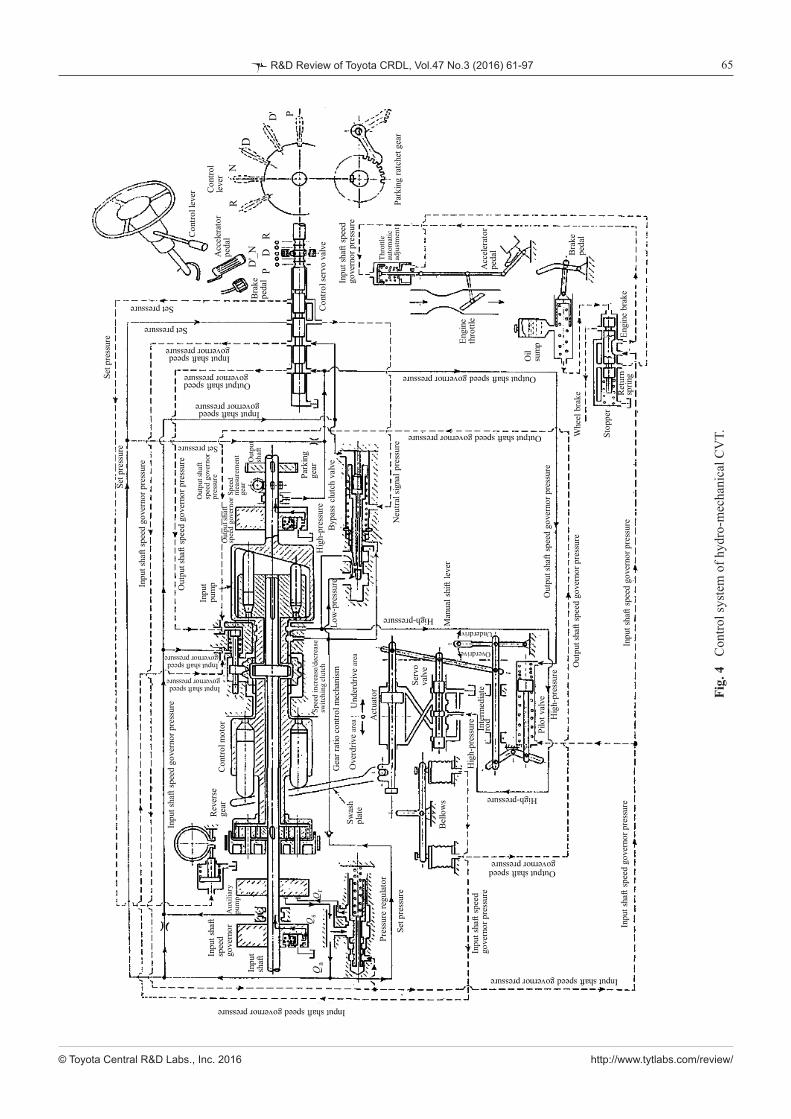
allow the driver to make shifting operations as well. Mode switching was carried out at a gear ratio of 1. The control mechanism for this function utilized the operation of the swash plate actuator piston and was implemented automatically using the discharge and suction pressure of the bellows attached to the seesaw-shaped link.
The engine throttle was connected to both the accelerator pedal and an automatic mechanism for controlling fuel-efficient driving. This mechanism used the input shaft governor pressure to apply a differential operation to the throttle with respect to the accelerator input of the driver. In the same way as a modern electronically controlled throttle, this control coordinated the gear ratio and throttle, allowing the engine to run closer to the optimum fuel economy operation line. The circuit was also provided with a shifting function on the deceleration side via the engine brake switching valve during engine braking. In addition, to allow the engine to idle and the vehicle to move off more smoothly, the end of the spool was provided with a pointed bypass clutch valve. Through this valve, the pressure of the input pump (i.e., the high-pressure line) could interrupt the low-pressure line, thereby creating an intermediate pressure and a partial clutch engagement state.
Figure 5 shows the engine operating lines achieved by this control system. Unavoidably, the deviation between the optimum operating lines is much larger than that achievable through today’s control technology. However, this simple hydraulic circuit was capable of achieving a wide range of performance aspects and functions. The system itself clearly anticipates developments twenty years later. Although heavily reliant on the dedication and technical resources of the designers and planners,(8) the influence of the challenging spirit of TCRDL even in the first years after its foundation is clear.
The developed transmission was evaluated in test drives on public roads. Although obviously still a prototype transmission in terms of the degree of automation provided by the ratio coverage and automatic shift mechanism, it is no exaggeration to say that the specifications of the transmission were at the cutting edge of the field both inside and outside Japan. However, development of the transmission still required much hard work. Great pains were required up to the end of the development period to optimize the particular noises generated by the hydraulic pump
mechanism. In underdrive mode, the input pump is driven by the power source and the reaction torque is transmitted directly to the output shaft via the pump casing. In addition, the hydraulic fluid discharged from the pump is used to drive the control motor, which drives the output shaft via clutch F1 (output split type). In overdrive mode, the roles of the pump and motor are reversed. The control motor is driven and discharges hydraulic fluid, which is used to drive the input pump and transmit power to the output shaft. In addition, power is applied directly from the power source via the input pump (input split type). The aim of switching the transmission path in this way is to achieve a wide ratio coverage of 6 along with a high transmission efficiency.
(2) Automatic shift control systemSince operation of this transmission by the driver
would require a certain amount of ability above that required for a manual transmission, it was necessary to develop an automatic control mechanism. Today’s engineers would naturally make appropriate use of micro-computer technology to devise an integrated control incorporating the control of the gear ratio, the mode switching, as well as the engine throttle so that the engine operating region is kept within the optimum fuel economy area. However, at the time, it was difficult to consider even the adoption of analog computers in vehicles. Therefore, a control system utilizing the hydraulic circuit shown in Fig. 4 was designed.
The gear ratio (i.e., the angle of the control motor swash plate) was controlled using the pilot valve based on the governor pressure of the input and output shafts (i.e., the rotation speed). At the same time, the servo valve was operated using the valve position as the command value, thereby controlling the displacement and angular stability of the swash plate actuator piston. In addition, the link mechanism was used to
Fig. 3 Two mode hydro-mechanical variator.
Input shaft
Control motor
Clutch
Output shaft casing
Input pump
Output shaft
Actuator
x
F2 F1
http://www.tytlabs.com/review/
65
© Toyota Central R&D Labs., Inc. 2016
R&D Review of Toyota CRDL, Vol.47 No.3 (2016) 61-97
Fig.
4
Con
trol s
yste
m o
f hyd
ro-m
echa
nica
l CV
T.
Qa
Qs
Qr
PD
RD
'_N
RN
D
D' P
Serv
o va
lve
Set p
ress
ure
Input shaft speed governor pressure
Out
put s
haft
spee
d go
vern
or p
ress
ure
Inpu
t sh
aftIn
put s
haft
spee
d go
vern
orA
uxili
ary
pum
p
Rev
erse
ge
arC
ontro
l mot
or
Inpu
t pu
mp
Out
put s
haft
spee
d go
vern
orSp
eed
mea
sure
men
tge
arO
utpu
t sh
aft
Park
ing
gear
Byp
ass
clut
ch v
alve
Hig
h-pr
essu
reLo
w-p
ress
ure
Spee
d in
crea
se/d
ecre
ase
switc
hing
clut
ch
Gea
r rat
io c
ontro
l mec
hani
sm
Und
erdr
ive
area
Act
uato
r
Ove
rdriv
ear
eaSw
ash
plat
e
Pres
sure
regu
lato
r
Bel
low
s
Pilo
t val
ve
Inte
rmed
iate
ro
d
Overdrive
Underdrive
Man
ual s
hift
leve
r
Engi
ne b
rake
Neu
tral s
igna
l pre
ssur
e
Whe
el b
rake
Stop
per
Ret
urn
sprin
g
Thro
ttle
auto
mat
ic
adju
stm
ent
Oil
sum
pEngi
ne
thro
ttle
Bra
ke
peda
l
Acc
eler
ator
pe
dal
Park
ing
ratc
het g
ear
Con
trol s
ervo
val
ve
Con
trol
leve
r
Set p
ress
ure
Set pressure
Set pressure
Set pressure
Inpu
t sha
ft sp
eed
gove
rnor
pre
ssur
e
Inpu
t sha
ft sp
eed
gove
rnor
pre
ssur
e
Input shaft speed governor pressure
Output shaft speedgovernor pressure
Input shaft speed governor pressure
Input shaft speed governor pressure
Input shaft speed governor pressure
Inpu
t sha
ft sp
eed
gove
rnor
pre
ssur
e
Out
put s
haft
spee
d go
vern
or
pres
sure
High-pressure
Input shaft speed governor pressure
Output shaft speed governor pressure
High-pressure
Hig
h-pr
essu
re
Hig
h-pr
essu
re
Set p
ress
ure
Inpu
t sha
ft sp
eed
gove
rnor
pre
ssur
e
Inpu
t sha
ft sp
eed
gove
rnor
pre
ssur
e
Out
put s
haft
spee
d go
vern
or p
ress
ure
Output shaft speed governor pressure
Output shaft speed governor pressure
Inpu
t sha
ft sp
eed
gove
rnor
pre
ssur
e
Con
trol l
ever
Out
put s
haft
spee
d go
vern
or p
ress
ure
Acc
eler
ator
pe
dal Bra
ke
peda
l

http://www.tytlabs.com/review/
66
© Toyota Central R&D Labs., Inc. 2016
R&D Review of Toyota CRDL, Vol.47 No.3 (2016) 61-97
2. 3 After the Initial Challenge
Subsequently, what happened to this research? After a waiting period of ten to twenty years, the genes that had been nurtured through the development of transmission systems became fertile soil for supporting basic technological development in the drivetrain field throughout the Toyota group, both publically and privately. These genes gave rise to various basic technologies, as summarized in Fig. 6.
The first fruit was the application of this research to technologies for analyzing the dynamic characteristics of hydraulic systems, which are the backbone of transmission control systems. This led to the development of technologies for analyzing and designing torque converters, which are the most suitable type of fluid transmission devices. Furthermore, the transmission control technology led to proposals for improving the transmission efficiency and driveability of multi-stage ATs while adopting newer control theories in accordance with the progress of micro-computer technology.
Once research and development into multi-stage ATs was underway, these efforts triggered research into wet clutches by tribology researchers, such as friction evaluation methods and modeling, and analysis of the behavior of additives. This led to the development of traction drive mechanisms and fluid mechanism analysis.
Despite various ups and downs, the development of CVT technology, which was the origin of power transmission research at TCRDL, resulted in the development of analysis technology for belt-driven CVTs, which made an important contribution to commercializing and enhancing the performance of CVTs in the Toyota group. Although still at a nascent stage, the most recent stream of research is the fusion of this technology with electrification.
Gear technology is another important subject for power transmission. TCRDL began from the development of vibration analysis and mechanism analysis technologies, and has continued to construct and develop technologies to analyze the three key elements of power transmission: efficiency, strength, and noise and vibration (NV). Since these developments are some of the most significant aspects of mechanical engineering, Fig. 6 only describes a range of typical reference materials and does not include any detailed descriptions. The history of this development will
and motor, as well as to enable high-speed rotation up to the same speed as the engine.*
After almost ten years of research and development at TCRDL, development was continued by one of the members of the Toyota group as a CVT for commercial vehicles. Unfortunately, the development finally ended without the creation of a practical transmission. One reason was the inability to resolve the issues described above. As mainstream transmission technology around the world trended toward a standard configuration consisting of a multi-stage AT with planetary gears and a torque converter to help the vehicle move off smoothly, there was no place to reflect the series of technologies developed for hydro-mechanical CVTs. As a result, the details of these technologies are still not widely known and the technological development of transmissions at TCRDL was shelved for the time being.
Fig. 5 Engine operating range.
70
60
50
40
30
20
10
0 1000 2000 3000 4000 5000
4/8
5/8
5/8100 km/h
60 km/h
1/8
0% gradient
5% gradient
10% gradient
Engine speed [rpm]
Engi
ne p
ower
[PS]
* In fact, these disadvantages of hydraulics (i.e., high-speed rotation and low-noise operation) have yet to be completely resolved even today. Modern hydraulic CVTs are only used in certain applications, mainly high-capacity wind power generators,(9) industrial vehicles, and small service vehicles.

http://www.tytlabs.com/review/
67
© Toyota Central R&D Labs., Inc. 2016
R&D Review of Toyota CRDL, Vol.47 No.3 (2016) 61-97
field, the analytical technologies that were developed covered the design of optimum cam profiles (Fig. 7) and devices to reduce pulsation through the analysis of pulsation in power steering vane pumps,(12) the analysis
appear in another issue of this journal.The following sections will describe some of the
basic drivetrain technologies in more detail.
3. Hydraulic System Technologies
Past issues of transmission development included NV generated by pumps and hydraulic control valves. These issues became common themes in fields such as power steering, hydraulic brakes, and fuel injection valves, which all developed as automotive actuator technology spread. This gave TCRDL the opportunity to apply the hydraulic technology nurtured through the development of transmissions to the resolution of these common issues. Consequently, work began into the development of test, measurement, and simulation technology for analyzing the dynamic characteristics of hydraulic systems.(10,11) In addition to the drivetrain
Fig. 6 History of research into basic drivetrain-related technologies.
1960 1970 1980 1990 2000 2010
Development of hydro-mechanical CVT
Analysis of torque converter flows
Analysis of transmission hydraulic system characteristics
Analysis of internal flows in hydraulic devices
Analysis of clutch friction characteristics
Analysis of traction characteristics
Engine controls
Multi-stage AT controls/ automatic control system calibration
Original belt development
Analysis of steel belts
Powertrain controls
Development of mechanisms fusing mechanical and electrical elements
Industrial vehicle powertrain controls
Static analysis of gear tooth engagement
Unified theory of tooth profiles
Analysis of vibration, mechanism analysis technologies
Dynamic analysis of gear tooth engagement(69-71) (72-73)
(74-77)
Development of basic technologies
Hydraulic system technologies(analysis of dynamic characteristics)
Fig. 7 Low-pulsation vane pump cam profile.
(a) Example of actual application (b) Expanded view of pump
Low-pulsationprofile
0 180Rotation angle [deg]
Rad
ius
Vane
Discharge portSuction port
Rotor
Cam ring
Rotor
VaneCam ring

http://www.tytlabs.com/review/
68
© Toyota Central R&D Labs., Inc. 2016
R&D Review of Toyota CRDL, Vol.47 No.3 (2016) 61-97
of self-excited vibration generated by various types of hydraulic systems,(13,14) and the improvement of diesel fuel injection system precision.(15) These all made a major contribution to a wide range of developments across the Toyota group.
Hydraulic technology spread to the development of hydraulic-based fluid analysis technologies to measure, analyze, and perform calculations for the torque converters that were gradually being refined as devices to help vehicles move off more smoothly. These efforts contributed to the advent of high-performance torque converters. Development of this technology continues to expand into three-dimensional analysis of the flows inside hydraulic valves.
3. 1 Analysis of Drivetrain Hydraulic Systems
The analysis of drivetrain hydraulic systems at TCRDL began in the 1980s with initiatives to analyze tube vibration induced by the hydraulic systems of manual transmission clutches.(16,17) Figure 8 shows a manual transmission clutch system. Engine flywheel vibration is transferred to the release cylinder via the release bearing and fork. Vibration also passes through the tubing, which excites the oil pressure in the master cylinder, thereby vibrating the clutch and dashboard and causing noise in the occupant compartment.
The pressure propagation of the tubing system, which is the main vibration transfer path, can be analyzed using either the impedance method for steady-state vibration characteristics or the method of characteristics for the time series response. The former method was adopted as the most appropriate way of evaluating vibration transfer characteristics. (Incidentally, the latter method is more suitable for the analysis of transient phenomena, such as studies
of the effects on valve opening and closing.(15)) Figure 9 shows the tube system analysis model. The model simulates five elements comprising each part of the tube system. Figure 10 shows a comparison of the calculated and actual transfer characteristics determined in experiments. Although the results match closely, the physical constants of the simulation were adjusted within an appropriate range to reproduce the phenomenon and ensure the matching of the results. Therefore, research focused on identifying the sensitivity between the component element specifications and vibration frequency characteristics, as well as methods to improve this sensitivity, as a way of utilizing the simulation. In addition, modeling needed to be performed by experienced analysts, and it was also necessary to obtain data about the pressure and displacement of each component to reproduce and verify the phenomena. For these reasons, measurement technologies were developed in parallel with this analysis method.
Subsequently, the analysis of hydraulic systems was expanded into behavior analysis of check balls for oil pressure discharge inside wet clutch pistons, analysis
Fig. 9 Scheme of clutch hydraulic system.
R/CSteel tube Flexible tube Steel
tube AccumulatorSteel tube
M/C
P1Q1
P2Q2
P3Q3
P4Q4
P5Q5
PRQR
PMQM
Engine
Flywheel
Clutch discClutch cover
Release bearing
Fork
Release cylinder (R/C)
Flexible tube Steel tube
Master cylinder (M/C)
Pedal bracket
Rubber damper
Dashboard
Clutch pedal
Fig. 8 Schematic drawing of clutch system. Fig. 10 Comparison between simulation and experiments.
Frequency [Hz]
PM/P
R[d
B]
Calculations
Experiments
Without accumulator
With accumulator (position A)
−30
−20
−10
0
10
20
0 100 200 300 400 500

http://www.tytlabs.com/review/
69
© Toyota Central R&D Labs., Inc. 2016
R&D Review of Toyota CRDL, Vol.47 No.3 (2016) 61-97
of the stability of regulator valves and linear solenoid valves, and the analysis of coupled vibration of shift control valves that contain complex combinations of hydraulic elements.(18,19)
Figure 11 shows an example of a system used to analyze coupled vibration.(19) Linear solenoid valves are devices that can accomplish fine and highly responsive hydraulic controls. However, since these solenoids are used to control both flow rates and pressure, solenoid systems are vulnerable to coupled vibration with hydraulic valves. In particular, if the valve specifications are designed to enhance controllability by increasing valve sensitivity and restricting oil pressure leakage, the rigidity of the whole hydraulic circuit increases, leading to more noticeable vibration. Research was carried out to experimentally and theoretically derive the conventional adjustment constants used to calculate and reproduce the vibration (such as the flow coefficient and entrained air volume of the valves, the bulk modulus, and the friction coefficient and viscous resistance of the spool valves), and to devise a general purpose simulation method capable of reproducing phenomena with as little adjustment as possible. As an example, Fig. 12 shows the test device used to measure the flow coefficient of a spool valve, as well as the results. Figure 13 shows an example of how the simulation was used for parameter optimization by applying quality engineering methods to suppress vibration. This research is a good example of the importance of the steady accumulation of data.
Subsequently, hydraulic system analysis was combined with flow analysis (see next section) via the analysis of pressure fields of internal gear pumps,
Fig. 11 Hydraulic control system of multi-stage AT.
Regulatingvalve
Solenoid valve 1
Pressure reduction valve
Control valve
Accumulator
Shift clutch
Line pressure
Solenoid valve 2
Fig. 12 Example of flow coefficient measurement.
Reynolds number (Re)10 102 103
0.1
1.0
Notch portion
Notch portion
Step portion
Taper portion
Flow
coe
ffici
ent (
Cd
)
(b) Test device
(a) Flow coefficients of various ports
Pres
sure
[Mpa
]
1.2
1.0
0.8
0.6
0.4
0.2
0.00.0 1.0 2.0
Time [sec]
Shift Start
Accel OnControl pressure
Clutch pressure
Shift start
Fig. 13 Experimental results of optimizing.
1.2
1.0
0.8
0.6
0.4
0.2
0.0
Pres
sure
[Mpa
]
0.0 1.0 2.0
Time [sec]
Accel OnControl pressure
Clutch pressure
Shift start
(a) Before optimizing
(b) After optimizing

http://www.tytlabs.com/review/
70
© Toyota Central R&D Labs., Inc. 2016
R&D Review of Toyota CRDL, Vol.47 No.3 (2016) 61-97
parts.(25-27) Figure 15 shows a device that can observe the flow paths between blades in the radial direction from the center of the shaft. This device visualizes flows between blades using laser sheet lighting and acrylic stator blades (Fig. 16) and measures flow velocities by laser Doppler velocimetry (LDV). As a result, the effects of flow separation from the stator blades on the rate of flow circulation, and the volumetric coefficient characteristics were identified. In addition, by adopting acyclic on the pump shell side and adding an image derotator, this device was able
resulting in initiatives to achieve 3D analysis of flows around spools inside valves, numerical analysis of acting forces, and the analysis of flows inside fluid machines.(20,21)
3. 2 Analysis of Torque Converter Flows
A torque converter consists of a pump, turbine, and stator. It is a mechanism that transmits force from the pump to the turbine through a closed circulation system called a torus. Until the 1960s, this mechanism was called the main transmission and the planetary gear was called the sub transmission. This was derived from the fact that the torque amplification action of the stator was utilized as a reduction gear to ensure a wide speed ratio. However, after the 1960s, as planetary gear transmissions evolved into three and four-speed transmissions, the role of the torque converter began to gradually change to emphasize performance when the vehicle moves off, smoother shifts, and highly efficient power transmission. As FWD vehicles became more widespread, it was necessary to shorten the length of the shaft and change the shape of the torus from round to flatter designs requiring large curvature changes.
To maintain basic performance while responding to this evolution in the role and design of torque converters, it was necessary to understand the phenomena occurring inside the torus and to develop more precise design tools. Therefore, TCRDL began the detailed analysis of flows inside torque converters from the first half of the 1980s. Analysis of the complex blade configuration and rotating closed flow fields inside torque converters required creativity and innovation. TCRDL started by performing experiments to measure the stator inlet and inflow angle using a specially designed X-type hot film anemometer(22) before moving on to flow visualization using the stator blade surface pressure distribution and 2D blade modeling by means of an original ultra-compact semiconductor pressure sensor,(23) and measurement of the pressure distribution inside the turbine flow paths.24) As an example, Fig. 14 shows the system used to measure the pressure inside the turbine flow paths using the semiconductor pressure sensor. This method succeeded in clarifying the flow turbulence between the turbine blades.
Since then, measurement and analysis technology has evolved into dedicated visualization devices capable of faithfully reproducing flow fields in actual Fig. 14 Pressure measurement of turbine flow path.
Epoxy resin Adhesive silicon SUS pipe
Silicon block Pressure transducerϕ1
.25
Shell
Sensor
Turbine
Core
(a) Cross-sectional view of pressure sensor tip
(b) Pressure sensor
(c) Pressure sensor fixing method
(d) Pressure sensor after attachment

http://www.tytlabs.com/review/
71
© Toyota Central R&D Labs., Inc. 2016
R&D Review of Toyota CRDL, Vol.47 No.3 (2016) 61-97
to visualize the whole of the pump and obtain large amounts of useful data by measuring and visualizing the flow fields.
The development of numerical analysis technology was carried out in parallel with the development of measurement technology. The computational fluid dynamics (CFD) research team developed 3D flow analysis technology using large-scale numerical computation(28,29) from the calculation of drag around vehicle bodies. The application of original turbulence models developed through joint projects with universities enabled the development of a highly precise simulation method. Figure 17 shows an example of calculations performed for torus flows. This technology identified large amounts of information that could not be obtained by non-3D calculation methods, such as the effects of secondary flows on flow paths, and the velocity distribution between the shell and core. A difference of less than 5% was also confirmed between simulation results and experiments.
In addition, since the stator blade design affects the characteristics of the torque converter, research was also carried out using the boundary element method to calculate complex flow fields with a relatively low computational load.(30) This method was combined with an inverse problem solution method to enable the optimum design of blade surface shapes that suppress flow separation from the blade surface.(31) Figure 18 shows the results of this research. The designed blade
Fig. 15 Visualized torque converter for measurement of stator flow.
Core-side section
Input (pump) shaft
Output (turbine) shaft
Stator
TurbinePump
Window
Observation direction
Mirror
Mean sectionShell-side section
Fig. 16 Stator blade visualization method and images.
Mean sectionShell-side section Core-side section
Mirrorinside blade
Originalmetallic blade
Acrylic blade
Laser light sheet
Core-ring
Shell-side section Mean section Core-side section
Thick blade e = 0.2
(a) Laser sheer lighting method
(b) Stator blade with mirror
(c) Photographs using laser sheet lighting methodFig. 17 Internal flows of three component blades
of torque converter.
Turbine Pump
Stator

http://www.tytlabs.com/review/
72
© Toyota Central R&D Labs., Inc. 2016
R&D Review of Toyota CRDL, Vol.47 No.3 (2016) 61-97
multi-stage ATs. Joint projects with members of the Toyota group aimed to develop controls and estimation technologies related to fuel economy and driveability. In addition, TCRDL also took on the challenges of control constant calibration and modeling, which were some of the fundamental issues of control system design. The following sections describe how these issues were overcome in actual development as well as some research initiatives that address hot topics of the current day.
4. 1 Improvement of Fuel Economy and Driveability
Slip control of the lockup clutch inside torque converters is an important technology for reducing NV generated by slight clutch slippage in low engine speed regions, as well as for improving fuel economy by minimizing power transmission losses.(33) Although various automakers developed lockup clutch slip controls in the second half of the 1980s, issues remained such as preventing frictional vibration (shudder) of the clutch and improving controllability. TCRDL worked with Toyota Motor Corporation to develop friction materials with excellent anti-shudder and durability characteristics, enhance the performance of hydraulic fluid, and develop systems that achieved precise control of fastening forces using proportional valves in hydraulic control systems. TCDRL participated in both the control and tribology aspects of these projects.
Figure 19 shows the outline of a lockup clutch slip control system.(34) Issues included ensuring slip speed control accuracy to achieve the desired fuel economy effect, covering a wide operation range, and achieving sufficient robustness and stability with respect to changes in friction characteristics over time and fluctuations in load. The control method that was introduced was H∞ control, which has just been proposed as a latest robust control theory. Details of the design process and control effects are described in the original papers and are omitted here. The following description focuses on two critical issues that were faced during development.(35)
The first issue was the control model creation procedure. Changes in the intrinsic nonlinear characteristics of the hydraulic system, particularly changes in the sliding resistance acting on the control valve spool due to the operational conditions have complicated model creation and the verification of the designed control constants. As an example, Fig. 20
achieves a flow velocity that does not slow down over a wide area of the blade surface, while prioritizing the optimum stator flow discharge angle, which is an important performance aspect in torque converter design.
TCRDL was actively engaged in complex research in both the experimental and computational fields. However, after meeting the limits of technology in certain areas, research into torque converters was brought to an end in around 2005.
4. Control Technologies
Automotive electronic controls using micro-computers began with engine controls and spread to transmissions, suspension systems, and dynamic vehicle controls. More recent developments include dramatic advances in automatic braking and other driver support functions. Research by TCRDL was initiated in the 1980s with the progress of onboard micro-computers, beginning with the application of advanced control theories assuming that rapidly developing micro-computing capabilities would resolve contemporary restrictions related to computation and implementation. This was before the spread of modern control design and simulation tools such as MATLAB, and a major issue of the day was verifying the effectiveness of the theories themselves.(32) In the powertrain field, research was originally mainly focused on gasoline engines, including idling engine speed control, air-fuel (A/F) ratio control, and electronic governor controls for industrial vehicles. However, in the 1990s, as cooperation between TCRDL and the Toyota group deepened due to the research in hydraulic systems and torque converters, research efforts also spread to
Fig. 18 Optimization of stator blade geometry using inverse solution method.
(a) Initial blade (b) Designed blade

http://www.tytlabs.com/review/
73
© Toyota Central R&D Labs., Inc. 2016
R&D Review of Toyota CRDL, Vol.47 No.3 (2016) 61-97
Contemporary 8-bit CPUs were restricted in terms of the capacity of the variable areas. Therefore, desktop analysis and simulations were carried out to minimize the length of internal computational variables. These efforts reduced the computational load, which helped to prevent calculations ending during the computational cycle and avoided interference with other control functions (Fig. 21). This issue might no longer seem relevant since modern CPUs are powerful enough to avoid concerns about finite variable lengths. However, the key point of creating systems that are as lean as possible should never be forgotten.
In addition to these precise mechanical controls, other electronic controls for multi-stage ATs grew in
shows the differences between actual and simulated waveforms of slip speed with respect to a stepped input. The solution involved carrying out identification using the frequency range and input amplitude range assumed by the control, and assuring the characteristics outside those ranges by robust design methods. In addition, due to the large amount of time required for control system design by this type of control model identification, an online design method was proposed using linear parameter-varying (LPV) modeling as an improved design method capable of utilizing future design resources.(36)
The second issue was ensuring the implementation accuracy of the control computational logic.
Fig. 19 Lockup clutch slip control system.
Robustness requiredOil temperature changes, nonlinear characteristics
Load fluctuations
Engine
Enginespeed
Lock-upclutch
Turbinespeed
Poff Pon
Lock-up controlvalve
LinearSolenoidvalve
Real slipspeedcalculation
Target slipspeedcalculation
Feedbackcontroller
Vehicle speedthrottle openingATF temp.
Initial set value
Torque converter
ECULock-up hydraulic control circuit
Changes in friction characteristics
Wide operation range
Fig. 20 Issues of modeling.
No match
Unmodeleddynamics exists.
Light load (throttle 5%)
Simulation Actual data
Actual dataSimulation
Heavy load (throttle 15%)
No time to create a precise model
↓Carry out by identification !
0
100
200
300
0
100
200
300
−5
0
5
0 2 4 6 8 10
Slip Speed[rpm]
Input duty [%]
Slip Speed[rpm]
Time [sec]
Subtracting the mean value of u

http://www.tytlabs.com/review/
74
© Toyota Central R&D Labs., Inc. 2016
R&D Review of Toyota CRDL, Vol.47 No.3 (2016) 61-97
that uses these feature variables to perform learning. Incidentally, the feature variable extraction process might not be required if enhanced learning technology is applied using the type of 3rd generation artificial intelligence (AI) that is currently under the spotlight. However, conversely, this creates a dilemma whereby the use of 3rd generation AI would obscure what features are used for the system judgments, which might have the effect of stopping development in this field.
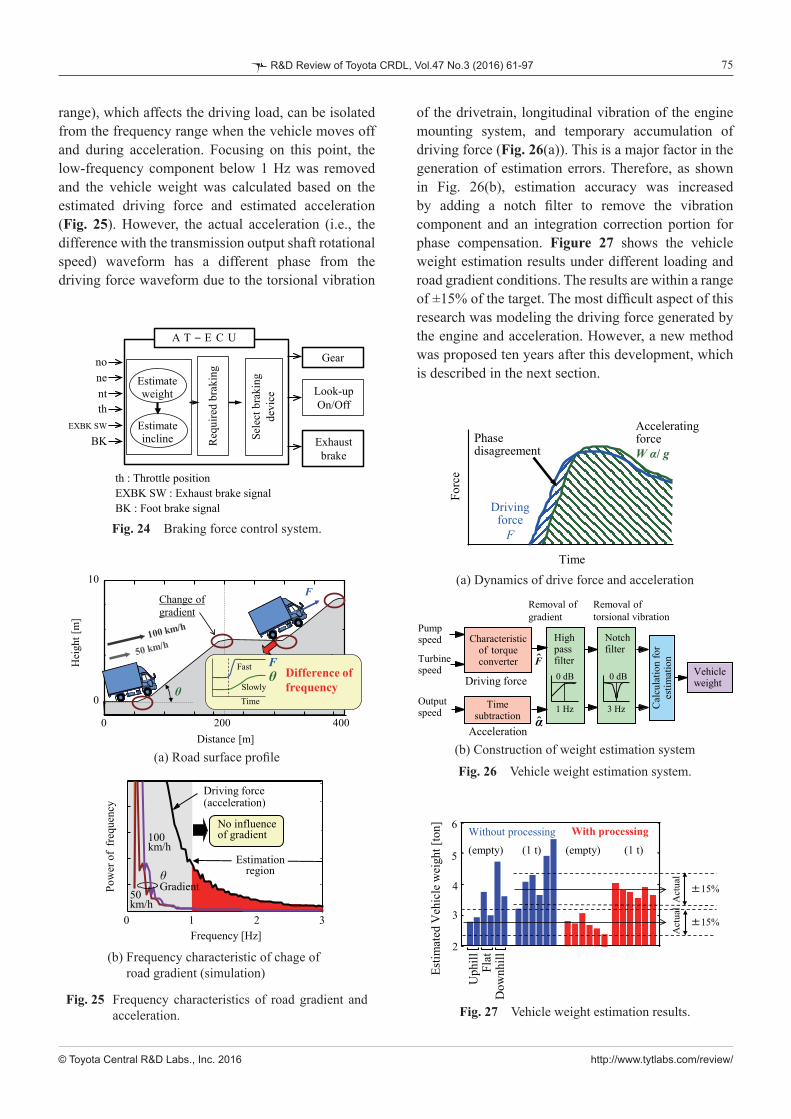
Estimation of driving environment awareness may not be required if the system can cooperate with the navigation system or use more accurate intelligent transportation system (ITS) technology. However, since not every vehicle can interact with information devices, it is important to enable estimation using onboard sensor data. One example is the contribution of driving environment estimation to a control system that plays a key role in preventing busy shifting on hilly roads and engine braking (Fig. 24).(39,40) This system estimates the gradient of the hill and controls the changes in shift speeds and the exhaust brake. However, the laden weight of commercial vehicles changes depending on the trip, which creates large rates of change depending on the weight of the vehicle. Therefore, since vehicle weight affects the estimated gradient value, a weight estimation system was required.
The key point of the estimation method is the fact that the change in the road gradient (i.e., the frequency
importance in the 1990s. One example is controls that allows the driver to select the desired shift speed, as a way of increasing the affinity between the driver and the vehicle. In response to this demand, TCRDL created a joint control and information processing team that helped to develop a practical method of estimating driver intention and the driving environment as information for shift speed selection.(37,38) The key was extracting the characteristic amounts to be used for the estimation. In addition to conventional statistical data processing, this research also referenced the type of wavelet analysis results shown in Fig. 22. This figure indicates the differences in power levels around 1 Hz and under 0.3 Hz at the accelerator application points highlighted by the arrows for two sporty and fuel efficient driving patterns. These results gave important pointers for extracting the AC and DC signals of accelerator operations, and were used to obtain feature variables for estimation.
Estimation of driver intention and the driving environment is performed using the feature variables and process flows shown in Fig. 23. At the core of the estimation system is a three-layer neural network
Fig. 21 Assured performance by ensuring computational accuracy.
Fig. 22 Wavelet transform of throttle. Fig. 23 Construction of estimation system.
80
60
40
20
04 8 12 160
Time [sec]
Slip
spee
d [r
pm] Sufficient accuracy
Insufficient accuracyFloating point calculation
Target value
Experimental dataDrivingintention
Roadenvironment
∙ Wavelet transform analysis
∙ Statistical processing analysis
Statistical processing analysis
Extraction of feature variables
Construction of neural network estimation
Operational feature variables Statistical feature variables∙ Rate of throttle opening on
stepping on accelerator∙ Vehicle acceleration in
braking operationStatistical feature variables∙ Maximum of throttle opening∙ Maximum of engine speed∙ Maximum of positive vehicle
acceleration∙ Maximum of negative vehicle
acceleration
∙ Mean of vehicle speed∙ Mean of throttle opening∙ Mean of yaw rate∙ Mean of road gradient∙ Mean of shift position∙ Rate of stoppage time
∙ Degree of driving intention
http://www.tytlabs.com/review/
75
© Toyota Central R&D Labs., Inc. 2016
R&D Review of Toyota CRDL, Vol.47 No.3 (2016) 61-97
of the drivetrain, longitudinal vibration of the engine mounting system, and temporary accumulation of driving force (Fig. 26(a)). This is a major factor in the generation of estimation errors. Therefore, as shown in Fig. 26(b), estimation accuracy was increased by adding a notch filter to remove the vibration component and an integration correction portion for phase compensation. Figure 27 shows the vehicle weight estimation results under different loading and road gradient conditions. The results are within a range of ±15% of the target. The most difficult aspect of this research was modeling the driving force generated by the engine and acceleration. However, a new method was proposed ten years after this development, which is described in the next section.
range), which affects the driving load, can be isolated from the frequency range when the vehicle moves off and during acceleration. Focusing on this point, the low-frequency component below 1 Hz was removed and the vehicle weight was calculated based on the estimated driving force and estimated acceleration (Fig. 25). However, the actual acceleration (i.e., the difference with the transmission output shaft rotational speed) waveform has a different phase from the driving force waveform due to the torsional vibration
Fig. 24 Braking force control system.
Estimateweight
nonentth
BKEXBK SW
th : Throttle positionEXBK SW : Exhaust brake signalBK : Foot brake signal
Estimateincline R
equi
red
brak
ing
Sele
ct b
raki
ng
devi
ce
Gear
Look-upOn/Off
Exhaustbrake
A T – E C U
Fig. 25 Frequency characteristics of road gradient and acceleration.
Distance [m]
0
0 200 400
Hei
ght [
m]
10
Change ofgradient
Fθ
Time
Fast
SlowlyDifference of frequencyθ
F
Frequency [Hz]
Pow
er o
f fr
eque
ncy
0 1 2 3
No influenceof gradient
Estimationregion θ
50km/h
Driving force(acceleration)
Gradient
(a) Road surface profile
(b) Frequency characteristic of chage of road gradient (simulation)
Fig. 26 Vehicle weight estimation system.
Highpassfilter
Vehicleweight
0 dB
1 Hz
0 dB
3 Hz
Removal ofgradient
Driving force
Acceleration
Characteristicof torqueconverter
Pumpspeed
Time subtraction
Turbinespeed
Outputspeed
F
^
Notchfilter
Removal oftorsional vibration
Cal
cula
tion
for
estim
atio
n
α
^
Drivingforce
F
AcceleratingforceW α/ g
Phasedisagreement
Time
Forc
e
(a) Dynamics of drive force and acceleration
(b) Construction of weight estimation system
Fig. 27 Vehicle weight estimation results.
Estim
ated
Veh
icle
wei
ght [
ton] 6
Uph
illFl
atD
ownh
ill
(empty) (1 t)
2
3
4
5
Without processing
Act
ual
±15%
With processing
±15%
(empty) (1 t)
Act
ual

http://www.tytlabs.com/review/
76
© Toyota Central R&D Labs., Inc. 2016
R&D Review of Toyota CRDL, Vol.47 No.3 (2016) 61-97
calculate the clutch hydraulic waveform to derive the ultimately required control command value and achieve the target output shaft torque that forms the basis of this value, calculation is repeated in the forward direction using the model. In addition, the evaluation of the output shaft torque during shifting is performed also by calculation in the forward direction.
It should be noted that, when applied to an actual transmission, the model error may exceed the robust range. Therefore, processes are added to identify the hydraulic system response model at the bottom right of Fig. 28 and the clutch friction coefficient, which enables large errors to be absorbed. Figure 29 shows the simulation results for the output shaft torque fluctuation range with respect to the fluctuations of the pressure control system. The proposed method shows that there is little expansion of shift shock even when fluctuation occurs. Figure 30 shows the shifting waveforms before and after calibration using this method. This method can also be applied to the engagement and disengagement systems of four clutches.
4. 2 Control System Calibration and Model Generation
Many of the issues related to control system design are caused by inevitable errors between the model of the control target and the actual control. If these errors affect performance, then it is necessary to start the design again or apply a calibration process using the actual parts. The shift control for a multi-stage AT is an extremely good example of this due to the inputs from multiple clutches and hydraulic control systems. The accuracy of model-based calibration is limited and calibration using an actual transmission requires large increases in workhours as the number of shift speeds increases. In response to these issues, a method was proposed to reduce the amount of work by increasing the robustness of design by factoring in the modeling error and fluctuations in system characteristics at the generation phase of the control target.(41)
Figure 28 shows the quality engineering-based procedure for generating a target output torque in the shifting process of a multi-stage AT. Systems that factor in modeling error or fluctuations in system characteristics generate the most robust target values (i.e., target values with low sensitivity to the deterioration of evaluation indices such as shifting smoothness and time under turbulent conditions). To
Fig. 28 Derivation of robust target of output shaft torque.
Step1
Step2
Step4
Step3
Robustness evaluation of target outputtorque curves
Preparation of target output torque curvesfor search (18 patterns)
Generating target oil pressure (18 patterns)
Adding upper and lower hydraulic disturbances
Selection of the best output torque curve
A2
C1
A1 A3 B2B1 B3
C2C3
D1D2D3
A B C D
1
2
18
・・・・・・
・・・
・・・
・・・・・・
・・・・・・
・・・・・・
A1 B1 C1 D1
A1 B2 C2 D2
A3 B3 C2 D1
No
L18 orthogonal table
Turbinespeed
Outputtorque
200
300
400
0 10
100
200
300
Time [sec]
Target output torque[Nm]
Engage targetoil pressure
[kPa]
Oil pressure -15kPa
Oil pressure +15kPaNo disturbance
3cP
ettoT arg_
333 RAµ
tT
3cT
tω
oT
3cP
eT-
222 RAsµ
PT
Release clutch system (2nd)
Engage clutch system (3rd)Outputtorque
Turbinespeed
ClutchTransfertorque
TurbinetorqueTorque
converter
Gear trainsystem
ClutchOil pressure
Oil pressure
Engine torque
Torquecapacity
Torque ratio tInertiatorque
0 1200
300
400
Time [sec]
C+D
B
TargetOutputtorque[Nm]
(b) Weight to clutch heat load
(c) Conventional method(a) Weight to shift shock
µs 22 RA2
333 RAµ
ωt
−15kPa
Targetoutputtorque

http://www.tytlabs.com/review/
77
© Toyota Central R&D Labs., Inc. 2016
R&D Review of Toyota CRDL, Vol.47 No.3 (2016) 61-97
Under the methods described above, the models depend on identification. The following describes an example of the latest research into more accurate modeling by partially incorporating physical models into the simulation.(42) The basic concept can be explained using the lumped mass model shown in Fig. 31. When the number of masses matches the number of forces between the masses, calculation of the forces is possible if the acceleration of each mass can be measured, even if the characteristics of the forces are nonlinear. The generation mechanism of the acting forces including these nonlinear characteristics can then be modeled from the estimated forces. The flowchart on the right of the figure shows the flow of the analysis method.
The conventional method identifies the constants of the generation mechanism model from the measured acceleration directly without following this two-stage modeling process. However, although the conventional method is capable of deriving model constants that enable the measured and estimated acceleration to match, it cannot guarantee the accuracy
200
300
400
200
300
400
200
300
400
0 1
B
B
B
+15[kPa] -−15[kPa]Outputtorque[Nm]
Outputtorque[Nm]
Outputtorque[Nm]
(b) Weight to heat load
(a) Weight to shift shock
(c) Conventional method
No disturbance
Time [sec]
Fig. 29 Robustness evaluation (2-3 upshift simulation).
Fig. 31 Concept of force calculation.Fig. 30 Output shaft torque before and after calibration
(8-3 downshift simulation).
Throttle opening 10%
2000
6000
0
1000
0 10
1500
Outputtorque[Nm]
Rotationalspeed[rpm]
8th 3rd
60%
Shift command
Target oilPressure
[kPa]
Time [sec]
EngineTurbine Inertia phase
Increase
Kick down
Shock
Clutch1
Clutch3Clutch2
Clutch4Target oilpressure
Rotationalspeed
8th
2000
6000
0
1000
0 10
1500
10%60%
Throttle opening
Outputtorque[Nm]
Rotationalspeed[rpm]
Shift command
Target oilPressure
[kPa]
8th 3rdKick down
Time [sec]
Targettorque
No increase
Less shock and smoothness
Improved shift timing
Rotationalspeed
Target oilpressure
(a) Simulation results (8-3 downshift): before design
(b) Simulation results (8-3 downshift): after design
(a) One component considered
(b) All components considered
(c) Proposed method
1f 2fxm ? ?
1f?
??4f
?
???
2f
3f11xm
22xm
33xm
44xm
11xm 22xm 33xm 1f 2f 3f
Step 1. Vehicle measurement
Step 2. Structual identification(PARAFAC analysis)
Step 3. Calculation of transfer force and external force
Step 4. Model construction

http://www.tytlabs.com/review/
78
© Toyota Central R&D Labs., Inc. 2016
R&D Review of Toyota CRDL, Vol.47 No.3 (2016) 61-97
In addition to dynamic systems, this method should, in principle, also be an effective way of deriving models consisting of lumped parameter systems. It is
of the intermediate forces. This is the advantage of the developed method. Here, it should be noted that, to ensure consistency between measured and unknown quantities, the proposed method requires the degrees of freedom (DOF) of the lumped mass system to be reduced while maintaining its physical structure.
As an example of the application of this modeling method, Fig. 32 shows a vehicle model for tip-in acceleration, which was the major sticking point described in the previous section. In the figure, PARAFAC analysis(43) is used to first derive the equations of motion for rotation and translation with seven DOF. Next, the inertial mass and rotational inertia are defined as existing physical models. Then the forces between the inertia are calculated as measured quantities for acceleration and angular acceleration (the principle model) (Fig. 33). The driveline model (i.e., the calculated driveshaft model) is derived by applying the nonlinear backlash element. Finally, the vehicle behavior (the internal driving force) during tip-in acceleration is simulated (Fig. 34). This figure shows that the measured values match closely with the forces and driveline model.
Fig. 32 Example of modeling.
ダンパ
susm
ロアアームエンジンマウント
トランスミッション・伝達系
シャシー系
クラッチ
ドライブ
シャフトデフ
タイヤ
ホイール
車両前後G
エンジン系
ギヤ
Engine Transmission, driveline
Damper Differential gearDriveshaft Tire wheel
Lower armEngine mount
Clutch gear
Chassis systemAcceleration msus
3-axis acceleration sensorEngine block
Subframe
FrontTorque rod
Vehicle body(floor)
Lower arm
(a) Target of analysis
(b) Measurement points with 3-axis acceleration sensors in chassis system
Time [sec]
Engine block(ratation, translation) Vechicle body
Ttransmission
EngineBush
Mount
Unsprung mass(translation)
(a) Confirmation of components to be considered
(b) Accelerations, angular accelerations
Fig. 33 Comparison of measured and calculated results for acceleration and angular acceleration.

http://www.tytlabs.com/review/
79
© Toyota Central R&D Labs., Inc. 2016
R&D Review of Toyota CRDL, Vol.47 No.3 (2016) 61-97
regarded as a promising modeling method for various applications.
5. Tribology
Like all mechanical devices, transmissions include elements that contact and slide against each other. The friction that this generates causes various phenomena, such as the transfer of power, and is also a cause of loss and abrasion. Tribology is a research field that will continue as long as machines are in existence. TCRDL begun power transfer-related tribology research in the second half of the 1980s with the analysis of friction characteristics of wet clutches in the shifting process of multi-stage ATs. This was used as the springboard for research to help improve shudder resistance by analyzing the actions of the automatic transmission
fluid (ATF) used in lockup clutch slip control systems. In addition, TCRDL also worked on the analysis of traction characteristics and traction fluid using molecular dynamics (MD) as basic research for traction drive CVTs.
5. 1 Analysis of Paper-based Wet Clutch Friction Characteristics
Figure 35 shows results including experimental analysis of changes in friction characteristics during initial contact.(44) The plateau ratio of the deformed asperities of the friction material surface correlates
Time [sec]
Fig. 34 Comparison of principle model and calclulated results for force and torque.
Fig. 35 Relationship between friction material surface shape and friction coefficient.
0.14
0.13
0.12
0.11
0.10
0 5 10 15 20 25
Rz = 2.2 μm1.3 μm0.2 μm
Fric
tion
coef
ficie
nt μ
d
Separator roughness
Area ratio of flat parts Ac [%]
0
1
2
3
4
μi μd
0.2s
μ0
Fric
tion
[kN
] 200th time 50th time
Start of engagement
End of engagement
Time [sec]
1st time
dEnvelope curve
Surface curve (measured by roughness meter)
Area ratio of flat parts: Ac = lc/l × 100 [%]
(a) Plateau ratio deformed asperities of friction material surface (Ac) and friction coefficient (μd)
(b) Change of friction force
(c) Definition of plateau ratio deformed asperities

http://www.tytlabs.com/review/
80
© Toyota Central R&D Labs., Inc. 2016
R&D Review of Toyota CRDL, Vol.47 No.3 (2016) 61-97
of very small air bubbles and that only an extremely narrow area close to the top of the surface asperity is the actual contact surface. A sketch of this and a contact surface model that illustrates the contact area are shown on the right of the photograph. Based on this model, a friction simulation model (Fig. 37) was created assuming that the oil film at the actual contact portion close to the top of the asperity and the boundary friction component contribute to the friction. This model is capable of qualitatively explaining the friction characteristics when engagement occurs.
Figure 38 shows a calculation example. The graphs illustrate the μ-v characteristics using the surface roughness of the actual contact area of the steel plate as the parameter. From the standpoint of improving the shudder resistance of the clutch, it is important to lower the negative slope characteristics. As the roughness becomes larger, the slip speed increases and solid contact is maintained even when an oil film is formed, thereby helping to retain the desirable friction characteristics.(46) The same figure also shows
with the friction coefficient during engagement and is not dependent on the roughness of the separator on the engagement side. Therefore, increasing the plateau ratio of the deformed asperities will help to achieve more stable friction characteristics. In addition to providing important knowledge for friction material surface processing technology, these results developed into the modeling of friction surfaces with the application of knowledge obtained by observation using a friction surface visualization device.
Figure 36 shows the friction surface visualization device and a visualized image. This photograph indicates that the friction surface is covered by a film
Fig. 36 Friction surface visualization device and observation results.
ATFLoad cell (friction force)
Load cell (pushing force)
Inertia (fly wheel)
MotorFriction material
Quartz glass
Pushing force
Observation
CCD camera
Quartz glass
Friction material
Observed areaVery small air bubbles
Contact area1 mm
(a) Observation window
(b) Test device
(c) Observation result
Fig. 37 Friction surface contact model.
Oil film
Contact unit
Steel plate
Paper friction plateContact
areaSteel plate
Paper friction plate
–0.01 mm
Actual contact area
Oil film
Viscous friction
Boundary friction µc
.
hb
BD
1σ2σ
Micro cavitation

http://www.tytlabs.com/review/
81
© Toyota Central R&D Labs., Inc. 2016
R&D Review of Toyota CRDL, Vol.47 No.3 (2016) 61-97
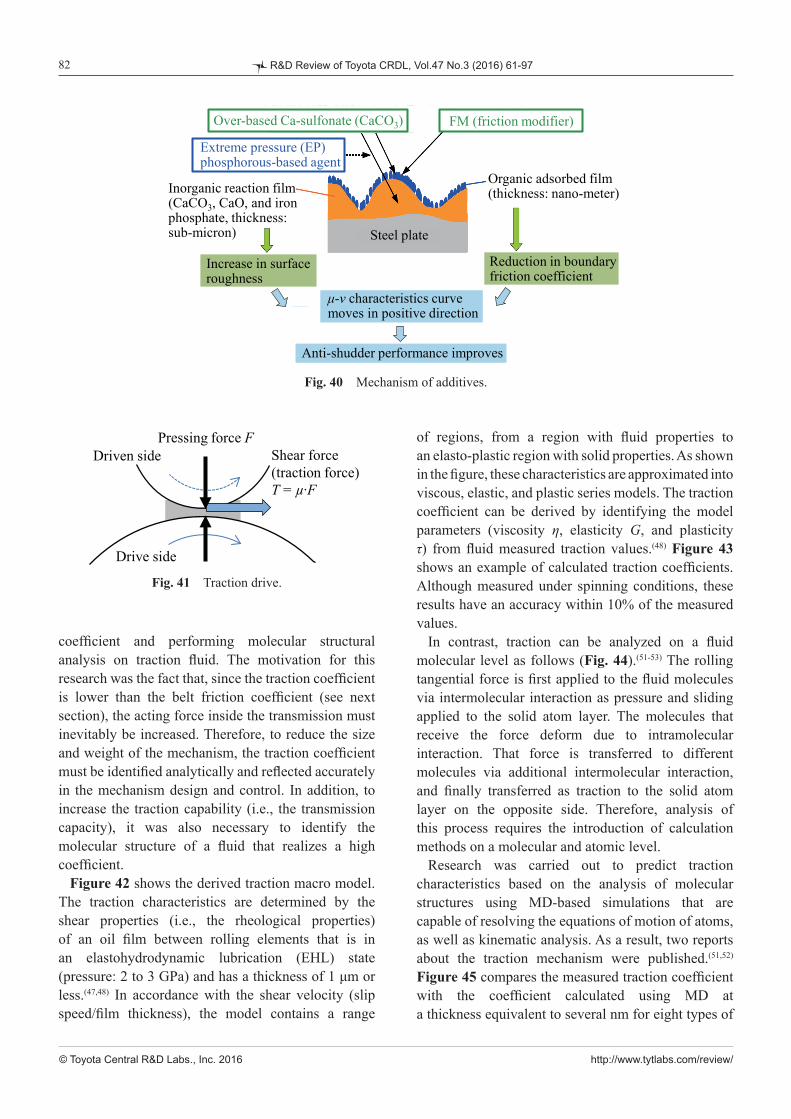
coefficient was clarified as shown in Fig. 39.(47) In addition, energy dispersive X-ray (EDX) and Fourier transform-infrared spectroscopy (FT-IR) analysis technologies that are specialties of TCRDL were used to identify that over-based calcium (Ca) sulfonate helps to generate additive reactants that increase the surface roughness of the steel plate, and that both the over-based Ca sulfonate and friction modifier (FMs) additives contribute to a reduction in boundary friction. These two analysis results are illustrated in Fig. 40, which shows the shudder prevention mechanism of the additives. In combination with the friction model described above, the increase in contact surface roughness and reduction of boundary friction were found to contribute to an improvement in μ-v characteristics, which helped to develop longer life ATF.
5. 2 Analysis of Traction Characteristics and MD-based Analysis of Fluid
Traction refers to the transmission of power by shear force when a lubricant (called a traction fluid) solidifies into a glassy state at a high surface pressure boundary between a pair of rolling elements (Fig. 41). Research and development of CVTs using this transfer method started before the 1940s when multi-stage ATs first emerged. However, the first commercial product was not released until the end of the twentieth century.(48)
At around the same time, TCRDL started basic research projects such as predicting the traction
the contribution of the boundary friction coefficient. A lower boundary friction coefficient has a large μ reduction effect at low slip speeds.(47) Although this model omits the oil permeability of the friction plate, the macro-elastic deformation during contact, and lacks the capability to follow changes in the steel plate, it is still a complex contact surface model and, as a first attempt to calculate friction characteristics, it is a good example of advanced research.
This modeling technology was then utilized in the development of ATF additives with excellent anti-shudder performance for the lockup clutch slip control inside a torque converter (see next section).
The key point for extending the anti-shudder lifetime of ATF is identifying the factors on the friction surface that affect the μ-v characteristics, and the additives that act on these factors. Based on the knowledge obtained through the above model, the relationship between the friction surface roughness and boundary friction
Fig. 39 Relationship of shudder with contact surface roughness and boundary friction coefficient.
0.3
0.2
0.1
00.05 0.1 0.15 0.2
No shudder region
After break-inwith 3/4-Ca Added
Over-basedCa-sulfonate
Shudderregion
After durabilitytest with 3/4-Ca
AddedFM
Con
tact
are
a ro
ughn
ess [
μm]
Boundary friction coefficient μc
Fig. 38 Effect of contact surface roughness and boundary friction coefficient on μ-v characteristics.
Total friction
Fluid friction component
Slip speed V [m/s]
σ1 =
0.25
0.20
0.15
0.10
0.05
00.5 1.0 1.5 2.0 2.5
Fric
tion
coef
ficie
nt μ 0.2
0.10.05
0.25 µm
Slip speed V [m/s]
Total friction
Fluid friction component
0.3
0.2
0.1
01 2
Fric
tion
coef
ficie
nt μ
0.25
0.2
0.15
µc
0.1
http://www.tytlabs.com/review/
82
© Toyota Central R&D Labs., Inc. 2016
R&D Review of Toyota CRDL, Vol.47 No.3 (2016) 61-97
of regions, from a region with fluid properties to an elasto-plastic region with solid properties. As shown in the figure, these characteristics are approximated into viscous, elastic, and plastic series models. The traction coefficient can be derived by identifying the model parameters (viscosity η, elasticity G, and plasticity τ) from fluid measured traction values.(48) Figure 43 shows an example of calculated traction coefficients. Although measured under spinning conditions, these results have an accuracy within 10% of the measured values.
In contrast, traction can be analyzed on a fluid molecular level as follows (Fig. 44).(51-53) The rolling tangential force is first applied to the fluid molecules via intermolecular interaction as pressure and sliding applied to the solid atom layer. The molecules that receive the force deform due to intramolecular interaction. That force is transferred to different molecules via additional intermolecular interaction, and finally transferred as traction to the solid atom layer on the opposite side. Therefore, analysis of this process requires the introduction of calculation methods on a molecular and atomic level.
Research was carried out to predict traction characteristics based on the analysis of molecular structures using MD-based simulations that are capable of resolving the equations of motion of atoms, as well as kinematic analysis. As a result, two reports about the traction mechanism were published.(51,52) Figure 45 compares the measured traction coefficient with the coefficient calculated using MD at a thickness equivalent to several nm for eight types of
coefficient and performing molecular structural analysis on traction fluid. The motivation for this research was the fact that, since the traction coefficient is lower than the belt friction coefficient (see next section), the acting force inside the transmission must inevitably be increased. Therefore, to reduce the size and weight of the mechanism, the traction coefficient must be identified analytically and reflected accurately in the mechanism design and control. In addition, to increase the traction capability (i.e., the transmission capacity), it was also necessary to identify the molecular structure of a fluid that realizes a high coefficient.
Figure 42 shows the derived traction macro model. The traction characteristics are determined by the shear properties (i.e., the rheological properties) of an oil film between rolling elements that is in an elastohydrodynamic lubrication (EHL) state (pressure: 2 to 3 GPa) and has a thickness of 1 μm or less.(47,48) In accordance with the shear velocity (slip speed/film thickness), the model contains a range
Fig. 40 Mechanism of additives.
Extreme pressure (EP) phosphorous-based agent
Over-based Ca-sulfonate (CaCO3) FM (friction modifier)
Inorganic reaction film (CaCO3, CaO, and iron phosphate, thickness: sub-micron)
Organic adsorbed film (thickness: nano-meter)
μ-v characteristics curve moves in positive direction
Anti-shudder performance improves
Increase in surface roughness
Reduction in boundary friction coefficient
Steel plate
Fig. 41 Traction drive.
Pressing force FShear force (traction force)T = µ∙F
Drive side
Driven side

http://www.tytlabs.com/review/
83
© Toyota Central R&D Labs., Inc. 2016
R&D Review of Toyota CRDL, Vol.47 No.3 (2016) 61-97
hydrocarbon-based fluids. Although the absolute values do not match, the sequence is consistent and the actual phenomena are qualitatively reproduced. Although the relationship between the traction coefficient and molecular structure has complex aspects, this analysis identified the traction mechanisms of chain molecules, monocyclic molecules, and dumbbell-shaped molecules.
Furthermore, to enable actual scale simulations in the film thickness direction, research was carried out that divided the film thickness into regions as shown in Fig. 46 and performed message passing interface (MPI) parallelization computation.(53) Under a high-pressure shear field in a 430 nm system, which is the same order as an actual system, a traction coefficient of 0.03 was obtained. This is close to the value obtained through measurement. Combined with the results shown in Fig. 45, MD-based computation
Fig. 44 Concept of momentum transfer of traction fluid.
(phase structure,molecular binding…)
Intermolecularinteraction
(bond, angle,torsion…)
Intermolecularinteraction
F2F2
F1F1 Pzz
Pzz
Fig. 42 Traction macro model.
Rheology model
Plastic slip τL
Viscosity η Elasticity G
Disc
Roller
(Local) Relative slip speed⊿U (x,y) Shear
force τ
a
b
−a
−b
x
y
s
τx
Spinωs
Rolling direction
x
y
Contact pressure distribution
pαp = 25
(III) Viscous region
(II) Plastic region
Drive side
(I) Adhesive (elastic) region
y
Spin ωs
x
U1
U2Driven side
Fig. 43 Predicted traction curves.
μmax
μmax
0
0.02
0.04
0.06
0.08
0.1
0 2 4 6
High-speed low-pressure surface
MeasuredCalculated
Trac
tion
coef
ficie
nt μ
Slip rate S [%]
Low-speed high-pressure surface
0.05
0.1
0.15
0.2
0.25
00 0.02 0.04 0.06
µ (experiment)
µ (s
imul
atio
n)
Fig. 45 Comparison with experiments (film thickness z0 = 6.7 nm, shear rate 1.5 × 10⁸ s-1).

http://www.tytlabs.com/review/
84
© Toyota Central R&D Labs., Inc. 2016
R&D Review of Toyota CRDL, Vol.47 No.3 (2016) 61-97
6. 1 Experimental Analysis of Belt ComponentElements
In the same way as discussed above for the analysis of internal torque converter flows, experimental analysis is at the root of basic research into metal belts.(58) Targets of analysis include the stress applied to elements and rings, as well as trajectories of movement and element angles inside the pulleys. The force and acceleration acting on the pulleys as reaction forces that compress the elements are also key information items for understanding various phenomena.
Figure 47 shows an example of the attachment of strain gauges to measure the forces acting on an element. The left figure shows the gauges used to measure compression and bending forces in the width
is capable of expressing and identifying actual phenomena through calculations from several nm to actual scale. This research is the first attempt to enable this type of simulation.
Subsequently, MD-based tribology analysis trended toward more fundamental tribological friction-related phenomena.(53)
6. Analysis of Belt-driven CVTs
As described above, research into CVTs at TCRDL was temporarily shelved in the 1960s. However, a European company called Van Doorne’s Transmisie (VDT) subsequently launched a new concept of CVT, which was driven by a metal V-belt. From the 1980s, this triggered various research studies in Japan and the U.S. that installed CVTs in vehicles, as well as original developments of different kinds of belts.(54) Stimulated by this new wave of interest in CVTs, TCRDL also began belt development and studies of system controls in the 1980s. In the second half of the 1990s, more than a decade after the practical adoption of CVTs using the metal V-belt developed by VDT, TCRDL re-started its research to analyze metal V-belts in partnership with a member of the Toyota group. This research is still ongoing today. Although the results of the next twenty years of research are well documented in previous issue of this journal(56,57), the following sections will cover several key topics from this period, albeit with some duplication.
Fig. 47 Measurement of metal belt element stress.
(a) Measurement of compression and bending force
(b) Measurement of bending force at elment noseFig. 46 Steady state snap shot of an actual scale simulation
(n-Hexane 100 molecules extracted and shown at the center of the film (top) and close to the solid atom layer (bottom).
430
nm
Node 1
Node 2
Node 3
Node 22
Node 23
Node 24 1 nmFe
Fe

http://www.tytlabs.com/review/
85
© Toyota Central R&D Labs., Inc. 2016
R&D Review of Toyota CRDL, Vol.47 No.3 (2016) 61-97
Figure 50 shows the measured results for the force acting on the element nose as an example of experimental analysis results.(59) Force does not act directly on the element nose since the top portion of the element is not in contact inside the primary pulley. However, force is applied to the nose through contact with the top part of the element on the compressional chord side. In addition, force spikes occur at the beginning and end of the pulley section. These are generated by changes in the moving pattern and dimple hole interference when the element switches from rotating to translational movement or from translational to rotating movement at the beginning and end of the pulley section. This phenomenon
direction of the element (i.e., the forces applied onto the element by the pulley). The right figure shows the gauges used to measure the bending force at the element nose. To improve measurement sensitivity, grooves are formed in the element in accordance with the direction of the acting force to fix the gauges. One issue was obtaining the measurement signals from strain gauges attached to a rotating belt. This was resolved by the development of the original data logging system shown in Fig. 48,(57) and by installing the logger at the top part of specially designed elements. Unlike telemeters or slip rings, the measurement signals are stored in memory located on the moving body, and are then outputted as digital data to a PC after measurement is completed. Carrying out signal processing on the measurement object ensures a good signal-noise (SN) ratio, prevents data loss, and enables sampling up to high frequencies. In addition, the use of a lightweight type (minimum weight: 1 gram) enabled the system to be used up to actual belt rotation speeds of 2000 rpm. In addition to the belt, this data logger was also used for measuring the acceleration of the pulley (Fig. 49), and for analysis of NV between the belt and pulley.
Fig. 49 Pulley acceleration measurement.Fig. 48 Data logger system.
Ultra-compact data logger
CVT belt
Measured element
Lithium battery unit
Specially designed elements
Battery unit
Data logger unitMeasured element
(a) Wiring for data logger and measuring element strain
(a) Attachment of data logger to CVT pully
(b) Attachment of data logger to CVT belt (b) Measurement results
Data logger
Acceleration sensor
AmplifierBattery case
Acceleration sensor
6-channel simultaneous measurement (3 axes × 2)
Beginning of drive pulley section
Intermediate Intermediate
End of driven pulley section
Drive pulley Driven pulley
Acceleration (dB)End of drive pulley section
Acceleration (dB)Beginning of driven pulley section
10dB
Input rotation speed: 1000 rpm, speed ratio: 1, input torque: 50 Nm

http://www.tytlabs.com/review/
86
© Toyota Central R&D Labs., Inc. 2016
R&D Review of Toyota CRDL, Vol.47 No.3 (2016) 61-97
movement of the belt to be measured.An example of the information obtained using this
belt angle measurement device is the range of element behavior inside, as well as at the beginning and end of the pulley sections. Figure 52 shows the changes in pitching and yawing of the primary pulley. At the under-drive side, clear angular changes occur in the transition region between the idle and active arcs. The results also show that the wear resistance of the end surface of the element is affected if the angle deviates from the ideal state (zero degrees).
These details are only a part of the information obtained by element behavioral analysis. Although other information on important phenomena has been identified, this is directly connected to product development and a little more time is required before it
becomes more pronounced at higher rotation speeds, and requires attention.
The inclination angle measurement device shown in Fig. 51 was developed to measure the belt movement trajectory and angle inside the pulleys.(57) The principle of this device is as follows: the relative positional deviation of three points of the element top portion is detected by highly sensitive displacement sensors and used to calculate the yaw, roll, and pitch angles. This device is distinguished by a control that ensures a constant small gap (0.3 mm) between the head attached with the three sensors and the element top. Each sensor is also provided with rings to prevent interference between the sensors. As a result, there is no need to attach a head for increasing measurement sensitivity to the element, which allows the actual
Fig. 50 Measurement result of element nose strain. (Nin = 500 rpm, Tin = 150 Nm, speed ratio = 2.4)
Time [sec]−20
−10
0
10
20
Nos
e pr
essi
ng fo
rce
[N]
Fig. 51 Element inclination angle measurement device.
Sensor head
Servo motor
Belt
Metal ring
Gap sensor
Fig. 52 Element angle measurement results.
-80 -60 -40 -20 0 20 40 60 80
Measuring position (deg)
Pitch a
ngl
e (bac
kwar
d t
iltin
g) γ2.4 γ1.0
γ2.0 γ0.7
γ1.7 γ0.5
γ1.4
outletinlet0−80 −60 −40 −20 0 20 40 60 800
Measuring position [deg]
Pitc
h an
gle
(bac
kwar
d til
ting)
-80 -60 -40 -20 0 20 40 60 80
Measuring position (deg)
Yaw
angl
e
γ2.4 γ1.0
γ2.0 γ0.7
γ1.7 γ0.5
γ1.4
outletinlet0−80 −60 −40 −20 0 20 40 60 800
Measuring position [deg]
Yaw
ang
le
(a) Measurement results: element pitch angle in primary pulley for different γ (200 Nm)
(b) Measurement results: element yaw angle in primary pulley for different γ (200 Nm)

http://www.tytlabs.com/review/
87
© Toyota Central R&D Labs., Inc. 2016
R&D Review of Toyota CRDL, Vol.47 No.3 (2016) 61-97
can be disclosed. It is hoped to publish this information in a future issue of the journal.
6. 2 Static Model of Belt Transfer
Modeling research activities were carried out hand-in-hand with experimental analysis. In one modeling method, the shapes of component elements are faithfully reproduced to create a discrete model, before generating solutions using the finite element method (FEM). In another method, the elements and rings are treated as a continuous body to find the balance of internal transfer forces. Although the former method is suitable for identifying the behavior of elements and rings, the computational load is extremely high, which limits its application to the identification of certain important phenomena. TCRDL developed the latter method as a simple means of observing the relationships of internal belt forces, and to enable analysis that factors in pulley deformation.(61) Figure 53 illustrates the forces acting on the inside of the belt and the calculation process flow.
Figure 54 shows an example of the research results obtained using this model.(62) These graphs are the results of analyzing the distance between the ring
Fig. 53 Modeling of internal belt stress and calculation process.
dθ
dF
T + dTTµa dF
Cr dθ
θ
Rings
Elements
Rings
dθ
µa
dθ
θ
dθ
dF
Q + dQQ
µa dF
Ce dθ
θ
Element
ζ
2µb dN
ϕ
dNdFz
µb dN sinζ
Pulley
Elements
Rings
dθ
µa
dθ
θ
2µb
µb dN sinζ
ζ
Step1: Calculate load distribution
Step2: Evaluate pulleydeformation
Step3: Calculate direction of friction forcebetween belt and pulley
End
Converged?
Y
N
Initial direction offriction forcebetween belt and pulley
Ring tension
Pri. Sec.
Element compression
Pulley clamping forceRing tension
Pri. Sec.
Element compression
Pulley clamping force
ζ BeltPulley
ζ BeltPulley
ζ BeltPulley
ζ BeltPulley
ζ
ζ
Clamping force
Y
Ring tension
(a) Equilibrium of forces that act on rings
(b) Equilibrium of forces that act on elements (c) Caluculation process
(a) Large δ
(b) Small δ
Fig. 54 Distribution of ring tension.
µ01 > 0 1st layer µ01 < 0
Other layers
Progress of belt rotation
Rin
g te
nsio
n
SecondaryPrimary
µ01 < 01st layer
µ01 > 0
Other layers
Progress of belt rotation
Rin
g te
nsio
n
SecondaryPrimary
µ01 > 0
µ01= 0

http://www.tytlabs.com/review/
88
© Toyota Central R&D Labs., Inc. 2016
R&D Review of Toyota CRDL, Vol.47 No.3 (2016) 61-97
using this device.(63,64) In these experiments, the clamping force was gradually reduced under a constant input torque, and data was obtained immediately up to the point that the transfer force disappeared. The figure also shows the stand-alone friction characteristics μe(Δv) of the elements using a slip-on ring. The following belt friction characteristics were identified. In the macro-slip area in which the friction is saturated and starts to decrease, the characteristics have the same gradient as the stand-alone element friction characteristics. However, before this area, the friction coefficient increases in accordance with the belt slip speed. Since the belt friction transfer force is the sum of the active element friction force inside the pulleys, the belt friction coefficient can be defined as the product of the active element friction coefficient and the active arc ratio (i.e., the proportion that contributes to force transfer). Therefore, although the gradient of the stand-alone element friction falls as the slip speed increases, the belt friction coefficient increases while the active arc ratio of the belt increases. The modeling results of this mechanism are shown as the bold line in the figure, in which the slip speed and friction coefficient calculation targets the minor diameter pulley that determines the transfer capacity. The two results match closely.
Assuming the application of these analysis results to clamping force controls, research was also carried out to find estimated values for physical quantities to enable the swift detection of friction saturation.(60,65) Based on the belt movement model, the studied estimated values
saddle surface and element locking edge (i.e., the element locking edge offset amount), which has the highest sensitivity between the designed geometrical dimensions and transfer losses. In the calculation shown in the figure, to identify the load of each ring layer, the ring model is treated as an element with multiple layers to simulate the actual design of the ring. When the offset amount in the figure is large, the tension of the innermost ring layer is almost the same as the tension of the other layers. In contrast, when the offset is small, the tension of the innermost ring is much different. In other words, although a smaller offset reduces loss, this has the effect of creating a relative increase in the ring tension amplitude. Therefore, great care must be taken when determining the specifications.
6. 3 Belt Dynamic Friction Characteristics
The transfer capacity of the belt is determined by the mechanical strength of the belt and the friction characteristics between the belt and the pulleys. Following the belt transfer principle, this friction is dynamic and not static because the belt is constantly slipping. For this reason, it is important to analyze dynamic and transient phenomena. Therefore, TCRDL developed a high-response, low-inertia belt-driving dynamo that enables both static and transient tests in analytical experiements (Fig. 55).(60) The original measurement and control system that was constructed using this dynamo enabled the analysis of transient belt phenomena in the unstable operation range.
Figure 56 shows results for the belt friction characteristics obtained through experimental analysis
Fig. 55 Transient tester. Fig. 56 State of power transmission.
Control panel
Electric system
Dynamo TransmissionLow
inertia dynamo
PROFIBUS
Independent CPU
Control system
Control panel
Fig. 54
Data acquisition
Control of transmission
Engine & vehicledynamics simulation
0.01 0.1 10.8
1.2
1.0
Belt slip speed Δv [m/s]
Fric
tion
coef
ficie
ntµ* (
=µ/
µ max
(γ=
0.65
))
µe (Δv)
Micro slip area
µmax
Macro slip area
Active arc β
Idle arc
Elements
β/α < 1 β/α = 1
α-β
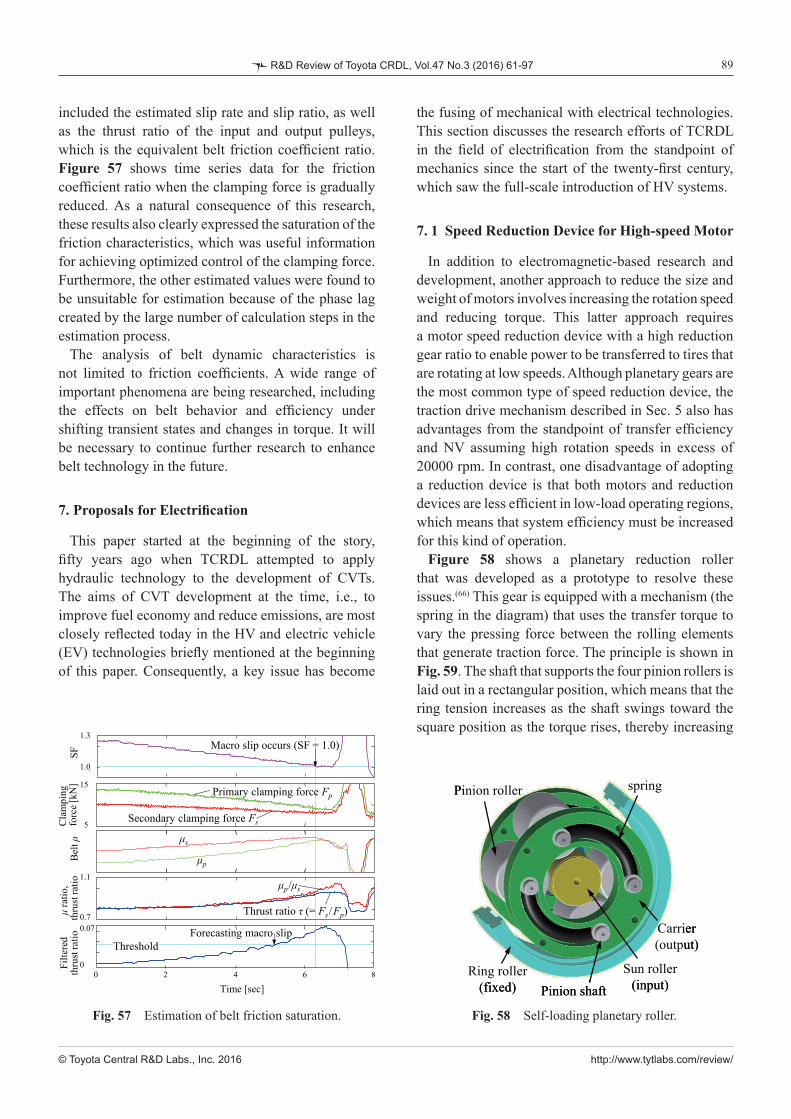
http://www.tytlabs.com/review/
89
© Toyota Central R&D Labs., Inc. 2016
R&D Review of Toyota CRDL, Vol.47 No.3 (2016) 61-97
the fusing of mechanical with electrical technologies. This section discusses the research efforts of TCRDL in the field of electrification from the standpoint of mechanics since the start of the twenty-first century, which saw the full-scale introduction of HV systems.
7. 1 Speed Reduction Device for High-speed Motor
In addition to electromagnetic-based research and development, another approach to reduce the size and weight of motors involves increasing the rotation speed and reducing torque. This latter approach requires a motor speed reduction device with a high reduction gear ratio to enable power to be transferred to tires that are rotating at low speeds. Although planetary gears are the most common type of speed reduction device, the traction drive mechanism described in Sec. 5 also has advantages from the standpoint of transfer efficiency and NV assuming high rotation speeds in excess of 20000 rpm. In contrast, one disadvantage of adopting a reduction device is that both motors and reduction devices are less efficient in low-load operating regions, which means that system efficiency must be increased for this kind of operation.
Figure 58 shows a planetary reduction roller that was developed as a prototype to resolve these issues.(66) This gear is equipped with a mechanism (the spring in the diagram) that uses the transfer torque to vary the pressing force between the rolling elements that generate traction force. The principle is shown in Fig. 59. The shaft that supports the four pinion rollers is laid out in a rectangular position, which means that the ring tension increases as the shaft swings toward the square position as the torque rises, thereby increasing
included the estimated slip rate and slip ratio, as well as the thrust ratio of the input and output pulleys, which is the equivalent belt friction coefficient ratio. Figure 57 shows time series data for the friction coefficient ratio when the clamping force is gradually reduced. As a natural consequence of this research, these results also clearly expressed the saturation of the friction characteristics, which was useful information for achieving optimized control of the clamping force. Furthermore, the other estimated values were found to be unsuitable for estimation because of the phase lag created by the large number of calculation steps in the estimation process.
The analysis of belt dynamic characteristics is not limited to friction coefficients. A wide range of important phenomena are being researched, including the effects on belt behavior and efficiency under shifting transient states and changes in torque. It will be necessary to continue further research to enhance belt technology in the future.
7. Proposals for Electrification
This paper started at the beginning of the story, fifty years ago when TCRDL attempted to apply hydraulic technology to the development of CVTs. The aims of CVT development at the time, i.e., to improve fuel economy and reduce emissions, are most closely reflected today in the HV and electric vehicle (EV) technologies briefly mentioned at the beginning of this paper. Consequently, a key issue has become
Fig. 57 Estimation of belt friction saturation.
Threshold
Primary clamping force Fp
5
15
Cla
mpi
ngfo
rce
[kN
]
0.7
1.1
μra
tio,
thru
st ra
tio
0
0.07
Filte
red
thru
st ra
tio
0 2 4 6 8
Time [sec]
1.0
1.3
SF
Macro slip occurs (SF = 1.0)
μp/μs
Thrust ratio τ (= Fs/Fp)
Secondary clamping force Fs
μs
μp
Bel
t μ
Forecasting macro slip
Fig. 58 Self-loading planetary roller.
spring
Sun roller(input)
Ring roller(fixed)
Pinion roller
Pinion shaft
Carrier(output)
spring
Sun roller(input)
Ring roller(fixed)
Pinion roller
Pinion shaft
Carrier(output)

http://www.tytlabs.com/review/
90
© Toyota Central R&D Labs., Inc. 2016
R&D Review of Toyota CRDL, Vol.47 No.3 (2016) 61-97
the pressing force. As an example of this design, a 45% variation in pressing force can be achieved with a 20-degree swing. Compared to conventional variable pressing force mechanisms that use the torque cam or wedge roller methods, the developed method has the potential to overcome issues such as shortening the shaft and compatibility with both forward and reverse rotation. Figure 60 shows the transfer efficiency and noise levels of this prototype. The mechanism has flat transfer efficiency characteristics from low loads and helps to achieve the targeted substantial increase in efficiency. Under high-speed drive conditions with a rotation speed of 30000 rpm, there is also a clear noise level difference of 10 dB compared to a planetary gear. In contrast, one remaining issue to be resolved before this design can be practically adopted is the development of a compact and durable spring for the mechanism.
7. 2 Electromagnetic Torque Converter
The integration of motors and mechanical elements has expanded to hybrid motor systems.(67) Figure 61 shows an electromagnetic torque converter system inspired from the analogy of a fluid-type torque converter that functions when the vehicle moves off. Based on the electromagnetic coupling function (top left of Fig. 61(a)), an integrated mechanism was created by adding a traction motor function (top of Fig. 61(a)). The key internal element of this mechanism is the slip ring system that supplies power to and draws
Fig. 59 Pressing force variation mechanism.
Arrangement of the pinion rollers vs. Circumferential length of the ring roller
Rectangular
Square
Contact force
Tensile force F= k(x+⊿x)
Tensile force F= kx
Largerlarger in circumferential length
Smallersmaller in circumferential length
Pinionroller
Ring roller
Sun roller
Swing angle
Arrangement of the pinion rollers vs. Circumferential length of the ring roller
Rectangular
Square
Contact force
Tensile force F= k(x+⊿x)
Tensile force F= kx
Largerlarger in circumferential length
Smallersmaller in circumferential length
Pinionroller
Ring roller
Sun roller
Swing angle
Larger in circumferential length
Smaller in circumferential length
Tensile force F = k(x + Δx)
Tensile force F = kx
-60
-40
-20
0
0 5 10 15 20Swing angle [deg]
Rat
e of
con
tact
fo
rce
chan
ge [%
]
RectangularSquare
-60
-40
-20
0
0 5 10 15 20Swing angle [deg]
Rat
e of
con
tact
fo
rce
chan
ge [%
]
RectangularSquare RectangularSquare
−60
−40
−20
0
0 5 10 15 20Swing angle [deg]R
ate
of c
onta
ct fo
rce
chan
ge [%
]
(a) Mechanism (b) Pressing force variation
Fig. 60 Transfer efficiency and noise.
Self-loading
60
80
90
100
0 20 40 60
Effic
ienc
y [%
]
Input torque [Nm]
70
Constant-loading
max 97%
6000rpm
Self-loading
60
80
90
100
0 20 40 60
Effic
ienc
y [%
]
Input torque [Nm]
70
Constant-loading
max 97%
6000rpm
Planetary gear
85
90
95
100
105
0 10000 20000 30000 40000Input rotational speed [rpm]
Noi
se le
vel [
dB]
Planetary roller
Planetary gear
85
90
95
100
105
0 10000 20000 30000 40000Input rotational speed [rpm]
Noi
se le
vel [
dB]
Planetary roller
(a) Efficiency
(b) Noise

http://www.tytlabs.com/review/
91
© Toyota Central R&D Labs., Inc. 2016
R&D Review of Toyota CRDL, Vol.47 No.3 (2016) 61-97
power from the input rotor winding. The assumed use of this mechanism is in a hybrid transmission that combines both a planetary gear transmission and CVT (Fig. 61(b)). Figure 62 shows a cross section of the prototype mechanism.
This motor mechanism is capable of realizing three operating modes. The first is the power transmitting mode that amplifies the engine power to enable the vehicle to move off smoothly and powerfully. As shown in Fig. 61(c), input torque is transferred to the output shaft directly via the output rotor by the action of the electromagnetic coupling. In addition, the current generated by the winding is supplied as power to the stator via the slip ring, thereby driving the output rotor and amplifying the torque. The second is the engine starting mode. The developed mechanism can start the engine by driving the input rotor via the output rotor from the outermost stator. The third is a motor driving mode that includes regenerative braking. This mode uses the output rotor and operates regardless of the rotational state with the input rotor. Figure 63 compares the torque amplification transmission efficiency with a fluid-type torque converter. The graph indicates that the developed mechanism is more efficient even when the speed ratio is low. It should also be noted that this mechanism can also operate in regions with a speed
Fig. 61 Electromagnetic torque converter system.
Side view
Output
Brush
Input
Slip ring
Electromagnetic coupling
Cross sectional view Side view
BrushOutput
Output rotor
Input rotorInput
Slip ring
StatorPermanent magnet
Output
Side view
Traction motor
Coil
Automatic transmissionClutch
Electric power flow
Mechanical power flow
Power split modeNin > Nout
Batt.
Eng.
(a) Schematic of the electromagnetic torque converter structure
(b) System structure of the presented hybrid system
(c) Power flows in the power transmitting mode
Fig. 62 Electromagnetic torque converter structure.
(a) Sectional view
(b) Prototype rotor and brush holder
Insulator cover
Brush
Spring
Brush holder assembly
Slip ring
Winding rotor
Brush holder assembly

http://www.tytlabs.com/review/
92
© Toyota Central R&D Labs., Inc. 2016
R&D Review of Toyota CRDL, Vol.47 No.3 (2016) 61-97
shows the relationship between the brush temperature wear amount per unit of sliding distance. The graph compares the results of a transient test that simulated the urban driving cycle (green triangles) and the results at a constant rotation speed and different currents without the cooling mechanism (red circles and blue squares). This graph confirms that durability could be maintained by controlling the brush temperature through oil cooling, even in the transient mode.
This mechanism has several distinguishing features. Instead of passenger HVs that can be started using the motor alone, it can be adopted with heavy duty HVs that require large torque for towing goods trailers or caravans.
Incidentally, there are similarities between this motor mechanism and the hydro-mechanical CVT that was introduced in Sec. 2. The similarity between an electrical version of an HMT using a hydraulic pump, motor, and planetary gear with the current Toyota Hybrid System (THS) has already been mentioned. In the same fashion, the hydraulic pump in Fig. 1 is similar to the electromagnetic coupling, and the transfer of the fluid force generated by the hydraulic pump to the output shaft hydraulic motor is similar to the transmission of power generated inside the electromagnetic coupling to the traction motor. Although the aim to harmonize with existing transmissions by using the motor mechanism to limit functions to moving off, electrical drive, and engine start is a point of difference, the mechanism itself can be seen as a re-imagining of the system that was developed fifty years ago.
ratio of more than 1. However, because a conventional transmission is installed behind the motor, a speed ratio of 1 will result in a directly coupled mode.
One of the main issues with this system is reliability, such as the occurrence of electrical abnormalities caused by slip ring wear and wear particles caused by mechanical sliding. Therefore, the structure shown in Fig. 64, which uses oil to cool the inside of the sliding portions and removes wear particles using blown air, was developed and evaluated.(68) Figure 65
Transmission efficiency @ Nin = 2000 rpm
Fig. 63 Electromagnetic torque converter transmission efficiency.
η [%
]
20 Nm50 Nm
100Nm150 Nm200 Nm250Nm
Fluid-type torque converter
e [Nout/Nin]
Fig. 64 Cooling of slip ring and wear particle removal mechanisms. Fig. 65 Slip ring wear evaluation test.
50 100 150 2000
0.05
0.1
0.15
0.2
0.25
0.3
0.35
0.4
Brush temperature [℃]
Wea
r/slid
ing
dist
ance
[µm
/km
] Room temperature
Ambient temp. 90℃
Ambient temp. 110℃
Room temp.
Ambient temperature, 90℃

http://www.tytlabs.com/review/
93
© Toyota Central R&D Labs., Inc. 2016
R&D Review of Toyota CRDL, Vol.47 No.3 (2016) 61-97
(3) Sakamoto, K., Otomachikku-toransumisshon Nyumon (in Japanese) (1995), pp. 34-51, Grand Prix BOOK PUBLISHING.
(4) Nagatomo, K., “HMT to 40 nen, Kako kara, soshite Mirai e”, Frudo Pawa Sisutemu (in Japanese), Vol. 33,
No. 5 (2002), pp. 54-58.(5) Ishihara, T., “Yuatsu Kudosha ni tsuite”, Proc. JSAE
Ann. Congr. (in Japanese), No. 661001 (1966).(6) Ishihara, T. et al., Yuatsu Kougaku, Ed. by Ishihara, T. (in Japanese) (1968), pp. 198-228, Asakura Publishing.(7) Abe, S. et al., “A Development of Toyota Hybrid
System”, Toyota Tech. Rev. (in Japanese), Vol. 47, No. 2 (1997), pp. 50-55.
(8) Sakamaki, T., “Toyoda Shoichiro Shi Kouenroku” (in Japanese) (2009), <http://www.higashiyamakai-kanto.com/file/toyota.pdf>, (accessed 2016-08-11).
(9) Umaya, M. et al., “Wind Power Generation (Development of Offshore Wing Turbine)”, Mitsubishi Heavy Industries Technical Review, Vol. 50, No. 3 (2013), pp. 29-35.
(10) Yamada, M. and Ueda, A., “Yuatsukanrokei no Shuhasu Tokusei”, Shouwa 52 nen Shunki Yukuatsu Kouenkai Ronbunshu (in Japanese) (1977), pp. 49-54.
(11) Yamada, M., “Jidosha no Yuatsu Gijutsu”, R&D Rev.Toyota CRDL (in Japanese), Vol. 16, No. 3 (1981), pp. 19-29.
(12) Hattori, K., Suzuki, H., “Jidosha you Ben Ponpu no Teimyakudouka ni kansuru Kenkyu”, Proc. JFPS Symp. Spring (In Japanese) (1984), pp. 77-80.
(13) Matsunaga, T. et al., “Analysis of Self-exited Vibration in Power Steering System”, Proc. Int. Symp. AVEC (1992), pp. 516-521.
(14) Hattori, K. and Suzuki, H., “Simulation Analysis of Pressure Fluctuation for Hydraulic Driving System of Cooling Fan”, R&D Rev. Toyota CRDL (in Japanese), Vol. 28, No. 3 (1993), pp. 23-33.
(15) Koike, M. et al., “Simulation of Abnormal Fuel Injection in Diesel Engines”, SAE Tech. Pap. Ser., No. 900345 (1990).
(16) Imai, K. et al., “Pressure Pulsation Transfer in Clutch Hydraulic Systems”, SAE Tech. Pap. Ser., No. 891307 (1989).
(17) Nimura, T. et al., “Analysis of Pulsation Transmission in Clutch Hydraulic System”, J. Autom. Eng. Jpn. (in Japanese), Vol. 42, No. 12 (1988), pp. 1528-1534.
(18) Tanihira A. et al., “Numerical Simulation of Hydraulic Circuits for Automatic-transmission on the Car”, Proc.
JFPS Symp. Autumn (in Japanese) (1998), pp. 46-48.(19) Nishizawa, H., “Design Technique for Suppressing
Vibration in Hydraulic Control System”, R&D Rev. Toyota CRDL (in Japanese), Vol. 36, No. 3 (2001), p. 54.
(20) Kondo, Y. et al., “Analysis of Flow Forces Acting on a Spool Valve”, Trans. JSME B (in Japanese), Vol. 65, No. 639 (1999), pp. 3577-3585.
(21) Kondo, Y. et al., “Analysis of Lubrication Characteristics on Sliding Surface between Shoe
8. Conclusion
This paper has looked back on various technologies in the history of drivetrain research and development at TCRDL. Although the author has described the importance of accumulating layers and layers of technological know-how in previous issue of this journal,(56) writing this paper has been a reminder that many researchers and engineers at TCRDL have done just that since its establishment.
On the other hand, the details of this paper were limited to publically disclosed reports and research. As a result, it does not fully express the passion of all the researchers and engineers involved in the research and development described in the introduction. However, to the researchers and engineers of today, I wish to add the following comments for consideration and reflection. It is not possible to continue navigating through the continuous changes of the times without an unheralded and unspoken passion. It is also not possible to create new things without using the achievements of the past as a basis for further development.
The writing of this paper owes a great deal to information received from a large number of people involved in the research and development described above, including Dr. Masatoshi Yamada, a former member of staff at TCRDL who was involved in the development of hydro-mechanical CVTs. Much drivetrain research at TCRDL from the 1980s was carried out with the close cooperation of Toyota Motor Corporation and members of the Toyota group. The research results are the result of the valuable advice and support received from these companies, who also gave excellent opportunities to utilize the research results during actual development, thereby providing important motivation to all the research teams. I would like to conclude by expressing my deepest gratitude for the assistance of everyone that contributed to the research and development activities of TCRDL, as well as to the writing of this paper.
References
(1) Kobayashi, A., “Yuatsushiki Zen’iki Mudan Hensokuki”, Trans. JSME (in Japanese), Vol. 40, No. 336 (1974),
pp. 2224-2235.(2) Kobayashi, A., “Yuatsushiki Hensokuki eno Kitai”,
REV. TOYOTA RD CENTER (in Japanese), Vol. 1, No. 4 (1964), pp. 3-28.

http://www.tytlabs.com/review/
94
© Toyota Central R&D Labs., Inc. 2016
R&D Review of Toyota CRDL, Vol.47 No.3 (2016) 61-97
and Swash Plate in a Compressor”, Trans. JSME C (in Japanese), Vol. 72, No. 714 (2006), pp. 636-643.
(22) Yamada, M. et al., “Torukukonbata Naibu Nagare no Kaiseki Dai 1 hou”, Shouwa 59 nen Shunki Yukuatsu Kouenkai Ronbunshu (in Japanese) (1984), pp. 73-76.
(23) Watanabe, H. et al., “Torukukonbata Naibu Nagare no Kaiseki Dai 3 hou”, Heisei 4 nen Shunki Yukuatsu Kouenkai Ronbunshu (in Japanese) (1992), pp. 145-148.
(24) Yamada, M. et al., “Pressure Distribution in Turbine Flow Passage of Torque Convertor”, Trans. JSME B (in Japanese), Vol. 64, No. 617 (1998), pp. 136-141.
(25) Watanabe, H. et al., “Flow Visualization and Measurement in the Stator of a Torque Converter”, Proc. JSAE Ann. Congr. (in Japanese), No. 945 (1994), pp. 137-140.
(26) Watanabe, H. et al, “Flow Visualization and Measurement or Torque Converter Stator Blades Using a Laser Sheet Lighting Method and a Laser Doppler Velocimeter”, SAE Tech. Pap. Ser., No. 970680 (1997).
(27) Watanabe, H. et al., “Flow Visualization and Measurement in the Stator of a Torque Converter”, R&D Rev. Toyota CRDL (in Japanese), Vol. 34, No. 1 (1999), pp. 57-66.
(28) Abe, K. et al., “Three-dimensional Simulation of the Flow in a Torque Converter”, Proc. JSAE Ann. Congr. (in Japanese), No. 902-1 (1990), pp. 293-296.
(29) Abe, K. et al., “Three-dimensional Simulation of the Flow in a Torque Converter”, SAE Tech. Pap. Ser., No. 910800 (1991).
(30) Yamada, M. et al., “Numerical Analysis of the Torque Converter Stator Blade by the Boundary Element Method”, SAE Tech. Pap. Ser., No. 921692 (1992).
(31) Kondoh, Y. et al., “Design Method Using Inverse Problem for a Torque Convertor Stator Blade”, Proc. JSME Fluids Eng. Div. (in Japanese), Vol. 1995 (1995), pp. 53-54.
(32) Osawa, M., “Jidosha eno Seigyoriron Tekiyou no Jissai – Enjin, Jidouhensokuki no Seigyo wo Chushin to shite”, Sys., Control Inf. (in Japanese), Vol. 40, No. 11 (1996), pp. 485-494.
(33) Kono, K. et al., “Lock-up Clutch Slip Control for Torque Convertors”, J. Soc. Autom. Eng. Jpn. (in Japanese), Vol. 50, No. 9 (1996), pp. 89-94.
(34) Osawa, M. et al., “Application of H∞ Control Design to Slip Control System for Torque Converter Clutch”, Adv. Autom. Control (1995), pp. 150-155.
(35) Osawa, M., “Jidosha ni okeru Keisoku to Seigyo Yomoyama banashi”, Special Lecture of SICE Chubu Branch, Nagoya Inst. Tech., Jan. 24, 2015 (in Japanese).
(36) Hibino, R. et al., “Robust and Simplified Design of Slip Control System for Torque Convertor Lock-up Clutch”, Ttans. ASME G, J. Dyn. Syst. Meas. Control, Vol. 131, No. 1 (2008), No. 011008.
(37) Yoshida, H. et al., “Real Time Estimation of Driver’s
Intention and Environment Based on Operational Signals”, R&D Rev. Toyota CRDL (in Japanese), Vol. 33, No. 3 (1998), p. 113.
(38) Hayakawa, K. et al., “Real Time Estimation of Driver’s Intention and Environment Based on Operational Signal”, Proc. SICE Ann. Conf. (in Japanese) (1997), pp. 615-616.
(39) Murahashi, T. et al., “Development of Engine Brake Control System for Commercial Vehicle with 6 Speed Automatic Transmission”, SAE Tech. Pap. Ser., No. 2006-01-1674 (2006).
(40) Hayakawa, K. et al., “On-board Estimation of Vehicle Weight by Optimizing Siglnal Processing”, SAE Tech. Pap. Ser., No. 2006-01-1489 (2006).
(41) Hibino, R. et al., “Robust Design Method for Calibration of Automatic Transmission Shift Control System”, JSAE Trans. (in Japanese), Vol. 44, No. 3 (2013), pp. 815-821.
(42) Hibino, R. et al., “Clarification of Transient Characteristics by Coupled Analysis of Powertrains and Vehicles”, SAE Int. J. Passeng. Cars – Mech. Syst.,
No. 9, No. 1 (2016), pp. 216-226.(43) Harshman, R. A., “Foundations of the PARAFAC
Procedure: Models and Conditions for an ‘Explanatory’ Multimodal Factor Analysis”, UCLA Working Papers in Phonetics (1970), 84p.
(44) Sanda, S., “Frictional Characteristics of a Wet Clutch Composed of Paper-based Facing during Running-in Process”, J. Jpn. Soc. Tribologists (in Japanese), Vol. 39, No. 12 (1994), pp. 1047-1053.
(45) Sanda, S. et al., “Mechanism of Friction of Wet Clutch with Paper Based Facings” Proc. Int. Tribology Conf. Yokohama (1995), p. 432.
(46) Tohyama, M. et al., “Anti-shudder Mechanism of ATF Addities (Part 1)”, J. Jpn. Soc. Tribologists (in Japanese), Vol. 47, No. 7 (2002), pp. 565-574.
(47) Tohyama, M. et al., “Anti-shudder Mechanism of ATF Addities (Part 2)”, J. Jpn. Soc. Tribologists (in Japanese), Vol. 47, No. 7 (2002), pp. 575-581.
(48) Nakano, M. et al., “Development of a Large Torque Capacity Half-toroidal CVT”, SAE Tech. Pap. Ser., No. 2000-01-0825 (2000).
(49) Evans, C. R. and Johnson, K. L., “The Rheological Properties of Elastohydrodynamic Lubricants”, Proc. Inst. Mech. Eng. Part C, Vol. 200, No. 5 (1986), pp. 303-312.
(50) Sanda, S. and Hayakawa, K., “Traction Drive System and Its Characteristics as Power Transmission”, R&D Rev. Toyota CRDL, Vol. 40, No. 3 (2005), pp. 30-39.
(51) Washizu, H. et al., “Analysis of Traction Properties of Fluids Using Molecular Dynamics Simulations (Part 1)”, J. Jpn. Soc. Tribologists (in Japanese), Vol. 51, No. 12 (2006), pp. 885-891.
(52) Washizu, H. et al., “Analysis of Traction Properties of Fluids Using Molecular Dynamics Simulations (Part 2)”, J. Jpn. Soc. Tribologists (in Japanese), Vol. 51, No. 12 (2006), pp. 892-899.

http://www.tytlabs.com/review/
95
© Toyota Central R&D Labs., Inc. 2016
R&D Review of Toyota CRDL, Vol.47 No.3 (2016) 61-97
Error”, FISITA Tech. Pap. No. 945029 (1994).(70) Yoshikawa, K. et al., “Measurement of Helical Gear
Transmission Error and Improvement of Analytical Method”, Trans. JSME C (in Japanese), Vol. 63, No. 609 (1997), pp. 1775-1782.
(71) Tani, H. et al., “Transmission Error of Three Axes Gear System”, Trans. JSME C (in Japanese), Vol. 65, No. 630 (1999), pp. 465-470.
(72) Honda, S., “Basic Theory on Tooth Contact and Dynamics Loads of Gears (1st Report)” (in Japanese),
Trans. JSME C, Vol. 62, No. 600 (1996), pp. 3262-3268.(73) Honda, S., Shin Hagataron to sono Ouyou
(in Japanese) (2014), 208p., SOEISHA.(74) Suzuki, A. et al., “Influence of Bearing Clearance on
Load Sharing in Planetary Gears”, ASME Int. Design Eng. Tech. Conf. and Comput. Inf. Eng. Conf. (2011), Pap. No. DETC2011-47622, pp. 259-265.
(75) Aihara, T. et al., “Load Analysis of Planetary Gears under Operating Conditions”, Trans. Soc. Autom. Eng. Jpn. (in Japanese), Vol. 43, No. 6 (2012), pp. 1281-1286.
(76) Tani, H. et al., “Reduction of Cranking Noise during Engine Startup”, Trans. Soc. Autom. Eng. Jpn. (in Japanese), Vol. 44, No. 5 (2013), pp. 865-870.
(77) Aoyama, T. et al., “Calculation Method for Gear Noise Variation Depending on Some Clearances”, Proc. JSME Symp. Motion Power Transm. (2013), pp. 125-129.
(78) Suzuki, A. et al., “Reduction of Planetary Gear Vibration by Multibody Dynamics Considering Bearing Clearance”, Proc. JSME Symp. Motion Power Transm. (2013), pp. 337-340.
Fig. 1 Reprinted from Yuatsu Kougaku (in Japanese) (1968), pp. 198-228, Ishihara, T. ed., © 1968 Asakura Publishing, with permission from Asakura Publishing Co., Ltd.
Figs. 2-5 Reprinted from Trans. JSME (in Japanese), Vol. 40, No. 336 (1974), pp. 2224-2235, Kobayashi, A., Yuatsushiki Zen’iki Mudan Hensokuki, © 1974 JSME, with permission from The Japan Society of Mechanical Engineers.
Figs. 8-10 Reprinted from SAE Tech. Pap. Ser., No. 891307 (1989), Imai, K. et al., Pressure Pulsation Transfer in Clutch Hydraulic Systems, © 1989 SAE International, with permission from SAE International.
Figs. 11 and 13Reprinted from R&D Rev. Toyota CRDL, Vol. 36, No. 3(2001), p. 54, Nishizawa, H., Design Technique for Suppressing Vibration in Hydraulic Control System, © 2001 TOYOTA CRDL, INC.
(53) Washizu, H. and Ohmori, T., “Analysis of Traction Properties Using Molecular Dynamics Simulations”, J. Jpn. Soc. Tribologists (in Japanese), Vol. 52, No. 3 (2007), pp. 180-185.
(54) Ohmori, T., “Bunshi, Genshi no Shiten karano Toraibomateriaru Sekkei”, JSME Tokai Shibu Souritsu 60 Shunen Kinenshi (in Japanese) (2012).
(55) Morimoto, Y., Mudanhensokuki CVT Nyumon (in Japanese) (2004), pp. 10-30, Grand Prix BOOK PUBLISHING.
(56) Osawa, M. et.al, “Special Issue: Basic Analysis towards Further Development of Continuously Variable Transmission”, R&D Review of Toyota CRDL, Vol. 40, No. 3 (2005), pp. 1-29.
(57) Tani, H. et al., “Measurement of the Behavior or a Metal V-belt for CVTs”, R&D Review of Toyota CRDL, Vol. 45, No. 3 (2014), pp. 23-30.
(58) Osawa, M. and Tarutani, I., “Kikai shiki Mudan Hensoku Kikou no Toraibo Sekkei”, Tribology Design Manual, Ed. by Nitanai, A. (in Japanese) (2015), pp. 329-338, TECHNO SYSTEM.
(59) Kimura, M. et al., “In-situ Measurement of High-speed Moving Parts with an Ultra-small Sized Data Logger”, Proc. Sensing Forum SCIE (in Japanese), No. 28 (2011), pp. 153-158.
(60) Yamaguchi, H. et al., “Measurement and Estimation Technologies for the Experimental Analysis of Metal V-belt Type CVTs”, R&D Rev. Toyota CRDL, Vol. 40, No. 3 (2005), pp. 21-29.
(61) Tarutani, I. et al., “Analysis of the Power Transmission Characteristics of a Metal V-belt Type CVT”, R&D Rev. Toyota CRDL, Vol. 40, No. 3 (2005), pp. 6-13.
(62) Tarutani, I. et al., “Ring Behavior Analysis of Metal CVT Belt”, Proc. JSAE Ann. Congr. (in Japanese) (2016), No. 20165002.
(63) Nishizawa, H. et al., “Friction Characteristics Analysis for Clamping Force Setup in Metal V-belt Type CVT”, SAE Tech. Pap. Ser., No. 2005-01-1462 (2005).(64) Nishizawa, H. et al., “Friction Characteristics
Analysis for Clamping Force Setup in Metal V-belt Type CVTs”, R&D Rev. Toyota CRDL (in Japanese), Vol. 40, No. 3 (2005), pp. 14-20.
(65) Yamaguchi, H. et al., “Development of Belt μ Saturation Detection Method for V-belt Type CVT”, SAE Tech. Pap. Ser., No. 2004-01-0479 (2004).
(66) Mizuno, Y. et al., “Study of Planetary Roller Type Traction Drive for High Speed Motor”, Proc. Symp. Motion and Power Transm. (in Japanese) (2013), pp. 39-42.
(67) Watanabe, T. et al., “High Efficiency Electromagnetic Torque Converter for Hybrid Electric Vehicles”, SAE Tech. Pap. Ser., No. 2016-01-1162 (2016).
(68) Asami, S. et al., “New Slip Ring System for Electromagnetic Coupling in HEV Driveline”, SAE Tech. Pap. Ser., No. 2016-01-1222 (2016).
(69) Ueda, Y. et al., “Analysis of Gear Transmission

http://www.tytlabs.com/review/
96
© Toyota Central R&D Labs., Inc. 2016
R&D Review of Toyota CRDL, Vol.47 No.3 (2016) 61-97
Control System for Commercial Vehicle with 6 Speed Automatic Transmission, © 2006 SAE International, with permission from SAE International.
Figs. 25-26 Reprinted from SAE Tech. Pap. Ser., No. 2006-01-1489 (2006), Hayakawa, K. et al., On-Board Estimation of Vehicle Weight by Optimizing Signal Processing, © 2006 SAE International, with permission from SAE International.
Figs. 28-30 Reprinted from JSAE Trans. (in Japanese), Vol. 44, No. 3(2013), pp. 815-821, Hibino, R. et al., Robust Design Method for Calibration of Automatic Transmisson Shift Control System, © 2013 JSAE, with permission from Society of Automotive Engineers of Japan.
Figs. 31-34Reprinted from SAE Int. J. Passeng. Cars – Mech. Syst., Vol. 9, No. 1 (2016), pp. 216-226, Hibino R. et al., Clarification of Transient Characteristics by Coupled Analysis of Powertrains and Vehicles, © 2016 SAE International, with permission from SAE International.
Fig. 35Reprinted from J. Jpn. Soc. Tribologists (in Japanese), Vol. 39, No. 12 (1994), pp. 1047-1053, Sanda, S., FrictionalCharacteristics of a Wet Clutch Composed of Paper-based Facing during Running-in Process, © 1994 JAST, with permission from Japanese Society of Tribologists.
Fig. 36Reprinted from Proc. Int. Trib. Conf., Yokohama (1995), p. 432, Sanda, S. et al., Mechanism of Friction of Wet Clutch with Paper Based Facings (Part 1), Observation andModeling of Facing Surface during Engagement, © 1995JAST, with permission from Japanese Society of Tribologists.
Fig. 37Reprinted from J. Jpn. Soc. Tribologists (in Japanese), Vol. 47, No. 7 (2002), pp. 565-574, Tohyama, M., Anti-shudder Mechanism of ATF Additives (Part 1), © 2002 JAST, with permission from Japanese Society of Tribologists.
Figs. 39-40Reprinted from J. Jpn. Soc. Tribologists (in Japanese), Vol. 47, No. 7 (2002), pp. 575-581, Tohyama, M., Anti-shudder Mechanism of ATF Additives (Part 2), © 2002 JAST, with permission from Japanese Society of Tribologists.
Figs. 42-43 Reprinted from R&D Rev. Toyota CRDL, Vol. 40, No. 3 (2005), pp. 30-38, Sanda, S. and Hayakawa, K., Traction Drive System and its Characteristics as Power
Fig. 14 Reprinted from Doctoral Thesis (in Japanese), Yamada, M.,Sutetayoku Keijou no Saitekika ni yoru Ryuutai Toruku Konbata no Seinou Koujou ni kansuru Kenkyu, © 1997 Yamada, M., with permission from Masatoshi Yamada.
Fig. 15 Reprinted from Proc. 1994 JSAE Ann. Congr. (Autumn) (in Japanese), No. 945 (1994), pp. 137-140, Watanabe, H.,Flow Visualization and Measurement in the Stator of a Torque Converter, © 1994 JSAE, with permission from Society of Automotive Engineers of Japan.
Fig. 16 Reprinted from SAE Tech. Pap. Ser., No. 970680 (1997), Watanabe, H. et al., Flow Visualization and Measurement of Torque Converter Stator Blades Using a Laser Sheet Lighting Method and a Laser Doppler Velocimeter, © 1997 SAE International, with permission from SAE International.
Fig. 18 Reprinted from Proc. JSME Fluids Eng. Conf. 1994 (in Japanese), Vol. 1995 (1995), pp. 53-54, Kondoh, Y. et al., Design Method Using Inverse Problem for a Torque Converter Stator Blade, © 1995 JSME, with permission from The Japan Society of Mechanical Engineers.
Figs. 19 and 21 Reprinted from Adv. Automot. Control 1995, pp.150-155, Osawa, M. et al., Application of H∞ Control Design to Slip Control System For Torque Converter Clutch, © 1995 Elsevier, with permission from Elsevier.
Fig. 20 Reprinted from J. Dyn. Sys., Meas., Control, Vol. 131,No. 1 (2008), 011008, Hibino, R. et al., Robust and SimplifiedDesign of Slip Control System for Torque Converter Lock-up Clutch, © 2009 ASME, with permission from The American Society of Mechanical Engineers.
Fig. 22 Reprinted from Proc. 36th SICE Ann. Conf. : Int. Sess. Pap.,302A-4 (1997), pp. 615-616, Hayakawa, K. et al., Real Time Estimation of Driver’s Intention and Environment Based on Operational Signal, © 1997 SICE, with permissionfrom The Society of Instrument and Control Engineers.
Fig. 23 Reprinted from R&D Rev. Toyota CRDL, Vol. 33, No. 3(1998), p. 54, Yoshida, H., Real Time Estimation of Driver’s Intention and Environment Based on Operational Signals, © 1998 TOYOTA CRDL, INC.
Fig. 24 Reprinted from SAE Tech. Pap. Ser., No. 2006-01-1674 (2006), Murahashi, T. et al., Development of Engine Brake

http://www.tytlabs.com/review/
97
© Toyota Central R&D Labs., Inc. 2016
R&D Review of Toyota CRDL, Vol.47 No.3 (2016) 61-97
Metal V-belt Type CVTs, © 2005 TOYOTA CRDL, INC.
Fig. 57 Reprinted from SAE Tech. Pap. Ser., No. 2004-01-0479 (2004), Yamaguchi, H. et al., Development of Belt μ Saturation Detection Method for V-belt Type CVT, © 2004 SAE International, with permission from SAE International.
Figs. 58-60 Reprinted from JSME Symp. Motion Power Trans. (in Japanese) (2013), pp. 39-42, Mizuno, Y. et al., Study of Planetary Roller Type Traction Drive for High Speed Motor, © 2013 JSME, with permission from The Japan Society of Mechanical Engineers.
Figs. 61-63 Reprinted from SAE Tech. Pap. Ser., No. 2016-01-1162(2016), Watanabe, T. et al., High Efficiency Electromagnetic Torque Converter for Hybrid Electric Vehicles, © 2016 SAE International, with permission from SAE International.
Fig.64-65 Reprinted from SAE Tech. Pap. Ser., No. 2016-01-1222 (2016), Asami, S. et al., New Slip Ring System for Electromagnetic Coupling in HEV Driveline, © 2016 SAE International, with permission from SAE International.
Transmission, © 2005 TOYOTA CRDL, INC.
Figs. 44-45Reprinted from J. Jpn. Soc. Tribologists (in Japanese), Vol. 51, No. 12 (2006), pp. 892-899, Washizu, H. et al.,Analysis of Traction Properties of Fluids Using Molecular Dynamics Simulations (Part 2) : Analysis of Molecular Mechanism of Traction Focusing on Intra- and Intermolecular Interaction, © 2006 JAST, with permission from Japanese Society of Tribologists.
Fig. 46Reprinted from J. Jpn. Soc. Tribologists (in Japanese), Vol. 52, No. 3 (2007), pp. 180-185, Washizu, H. and Ohmori, T., Analysis of Traction Properties Using Molecular Dynamics Simulations, © 2007 JAST, with permission from Japanese Society of Tribologists.
Figs. 47, 50 and 55Reprinted from R&D Rev. Toyota CRDL, Vol. 40,No. 3 (2005), pp. 21-29, Yamaguchi, H. et al., Measurement and Estimation Technologies for the Experimental Analysis of Metal V-belt Type CVTs, © 2005 TOYOTA CRDL, INC.
Figs. 48-49 Reprinted from Dai 28kai Senshingu Foramu Shiryo (in Japanese), pp. 153-158 (2011), Kimura, M. et al., In-situ Measurement of High-speed Moving Parts with an Ultra-small Sized Data Logger, © 2011 SICE, with permission from The Society of Instrument and Control Engineers.
Figs. 51-52 Reprinted from Proc. Int. Congr. Contin. Var. Hybrid Transm., Yokohama (2007), No. 20074566 , pp. 141-145, Tani, H. et al., A Study on the Behavior of a Metal V-belt for CVTs, © 2007 JSAE, with permission from Society of Automotive Engineers of Japan.
Fig. 53 Reprinted from R&D Rev. Toyota CRDL, Vol. 40, No. 3 (2005), pp. 6-13, Tarutani, I. et al., Analysis of the Power Transmission Characteristics of a Metal V-belt Type CVT, © 2005 TOYOTA CRDL, INC.
Fig. 54 Reprinted from Prepr. Mtg. Soc. Automot. Eng. Jpn., No. 20165002 (2016), pp. 5-9, Tarutani, I. et al., Ring Behavior Analysis of Metal CVT Belt, © 2016 JSAE, with permission from Society of Automotive Engineers of Japan.
Fig. 56 Reprinted from R&D Rev. Toyota CRDL, Vol. 40, No. 3 (2005), pp. 14-20, Nishizawa, H. et al., Friction Characteristics Analysis for Clamping Force Setup in
Masataka Osawa Research Field: - Sensing and Logging Micro-device for Powertrain Unit - Drivetrain and Powertrain Technology Academic Societies: - Society of Automotive Engineers of Japan - The Society of Instrument and Control Engineers - The Japan Society of Mechanical Engineers Awards: - JSAE Award for Outstanding Technology Development, 1996 - SICE Award for Outstanding Technology and Takeda Prize, 2004 - SICE Award for Outstanding Technology, 2012