Embed Size (px)
Citation preview
www.pwc.co.uk
Research into modern pay systems
Office of Manpower Economics
Office of Manpower Economics
November 2016
Research into modern pay systems
Office of Manpower Economics PwC Contents
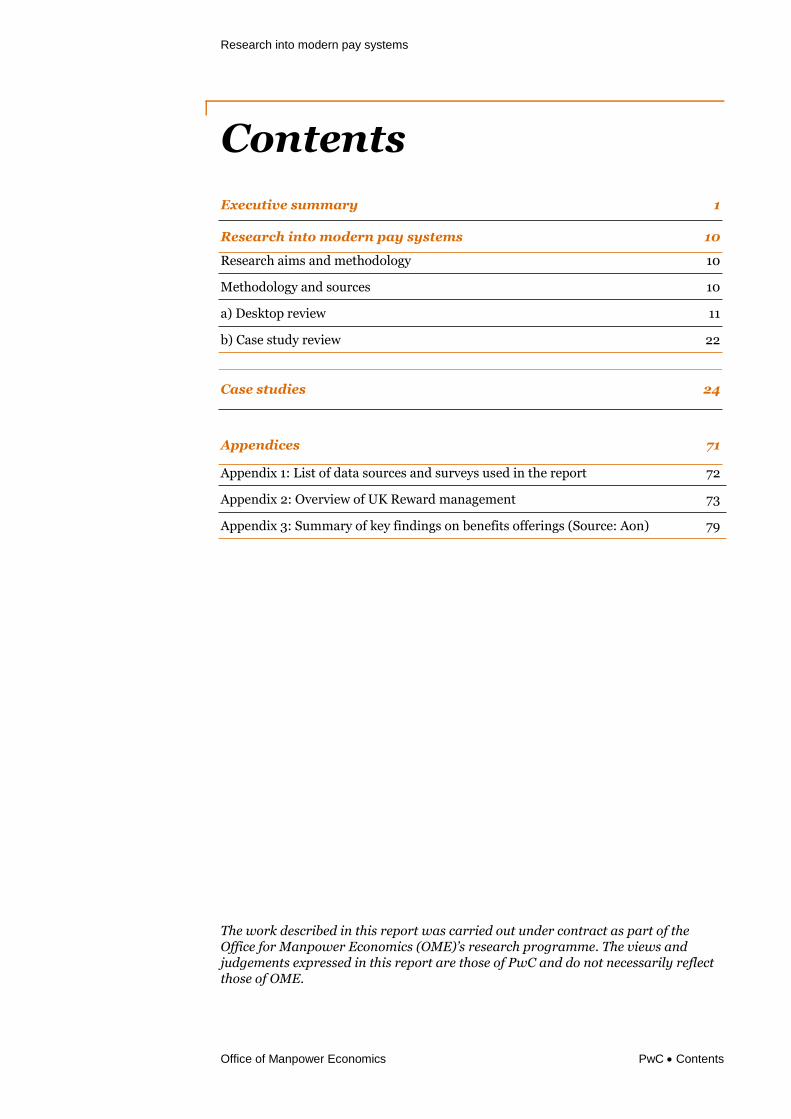
Executive summary 1
Research into modern pay systems 10
Research aims and methodology 10
Methodology and sources 10
a) Desktop review 11
b) Case study review 22
Case studies 24
Appendices 71
Appendix 1: List of data sources and surveys used in the report 72
Appendix 2: Overview of UK Reward management 73
Appendix 3: Summary of key findings on benefits offerings (Source: Aon) 79
The work described in this report was carried out under contract as part of the Office for Manpower Economics (OME)’s research programme. The views and judgements expressed in this report are those of PwC and do not necessarily reflect those of OME.
Contents
Research into modern pay systems
Office of Manpower Economics PwC 1
This paper provides an analysis of the main changes that have taken place in the reward landscape since the last
UK recession (circa 2007), and aims to describe the characteristics of a “modern pay system” in UK
organisations, including examples of innovative practice. It is intended to broaden and deepen Pay Review Body
understanding of pay in the private and not-for-profit sectors, drawing out insights relevant to the design of
public sector pay systems. Findings are based on desktop research (a literature review) and cross-industry case
studies representing the diversity of the UK workforce.
The literature review identifies recent changes in employer practice in a range of areas including the different
types of pay systems in use across the economy. It places the case studies in context and frames recent trends
and changes in emphasis.
The case studies draw out insights above and beyond the statistical trends captured by the literature review. The
case studies were conducted independently of the literature review and are intended to capture a range of
sectors and circumstances.
In aggregate, our research found that:
Since 2007, the design of basic pay structures has remained more or less consistent, with individual job rates, broad banding and narrow banding all common. The relative prevalence of these approaches varies significantly by sector, with public sector organisations most likely to utilise pay spines and private sector organisations likely to rely on job specific rates or bands.
The majority of organisations operate more than one pay structure, typically based on job level (executives, management, clerical etc.).
Pay progression arrangements tend to be somewhat opaque – but individual performance and affordability are the most prominent inputs.
A quarter of the case study companies have recently attempted to cascade performance-linked variable pay further down their organisation. Over two thirds have recently made or are planning to make changes to their performance management processes.
Although a number of the case study companies were concerned about equal pay risk related to the incoming gender pay gap disclosure requirements, they had no immediate plans to change their existing approach.
Some of the organisations cited that they were making reward-specific changes linked to the preferences of the “millennial” generation – but there was mixed practice regarding actual responses.
Innovative benefits (e.g. such as an on-site games room or staff cinema) are becoming part of the reward landscape, primarily for large companies and the technology sector.
A more detailed summary of the findings, organised across three key areas (1. Pay Structures and Spend; 2. Pay
and Performance; and 3. Beyond Pay: The Wider Employment Deal), is set out on the following pages.
Executive summary

Research into modern pay systems
Office of Manpower Economics PwC 2
1. Pay structures and spend
In considering basic pay structures in the UK we reviewed three major annual surveys1. The surveys reached
differing conclusions as to which structures were most dominant, most likely for sampling reasons (e.g. sector
and size makeup of the organisations surveyed).
i) Pay system design
Literature review findings:
According to the CIPD, pay systems based on narrow banding have increased in popularity (see Chart 1 below),
which may reflect a perception that they facilitate a greater level of cost control. Broad bands can result in more
rapid increases in pay costs (given the greater scope for pay progression within them), which may explain the
broadly static trend in their use.
Chart 1: Pay structures 2008-2015 (Source: CIPD)
XPertHR find that practice varies significantly by sector, with public sector organisations most likely to utilise
pay spines, while private sector organisations tend to rely on job specific rates or bands.
Case study insights:
The private sector case studies support this, with broad banding the most prevalent approach for managerial
staff (used by around ¾ of the sample), and spot rates or narrow bands more likely to be applied to roles below
management, reflecting the more clearly defined nature of these types of role. Broad bands were often
accompanied by the use of career families, whereby highly specialist roles (often in technology or engineering)
are eligible for higher levels of pay. This model allows organisations to operate a robust market facing structure
while retaining a degree of flexibility.
1 These were: the annual surveys on Reward Management conducted by the Chartered Institute of Personnel
Development (CIPD 2008 to 2014/15); the annual Management Benchmark Pay Report (MBPR) produced by
Incomes Data Services (IDS 2007 and 2014), and XpertHR’s Pay and Grading Structures survey 2015.
0%
10%
20%
30%
40%
50%
60%
2008 2009 2010 2011 2012 2013 2014
Org
an
isa
tio
ns
citi
ng
Individual pay rates/ranges/spot salaries Broad bands
Job families/career grades Pay spines
Narrow graded
Research into modern pay systems
Office of Manpower Economics PwC 3
Perhaps unsurprisingly, XpertHR found that the majority of organisations operated more than one pay
structure (i.e. for different populations).
PwC’s view:
We find that since 2007, the use of alternative designs of base pay structures has remained more or less
consistent, despite some movements in the relative prevalence of the available approaches. Individual job rates,
broad banding and narrow banding all remain commonly used, though as mentioned above the prevalence of
each of these approaches continues to vary markedly between industries with differing levels of specialised
staff, and between the private vs public sector.
ii) Basic pay setting and pay review factors
Literature review findings:
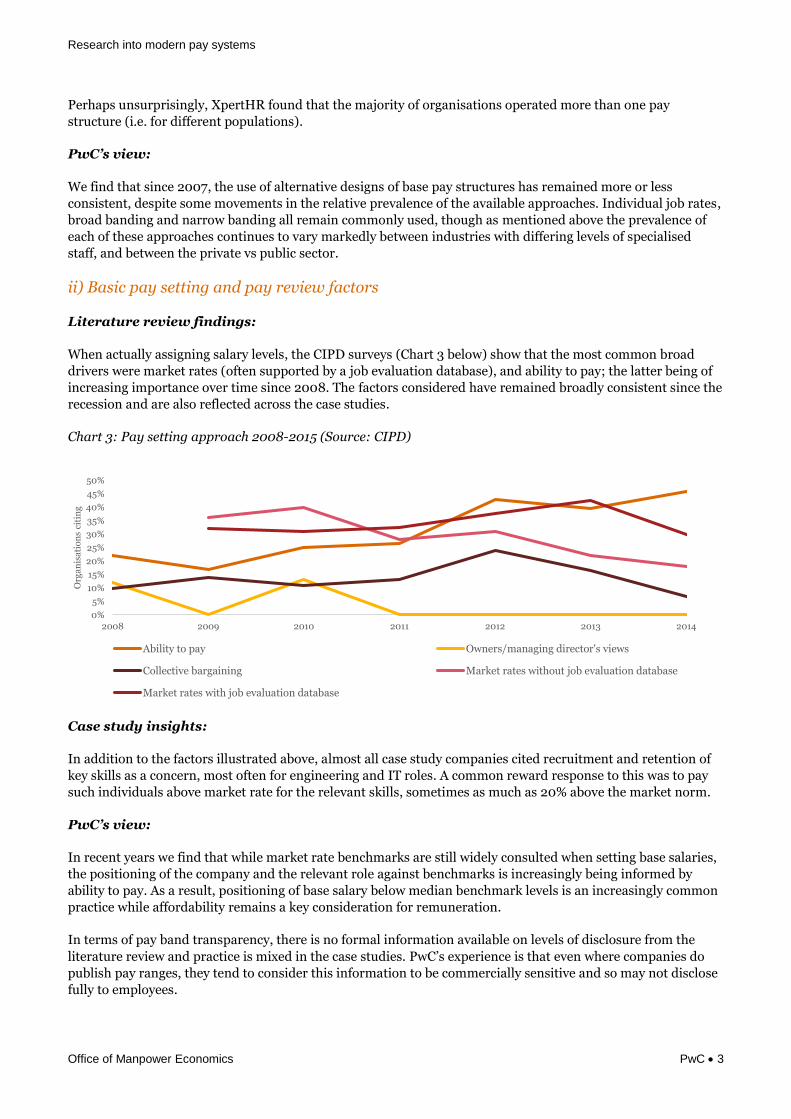
When actually assigning salary levels, the CIPD surveys (Chart 3 below) show that the most common broad
drivers were market rates (often supported by a job evaluation database), and ability to pay; the latter being of
increasing importance over time since 2008. The factors considered have remained broadly consistent since the
recession and are also reflected across the case studies.
Chart 3: Pay setting approach 2008-2015 (Source: CIPD)
Case study insights:
In addition to the factors illustrated above, almost all case study companies cited recruitment and retention of
key skills as a concern, most often for engineering and IT roles. A common reward response to this was to pay
such individuals above market rate for the relevant skills, sometimes as much as 20% above the market norm.
PwC’s view:
In recent years we find that while market rate benchmarks are still widely consulted when setting base salaries,
the positioning of the company and the relevant role against benchmarks is increasingly being informed by
ability to pay. As a result, positioning of base salary below median benchmark levels is an increasingly common
practice while affordability remains a key consideration for remuneration.
In terms of pay band transparency, there is no formal information available on levels of disclosure from the
literature review and practice is mixed in the case studies. PwC’s experience is that even where companies do
publish pay ranges, they tend to consider this information to be commercially sensitive and so may not disclose
fully to employees.
0%
5%
10%
15%
20%
25%
30%
35%
40%
45%
50%
2008 2009 2010 2011 2012 2013 2014
Org
an
isa
tio
ns
citi
ng
Ability to pay Owners/managing director's views
Collective bargaining Market rates without job evaluation database
Market rates with job evaluation database
Research into modern pay systems
Office of Manpower Economics PwC 4
iii) Pay progression
Literature review findings:
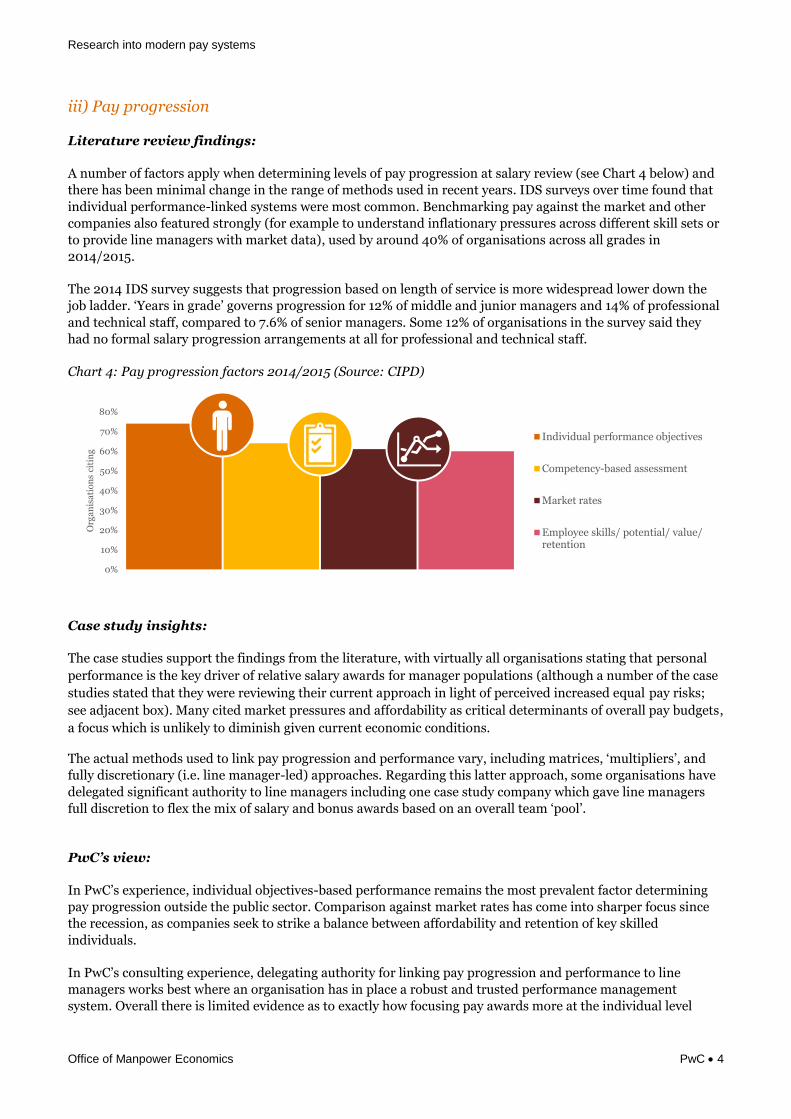
A number of factors apply when determining levels of pay progression at salary review (see Chart 4 below) and
there has been minimal change in the range of methods used in recent years. IDS surveys over time found that
individual performance-linked systems were most common. Benchmarking pay against the market and other
companies also featured strongly (for example to understand inflationary pressures across different skill sets or
to provide line managers with market data), used by around 40% of organisations across all grades in
2014/2015.
The 2014 IDS survey suggests that progression based on length of service is more widespread lower down the
job ladder. ‘Years in grade’ governs progression for 12% of middle and junior managers and 14% of professional
and technical staff, compared to 7.6% of senior managers. Some 12% of organisations in the survey said they
had no formal salary progression arrangements at all for professional and technical staff.
Chart 4: Pay progression factors 2014/2015 (Source: CIPD)
Case study insights:
The case studies support the findings from the literature, with virtually all organisations stating that personal
performance is the key driver of relative salary awards for manager populations (although a number of the case
studies stated that they were reviewing their current approach in light of perceived increased equal pay risks;
see adjacent box). Many cited market pressures and affordability as critical determinants of overall pay budgets,
a focus which is unlikely to diminish given current economic conditions.
The actual methods used to link pay progression and performance vary, including matrices, ‘multipliers’, and
fully discretionary (i.e. line manager-led) approaches. Regarding this latter approach, some organisations have
delegated significant authority to line managers including one case study company which gave line managers
full discretion to flex the mix of salary and bonus awards based on an overall team ‘pool’.
PwC’s view:
In PwC’s experience, individual objectives-based performance remains the most prevalent factor determining
pay progression outside the public sector. Comparison against market rates has come into sharper focus since
the recession, as companies seek to strike a balance between affordability and retention of key skilled
individuals.
In PwC’s consulting experience, delegating authority for linking pay progression and performance to line
managers works best where an organisation has in place a robust and trusted performance management
system. Overall there is limited evidence as to exactly how focusing pay awards more at the individual level
0%
10%
20%
30%
40%
50%
60%
70%
80%
Org
an
isa
tio
ns
citi
ng
Individual performance objectives
Competency-based assessment
Market rates
Employee skills/ potential/ value/retention

Research into modern pay systems
Office of Manpower Economics PwC 5
actually impacts retention and motivation of the wider workforce. However, PwC studies have shown that
younger demographics prioritise feedback and appraisal. While ‘fairness’ and ‘equality’ were cited by a number
of case study organisations as being important principles of their approach, interpretations of these terms are
nuanced and can apply equally to both highly individual and collectively focussed models.
2. Pay and performancei) Variable pay
Literature review findings:
The CIPD annual surveys (Chart 5, below) show that individual performance-related bonus schemes remain popular, while team based results no longer play a significant role in determining variable pay.
Chart 5: Inputs to variable pay decisions 2008-2014 (Source: CIPD)
Case study insights:
In the case study organisations, bonus approaches typically reflect pay progression models, i.e. management
roles are more likely to have an individual performance link of some kind and below-manager roles are more
likely to only have a corporate performance link. In virtually all cases, ratings play a role in bonus outcomes.
The methods used to determine bonus outcomes typically involve either a formulaic link to ratings or a degree
of management discretion (supported by a performance rating).
PwC’s view:
In PwC’s experience, one major development since the recession has been the greater emphasis placed on
variable pay systems (generally linked to employee or company performance), broadly speaking with the aim of
using the pay budget as efficiently as possible to encourage positive and sustainable staff behaviours. Overall
there is little evidence of any fundamental structural shift in the range of approaches. However, PwC is aware
through its consulting that some companies have recently increased the size of awards for very high performers,
based on a hypothesis that these individuals add disproportionate value to the business. Evidence for this
hypothesis is mixed vs the potential negative impacts of internal pay ‘inequality’.
0%
10%
20%
30%
40%
50%
60%
70%
2008 2009 2010 2011 2012 2013 2014
Org
an
isa
tio
ns
citi
ng
Individual performance Business results
Business and individual (Combined approach) Merit pay rise
Team based results Sales commission
Note: “Business results” did not appear as an alternative after 2010.
Research into modern pay systems
Office of Manpower Economics PwC 6
ii) Performance management
Literature review findings:
Our literature review and case studies suggest that the structure of the typical UK performance management
process is still largely built around personal objective setting and end of year assessment.
Case study insights:
From a forward-looking perspective, there is a very clear message from the case studies that performance
management is high up on the HR agenda.
Virtually every case study company questioned cited changes underway, most commonly:
Process simplification – e.g. fewer, simpler objectives and increased local discretion over performance
outcomes.
Greater focus on meaningful conversations – e.g. separation of reward and performance conversations
and training for line managers on having good conversations.
Improvements to technology – e.g. instant feedback tools and performance dashboards.
PwC’s view:
A 2015 PwC survey found that many employers view performance management as cumbersome, overly-
complex and bureaucratic and that there is a desire for simplification. Although these employers acknowledged
that the end of year performance review is useful, they were concerned about the time taken to conduct
performance reviews throughout the year and expressed doubts as to whether there is a correlation between the
formal process and commercial outputs.
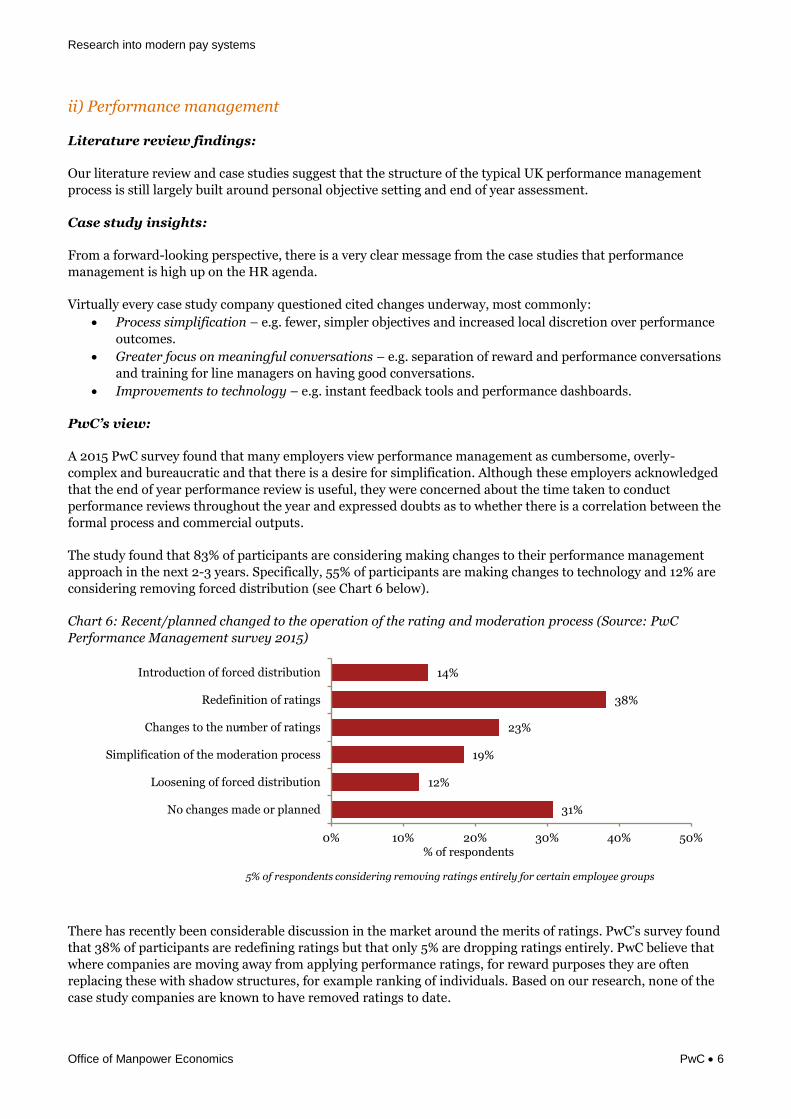
The study found that 83% of participants are considering making changes to their performance management
approach in the next 2-3 years. Specifically, 55% of participants are making changes to technology and 12% are
considering removing forced distribution (see Chart 6 below).
Chart 6: Recent/planned changed to the operation of the rating and moderation process (Source: PwC
Performance Management survey 2015)
There has recently been considerable discussion in the market around the merits of ratings. PwC’s survey found
that 38% of participants are redefining ratings but that only 5% are dropping ratings entirely. PwC believe that
where companies are moving away from applying performance ratings, for reward purposes they are often
replacing these with shadow structures, for example ranking of individuals. Based on our research, none of the
case study companies are known to have removed ratings to date.
14%
38%
23%
19%
12%
31%
0% 10% 20% 30% 40% 50%
Introduction of forced distribution
Redefinition of ratings
Changes to the number of ratings
Simplification of the moderation process
Loosening of forced distribution
No changes made or planned
% of respondents
1
5% of respondents considering removing ratings entirely for certain employee groups

Research into modern pay systems
Office of Manpower Economics PwC 7
The other factor which is evident from the research is that many organisations do not apply performance
related pay to below management populations. This is likely to reflect a view that performance differentiation at
these levels (where the scope to personally impact overall business outputs is low) is an inefficient use of time.
Organisations may however apply a performance hurdle under which no pay increase or bonus is awarded.
3. Beyond pay: the wider employment deali) Reward strategies, employee engagement and communication
Literature review findings
In recent years, recovery in the UK economy has brought the “war on talent” to the top of the corporate agenda.
A Kings College London survey in 2013 identified 37% of companies reporting skills shortages in key areas of
their businesses. Buoyancy in the labour market means that attracting and retaining talent while also delivering
value for money from reward spend - and in many cases attempting to reduce costs - can be challenging.
Case study insights:
In the face of these challenges, our case study research shows that organisations are working hard to understand and address generational differences and tensions, using tools such as preference analytics and employee focus groups to better segment the workforce, with a particular focus on the needs of the so called ‘millennial’ generation. A clear outcome of this has been a shift in emphasis to the wider employee deal and overall ‘experience’ of work. For example, Case Study 2 stated that the company is focussing on career progression opportunities, mainly driven by “an increasingly young employee base who are looking for greater clarity over opportunities”. Individuals are culturally empowered to advance their own careers, while the company will provide resources and support to help them achieve their goals. A formal leadership programme is in place to help develop and nurture senior management of the future.
Better communication and branding around the reward and employment proposition was also a key focus for a
number of case study organisations. For example, one study carried out research analysis to gain a better
picture of the institution’s current image against its comparators and peers. The results indicated that a number
of gaps needed to be addressed. For example, the recruitment website was not perceived to portray the
organisation as leading and forward thinking and provided a poor image and first impression of the institution.
PwC’s view:
PwC research supports the trends identified from the case studies, finding that workforces are becoming
increasingly diverse in their motivations and needs, a result of both the rising pension age and different
expectations of the ‘millennial’ generation. The same research advocates that employees with the right skills
will be a powerful generation of workers, able to command not only creative reward packages by today’s
standards, but also influence the way they work and where and how they operate in the workplace.
ii) Benefits
Literature review findings:
Aligned with the diversity hypothesis, a different 2015 report by PwC provides further evidence that a ‘one size
fits all’ approach to reward is not unlocking the full potential of a strategically targeted total reward proposition.
The survey, based on 2,400 employees’ perception on the benefits they were receiving, revealed that benefits
could be better customised according to age, gender and where employees are in their lifecycle. Younger
employees placed higher value on cost of living benefits such as discounted canteen and retail vouchers, but in
particular non-financial benefits such as training and development. Perhaps unsurprisingly, older employees
placed greater emphasis on pension.
When asked what new benefits they would most like to see introduced, there were fewer marked differences
between age groups, perhaps because of the absence of pensions as an option. Younger employees had a slightly
Research into modern pay systems
Office of Manpower Economics PwC 8
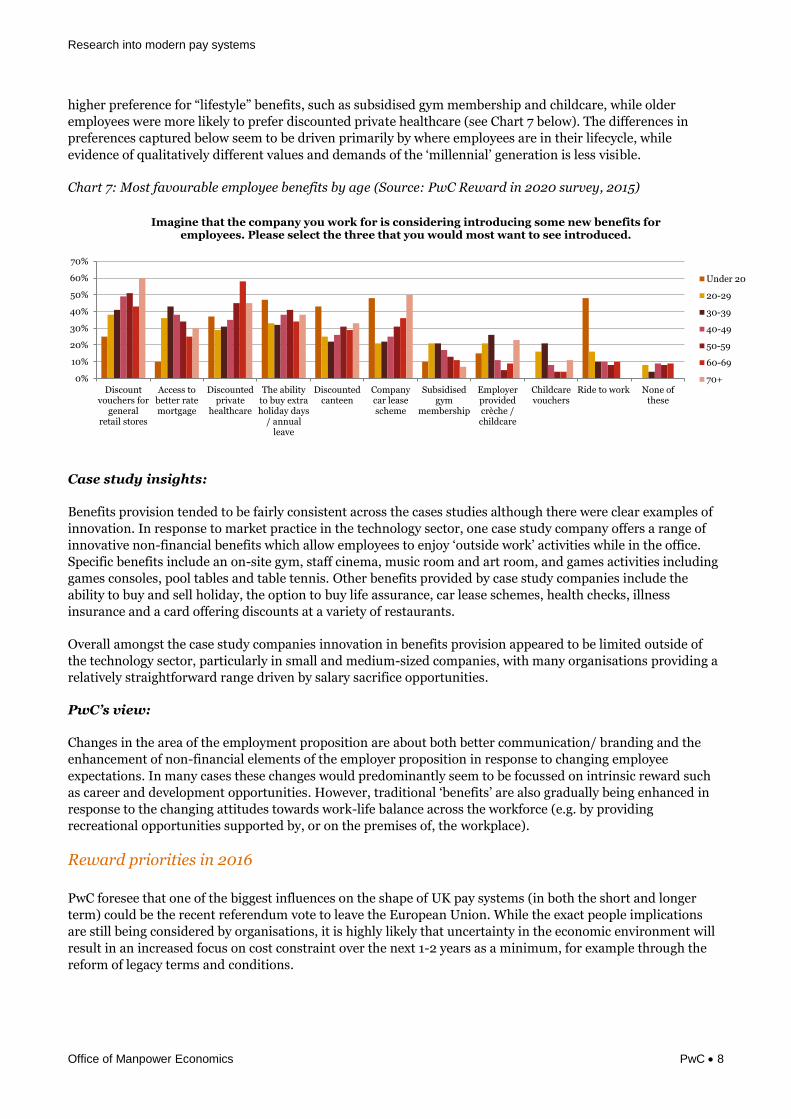
higher preference for “lifestyle” benefits, such as subsidised gym membership and childcare, while older
employees were more likely to prefer discounted private healthcare (see Chart 7 below). The differences in
preferences captured below seem to be driven primarily by where employees are in their lifecycle, while
evidence of qualitatively different values and demands of the ‘millennial’ generation is less visible.
Chart 7: Most favourable employee benefits by age (Source: PwC Reward in 2020 survey, 2015)
Case study insights:
Benefits provision tended to be fairly consistent across the cases studies although there were clear examples of
innovation. In response to market practice in the technology sector, one case study company offers a range of
innovative non-financial benefits which allow employees to enjoy ‘outside work’ activities while in the office.
Specific benefits include an on-site gym, staff cinema, music room and art room, and games activities including
games consoles, pool tables and table tennis. Other benefits provided by case study companies include the
ability to buy and sell holiday, the option to buy life assurance, car lease schemes, health checks, illness
insurance and a card offering discounts at a variety of restaurants.
Overall amongst the case study companies innovation in benefits provision appeared to be limited outside of
the technology sector, particularly in small and medium-sized companies, with many organisations providing a
relatively straightforward range driven by salary sacrifice opportunities.
PwC’s view:
Changes in the area of the employment proposition are about both better communication/ branding and the
enhancement of non-financial elements of the employer proposition in response to changing employee
expectations. In many cases these changes would predominantly seem to be focussed on intrinsic reward such
as career and development opportunities. However, traditional ‘benefits’ are also gradually being enhanced in
response to the changing attitudes towards work-life balance across the workforce (e.g. by providing
recreational opportunities supported by, or on the premises of, the workplace).
Reward priorities in 2016
PwC foresee that one of the biggest influences on the shape of UK pay systems (in both the short and longer
term) could be the recent referendum vote to leave the European Union. While the exact people implications
are still being considered by organisations, it is highly likely that uncertainty in the economic environment will
result in an increased focus on cost constraint over the next 1-2 years as a minimum, for example through the
reform of legacy terms and conditions.
0%
10%
20%
30%
40%
50%
60%
70%
Discountvouchers for
generalretail stores
Access tobetter ratemortgage
Discountedprivate
healthcare
The abilityto buy extraholiday days
/ annualleave
Discountedcanteen
Companycar leasescheme
Subsidisedgym
membership
Employerprovidedcrèche /childcare
Childcarevouchers
Ride to work None ofthese
Imagine that the company you work for is considering introducing some new benefits for employees. Please select the three that you would most want to see introduced.
Under 20
20-29
30-39
40-49
50-59
60-69
70+

Research into modern pay systems
Office of Manpower Economics PwC 9
PwC conducted a survey of Global Heads of Reward at a recent conference to understand which Brexit issues
companies are most concerned about. The survey found that the greatest immediate remuneration-specific
concern for companies is the impact of volatility on the achievement of performance conditions related to bonus
pools (Chart 8 below).
Chart 8: Greatest immediate remuneration-specific concerns from the impact Brexit vote (Source: PwC
Global Reward Conference survey 2016)
Anecdotally PwC have seen an increase in companies focusing on pay and gender issues. In February 2016 Government published draft regulations which require employers with 250 or more employees to publicly disclose information about their gender pay gap. The requirements affect employers with at least 250 employees across England, Wales and Scotland. Given the very early nature of the consultation there is limited information available on company responses to the draft requirements. It is likely that the requirements will heighten focus on underlying equal pay risk, although the disclosures are (in themselves) unlikely to directly expose companies to legal challenge. Anecdotal examples of approaches to this issue include more rigorous analysis of pay outcomes by gender as well as a move away from paying bonuses as a % of salary (as this can exacerbate base pay driven gaps).
Away from a focus on performance management and gender pay, there is limited indication that any fundamental
change is to be expected in reward structures over the medium term. That said, PwC perceive that the traditional
reward model of fixed structures and pay ranges within the organisation may not easily lend itself to the
adaptability and flexibility the future ‘digital’ and ‘creative’ workforces may require. Although no one size fits all,
we predict that organisations will increasingly make use of their customer technologies and insights to make
reward more engaging and relevant for their own employees.
15.6%
25%
21.9%
37.5%
0% 10% 20% 30% 40%
Overall remuneration costs
Remuneration pressures due to key talent shortages
Target setting in an uncertain environment
The impact of volatility on performance measures andbonus pools
Research into modern pay systems
Office of Manpower Economics PwC 10
Research aims and methodology This paper provides an analysis of the main changes that have taken place in the reward landscape since the last
UK recession (circa 2007), and aims to describe the characteristics of a “modern pay system” in UK
organisations, including examples of innovative practice. It is intended to broaden and deepen Pay Review Body
understanding of pay in the private and not-for-profit sectors, drawing out insights relevant to the design of
public sector pay systems. Findings are based on desktop research (a literature review) and cross-industry case
studies representing the diversity of the UK workforce.
The literature review identifies recent changes in employer practice in a range of areas including the different
types of pay systems in use across the economy. It places the case studies into context and frames recent trends
and changes in emphasis.
The case studies draw out insights above and beyond the statistical trends captured by the literature review. The
case studies were conducted independently of the literature review and were intended to capture a range of
sectors and circumstances.
Methodology and sources We set out below the proposed methodology and approach to a) the literature review and b) the case study
elements of the research.
a) Literature reviewTo set out the scope of the changes to UK pay systems since the recession, our approach to desk based research
has fallen into two categories:
Literature providing a broad overview of current pay systems and how they have changed.Examples of some key documents we have analysed include:
“Reward Management surveys” (CIPD) 2007 to 2015;
“Management Benchmark Pay Reports” (IDS) 2007 to 2014;
“Pay and grading structures survey” (XpertHR) 2015;
“Which Way Now for Reward” (Hay) 2012; and
“Executive and Management Reward Surveys” (PwC) 2007-2015.
Literature highlighting specific reward issues. Examples of some key documents we haveanalysed include:
“Reward in 2020” (PwC) 2015;
“Transforming performance management” (PwC) 2015;
“Ticking all the boxes? A study of performance management practices in the UK” (Towers Watson) 2013
“Resourcing and talent planning” (CIPD/Hays recruitment) 2015;
“Learning and Development” (CIPD) 2015;
“The State of Human Resources Survey” (King’s College) 2013;
Research into modern pay systems
Research into modern pay systems
Office of Manpower Economics PwC 11
“The AGR Annual Survey” (Association of Graduate Recruiters) 2015;
”Reward strategies and priorities” (XpertHR) 2015;
“Employee Benefits and Trends Survey” (Aon) 2015;
“Benefits shifts research” (Reward & Employee Benefits Association (REBA) 2016;
“High Fliers: The graduate Market in 2016”;
“Reward strategies and priorities survey 2016” (XpertHR); and
PwC Global Reward Conference Survey (2016).
b) Case study review
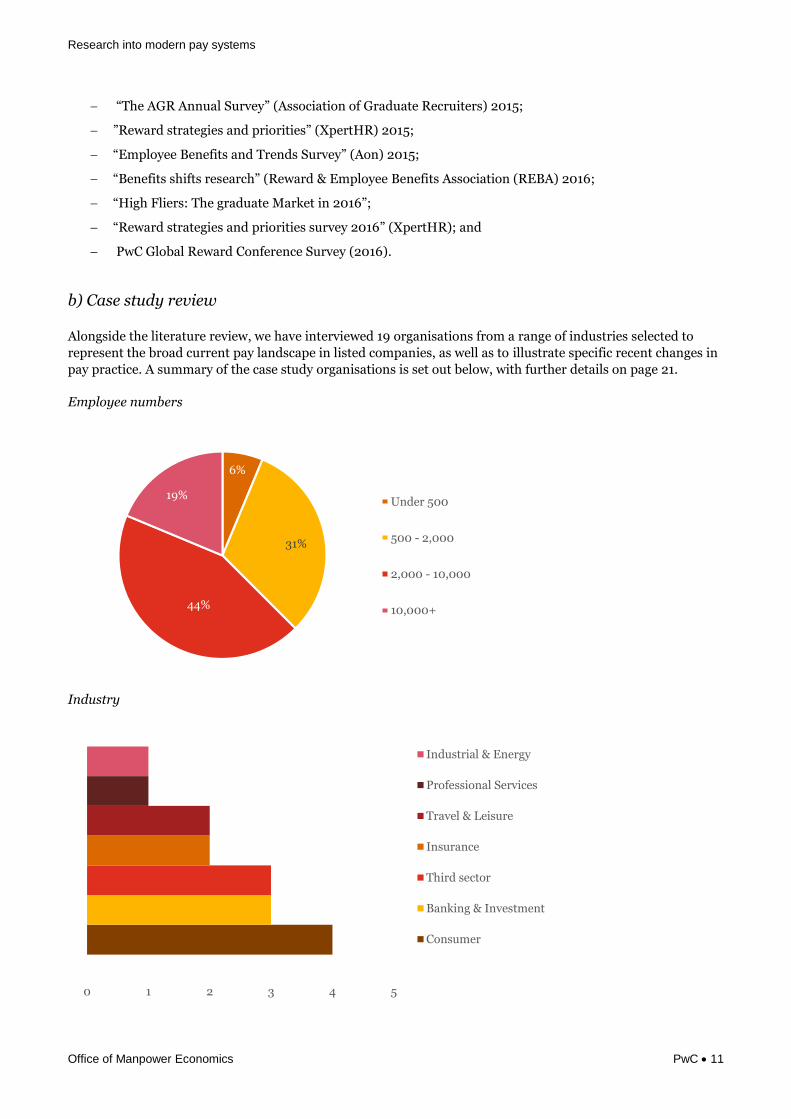
Alongside the literature review, we have interviewed 19 organisations from a range of industries selected to
represent the broad current pay landscape in listed companies, as well as to illustrate specific recent changes in
pay practice. A summary of the case study organisations is set out below, with further details on page 21.
Employee numbers
Industry
0 1 2 3 4 5
Industrial & Energy
Professional Services
Travel & Leisure
Insurance
Third sector
Banking & Investment
Consumer
6%
31%
44%
19%Under 500
500 - 2,000
2,000 - 10,000
10,000+
Research into modern pay systems
Office of Manpower Economics PwC 12
a) Literature review
1) Pay structures and spendi) Pay system design
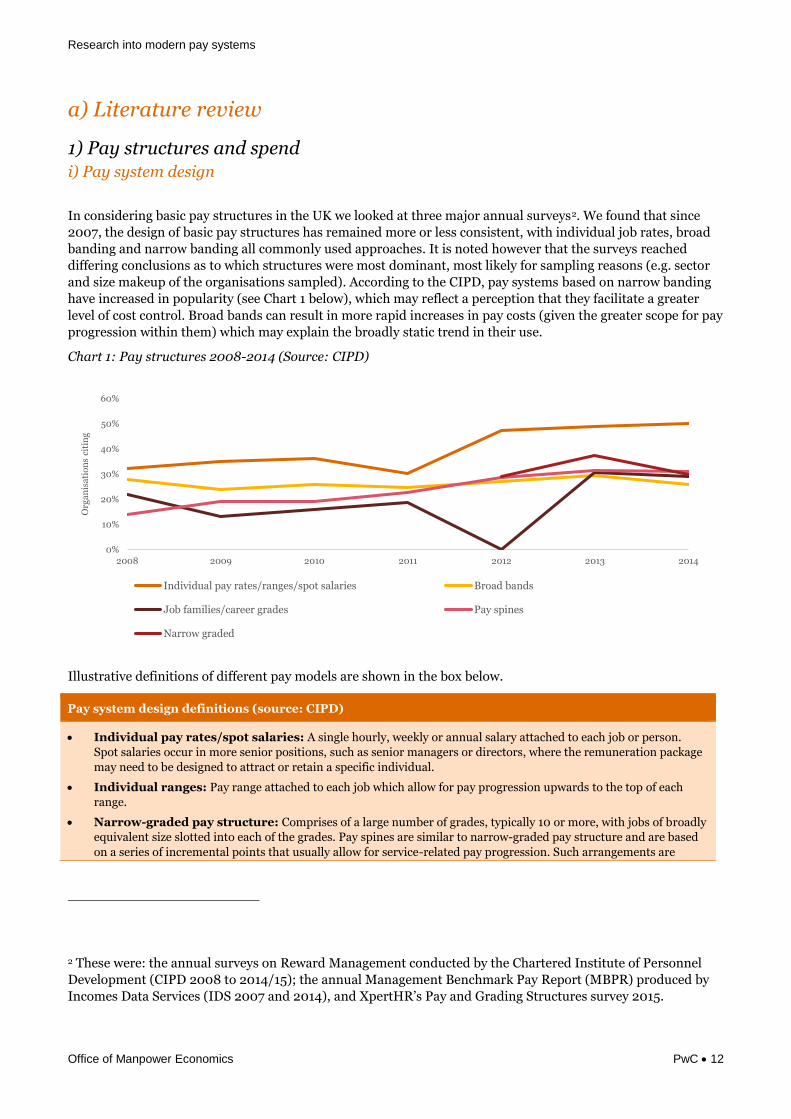
In considering basic pay structures in the UK we looked at three major annual surveys2. We found that since
2007, the design of basic pay structures has remained more or less consistent, with individual job rates, broad
banding and narrow banding all commonly used approaches. It is noted however that the surveys reached
differing conclusions as to which structures were most dominant, most likely for sampling reasons (e.g. sector
and size makeup of the organisations sampled). According to the CIPD, pay systems based on narrow banding
have increased in popularity (see Chart 1 below), which may reflect a perception that they facilitate a greater
level of cost control. Broad bands can result in more rapid increases in pay costs (given the greater scope for pay
progression within them) which may explain the broadly static trend in their use.
Chart 1: Pay structures 2008-2014 (Source: CIPD)
Illustrative definitions of different pay models are shown in the box below.
Pay system design definitions (source: CIPD)
Individual pay rates/spot salaries: A single hourly, weekly or annual salary attached to each job or person.
Spot salaries occur in more senior positions, such as senior managers or directors, where the remuneration package
may need to be designed to attract or retain a specific individual.
Individual ranges: Pay range attached to each job which allow for pay progression upwards to the top of each
range.
Narrow-graded pay structure: Comprises of a large number of grades, typically 10 or more, with jobs of broadly
equivalent size slotted into each of the grades. Pay spines are similar to narrow-graded pay structure and are based
on a series of incremental points that usually allow for service-related pay progression. Such arrangements are
2 These were: the annual surveys on Reward Management conducted by the Chartered Institute of Personnel
Development (CIPD 2008 to 2014/15); the annual Management Benchmark Pay Report (MBPR) produced by
Incomes Data Services (IDS 2007 and 2014), and XpertHR’s Pay and Grading Structures survey 2015.
0%
10%
20%
30%
40%
50%
60%
2008 2009 2010 2011 2012 2013 2014
Org
an
isa
tio
ns
citi
ng
Individual pay rates/ranges/spot salaries Broad bands
Job families/career grades Pay spines
Narrow graded
Research into modern pay systems
Office of Manpower Economics PwC 13
traditionally found in local government, or voluntary organisations with pay structures that mirror local government
arrangements
Broad banding: Uses a small number of salary bands, typically just four or five often classified by job families.
Whereas a traditional salary structure may typically have a 10 - 40% difference in pay between its minimum and
maximum, broad-banding may have up to 100% difference.
Job families: Grouping jobs within similar occupations or functions together, usually with six to eight levels,
similar to the number of grades found in broad-graded structures. There are separate pay structures for different
families.
Career grade: The use of a common pay structure across all job families, rather than operating separate pay
structures for each family. Such arrangements tend to reflect an emphasis on career paths and progression as
opposed to the greater pay focus of the job families approach.
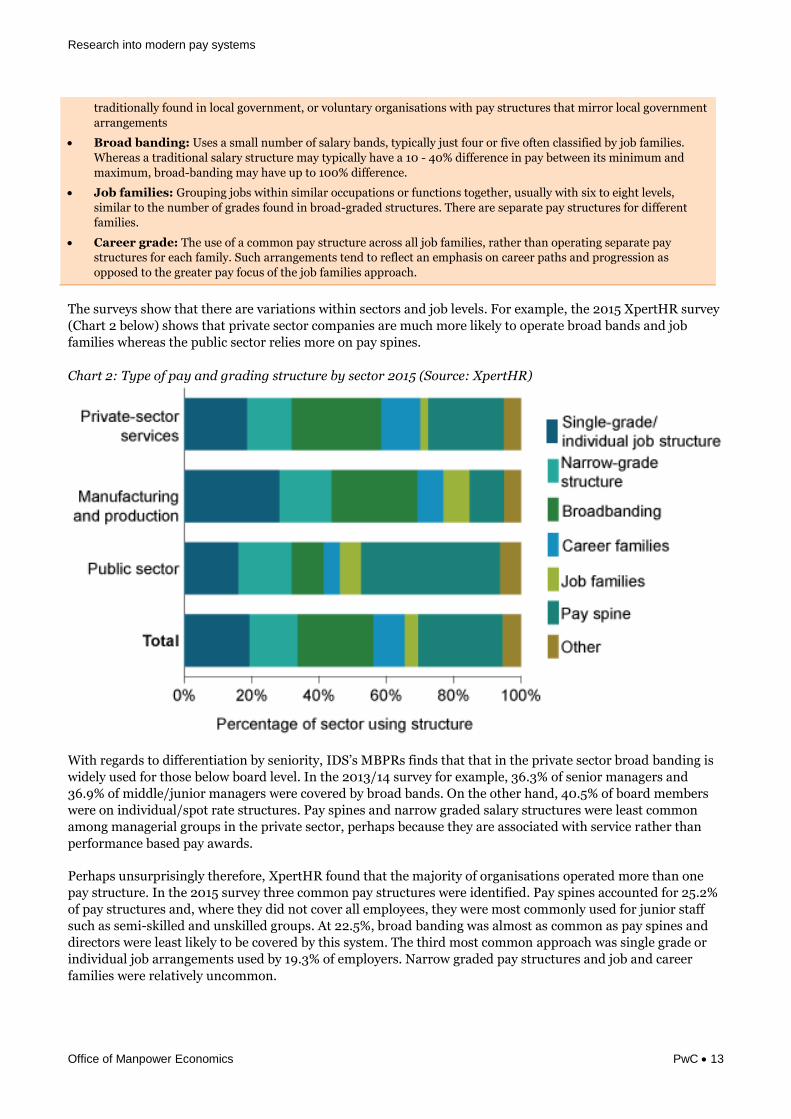
The surveys show that there are variations within sectors and job levels. For example, the 2015 XpertHR survey
(Chart 2 below) shows that private sector companies are much more likely to operate broad bands and job
families whereas the public sector relies more on pay spines.
Chart 2: Type of pay and grading structure by sector 2015 (Source: XpertHR)
With regards to differentiation by seniority, IDS’s MBPRs finds that that in the private sector broad banding is
widely used for those below board level. In the 2013/14 survey for example, 36.3% of senior managers and
36.9% of middle/junior managers were covered by broad bands. On the other hand, 40.5% of board members
were on individual/spot rate structures. Pay spines and narrow graded salary structures were least common
among managerial groups in the private sector, perhaps because they are associated with service rather than
performance based pay awards.
Perhaps unsurprisingly therefore, XpertHR found that the majority of organisations operated more than one
pay structure. In the 2015 survey three common pay structures were identified. Pay spines accounted for 25.2%
of pay structures and, where they did not cover all employees, they were most commonly used for junior staff
such as semi-skilled and unskilled groups. At 22.5%, broad banding was almost as common as pay spines and
directors were least likely to be covered by this system. The third most common approach was single grade or
individual job arrangements used by 19.3% of employers. Narrow graded pay structures and job and career
families were relatively uncommon.

Research into modern pay systems
Office of Manpower Economics PwC 14
ii) Basic pay setting and pay review factorsThe most common factors considered when attaching salary levels, ranges or mid-points to grades or roles were
market rates, job evaluation scores, and the ability to pay; the latter being of increasing importance over time
since 2008 due to affordability constraints and economic uncertainty in the past eight years. These three factors
have remained the key determinants of base salary since the recession. In the 2014/15 CIPD survey, 46% of
respondents stated that ability to pay was the main method of setting base pay levels, while 30% focussed on
market rates (underpinned by job evaluation scores). In contrast, only 7% of organisations specified collective
bargaining as the primary means used to determine basic pay.
Chart 3: Pay setting approach 2008-2014 (Source: CIPD)
XpertHR found that the most common factors used to determine salaries in broad-banded structures were
market rates (61.3%), salary survey data (50%) and internal relativities (over 40%). (Please note, multiple
answers could be chosen to this question). In narrow grade or individual job structures, one-third of
respondents positioned pay by matching against existing grades, band definitions or profiles; 30% used job
evaluation scores; and 20.8% used market rates.
Building on the trends detailed above, almost all case study companies cited recruitment and retention of key
skills as a concern, most often for engineering and IT roles. A common reward response to this was to pay such
individuals above market rates for the relevant skills, sometimes as much as 20% above the market norm.
iii) Pay progressionPay progression refers to the mechanism by which an individual’s salary increases, while remaining in the same role, to reward continued development and to take into account cost of living and/or market factors. The box below provides a definition for the different types of pay progression.
Pay progression definitions (source: CIPD)
Individual performance: Individual pay rises with an assessment of an individual employee’s performance by a
manager or supervisor.
Market rates: Pay increases are linked to keep pace with rates for similar jobs or regional pay levels in the external
labour market.
Competencies: Linking pay rises to an assessment of employee competencies in a range of areas, usually focusing
on the employee’s input to the job, rather than performance or output.
Employee skills/potential/value/retention: Pay progression based on retaining identified employees who
have the potential, ability and aspiration for company success or successive leadership position within the company.
0%
5%
10%
15%
20%
25%
30%
35%
40%
45%
50%
2008 2009 2010 2011 2012 2013 2014
Org
an
isa
tio
ns
citi
ng
Ability to pay Owners/managing director's views
Collective bargaining Market rates without job evaluation database
Market rates with job evaluation database
Research into modern pay systems
Office of Manpower Economics PwC 15
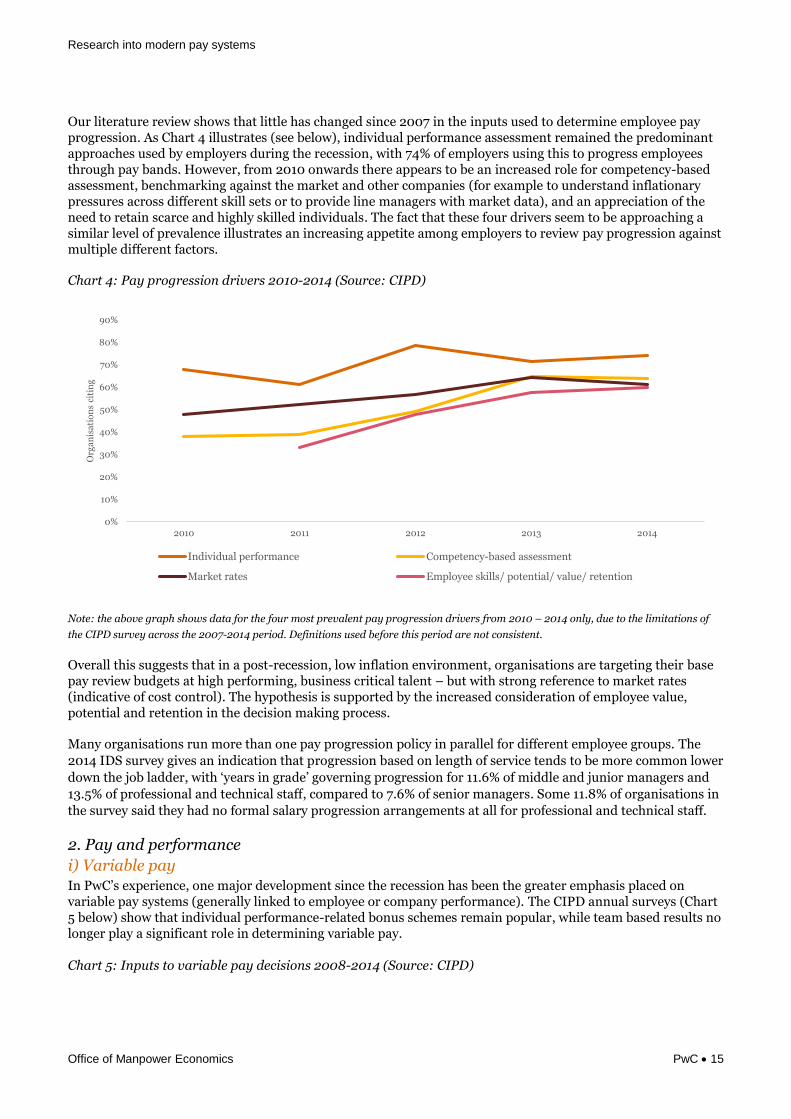
Our literature review shows that little has changed since 2007 in the inputs used to determine employee pay progression. As Chart 4 illustrates (see below), individual performance assessment remained the predominant approaches used by employers during the recession, with 74% of employers using this to progress employees through pay bands. However, from 2010 onwards there appears to be an increased role for competency-based assessment, benchmarking against the market and other companies (for example to understand inflationary pressures across different skill sets or to provide line managers with market data), and an appreciation of the need to retain scarce and highly skilled individuals. The fact that these four drivers seem to be approaching a similar level of prevalence illustrates an increasing appetite among employers to review pay progression against multiple different factors.
Chart 4: Pay progression drivers 2010-2014 (Source: CIPD)
Note: the above graph shows data for the four most prevalent pay progression drivers from 2010 – 2014 only, due to the limitations of
the CIPD survey across the 2007-2014 period. Definitions used before this period are not consistent.
Overall this suggests that in a post-recession, low inflation environment, organisations are targeting their base pay review budgets at high performing, business critical talent – but with strong reference to market rates (indicative of cost control). The hypothesis is supported by the increased consideration of employee value, potential and retention in the decision making process.
Many organisations run more than one pay progression policy in parallel for different employee groups. The
2014 IDS survey gives an indication that progression based on length of service tends to be more common lower
down the job ladder, with ‘years in grade’ governing progression for 11.6% of middle and junior managers and
13.5% of professional and technical staff, compared to 7.6% of senior managers. Some 11.8% of organisations in
the survey said they had no formal salary progression arrangements at all for professional and technical staff.
2. Pay and performance
i) Variable payIn PwC’s experience, one major development since the recession has been the greater emphasis placed on variable pay systems (generally linked to employee or company performance). The CIPD annual surveys (Chart 5 below) show that individual performance-related bonus schemes remain popular, while team based results no longer play a significant role in determining variable pay.
Chart 5: Inputs to variable pay decisions 2008-2014 (Source: CIPD)
0%
10%
20%
30%
40%
50%
60%
70%
80%
90%
2010 2011 2012 2013 2014
Org
an
isa
tio
ns
citi
ng
Individual performance Competency-based assessment
Market rates Employee skills/ potential/ value/ retention

Research into modern pay systems
Office of Manpower Economics PwC 16
Note: “Business results” did not appear as a criteria after 2010.
In terms of quantum, the value of bonuses as a proportion of salary increases in line with job seniority and is considerably higher in the private sector compared with the public and voluntary sectors. The 2014 IDS survey gives an indication of the value of bonus payments in private firms by looking at on-target bonuses. The survey found that median bonuses range from 10% of salary for junior managers to 45% for chief executives.
ii) Performance managementThe structure of the typical UK performance management process is still largely built around personal objective setting and end of year assessment. A 2015 PwC survey found that many employers view performance management as cumbersome, overly-complex and bureaucratic and that there is a desire for simplification. In a pulse survey conducted by Towers Watson in December 2013, 96% of participants stated that performance management was vital for their organisation but over a third identified that it did not result in a marked improvement on employee performance. Additionally, there was little evidence that it was effectively adopted to meet the diverse needs of different employee populations.
Some of the areas of concerns highlighted in PwC’s 2015 survey were:
Although many employers acknowledge that the end of the year performance review is useful, they wereconcerned about the time taken to conduct performance reviews throughout the year and expresseddoubts as to whether there is a correlation between the formal process and commercial outputs.
Objective setting works well from the employers’ perspective but employees’ views suggested that it doeslittle to motivate and engage, particularly when it is top-down in nature.
The capability of line managers and the consistency of performance management from process tooutcomes remains problematic.
Many companies are placing greater emphasis on interim reviews but there was a general consensus thatthe feedback process is ‘clunky’ and that employees would in most cases prefer a more continuousapproach.
Employees also said that reward outcomes drive too much of the process and place too much pressure onthe overall rating.
The survey found that 83% of participants are considering making changes to their performance management approach in the next 2-3 years. While most employers were ‘tweaking’ their current approach (generally retaining the familiar elements of their performance management systems) others were pursuing more radical change. For example, 12% of companies were abandoning performance ratings and/or forced ranking in favour of introducing a culture of continuous feedback throughout the year (e.g. more regular line manager conversations, use of technology to provide instant feedback, peer review).
Table 1 provides an illustrative range of practice from less, to significant, change.
0%
10%
20%
30%
40%
50%
60%
70%
2008 2009 2010 2011 2012 2013 2014
Org
an
isa
tio
ns
citi
ng
Individual performance Business results
Business and individual (Combined approach) Merit pay rise
Team based results Sales commission
Research into modern pay systems
Office of Manpower Economics PwC 17
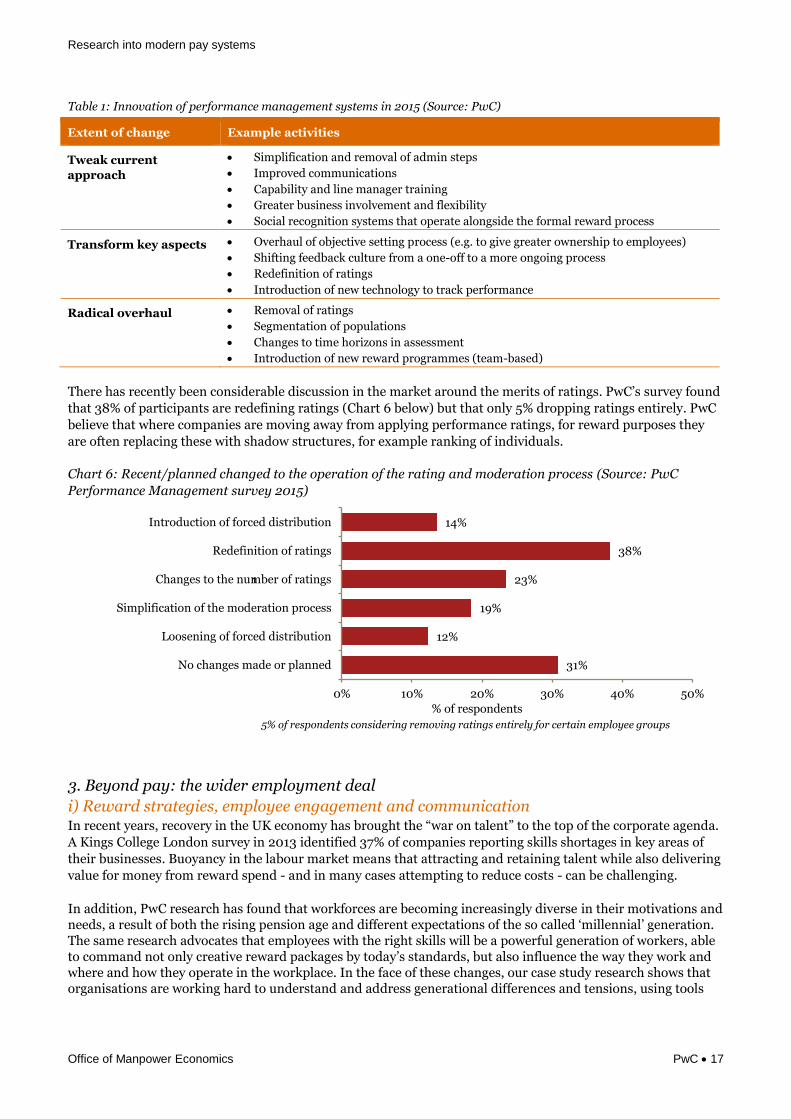
Table 1: Innovation of performance management systems in 2015 (Source: PwC)
Extent of change Example activities
Tweak current
approach
Simplification and removal of admin steps
Improved communications
Capability and line manager training
Greater business involvement and flexibility
Social recognition systems that operate alongside the formal reward process
Transform key aspects Overhaul of objective setting process (e.g. to give greater ownership to employees)
Shifting feedback culture from a one-off to a more ongoing process
Redefinition of ratings
Introduction of new technology to track performance
Radical overhaul Removal of ratings
Segmentation of populations
Changes to time horizons in assessment
Introduction of new reward programmes (team-based)
There has recently been considerable discussion in the market around the merits of ratings. PwC’s survey found
that 38% of participants are redefining ratings (Chart 6 below) but that only 5% dropping ratings entirely. PwC
believe that where companies are moving away from applying performance ratings, for reward purposes they
are often replacing these with shadow structures, for example ranking of individuals.
Chart 6: Recent/planned changed to the operation of the rating and moderation process (Source: PwC
Performance Management survey 2015)
3. Beyond pay: the wider employment deal
i) Reward strategies, employee engagement and communicationIn recent years, recovery in the UK economy has brought the “war on talent” to the top of the corporate agenda.
A Kings College London survey in 2013 identified 37% of companies reporting skills shortages in key areas of
their businesses. Buoyancy in the labour market means that attracting and retaining talent while also delivering
value for money from reward spend - and in many cases attempting to reduce costs - can be challenging.
In addition, PwC research has found that workforces are becoming increasingly diverse in their motivations and needs, a result of both the rising pension age and different expectations of the so called ‘millennial’ generation. The same research advocates that employees with the right skills will be a powerful generation of workers, able to command not only creative reward packages by today’s standards, but also influence the way they work and where and how they operate in the workplace. In the face of these changes, our case study research shows that organisations are working hard to understand and address generational differences and tensions, using tools
14%
38%
23%
19%
12%
31%
0% 10% 20% 30% 40% 50%
Introduction of forced distribution
Redefinition of ratings
Changes to the number of ratings
Simplification of the moderation process
Loosening of forced distribution
No changes made or planned
% of respondents
1
5% of respondents considering removing ratings entirely for certain employee groups
Research into modern pay systems
Office of Manpower Economics PwC 18
such as preference analytics and employee focus groups to better segment the workforce. A clear outcome of this has been a shift in emphasis to the wider employee deal and overall ‘experience’ of work.
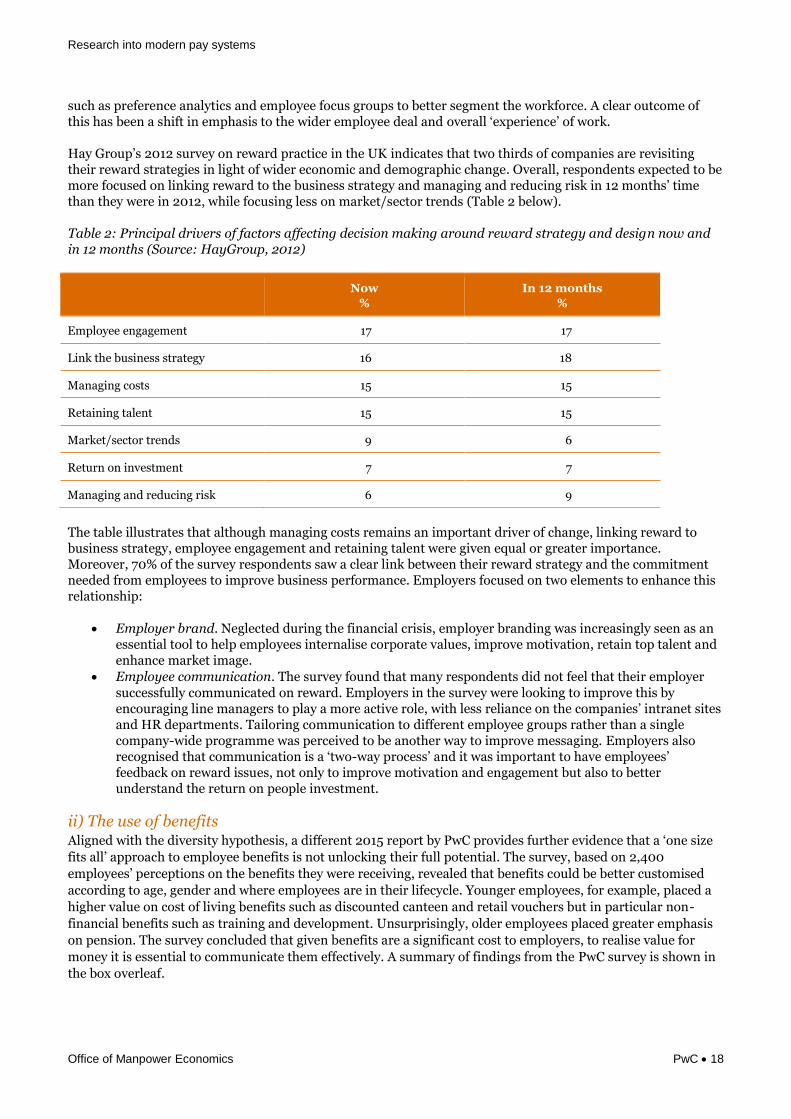
Hay Group’s 2012 survey on reward practice in the UK indicates that two thirds of companies are revisiting their reward strategies in light of wider economic and demographic change. Overall, respondents expected to be more focused on linking reward to the business strategy and managing and reducing risk in 12 months’ time than they were in 2012, while focusing less on market/sector trends (Table 2 below).
Table 2: Principal drivers of factors affecting decision making around reward strategy and design now and in 12 months (Source: HayGroup, 2012)
Now
%
In 12 months
%
Employee engagement 17 17
Link the business strategy 16 18
Managing costs 15 15
Retaining talent 15 15
Market/sector trends 9 6
Return on investment 7 7
Managing and reducing risk 6 9
The table illustrates that although managing costs remains an important driver of change, linking reward to business strategy, employee engagement and retaining talent were given equal or greater importance. Moreover, 70% of the survey respondents saw a clear link between their reward strategy and the commitment needed from employees to improve business performance. Employers focused on two elements to enhance this relationship:
Employer brand. Neglected during the financial crisis, employer branding was increasingly seen as anessential tool to help employees internalise corporate values, improve motivation, retain top talent andenhance market image.
Employee communication. The survey found that many respondents did not feel that their employer
successfully communicated on reward. Employers in the survey were looking to improve this byencouraging line managers to play a more active role, with less reliance on the companies’ intranet sitesand HR departments. Tailoring communication to different employee groups rather than a singlecompany-wide programme was perceived to be another way to improve messaging. Employers alsorecognised that communication is a ‘two-way process’ and it was important to have employees’feedback on reward issues, not only to improve motivation and engagement but also to betterunderstand the return on people investment.
ii) The use of benefitsAligned with the diversity hypothesis, a different 2015 report by PwC provides further evidence that a ‘one size
fits all’ approach to employee benefits is not unlocking their full potential. The survey, based on 2,400
employees’ perceptions on the benefits they were receiving, revealed that benefits could be better customised
according to age, gender and where employees are in their lifecycle. Younger employees, for example, placed a
higher value on cost of living benefits such as discounted canteen and retail vouchers but in particular non-
financial benefits such as training and development. Unsurprisingly, older employees placed greater emphasis
on pension. The survey concluded that given benefits are a significant cost to employers, to realise value for
money it is essential to communicate them effectively. A summary of findings from the PwC survey is shown in
the box overleaf.
Research into modern pay systems
Office of Manpower Economics PwC 19
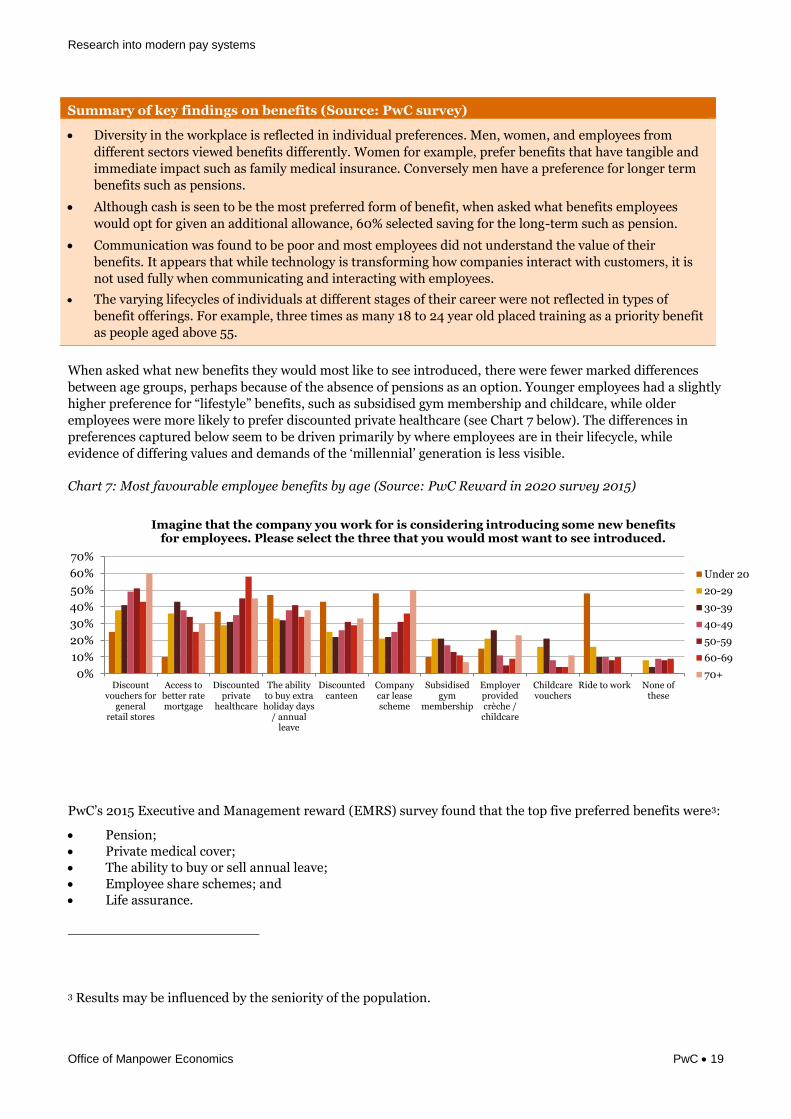
Summary of key findings on benefits (Source: PwC survey)
Diversity in the workplace is reflected in individual preferences. Men, women, and employees from
different sectors viewed benefits differently. Women for example, prefer benefits that have tangible and
immediate impact such as family medical insurance. Conversely men have a preference for longer term
benefits such as pensions.
Although cash is seen to be the most preferred form of benefit, when asked what benefits employees
would opt for given an additional allowance, 60% selected saving for the long-term such as pension.
Communication was found to be poor and most employees did not understand the value of their
benefits. It appears that while technology is transforming how companies interact with customers, it is
not used fully when communicating and interacting with employees.
The varying lifecycles of individuals at different stages of their career were not reflected in types of
benefit offerings. For example, three times as many 18 to 24 year old placed training as a priority benefit
as people aged above 55.
When asked what new benefits they would most like to see introduced, there were fewer marked differences
between age groups, perhaps because of the absence of pensions as an option. Younger employees had a slightly
higher preference for “lifestyle” benefits, such as subsidised gym membership and childcare, while older
employees were more likely to prefer discounted private healthcare (see Chart 7 below). The differences in
preferences captured below seem to be driven primarily by where employees are in their lifecycle, while
evidence of differing values and demands of the ‘millennial’ generation is less visible.
Chart 7: Most favourable employee benefits by age (Source: PwC Reward in 2020 survey 2015)
PwC’s 2015 Executive and Management reward (EMRS) survey found that the top five preferred benefits were3:
Pension;
Private medical cover;
The ability to buy or sell annual leave;
Employee share schemes; and
Life assurance.
3 Results may be influenced by the seniority of the population.
0%
10%
20%
30%
40%
50%
60%
70%
Discountvouchers for
generalretail stores
Access tobetter ratemortgage
Discountedprivate
healthcare
The abilityto buy extraholiday days
/ annualleave
Discountedcanteen
Companycar leasescheme
Subsidisedgym
membership
Employerprovidedcrèche /childcare
Childcarevouchers
Ride to work None ofthese
Imagine that the company you work for is considering introducing some new benefits for employees. Please select the three that you would most want to see introduced.
Under 20
20-29
30-39
40-49
50-59
60-69
70+

Research into modern pay systems
Office of Manpower Economics PwC 20
Conversely, cycle to work, healthcare cash plan, payroll giving, childcare and gym membership were the least preferred benefits.
Aon’s 2015 Employee Benefits & Trends Survey found that employers’ spend on benefits is increasing, with over half of respondents expecting their benefit spend to rise in the next twelve months. However, despite the large investments made by employers, 64% in the survey did not offer total reward statements. The key results from the survey are shown in Appendix 3.
Another survey by Reward & Benefits Association, carried out earlier this year, found that employers are saving money on their benefit spend by moving insurance provision into flexible benefits and passing the choice on to employees.
Reward priorities in 2016 In the medium term we anticipate that many of the trends observed in the past few years will continue, particularly the increasing emphasis on variable pay linked to individual performance, and the drive to increase the effectiveness and fairness of performance management systems from both employers’ and employees’ points of view.
PwC’s EMRS survey asked employers to list their reward priorities in 2016:
Over 60% said that they will focus on reviewing their performance management system.
With significant new regulations on gender pay reporting coming into force on 1 October this year, 46%identified equal pay to be a major concern.
Over 50% of employers cited regulatory governance on policies and procedures as a top priority.
A recent report by XpertHR, conducted in early 2016, asked participants to indicate the key reward issues that organisations will focus on in the coming year. The survey revealed that aside from annual pay review and ongoing salary benchmarking, one-third of respondents will be prioritising gender pay gap reporting.
Given that the regulations are under consultation at the time of publication of this report, there is currently limited evidence as to what impact the Government’s incoming gender pay gap reporting will have on pay systems. Anecdotally PwC have seen a number of responses in the market including more rigorous analysis of pay outcomes by gender as well as a move away from paying bonuses as a % salary (as this can exacerbate base pay driven gaps). This is not directly linked to gender pay gap reporting (which is separate to the legal risk of equal pay claims) but is driven by heightened awareness of the issue.
A high proportion of organisations - 43% - will be reviewing their benefits offering with a view to enhancement. At the same time, 46% are considering how to better manage pension costs. A further 21.2% are planning to improve the link between pay and performance. For many of these organisations, the emphasis seems to be on improving the performance appraisal process to create better visibility of the link between performance and reward.
PwC foresee that one of the biggest influences on the shape of UK pay systems (in both the short and longer
term) could be the recent referendum vote to leave the European Union. While the exact people implications
are still being considered by organisations, it is highly likely that uncertainty in the economic environment will
result in an increased focus on cost constraint over the next 1-2 years as a minimum.
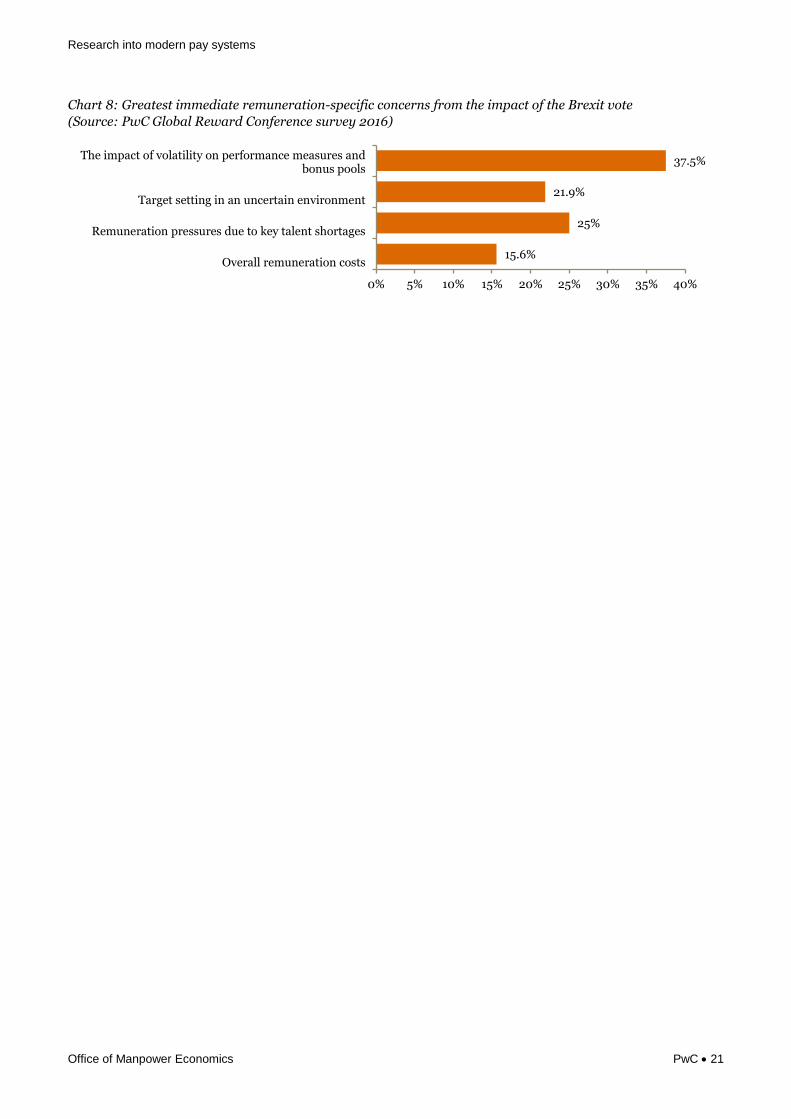
PwC conducted a survey of Global Heads of Reward at a recent conference to understand which Brexit issues
companies are most concerned about. The survey found that the greatest immediate remuneration-specific
concern for companies is the impact of volatility on the achievement of performance conditions related to bonus
pools (Chart 8 overleaf).
Research into modern pay systems
Office of Manpower Economics PwC 21
Chart 8: Greatest immediate remuneration-specific concerns from the impact of the Brexit vote
(Source: PwC Global Reward Conference survey 2016)
15.6%
25%
21.9%
37.5%
0% 5% 10% 15% 20% 25% 30% 35% 40%
Overall remuneration costs
Remuneration pressures due to key talent shortages
Target setting in an uncertain environment
The impact of volatility on performance measures andbonus pools

Research into modern pay systems
Office of Manpower Economics PwC 22
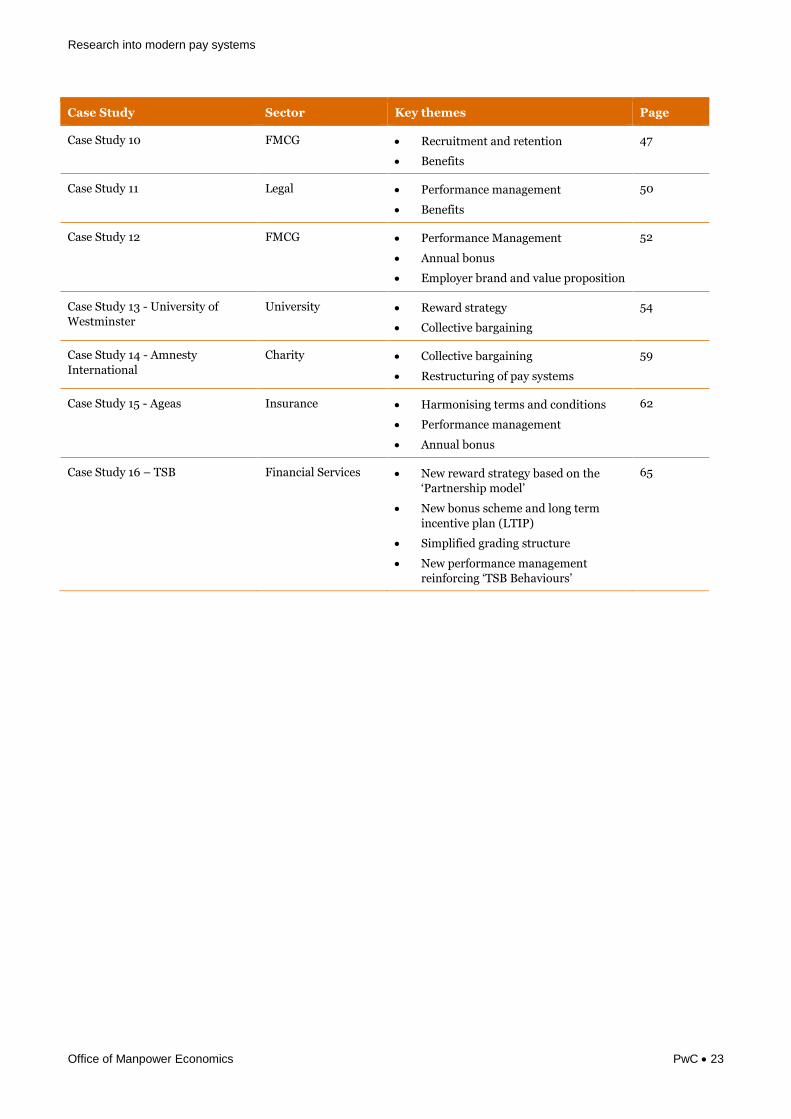
b) Case study reviewOverview of case studies
We provide below a summary of the case study organisations reviewed as part of this research. For the majority
of case studies we have followed a consistent structure, focusing on key areas of change and innovation where
relevant. A small number of the case studies (13-16) have undergone significant recent change, and we have
therefore covered these in more extensive detail as we feel they are particularly relevant to the audience of this
paper.
Case Study Sector Key themes Page
Case Study 1 Charity Performance management
Pay for performance
24
Case Study 2 Asset Management Performance management
Pay for performance
Employee benefits
26
Case Study 3 Energy Performance management
Engineering recruitment and
retention
Graduate programme
28
Case Study 4 Hospitality and
leisure Talent and succession management
Employer brand and value proposition
31
Case Study 5 Technology Reward in a fast growing organisation
Employee benefits
35
Case Study 6 Logistics Collective bargaining
Performance management
Harmonising terms and conditions
38
Case Study 7 Travel Collective bargaining
Performance management
Restructuring of pay systems
41
Case Study 8 Financial Services Reward in a fast growing organisation
Performance management
Annual bonus
Benefits
43
Case Study 9 Insurance Changes to salary setting approach
Performance management
Incentives
Harmonisation of terms and
conditions
45
Research into modern pay systems
Office of Manpower Economics PwC 23
Case Study Sector Key themes Page
Case Study 10 FMCG Recruitment and retention
Benefits
47
Case Study 11 Legal Performance management
Benefits
50
Case Study 12 FMCG Performance Management
Annual bonus
Employer brand and value proposition
52
Case Study 13 - University of
Westminster
University Reward strategy
Collective bargaining
54
Case Study 14 - Amnesty
International
Charity Collective bargaining
Restructuring of pay systems
59
Case Study 15 - Ageas Insurance Harmonising terms and conditions
Performance management
Annual bonus
62
Case Study 16 – TSB Financial Services New reward strategy based on the
‘Partnership model’
New bonus scheme and long term
incentive plan (LTIP)
Simplified grading structure
New performance management
reinforcing ‘TSB Behaviours’
65

Research into modern pay systems
Office of Manpower Economics PwC 24
Case studies

Research into modern pay systems
Office of Manpower Economics PwC 25
Case study 1
Company details Key themes
Sector: Charity
Business activity: Biomedical research
Business type: Global, but mainly UK-based charity
Total number of UK employees: 500 – 2,000
Workforce specifics of note: Many scientific researchers
Performance management
Pay for performance
Background to organisation and summary of recent changes
Background
The company is an independent global charitable foundation, mainly operating in the UK. Over the past two years there has
been a focus on strengthening employee engagement through empowerment and better recognising individuals for their
efforts and achievements. In line with this shift, fairness and consistency has been a key theme for reward, as has
strengthening the link between performance and pay. As a result, the company is currently reviewing its reward principles
and strategy.
Recent changes and strategic rationale
The organisation has focused on developing performance management strategies in an effort to strike a balance
between fairness and consistency in reward, and to recognise individuals for their efforts. In light of this, an annual
bonus has been implemented, and salary rises have been linked to individual performance.
To encourage employee empowerment and line manager accountability, the annual bonus has been implemented to
provide line managers with the discretion to allocate the new all-employee bonus as they see fit. The company hopes to
increase engagement and development opportunities in light of this.
Reinforcement of the value of benefits employees receive, for example by holding a "real price day" at the canteen. On
this day 'normal' prices will be charged, and the extra is donated to charity to highlight the value of the benefit.
Reward framework
Salary structure
In line with wider market practice, the company considers market rates when assessing employee salaries. Market data is
linked to a Job Evaluation System although this may be updated in the future as it is complex (containing 14 factors) and
not well adapted to the professional and technical roles now prevalent in the organisation.
The company consider the market median to be an appropriate level of pay (as opposed to higher levels), as the
organisation has a well-respected brand and has few recruitment issues. The company tends to apply local flexibility to
these benchmarks when specialist skills are needed, or roles are difficult to recruit. A recent exercise has been carried out to
refresh market data sources and ensure they are an appropriate match for the relevant role. This revealed that in some
cases salaries had fallen behind market.
The current pay band structure is also likely to be reviewed in the future as the bands are perceived to be too wide and with
too much overlap. For example there are some salary levels where the individual could conceivably sit in either of three
separate bands.
Pay progression and promotion
In line with the company’s focus on ‘recognising individuals for their efforts’, pay progression is based on individual
performance. A fixed increase as a percentage of salary is applied for everyone who is performing at ‘satisfactory’ level. The
company rewards those who have increased in experience level or have gained responsibilities with a larger salary increase.
The salary review process occurs once a year.
Promotions tend to be limited to occurrences where incumbents leave the organisation. While turnover has historically
slow, recent organisational changes have resulted in a larger than normal number of vacancies opening up.
Promotion timelines are not fixed, and they may be awarded at any time of the year, rather than being aligned with the
annual pay review (as is commonly seen in the wider market). One consequence of this is that the Reward team receive a
significant number of repeat applications, creating an administrative burden. The situation is not helped by the fact that the
Research into modern pay systems
Office of Manpower Economics PwC 26
organisation does not have in place a well embedded career framework to define the competencies and skills required for
each grade. There is however a framework for professional roles which is due to be rolled out more widely in the near term.
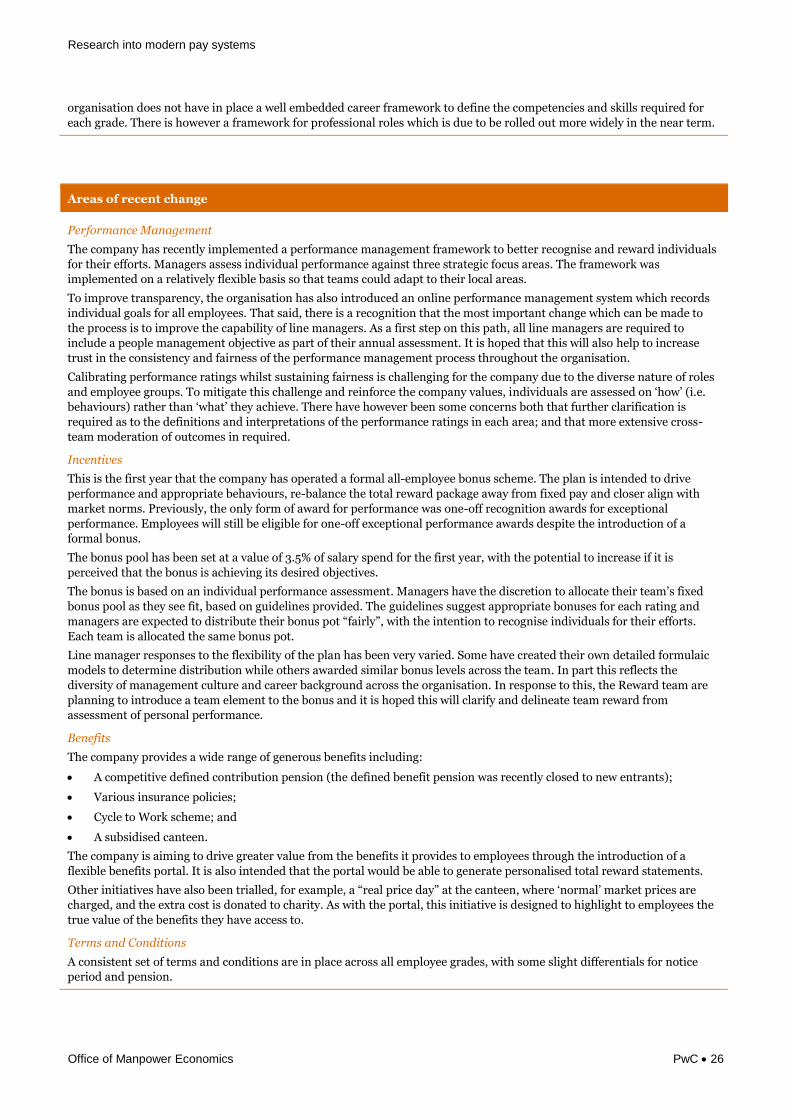
Areas of recent change
Performance Management
The company has recently implemented a performance management framework to better recognise and reward individuals
for their efforts. Managers assess individual performance against three strategic focus areas. The framework was
implemented on a relatively flexible basis so that teams could adapt to their local areas.
To improve transparency, the organisation has also introduced an online performance management system which records
individual goals for all employees. That said, there is a recognition that the most important change which can be made to
the process is to improve the capability of line managers. As a first step on this path, all line managers are required to
include a people management objective as part of their annual assessment. It is hoped that this will also help to increase
trust in the consistency and fairness of the performance management process throughout the organisation.
Calibrating performance ratings whilst sustaining fairness is challenging for the company due to the diverse nature of roles
and employee groups. To mitigate this challenge and reinforce the company values, individuals are assessed on ‘how’ (i.e.
behaviours) rather than ‘what’ they achieve. There have however been some concerns both that further clarification is
required as to the definitions and interpretations of the performance ratings in each area; and that more extensive cross-
team moderation of outcomes in required.
Incentives
This is the first year that the company has operated a formal all-employee bonus scheme. The plan is intended to drive
performance and appropriate behaviours, re-balance the total reward package away from fixed pay and closer align with
market norms. Previously, the only form of award for performance was one-off recognition awards for exceptional
performance. Employees will still be eligible for one-off exceptional performance awards despite the introduction of a
formal bonus.
The bonus pool has been set at a value of 3.5% of salary spend for the first year, with the potential to increase if it is
perceived that the bonus is achieving its desired objectives.
The bonus is based on an individual performance assessment. Managers have the discretion to allocate their team’s fixed
bonus pool as they see fit, based on guidelines provided. The guidelines suggest appropriate bonuses for each rating and
managers are expected to distribute their bonus pot “fairly”, with the intention to recognise individuals for their efforts.
Each team is allocated the same bonus pot.
Line manager responses to the flexibility of the plan has been very varied. Some have created their own detailed formulaic
models to determine distribution while others awarded similar bonus levels across the team. In part this reflects the
diversity of management culture and career background across the organisation. In response to this, the Reward team are
planning to introduce a team element to the bonus and it is hoped this will clarify and delineate team reward from
assessment of personal performance.
Benefits
The company provides a wide range of generous benefits including:
A competitive defined contribution pension (the defined benefit pension was recently closed to new entrants);
Various insurance policies;
Cycle to Work scheme; and
A subsidised canteen.
The company is aiming to drive greater value from the benefits it provides to employees through the introduction of a
flexible benefits portal. It is also intended that the portal would be able to generate personalised total reward statements.
Other initiatives have also been trialled, for example, a “real price day” at the canteen, where ‘normal’ market prices are
charged, and the extra cost is donated to charity. As with the portal, this initiative is designed to highlight to employees the
true value of the benefits they have access to.
Terms and Conditions
A consistent set of terms and conditions are in place across all employee grades, with some slight differentials for notice
period and pension.
Research into modern pay systems
Office of Manpower Economics PwC 27
Areas of recent change
The company prides itself on providing a good work-life balance for all employees, which is considered to be a key part of
the organisational brand. Enforcing this, is a contractual working week of 35 hours, which employees are very unlikely to
exceed.
The company recently updated their terms and conditions by removing the employee probation period.

Research into modern pay systems
Office of Manpower Economics PwC 28
Case study 2
Company details Key themes
Sector: Financial services
Business activity: Investment management
Business type: Private global entity
Total number of UK employees: 2,000 – 10,000
Performance management
Pay for performance
Employee benefits/focus on the
wider employee 'deal'
Background to organisation and summary of recent changes
Background
The company provides investment services in the UK. As the organisation is a private company, historically, there has been
little/no pressure to formalise its reward strategy. This has led to the organisation using an informal and highly
discretionary reward strategy. However, as the company has grown over time, increasing pressure from the regulatory
authorities has led to the organisation evolving its approach to compensation and benefits, as well as performance
management.
Recent changes and strategic rationale
Alongside wider organisational change, the company is undergoing a complete overhaul of its performance
management system and processes. This was driven by the desire to enforce more of a performance culture and a
perceived lack of consistency.
Key changes include roll-out of a new HR technology system, new goal setting framework and making performance
management mandatory. The company is considering bringing in forced distribution to encourage consistency but this
has not been agreed on at present.
Despite operating in a sector where salary banding is common practice, the company has never used this structure and
instead relies on market information and line manager discretion.
There is also a strong emphasis on empowering Line Managers to have significant discretion on variable reward
outcomes.
Reward framework
Salary structure
Unlike the majority of its peers, the organisation does not use salary bands – there has never been buy-in at the company to
do this. Instead, pay for a new joiner is set according to the median market rate and the company uses grading to determine
bonus opportunity.
In 2015, the company aligned annual bonus with salary review so that all pay decisions are made at a single point of the
year. Reward is benchmarked annually to check positioning against the wider market and the approach varies throughout
the business.
Pay progression and promotion
Pay increases are based on market information and line manager discretion. A recent change involves providing line
managers with discretion to allocate the annual pool between a base salary increase and cash bonus. Typically, the idea is
that annual bonuses should be more reflective of individual outputs in the year, e.g. exceptional performance, whilst base
salary should reflect whether the level is appropriate for that role. Further details are provided under ‘Variable pay’ below.
Performance management
The annual Performance Management cycle includes goal-setting at the beginning of the year, collection of feedback
throughout the year, and appraisals with line managers and individuals at year end. Employees are rated on a scale of 1
(exceptional performance) to 5 (cannot judge performance, e.g. as new joiner).
Four issues were identified with the current system that required improvement:
3 ratings were very common, due to lack of forced distribution and not enough differentiation on the 1 to 5 ratings
scale;
There was a lack of consistency in goal-setting between employees and little guidance was provided;

Research into modern pay systems
Office of Manpower Economics PwC 29
Reward framework
There was no formulaic approach to calculate the amount of bonus awarded, meaning that two employees performing
the same role at the same level could receive different bonuses; and
There was no single 'template' or process to use for performance management purposes across different locations
IT systems have been updated to include Workday - a performance management processing system. All goals must now be
entered on to the system before year end and there will be high-level consistency checks. Goal setting has been defined
more clearly, and each goal must now be aligned to one of three strategic pillars and must be based on defined, measureable
information.
Ratings have been better defined and clarified to managers, through a performance grid providing guidance on what it
means to be a particular rating. The company is considering bringing in forced distribution to encourage consistency but
this has not been agreed on at present.
Variable pay
All employees are eligible for an annual cash bonus, and line managers have the discretion to allocate a pay budget between
annual bonus and salary increase as they see fit.
The annual reward cycle is as follows:
1 Based on market conditions, company performance etc. the Remuneration Committee will determine and allocate the
variable pay pool and share awards available for the year
2 Divisions receive pool allocations and feed these down to Line Managers within teams
3 Line Managers will put forward proposed bonuses and pay rises for individuals for approval by the head of the Division
4 Bonuses and pay rises are signed off divisionally and centrally
While divisions are allocated an amount to be spent on bonuses, the exact split between individuals in any team is at the
complete discretion of Line Managers. The reward team is responsible for high-level sense checks to ensure consistency
across teams and individual bonus payout levels. For Senior Management bonus allocations, there are roundtable
discussions to calibrate payouts in line with performance.
Benefits
Benefits are mainly focused around employee wellbeing, including private medical care. A range of additional wellbeing
benefits including dependency support are currently being considered. Flex benefits are not currently provided, but
employees are given some choice of benefits including:
The opportunity to buy up to 10 days additional holiday; and
Cycle to work scheme.
The organisation regularly surveys employees about the benefits on offer to ensure the selection is kept up to date. There has
been recent investment in non-financial benefits for employees working in out out-of-town-locations to reduce recruitment
issues in particular locations, e.g. weekly Zumba classes, free shuttle buses into town, and revamping the office space.
Recruitment and retention
The organisation does not generally have issues attracting and retaining staff. In out-of-town locations, additional non-
financial benefits are provided to attract employees (please see section above for more information).
There are graduate schemes for various sectors, e.g. Technology, Customer Service etc., and these are highly competitive.
Graduates rotate every six months to different teams within their specialism to broaden their skills, and participate in one
international rotation. The organisation also runs a highly successful Apprenticeship programme, which has been
particularly beneficial in IT/digital roles. Many apprentices remain with the company after qualifying and it has been a
great way of growing future talent.
Unlike the graduate scheme where rotations are mandatory, Apprentices stay within a certain role
The wider employment deal
In previous years, there was less commitment to helping individuals drive their career forward. However, in the past year
there have been a number of enhancements and clarification of career progression opportunities, mainly driven by an
increasingly young employee base who are looking for greater clarity over opportunities.
The organisation has a concept known as “drive your career”. Individuals are empowered to take responsibility for
advancing their own careers, while the company will provide resources and support to help employees achieve their goals. A
formal leadership programme is in place to help develop and nurture senior management of the future.
Flexible working hours have recently been introduced to promote work-life balance and modernise in line with competitors.
In addition, the company has been increasing publicity around their company charity to help improve their brand and
reputation among employees.
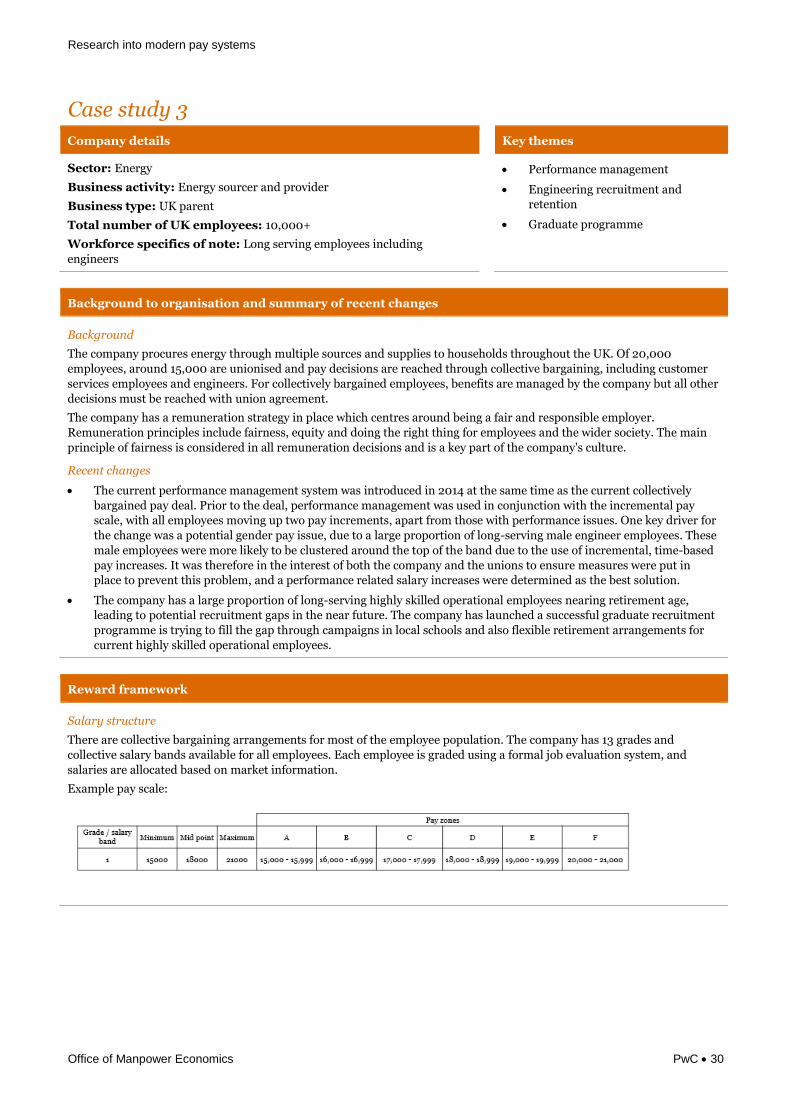
Research into modern pay systems
Office of Manpower Economics PwC 30
Case study 3
Company details Key themes
Sector: Energy
Business activity: Energy sourcer and provider
Business type: UK parent
Total number of UK employees: 10,000+
Workforce specifics of note: Long serving employees including
engineers
Performance management
Engineering recruitment and
retention
Graduate programme
Background to organisation and summary of recent changes
Background
The company procures energy through multiple sources and supplies to households throughout the UK. Of 20,000
employees, around 15,000 are unionised and pay decisions are reached through collective bargaining, including customer
services employees and engineers. For collectively bargained employees, benefits are managed by the company but all other
decisions must be reached with union agreement.
The company has a remuneration strategy in place which centres around being a fair and responsible employer.
Remuneration principles include fairness, equity and doing the right thing for employees and the wider society. The main
principle of fairness is considered in all remuneration decisions and is a key part of the company's culture.
Recent changes
The current performance management system was introduced in 2014 at the same time as the current collectively
bargained pay deal. Prior to the deal, performance management was used in conjunction with the incremental pay
scale, with all employees moving up two pay increments, apart from those with performance issues. One key driver for
the change was a potential gender pay issue, due to a large proportion of long-serving male engineer employees. These
male employees were more likely to be clustered around the top of the band due to the use of incremental, time-based
pay increases. It was therefore in the interest of both the company and the unions to ensure measures were put in
place to prevent this problem, and a performance related salary increases were determined as the best solution.
The company has a large proportion of long-serving highly skilled operational employees nearing retirement age,
leading to potential recruitment gaps in the near future. The company has launched a successful graduate recruitment
programme is trying to fill the gap through campaigns in local schools and also flexible retirement arrangements for
current highly skilled operational employees.
Reward framework
Salary structure
There are collective bargaining arrangements for most of the employee population. The company has 13 grades and
collective salary bands available for all employees. Each employee is graded using a formal job evaluation system, and
salaries are allocated based on market information.
Example pay scale:

Research into modern pay systems
Office of Manpower Economics PwC 31
Core reward areas
Pay progression and promotion
Collectively bargained employees have their pay set on the 1st of April via either a one year pay deal or a three year pay deal,
depending on the circumstances surrounding the deal at the time. Currently the company is in the second year of a three
year deal. The salary pot to be used for increases is primarily based on increases in the cost of living, and general wage
inflation. This pot is allocated between individuals based on performance management outcome.
The company has moved away from an incremental pay structure to a ‘pay for performance’ structure, using a pay matrix to
determine pay increases for individuals. This matrix is shown on the following page.
In the diagram, performance ratings are represented by 1-5, with 5 being the highest performance rating. The pay zones
within each band are represented by the letters A-F, reflecting how far through the pay band the individual is. A represents
the bottom of the band and F represents the top. Salary increases are awarded on this basis.
Performance management
The current performance management system was introduced in 2014 at the same time as the current collectively
bargained pay deal. Prior to the deal, performance management was used in conjunction with the incremental pay scale,
with all employees moving up two pay increments, apart from those with performance issues.
One key driver for the change was a potential gender pay issue, due to a large proportion of long-serving male engineer
employees. These male employees were more likely to be clustered around the top of the band due to the use of
incremental, time-based pay increases. It was therefore in the interest of both the company and the unions to ensure
measures were put in place to prevent this problem, and a performance related salary increases were determined as the best
solution.
The new system involves individuals setting objectives, and being assessed at mid-year and year-end based on performance
against objectives and behaviour compared to company values. Values include safety, customer service, efficiency,
sustainability, teamwork, leadership and excellence.
A holistic view of performance against goals and
behaviours is taken at year end, and performance and
development is discussed with each individual. Line
managers are given detailed guidelines for evaluating
performance, including comprehensive performance
matrices allowing each employee to be rated from 1-5
against each of the company values. Each individual is
graded on the basis of a 5 point scale, from ‘1-
unsatisfactory’ to ‘5 – outstanding’. Performance ratings
are collected and calibrated to form a guided distribution
curve.
Reward framework
Incentives
Annual bonuses are typically available for non-collectively bargained management employees approximately earning over
£40,000 p.a. Eligible employees can earn up to 10% of salary as a bonus. Bonuses are awarded based on the fulfilment of a
series of targets in four ‘segments’ worth 25% of bonus each. The performance segments include Corporate Objectives,
Business Objectives, Team Working (assessment of how company has performed against its values) and Personal
Performance. Evidence is gathered on how the company and individual has performed, and potential payouts are
calculated. For senior management roles, this information is then played back to the Remuneration Committee for their
final decision on the assessment.
Research into modern pay systems
Office of Manpower Economics PwC 32
Reward framework
The company is currently reviewing incentives targets and is considering removing the Team Working element due to
concerns over the directness and measurability of the targets.
The company operates a Share Incentive Plan (SIP) and an SAYE scheme for all employees. The share SAYE scheme offers
employees a maximum of a 20% discount on share price, and they can purchase up to 25 months salary at full value. The
SIP provides employees with a 1:1 match in shares purchased, up to £150 per month. Take up is very strong, with 61% of
employees participating in the SIP and 30% in the SAYE.
Recently the company has introduced a free share offering to try to boost employee shareholding. They looked at who was
buying shares and found out that lower earners with less service were not using the scheme. They tried to come up with an
alternative offering that would be attractive to these employees, and set up the scheme. Each employee will be given £150 -
£200 of shares this year if the company meets its dividend targets.
Benefits
The company provides a suite of benefits including:
Share Incentive Plan Employee assistance programme
Sharesave scheme (SAYE) Childcare vouchers
Payroll charity donations The ability to buy additional holiday
Discounted private health assessments Cycle to work scheme
Online GP consultations Season ticket loans
Private medical healthcare cash plan Car salary sacrifice scheme
Discounted gym membership Staff energy discount
Discounted boiler cover and repair Discounted mobile phone contracts
Preferential rates at a range of high street
retailers
The final salary pension scheme closed to new entrants about 10 years ago but the company has a significant proportion of
long-serving employees who remain in the scheme. For new joiners there is a defined contribution scheme with an
employer match of up to 6% of salary. Initially all employees are enrolled on a 6% contribution with a 6% match but they
can choose to reduce this. Recently the company found there was a lack of understanding among the employee population
of the importance of pensions, and the likely payouts from the scheme. They engaged with Edinburgh University and their
pension provider and provided financial education to employees around this issue.
The company does not currently offer total reward statements or provide a breakdown of the financial value of benefits.
However, they display all benefits on the employee portal so employees are aware of them and the value they offer.
Recruitment and retention
There is recognition that there is a potential recruitment gap of highly skilled operational employees likely to arise in the
next 5-10 years as a large proportion of their workforce will retire. The company has introduced flexible retirement deals to
try to allow some employees to work longer if they wish to. However, as all have particularly generous pensions through the
final salary scheme, it is unlikely that many will choose to stay. When highly skilled operational roles are particularly
difficult to recruit, the company has the flexibility to pay up to 120% of market median, which is typically a good estimate of
upper quartile pay.
There has been a concerted effort to recruiting highly skilled operational graduates including a TV campaign to help create
employer brand identity. The company is now oversubscribed for graduate places, with engineering and IT being
increasingly popular. The main challenge has been recruiting women into graduate places in these fields. The company has
been actively targeting local schools to try to get female students involved and interested in STEM subjects to help plug the
gap, in order to influence the supply pool in the years to come.
There are some recruitment issues in particularly remote regions where local amenities are scarce. In circumstances where
it is difficult to recruit individuals, extra incentives and allowances can be offered particularly where there is a
demonstrable skills shortage. The company does not otherwise vary rates of pay by region.
Equal pay
To prevent escalating any potential Equal Pay issues the company agreed a set of measures with unions to prevent
employees drifting beyond the top of their respective pay bands. A pay-for-performance system was also introduced around
the same time, further mitigating potential equal pay issues and driving performance.
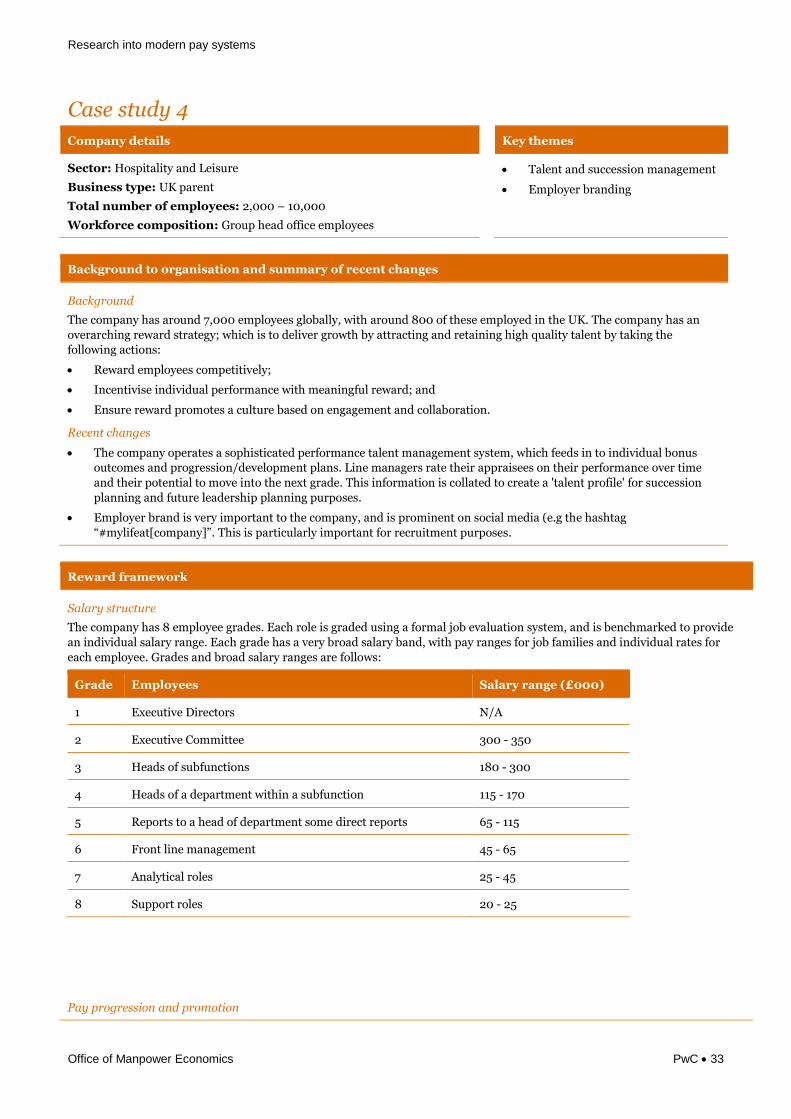
Research into modern pay systems
Office of Manpower Economics PwC 33
Case study 4
Company details Key themes
Sector: Hospitality and Leisure
Business type: UK parent
Total number of employees: 2,000 – 10,000
Workforce composition: Group head office employees
Talent and succession management
Employer branding
Background to organisation and summary of recent changes
Background
The company has around 7,000 employees globally, with around 800 of these employed in the UK. The company has an
overarching reward strategy; which is to deliver growth by attracting and retaining high quality talent by taking the
following actions:
Reward employees competitively;
Incentivise individual performance with meaningful reward; and
Ensure reward promotes a culture based on engagement and collaboration.
Recent changes
The company operates a sophisticated performance talent management system, which feeds in to individual bonus
outcomes and progression/development plans. Line managers rate their appraisees on their performance over time
and their potential to move into the next grade. This information is collated to create a 'talent profile' for succession
planning and future leadership planning purposes.
Employer brand is very important to the company, and is prominent on social media (e.g the hashtag
“#mylifeat[company]”. This is particularly important for recruitment purposes.
Reward framework
Salary structure
The company has 8 employee grades. Each role is graded using a formal job evaluation system, and is benchmarked to provide
an individual salary range. Each grade has a very broad salary band, with pay ranges for job families and individual rates for
each employee. Grades and broad salary ranges are follows:
Grade Employees Salary range (£000)
1 Executive Directors N/A
2 Executive Committee 300 - 350
3 Heads of subfunctions 180 - 300
4 Heads of a department within a subfunction 115 - 170
5 Reports to a head of department some direct reports 65 - 115
6 Front line management 45 - 65
7 Analytical roles 25 - 45
8 Support roles 20 - 25
Pay progression and promotion

Research into modern pay systems
Office of Manpower Economics PwC 34
Reward framework
Salaries are reviewed annually, and individuals progress through pay bands based on three factors:
Company pay review budget
Annual performance rating
Employee salary relative to market rates for the role
Performance management
The company operates a robust performance management process for all employees, involving annual performance review
against agreed objectives, and a link to both incentive outcomes and development needs.
Each employee sets measurable goals based on their team’s KPIs at the beginning of the year, and are expected to have a mid-
year review with their line manager to discuss performance and development opportunities for the next 6 months; followed by a
full review of performance against objectives and the identification of training and development needs at performance year end.
The orange wheel in the graphic below provides an overview of the stages of the annual performance cycle.
The purple sections of the wheel provide an overview of the talent development and succession planning cycle. This runs
alongside the performance management process. Employees are expected to submit a personal development plan (PDP) for the
next year following their end of year review conversation, and have a personal development conversation with their line
managers.
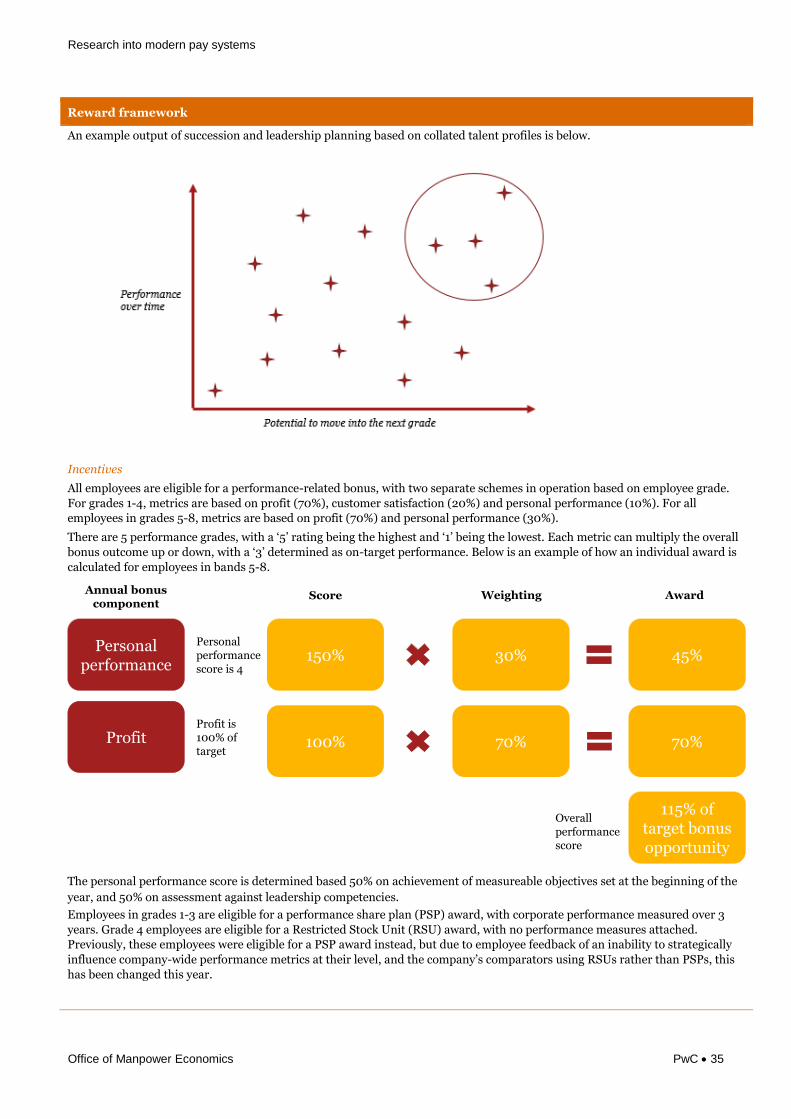
Research into modern pay systems
Office of Manpower Economics PwC 35
Reward framework
An example output of succession and leadership planning based on collated talent profiles is below.
Incentives
All employees are eligible for a performance-related bonus, with two separate schemes in operation based on employee grade.
For grades 1-4, metrics are based on profit (70%), customer satisfaction (20%) and personal performance (10%). For all
employees in grades 5-8, metrics are based on profit (70%) and personal performance (30%).
There are 5 performance grades, with a ‘5’ rating being the highest and ‘1’ being the lowest. Each metric can multiply the overall
bonus outcome up or down, with a ‘3’ determined as on-target performance. Below is an example of how an individual award is
calculated for employees in bands 5-8.
The personal performance score is determined based 50% on achievement of measureable objectives set at the beginning of the
year, and 50% on assessment against leadership competencies.
Employees in grades 1-3 are eligible for a performance share plan (PSP) award, with corporate performance measured over 3
years. Grade 4 employees are eligible for a Restricted Stock Unit (RSU) award, with no performance measures attached.
Previously, these employees were eligible for a PSP award instead, but due to employee feedback of an inability to strategically
influence company-wide performance metrics at their level, and the company’s comparators using RSUs rather than PSPs, this
has been changed this year.
Profit
Personal performance
150%
100%
30%
70%
45%
70%
115% oftarget bonus opportunity
Annual bonus component
Score Weighting Award
Personal performancescore is 4
Profit is100% oftarget
Overall performancescore
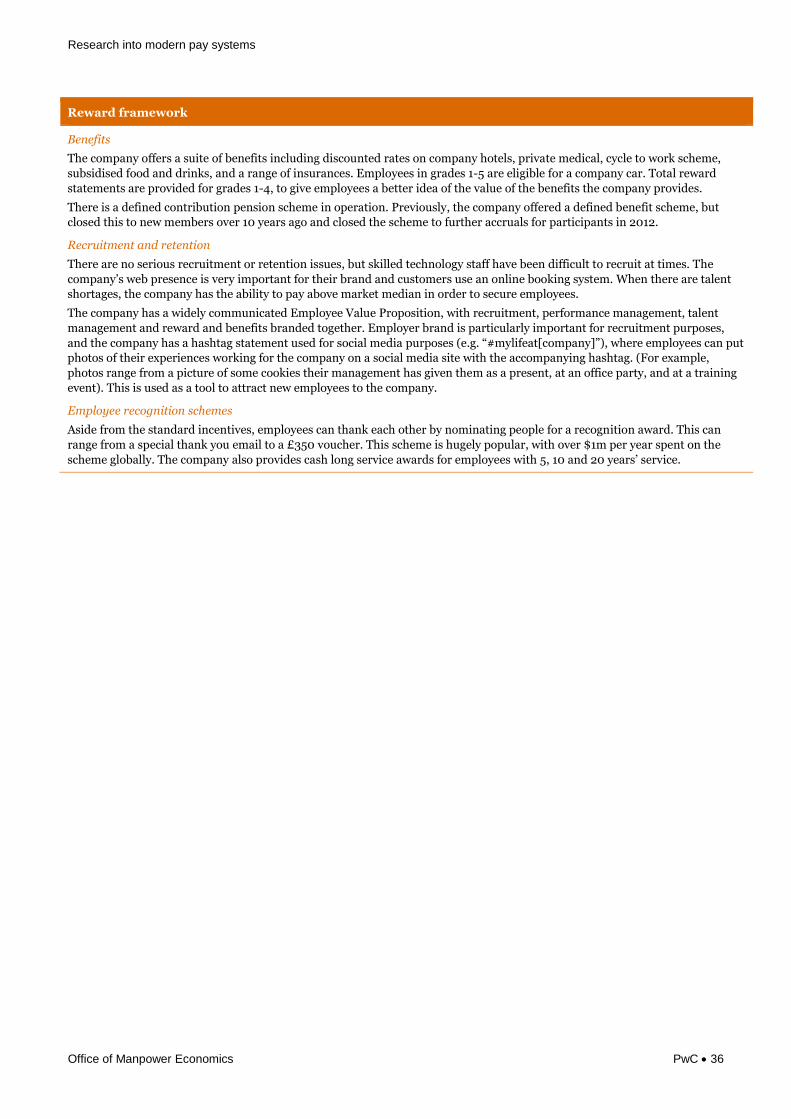
Research into modern pay systems
Office of Manpower Economics PwC 36
Reward framework
Benefits
The company offers a suite of benefits including discounted rates on company hotels, private medical, cycle to work scheme,
subsidised food and drinks, and a range of insurances. Employees in grades 1-5 are eligible for a company car. Total reward
statements are provided for grades 1-4, to give employees a better idea of the value of the benefits the company provides.
There is a defined contribution pension scheme in operation. Previously, the company offered a defined benefit scheme, but
closed this to new members over 10 years ago and closed the scheme to further accruals for participants in 2012.
Recruitment and retention
There are no serious recruitment or retention issues, but skilled technology staff have been difficult to recruit at times. The
company’s web presence is very important for their brand and customers use an online booking system. When there are talent
shortages, the company has the ability to pay above market median in order to secure employees.
The company has a widely communicated Employee Value Proposition, with recruitment, performance management, talent
management and reward and benefits branded together. Employer brand is particularly important for recruitment purposes,
and the company has a hashtag statement used for social media purposes (e.g. “#mylifeat[company]”), where employees can put
photos of their experiences working for the company on a social media site with the accompanying hashtag. (For example,
photos range from a picture of some cookies their management has given them as a present, at an office party, and at a training
event). This is used as a tool to attract new employees to the company.
Employee recognition schemes
Aside from the standard incentives, employees can thank each other by nominating people for a recognition award. This can
range from a special thank you email to a £350 voucher. This scheme is hugely popular, with over $1m per year spent on the
scheme globally. The company also provides cash long service awards for employees with 5, 10 and 20 years’ service.
Research into modern pay systems
Office of Manpower Economics PwC 37
Case study 5
Company details Key themes
Sector: Gaming (Tech)
Business activity: Games developer
Business type (UK parent/subsidiary etc.): UK Subsidiary
Total number of UK employees: Under 500
Workforce composition: Young, mainly male (72% of workforce)
Reward in a fast growing
organisation
Employee benefits
Background to organisation and summary of recent changes
Background
The company was founded in 2003 by largely Swedish founders - leading to an emphasis on equality and non-hierarchal
culture that is still prevalent today. The business is mainly focused on developing social games played via mobile phones
and tablets. The company was founded in 2003 and has grown quickly due to the success of some of its app-based games. It
has recently been acquired by a US listed company. There is one centralised office in the UK of around 450 employees and
approx. 2,000 globally. Becoming a subsidiary company has led to an increased focus on headcount and cost pressures, and
the remuneration structure is now evolving to reflect this.
There is a formal remuneration strategy in place with a series of guiding principles, including equality.
The company was founded in 2003 as a startup and has grown significantly in a short space of time. It has recently
been acquired by a large listed company.
The company provides a comprehensive reward and benefits package. It offers a range of innovative non-financial
benefits including free meals and on-site entertainment facilities which allow employees to enjoy 'work' and 'outside
work' activities while in the office.
Key changes
One of the key differentiations between this company and more traditional industries is its employee benefits offering:
Free meals, drinks and snacks including alcohol on Friday afternoons;
On-site gym;
Games activities including games consoles, pool tables, table tennis etc; and
Staff cinema, music room and art room.
This is in part driven by market practice in the tech sector, but it also helps employees to work flexibly.
There is also a 'Gold Bar' recognition scheme in operation to recognise employees for going above and beyond what is
expected. Employees are nominated by their line manager, or nominated by team members to their line manager. The
scheme provides nominated employees with a cash award of up to 5% of salary.
Reward framework
Salary structure
There is a formal grading structure in place, with 9 grades linked to wide salary ranges split by tech and non-tech roles. New
roles are determined based on internal peers, external market information and the current candidate’s pay package. The
aim is to set base salary at around market median but there is scope to increase this for roles which are harder to recruit.
Pay progression and promotion
The company reviews salaries annually, with increases based on internal relativities, external market data and inflation
rates. The pay budget was previously based on profit metrics but this will change this year to reflect the acquirer’s practices.
Progression is based on performance in role. The company is currently looking to provide better communication to
employees around career development opportunities both horizontally and laterally across the business in order to facilitate
career progression.
Performance management
There is a performance management system in place involving an annual performance review and a Mid-Year check-in.
This is based on goal setting, with a manager-led appraisal against set goals taking place at year end. Employees may
Research into modern pay systems
Office of Manpower Economics PwC 38
Reward framework
provide feedback/evidence of performance from peers but this is not essential unless requested by the line manager. Each
employee receives an appraisal rating at year end.
Incentives
Prior to the recent acquisition, performance ratings were not linked formally to annual bonus. All employees received a
fixed percentage of salary based on their level as an annual bonus, consistent with the egalitarian culture. However, since
the acquisition, bonus will now be flexed up and down depending on performance (for the more senior roles) – from 0.5x
expected bonus allocation to 2x bonus allocation based on performance rating.
Pre-acquisition, staff were mainly incentivised through equity, and many employees realised substantial value when the
company floated on the stock market in 2014. The equity scheme has now been replaced with a profit sharing plan, which
can be worth up to 2x bonus allocation. Vice Presidents and above are now members of the acquirer’s equity scheme. The
company has experienced a very positive reaction to this focus on cash from employees due to the young nature of the
workforce.
There is a ‘Gold Bar’ recognition scheme in operation to recognise employees for going above and beyond what is expected.
Employees are nominated by their line manager, or nominated by team members to their line manager. The scheme
provides nominated employees with a cash award of up to 5% of salary.
Benefits
The company has recently introduced flexible benefits with reference to market norms, but also offers a variety of non-
financial and office-based benefits. The company does not currently provide total reward statements.
On-site office/environmental benefits include:
Free meals, drinks and snacks including alcohol on Friday afternoons
On-site gym
Games activities including games consoles, pool tables, table tennis etc.
Staff cinema, music room and art room
Financial benefits include:
Pension: 1-1 match of 3-5% (moving towards a 5% match as a result of pension legislation changes)
Life assurance with the option to include partner in the scheme
Disability and critical illness cover
Private medical cover with the option to add family cover
Local discounts
25 days of annual leave and 4 days between Christmas and New Year
There is no company car scheme is in operation due to the central London location of all staff, or car allowance.
Non-financial benefits include:
Virtual GPs (a scheme where employees are able to make GP appointments online and talk to them via video-call. The
GP can then arrange for prescriptions to be sent to the office).
Dental (voluntary employee funded plan)
Health screenings
Cycle to work scheme
Childcare vouchers
Dining discount card
Community day
Recruitment and retention
There are currently no retention issues and very low employee turnover rates. There are no exit interviews in place. The
company operates a successful campus internship scheme.
Diversity and gender pay
Gender pay and gender diversity is considered to be a significant issue due to the high volume of male employees. Only 28%
of the employee population is female. This is expected given the industry, but has been exacerbated by the recent
acquisition, which lead to several senior female employees leaving. To improve the number of female recruits in the future,
there is a company-wide scheme in place to try to attract female candidates into the technology industry. There is also a

Research into modern pay systems
Office of Manpower Economics PwC 39
Reward framework
very active 'Women in Tech' group who conduct talks to promote successful female role models and encourage more women
into Tech.
Research into modern pay systems
Office of Manpower Economics PwC 40
Case study 6
Company details Key themes
Sector: Logistics and distribution
Business activity: Postal services
Business type: UK parent
Total number of UK employees: 10,000+
Workforce specifics of note: A large proportion of the workforce are
long-serving, collectively bargained operational employees
Collective bargaining
Performance management
Background to organisation and summary of recent changes
Background
The company has recently listed, and has a large collectively bargained employee population. There is no formal reward
strategy in place, but the company does have an overarching remuneration philosophy that is used for management pay
decisions. This includes the principle that pay should be attractive in order to recruit, retain and motivate individuals, and
that non-collectively bargained pay should range from 80% of market median to above market median in certain
circumstances.
The company has three broad employee categories for the purposes of pay decisions:
Senior management
Collectively negotiated management
Collectively negotiated front line employees.
Recent changes
Since 2009, pay structure changes have mainly been tactical and driven by cost pressures. For example, there have been
several pension reforms due to DB scheme deficit and legislative changes.
Collectively bargained operational employees have different salary structures and incentive arrangements to
management employees.
The performance management system for the management employee population has been revamped in the last year
with an increased focus on individual performance.
The company is in the process of harmonising employee terms and conditions.
Reward framework
Salary structure
Senior management salaries are based on broad pay bands. Job evaluation is used to place senior management employees
in a pay band, and salaries are set using external benchmarking and internal relativities.
Collectively negotiated management and front line employees have fixed incremental pay scales, with an individual’s pay
progressing on the basis of time in role. For front line employees, they have to be in the role 6 months to reach the mid-
point of the scale, and 1 year to earn the maximum. Due to the short pay scales, 90% of front line employees are on the
maximum of their scale. All employees are paid above the living wage.
Pay progression and promotion
Pay increases for collectively bargained employees are based on affordability, general inflation and the outcome of
industrial relations pay bargaining. There are pay reviews annually for all employees.
Pay increases for senior management are also based on affordability and general inflation factors, and are based on a merit-
only basis, linked to performance management outcomes. There is not across-the-board increase for non-unionised
employees.
Promotions are based on merit, with open resourcing for all new openings. All roles are advertised and external and
internal candidates can apply. The company also provides development opportunities to employees who they feel are ready
to move up a grade, to encourage internal progression and prepare them for any promotion opportunities that arise.
Performance management
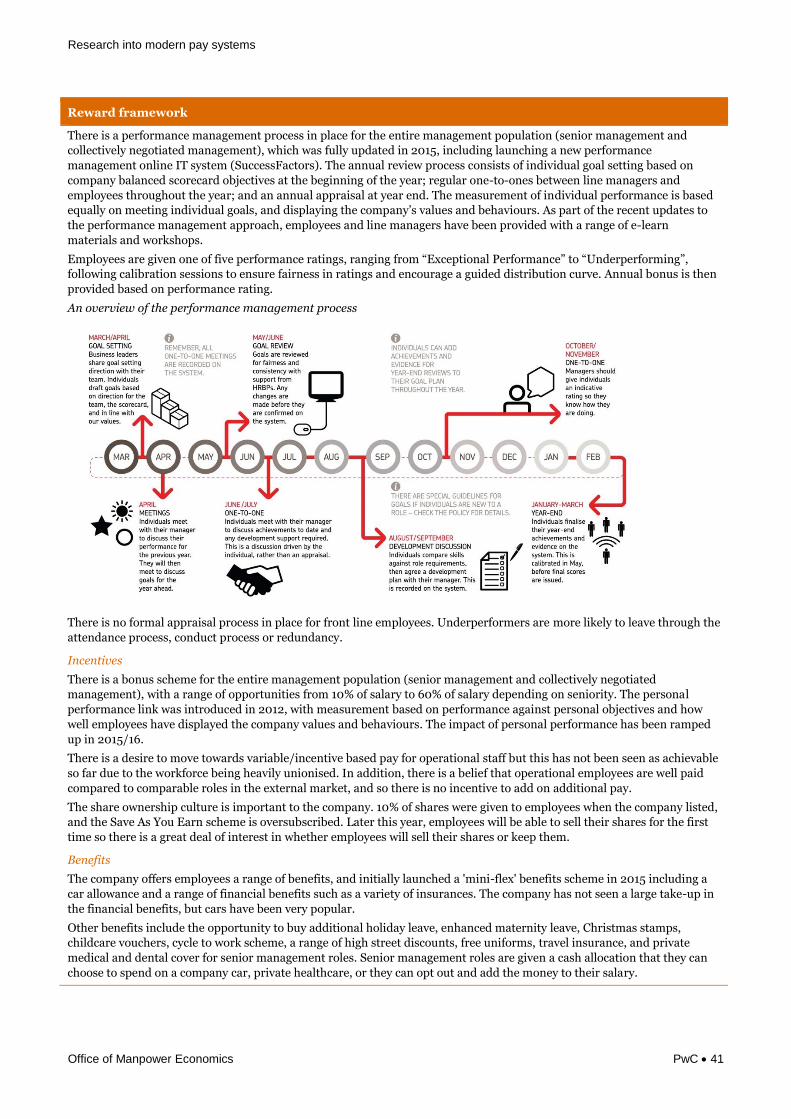
Research into modern pay systems
Office of Manpower Economics PwC 41
Reward framework
There is a performance management process in place for the entire management population (senior management and
collectively negotiated management), which was fully updated in 2015, including launching a new performance
management online IT system (SuccessFactors). The annual review process consists of individual goal setting based on
company balanced scorecard objectives at the beginning of the year; regular one-to-ones between line managers and
employees throughout the year; and an annual appraisal at year end. The measurement of individual performance is based
equally on meeting individual goals, and displaying the company’s values and behaviours. As part of the recent updates to
the performance management approach, employees and line managers have been provided with a range of e-learn
materials and workshops.
Employees are given one of five performance ratings, ranging from “Exceptional Performance” to “Underperforming”,
following calibration sessions to ensure fairness in ratings and encourage a guided distribution curve. Annual bonus is then
provided based on performance rating.
An overview of the performance management process
There is no formal appraisal process in place for front line employees. Underperformers are more likely to leave through the
attendance process, conduct process or redundancy.
Incentives
There is a bonus scheme for the entire management population (senior management and collectively negotiated
management), with a range of opportunities from 10% of salary to 60% of salary depending on seniority. The personal
performance link was introduced in 2012, with measurement based on performance against personal objectives and how
well employees have displayed the company values and behaviours. The impact of personal performance has been ramped
up in 2015/16.
There is a desire to move towards variable/incentive based pay for operational staff but this has not been seen as achievable
so far due to the workforce being heavily unionised. In addition, there is a belief that operational employees are well paid
compared to comparable roles in the external market, and so there is no incentive to add on additional pay.
The share ownership culture is important to the company. 10% of shares were given to employees when the company listed,
and the Save As You Earn scheme is oversubscribed. Later this year, employees will be able to sell their shares for the first
time so there is a great deal of interest in whether employees will sell their shares or keep them.
Benefits
The company offers employees a range of benefits, and initially launched a 'mini-flex' benefits scheme in 2015 including a
car allowance and a range of financial benefits such as a variety of insurances. The company has not seen a large take-up in
the financial benefits, but cars have been very popular.
Other benefits include the opportunity to buy additional holiday leave, enhanced maternity leave, Christmas stamps,
childcare vouchers, cycle to work scheme, a range of high street discounts, free uniforms, travel insurance, and private
medical and dental cover for senior management roles. Senior management roles are given a cash allocation that they can
choose to spend on a company car, private healthcare, or they can opt out and add the money to their salary.
Research into modern pay systems
Office of Manpower Economics PwC 42
Reward framework
The defined benefit pension scheme was closed to new joiners in 2008, but is still open to accruals for existing participants.
A defined contribution scheme exists for new joiners, where employees contribute 4%/5%/6% and the employer matches it
with 7%/8%/9% depending on employee contribution.
Total reward statements are used to make sure people are aware of what they have and the value of the reward and benefits
spend. These capture base pay, pensions, benefits, holidays, childcare vouchers, cycle to work scheme and pension salary
exchange. The feedback from employees is that these have been very powerful in communicating the true value of the
reward offering. The statements are mailed annually to individuals and there is a quarterly update online.
Recruitment and retention
There are some retention issues with IT employees, who are generally part of a younger demographic than the rest of the
employee population, and are not generally part of the now closed Defined Benefit pension scheme, meaning that they have
more propensity to leave. The organisation has reacted by managing the reward package offered to employees in the
following ways:
Providing more market-aligned incentives
Conducting annual salary reviews to ensure reward stays aligned with the market
Ensuring the total value of the reward offering is communicated through total reward statements
Looking actively for retention hotspots and managing them as they arrive
Succession planning
Providing employees with interesting development opportunities to keep them engaged
Equal pay
The company does not currently have any major equal pay concerns. However, there is a recognition that employees are
becoming more aware of equal pay issues due to media attention, and are potentially more likely to make claims. Pay for
new joiners is carefully managed and there are equal pay considerations in decision making. The company has a female
CEO and lots of female managers. However, there is a recognition that there is an element of occupational segregation in
engineering and driving roles and also legacy payments are more likely to be made to more long-serving members of the
workforce. These staff members are generally older, white males which could be causing inequality. However, due to the
unionised nature of the business, these payments are difficult to remove. Pay equality is something the company intends to
review in the near future.
Research into modern pay systems
Office of Manpower Economics PwC 43
Case study 7
Company details Key themes
Sector: Travel and leisure
Business activity: Travel services
Business type: UK subsidiary
Total number of UK employees: 10,000+
Collective bargaining
Performance management
Move away from incremental pay
increases
Background to organisation and summary of recent changes
Background
The company is heavily unionised and the key drivers of reward are compliance with legislative change and the continued
push towards a market competitive cost base. The overall company strategy is focused on supporting people change,
organisational change and rewarding exceptional behaviour and performance.
Recent changes
In order to better reflect organisational changes within the company, and to maintain affordability, the company has
moved away from an incremental pay approach for new recruits in the below management/specialist population. A
three-spot rate process has been introduced, which places new recruits at an entry level salary, with the potential to
increase to a fully competitive salary level after 12 months at the company.
Performance management has been an area of focus, with a number of recent changes made to the bonus structure of
the 'broad banded' population. There is a continued desire to extend performance management to lower grades and
link it to reward where appropriate.
Terms and conditions for new joiners have been modernised to reduce/remove some of the legacy arrangements which
did not support business needs, and reduced organisational flexibility.
Reward framework
Salary structures
The company has two main salary setting processes:
1 The management population (made up of Junior Management, Middle Management and Senior Management) have a
broad banded pay structure, with pay aligned to the market.
2 Those below management and specialists (e.g. customer services employees) are now on a three-grade spot rate
approach (new recruits only). Employees are now placed into one of three grades and provided with an appropriate spot
rate. Previously, an incremental pay approach was used for this population. The new "spot rate" approach places new
recruits at an entry level salary, with the potential to increase to a fully competitive salary level after 12 months at the
company. This salary award is based on achieving acceptable levels of performance, and entry level salaries are based on
accountabilities of the individual. There are no further salary progression points.
The changes introduced (including the new grading structure for below management and specialists) better reflect and
support recent and anticipated organisational design changes, specifically, maintaining cost efficiency and ensuring
affordability for the future.
Pay review and progression
There are several groups of employees who are managed within a negotiated salary award process. Pay increases are linked
broadly to increases in the cost of living, company affordability and external market considerations. Any increases awarded
are typically awarded to all collectively bargained employees. For the management population, the considerations are
broadly similar, with a greater emphasis on external market considerations. Any salary increases for this population will be
based on a merit only approach; there is no automatic across the board salary increase.
Performance management
The company has a clear focus on driving and improving performance management and has allocated dedicated resources to
this. The company has recently launched competency frameworks for broad banded grades and these are linked to the
performance management process. This aims to give a common language and standards across the company and to enable
colleagues to focus on both business objectives (the ‘how’) and behavioural objectives (the ‘what).
Research into modern pay systems
Office of Manpower Economics PwC 44
Reward framework
A new online 360 feedback tool has been developed as part of the performance management and rating approach. The
company is now focusing on individual performance and the behaviours displayed by employees, including how they align
to the company values. There is a plan to roll out the performance management changes to the wider workforce at the
appropriate time. Within business support teams, contracts have also been introduced to provide the flexibility to introduce
differentiated bonuses based on performance management in the future.
Benefits
The company does not provide flexible benefits, but do operate a voluntary benefits platform. There have not been any
fundamental changes to the benefits provided over the past few years. However, there have been some small changes to the
way benefits are operated which enhance the value for the company and for employees whilst controlling the costs of the
scheme. Any changes have been largely driven by legislative changes, and examples include the provision of childcare
vouchers and healthcare provisions through salary sacrifice arrangements.
The company introduced the option of salary sacrifice for pensions AVCs, which went down very well with employees. The
company had already operated a salary sacrifice for n contributions for a number of years.
As would be expected in the industry, the company also offer eligible employees staff travel benefits and discounted travel
and hotel.
Graduate programmes
The company offers various graduate programmes within different areas of the business, e.g. Finance, IT, HR, OR,
Procurement and Leadership. These schemes are three years long, with the potential to move into a secured role if their
application at the end of the period is successful.
Terms and Conditions
The company has undergone significant work in harmonising the terms and conditions of employees. A comprehensive
terms and conditions package for new joiners has been developed and had become much more rigid in various areas e.g.
sickness, number of days annual leave, shift rates, overtime rates and redeployment. The company now has a modernised
set of terms and conditions which can be adapted during the employee’s time at the company. This has been driven by the
idea that the company needs to be more reactive to global issues that are increasingly affecting the business, and requires
increased flexibility to do this.
Recruitment and Retention
The company faces challenges recruiting and retaining Commercial roles, such as Commercial Analysts, and Customer
Relationship Marketing roles. There is a push to pay these roles premium salaries in order to retain the talent. Retaining
these roles is a key focus for the company, as there is recognition that they will drive significant future revenue. The
company therefore wishes to ensure that Reward packages remain market competitive, including paying these roles
‘premium’ salaries.
Engineering is one of the key pressure points, as the company are experiencing issues around the skills available, in part
driven by the increased mobility of labour globally. This has created a push to increase salary levels for engineers.
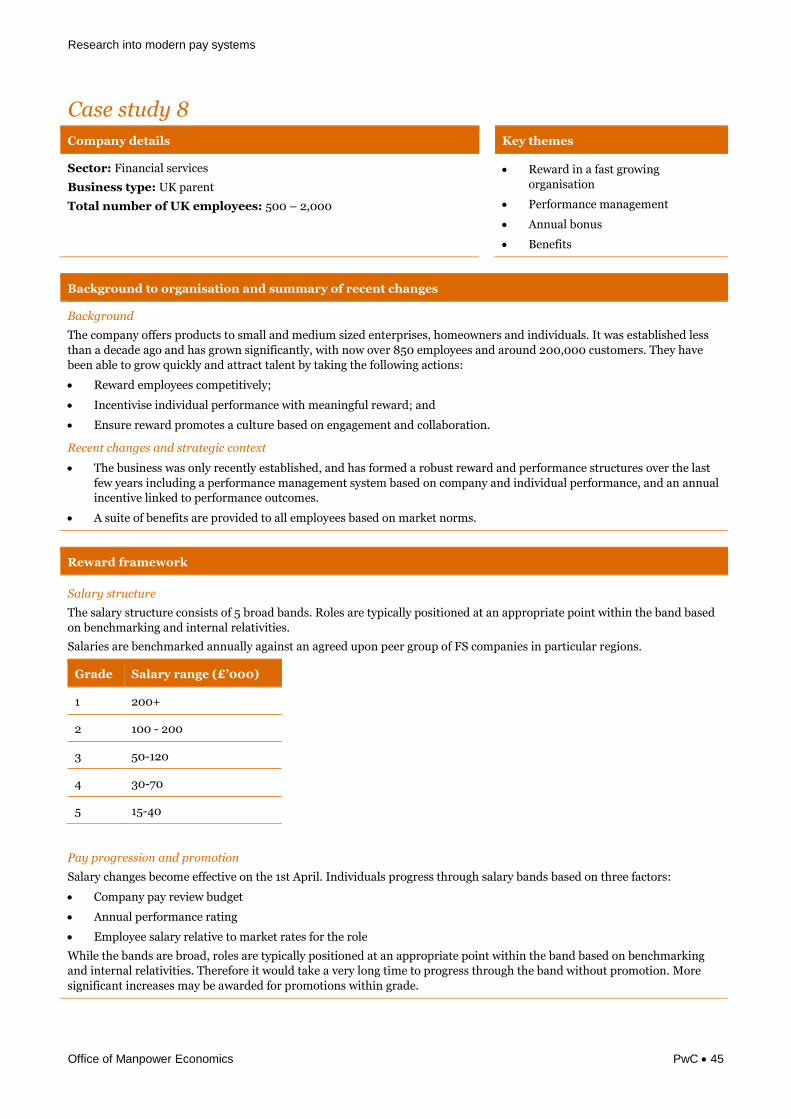
Research into modern pay systems
Office of Manpower Economics PwC 45
Case study 8
Company details Key themes
Sector: Financial services
Business type: UK parent
Total number of UK employees: 500 – 2,000
Reward in a fast growing
organisation
Performance management
Annual bonus
Benefits
Background to organisation and summary of recent changes
Background
The company offers products to small and medium sized enterprises, homeowners and individuals. It was established less
than a decade ago and has grown significantly, with now over 850 employees and around 200,000 customers. They have
been able to grow quickly and attract talent by taking the following actions:
Reward employees competitively;
Incentivise individual performance with meaningful reward; and
Ensure reward promotes a culture based on engagement and collaboration.
Recent changes and strategic context
The business was only recently established, and has formed a robust reward and performance structures over the last
few years including a performance management system based on company and individual performance, and an annual
incentive linked to performance outcomes.
A suite of benefits are provided to all employees based on market norms.
Reward framework
Salary structure
The salary structure consists of 5 broad bands. Roles are typically positioned at an appropriate point within the band based
on benchmarking and internal relativities.
Salaries are benchmarked annually against an agreed upon peer group of FS companies in particular regions.
Grade Salary range (£’000)
1 200+
2 100 - 200
3 50-120
4 30-70
5 15-40
Pay progression and promotion
Salary changes become effective on the 1st April. Individuals progress through salary bands based on three factors:
Company pay review budget
Annual performance rating
Employee salary relative to market rates for the role
While the bands are broad, roles are typically positioned at an appropriate point within the band based on benchmarking
and internal relativities. Therefore it would take a very long time to progress through the band without promotion. More
significant increases may be awarded for promotions within grade.

Research into modern pay systems
Office of Manpower Economics PwC 46
Reward framework
Performance management
The company operates a robust performance management process for all employees, involving annual performance reviews
against agreed objectives, and a link to both incentive outcomes and development needs.
Each employee sets measurable goals based on their team’s KPIs at the beginning of the year and is expected to have a mid-
year review with their line manager to discuss performance and development opportunities for the next 6 months; and a
full review of performance against objectives and the identification of training and development needs at performance year
end. Ratings that are given are from 1 to 5, 1 being unsatisfactory and 5 being exceeds expectations.
Incentives
All employees are eligible for a performance-related bonus as a percentage of salary. The level of award is based on
company performance, which is then modified between 0 and 250 percent based on individual performance, meaning that
top performers can receive up to 1.5x the initial corporate annual bonus award (being 100%).
Senior roles (Grades 1 and 2) are eligible for a Long Term Incentive Plan based on company financial objectives and
measured over a 3 year performance period, and a Restricted Share Plan to align the interests of management with the
interests of shareholders.
The company recently listed, and as a result employees were awarded a one-off IPO share award of £200 for all employees,
with an additional £200 for each year of full service up to a maximum of £1000.
The sales team receive sales incentives, and these are paid quarterly in cash.
Benefits
The company offers a suite of benefits including:
Income protection insurance Employee assistance programme
Life assurance Enhanced maternity/adoption leave
Payroll charity donations A range of shopping discounts
Discounted private health assessments Cycle to work scheme
Additional holiday purchase Season ticket loans
Private medical insurance Car salary sacrifice scheme
Discounted gym membership Childcare vouchers
Defined contribution pension scheme
Recruitment and retention
Certain roles are difficult for the company to recruit, for example those at the senior end or individuals who are highly
specialist. There are some issues with senior people wanting to move on to larger competitors with potentially higher
reward opportunities.
The company is currently trialling apprenticeships and if these work well they have identified their next step to be
implementing a graduate scheme. Although this is an ideal next step there are obvious challenges in planning a two year
graduate scheme within a very new business.
Employee recognition schemes
Aside from the standard incentives, employees can nominate each other for a recognition award to say thank you for a job
well done. Employees are rewarded £20 for every nomination they make and then £400 per quarter is distributed to the
top 5 performers.

Research into modern pay systems
Office of Manpower Economics PwC 47
Case study 9
Company details Key themes
Sector: Financial services
Business Activity: Insurance
Business type: UK parent (mutual)
Total number of UK employees: 2,000 – 10,000
Changes to salary setting approach
Performance management
Incentives
Harmonisation of terms and
conditions
Background to organisation and summary of recent changes
Background
Along with its subsidiaries, the company is one of the largest insurers in the UK. The company has an overarching reward
strategy that is outlined in the Directors' Remuneration Report; and underpins everything that the company does from a
pay perspective. This is summarised in the following 3 key principles:
Align executives' interests with those of our members and other customers.
Support delivery of Group strategy whilst ensuring adherence to the Group's risk appetite.
Align with relevant market practices.
As these principles are quite high-level they do not need to be regularly updated, as they allow a certain degree of flexibility.
However, these principles are to be updated formally next year.
Recent changes and strategic intent
The company is currently focusing on performance management, including:
Training and development for line managers to improve capability to deliver effective performance management
and handle difficult conversations; and
Improvements to performance management IT systems
Job families are being introduced to group unique roles. This is intended to simplify the remuneration structure and
improve internal pay governance.
Reward framework
Salary structure
There are 1,400 unique role profiles at the company, the characteristics of each role being determined through the use of a
job evaluation and grading system commonly found in the market. Alongside this grading, detailed pay benchmarking has
been undertaken in the past to help define the remuneration package for each role.
Due to the vast number of unique role profiles, there have been some calls from management to condense these roles into
job families in order to simplify the remuneration structure, and this is to be done in the near future. These job families,
once implemented, will allow for simpler internal pay governance (there being fewer jobs to manage, benchmark and
update) and more detailed analytics around areas such as equal pay.
Pay progression and promotion
Promotions do not follow a calendar, i.e. they do not typically occur at the end of a performance management year, as in
some organisations, but occur as and when a business need arises. There is a view that when the aforementioned job
families are put in place, this may facilitate the development of defined career paths for employees.
Performance management
Performance management follows an annual cycle with two fixed points - half year and end of year, with employees being
graded along a "guided" distribution curve. While the system seems to work currently, the general consensus is that it will
need to be changed in the near future, as there is a perception that the process is not applied with consistent rigour by all
managers.
This year the reward team are planning a programme to develop people manager capability in performance management.
From a systems perspective, the team currently use iTrent, though they note that a more advanced systems may be required
in the future to improve the efficiency and effectiveness of performance management.
Research into modern pay systems
Office of Manpower Economics PwC 48
Reward framework
Incentives
There are five types of variable remuneration at the company:
1 Group STIP (Short-term Incentive Plan)
a This is an annual award made using a scorecard assessing performance against Group, divisional and personal
targets.
b After performance is entered into the system, management are provided with a figure over which they have ultimate
discretion in awarding to the employee.
2 Sales incentive plans for selling to intermediaries
a Under these plans, there is a threshold number, and if an employee beats this threshold by a certain number of they
receive a bonus.
b Base salary is about 50% of on-target earnings, and so the operation of this incentive plan is important to these
employees. As a result, the plan undergoes annual reviews to ensure is remains appropriate.
3 Growth participation scheme in Asset Management
a This scheme consists of a pool of money which is apportioned on a discretionary basis among fund managers,
assessed against a cost threshold metric and whether there have been any breaches of the risk appetite statement.
b This award is then deferred for two years based on long term funds.
4 Standard LTIP
a This plan is for senior executives who sit on the Executive Committee and a few direct reports of the Executive
Committee. Entrance onto the plan on an invitation-only basis.
b Performance is assessed against a balanced scorecard, made up of financial, investment performance, customer
experience, assurance and people metrics.
5 LTIF
a This is a long term fund for asset managers.
b Performance is assessed 70% against an investment metric and 30% against a cost metric.
Alongside these five plans there is also a peer to peer recognition bonus, as well as more unofficial awards at the end of the
year such as bottles of champagne for specific achievements (e.g creating a good customer experience).
Benefits
The company has recently undertaken a large project to remove a legacy Defined Benefit scheme, and are currently thinking
about annual allowance changes and how to deal with this. A salary supplement is available to all those who applied for
protection from these changes.
Salary sacrifice is used elsewhere, encompassing a wide variety of benefits such as pension, childcare vouchers and bikes.
The company had been looking at removing cars from the list of potential benefits in order to de-risk their fleet, although
there has been significant resistance from employees.
Recruitment and retention
One of the key people issues the company faces is that individuals in internal audit, risk and compliance and senior
actuarial teams are challenging for the company to recruit and retain. In order to retain senior people from these areas,
certain employees are therefore invited to the LTIP. A further short-term incentive may also be put in place in the near
future.
Amongst the broader employee base, the company ensures that salaries remain competitive against the market through
regular benchmarking exercises and pay rises where required. The target is to hit median across all areas, and move people
through from 80% to 120% of median as required (based on experience and performance). To compensate London-based
employees for the increased costs of living the company also has a ‘London-pay range’.
Terms and conditions
The terms and conditions at the company were brought together from 12 different businesses. Therefore, while a lot has
been achieved by management in terms of harmonisation, there is still more to do, for example there are still 13 different
sets of redundancy arrangements. To deal with the problems caused by these different arrangements, management are
seeking to move to a single contract over the next two years.
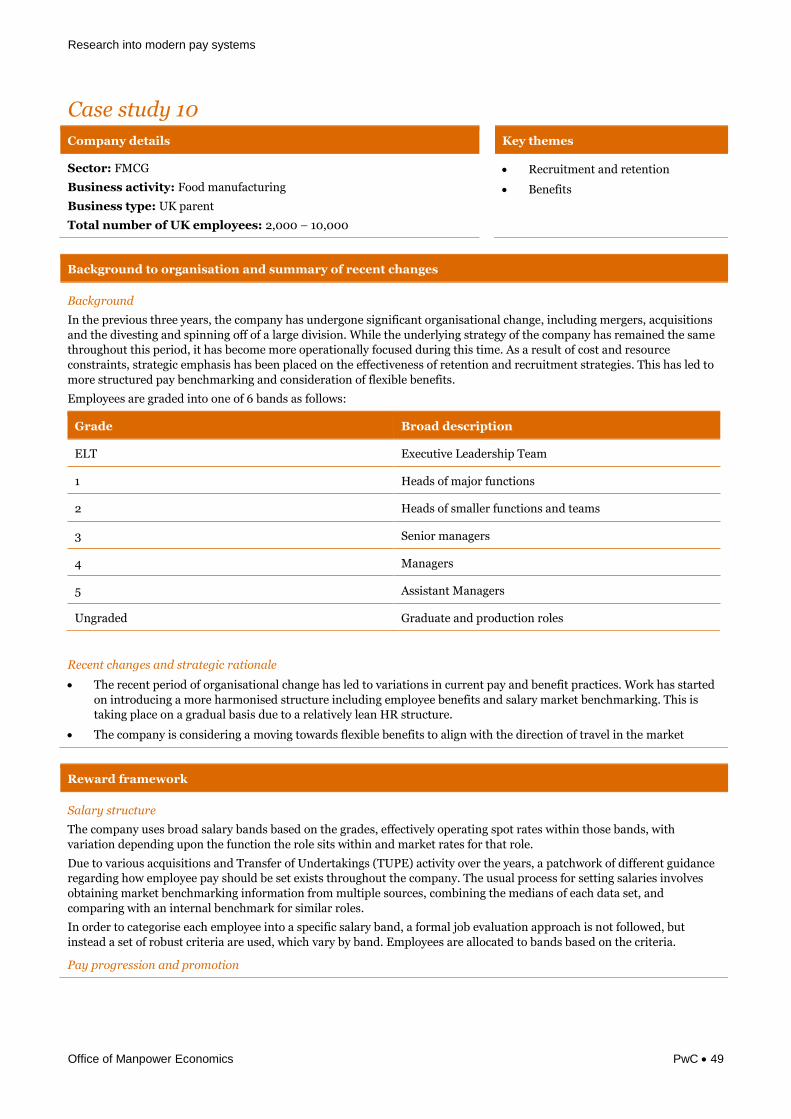
Research into modern pay systems
Office of Manpower Economics PwC 49
Case study 10
Company details Key themes
Sector: FMCG
Business activity: Food manufacturing
Business type: UK parent
Total number of UK employees: 2,000 – 10,000
Recruitment and retention
Benefits
Background to organisation and summary of recent changes
Background
In the previous three years, the company has undergone significant organisational change, including mergers, acquisitions
and the divesting and spinning off of a large division. While the underlying strategy of the company has remained the same
throughout this period, it has become more operationally focused during this time. As a result of cost and resource
constraints, strategic emphasis has been placed on the effectiveness of retention and recruitment strategies. This has led to
more structured pay benchmarking and consideration of flexible benefits.
Employees are graded into one of 6 bands as follows:
Grade Broad description
ELT Executive Leadership Team
1 Heads of major functions
2 Heads of smaller functions and teams
3 Senior managers
4 Managers
5 Assistant Managers
Ungraded Graduate and production roles
Recent changes and strategic rationale
The recent period of organisational change has led to variations in current pay and benefit practices. Work has started
on introducing a more harmonised structure including employee benefits and salary market benchmarking. This is
taking place on a gradual basis due to a relatively lean HR structure.
The company is considering a moving towards flexible benefits to align with the direction of travel in the market
Reward framework
Salary structure
The company uses broad salary bands based on the grades, effectively operating spot rates within those bands, with
variation depending upon the function the role sits within and market rates for that role.
Due to various acquisitions and Transfer of Undertakings (TUPE) activity over the years, a patchwork of different guidance
regarding how employee pay should be set exists throughout the company. The usual process for setting salaries involves
obtaining market benchmarking information from multiple sources, combining the medians of each data set, and
comparing with an internal benchmark for similar roles.
In order to categorise each employee into a specific salary band, a formal job evaluation approach is not followed, but
instead a set of robust criteria are used, which vary by band. Employees are allocated to bands based on the criteria.
Pay progression and promotion
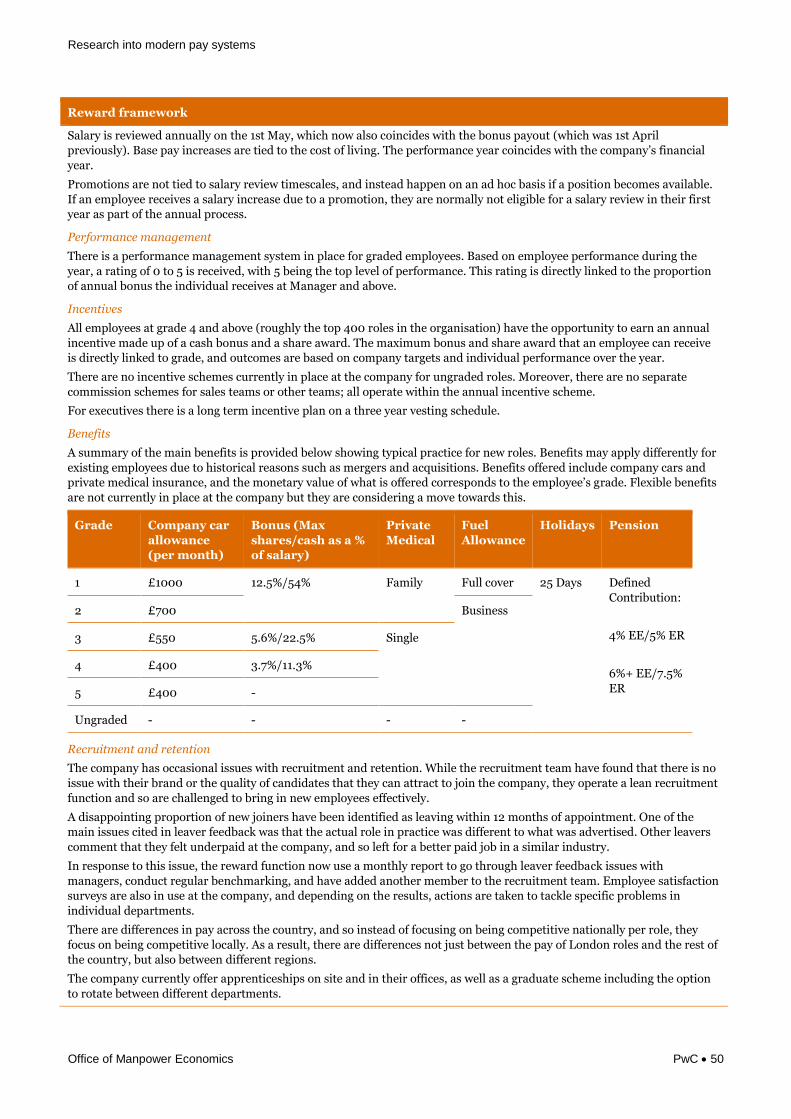
Research into modern pay systems
Office of Manpower Economics PwC 50
Reward framework
Salary is reviewed annually on the 1st May, which now also coincides with the bonus payout (which was 1st April
previously). Base pay increases are tied to the cost of living. The performance year coincides with the company’s financial
year.
Promotions are not tied to salary review timescales, and instead happen on an ad hoc basis if a position becomes available.
If an employee receives a salary increase due to a promotion, they are normally not eligible for a salary review in their first
year as part of the annual process.
Performance management
There is a performance management system in place for graded employees. Based on employee performance during the
year, a rating of 0 to 5 is received, with 5 being the top level of performance. This rating is directly linked to the proportion
of annual bonus the individual receives at Manager and above.
Incentives
All employees at grade 4 and above (roughly the top 400 roles in the organisation) have the opportunity to earn an annual
incentive made up of a cash bonus and a share award. The maximum bonus and share award that an employee can receive
is directly linked to grade, and outcomes are based on company targets and individual performance over the year.
There are no incentive schemes currently in place at the company for ungraded roles. Moreover, there are no separate
commission schemes for sales teams or other teams; all operate within the annual incentive scheme.
For executives there is a long term incentive plan on a three year vesting schedule.
Benefits
A summary of the main benefits is provided below showing typical practice for new roles. Benefits may apply differently for
existing employees due to historical reasons such as mergers and acquisitions. Benefits offered include company cars and
private medical insurance, and the monetary value of what is offered corresponds to the employee’s grade. Flexible benefits
are not currently in place at the company but they are considering a move towards this.
Grade Company car
allowance
(per month)
Bonus (Max
shares/cash as a %
of salary)
Private
Medical
Fuel
Allowance
Holidays Pension
1 £1000 12.5%/54% Family Full cover 25 Days Defined
Contribution:
4% EE/5% ER
6%+ EE/7.5%
ER
2 £700 Business
3 £550 5.6%/22.5% Single
4 £400 3.7%/11.3%
5 £400 -
Ungraded - - - -
Recruitment and retention
The company has occasional issues with recruitment and retention. While the recruitment team have found that there is no
issue with their brand or the quality of candidates that they can attract to join the company, they operate a lean recruitment
function and so are challenged to bring in new employees effectively.
A disappointing proportion of new joiners have been identified as leaving within 12 months of appointment. One of the
main issues cited in leaver feedback was that the actual role in practice was different to what was advertised. Other leavers
comment that they felt underpaid at the company, and so left for a better paid job in a similar industry.
In response to this issue, the reward function now use a monthly report to go through leaver feedback issues with
managers, conduct regular benchmarking, and have added another member to the recruitment team. Employee satisfaction
surveys are also in use at the company, and depending on the results, actions are taken to tackle specific problems in
individual departments.
There are differences in pay across the country, and so instead of focusing on being competitive nationally per role, they
focus on being competitive locally. As a result, there are differences not just between the pay of London roles and the rest of
the country, but also between different regions.
The company currently offer apprenticeships on site and in their offices, as well as a graduate scheme including the option
to rotate between different departments.
Research into modern pay systems
Office of Manpower Economics PwC 51
Reward framework
Terms and conditions
There is a desire to harmonise the terms and conditions of employee contracts as there are some legacy differences between
them, but no plan is currently in place to do so at present.
Equal pay
There is some concern with the government’s proposed approach to gender pay gap reporting. While internally there are no
equal pay issues and the differences in pay can be understood and explained, under the reporting criteria there may be seen
to be a gap within the company. This is currently being investigated and an action plan developed.
Research into modern pay systems
Office of Manpower Economics PwC 52
Case study 11
Company details Key themes
Sector: Legal services
Business type: Limited Liability Partnership
Total number of UK employees: 500 – 2,000
Performance management
Employee benefits
Background to organisation and summary of recent changes
Background
The company is a law firm based in the UK, providing a range of legal services. Following a number of changes in the
leadership team, the company has in recent years introduced a reward function and built a reward strategy that is clear,
concise and connected, based on the desire to move towards increased transparency around employee remuneration. This
reward strategy is focused on empirical data and operates within defined structures, as opposed to a more discretionary
approach typical of the wider legal sector.
The company now has in place the foundations of a robust reward structure, but there is still a lot of work to be done in
developing and streamlining this. The next phase for the reward function will be moving towards using job evaluation, as
well as looking at health benefits to drive employee wellbeing. There is also a desire amongst the reward function to move
towards a culture of recognition, with increased freedom for management to award instant recognition to employees, as
opposed to the standard end-of-year awards.
Recent changes and strategic rationale:
In recent years the company has been laying the foundations for a more evidence-based, transparent approach to
reward and performance. This is not typical within the legal sector, but is the direction that market leaders are taking.
The company has recently undertaken specialist benchmarking to better inform salary positioning and is in the
process of implementing job evaluation to ensure roles are sized effectively.
Performance management process improvement is on the company agenda to better align pay with performance. An
annual appraisal process will be launched this year.
Reward framework
Salary structure
The company does not currently publish pay scales for each grade. While broad guidance surrounding salary structures was
circulated this year, in the near future specified salary structures will be implemented for fee earning and business support
roles. This ties in with the desire in the reward function for increased transparency. The eventual aim is to be able to
quantify exactly what band each role sits in, and link pay to a consistent framework that ties together competencies,
learning and development.
The company wishes to be proactive about equal pay, though is to an extent reliant on the implementation of a job
evaluation system to fully understand their current position and take any action on pay.
For the first time, this year the reward function used salary survey data from a specialist benchmarking provider instead of
relying solely on recruitment agencies. From this survey data, the company now better understands a general market
positioning, but this information is not currently shared outside of HR. Given that the comparator group available in this
survey typically covers much larger competitors, it may without sufficient context and interpretation, be misleading for
employees and managers.
Pay progression and promotion
The pool for pay progression is based on company performance, but allocations are supported by market data. Ultimately
pay decisions are at the discretion of line managers, and are effective each April. Promotions also take place in April.
Any bonus that has been earned in the year is paid to the employee in June.
Performance management
There is no performance management technology currently in use, though a new appraisal system is being launched from
May onwards.
Focus on performance improvement plans is also on the agenda this year.
Research into modern pay systems
Office of Manpower Economics PwC 53
Reward framework
Incentives
It is possible for employees to earn a discretionary bonus, though this is more common among the fee earning population
than for support roles. There is a drive currently to make the bonus more visible to support staff, and link it more directly to
appraisal outcomes and metrics rather than relying on management discretion.
For partners, as at most professional service firms, there is an annual profit share, based ultimately on the discretion of the
remuneration committee but dictated by metrics such as revenue generation and seniority.
Benefits
Benefits provided include:
Private Medical Insurance
Permanent Health Insurance
Employee Assistance Programme
Life Assurance
Accident Insurance
Childcare Vouchers
Occupational Sick Pay
Maternity Pay
DC pension scheme
All pensions provided to employees are defined contribution, and all legacy Defined Benefit schemes have now been closed.
The company is currently consolidating pension providers, moving auto enrolment contributions to one provider, who
currently provide the higher opt-in pension scheme with employer contributions of 5% for employees that contribute 4%.
Recruitment and retention
Staff based in London typically receive higher remuneration than those in the regions due to the competitive London legal
market. In terms of resourcing, specialists are often sourced in London. However, resourcing is often reactive, and a more
proactive approach to resourcing and succession planning may make sourcing key talent a smoother and more effective
process.
Going forwards, there is the desire to launch an apprenticeship scheme, which may also involve graduates.

Research into modern pay systems
Office of Manpower Economics PwC 54
Case study 12
Company details Key themes
Sector: FMCG
Business activity: Drinks manufacturer
Business type: Private UK company
Total number of UK employees: 500 – 2,000
Performance Management
Annual bonus
Employer brand and value
proposition
Background to organisation and summary of recent changes
Background
The organisation is family owned, with a family counsel supervisory board, an executive board, and three major business
units (branding, operations, and central services). The majority of employees are within the operations business unit, and
the majority of operations take place in the UK.
The reward strategy is refreshed every 3 years in line with business strategy, and is soon to be reviewed. The company
intends to look at all of the fundamental elements of pay and whether they are still fit for purpose. Since the recession, the
process for determining pay has not changed. Pay awards have continued year on year but quantum has dropped when
economic conditions have been particularly challenging.
There are 5 main broad grades in place:
Grade Broad description
1 Executive Leadership Team
2 Senior Leadership
3 People / Area Leadership (Management)
4 Specialists / Coordinators / Supervisors
5 Team Members and Administrators
Recent changes and strategic rationale
The company has developed a strong a pay-for-performance culture with a robust performance management system
based on goals and core company values. This is linked to annual bonus and salary increases.
The company has few retention problems and highly engaged employees. This is attributed to significant work on the
employee value proposition, including employer branding and communication of company values.
Reward framework
Salary structure
Salary structures differ depending on business unit. For the majority of operations staff, fixed pay rates are used. These are
not linked to performance, and individuals are all paid a fixed rate for the job. However, engineers, technical positions, and
those in leadership/supervisory roles are not on fixed rates, and are instead on salary scales.
The branded business and central operations business units (and operations engineers, technical positions and
management) use broad pay bands based on the company grades, with individual employee rates set on the basis of market
positioning.
Pay progression and promotion
Pay progression is based on market comparison and personal performance. Because salary increases are primarily
performance driven, it is common for some employees to receive larger pay increases than others as a result of their
appraisal rating. The budget for salary increases is based on revenue in the last quarter of the year before. Pay budgets also
take into account wage and price inflation.
Research into modern pay systems
Office of Manpower Economics PwC 55
Reward framework
Performance management
There is an online tool used for management performance management. Individual performance is reviewed against three
main areas:
Performance review against measurable goals set at the beginning of the year ("the what")
Performance review against company values ("the how")
Personal development over the course of the year ("future potential")
Line manager and employee performance and development interactions are triggered by the online tool. It is expected that
the individual will submit evidence against their goals they set at the beginning of the year, and evidence that they are
behaving in line with the company values. Goals are set in line with core competencies and values expected as part of the
role. Employees each have a copy of their job description which includes a 'Success Profile', outlining core competencies
and core values, technical competencies. Individuals produce evidence to support they are doing this.
At year end, there is a conversation on how the employee has performed, and how they can develop. The line manager then
submits a proposed rating, and there is oversight from the line manager's leader (and their leader above them to ensure
fairness. The company does not used forced or guided distribution, but it is believed that most line managers understand
that bonus pot is influenced by the number of high performers.
Incentives
All employees are eligible for a bonus. There are 2 main schemes, split by function and by seniority:
The Functional annual bonus scheme applies to all employees in Grades 1, 2, 3 and commercial and marketing roles
sitting within level 4. The bonus opportunity differs by level and function. For Grade 2, annual opportunity is up to a
max of 60%, and for Grade 3, annual opportunity is up to 22.5%. The company needs to meet a threshold level of
financial performance before bonuses pay out, and then individual performance is measured to provide the outcome.
The Company scheme applies to everyone in operations and central services at Grade 4, and all employees throughout
the organisation at Grade 5. Bonuses are paid on a weighted basis between company financial performance and
individual performance (72% company performance and 28% on individual performance).
There is a cash-based long term incentive plan in operation for all employees at grades 1 and 2. The maximum opportunity
for Grade 2 is 45% of salary, with 30% payout for on target performance. Performance is based on 3 year cycles, with two
financial metrics being measured: Net Sales Value and Gross Contribution.
Benefits
Universal benefits are provided for all employees. These include buying and selling of holidays, enhanced sick pay, private
healthcare, life cover, company car allowance and pension.
The company used to operate a defined benefit pension scheme but closed this in 2007 and now offer a defined
contribution scheme for those employed since this time.
Recruitment and retention
The company has few retention problems but foresees potential engineering shortages in the future. There has been a push
to hire graduate engineers and the recent oil and gas recession has helped with this.
As the company has some remote locations, there is occasionally difficulty in recruiting high calibre individuals. In these
rare cases, there is the ability to pay above the market median.
Employee brand and value proposition
The company has very high employee engagement scores, with this being attributed to pride in the employer brand, and
how employees are treated. The company has done a lot of work to raise brand profile, pride in the brand and the
importance of their values. There is a company-wide recognition scheme with a cash bonus 3 times a year for employees
who have the best example of ‘living the values’.
Research into modern pay systems
Office of Manpower Economics PwC 56
Case study 13 – University of Westminster – In-depth case study on developing a new reward strategy
Company details Key themes
Sector: Public
Business activity: University
Total number of UK employees: 2,000 – 10,000
Workforce specifics of note: High proportion of specialist roles
(academics)
Collective bargaining
Performance management
Reward framework
Background
Based in the heart of London, the University of Westminster attracts over 20,000 students from UK and abroad. The
University's academic activities are organised into seven faculties and schools, within which there are around 40
departments. The University was founded as Britain's first polytechnic in 1838 and awarded University status in 1992. In
2015, it ranked 100 in the league table of the Complete University Guide UK. The University's leading research areas are
politics, media, art and design, architecture and biomedical sciences.
Taking advantage of its London based location, popularity among students and world-leading research facilities, a new
strategy, Westminster 2020, was launched in August 2015. Although still at the inception stage, the new strategy will enable
the University to become a 'practise focused university in the top half of the Higher Education Institutions in the UK with
some disciplines in the top 500 worldwide', and to 'retain its success and sustainability within an increasingly crowded and
competitive Higher Education environment'. One of the key enablers to facilitate the delivery of Westminster 2020 is the
development of the People Strategy (see foot of Case Study).
Around 3,000 employees work for the University including 169 in senior management level, 900 lecturers, senior lecturers,
principals & researchers, 800 visiting academics and 1,120 support staff.
The governance of the University is led by the Court of Governors which approves the University's long-term objectives and
strategies. The Court comprises of independent (non-executive) governors, elected staff governors, an elected student
governor, and two ex-officio governors (the Vice-Chancellor and the Deputy Vice-Chancellor)
Recent changes
Westminster operate three main pay and grading structures - a negotiated incremental pay spine system, managerial
and professorial grades
The Westminster 2020 People Strategy was launched in August 2015 as part of the overall Westminster 2020 strategy.
The People Strategy will create a 'One Vision' ethos and all terms and conditions, with the exception of salary will be
harmonised. Employer brand, and staff development are key to achieving the objectives of the new strategy
Westminster will also be introducing additional benefits on top of existing benefits to enhance employer brand and
updating the competency framework
There are three main pay and grading structures for university staff.
1 Within a nationally negotiated 51 point pay spine are the support grade, NG0 to NG8 and academic grade staff, Ac1 to
Ac4 on incremental salaries with 4 to 5 points in each grade.
2 Overlapping and above the 51 point pay spine are around 169 staff on local management contracts - L1 to L5 - together
with three professorial grades, Prof C, B and A grades, which are equivalent to L3, L4 and L5.
3 Seven members of staff are in the senior management group consisting of staff in L6 to L9, with the vice chancellor at
the top (L9).
Moving up the 51 pay spine within the salary band is automatic, unless someone is subject to a formal capability or
disciplinary process, but in practice about 40% of staff progress to the next pay point with the remaining already at the top
of their pay bands. Once employees reach the top of the pay band they receive only the cost of living increase. The
University has a single year nationally negotiated pay deal for those not on performance related pay, which amounted to 1%
increase in August 2015.
Separately, salaries, terms and conditions of employment of senior managers on grades 9 to 6 are determined by the
University of Westminster's remuneration committee. When setting pay, the remuneration committee will consider
location as a key element, using London and the South East salary data provided by the University and Colleges Employers
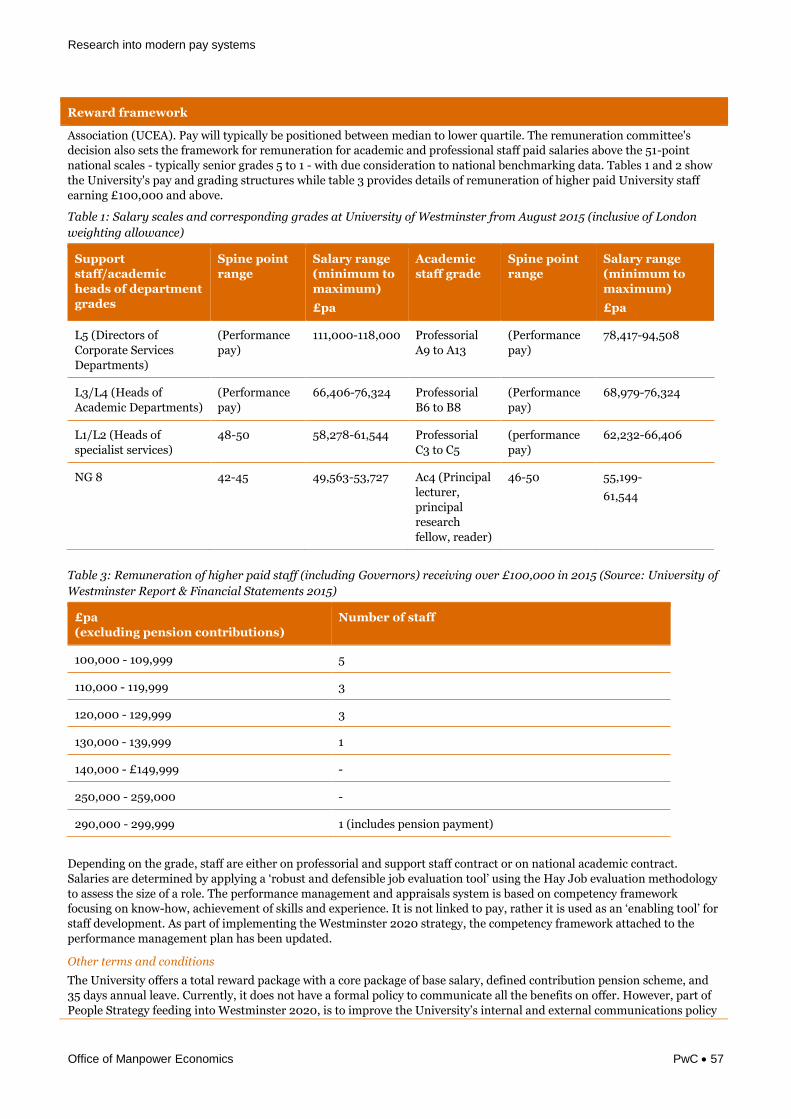
Research into modern pay systems
Office of Manpower Economics PwC 57
Reward framework
Association (UCEA). Pay will typically be positioned between median to lower quartile. The remuneration committee's
decision also sets the framework for remuneration for academic and professional staff paid salaries above the 51-point
national scales - typically senior grades 5 to 1 - with due consideration to national benchmarking data. Tables 1 and 2 show
the University's pay and grading structures while table 3 provides details of remuneration of higher paid University staff
earning £100,000 and above.
Table 1: Salary scales and corresponding grades at University of Westminster from August 2015 (inclusive of London
weighting allowance)
Support
staff/academic
heads of department
grades
Spine point
range
Salary range
(minimum to
maximum)
£pa
Academic
staff grade
Spine point
range
Salary range
(minimum to
maximum)
£pa
L5 (Directors of
Corporate Services
Departments)
(Performance
pay)
111,000-118,000 Professorial
A9 to A13
(Performance
pay)
78,417-94,508
L3/L4 (Heads of
Academic Departments)
(Performance
pay)
66,406-76,324 Professorial
B6 to B8
(Performance
pay)
68,979-76,324
L1/L2 (Heads of
specialist services)
48-50 58,278-61,544 Professorial
C3 to C5
(performance
pay)
62,232-66,406
NG 8 42-45 49,563-53,727 Ac4 (Principal
lecturer,
principal
research
fellow, reader)
46-50 55,199-
61,544
Table 3: Remuneration of higher paid staff (including Governors) receiving over £100,000 in 2015 (Source: University of
Westminster Report & Financial Statements 2015)
£pa
(excluding pension contributions)
Number of staff
100,000 - 109,999 5
110,000 - 119,999 3
120,000 - 129,999 3
130,000 - 139,999 1
140,000 - £149,999 -
250,000 - 259,000 -
290,000 - 299,999 1 (includes pension payment)
Depending on the grade, staff are either on professorial and support staff contract or on national academic contract.
Salaries are determined by applying a ‘robust and defensible job evaluation tool’ using the Hay Job evaluation methodology
to assess the size of a role. The performance management and appraisals system is based on competency framework
focusing on know-how, achievement of skills and experience. It is not linked to pay, rather it is used as an ‘enabling tool’ for
staff development. As part of implementing the Westminster 2020 strategy, the competency framework attached to the
performance management plan has been updated.
Other terms and conditions
The University offers a total reward package with a core package of base salary, defined contribution pension scheme, and
35 days annual leave. Currently, it does not have a formal policy to communicate all the benefits on offer. However, part of
People Strategy feeding into Westminster 2020, is to improve the University’s internal and external communications policy
Research into modern pay systems
Office of Manpower Economics PwC 58
Reward framework
including the development of a Total Reward Statement, highlighting the values of benefits that are currently poorly
recognised and promoted to staff. A number of future benefits are also being considered to enhance the employer brand to
promote the Westminster 2020 strategy. A list of current benefits are shown in Box 1 while employer brand and benefits are
discussed in full below.
Box 1: Existing benefits at University of Westminster at 2016
Occupational Pension Schemes:
Local Pensions Fund Authority (LPFA)
University Superannuation Scheme (USS)
Teachers Pension Scheme (TSS)
Flexible working
Eye care vouchers – free eye tests and money-off cost of glasses for all VDU users
Employee assistance helpline, free advice including
financial matters
medical concerns
legal issues and consumer rights
relationships
eldercare and childcare options
housing challenges
Professional staff networks
Childcare vouchers
Give as you earn (charitable donation)
Cycle to work – salary sacrifice, tax free bikes
Annual season ticket loans interest free
Simply health medical cash plan
Long service award-£250 fixed sum
Well-being day
Staff gym and sports facilities
Aims of Westminster 2020 and the new People Strategy
The aims and vision of Westminster 2020 is shown in Box 2 but as stated above, the People Strategy is an important
facilitator of Westminster 2020. There are five themes and priorities attached to People Strategy. These are:
Employer branding & resourcing – fit for purpose technologies & strategies; visible university values & behaviours;
open and clear communication.
Reward, benefits & incentives – flexible and fit for purpose terms & conditions; career pathways for all job families;
flexible & appropriate exit strategies.
Workforce planning – size, shape & cost of staff population; knowledge & skills for the future; fit for purpose roles &
structures.
Safety, health & well-being
Organisational & staff engagement & development.
The working culture needed to achieve Westminster 2020, says the University, should be ‘the skills and behaviours’ that are
underpinned by the ‘University values statements and ‘modelled’ by all managers to bring them to life and make them ‘live’
’. People Strategy will be updated annually to adjust to the changing needs of the University and its staff. The University’s
forward thinking and people management information reporting is shown Appendix 8.
Box 2: University of Westminster, aims and vision of Westminster 2020
By 2020 the aim is to:
Foster a culture where all staff are fully engaged in achieving the success of our single shared vision.

Research into modern pay systems
Office of Manpower Economics PwC 59
Reward framework
Establish key international partnerships and increase both the numbers of international students at
the University and UK students studying overseas.
Grow the student population while maintaining an attractive and affordable staff-student ratio
without reducing quality.
Achieve an overall graduate employability level in the upper quartile of UK institutions.
Significantly increase income from research, academic enterprise and commercial activities
Increase annual turnover to maintain long-term financial sustainability of the University and provide
stability for staff and students.
Be ranked in the top half of UK HEIs with some disciplines ranked in the top 500 worldwide
Establish key international partnerships and increase the numbers of international students at the
University and UK students studying overseas
Employer branding & resourcing
Employer branding or the Westminster identity, was adopted as a tool to position the University as the ‘employer of choice’
in order to attract and retain appropriate people. The University’s new ethos of, ‘One Vision’, aims to achieve an ‘open, fair
and equitable’ working culture for all employees irrespective of grade. As a result, the University has harmonised all terms
and conditions across all staff groups as part of its principle of treating all staff the same. The only difference in benefits
relates to an individual’s pay band, as determined by the use of a robust job evaluation tool using the Hay methodology. The
University states that it preferred this course of action rather than introducing new elements to reward packages as that
would be construed as divisive. It was important to communicate this new ethos into the employer brand for recruitment
and retention purposes.
However, before the policy to improve employer brand was implemented, the University carried out research analysis to
gain a better picture of the institution’s current image against its comparators and peers. The results indicated that a
number of gaps needed to be addressed. For example, the University’s recruitment website, did not portray the University
as a leading and forward thinking organisation and provided a poor image and first impression of the institution.
Additionally, IT applications fell well short of best practice and was not interactive with the usage of latest technology.
The planning process also included obtaining feedback from a representative group of Westminster’s staff cohort to
understand the extent of its current employee engagement and the employer value proposition (EVP). EVP describes the
mix of features, benefits, and ways of working in an organisation. Also known as the ‘People Deal’, EVP characterises an
employer and differentiates it from its competition. The results also showed that a number of improvements were needed.
Value to EVP could be added, for instance, by highlighting its location and connection with the UK government and
industry. The University will develop its EVP not as a stand-alone policy but linked to other key strategies such as career
pathways and reward and benefits.
Benefits
On top of harmonising all terms and conditions for all groups of staff, part of the ‘employer of choice’ and employer brand
was to further improve the benefits system around a flexible package tailored to meet the needs of the diverse staff
expectations, career choices and lifestyles. This decision was supported by existing market studies which showed that,
‘knowledge economy where careers in higher education are located, financial considerations are in themselves ineffective
motivators for the type of people attracted to roles that require creativity, drive and thought’. Additionally, generational
impact on staff profile and Generation Y, do not necessarily value money as the key form of compensation, rather they
prefer social impact and personal growth.
Benefits provision was therefore benchmarked against five comparative universities as well as private and other public
sector organisations. Although this showed that Westminster was well placed in its benefits provision, it did not offer the
five most popular covers found in the results. These were:
Life cover;
Enhanced private medical care including dental;
Professional subscriptions through salary sacrifice;
Discounted PCs/mobile phones;
Car leasing.
Although, life cover is already offered to senior staff, the University is planning to investigate the options to extend this
benefit to all other staff and recommending the adoption of the other top benefits. A list of possible future benefits are
shown in the box below.
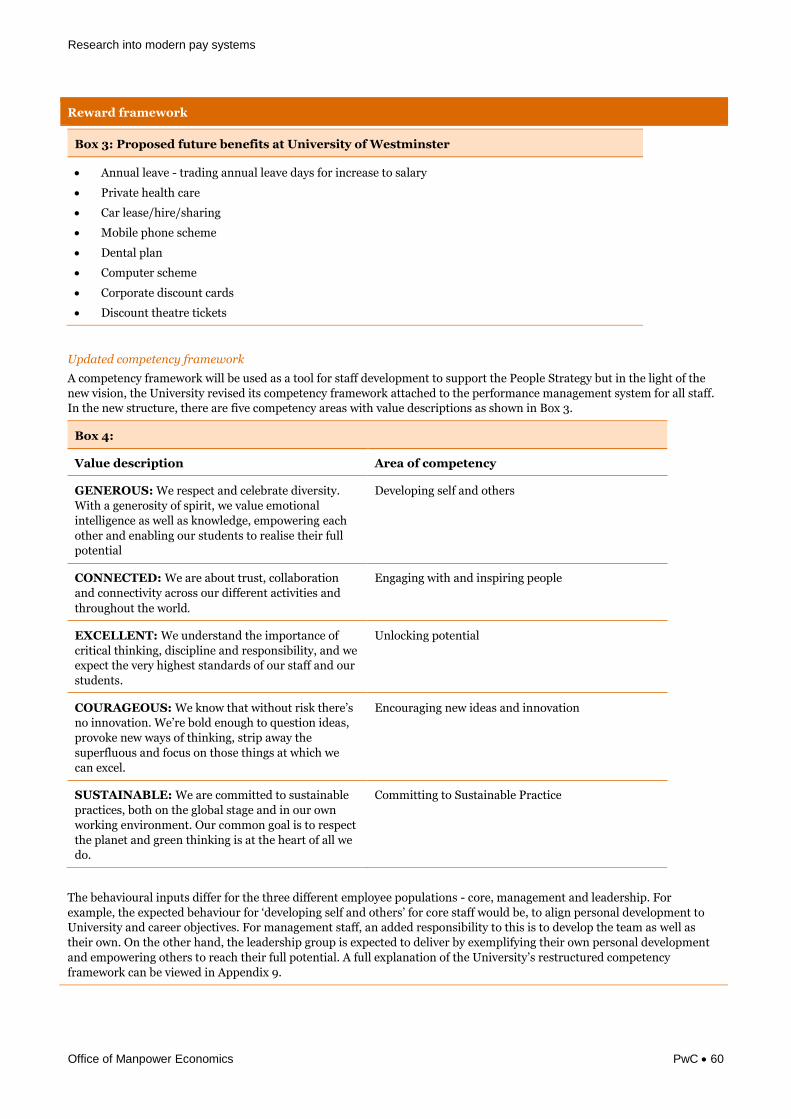
Research into modern pay systems
Office of Manpower Economics PwC 60
Reward framework
Box 3: Proposed future benefits at University of Westminster
Annual leave - trading annual leave days for increase to salary
Private health care
Car lease/hire/sharing
Mobile phone scheme
Dental plan
Computer scheme
Corporate discount cards
Discount theatre tickets
Updated competency framework
A competency framework will be used as a tool for staff development to support the People Strategy but in the light of the
new vision, the University revised its competency framework attached to the performance management system for all staff.
In the new structure, there are five competency areas with value descriptions as shown in Box 3.
Box 4:
Value description Area of competency
GENEROUS: We respect and celebrate diversity.
With a generosity of spirit, we value emotional
intelligence as well as knowledge, empowering each
other and enabling our students to realise their full
potential
Developing self and others
CONNECTED: We are about trust, collaboration
and connectivity across our different activities and
throughout the world.
Engaging with and inspiring people
EXCELLENT: We understand the importance of
critical thinking, discipline and responsibility, and we
expect the very highest standards of our staff and our
students.
Unlocking potential
COURAGEOUS: We know that without risk there’s
no innovation. We’re bold enough to question ideas,
provoke new ways of thinking, strip away the
superfluous and focus on those things at which we
can excel.
Encouraging new ideas and innovation
SUSTAINABLE: We are committed to sustainable
practices, both on the global stage and in our own
working environment. Our common goal is to respect
the planet and green thinking is at the heart of all we
do.
Committing to Sustainable Practice
The behavioural inputs differ for the three different employee populations - core, management and leadership. For
example, the expected behaviour for ‘developing self and others’ for core staff would be, to align personal development to
University and career objectives. For management staff, an added responsibility to this is to develop the team as well as
their own. On the other hand, the leadership group is expected to deliver by exemplifying their own personal development
and empowering others to reach their full potential. A full explanation of the University’s restructured competency
framework can be viewed in Appendix 9.
Research into modern pay systems
Office of Manpower Economics PwC 61
Case study 14 – Amnesty International – In-depth case study on pay system restructuring
Company details Key themes
Sector: Charity
Business activity: Charity
Business type: Global human rights organisation
Total number of UK employees: 500 – 2,000
Collective bargaining
Restructuring of pay system
Move to performance related pay
system for senior individuals
Background to organisation and summary of recent changes
Background
A global re-structuring programme commencing in 2012 involved decentralising Amnesty International, International
Secretariat (AIIS) workload from a heavily staffed UK based hub to ten newly created international hubs. The thinking
behind this action was to, ‘get nearer to human rights abuses, rather than be seen to dictate from the UK’. The organisation
moved from 5% of total staff overseas to 50% of total staff overseas, resulting in 200 staff redundancies in the UK. Prior to
the re-distribution programme, Amnesty International attracted some negative publicity, when the Secretary General and
the Deputy received, what was perceived to be high severance payments for a non-profit organisation. An independent
review followed and a number of steps were instigated to strengthen the organisation’s management and governance
procedures. Two key implementations were the introduction of a new remuneration committee and extensive work on
governance.
These changes and staff dissatisfaction paved the way to reassess the pay structure for the non-senior leadership team. Pay
had not been reviewed since 2008 and there was a need to make it ‘fit for purpose’, recognising the cultural norm of
‘overpaying at the bottom and underpaying at the top’. This did not require a radical overhaul of the pay system and with a
heavily unionised staff, a restructuring of the pay system was negotiated with a two-year transition period culminating in
the 2016/2017 pay cycle.
Recent changes
The pay and grading structure for AIIS non-senior management staff is based on a length of service, automatic
incremental pay system. Employees move up each step after one year of service. On top of this, an annual cost-of-living
increase is applied. When employees reach the grade ceiling, they only receive the cost-of-living increase and moving
to the next grade requires promotion. The pay structure consists of seven grades where grade 1 is the lowest and grade
7 is the highest. Within each grade there are six incremental steps. To reduce pay differentials, AIIS redefined step
increases in all seven grades and grade boundaries were recalibrated to create a new structure with less overlap.
AIIS also introduced newly defined step increases using external benchmarking data against comparator organisations
and the cost-of-living increase now based on CPI measure subject to a cap
The senior leader team are on performance pay system and broad-band pay structure
Reward framework
Pay structure changes for London staff
The pay and grading structure for AIIS non-senior management staff is based on a length of service, automatic incremental
pay system. Employees move up each step after one year of service. On top of this, an annual cost-of-living increase is
applied. When employees reach the grade ceiling, they only receive the cost-of-living increase and moving to the next grade
requires promotion. The pay structure consists of seven grades where grade 1 is the lowest and grade 7 is the highest.
Within each grade there are six incremental steps. Step 1 is positioned at the bottom of the grade and step 6 is at the top.
Job examples of grades are given below. There are around 20 staff in grades 1 and 2 and 70 in grades 6 and 7. The bulk of
the employees, approximately 500, are within grades 3, 4 and 5.
Grade job examples at Amnesty International, International Secretariat
Grade 7 = Programme Directors/Regional Director/PD, Advocacy/PD, Campaigns/PD, Global Thematic Research
Grade 6 = Deputy Programme Directors/Senior Researcher/Head of Management Accounts/Human Resource
Business Partner
Grade 5 = Researcher
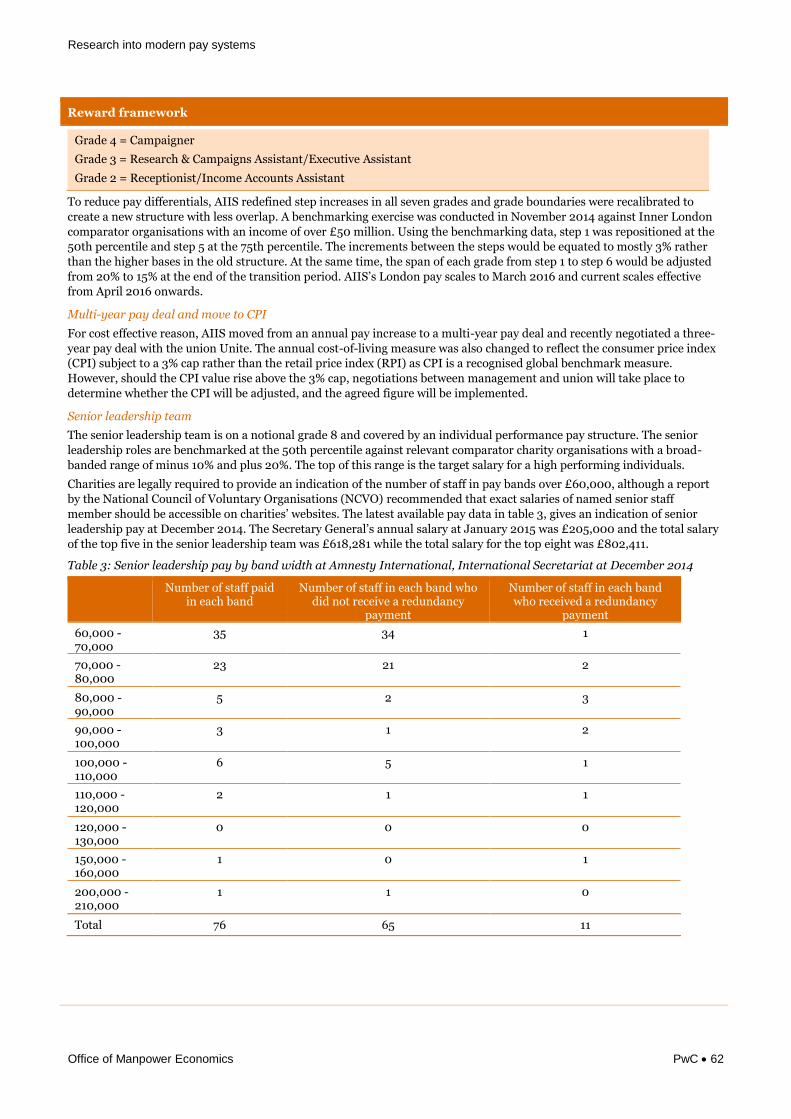
Research into modern pay systems
Office of Manpower Economics PwC 62
Reward framework
Grade 4 = Campaigner
Grade 3 = Research & Campaigns Assistant/Executive Assistant
Grade 2 = Receptionist/Income Accounts Assistant
To reduce pay differentials, AIIS redefined step increases in all seven grades and grade boundaries were recalibrated to
create a new structure with less overlap. A benchmarking exercise was conducted in November 2014 against Inner London
comparator organisations with an income of over £50 million. Using the benchmarking data, step 1 was repositioned at the
50th percentile and step 5 at the 75th percentile. The increments between the steps would be equated to mostly 3% rather
than the higher bases in the old structure. At the same time, the span of each grade from step 1 to step 6 would be adjusted
from 20% to 15% at the end of the transition period. AIIS’s London pay scales to March 2016 and current scales effective
from April 2016 onwards.
Multi-year pay deal and move to CPI
For cost effective reason, AIIS moved from an annual pay increase to a multi-year pay deal and recently negotiated a three-
year pay deal with the union Unite. The annual cost-of-living measure was also changed to reflect the consumer price index
(CPI) subject to a 3% cap rather than the retail price index (RPI) as CPI is a recognised global benchmark measure.
However, should the CPI value rise above the 3% cap, negotiations between management and union will take place to
determine whether the CPI will be adjusted, and the agreed figure will be implemented.
Senior leadership team
The senior leadership team is on a notional grade 8 and covered by an individual performance pay structure. The senior
leadership roles are benchmarked at the 50th percentile against relevant comparator charity organisations with a broad-
banded range of minus 10% and plus 20%. The top of this range is the target salary for a high performing individuals.
Charities are legally required to provide an indication of the number of staff in pay bands over £60,000, although a report
by the National Council of Voluntary Organisations (NCVO) recommended that exact salaries of named senior staff
member should be accessible on charities’ websites. The latest available pay data in table 3, gives an indication of senior
leadership pay at December 2014. The Secretary General’s annual salary at January 2015 was £205,000 and the total salary
of the top five in the senior leadership team was £618,281 while the total salary for the top eight was £802,411.
Table 3: Senior leadership pay by band width at Amnesty International, International Secretariat at December 2014
Number of staff paid in each band
Number of staff in each band who did not receive a redundancy
payment
Number of staff in each band who received a redundancy
payment
60,000 - 70,000
35 34 1
70,000 - 80,000
23 21 2
80,000 - 90,000
5 2 3
90,000 - 100,000
3 1 2
100,000 - 110,000
6 5 1
110,000 - 120,000
2 1 1
120,000 - 130,000
0 0 0
150,000 - 160,000
1 0 1
200,000 - 210,000
1 1 0
Total 76 65 11
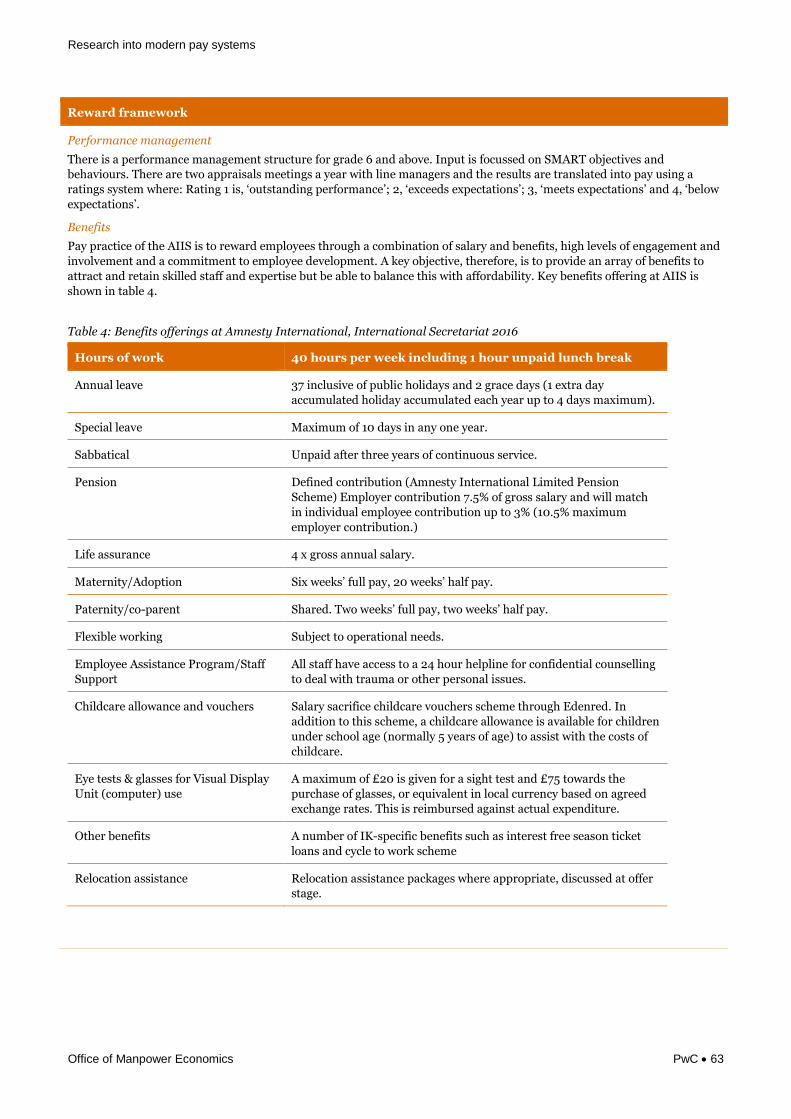
Research into modern pay systems
Office of Manpower Economics PwC 63
Reward framework
Performance management
There is a performance management structure for grade 6 and above. Input is focussed on SMART objectives and
behaviours. There are two appraisals meetings a year with line managers and the results are translated into pay using a
ratings system where: Rating 1 is, ‘outstanding performance’; 2, ‘exceeds expectations’; 3, ‘meets expectations’ and 4, ‘below
expectations’.
Benefits
Pay practice of the AIIS is to reward employees through a combination of salary and benefits, high levels of engagement and
involvement and a commitment to employee development. A key objective, therefore, is to provide an array of benefits to
attract and retain skilled staff and expertise but be able to balance this with affordability. Key benefits offering at AIIS is
shown in table 4.
Table 4: Benefits offerings at Amnesty International, International Secretariat 2016
Hours of work 40 hours per week including 1 hour unpaid lunch break
Annual leave 37 inclusive of public holidays and 2 grace days (1 extra day
accumulated holiday accumulated each year up to 4 days maximum).
Special leave Maximum of 10 days in any one year.
Sabbatical Unpaid after three years of continuous service.
Pension Defined contribution (Amnesty International Limited Pension
Scheme) Employer contribution 7.5% of gross salary and will match
in individual employee contribution up to 3% (10.5% maximum
employer contribution.)
Life assurance 4 x gross annual salary.
Maternity/Adoption Six weeks’ full pay, 20 weeks’ half pay.
Paternity/co-parent Shared. Two weeks’ full pay, two weeks’ half pay.
Flexible working Subject to operational needs.
Employee Assistance Program/Staff
Support
All staff have access to a 24 hour helpline for confidential counselling
to deal with trauma or other personal issues.
Childcare allowance and vouchers Salary sacrifice childcare vouchers scheme through Edenred. In
addition to this scheme, a childcare allowance is available for children
under school age (normally 5 years of age) to assist with the costs of
childcare.
Eye tests & glasses for Visual Display
Unit (computer) use
A maximum of £20 is given for a sight test and £75 towards the
purchase of glasses, or equivalent in local currency based on agreed
exchange rates. This is reimbursed against actual expenditure.
Other benefits A number of IK-specific benefits such as interest free season ticket
loans and cycle to work scheme
Relocation assistance Relocation assistance packages where appropriate, discussed at offer
stage.
Research into modern pay systems
Office of Manpower Economics PwC 64
Case study 15 – Ageas – In-depth case study on harmonising reward arrangements and terms and conditions following organisational change
Company details Key themes
Sector: Financial Services
Business activity: Insurance Service Company
Business type: UK subsidiary
Total number of UK employees: 2,000 – 10,000
Harmonising terms and conditions
Performance management
Annual bonus
Background to organisation and summary of recent changes
Background
Since 2000 the company has increased in size tenfold, after merging with or acquiring multiple other companies. This
growth created a complex organisation structure and multiple HR systems; payroll teams; HR policies; employee contracts;
and third party providers used throughout the company. These differences led to inconsistencies in employee terms and
conditions and experiences of working for the company.
The company has undergone a period of change brought on by a combination of legislative pressures (such as pension auto-
enrolment) and the need for harmonisation across the company. The HR teams from across the UK have recently been
brought together with the aim of providing consistency of policies, practices and terms and conditions throughout the
business. Harmonisation has helped create a clear 'one organisation' image, and has had the added advantage of cost
savings, e.g. by using the same providers in all parts of the business, bulk discounts have been available.
A formal Reward strategy is in place, which focuses on the following:
To provide a reward package that is competitive in the marketplace in order to attract and retain employees
To provide a reward package that is sustainable for the company
To ensure that the reward processes are simple, open, honest and transparent
To differentiate pay based on performance, in order to deliver enhanced business performance, while ensuring
remuneration systems support fair customer outcomes
Recent changes and strategic rationale
The organisational change over the last decade has created a complex array of terms and conditions and pay practices, with
individual businesses running relatively autonomously.
The organisation has recently undergone a period of harmonisation to counteract these challenges, including:
Harmonising employee terms and conditions
Developing a new grading structure and associated pay scales
Pension changes
Bringing all employees under one annual bonus reaction
Introducing flexible benefits
Reward framework
Salary structure
The company has recently undergone a process of developing consistent grades across the organisation. Previously, five of
the company’s businesses had no grading and pay banding arrangements in place at all, with employees receiving spot
rates. Two of the larger businesses used the Hay approach to grading, but both businesses applied it in a different way. A
harmonised approach to job evaluation and grading across the company was required, and the company worked with a job
evaluation provider and pay benchmarking specialist to develop a robust job evaluation methodology, and six grades to
cover all roles below the Executive team. Using Hay and a pay benchmarking provider to better access and use market data,
the company created six grades, each with associated pay scales, to cover all roles below the Executive group. Each function
has a ‘career ladder’ corresponding to the grades, with associated pay scales.

Research into modern pay systems
Office of Manpower Economics PwC 65
Reward framework
The pay benchmarking approach for new roles involves looking at market data and adjusting for a variety of factors, such as
difficulty in recruiting, and high employee turnover rates. Salaries are generally set at between 80-120% of market median,
unless there is a specific reason as to why it should be otherwise. Each proposed benchmark is reviewed for affordability
and to ensure it aligns with internal relativities.
Pay progression and promotion
Salaries are reviewed on an annual basis, and take into account affordability, market information and other external
factors, for example the new living wage regulations.
Performance management
There is a performance management process in place consisting of annual review by line manager. Annual appraisal results
feed in to the bonus scheme.
Incentives
In 2015, there were five different bonus schemes due to legacy schemes in different businesses, but there is a proposal to
harmonise these schemes in 2016 into one company-wide bonus scheme. The same company metrics will be used for all
employees in the scheme (UK net profit, UK return on earnings and individual performance). Each of these measures will
have a trigger which needs to be met before any payment is made, and bonus payments will be distributed based on
individual performance.
Separately, sales individuals receive a sales bonus or are on specific commission arrangements.
Benefits
The company rolled out flexible benefits to all employees in 2013, with the list of benefits increasing for 2014 and 2015. The
benefits provided include the ability to buy and sell holiday, the option to buy life assurance, care lease schemes, illness
insurance and a card offering discounts at a variety of restaurants. The number of employees who have taken up flexible
benefits is high; in 2013 37% of employees opted in, and this increased to 50% in 2014. The feedback from employees has
been overwhelmingly positive. A list of benefits is provided below:
Benefits offered in year 1:
Buying and selling holiday (3 days)
Buying and selling life assurance
Core cover aligned at 4 times salary
minimum of 2 times salary
maximum of 10 times salary
Childcare Vouchers
Health Cash Plan
Tastecard (discounted restaurant offers)
Car Breakdown
Dental Insurance
Cycle-scheme
Car lease Scheme
Benefits offered in year 2:
Buying and selling holiday (5 days)
Partner life assurance
Critical Illness Insurance
Partner Critical Illness Insurance
Benefits offered in year 3:
Cancer checks
Health Assessments
The most popular benefits have been buying and selling of holiday, and life assurance.
Harmonisation of pension provision
Auto-enrolment created an opportunity for the company to develop its pension provision. Previously the organisation had 3
separate pension providers, 5 separate pension schemes and 64 different contribution schedules in place. There were some
concerns in the company around the costs of implementing auto-enrolment, e.g. the complexity it would create and
whether the internal capability to deal with this was available. It was decided that the current pension provider could not
offer the required support, so a new provider was engaged. The new provider was able to consolidate all other employee
benefits within the same contract, free of charge. By 2013, modelling of different contribution schemes lead to a new
mandatory 3% employee contribution and 6% employer contribution for all employees (18% for executives).
Harmonisation of Terms and Conditions
Research into modern pay systems
Office of Manpower Economics PwC 66
Reward framework
Employee terms and conditions throughout the company have been harmonised where possible to reflect the fact that the
company is ‘one organisation’. This process included highlighting around 30 differences throughout the contracts and
assessing what changes could be made and how they could be made. This approach consisted of reviewing market data and
competitor information, reviewing existing arrangements and considering the affordability. 19 changes were implemented
from April 2015, and the remaining changes remain a ‘strategic intent’; to be harmonised in the future.
Changes in the terms and conditions varied from using different life assurance providers to changes in contractual hours.
The changes that created the most angst for employees were the changes to long-service rewards, where some employees
had just passed a milestone that a reward has now been introduced for.
Research into modern pay systems
Office of Manpower Economics PwC 67
Case study 16 – TSB – In-depth case study on developing a new reward strategy
Company details Key themes
Sector: Finance Business activity: Retail and commercial bank with circa 600 branches in the UK managing £23 billion on behalf of 4.6 million customers. Total number of UK employees: 8,300 Workforce specifics of note: ‘Partnership’ model since January 2015. 1:1 fixed to variable cap for executive directors; core reward is based on customer, financial and strategic metrics.
New reward strategy based on the
‘Partnership model’
New bonus scheme and long term
incentive plan (LTIP)
Simplified grading structure
New performance management
reinforcing ‘TSB Behaviours’
Reward framework
Background
TSB is the seventh largest stand-alone high street bank in the UK and is a subsidiary of the Spanish banking group,
Sabadell. Following demerger from Lloyds Banking Group and initial public offering (IPO) floatation in 2014, the company
moved away from a product sales business to become a highly focussed customer service business. It was therefore essential
to achieve consistently outstanding customer service in the business model, and for staff to embrace this new culture. As a
result, TSB introduced an employee ‘Partnership’ model in January 2015, based on a collective ‘shared success’ or ‘shared
failure’ reward philosophy.
Key Features of TSB’s new Reward Structure
Partnership reward strategy embraces five key values: Straight-forward; transparent; responsible; collaborative;
pioneering.
Simplification of grade structure consolidating grades A and B and removing upper and lower distinctions at
grades D and E.
Replaced the old annual bonus and quarterly incentive schemes and LTIP with two new schemes. The TSB Award
is open to all employees including the chief executive officer (CEO). The Sustainable Performance Award (SPA) is
a discretionary executive longer term reward plan.
At Executive level, implementation of the two new plans rebalanced executives’ fixed and variable reward.
Uniquely amongst UK banks, TSB did not seek shareholder approval for a 2:1 fixed: variable remuneration cap and
therefore complies with the 1:1 ‘fixed : variable’ remuneration cap prescribed by the Prudential Regulation
Authority (PRA) and the Europan Banking Authority (EBA).
New performance management scheme, TSB Partner Performance, is underpinned by the new ‘TSB Behaviours’
and encompasses three broad, well differentiated performance categories: Pioneer, On Track and Off Track.
Grading Structure
TSB’s new reward structure reflects two employee populations. Grades B to F cover partners below executive level while
executives below the Bank Executive Committee are placed within grades G and H. The new grading structure was designed
to achieve simplification and transparency and arose out of the old structure by consolidating two bottom grades A and B
and by removing the upper and lower distinction levels in grades D and E. Additionally, TSB operated eight pay locations in
the old system but as part of reducing pay complexity, pay locations were consolidated into two regions, London and
National.
The new pay and grading structure is based on a broad-band system with seven pay bands across grades B to E. Grade B to
E pay bands were developed using the median market data for all roles within each pay band. The pay band minimums and
maximums are reviewed annually and move taking account of the market in April each year. In order to reflect the
individual nature of senior roles and the wider variation in market pricing, TSB applies individual role sizing and pricing at
grade F and above. Market data is used to identify the market median basic salary of each senior role and is sense checked
using a secondary market data source for specific functions and roles. Tables 1 and 2 provides a summary of the company’s
grading arrangement.
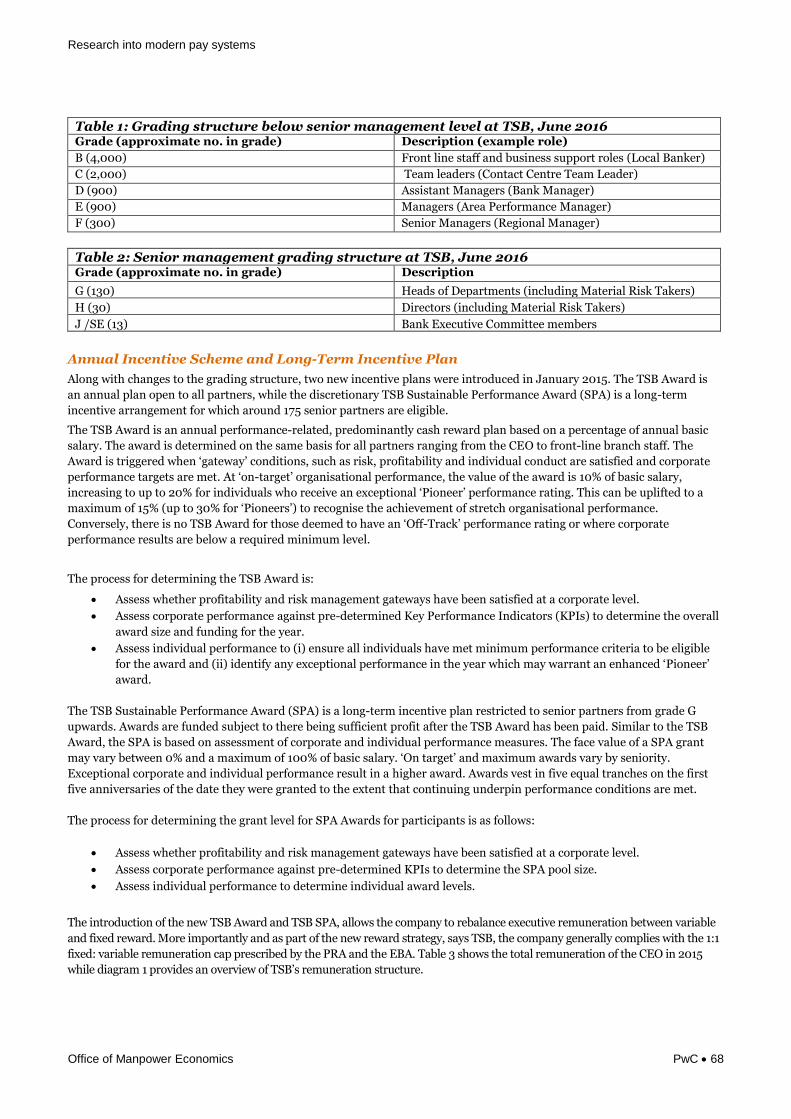
Research into modern pay systems
Office of Manpower Economics PwC 68
Table 1: Grading structure below senior management level at TSB, June 2016 Grade (approximate no. in grade) Description (example role)
B (4,000) Front line staff and business support roles (Local Banker)
C (2,000) Team leaders (Contact Centre Team Leader)
D (900) Assistant Managers (Bank Manager)
E (900) Managers (Area Performance Manager)
F (300) Senior Managers (Regional Manager)
Table 2: Senior management grading structure at TSB, June 2016 Grade (approximate no. in grade) Description
G (130) Heads of Departments (including Material Risk Takers)
H (30) Directors (including Material Risk Takers)
J /SE (13) Bank Executive Committee members
Annual Incentive Scheme and Long-Term Incentive Plan
Along with changes to the grading structure, two new incentive plans were introduced in January 2015. The TSB Award is
an annual plan open to all partners, while the discretionary TSB Sustainable Performance Award (SPA) is a long-term
incentive arrangement for which around 175 senior partners are eligible.
The TSB Award is an annual performance-related, predominantly cash reward plan based on a percentage of annual basic
salary. The award is determined on the same basis for all partners ranging from the CEO to front-line branch staff. The
Award is triggered when ‘gateway’ conditions, such as risk, profitability and individual conduct are satisfied and corporate
performance targets are met. At ‘on-target’ organisational performance, the value of the award is 10% of basic salary,
increasing to up to 20% for individuals who receive an exceptional ‘Pioneer’ performance rating. This can be uplifted to a
maximum of 15% (up to 30% for ‘Pioneers’) to recognise the achievement of stretch organisational performance.
Conversely, there is no TSB Award for those deemed to have an ‘Off-Track’ performance rating or where corporate
performance results are below a required minimum level.
The process for determining the TSB Award is:
Assess whether profitability and risk management gateways have been satisfied at a corporate level.
Assess corporate performance against pre-determined Key Performance Indicators (KPIs) to determine the overall
award size and funding for the year.
Assess individual performance to (i) ensure all individuals have met minimum performance criteria to be eligible
for the award and (ii) identify any exceptional performance in the year which may warrant an enhanced ‘Pioneer’
award.
The TSB Sustainable Performance Award (SPA) is a long-term incentive plan restricted to senior partners from grade G
upwards. Awards are funded subject to there being sufficient profit after the TSB Award has been paid. Similar to the TSB
Award, the SPA is based on assessment of corporate and individual performance measures. The face value of a SPA grant
may vary between 0% and a maximum of 100% of basic salary. ‘On target’ and maximum awards vary by seniority.
Exceptional corporate and individual performance result in a higher award. Awards vest in five equal tranches on the first
five anniversaries of the date they were granted to the extent that continuing underpin performance conditions are met.
The process for determining the grant level for SPA Awards for participants is as follows:
Assess whether profitability and risk management gateways have been satisfied at a corporate level.
Assess corporate performance against pre-determined KPIs to determine the SPA pool size.
Assess individual performance to determine individual award levels.
The introduction of the new TSB Award and TSB SPA, allows the company to rebalance executive remuneration between variable
and fixed reward. More importantly and as part of the new reward strategy, says TSB, the company generally complies with the 1:1
fixed: variable remuneration cap prescribed by the PRA and the EBA. Table 3 shows the total remuneration of the CEO in 2015
while diagram 1 provides an overview of TSB’s remuneration structure.
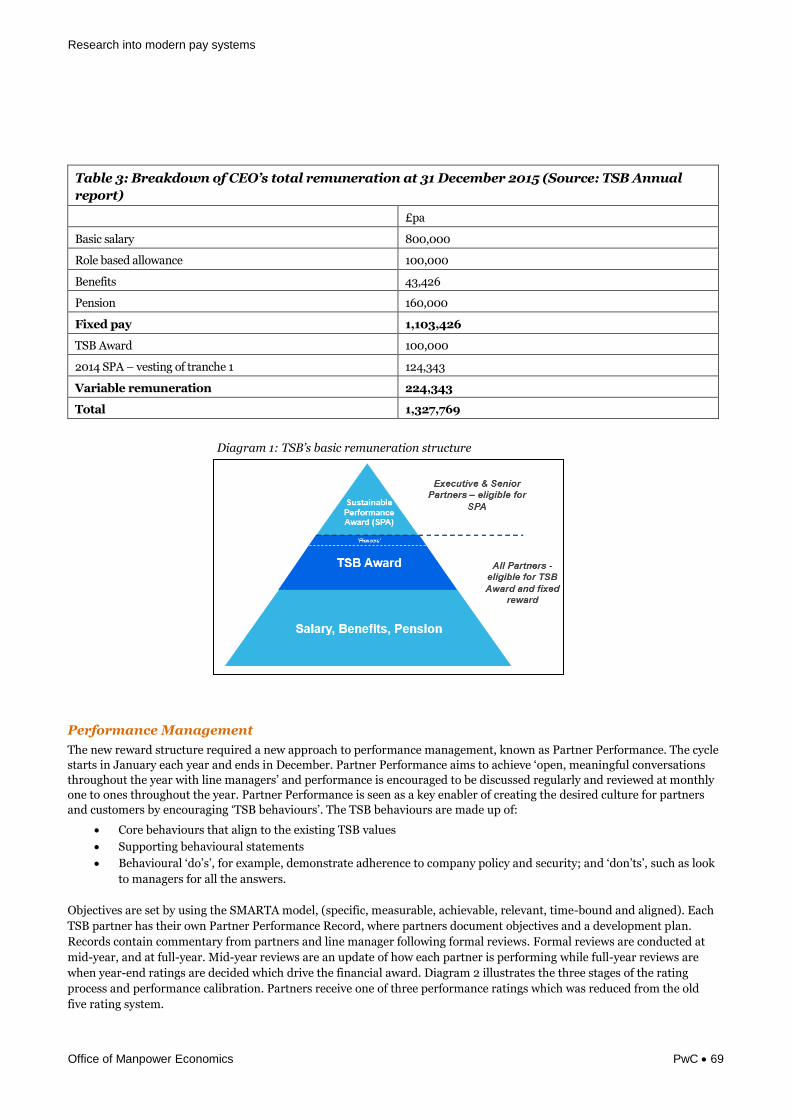
Research into modern pay systems
Office of Manpower Economics PwC 69
Table 3: Breakdown of CEO’s total remuneration at 31 December 2015 (Source: TSB Annual
report)
£pa
Basic salary 800,000
Role based allowance 100,000
Benefits 43,426
Pension 160,000
Fixed pay 1,103,426
TSB Award 100,000
2014 SPA – vesting of tranche 1 124,343
Variable remuneration 224,343
Total 1,327,769
Performance Management
The new reward structure required a new approach to performance management, known as Partner Performance. The cycle
starts in January each year and ends in December. Partner Performance aims to achieve ‘open, meaningful conversations
throughout the year with line managers’ and performance is encouraged to be discussed regularly and reviewed at monthly
one to ones throughout the year. Partner Performance is seen as a key enabler of creating the desired culture for partners
and customers by encouraging ‘TSB behaviours’. The TSB behaviours are made up of:
Core behaviours that align to the existing TSB values
Supporting behavioural statements
Behavioural ‘do’s’, for example, demonstrate adherence to company policy and security; and ‘don’ts’, such as look
to managers for all the answers.
Objectives are set by using the SMARTA model, (specific, measurable, achievable, relevant, time-bound and aligned). Each
TSB partner has their own Partner Performance Record, where partners document objectives and a development plan.
Records contain commentary from partners and line manager following formal reviews. Formal reviews are conducted at
mid-year, and at full-year. Mid-year reviews are an update of how each partner is performing while full-year reviews are
when year-end ratings are decided which drive the financial award. Diagram 2 illustrates the three stages of the rating
process and performance calibration. Partners receive one of three performance ratings which was reduced from the old
five rating system.
Diagram 1: TSB’s basic remuneration structure

Research into modern pay systems
Office of Manpower Economics PwC 70
These are:
A Pioneer rating reflects outstanding performance on what has been achieved and how it has been delivered.
An On Track rating implies that an individual is doing what is expected in the TSB way.
An Off Track rating will be applicable to those who have not always met the behavioural and/or performance
expectations of their role.
Benefits
TSB operates a flexible benefits system, with partners receiving an additional 4% of basic salary which can be
spent on a variety of (often tax efficient) benefits. The choices of benefits include critical illness cover, childcare
vouchers, and additional medical cover.
Partners at grade D and above are entitled to personal medical insurance.
Partners at grade E and above also receive either a cash car allowance or the option to select a company car.
All partners are eligible to participate in HMRC approved all employee share schemes which allow partners to take
a stake in the business on a potentially tax favoured basis.
All partners are eligible for the defined contribution pension scheme, with employer contributions of between 8%
and 13% depending on partner personal contribution, as shown below.
Partner
contribution
TSB contribution
3% 8%
4% 10%
5% 13%
Diagram 2: Rating process for TSB Award
Step one Indicative ratings
Step two Bank Executive
Committee Calibration
Step three Ratings communicated
• Performance review conversations take place and performance ratings are communicated
• Indicative ratings for each business area are discussed by Band Executive Committee Calibration and their first reports to agree final performance ratings for all
• CEO and Bank Executive Committee formally sign-offall ratings
• Business area calibrationsessions take place to agree indicative ratings for all
• Rating submission templates are populated and returned to the PM Team by Approved Submitters

Research into modern pay systems
Office of Manpower Economics PwC 71
Appendices
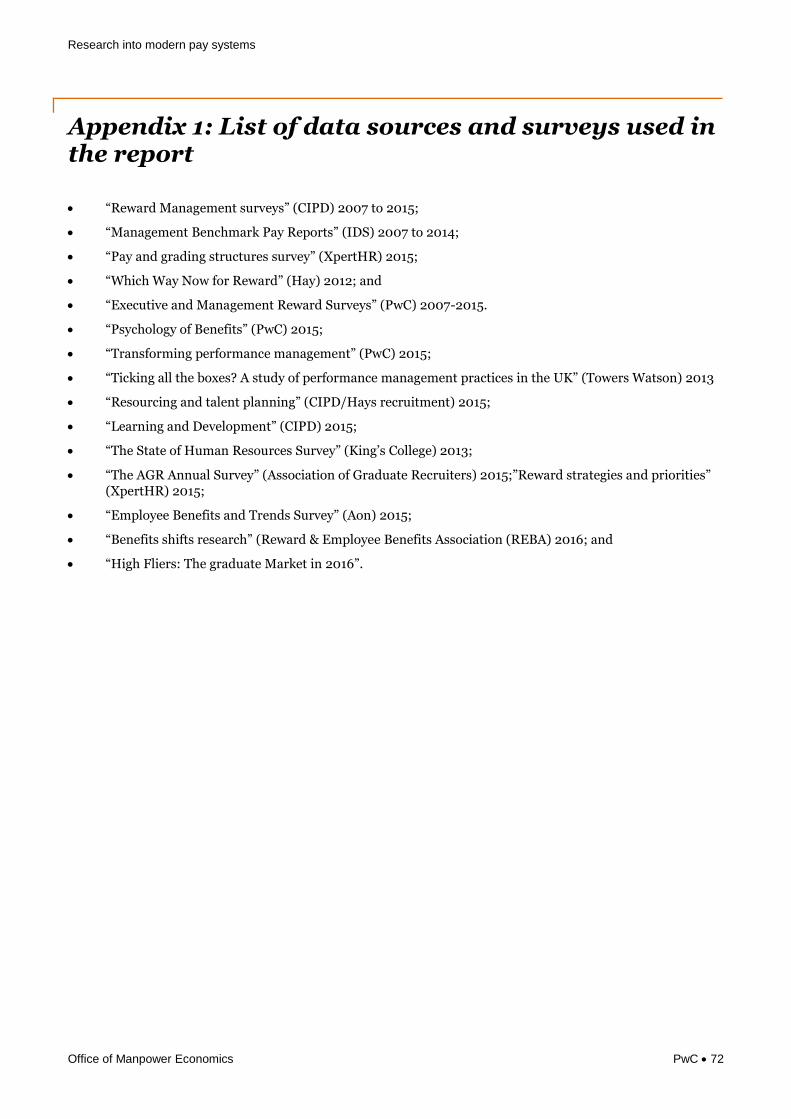
Research into modern pay systems
Office of Manpower Economics PwC 72
“Reward Management surveys” (CIPD) 2007 to 2015;
“Management Benchmark Pay Reports” (IDS) 2007 to 2014;
“Pay and grading structures survey” (XpertHR) 2015;
“Which Way Now for Reward” (Hay) 2012; and
“Executive and Management Reward Surveys” (PwC) 2007-2015.
“Psychology of Benefits” (PwC) 2015;
“Transforming performance management” (PwC) 2015;
“Ticking all the boxes? A study of performance management practices in the UK” (Towers Watson) 2013
“Resourcing and talent planning” (CIPD/Hays recruitment) 2015;
“Learning and Development” (CIPD) 2015;
“The State of Human Resources Survey” (King’s College) 2013;
“The AGR Annual Survey” (Association of Graduate Recruiters) 2015;”Reward strategies and priorities”(XpertHR) 2015;
“Employee Benefits and Trends Survey” (Aon) 2015;
“Benefits shifts research” (Reward & Employee Benefits Association (REBA) 2016; and
“High Fliers: The graduate Market in 2016”.
Appendix 1: List of data sources and surveys used in the report

Research into modern pay systems
Office of Manpower Economics PwC 73
Overview of UK reward management practices in the private/public and voluntary sectors from 2007 to 2014/15. (Source: CIPD Reward Management surveys)
Year Base pay structure Basic pay determination Pay progression Bonuses and incentives; Pension and other
benefits
long-term incentives**
2008 32% individual pay
rates/ranges/spot salaries
31% market rates 76% combination/hybrid Bonus & incentives 97% pension
28% broad bands 22% ability to pay 10% individual performance 60% individual 84% 25<days holiday
22% job families/career
grades
20% job evaluation database 6% length of service 51% business results 79% training & development
14% Pay spines 12% owner's/managing director's
views
3% market rates 50% combination of the
above two
70% tea/coffee/cold drinks
10% collective bargaining 27% team based
5% shareholders' views
2009 35% individual pay
rates/ranges/spot salaries
36% market rates without job
evaluation database
66% combination/hybrid Bonus & incentives 95% pension
24% broad bands 32% market rates with job
evaluation database
13% individual performance 61% individual 71% training & development
19% pay spines 17% ability to pay 8% length of service 56% business results 67% 25<days holiday
13% job families/career
grades
14% collective bargaining 7% other 41% combination of the
above two
62% tea/coffee/cold drinks
Appendix 2: Overview of UK Reward management

Research into modern pay systems
Office of Manpower Economics PwC 74
Year Base pay structure Basic pay determination Pay progression Bonuses and incentives; Pension and other
benefits
long-term incentives**
23% team based
Long-term incentives
36% ESOS
29% SIP
26% CSOP
26% SAYE
2010 - 36% individual pay
rates/ranges/spot salaries
40% market rates without job
evaluation database)
68% individual performance Bonus & incentives 95% pension
26% broad bands 31% market rates with job
evaluation database
48% market rates 58% individual rises (no other benefits
information given)
19% pay spines 25% ability to pay 38% competency 47% business results
16% job families/career
grades
13% owner's/managing director's
views
34% organisational performance 44% combination of the
above two
11% collective bargaining 21% team based
Long-term incentives
37% ESOS
31% SIP
26% exec restricted/PSP

Research into modern pay systems
Office of Manpower Economics PwC 75
Year Base pay structure Basic pay determination Pay progression Bonuses and incentives; Pension and other
benefits
long-term incentives**
24% CSOP
2011 30.1% individual pay
rates/ranges/spot salaries
32.4% market rates with job
evaluation
61.4% individual performance Bonus & incentives 99% pension
24.7% broad bands 28.1% market rates without job
evaluation
52.4% market rates 56.4% merit pay rises 81% flexible/homeworking
22.6% pay spines 26.4% ability to pay 38.8% competencies 53.5% individual bonuses 47% voluntary affinity
benefits
18.7% job families/career
grades
13.1% collective bargaining 33.3% skills 29.1% individual non-
monetary recognition awards
36% flexible benefits
28.1% combination schemes
Long-term incentives
33.6% SAYE
31.6% SIP
20% CSOP
17.2% ESOS
2012 47.2% individual pay
rates/ranges/spot salaries
42.7% ability to pay 78.6% individual performance Bonus & incentives 89.2% pension
29% narrow graded 37.5% market rates with job
evaluation
56.8% market rates 66.6% individual bonuses 69.1% flexible/homeworking
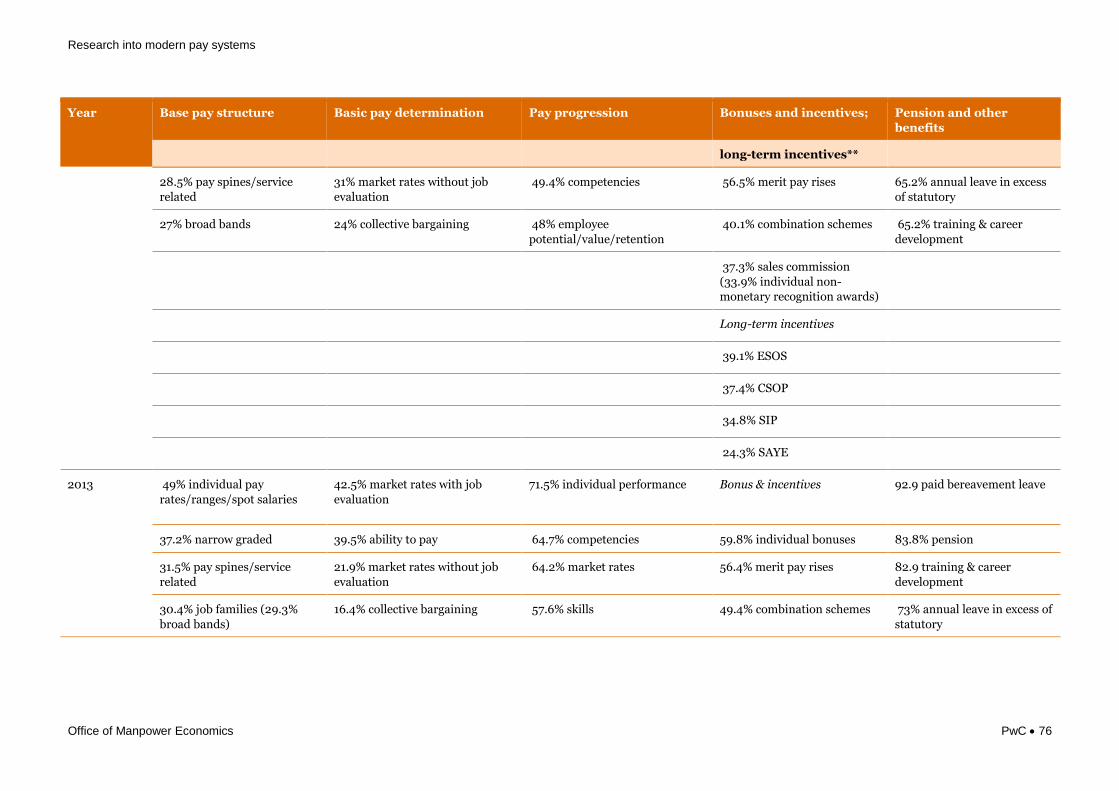
Research into modern pay systems
Office of Manpower Economics PwC 76
Year Base pay structure Basic pay determination Pay progression Bonuses and incentives; Pension and other
benefits
long-term incentives**
28.5% pay spines/service
related
31% market rates without job
evaluation
49.4% competencies 56.5% merit pay rises 65.2% annual leave in excess
of statutory
27% broad bands 24% collective bargaining 48% employee
potential/value/retention
40.1% combination schemes 65.2% training & career
development
37.3% sales commission
(33.9% individual non-
monetary recognition awards)
Long-term incentives
39.1% ESOS
37.4% CSOP
34.8% SIP
24.3% SAYE
2013 49% individual pay
rates/ranges/spot salaries
42.5% market rates with job
evaluation
71.5% individual performance Bonus & incentives 92.9 paid bereavement leave
37.2% narrow graded 39.5% ability to pay 64.7% competencies 59.8% individual bonuses 83.8% pension
31.5% pay spines/service
related
21.9% market rates without job
evaluation
64.2% market rates 56.4% merit pay rises 82.9 training & career
development
30.4% job families (29.3%
broad bands)
16.4% collective bargaining 57.6% skills 49.4% combination schemes 73% annual leave in excess of
statutory
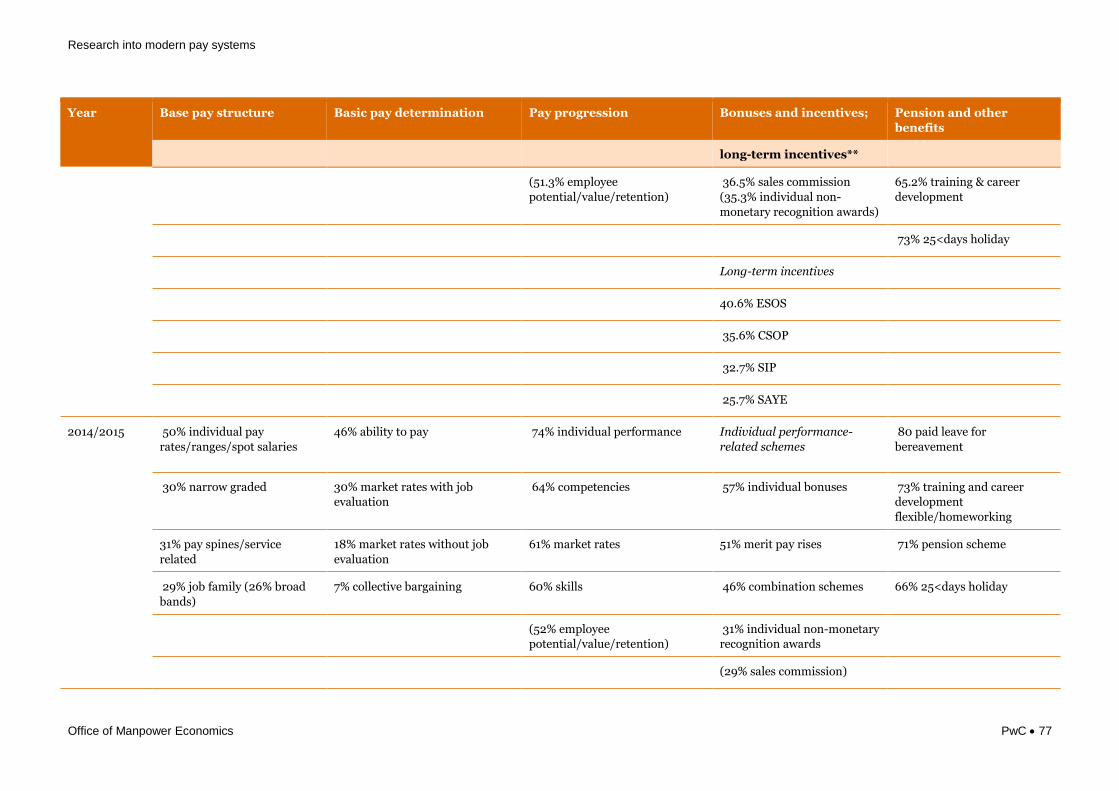
Research into modern pay systems
Office of Manpower Economics PwC 77
Year Base pay structure Basic pay determination Pay progression Bonuses and incentives; Pension and other
benefits
long-term incentives**
(51.3% employee
potential/value/retention)
36.5% sales commission
(35.3% individual non-
monetary recognition awards)
65.2% training & career
development
73% 25<days holiday
Long-term incentives
40.6% ESOS
35.6% CSOP
32.7% SIP
25.7% SAYE
2014/2015 50% individual pay
rates/ranges/spot salaries
46% ability to pay 74% individual performance Individual performance-
related schemes
80 paid leave for
bereavement
30% narrow graded 30% market rates with job
evaluation
64% competencies 57% individual bonuses 73% training and career
development
flexible/homeworking
31% pay spines/service
related
18% market rates without job
evaluation
61% market rates 51% merit pay rises 71% pension scheme
29% job family (26% broad
bands)
7% collective bargaining 60% skills 46% combination schemes 66% 25<days holiday
(52% employee
potential/value/retention)
31% individual non-monetary
recognition awards
(29% sales commission)
Research into modern pay systems
Office of Manpower Economics PwC 78
Year Base pay structure Basic pay determination Pay progression Bonuses and incentives; Pension and other
benefits
long-term incentives**
Notes: * Where given; ** ESOS = executive share option scheme; SIP = share incentive plan; CSOP = company share option plan; SAYE = save as you earn; PSP = Performance share plan
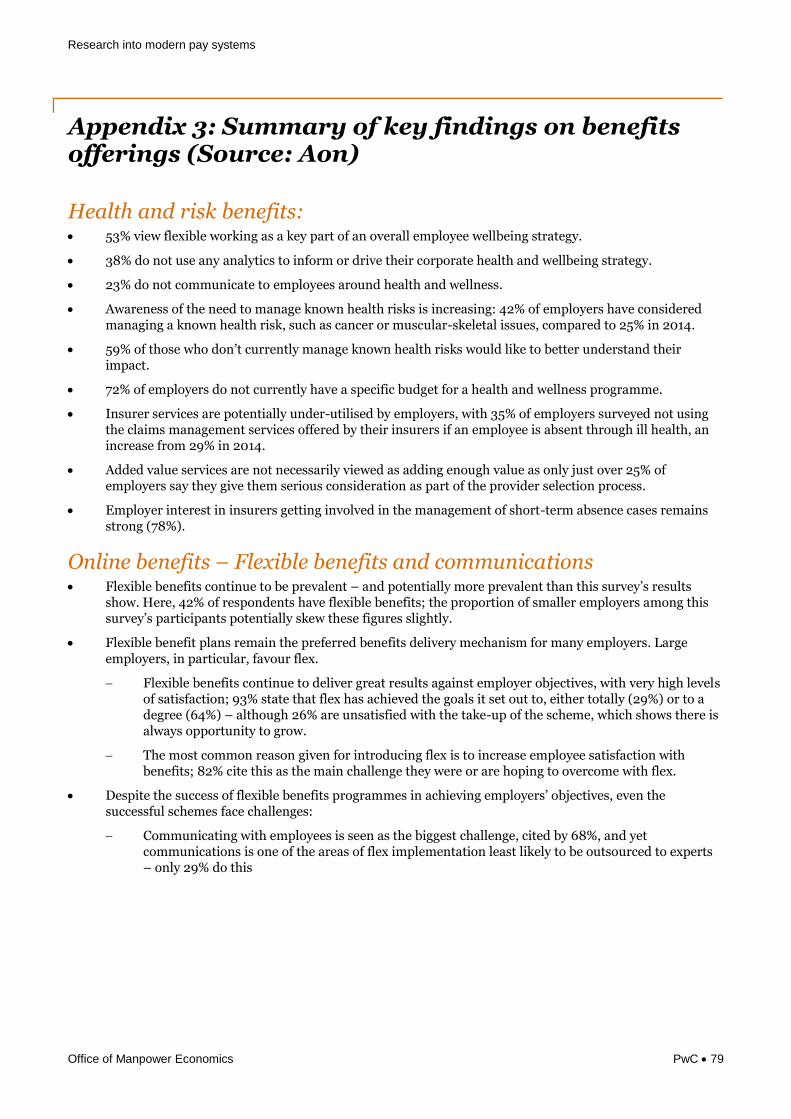
Research into modern pay systems
Office of Manpower Economics PwC 79
Health and risk benefits: 53% view flexible working as a key part of an overall employee wellbeing strategy.
38% do not use any analytics to inform or drive their corporate health and wellbeing strategy.
23% do not communicate to employees around health and wellness.
Awareness of the need to manage known health risks is increasing: 42% of employers have consideredmanaging a known health risk, such as cancer or muscular-skeletal issues, compared to 25% in 2014.
59% of those who don’t currently manage known health risks would like to better understand theirimpact.
72% of employers do not currently have a specific budget for a health and wellness programme.
Insurer services are potentially under-utilised by employers, with 35% of employers surveyed not usingthe claims management services offered by their insurers if an employee is absent through ill health, anincrease from 29% in 2014.
Added value services are not necessarily viewed as adding enough value as only just over 25% ofemployers say they give them serious consideration as part of the provider selection process.
Employer interest in insurers getting involved in the management of short-term absence cases remainsstrong (78%).
Online benefits – Flexible benefits and communications Flexible benefits continue to be prevalent – and potentially more prevalent than this survey’s results
show. Here, 42% of respondents have flexible benefits; the proportion of smaller employers among thissurvey’s participants potentially skew these figures slightly.
Flexible benefit plans remain the preferred benefits delivery mechanism for many employers. Large
employers, in particular, favour flex.
Flexible benefits continue to deliver great results against employer objectives, with very high levels of satisfaction; 93% state that flex has achieved the goals it set out to, either totally (29%) or to a degree (64%) – although 26% are unsatisfied with the take-up of the scheme, which shows there is always opportunity to grow.
The most common reason given for introducing flex is to increase employee satisfaction with benefits; 82% cite this as the main challenge they were or are hoping to overcome with flex.
Despite the success of flexible benefits programmes in achieving employers’ objectives, even thesuccessful schemes face challenges:
Communicating with employees is seen as the biggest challenge, cited by 68%, and yet communications is one of the areas of flex implementation least likely to be outsourced to experts – only 29% do this
Appendix 3: Summary of key findings on benefits offerings (Source: Aon)

This document has been prepared only for the Office of Manpower Economics and solely for the purpose and on the terms agreed
with Office of Manpower Economics. We accept no liability (including for negligence) to anyone else in connection with this
document, and it may not be provided to anyone else.
© 2016 PricewaterhouseCoopers LLP. All rights reserved. In this document, "PwC" refers to PricewaterhouseCoopers LLP (a
limited liability partnership in the United Kingdom), which is a member firm of PricewaterhouseCoopers International Limited, each
member firm of which is a separate legal entity.
160523-113304-KM-OS