Embed Size (px)
Citation preview

RESEARCH

2
Positive net absorption has been
driven by new entrants.
Tenants are migrating from
secondary to prime office
buildings, more particularly to
new generation prime office
buildings constructed post 2006.
Despite the recent negative net
supply, gross supply for Adelaide
CBD is projected to be 28,270m²
over the next twelve months.
Investor demand remains strong
with Adelaide viewed as an
attractive value proposition with
average prime yields across the
Eastern Seaboard generally 100-
200 basis points firmer than
those being achieved in South
Australia.
Research Analyst SA
Adelaide CBD Office Market Indicators as at July 2019
Grade Total Stock
(m²)*
Vacancy
Rate (%)*
Annual Net
Absorption (m²)^
Six Months Net
Supply (m²)“
Average Gross
Face Rent ($/
m²)
Average
Incentive (%)
Average Core
Market Yield (%)
Prime 594,887 11.6 14,213 N/A 529 32.2 6.62
Secondary 823,072 13.6 8,005 N/A 383 33.9 8.15
Total 1,417,959 12.8 22,218 -5,744
an additional 100 graduates next year as
the defence projects at Techport ramp
up.
“Ten Gigabit Adelaide” good for tenants & investors
“Ten Gigabit Adelaide”, a high-speed
fibre optic data network, has positively
impacted Adelaide CBD sales and
leasing demand. Agents have reported
that “Ten Gigabit Adelaide” has attracted
interest from investors and helped
increase the appeal for tenants of
relocating or establishing a presence in
the Adelaide CBD. Example includes
Technicolour - a global media post-
production group - who have set up their
Australian Headquarters in the Adelaide
CBD. This is likely to generate up to 400
jobs and is expected to inject an
economic benefit of up to $250 million
over the next decade.
Slowing growth but the outlook remains positive
Growth in the South Australian economy
has softened consistent with national
trends as slow income growth and
weaker housing market conditions weigh
on consumer spending. By contrast,
government infrastructure spending and
defence industry construction are
supporting growth, while the lower
Australian dollar is providing a boost to
exports.
Low cost of capital continues to benefit the property market
The Reserve Bank of Australia (RBA) has
cut the cash rate in both June and July
2019 to a historic low of 1.0%. Further
cuts in interest rates are expected in the
near future. Market interest rates have
declined significantly over the past year in
response to more accommodative
monetary policy and the softer growth
outlook.
South Australia remains the only State
with no stamp duty payable on
commercial property. The low cash rate
coupled with the abolition of stamp duty
will continue to attract investment into the
SA property market.
BAE contribute to SA economy
Investments from the defence industry
have made a positive impact on
employment growth with BAE Systems
recently employing more than 80
graduates, and are expected to employ
Employment Growth South Australia and Adelaide
% changes y-o-y basis
0.00%
0.50%
1.00%
1.50%
2.00%
2.50%
2016
2017
2018
2019
2020
2021
2022
2023
2024
2025
2026
South Australia Adelaide
Forecast
3
RESEARCH
New entrants to the Adelaide CBD market
Historically, building owners have relied
on tenant relocations or renewals,
however over the past 18 months, we
have seen an increase in new entrants to
the Adelaide CBD. A recent new entrant
is Victory Offices—a serviced office
business which provides a flexible
workspace has recently established a
presence in Adelaide CBD (11 Waymouth
Street).
In addition to this, Beach Energy—an oil
and gas exploration and production
company has relocated from Conyngham
Street, Glenside (suburban) to Flinders
Street, Adelaide (CBD).
Largest net absorption since January 2009
In the six months to July 2019, Adelaide
CBD has recorded positive net
absorption of 15,824m². This is 2.6 times
above the 25-year average, making it the
strongest result in Adelaide CBD since
January 2009, when absorption was
41,252m².
Positive net absorption has been driven
by tenant expansion and new entrants to
Adelaide CBD. Notable examples in
addition to Beach Energy include Boeing
(new entrant) and BAE Systems
(suburban to Adelaide CBD).
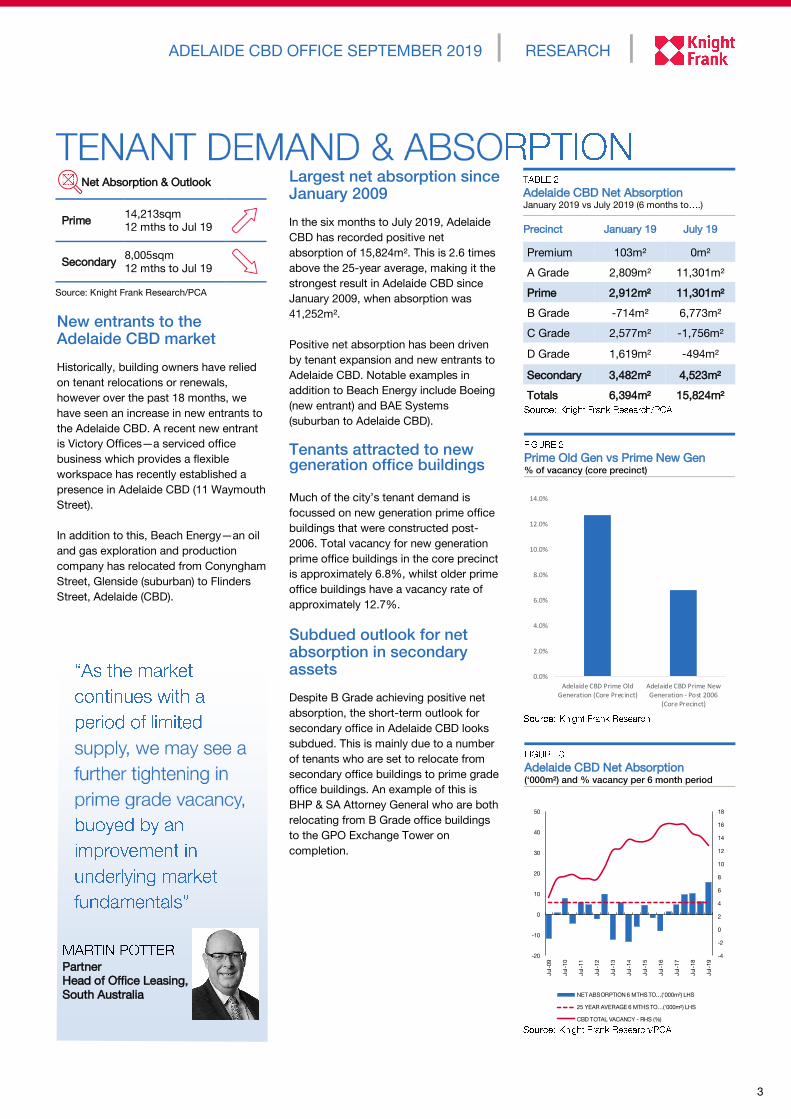
Tenants attracted to new generation office buildings
Much of the city’s tenant demand is
focussed on new generation prime office
buildings that were constructed post-
2006. Total vacancy for new generation
prime office buildings in the core precinct
is approximately 6.8%, whilst older prime
office buildings have a vacancy rate of
approximately 12.7%.
Subdued outlook for net absorption in secondary assets
Despite B Grade achieving positive net
absorption, the short-term outlook for
secondary office in Adelaide CBD looks
subdued. This is mainly due to a number
of tenants who are set to relocate from
secondary office buildings to prime grade
office buildings. An example of this is
BHP & SA Attorney General who are both
relocating from B Grade office buildings
to the GPO Exchange Tower on
completion.
Adelaide CBD Net Absorption (‘000m²) and % vacancy per 6 month period
ADELAIDE CBD OFFICE SEPTEMBER 2019
Net Absorption & Outlook
Prime 14,213sqm
12 mths to Jul 19
Secondary 8,005sqm
12 mths to Jul 19
Source: Knight Frank Research/PCA
Prime Old Gen vs Prime New Gen % of vacancy (core precinct)
Partner
Head of Office Leasing,
South Australia
-4
-2
0
2
4
6
8
10
12
14
16
18
-20
-10
0
10
20
30
40
50
Jul-
09
Jul-
10
Jul-
11
Jul-
12
Jul-
13
Jul-
14
Jul-
15
Jul-
16
Jul-
17
Jul-
18
Jul-
19
NET ABSORPTION 6 MTHS TO…('000m²) LHS
25 YEAR AVERAGE 6 MTHS TO…('000m²) LHS
CBD TOTAL VACANCY - RHS (%)
Adelaide CBD Net Absorption January 2019 vs July 2019 (6 months to….)
Precinct January 19 July 19
Premium 103m² 0m²
A Grade 2,809m² 11,301m²
Prime 2,912m² 11,301m²
B Grade -714m² 6,773m²
C Grade 2,577m² -1,756m²
D Grade 1,619m² -494m²
Secondary 3,482m² 4,523m²
Totals 6,394m² 15,824m²
0.0%
2.0%
4.0%
6.0%
8.0%
10.0%
12.0%
14.0%
Adelaide CBD Prime OldGeneration (Core Precinct)
Adelaide CBD Prime NewGeneration - Post 2006
(Core Precinct)

4
Adelaide CBD Vacancy % total vacancy
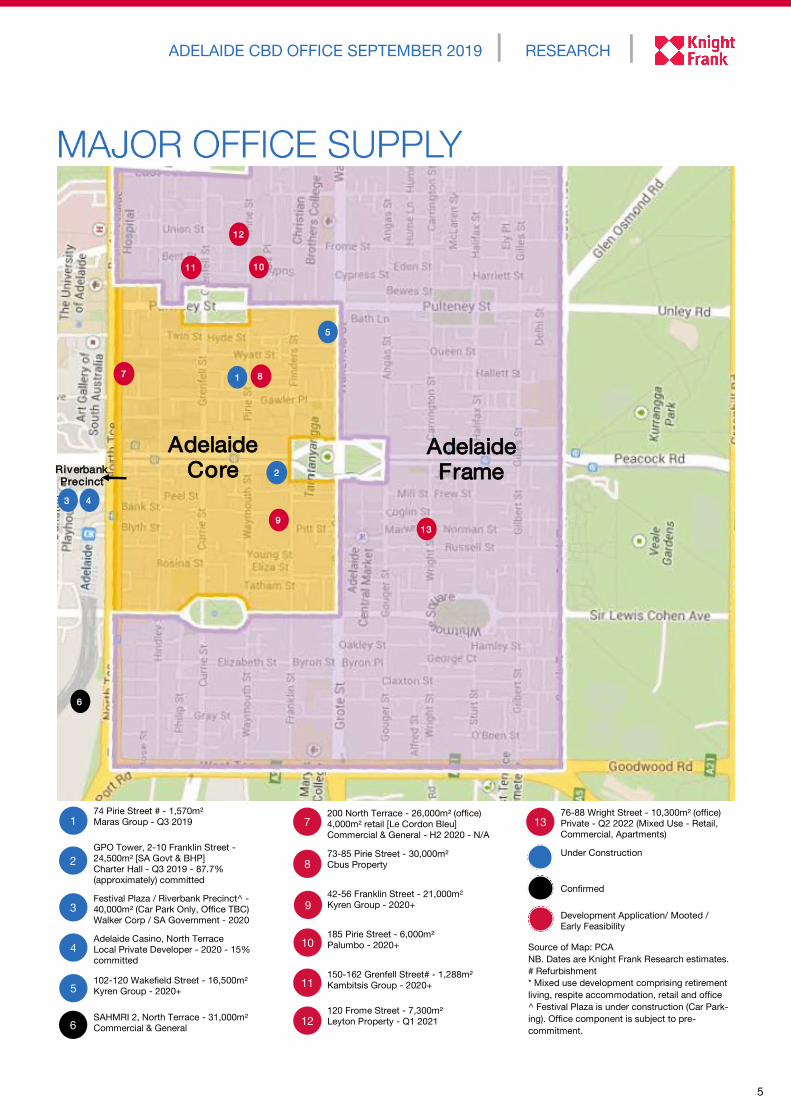
Developments such as 73-85 Pirie Street
(Cbus Property “Planet Nightclub”), 200
North Terrace (Le Cordon Bleu and
Commercial & General) and Festival Plaza
(Walker Corporation) would total
approximately 96,000m² office space if all
were to proceed. Despite this, Kyren
Group has commenced building a 14
level office tower at 102-108 Wakefield
Street without any known tenant pre-
commitment. The development is
expected to be completed in Q3 2020
and will comprise approximately
14,880m² of office space.
The next round of the supply cycle is
likely to deliver in 2023, with Department
of Human & Services (DHS) and
Department of Planning, Transport &
Infrastructure (DPTI) on the market for
circa 15,900m² (DHS) and 24,000m²
(DPTI) in 2023. If these requirements were
to proceed, additional office supply is
likely required.
Vacancy rates continue to drop
The Adelaide CBD vacancy rate has been
falling consistently since peaking at the
end of 2016 at 16.2%, bringing the
vacancy down by 1.4% to 12.8% in the
six months to July 2019. This marks one
of the largest percentage drops since
January 2008. The decrease in vacancy
was mainly driven by solid net absorption
coupled with the withdrawals of 51 Pirie
Street and 124 Waymouth Street.
Low supply and high withdrawal
In H1 2019, Adelaide CBD recorded
negative net supply of –5,744m², which is
significantly below the 25-year average
of 12,782m². The negative net supply
was mainly attributed to the withdrawal
of 51 Pirie Street (4,650m²) and 124
Waymouth Street (2,424m²). Both of
these withdrawals have been driven by a
change of use, with 51 Pirie Street to be
redeveloped into a 28 storey hotel and
124 Waymouth Street to be redeveloped
into a 17 storey student accommodation
facility comprising 721 beds.
Gross supply for Adelaide CBD is
projected to be 26,070m² in the six
months to January 2020 and 2,200m² in
the six months to July 2020, providing a
total supply of 28,270m² over the next
twelve months. The majority of this
supply has already been pre-committed.
GPO Exchange Tower coming soon
The main source of supply over the next
six months is the development of Charter
Hall’s GPO Exchange Tower. The
development will comprise a 20-storey
building disposed as ground floor retail,
levels 1 & 2 car parking, levels 3 - 19
office, and a rooftop plant room spanning
over 2 levels. On completion, the
property will have an NLA of 24,500m²,
with 87.7% of the NLA pre-committed by
the SA Attorney General’s Department
and BHP.
Future pipeline requires further pre-commitments
The majority of the proposed office
developments in Adelaide CBD are still
subject to tenant pre-commitment.
Adelaide CBD Vacancy Rates July 2019 vs July 2020
Precinct July 18 July 19
Premium 2.8 2.6
A Grade 14.8 12.3
Prime 14.0 11.6
B Grade 14.5 12.9
C Grade 15.7 14.5
D Grade 16.7 13.9
Secondary 15.3 13.6
Totals 14.7 12.8
Despite the recent drop in the vacancy
rate, the short-term outlook for secondary
assets is subdued in Adelaide CBD. The
new supply coming onto the market (GPO
Tower) will impact the secondary market
with SA Attorney General & BHP likely to
leave significant backfill vacancy.
We understand SA Attorney General has
a lease tail (c15,000m²) of approximately
2.9 years at 45 Pirie Street before they
relocate to GPO. PCA measure the
vacancy data based on occupied space
and therefore the lease tail at 45 Pirie
Street will be considered as vacant in
forthcoming PCA data. On a positive
note, BHP has increased its tenure from
approximately 6,400m² to 10,000m².
Vacancy Rate & Outlook
Prime 11.6%
-240bps y-o-y
Secondary 13.6%
-160bps y-o-y
Source: Knight Frank Research/PCA
Adelaide Gross Supply Additions % total vacancy
0.0%
2.0%
4.0%
6.0%
8.0%
10.0%
12.0%
14.0%
16.0%
18.0%
20.0%
Jul-
09
Jul-
10
Jul-
11
Jul-
12
Jul-
13
Jul-
14
Jul-
15
Jul-
16
Jul-
17
Jul-
18
Jul-
19
PRIME SECONDARY
PRIME 10 YR AVERAGE SECONDARY 10 YR AVERAGE
0
5
10
15
20
25
30
35
40
45
50
Jul-
09
Jul-
10
Jul-
11
Jul-
12
Jul-
13
Jul-
14
Jul-
15
Jul-
16
Jul-
17
Jul-
18
Jul-
19
Jul-
20
Projection
CBD GROSS SUPPLY 6 MONTHS TO... ('000m²)
25 YEAR AVERAGE
5
RESEARCH ADELAIDE CBD OFFICE SEPTEMBER 2019
74 Pirie Street # - 1,570m²
Maras Group - Q3 2019
GPO Tower, 2-10 Franklin Street -
24,500m² [SA Govt & BHP]
Charter Hall - Q3 2019 - 87.7%
(approximately) committed
Festival Plaza / Riverbank Precinct^ -
40,000m² (Car Park Only, Office TBC)
Walker Corp / SA Government - 2020
Adelaide Casino, North Terrace
Local Private Developer - 2020 - 15%
committed
102-120 Wakefield Street - 16,500m²
Kyren Group - 2020+
SAHMRI 2, North Terrace - 31,000m²
Commercial & General
1
2
200 North Terrace - 26,000m² (office)
4,000m² retail [Le Cordon Bleu]
Commercial & General - H2 2020 - N/A
73-85 Pirie Street - 30,000m²
Cbus Property
42-56 Franklin Street - 21,000m²
Kyren Group - 2020+
185 Pirie Street - 6,000m²
Palumbo - 2020+
150-162 Grenfell Street# - 1,288m²
Kambitsis Group - 2020+
120 Frome Street - 7,300m²
Leyton Property - Q1 2021
76-88 Wright Street - 10,300m² (office)
Private - Q2 2022 (Mixed Use - Retail,
Commercial, Apartments)
Under Construction
Confirmed
Development Application/ Mooted /
Early Feasibility
Source of Map: PCA
NB. Dates are Knight Frank Research estimates.
# Refurbishment
* Mixed use development comprising retirement
living, respite accommodation, retail and office
^ Festival Plaza is under construction (Car Park-
ing). Office component is subject to pre-
commitment.
9
3
4 10
11 5
6
8
7
12
13
Adelaide
CoreAdelaide
FrameRiverbank
Precinct2
3 4
6
5
7 8
9
10
13
1
12
11

6
Decrease in incentives reflects improvements in effective rental growth
In the six months to July 2019, average
prime face rents in Adelaide CBD office
have remained similar at $529/m².
Despite this, average prime incentives
have contracted from 32.5% to 32.2%,
and this has led to some uplift in prime
gross effective rents. Over the past
twelve months, average prime CBD gross
effective rents have increased by 5.8%,
from $339/m² to $359/m².
The decrease in incentives has been
driven by an increase in demand for
prime office space as many tenants are
seeking to relocate to prime office assets
at the end of their lease terms. This
growth momentum is likely to continue
given the high demand for prime office
space, particularly new generation office
buildings constructed post 2006.
GPO Exchange Tower sets new record rents in SA
Although prime office face rents have
remained static over the past six months,
the completion of GPO Exchange Tower
will set a new benchmark in rents with
deals stuck at circa $650/m² p.a. gross.
As at July 2019, prime office rents range
from $475/m² p.a. gross to $560/m² p.a.
gross in Adelaide CBD.
Most leasing activity has been for prime office Over the past six months, leasing
transactions have predominately
occurred in prime office buildings. A
notable example is Aurecon, an
engineering company that has recently
committed to expand & relocate from 55
Grenfell Street (c1,600m²) to 25 Grenfell
Street (c2,500m²).
Another recent leasing transaction is
Department Veteran Affairs (DVA). DVA
has committed to relocate from 199
Grenfell Street (B Grade) to 91 King
William Street (Premium).
Despite the high level of leasing activity
in prime assets, there have also been
notable leasing transactions in secondary
buildings such as Technicolor, who
recently occupied approximately 4,000m²
over three levels at 178 North Terrace (B
Grade) for an initial term of 10 years.
Adelaide CBD Prime Incentives vs
Gross Effective Rent $/m² LHS, % RHS
Recent Leasing Activity Adelaide CBD
Address NLA m² Face Rent
$/m²
Term
(yrs)
Incentive
(%)` Tenant Start Date
25 Grenfell Street, Adelaide 2,500* 500g 10 # Aurecon March 2020
91 King William Street, Adelaide 2,100* 535g 7 # Department Veteran Affairs January 2020
2-10 Franklin Street, Adelaide 10,000* # 10 # BHP October 2019
2-10 Franklin Street, Adelaide 11,500* # 12 # SA Attorney General October 2019
30 Currie Street, Adelaide 2,616 435g 10 # Red Cross September 2019
178 North Terrace, Adelaide 4,000* # 10 # Technicolor March 2019
80 Flinders Street, Adelaide 3,230 532g 7 # Beach Energy June 2019
80 Flinders Street, Adelaide 2,654 555g 7 # BAE November 2018
Rents, Incentives & Outlook
Prime
Rents (g)
$529/sqm face
2.28% y-o-y
$359/sqm eff
5.84% y-o-y
Secondary
Rents (g)
$383/sqm face
1.21% y-o-y
$253/sqm eff
3.39% y-o-y
Incentives P:32.2%
S:33.9%
Adelaide CBD Gross Effective Rent Prime vs Secondary ($/m² p.a average )
10
15
20
25
30
35
40
0
50
100
150
200
250
300
350
400
450
500
Jul
-09
Jul
-10
Jul
-11
Jul
-12
Jul
-13
Jul
-14
Jul
-15
Jul
-16
Jul
-17
Jul
-18
Jul
-19
PRIME EFFECTIVE RENT - LHS ($/m²)
PRIME INCENTIVE - RHS (%)
0
50
100
150
200
250
300
350
400
450
500
Jul-
09
Jul-
10
Jul-
11
Jul-
12
Jul-
13
Jul-
14
Jul-
15
Jul-
16
Jul-
17
Jul-
18
Jul-
19
PRIME SECONDARY
7
RESEARCH
A recently settled sale includes 55 Currie
Street. The property was transacted for
$148.25 million to a Singapore listed
property trust, Suntec REIT— ARA
managed, reflecting a core market yield
of 7.39% and a W.A.L.E of 4.21 years
(by income).
High demand from interstate & off-shore
Demand in Adelaide is predominately
from interstate and off-shore capital,
more particularly from Singapore. This is
partly due to the attractive value
proposition for investors seeking higher
income returns as average prime yields
across the Eastern Seaboard are 100-
200 basis points firmer than South
Australia. Furthermore, improving
leasing market sentiment coupled with
Positive outlook for CBD sales above $10 million
YTD 2019 sale transactions currently
stand at $285.37 million for properties
above $10 million in Adelaide CBD. At
the current rate, sales volume for
CY2019 should exceed the ten year
average, especially given a number of
office buildings in Adelaide CBD are
currently under offer.
One of the properties currently under
contract is 25 Grenfell Street. The
property was recently contracted by
Singaporean based REIT Soilbuild
Business Space for $134.22 million
which reflects a core market yield of
circa 6.75% and a W.A.L.E of 4.87 years.
In addition, 80 Flinders Street is currently
under contract to an interstate property
fund— Centuria for $127 million. The sale
price includes the adjoining multi-level
car park (61-67 Wyatt Street) and reflects
a blended core market yield of 6.11%
and a W.A.L.E of 4.75 years for the office
building.
Adelaide CBD Sales $10 million + By Purchaser Type ($m)
Adelaide CBD vs East Coast Yields Prime Core Market Yields
ADELAIDE CBD OFFICE SEPTEMBER 2019
Current Yields & Outlook
Prime 6.00% - 7.25%
-59bps y-o-y
Secondary 7.75% - 8.75%
-25bps y-o-y
Recent Sales Activity Adelaide CBD
Address Grade Price $
mil
Core
Market
Yield % NLA m²
$/m²
NLA
WALE
yrs Vendor Purchaser
Sale
Date
80 Flinders Street, Adelaide (incl car park)
A 127.00 6.11
(blended) 12,154 6,593 3.29 Lendlease Centuria U/C
25 Grenfell Street, Adelaide
A 134.22 c6.75 25,039 5,360 4.87 Credit Suisse Soilbuild Business
Space U/C
55 Currie Street, Adelaide
A 148.25 7.39 26,200 5,658 4.21 AEP Currie Pty Ltd Suntec REIT (ARA) Sep-19
121 King William Street, Adelaide
A 82.25 6.58 12,408 6,593 3.34 Motor Accident
Commission Charter Hall Direct
PFA Fund May-19
99 Gawler Place, Adelaide
B 41.87 7.57 11,157 3,753 1.9 Blackstone Fortius Jul-19
In the Fringe market, average prime
4.0%
4.5%
5.0%
5.5%
6.0%
6.5%
7.0%
7.5%
8.0%
8.5%
9.0%
Jul-
09
Jul-
10
Jul-
11
Jul-
12
Jul-
13
Jul-
14
Jul-
15
Jul-
16
Jul-
17
Jul-
18
Jul-
19
SYDNEY BRISBANE
MELBOURNE ADELAIDE
the low cost of capital has further
attracted investment into the property
market.
Yields compress further
Yields for prime assets across the
Adelaide CBD market continue to firm.
In the six months to July 2019, average
Adelaide CBD prime yields edged in by
14 basis points, from 6.76% to 6.62%
and secondary yields also firmed by 8
basis points, from 8.23% to 8.15%.
$0
$100
$200
$300
$400
$500
$600
$700
$800
$900
$1,000
2009
2010
2011
2012
2013
2014
2015
2016
2017
2018
2019
REIT/LISTED FUND DEVELOPER
OFFSHORE OWNER OCCUPIER
PRIVATE INVESTOR UNLISTED/WHOLESALE
10 Year Average
Knight Frank Research provides strategic advice, consultancy services and forecasting
to a wide range of clients worldwide including developers, investors, funding
organisations, corporate institutions and the public sector. All our clients recognise the
need for expert independent advice customised to their specific needs.
Sydney CBD Office
Market Overview
August 2019
Australian Capital
View Outlook 2019
Knight Frank Research Reports are available at KnightFrank.com.au/Research
Adelaide Industrial
Market Overview
August 2019
Important Notice
© Knight Frank Australia Pty Ltd 2019 – This report is published for general information only and not to
be relied upon in any way. Although high standards have been used in the preparation of the
information, analysis, views and projections presented in this report, no responsibility or liability
whatsoever can be accepted by Knight Frank Australia Pty Ltd for any loss or damage resultant from
any use of, reliance on or reference to the contents of this document. As a general report, this material
does not necessarily represent the view of Knight Frank Australia Pty Ltd in relation to particular
properties or projects. Reproduction of this report in whole or in part is not allowed without prior
written approval of Knight Frank Australia Pty Ltd to the form and content within which it appears.
RESEARCH
Yee Ng Research Analyst - SA
+61 8 8233 5217
[email protected] Ben Burston Partner,
Chief Economist
+61 2 9036 6756
SOUTH AUSTRALIA
Oliver Totani Director,
Head of Agency
+61 8 8233 5210
[email protected] Bobbette Scott Partner,
Head of South Australia
+61 8 8233 5211
CAPITAL MARKETS
Guy Bennett Partner,
Head of Institutional Sales, VIC & SA
+61 8 8233 5204
[email protected] Tony Ricketts Director
+61 8 8233 5259
OFFICE LEASING
Martin Potter Partner,
Head of Office Leasing
+61 8 8233 5208
VALUATIONS & ADVISORY
James Pledge Partner,
Head of Valuation & Advisory, SA
+61 8 8233 5212
[email protected] Nick Bell Partner,
Valuation & Advisory, SA
+61 8 8233 5242
The Wealth Report
2019